IT 403 Project Beer Advocate Analysis
|
|
|
- Peregrine Bridges
- 5 years ago
- Views:
Transcription
, beer style, beer name, time of review, ABV (alcohol by volume), and beer brewer.")
1 1. Exploratory Data Analysis (EDA) IT 403 Project Beer Advocate Analysis Beer Advocate is a membership-based reviews website where members rank different beers based on a wide number of categories. The data covers overall ratings of beer by different users, more granular ratings (like aroma, color, etc), beer style, beer name, time of review, ABV (alcohol by volume), and beer brewer. The data set used for this report covers over 260,000 records for the year of Data was transformed from unstructured to CSV format using Open Refine, as well as a combination of custom shell scripts that were created using various tools like sed to strip out unwanted data and artifacts, as well as convert Unix epoch time to standard years and months. It was then loaded into SPSS for visualization. The main challenges with working with this dataset in SPSS arose from its size. At over 260,000 records, and checking in at over 100MB, SPSS ran quite slow when ingesting and analyzing the data. Furthermore, when running cross tabulation reports, issues arose with specific limitations (likely due to memory allocation) that SPSS has put in place. This necessitated a dramatic reduction in the size of the dataset (only for the cross tabulation portion of the analysis). Size reduction was done by randomly sampling records using a shell script written in the command line. The main questions we ask in this report deal with the kinds of beer that people review, and what affects the review scores that they give to the beers that they drink. Since the craft beer movement was created largely as a response to the homogeneity of American beer offerings, it s of interest to see if it actually offers people a dramatic difference from the previous pilsner beer paradigm, where American Pilsners like Budweiser, Coors, and Miller were the most popular. The analysis then ends with a review of users on the site, and how they might affect the data in the website s database. 1

2 1.1. Quantitative Variables The quantitative variables for this dataset are ABV (alcohol by volume), Review Appearance, Review Aroma, Review Palate, Review Taste, Review Overall, Time, Month Histogram The histogram of this data looks at the beers reviewed by their ABV, and indicates that it the data is right skewed. When analyzing the records of beers reviewed on a beer rating website, the ABV (alcohol by volume), on average, of beers reviewed is 5.75, with three quarters being at 7.7 or below. The skewness of the data, combined with the presence of outliers, indicates that using a mean average is going to result in, to some degree, data that is less reliable. 2

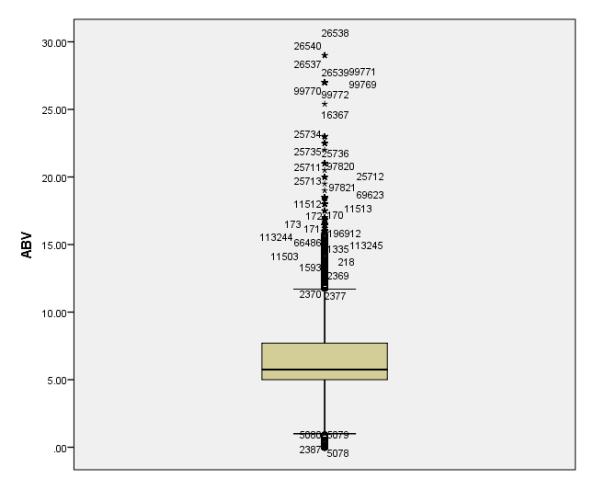
3 1.3. Center of Distribution The median ABV of beers reviewed on the website is 5.75, and is a good measure of center. Due to the number of outliers in the data s ABV, there s too much risk in relying on the mean, which is Five-number-summary The five-number-summary for ABV is:.01, 5, 5.75, 7.7, 29 The minimum ABV of a beer reviewed is.01, the maximum is 29. Under 25% of beers reviewed have an ABV of 5 or less. 50% of beers reviewed have an ABV of 5.75 or less, and the top 25% of beers reviewed have an ABV of 7.7 or more. The median average ABV of beers reviewed is Boxplot and Normal Probability Plot 3
4 4

5 The box plot shows a clear indication of the data being right-skewed with outliers on both ends, but the majority on the right and including extreme outliers (indicated by the stars on the graph). The normality test indicates that the data is non-normal, with it being positively skewed Outliers using the 1.5*IQR rule. Interpret and explain in plain English your finding. Include list of possible outliers and what might be the possible reasons why they are outlier(s) IQR = Q3-Q1 Q3= 7.7, Q1=5. 5
6 IQR=2.7*1.5=4.05. Outliers will be outside of Q1-4.05, and Q3+4.05, or 0.95 and 11.75, respectively. In other words, the majority of beers should fall within 0.95 and ABV. The outliers could exist for several reasons: 1) Error in entry by the website user. Perhaps the person entering the data fat-fingered a number and put in the incorrect ABV. 2) Also quite likely is that there are beers that have a low ABV (consider the low-to-non-alcoholic O Doul s) or extremely high ABV (Dogfish Head 120 Minute IPA, for instance, has an ABV of 18) Findings The data indicates that beers reviewed on this particular website typically have an ABV of 5.75, and more broadly speaking, generally fall between 0.95 and ABV. The highest ABV of a beer reviewed is 29, and the lowest is 0.01, which is quite interesting in terms of beers existing with such extreme ABVs in them. Quite frankly, I m surprised that the people reviewing the 29 ABV beer were capable of typing up a review after drinking it. 2. Regression Analysis: 43 points For this regression analysis we begin with a simple question: will the way a beer looks affect the way a person perceives its taste? We know, for instance, that restaurants will serve their food on ornate plates and spend great amounts of time working on its presentation. Similarly, will the way we perceive a beer s look (it s foaminess, clarity, and color) affect how we rate its flavor? 2.1. Response and Predictor Variables Response: Review Taste Predictor: Review Appearance The question being asked is: does the way a beer look influence the way a beer tastes? In order to do this, we take the Review Taste (out of 10 total possible points) and compare it against the Review Appearance (which is out of 5 total possible points). 6
 Review taste and review appearance seem to have a strong positive correlation. As the rating for an appearance in a beer goes up, so does the rating on its taste.")
7 2.2. Scatter Plot with Regression Line (Due to the number of data points at over 200,000, I also went ahead and binned the points on the scatterplot to provide a clearer view of distribution and weight) Review taste and review appearance seem to have a strong positive correlation. As the rating for an appearance in a beer goes up, so does the rating on its taste. Furthermore, by looking at the strength of the binned points, we can determine that there appears to be no significant outliers in the data. This could indicate that the way a beer looks affects how the drinker perceives its flavor. 7

8 2.3. Correlations r² = r = At.560, the correlation coefficient is above.5, and thus indicates that there is a strong positive correlation between the way a beer looks and the way that it tastes. This is promising, as it indicates that there are factors outside of the actual taste of a beer that effect how we experience its flavor. 8
9 2.4. Coefficient of Determination r² = 0.314, which indicates that 31% of the taste ratings received can be explained by the appearance ratings received. This is likely due to the data being skewed, but is to be expected since we know there are other variables that contribute to how we experience a beer s flavor such as appearance, actual taste, etc Slope and Intercept y = mx+b Slope = Intercept (b) = * = This indicates that, if an appearance rating were to equal 0, a beer s flavor would likely to be rated at


10 2.6. Regression Equation to Predict The highlighted record was chosen to test our model. In the record, the review appearance is rated at 2. According to our model, then, taste should be rated at 1.133* = The actual Y value is 4, which is a difference of in ratings, or about 7.5% difference from the actual value to the predicted value. This seems to suggest that the model is fairly accurate for determining how a beer will rank in taste given a rating for its appearance Residual and Residual Plot 10
 the residual error seems to be constant, and within -2 and 2.")
11 The data for the residual plot is binned again in order to show strength of the overlapping data points. Looking at the strength of the points, no strong pattern seems to emerge. Furthermore, (again, looking particularly at the weight of the binned points) the residual error seems to be constant, and within -2 and 2. This seems to indicate that appearance ratings are a good predictor of flavor ratings for beer Conclusion In conclusion, the appearance rating of a beer (or, the way a person perceives the look of a beer) has an effect on the flavor rating of a beer (or, the way a person perceives the quality of the flavor of a beer). The results also show that beer appearance accounts for 31 percent of the changes we see in flavor ratings, which is an acceptable number considering we know of other factors at play that will influence how we experience tasting a beer. Additional factors that could influence the flavor of a beer (aside from the flavor itself) would be factors like actual taste (of course), as well as the aroma and palate (also known as mouthfeel) of the beer. 11
12 3. Contingency Table (Two-way Table): 21 points For the next part of the analysis, the data had to be reduced in size in order to be able to run a crosstab on it. SPSS has some limitations around record numbers in cross tabulation reports, with the upper end being at 1000 values. Therefore, it became necessary to limit the data being used in this analysis by choosing a random sample. This was done through a script written in the command line Qualitative Variables In total, the dataset has the following qualitative variables: Beer Name, Beer Style, Profile Name, Beer ID, Brewer, Season, Strength. For this study, we ll be looking at beer strength (mild is <4.5, strong is >4.5 and <9, and very strong is >9 ABV) Contingency Table 12

13 3.3. Clustered Bar Graph Strong beers are clearly the most popular ones to drink, followed by very strong, and then finally mild. Mild beers are most popular in the Winter, followed by Summer, Spring, then Autumn. Strong beers are most popular in the Winter, followed by Autumn, Spring, then Summer. And finally, very strong beers are most popular in Autumn, followed by Winter, Summer, then Spring. This gives us a glimpse into the beer s people drink during any season, and begins to paint a broader picture that indicates preference for beer based on the time of year. It also poses some new questions: what leads people to drink stronger beers during colder seasons? Why do people drink less beer during warmer seasons? 13
, followed by the mild category, which is below 4.5 ABV.")
14 3.4. Two Way Table without Percentages About two thirds of beers drunk are of the strong (between 4.5 and 9 ABV) category. The next most popular type of beer to drink is the very strong variety (9 ABV and above), followed by the mild category, which is below 4.5 ABV. Neither Spring nor Summer have a more popular strength of beer compared to Winter and Autumn, though mild beers do not appear to be popular during the Autumn. More beer is drunk in the colder Winter and Autumn seasons than in the warmer Spring and Summer seasons. The people who drink beer and rate them on this website clearly prefer drinking strong beer, which is also associated with the craft beer movement. We may begin to infer from this that most people who rate beer on the website are craft beer drinkers, then. 14

15 3.5. Two Way Table with Percentages During the Winter and Autumn seasons when it s cold, a higher proportion of stronger beers are drunk (at both strong and very strong) than in the Spring and Summer seasons. This is likely due to the fact that during the colder months, darker beers are more popular, which have a higher ABV, and thus are stronger beers. Looking at seasons individually, during Autumn very strong beers are preferred. During Spring, mild beers are preferred. During Summer, mild beers are also preferred. And finally, during Winter, strong beers are most preferred. This aligns with our hypothesis earlier that during warmer seasons, people drink less strong beer, and during colder seasons, people drink stronger beer. This aligns well with the lawn mowing beer idea, that is to say, a good lawn mowing beer (to be drunk when it s hot outside) is typically a lighter one Findings and Conclusions Perhaps not surprisingly, during the colder seasons people drink more beer, and drink stronger beer. During the warmer seasons, people tend to drink less beer. This is likely due to stronger 15
16 beer styles being sold more commonly during the colder seasons, as well as stronger alcohol generally being preferred when it gets colder outside. Furthermore, strong beers between 4.5 and 9 ABV are the most popular beers to drink, while very strong beers are the next most favored, and mild beers being the least favored. This indicates that people who use the website do not generally drink traditional American Pilsners, which fall at or under 4.5 ABV. Given that, it s safe to assume a few things about this website and their data: 1) The people who rate beers on the website have a preference for craft beer, which has a much higher ABV then traditional beers. 2) As a result of that, the beers that people drink are of a higher strength (ABV). 3) When rating the flavor of these beers, as seen in part 2 of this analysis, factors such as the beer s appearance are just as important as its flavor, indicating a more discerning beer taster concerned with multiple facets of their beer s composition. Beer Advocate users do indeed seem to represent a different market segment than the traditional beer drinker. They drink beers that are of a higher alcoholic content than traditional beers, are influenced by attention to flavor, but also things like how a beer looks. And finally, they change the kinds of beers they drink seasonally, indicating shifting preferences and an eye toward diversity in the beer that they drink. 16
Wine-Tasting by Numbers: Using Binary Logistic Regression to Reveal the Preferences of Experts
 Wine-Tasting by Numbers: Using Binary Logistic Regression to Reveal the Preferences of Experts When you need to understand situations that seem to defy data analysis, you may be able to use techniques
OF THE VARIOUS DECIDUOUS and
 (9) PLAXICO, JAMES S. 1955. PROBLEMS OF FACTOR-PRODUCT AGGRE- GATION IN COBB-DOUGLAS VALUE PRODUCTIVITY ANALYSIS. JOUR. FARM ECON. 37: 644-675, ILLUS. (10) SCHICKELE, RAINER. 1941. EFFECT OF TENURE SYSTEMS
STA Module 6 The Normal Distribution
 STA 2023 Module 6 The Normal Distribution Learning Objectives 1. Explain what it means for a variable to be normally distributed or approximately normally distributed. 2. Explain the meaning of the parameters
STA Module 6 The Normal Distribution. Learning Objectives. Examples of Normal Curves
 STA 2023 Module 6 The Normal Distribution Learning Objectives 1. Explain what it means for a variable to be normally distributed or approximately normally distributed. 2. Explain the meaning of the parameters
Emerging Local Food Systems in the Caribbean and Southern USA July 6, 2014
 Consumers attitudes toward consumption of two different types of juice beverages based on country of origin (local vs. imported) Presented at Emerging Local Food Systems in the Caribbean and Southern USA
Predicting Wine Quality
 March 8, 2016 Ilker Karakasoglu Predicting Wine Quality Problem description: You have been retained as a statistical consultant for a wine co-operative, and have been asked to analyze these data. Each
Missing value imputation in SAS: an intro to Proc MI and MIANALYZE
 Victoria SAS Users Group November 26, 2013 Missing value imputation in SAS: an intro to Proc MI and MIANALYZE Sylvain Tremblay SAS Canada Education Copyright 2010 SAS Institute Inc. All rights reserved.
Cooking and Pairing Written Exam Key
 Cooking and Pairing Written Exam Key Name: Date: Class: 1. Describe each step in the brewing process below. a. What are the two most important variables brewers control during the Mashing step? Time and
From VOC to IPA: This Beer s For You!
 From VOC to IPA: This Beer s For You! Joel Smith Statistician Minitab Inc. jsmith@minitab.com 2013 Minitab, Inc. Image courtesy of amazon.com The Data Online beer reviews Evaluated overall and: Appearance
2 Recommendation Engine 2.1 Data Collection. HapBeer: A Beer Recommendation Engine CS 229 Fall 2013 Final Project
 1 Abstract HapBeer: A Beer Recommendation Engine CS 229 Fall 2013 Final Project This project looks to apply machine learning techniques in the area of beer recommendation and style prediction. The first
SWEET DOUGH APPLICATION RESEARCH COMPARING THE FUNCTIONALITY OF EGGS TO EGG REPLACERS IN SWEET DOUGH FORMULATIONS RESEARCH SUMMARY
 SWEET DOUGH APPLICATION RESEARCH COMPARING THE FUNCTIONALITY OF EGGS TO EGG REPLACERS IN SWEET DOUGH FORMULATIONS RESEARCH SUMMARY SWEET DOUGH RESEARCH EXECUTIVE SUMMARY For this study, eggs were reduced
Name: Adapted from Mathalicious.com DOMINO EFFECT
 Activity A-1: Domino Effect Adapted from Mathalicious.com DOMINO EFFECT Domino s pizza is delicious. The company s success is proof that people enjoy their pizzas. The company is also tech savvy as you
Napa County Planning Commission Board Agenda Letter
 Agenda Date: 7/1/2015 Agenda Placement: 10A Continued From: May 20, 2015 Napa County Planning Commission Board Agenda Letter TO: FROM: Napa County Planning Commission John McDowell for David Morrison -
CHOCOLATE CHIP COOKIE APPLICATION RESEARCH
 CHOCOLATE CHIP COOKIE APPLICATION RESEARCH COMPARING THE FUNCTIONALITY OF EGGS TO EGG REPLACERS IN CHOCOLATE CHIP COOKIE FORMULATIONS RESEARCH SUMMARY CHOCOLATE CHIP COOKIE RESEARCH EXECUTIVE SUMMARY For
Feasibility Project for Store Brand Macaroni and Cheese
 Feasibility Project for Store Brand Macaroni and Cheese Prepared by Group 2 Jenna Forrest, Christina Gatti, Anna Flobeck, Dylan Fawcett Terry Smith TECM 2700.003 April 23, 2014 Table of Contents Table
FACTORS DETERMINING UNITED STATES IMPORTS OF COFFEE
 12 November 1953 FACTORS DETERMINING UNITED STATES IMPORTS OF COFFEE The present paper is the first in a series which will offer analyses of the factors that account for the imports into the United States
Curtis Miller MATH 3080 Final Project pg. 1. The first question asks for an analysis on car data. The data was collected from the Kelly
 Curtis Miller MATH 3080 Final Project pg. 1 Curtis Miller 4/10/14 MATH 3080 Final Project Problem 1: Car Data The first question asks for an analysis on car data. The data was collected from the Kelly
Activity 10. Coffee Break. Introduction. Equipment Required. Collecting the Data
 . Activity 10 Coffee Break Economists often use math to analyze growth trends for a company. Based on past performance, a mathematical equation or formula can sometimes be developed to help make predictions
Wine On-Premise UK 2016
 Wine On-Premise UK 2016 T H E M E N U Introduction... Page 5 The UK s Best On-Premise Distributors... Page 7 The UK s Most Listed Wine Brands... Page 17 The Big Picture... Page 26 The Style Mix... Page
HW 5 SOLUTIONS Inference for Two Population Means
 HW 5 SOLUTIONS Inference for Two Population Means 1. The Type II Error rate, β = P{failing to reject H 0 H 0 is false}, for a hypothesis test was calculated to be β = 0.07. What is the power = P{rejecting
Buying Filberts On a Sample Basis
 E 55 m ^7q Buying Filberts On a Sample Basis Special Report 279 September 1969 Cooperative Extension Service c, 789/0 ite IP") 0, i mi 1910 S R e, `g,,ttsoliktill:torvti EARs srin ITQ, E,6
Northern Region Central Region Southern Region No. % of total No. % of total No. % of total Schools Da bomb
 Some Purr Words Laurie and Winifred Bauer A number of questions demanded answers which fell into the general category of purr words: words with favourable senses. Many of the terms supplied were given
Regression Models for Saffron Yields in Iran
 Regression Models for Saffron ields in Iran Sanaeinejad, S.H., Hosseini, S.N 1 Faculty of Agriculture, Ferdowsi University of Mashhad, Iran sanaei_h@yahoo.co.uk, nasir_nbm@yahoo.com, Abstract: Saffron
Online Appendix to. Are Two heads Better Than One: Team versus Individual Play in Signaling Games. David C. Cooper and John H.
 Online Appendix to Are Two heads Better Than One: Team versus Individual Play in Signaling Games David C. Cooper and John H. Kagel This appendix contains a discussion of the robustness of the regression
Lollapalooza Did Not Attend (n = 800) Attended (n = 438)
 Attended (n = 438)") D SDS H F 1, 16 ( ) Warm-ups (A) Which bands come to ACL Fest? Is it true that if a band plays at Lollapalooza, then it is more likely to play at Austin City Limits (ACL) that year? To be able to provide
D SDS H F 1, 16 ( ) Warm-ups (A) Which bands come to ACL Fest? Is it true that if a band plays at Lollapalooza, then it is more likely to play at Austin City Limits (ACL) that year? To be able to provide
SUGAR COOKIE APPLICATION RESEARCH COMPARING THE FUNCTIONALITY OF EGGS TO EGG REPLACERS IN SUGAR COOKIE FORMULATIONS RESEARCH SUMMARY
 SUGAR COOKIE APPLICATION RESEARCH COMPARING THE FUNCTIONALITY OF EGGS TO EGG REPLACERS IN SUGAR COOKIE FORMULATIONS RESEARCH SUMMARY SUGAR COOKIE RESEARCH EXECUTIVE SUMMARY For this study, eggs were reduced
Relationships Among Wine Prices, Ratings, Advertising, and Production: Examining a Giffen Good
 Relationships Among Wine Prices, Ratings, Advertising, and Production: Examining a Giffen Good Carol Miu Massachusetts Institute of Technology Abstract It has become increasingly popular for statistics
Quality of western Canadian flaxseed 2012
 ISSN 1700-2087 Quality of western Canadian flaxseed 2012 Ann S. Puvirajah Oilseeds Contact: Ann S. Puvirajah Oilseeds Tel : 204 983-3354 Email: ann.puvirajah@grainscanada.gc.ca Fax : 204-983-0724 Grain
BORDEAUX WINE VINTAGE QUALITY AND THE WEATHER ECONOMETRIC ANALYSIS
 BORDEAUX WINE VINTAGE QUALITY AND THE WEATHER ECONOMETRIC ANALYSIS WINE PRICES OVER VINTAGES DATA The data sheet contains market prices for a collection of 13 high quality Bordeaux wines (not including
BLUEBERRY MUFFIN APPLICATION RESEARCH COMPARING THE FUNCTIONALITY OF EGGS TO EGG REPLACERS IN BLUEBERRY MUFFIN FORMULATIONS RESEARCH SUMMARY
 BLUEBERRY MUFFIN APPLICATION RESEARCH COMPARING THE FUNCTIONALITY OF EGGS TO EGG REPLACERS IN BLUEBERRY MUFFIN FORMULATIONS RESEARCH SUMMARY BLUEBERRY MUFFIN RESEARCH EXECUTIVE SUMMARY For this study,
Report to Zespri Innovation Company Ltd. An Analysis of Zespri s 2003 Organic Kiwifruit Database: Factors Affecting Production
 Report to Zespri Innovation Company Ltd An Analysis of Zespri s 2003 Organic Kiwi Database: Factors Affecting Production Lesley M. Hunt John R. Fairweather September 2004 Agribusiness and Economics Research
Which of the following are resistant statistical measures? 1. Mean 2. Median 3. Mode 4. Range 5. Standard Deviation
 Which of the following are resistant statistical measures? 1. Mean 2. Median 3. Mode 4. Range 5. Standard Deviation For the variable number of parking tickets in the past year would you expect the distribution
Modeling Wine Quality Using Classification and Regression. Mario Wijaya MGT 8803 November 28, 2017
 Modeling Wine Quality Using Classification and Mario Wijaya MGT 8803 November 28, 2017 Motivation 1 Quality How to assess it? What makes a good quality wine? Good or Bad Wine? Subjective? Wine taster Who
The Wild Bean Population: Estimating Population Size Using the Mark and Recapture Method
 Name Date The Wild Bean Population: Estimating Population Size Using the Mark and Recapture Method Introduction: In order to effectively study living organisms, scientists often need to know the size of
Relation between Grape Wine Quality and Related Physicochemical Indexes
 Research Journal of Applied Sciences, Engineering and Technology 5(4): 557-5577, 013 ISSN: 040-7459; e-issn: 040-7467 Maxwell Scientific Organization, 013 Submitted: October 1, 01 Accepted: December 03,
THE EVALUATION OF WALNUT VARIETIES FOR CALIFORNIA S CENTRAL COAST REGION 2007 HARVEST
 THE EVALUATION OF WALNUT VARIETIES FOR CALIFORNIA S CENTRAL COAST REGION 2007 HARVEST William W. Coates ABSTRACT Walnut varieties sometimes have different tree and nut characteristics in the cool Central
Table 1.1 Number of ConAgra products by country in Euromonitor International categories
 CONAGRA Products included There were 1,254 identified products manufactured by ConAgra in five countries. There was sufficient nutrient information for 1,036 products to generate a Health Star Rating and
Imputation of multivariate continuous data with non-ignorable missingness
 Imputation of multivariate continuous data with non-ignorable missingness Thais Paiva Jerry Reiter Department of Statistical Science Duke University NCRN Meeting Spring 2014 May 23, 2014 Thais Paiva, Jerry
STAT 5302 Applied Regression Analysis. Hawkins
 Homework 3 sample solution 1. MinnLand data STAT 5302 Applied Regression Analysis. Hawkins newdata
Business Statistics /82 Spring 2011 Booth School of Business The University of Chicago Final Exam
 Business Statistics 41000-81/82 Spring 2011 Booth School of Business The University of Chicago Final Exam Name You may use a calculator and two cheat sheets. You have 3 hours. I pledge my honor that I
The age of reproduction The effect of university tuition fees on enrolment in Quebec and Ontario,
 The age of reproduction The effect of university tuition fees on enrolment in Quebec and Ontario, 1946 2011 Benoît Laplante, Centre UCS de l INRS Pierre Doray, CIRST-UQAM Nicolas Bastien, CIRST-UQAM Research
The Future of the Still & Sparkling Wine Market in Poland to 2019
 673 1. The Future of the Still & Sparkling Wine Market in Poland to 2019 Reference Code: AD0419MR www.canadean-winesandwine.com Summary The Future of the Still & Sparkling Wine Market in Poland to 2019
Labor Supply of Married Couples in the Formal and Informal Sectors in Thailand
 Southeast Asian Journal of Economics 2(2), December 2014: 77-102 Labor Supply of Married Couples in the Formal and Informal Sectors in Thailand Chairat Aemkulwat 1 Faculty of Economics, Chulalongkorn University
Running Head: MESSAGE ON A BOTTLE: THE WINE LABEL S INFLUENCE p. 1. Message on a bottle: the wine label s influence. Stephanie Marchant
 Running Head: MESSAGE ON A BOTTLE: THE WINE LABEL S INFLUENCE p. 1 Message on a bottle: the wine label s influence Stephanie Marchant West Virginia University Running Head: MESSAGE ON A BOTTLE: THE WINE
2017 FINANCIAL REVIEW
 2017 FINANCIAL REVIEW In addition to activity, strategy, goals, and challenges, survey respondents also provided financial information from 2014, 2015, and 2016. Select results are provided below: 2016
1.3 Box & Whisker Plots
 1.3 Box & Whisker Plots Box and Whisker Plots or box plots, are useful for showing the distribution of values in a data set. The box plot below is an example. A box plot is constructed from the five-number
Statistics & Agric.Economics Deptt., Tocklai Experimental Station, Tea Research Association, Jorhat , Assam. ABSTRACT
 Two and a Bud 59(2):152-156, 2012 RESEARCH PAPER Global tea production and export trend with special reference to India Prasanna Kumar Bordoloi Statistics & Agric.Economics Deptt., Tocklai Experimental
Economics 101 Spring 2016 Answers to Homework #1 Due Tuesday, February 9, 2016
 Economics 101 Spring 2016 Answers to Homework #1 Due Tuesday, February 9, 2016 Directions: The homework will be collected in a box before the large lecture. Please place your name, TA name and section
Global Flavor and Fragrance Market Report
 Global Flavor and Fragrance Market Report ---------------------------------------------------------------- 2012 Executive Summary The flavor and fragrances (F&F) industry involves companies that develop
Revisiting the most recent Napa vintages
 Revisiting the most recent Napa vintages Wine observers agree: 212, 213 and 214 are extraordinary Napa vintages. Much has already been written on the first two vintages. The 214 vintage is now starting
A Hedonic Analysis of Retail Italian Vinegars. Summary. The Model. Vinegar. Methodology. Survey. Results. Concluding remarks.
 Vineyard Data Quantification Society "Economists at the service of Wine & Vine" Enometrics XX A Hedonic Analysis of Retail Italian Vinegars Luigi Galletto, Luca Rossetto Research Center for Viticulture
To: Professor Roger Bohn & Hyeonsu Kang Subject: Big Data, Assignment April 13th. From: xxxx (anonymized) Date: 4/11/2016
 Date: 4/11/2016") To: Professor Roger Bohn & Hyeonsu Kang Subject: Big Data, Assignment April 13th. From: xxxx (anonymized) Date: 4/11/2016 Data Preparation: 1. Separate trany variable into Manual which takes value of 1
To: Professor Roger Bohn & Hyeonsu Kang Subject: Big Data, Assignment April 13th. From: xxxx (anonymized) Date: 4/11/2016 Data Preparation: 1. Separate trany variable into Manual which takes value of 1
What Is This Module About?
 What Is This Module About? Do you enjoy shopping or going to the market? Is it hard for you to choose what to buy? Sometimes, you see that there are different quantities available of one product. Do you
The Market Potential for Exporting Bottled Wine to Mainland China (PRC)
") The Market Potential for Exporting Bottled Wine to Mainland China (PRC) The Machine Learning Element Data Reimagined SCOPE OF THE ANALYSIS This analysis was undertaken on behalf of a California company
The Market Potential for Exporting Bottled Wine to Mainland China (PRC) The Machine Learning Element Data Reimagined SCOPE OF THE ANALYSIS This analysis was undertaken on behalf of a California company
Supply & Demand for Lake County Wine Grapes. Christian Miller Lake County MOMENTUM April 13, 2015
 Supply & Demand for Lake County Wine Grapes Christian Miller Lake County MOMENTUM April 13, 2015 About Full Glass Research Provider of economic, market & industry research to food & drink companies and
F&N 453 Project Written Report. TITLE: Effect of wheat germ substituted for 10%, 20%, and 30% of all purpose flour by
 F&N 453 Project Written Report Katharine Howe TITLE: Effect of wheat substituted for 10%, 20%, and 30% of all purpose flour by volume in a basic yellow cake. ABSTRACT Wheat is a component of wheat whole
Estimating and Adjusting Crop Weight in Finger Lakes Vineyards
 Estimating and Adjusting Crop Weight in Finger Lakes yards (Material handed out at a Finger Lakes grower twilight meeting July, 2001) Copyright 2001 Robert Pool Reviewed by Jodi Creasap Gee, 2011 Why estimate
Analysis of Coffee Shops Within a One-Mile Radius of the University of North Texas
 Feasibility Report Analysis of Coffee Shops Within a One-Mile Radius of the University of North Texas Prepared by: Robert Buchanan, Christopher Douglas, Grant Koslowski and Miguel Martinez Prepared for:
Wine Australia Wine.com Data Report. July 21, 2017
 Wine Australia Wine.com Data Report July 21, 2017 INTRODUCTION Wine Opinions is a wine market research company focusing on the attitudes, behaviors, and taste preferences of U.S. wine drinkers. Wine Opinions
STUDY REGARDING THE RATIONALE OF COFFEE CONSUMPTION ACCORDING TO GENDER AND AGE GROUPS
 STUDY REGARDING THE RATIONALE OF COFFEE CONSUMPTION ACCORDING TO GENDER AND AGE GROUPS CRISTINA SANDU * University of Bucharest - Faculty of Psychology and Educational Sciences, Romania Abstract This research
BNI of kinds of corn chips (descriptive statistics)
") Site: Wiki of Science at http://wikiofscience.wikidot.com Source page: 20121025 - BNI of kinds of corn chips (descriptive statistics) - 2012 at http://wikiofscience.wikidot.com/print:20121025-bni-kind-corn-chip-perezgonzalez2012
Site: Wiki of Science at http://wikiofscience.wikidot.com Source page: 20121025 - BNI of kinds of corn chips (descriptive statistics) - 2012 at http://wikiofscience.wikidot.com/print:20121025-bni-kind-corn-chip-perezgonzalez2012
The Effect of Almond Flour on Texture and Palatability of Chocolate Chip Cookies. Joclyn Wallace FN 453 Dr. Daniel
 The Effect of Almond Flour on Texture and Palatability of Chocolate Chip Cookies Joclyn Wallace FN 453 Dr. Daniel 11-22-06 The Effect of Almond Flour on Texture and Palatability of Chocolate Chip Cookies
IMSI Annual Business Meeting Amherst, Massachusetts October 26, 2008
 Consumer Research to Support a Standardized Grading System for Pure Maple Syrup Presented to: IMSI Annual Business Meeting Amherst, Massachusetts October 26, 2008 Objectives The objectives for the study
Coffee weather report November 10, 2017.
 Coffee weather report November 10, 2017. awhere, Inc., an agricultural intelligence company, is pleased to provide this map-and-chart heavy report focused on the current coffee crop in Brazil. Global stocks
Session 4: Managing seasonal production challenges. Relationships between harvest time and wine composition in Cabernet Sauvignon.
 Session 4: Managing seasonal production challenges Relationships between harvest time and wine composition in Cabernet Sauvignon Keren Bindon Cristian Varela, Helen Holt, Patricia Williamson, Leigh Francis,
SIMPLE CODED IDENTIFICATION REFERENCES OF HARVESTING TIME FOR OIL PALM FRUITS
 ICBAA2017-13 SIMPLE CODED IDENTIFICATION REFERENCES OF HARVESTING TIME FOR OIL PALM FRUITS N.I.H.N., Mahadi, M. B. Adam and D. D. Silalahi Institute of Mathematical Research bakri@upm.edu.my Abstract:
Previous analysis of Syrah
 Perception and interest of French consumers for Syrah / Shiraz Introduction Plan Previous analysis on Syrah vine and on consumer behaviour for this kind of wine Methods of research Building the General
Thought: The Great Coffee Experiment
 Thought: The Great Coffee Experiment 7/7/16 By Kevin DeLuca ThoughtBurner Opportunity Cost of Reading this ThoughtBurner post: $1.97 about 8.95 minutes I drink a lot of coffee. In fact, I m drinking a
COMPARISON OF CORE AND PEEL SAMPLING METHODS FOR DRY MATTER MEASUREMENT IN HASS AVOCADO FRUIT
 New Zealand Avocado Growers' Association Annual Research Report 2004. 4:36 46. COMPARISON OF CORE AND PEEL SAMPLING METHODS FOR DRY MATTER MEASUREMENT IN HASS AVOCADO FRUIT J. MANDEMAKER H. A. PAK T. A.
WINE GRAPE TRIAL REPORT
 WINE GRAPE TRIAL REPORT Stellenbosch, Western Cape Louisvale 2008/09 season Introduction A trial was conducted in the Stellenbosch area on an older wine grape vineyard to determine whether AnnGro alone,
EFFECT OF TOMATO GENETIC VARIATION ON LYE PEELING EFFICACY TOMATO SOLUTIONS JIM AND ADAM DICK SUMMARY
 EFFECT OF TOMATO GENETIC VARIATION ON LYE PEELING EFFICACY TOMATO SOLUTIONS JIM AND ADAM DICK 2013 SUMMARY Several breeding lines and hybrids were peeled in an 18% lye solution using an exposure time of
PSYC 6140 November 16, 2005 ANOVA output in R
 PSYC 6140 November 16, 2005 ANOVA output in R Type I, Type II and Type III Sums of Squares are displayed in ANOVA tables in a mumber of packages. The car library in R makes these available in R. This handout
UNDERSTANDING WINE. Class 7 Tasting. TASTING: Old World vs. New World: Sancerre (Loire) and Sauvignon Blanc (CA)
 and Sauvignon Blanc (CA)") TASTING: Old World vs. New World: Sancerre (Loire) and Sauvignon Blanc (CA) Before you start the tasting: 1. Make sure you have the Tasting Checklist. If you don t have the checklist, please use the navigation
TASTING: Old World vs. New World: Sancerre (Loire) and Sauvignon Blanc (CA) Before you start the tasting: 1. Make sure you have the Tasting Checklist. If you don t have the checklist, please use the navigation
Fairtrade Buying Behaviour: We Know What They Think, But Do We Know What They Do?
 Fairtrade Buying Behaviour: We Know What They Think, But Do We Know What They Do? Dr. Fred A. Yamoah Prof. Andrew Fearne Dr. Rachel Duffy Dr. Dan Petrovici Background/Context The UK is a major market for
Macroclimate in New York and Site Suitability
 Statewide Viticulture Extension Tim Martinson Tel: 315 787-2448 Dept. Horticultural Sciences Fax: 315-787-2216 NYS Agric. Exper. Station E-mail: tem2@cornell.edu 106 Hedrick Hall 630 West North Street,
Title: Will adding non-fat dry milk solids improve the taste and palatability of skim and
 Title: Will adding non-fat dry milk solids improve the taste and palatability of skim and 2% fat milk? Abstract: This experiment tested if adding non-fat dry milk solids to skim milk and 2% milk would
ewellness magazine Surprise yourself at the Benefits of Organic Frozen Foods! Eat well
 ewellness magazine Surprise yourself at the Benefits of Organic Frozen Foods! 2018-03-20 Frozen foods can be a surprisingly healthy option to keep you on track with your fitness and well-being goals. When
Varietal Specific Barrel Profiles
 RESEARCH Varietal Specific Barrel Profiles Beaulieu Vineyard and Sea Smoke Cellars 2006 Pinot Noir Domenica Totty, Beaulieu Vineyard Kris Curran, Sea Smoke Cellars Don Shroerder, Sea Smoke Cellars David
ALBINISM AND ABNORMAL DEVELOPMENT OF AVOCADO SEEDLINGS 1
 California Avocado Society 1956 Yearbook 40: 156-164 ALBINISM AND ABNORMAL DEVELOPMENT OF AVOCADO SEEDLINGS 1 J. M. Wallace and R. J. Drake J. M. Wallace Is Pathologist and R. J. Drake is Principle Laboratory
1. ARE GROWERS SPRAYING COPPER? Copper Analysis: SPRAY DIARY ANALYSIS 2012/13 SEASON September 2013
 SPRAY DIARY ANALYSIS 2012/13 SEASON September 2013 Copper Analysis: Contents 1. Are Growers Spraying Copper?... 1 1.1 Areas been sprayed... 2 2. How Does Copper Use Vary Between Varieties?... 4 2.1 Regional
Markets for Breakfast and Through the Day
 2 Markets for Breakfast and Through the Day Market design is so pervasive that it touches almost every facet of our lives, from the moment we wake up. The blanket you chose to sleep under, the commercial
Growth in early yyears: statistical and clinical insights
 Growth in early yyears: statistical and clinical insights Tim Cole Population, Policy and Practice Programme UCL Great Ormond Street Institute of Child Health London WC1N 1EH UK Child growth Growth is
Pasta Market in Italy to Market Size, Development, and Forecasts
 Pasta Market in Italy to 2019 - Market Size, Development, and Forecasts Published: 6/2015 Global Research & Data Services Table of Contents List of Tables Table 1 Demand for pasta in Italy, 2008-2014 (US
MBA 503 Final Project Guidelines and Rubric
 MBA 503 Final Project Guidelines and Rubric Overview There are two summative assessments for this course. For your first assessment, you will be objectively assessed by your completion of a series of MyAccountingLab
RESULTS OF THE MARKETING SURVEY ON DRINKING BEER
 Uri Dahahn Business and Economic Consultants RESULTS OF THE MARKETING SURVEY ON DRINKING BEER Uri Dahan Business and Economic Consultants Smith - Consulting & Reserch ltd Tel. 972-77-7032332, Fax. 972-2-6790162,
Napa County Planning Commission Board Agenda Letter
 Agenda Date: 3/4/2015 Agenda Placement: 10A Napa County Planning Commission Board Agenda Letter TO: FROM: Napa County Planning Commission David Morrison - Director Planning, Building and Environmental
OIV Revised Proposal for the Harmonized System 2017 Edition
 OIV Revised Proposal for the Harmonized System 2017 Edition TABLE OF CONTENTS 1. Preamble... 3 2. Proposal to amend subheading 2204.29 of the Harmonized System (HS)... 4 3. Bag-in-box containers: a growing
An Advanced Tool to Optimize Product Characteristics and to Study Population Segmentation
 OP&P Product Research Utrecht, The Netherlands May 16, 2011 An Advanced Tool to Optimize Product Characteristics and to Study Population Segmentation John M. Ennis, Daniel M. Ennis, & Benoit Rousseau The
MARKET NEWSLETTER No 93 April 2015
 Focus on OLIVE OIL IMPORT TRENDS IN RUSSIA Russian imports of olive oil and olive pomace oil grew at a constant rate between 2/1 and 213/14 when they rose from 3 62 t to 34 814 t (Chart 1). The only exceptions
Problem Set #3 Key. Forecasting
 Problem Set #3 Key Sonoma State University Business 581E Dr. Cuellar The data set bus581e_ps3.dta is a Stata data set containing annual sales (cases) and revenue from December 18, 2004 to April 2 2011.
The Effects of Dried Beer Extract in the Making of Bread. Josh Beedle and Tanya Racke FN 453
 The Effects of Dried Beer Extract in the Making of Bread Josh Beedle and Tanya Racke FN 453 Abstract: Dried Beer Extract is used in food production to create a unique and palatable flavor. This experiment
Determining the Optimum Time to Pick Gwen
 California Avocado Society 1988 Yearbook 72: 209-214 Determining the Optimum Time to Pick Gwen Gray Martin and Bob Bergh Department of Botany and Plant Sciences, University of California, Riverside. Predicting
An application of cumulative prospect theory to travel time variability
 Katrine Hjorth (DTU) Stefan Flügel, Farideh Ramjerdi (TØI) An application of cumulative prospect theory to travel time variability Sixth workshop on discrete choice models at EPFL August 19-21, 2010 Page
POTATOES USA / SNAC-INTERNATIONAL OUT-OF-STORAGE CHIP QUALITY MICHIGAN REGIONAL REPORT
 POTATOES USA / SNAC-INTERNATIONAL OUT-OF-STORAGE CHIP QUALITY 2015-2016 MICHIGAN REGIONAL REPORT Chris Long and Aaron Yoder, Michigan State University Procedure: The 2015 Potatoes USA / SNAC-International
THE STATISTICAL SOMMELIER
 THE STATISTICAL SOMMELIER An Introduction to Linear Regression 15.071 The Analytics Edge Bordeaux Wine Large differences in price and quality between years, although wine is produced in a similar way Meant
RESEARCH UPDATE from Texas Wine Marketing Research Institute by Natalia Kolyesnikova, PhD Tim Dodd, PhD THANK YOU SPONSORS
 RESEARCH UPDATE from by Natalia Kolyesnikova, PhD Tim Dodd, PhD THANK YOU SPONSORS STUDY 1 Identifying the Characteristics & Behavior of Consumer Segments in Texas Introduction Some wine industries depend
The Roles of Social Media and Expert Reviews in the Market for High-End Goods: An Example Using Bordeaux and California Wines
 The Roles of Social Media and Expert Reviews in the Market for High-End Goods: An Example Using Bordeaux and California Wines Alex Albright, Stanford/Harvard University Peter Pedroni, Williams College
Opportunities. SEARCH INSIGHTS: Spotting Category Trends and. thinkinsights THE RUNDOWN
 SEARCH INSIGHTS: Spotting Category Trends and WRITTEN BY Sonia Chung PUBLISHED December 2013 Opportunities THE RUNDOWN Search data can be a brand marketer s dream. It s a near limitless source consumer
EMBARGO TO ON FRIDAY 16 SEPTEMBER. Scotch Whisky Association. Exports of Scotch Whisky; Year to end of June 2016 (2016 H1)
") EMBARGO TO 00.01 ON FRIDAY 16 SEPTEMBER Scotch Whisky Association Exports of Scotch Whisky; Year to end of June 2016 (2016 H1) VOLUME UP 3.1% to 531 MILLION bottles VALUE DOWN SLIGHTLY BY 1.0% TO 1.70
EMBARGO TO 00.01 ON FRIDAY 16 SEPTEMBER Scotch Whisky Association Exports of Scotch Whisky; Year to end of June 2016 (2016 H1) VOLUME UP 3.1% to 531 MILLION bottles VALUE DOWN SLIGHTLY BY 1.0% TO 1.70
CHAPTER 2 ANNUAL RETAIL FOOD PRICE MOVEMENTS
 Part 3 2.1 Introduction CHAPTER 2 ANNUAL RETAIL FOOD PRICE MOVEMENTS The Institute for Planning Research, a research institute attached to the University of Port Elizabeth started a longitudinal research