ABSTRACT. MCLEAN, KYLE GEOFFREY. Alternative Sensory Methods for Evaluation of Consumer Liking. (Under the direction of Dr. MaryAnne Drake.
|
|
|
- Morgan Hodges
- 5 years ago
- Views:
Transcription
1 ABSTRACT MCLEAN, KYLE GEOFFREY. Alternative Sensory Methods for Evaluation of Consumer Liking. (Under the direction of Dr. MaryAnne Drake.) The ability to collect data from consumers has been monumentally changed by the advent of digital technology. Where before collecting large detailed amounts of data from a number of consumers would have required hundreds of researcher hours, now by utilizing technology we are able to collect thousands of data points in a comparably negligible amount of time. With this large leap forward in researchers ability to collect vast swathes of data, it is necessary to review and innovate on consumer testing methods for their effectiveness to capture consumer sentiments as well as their time, labor, and cost efficiency. The research and literature review in this thesis explore how new alternative methods of conducting consumer research leverage new technologies to conduct sensory research. Bacon is one of the most recognizable consumer pork products and is differentiated by appearance, flavor, thickness, and several possible product claims. The objective of this study was to explore the attributes of retail bacon that influence consumers to purchase and consume bacon. An Adaptive Choice-Based Conjoint (ACBC) survey was designed for attributes of raw American-style bacon. An ACBC survey (N=1410 consumers) and Kano questioning were applied to determine the key attributes that influenced consumer purchase. Attributes included package size, brand, thickness, label claims, flavor, price, and images of the bacon package displaying fat:lean ratio. Maximum Difference Scaling
2 (MaxDiff) was used to rank appeal of 20 different bacon images with variable fat:lean ratio and slice shape. The most important attribute for bacon purchase was price followed by fat:lean appearance and then flavor. Three consumer clusters were identified with distinct preferences. For two clusters, price was not the primary attribute. Understanding preferences of distinct consumer clusters will enable manufacturers to target consumers and make more appealing bacon. Likewise, coffee is a complex product which can be better understood through a blend of traditional preference mapping with projective mapping (PM) with check-all-that-apply (CATA) for brewed black coffees. Consumers (n=22) evaluated eleven coffees and placed them on dimensional planes based on similarities and selected attributes (PMCATA) to describe each coffee from a provided list. These consumers also scored liking. A descriptive panel documented properties of the coffees in quadruplicate followed by consumer testing with 150 black coffee consumers. Data from PMCATA was analyzed using multiple factor analysis (MFA) while preference mapping was applied to the DA and consumer data. Both methods resulted in groupings with distinct consumer preferences. The consumer groups from PMCATA were distinguished by preferences for light and dark roast attributes. DA revealed more differences than PMCATA while preference mapping revealed more differences with three clusters. These results demonstrate PMCATA can be a preliminary alternative to traditional methods for profiling and consumer preferences of complex products like coffee. Advances in technology do not always mean that entirely new methodologies need to be developed. Often we are able to more effectively apply methodologies that already
3 existed. By looking back at older methodologies and applying them in a new context, we are able to see that methods of research that were more cumbersome and inefficient can provide meaningful data that can challenge current practices for an ability to effectively and efficiently reflect consumer sentiments
4 Copyright 2016 Kyle Geoffrey McLean All Rights Reserved
5 Alternative Sensory Methods for Evaluation of Consumer Liking by Kyle Geoffrey McLean A thesis submitted to the Graduate Faculty of North Carolina State University in partial fulfillment of the requirements for the Degree of Master of Science Food Science Raleigh, North Carolina 2016 APPROVED BY: Dr. MaryAnne Drake Committee Chair Dr. Jason A. Osborne Dr. Dana Hanson Dr. Timothy H. Sanders
6 BIOGRAPHY Kyle McLean grew up in Deerfield, Illinois with his sister and parents, who both inspired him to work in the food science industry. Kyle had the opportunity to live in England and be educated in an Oxford primary school when he was young, and has traveled throughout the world for Karate tournaments. In 2014, Kyle graduated from Kansas State University with a Bachelor of Science in Food Science and Industry and began working with Dr. MaryAnne Drake that same year. Upon receiving his Master of Food Science degree from North Carolina State University, Kyle will be moving to Chicago, Illinois to begin his career in sensory food science. ii
7 ACKNOWLEDGEMENTS Kyle would first like to thank his committee members for their support of this research. He especially appreciates the guidance of Dr. MaryAnne Drake, who insisted on only the best work from him. Kyle is thankful for all of the people he has met at NCSU for their comradery and friendship. Finally, Kyle would like to thank his wonderful family and his fiancé for their support through every trial that graduate school has presented him. iii
8 TABLE OF CONTENTS LIST OF TABLES... vi LIST OF FIGURES... vii CHAPTER 1: A REVIEW OF KANO ANALYSIS IN CONSUMER FOOD PRODUCT TESTING... 1 Introduction... 1 Goal of Kano Analysis... 1 What is Kano?... 2 How does Kano work?... 3 Data Collection and Kano Analysis... 6 What are Kano s limitations?... 9 Why is Kano a good option for the food industry?... 9 What work has been done with food? Kano s Contribution to Other Methods Recommendations References CHAPTER 2: CONSUMER PERCEPTION OF RETAIL PORK BACON ATTRIBUTES USING ADAPTIVE CHOICE CONJOINT ANALYSIS AND MAXIMUM DIFFERENTIAL SCALING Practical Applications Introduction iv
9 Materials and Methods Conjoint Survey Kano Analysis Consumer Importance and Emotions MaxDiff Scaling...31 Statistical Analysis Results and Discussion Conclusions References CHAPTER 3: COMPARISON OF TRADITIONAL PREFERENCE MAPPING WITH PROJECTIVE MAPPING FOR CHARACTERIZING CONSUMER PERCEPTION OF BREWED BLACK COFFEES Practical Application Introduction Materials and Methods Data Analysis Results and Discussions Discussion Conclusions References APPENDIX v
10 LIST OF TABLES Table 1.1 Matrix for Kano classification Table 2.1 Attributes and levels used in the ACBC conjoint survey Table 2.2 Twenty images used for bacon pack appearance in MaxDiff exercise...47 Table 2.3 Twenty images used for bacon strips appearance in MaxDiff exercises Table 2.4 Utility scores for levels within attributes for consumer clusters Table 2.5 Kano classifications Table 2.6 Importance scores for bacon attributes. Different letters in rows following means signify differences (P < 0.05). Importance was scored on a 5-point scale where 1 = not at all important and 5 = very important Table 2.7 Mean MaxDiff scores for bacon packaged images (scaled to 100) Table 2.8 Mean MaxDiff scores for bacon strip images (scaled to Table 3.1 Coffee brewing concentrations per 64 oz ( ml) of spring water Table 3.2 Coffee descriptors provided for PMCATA Table 3.3 Lexicon used for trained panel descriptive analysis of brewed black coffees Table 3.4 Comparison of overall liking means between CLT and PMCATA Table 3.5 Trained panel means for brewed black coffee Table 3.6 Consumer results Table 3.7 Overall liking among consumer clusters from the traditional CLT (n=275) vi
11 LIST OF FIGURES Figure 1.1 Kano s model for customer satisfaction (Kano et al. 1984) Figure 1.2 Kano results scatterplot of bacon attributes. An example Figure 1.3 Kano classifier and Kano categories (Xu et al. 2009) Figure 1.4 House of quality diagram (Matzler and Hinterhuber 1998) Figure 2.1 Attribute average importance scores across consumer clusters. Letters above bars within each attribute signify difference (P < 0.05) Figure 3.1 Multiple factor analysis of PMCATA data on 11 coffees (N=47 responses) Figure 3.2 Principal component analysis biplot of trained descriptive panel data on 11 coffees Figure 3.3 Percent represents the estimated percentage of consumers that would like the product above the mean Figure 3.4 Preference map of trained panel and consumer acceptance scores of black coffee Figure 3.5 Preference map for Cluster 1 consumers of trained panel and consumer acceptance scores of black coffee Figure 3.6 Preference map of Cluster 2 consumers of trained panel and consumer acceptance scores of black coffee Figure 3.7 Preference map of Cluster 3 consumers of trained panel and consumer acceptance scores of black coffee Figure 3.8 External preference map by partial least squares (PLS) regression for brewed black coffees. N=150 consumer evaluations of each coffee. Consumer clusters are identified by C1-C3. Coffees are indicated by numbers (Table 3.1) vii
12 CHAPTER 1: A REVIEW OF KANO ANALYSIS IN CONSUMER FOOD PRODUCT TESTING Introduction Kano analysis is a consumer research tool that can be used to define the relationship between customer needs and customer satisfaction (Xu et al. 2008; Kuo et al. 2014). Kano is useful and unique because it can identify asymmetric and nonlinear relationships between variables (Chen 2012). Relationships that might be found using numbered or line scaling tend to rely on a linear relationship where consumers respond to the question and their willingness to accept a product, leading to an ideal point of consumer acceptance. In reality, there might be a range of values that consumers find acceptable and in Kano analysis, they are referred to as Attractive, Performance and Must-Be as the 3 main categories and Indifferent and Reverse as the two other categories (Kano et al. 1984). Goal of Kano Analysis It is not always enough to know if a product as a whole is liked by consumers. In a quest for product optimization and generating the most consumer appeal with the least amount of resources, it is important to understand how consumers view and appreciate the individual components of a product. There are many approaches to understanding how a consumer might view and appreciate the individual components of a product. These 1
13 include, but are not limited to, simply using hedonic questioning for each of the individual components of a product, preference testing a wide range of products with a number of different attributes and inferring attribute preference through techniques such as penalty analysis, or applying a complex design of experiment or conjoint analysis to identify combinations of appealing attributes. Kano modeling is an alternative method for understanding how consumers feel about specific attributes of a product and, unlike the previously mentioned methods, it does not rely on a scale or forcing consumer preference in order to observe consumer sentiment. What is Kano? Kano modeling was originally founded on the theory of attractive qualities or service in the work of Dr. Noriaki Kano in the field of quality management (Kano et al. 1984). This model was also influenced by the Motivator-Hygiene theory that is used to model employee satisfaction using work engagement and compensation in a similar fashion to how Kano models consumer satisfaction of potential products by looking at consumer sentiment of potential features and attributes (Ernzer and Kopp 2003; Mitrabasu 2013). Kano modeling is based around the idea that simply adding more features to a product, a more is better approach, is not necessarily the most effective way to improve consumer satisfaction. Not only is this approach not efficient from a business standpoint by adding more cost to a product or service, at times the added items can be dissatisfiers and may 2
14 increase consumer dislike or dissatisfaction with the product. Instead, Kano modeling assumes that not all product components are valued equally and looks to have consumers prioritize product attributes to determine what attributes matter the most to consumers (Martin and Hanngton 2012). By understanding how consumers prioritize different aspects of products, developers are able to more efficiently allocate their time and resources to the most critical elements. Typically, the results of a Kano analysis are displayed in a two dimensional graph (Figure 1.1). How does Kano work? Kano s model works by first exploring selected attributes and then proceeding to respondent questionnaires and statistical analysis where each attribute is assigned to one of five dimensions of perceived quality. These dimensions can be seen in Figure 1.1. The five qualities can be summarized as: 1. Attractive: These attributes increase consumer satisfaction, but cause no penalty to consumer sentiment when missing. Kano originally called these Attractive or Delighters because that is exactly what they are and do. These are the attributes that can provide a point of difference and add value to a product. 2. One-Dimensional: The more these attributes are present, the more satisfied the consumer will be. These are the requirements that can usually be expressed on a linear spectrum such as the percentage of visible fat to lean in bacon or a light to dark 3
15 coffee spectrum. As the attribute move towards one end of the spectrum they will add to consumer satisfaction. If the attribute moves to the other end of the spectrum, it can have a negative impact on consumer satisfaction. These attributes can be important because they need to be filled to a certain point in order to not have a negative impact on consumer liking like a rejecter but can also add to consumer acceptability like an attractive attribute if fulfilled past consumer expectations. They are essentially linear drivers of liking. 3. Must-Be: When these attributes are present, consumers will have a neutral sentiment, but when not present, consumers will be dissatisfied. These attributes are requirements that must be included to avoid consumer dissatisfaction and are viewed as standard elements of a product by the consumer. 4. Indifferent: These are the attributes that most customers don t care about, whether they are present or not, and these attributes have little to no benefit when it comes to consumer satisfaction. 5. Reverse: Reverse attributes are those that cause dissatisfaction when present and satisfaction when absent. They are essentially linear drivers of dislike. They most typically find themselves in a product or service due to a lack of consumer research. There are numerous examples in the food industry. One example is packaging. An alcoholic beverage maker was seeking a premium ready-to-drink cocktail look by making the bottle appear like a silver shaker. In post research, it was discovered that the silver coating prevented the consumer from seeing the product and was a key 4
16 reason for a number of consumers not to purchase. The attribute and added expense would be a reverse driver and may have been avoided with more thorough research on packaging (J. McLean, personal communication 2016). As with other consumer research tactics, there are no absolutes with the Kano model. What one consumer describes as an attractive quality may be described as a one dimensional quality by others and may even be a must be quality by some. These differences in opinion are often attributed to customer segmentations with different priorities. As with other consumer research tools, multiple consumers should be surveyed and the average responses categorized. Segmentation of consumers can also be explored. The advantages of classifying product attributes into Attractive, Must-Be, and Performance qualities were described as follows by Matzler and Hinterhuber (1998): Product attributes are better understood: those which have the greatest influence on consumer satisfaction can be identified and classified into Must-Be, Performance, and Attractive qualities. Discovering and fulfilling attractive attributes creates a wide range of possibilities for differentiation. A product which merely satisfied the Must-Be and Performance qualities is perceived as only average and therefore interchangeable. Addition or enhancement of one dimensional attributes can increase product appeal. 5
17 Developers can set priorities for product development. It is, for example, useless to invest in improving Must-Be qualities which are already at a satisfactory level. It is better to improve Performance or Attractive attributes as they have greater influence on the consumer satisfaction levels. More generally, Must-Be and Performance qualities can potentially generate dissatisfaction and should first be brought under control when developing a product. Once such sources of potential dissatisfaction have been eliminated, attention can be focused on optimizing Performance and Attractive attributes to potentially generate greater satisfaction. Data Collection and Kano Analysis Dimensions are determined for each product attribute based on the level of sufficiency for which the attribute is present and the degree of consumer satisfaction (Lofgren and Witell 2008). How a researcher acquires the information to make this model can take a few different forms. Data can be collected by face-to-face interviews where researchers analyze transcripts to identify attribute: consequence relationships (Fisher and Schutta 2003), or data can be collected through a survey where consumers are asked questions in pairs: in one question the attribute is present and in the other it is not. Consumers are also asked to respond to sentiments about the product in this method (Martin and Hanngton 2012). Through both of these methods, consumers respond with or are asked whether 6
18 they like the attribute, expect the attribute, accept the attribute, dislike the attribute, or are neutral about the attribute. The consumer responses are taken both when the attribute is present and when the attribute is not present. Attributes are then categorized as Attractive (A), One- Dimensional (O), Indifferent (I), Must-Have (M), or Reverse (R) for each consumer in accordance with the grid in Table 1.1 (Lofgren and Witell 2008). Using this grid, the frequency of consumer responses for each pair of questions is collected. For example, the question pairs asked for a bacon packaging study would be: How do you feel when a window is present on the back of a package to view bacon? and How do you feel when a window is not present on the back of a package to view bacon? Consumer responses would be one of the following for each question: 1. I enjoy it that way. 2. It is a basic necessity (or, I expect it that way). 3. I am neutral. 4. I dislike it, but I can live with it that way. 5. I dislike it, and I can t accept it. The easiest way to interpret the results of a Kano model is to classify each attribute as the affinity it is most frequently considered by consumers (Sauerwein et al.1996). 7
19 Alternatively, there is a method to graphically represent consumer sentiments. This graphic can show what attributes are placed firmly in a classification and which attributes may be polarized among consumers. Using frequencies generated, the following equations are used to calculate the satisfaction and dissatisfaction index: Satisfaction index Dissatisfaction index A+O A+O+M+I M+O A+O+M+I The attributes can then be displayed in a scatterplot (Figure 1.2) with satisfaction on the y-axis and dissatisfaction shown on the x-axis. Attributes that are One-Dimensional drivers will be located towards the top right quadrant (I), Attractive attributes in the top left (II), Indifferent attributes in the bottom left (III), and Must-Have attributes in the bottom right (IV) (Berger et al. 1993). An example of real data collected and plotted can be seen in Figure 1.2. Attributes that are seen to be unimportant are pushed down in bottom left corner of the plot, must-have attributes migrate towered the bottom right of the plot with attractive attributes located in the top left region and drivers of liking in the top right. An illustration of the different regions of the Kano index plot can be seen in Figure 1.3 outlining the different classifications (Xu et al. 2009). 8
20 What are Kano s limitations? There are some limitations to the Kano model. The model works based on asking consumers what their affinity would be to a certain product feature. This can prove to be a challenge if consumers are unfamiliar with a particular feature or if developers are trying to test the affinity for an attribute that is currently not present in the market. It is imperative for consumers to have a good understanding of the attributes of a product class and the consequences associated with those attributes so that affinity can be accurately gauged (Fisher and Schutta 2003). Because of this issue, it is critical that respondents are screened correctly for a study and that the sample size is large enough to evaluate consumer segmentations or usage and demographic differences in the respondent base. Why is Kano a good option for the food industry? Consumer sentiment in product choices in a grocery store can be influenced by a number of different factors including both sensory attributes as well extrinsic attributes such as brand, packaging, label claims, and other market influences (Moskowitz et al. 2006; Gelici-Zeko et al. 2012, Kim et al., 2013; Hubbard et al., 2016). Consumer testing has shown that if these extrinsic characteristics of a product are recognized and accepted, the product is more likely to be accepted by the consumer (Moskowitz et al. 2006; Childs et al. 2008). 9
21 There have been many different methodologies used to try and understand how the extrinsic factors of a product affect consumer liking. These can be as simple as asking consumers how important they think a particular factor is, a Kano model, or as complex as conjoint analysis. Both Kano analysis and conjoint analysis have been used in a wide range of food applications including chocolate milk, produce and eggs to determine the importance of extrinsic and intrinsic product attributes on acceptance (Wardy et al. 2014; Kim et al. 2013). As food companies are continuously trying to find the most effective ways to satisfy and give consumers a point of difference with attractive attributes, deliver the must-haves as efficiently as possible, and increase productivity, Kano analysis can be a key tool. What work has been done with food? Although Kano modeling did not originally start in the food industry, it has been used successfully to better understand the attributes of many food products: Cottage cheese, lemon-lime carbonated beverages, chocolate milk, and chicken eggs. Food and beverage product development lends itself to Kano well due to the fact that a single type of product can be divided into many different attributes and qualities. Some of these qualities can be binary such as is a product organic or not, or a product can be one of many things such as a flavor or attributes can also be scaled/categorized such as skim, 2% and whole milk. The issues with looking at these attributes with a simple importance question are that it is 10
22 it only gets at the importance of having that attribute. This makes it difficult to understand the penalty for not including an attribute. Consumers might say that thick cut bacon is important to them but an importance question might fail to capture that there is not a large decline in sentiment for a product that is not thick cut. This means that the attribute of thick cut in bacon can serve as a point of difference from other products, but it is not necessary for the consumer to have a positive sentiment towards the product. Hubbard et al. (2015) used Kano modeling to evaluate consumer sentiment for attributes that are present in Cottage cheese. This modeling was paired with conjoint analysis to try and gain a full picture of consumer attitude in the category. This study found a number of attractive attributes in Cottage cheese. Satiety, digestive benefits, all natural and reduced fat were all viewed as attractive qualities. This means that their presence can add to consumer acceptance but their absence would not cause a negative experience. One dimensional qualities were tasting good and healthy, meaning that if a consumer perceives these qualities to be present, then it can add to consumer desire and satisfaction with Cottage cheese. If these qualities are not perceived to be present, then it can detract from consumer liking. The only must-have product attribute was creaminess showing that it is an expected quality that, if not present, will have a negative impact on consumer sentiment. 11
23 Kano modeling has also been used to demonstrate desired attributes in retail chicken eggs which emphasized the importance of convenience and safety while also showing that organic can be an attractive option to specific consumer segments (Wardy et al. 2014). Kano modeling was also used by Oltman et al. (2015) to identify consumers key attributes in protein beverages. Kano modeling was combined with an Adaptive Choice Based Conjoint (ACBC) to gain a full picture on how consumers viewed attributes of protein beverages. There were different attractive attributes for different consumer segments. Some consumers put emphasis on the amount of protein while others put emphasis on natural sweetener(s) and an all natural label claim. Kano modeling can also be applied to food packaging. Kim et al. (2013) evaluated the impact of packaging information on consumer acceptance of chocolate milk. This study was also paired with a conjoint analysis to gain a more detailed understanding of how consumers view attributes of chocolate milk packaging. This study also found differences in expectations between consumer segments supported by the conjoint results and Kano modeling. These differences showed that there are brand name preferences between segments as well as differences in expectations for organic ingredients, fat levels and sugar content. By knowing this information, product developers and marketers can better prioritize the attributes of a product and the cost to develop the attributes. By first prioritizing musthaves and one-dimensional attributes, developers build a floor of meeting consumer expectations. It is important to address these concerns first because they can potentially 12
24 have a negative impact on consumer experiences. After addressing must-have and the one-dimensional attributes, developers can look to enhance one-dimensional attributes and implement attractive elements to provide value added qualities to the consumer that can enhance their reasons to buy and their loyalty to the product. Kano s Contribution to Other Methods The Kano method was a cornerstone of developing a new method to choose products to be tasted when conducting preference mapping. This method is referred to as Adaptive Preference Target (APT). For a given category, researchers prioritized products and proposed a hierarchical order to be presented to each consumer. As they learned from the Kano model, some attributes explain only dissatisfaction (i.e. Must-Have attributes) and others explain satisfaction (i.e. attractive attributes). So, in product selection, the researchers avoided focusing on rejected ranges that are not optimized on Must-Have attributes and hypothesized that these products would not help explain what drives satisfaction. Even if a product presents an optimum level for an Attractive attribute, its effect on satisfaction can be hidden if the product is not optimized for a Must-Have attribute (Riviere et al. 2006). This methodology is acknowledging that consumer satisfaction does not have a linear relationship with attributes present in a product and that some attributes might contribute or detract more or less from consumer satisfaction dependent on how present they are in a product. 13
25 More generally, it was theorized that product satisfaction is determined by the absence of dissatisfaction for each of its attributes. Researchers proposed a two-sequence test that takes Kano s typology of attributes into account for each individual. First, APT aimed to find the prerequisites for each consumer by exploring the whole product range in an initial sequence. Then, in the second sequence, the new methodology focused on the individual preferred products to better identify Attractive attributes for each consumer. This sequential approach leads to products that are adapted to each consumer according to his or her specific preferences (Riviere et al. 2006). APT addresses one of the largest shortcomings of Kano models. That is, Kano only shows the direction of consumer sentiment but is not equipped to gauge the magnitude of change that might occur if an attribute is altered. For example, consumers might report that thick cut bacon is an attractive attribute meaning that if it is included, consumer acceptance would be expected to increase. However, it is difficult to know if the increase in consumer appreciation will be large enough to be meaningful or to offset the cost of changing the attribute. This is why it is important to combine or follow up Kano models with hedonic questions or other methods to quantify changes in consumer acceptance. Quality Function Deployment (QFD) was developed in the 1960s with the purpose of developing a quality assurance method that would design customer satisfaction into a product before it was manufactured. Prior quality control methods were primarily aimed at fixing a problem during or after manufacture (Akao 2003). QFD was able to utilize 14
26 Kano s method for understanding consumer needs and prioritize product attributes while also keeping in consideration the interaction effect that attributes might have on one another as well as added costs of production (Matzler and Hinterhuber 1998). QFD is used to identify each customer requirement (effect) and to identify the design substitute quality characteristics and process factors (causes) needed to control and measure it using a diagram known as a House of Quality diagram (Figure 1.4) with customer needs on the side and supplier responses on top. What was missing, though, was a way to determine which of the customer requirements were Attractive, Must-Have, Indifferent, Questionable, or Reverse, this was where Kano analysis has made QFD more efficient. Recommendations Kano analysis can be a very powerful tool that is able to uncover meaningful information that is not always apparent in other testing methods. It can be used as a way to understand the quality of attributes for a product that acutely matter to your consumer and help shed light on what it is that they expect and appreciate in particular goods. Kano modeling is a good primary tool to understand what attributes impact consumer sentiment and can be used to prioritize resources against attributes that consumers consider must-have, attractive, one-dimensional, reverse or are indifferent about. Kano modeling can be used as a stand-alone method to understand consumer sentiment toward attributes of a product. However, it is often important to understand the degree of impact of changes to these attributes. In order to understand the magnitude of difference made by attributes, it is 15
27 important to pair Kano with a hedonic scaled method of data collection. By understanding what it is that consumers desire out of their product, researchers can strive to achieve optimal satisfaction for product users. 16
28 TABLES AND FIGURES Figure 1.1 Kano's model for customer satisfaction (Kano et al. 1984). 17
29 Attribute present Table 1.1 Matrix for Kano classification Attribute not present Like Expected Neutral Accept Dislike Like Questionable Attractive Attractive Attractive One-dimensional Expect Reverse Indifferent Indifferent Indifferent Must have Neutral Reverse Indifferent Indifferent Indifferent Must have Accept Reverse Indifferent Indifferent Indifferent Must have Dislike Reverse Reverse Reverse Reverse Questionable 18
30 Figure 1.2 Kano results scatterplot of bacon attributes. An example. 19

31 Figure 1.3 Kano classifier and Kano categories (Xu et al. 2009). 29

32 Figure 1.4 House of quality diagram (Matzler and Hinterhuber 1998). 21
33 REFERENCES AKAO, Y., MAZUR, G.H. (2003). The leading edge in QFD: past, present and future, IJQRM, BERGER, C. BLAUTH, R. BOGER, D. BOLSTER, C. BURCHILL, G. DUMOUCHEL, W. POULIOT, F. RICHTER, R. RUBINOFF, A. SHEN, D. TIMKO, M. WALDEN, D. (1993) Kano s Methods for Understanding Customer-defined Quality, CQM, 4, CHEN, L A novel approach to regression analysis for the classification of quality attributes in the Kano model: An empirical test in the food and beverage industry. Omega 40, CHILDS, J.L., THOMPSON, J.L., LILLARD, J.S., BERRY, T.K. and DRAKE, M.A Consumer perception of whey and soy protein in meal replacement products. J. Sensory Stud. 23, ERNZER, M. and KOPP, K Application of Kano method to life cycle design. In Environmentally Conscious Design and Inverse Manufacturing, International Symposium FISHER, C. and SCHUTTA, J.T Voice of the Customer. Chap. 4 in Developing New Services, p , American Society for Quality, Quality Press, Milwaukee, WI. 22
34 GELICI-ZEKO, M. M., LUTTERS.D, KLOOSTER.R, WEIJZEN P Studying the influence of packaging design on consumer perceptions (of dairy products) using categorizing and perceptual mapping. Pack. Tech. Sci. 26, KANO, N. SERAKU, N., TAKAHASHI, F. TSUJI, S Attractive quality and mustbe quality. J. Japanese Society For Quality Control. 14, KIM, M. K., LOPETCHARAT K., DRAKE M. A Influence of packaging information on consumer liking of chocolate milk. J. Dairy Sci. 96, LOFGREN, M. and WITELL, L Two decades of using Kano s theory of attractive quality: A Literature review. Quality Management Journal. 15, MARTIN, B. and HANINGTON, B. M Kano Analysis in Universal Methods of Design: 100 Ways to Research Complex Problems, Develop Innovative Ideas, And Design Effective Solutions. Chap. 50, p ,Rockport Publishers, Beverly, MA. MATZLER K. AND HINTERHUBER H.H., How to make product development projects more successful by integrating Kano s model of customer satisfaction into quality function deployment. Technovation, 18, MITRABASU, N.C Integrating kano model and herzberg two factor theory to unveil the third quality factor of patient satisfaction in a multispecialty outdoor medical center. Int J Emerging Science and Engineering 1,
35 MOSKOWITZ, H. R., BECKLEY J. H., AND RESURRECCION A. V Chapter 7. High-level product assessment in Sensory and Consumer Research in Food Product Development. Blackwell Publishing, Ames, IA. pp OLTMAN, A.E., K. LOPETCHARAT,, E. BASTIAN AND, M.A. DRAKE Identifying key attributes for protein beverages. J. Food Sci., 80, RIVIERE, P., MONROZIER, R., ROGEAUX, M., PAGES, J., SAPORTA, G Adaptive preference target: Contribution of Kano s model of satisfaction for an optimized preference analysis using a sequential consumer test. Food Qual. Pref., 17(7), SAUERWEIN E., BAILOM F., MATZLER K., HINTERHUBER H. H The Kano Model: How To Delight Your Customers. International Working Seminar on Production Economics. 1, WARDY, W., MENA, B., NONGTAODUM, S., NO, H. K., PRINYAWIWATKUL, W Exploring the Drivers of Purchase Intent and Consumer Satisfaction of Chicken Eggs Using Principal Component Analysis and the Kano Model. J. Sensory Stud, 29, XU, Q., JIAO, R.J., YANG, X., HELANDER,M An analytical Kano model for customer need analysis. Design Studies. 30,
36 CHAPTER 2: CONSUMER PERCEPTION OF RETAIL PORK BACON ATTRIBUTES USING ADAPTIVE CHOICE CONJOINT ANALYSIS AND MAXIMUM DIFFERENTIAL SCALING Practical Applications Consumer survey techniques have expanded to a mass of possibilities due to the ubiquity of internet access. Adaptive Choice-Based Conjoint (ACBC) is a research technique that allows consumers to react to assembled products and identify product attributes that they prefer. This technique allows researchers to evaluate changes in current products or product price to maximize consumer appeal. Kano questions allow researchers to look at the individual aspects of a product and understand consumer sentiment and expectations towards those product qualities while Maximum Difference scaling allows consumers to directly rank single attributes of a product relative to one another. A combination of these three approaches can provide key understandings on consumer perceptions of retail bacon allowing companies to optimize and maximize their development and advertising resources. Introduction Bacon is one of the most iconic food products in the retail space. In the past few years, the consumer demand for pork bacon has increased and this increase in demand, coupled with the high value of pork bellies (the source of bacon), suggests the potential for bacon 25
37 beyond commodity value. As such, it is important to understand why and how bacon consumers view the value of bacon qualities and how that can assist in product development and positioning. Understanding and fulfilling consumer needs has been well recognized as one of the principle factors for product design and development success (Mckay et al. 2001). Kano questioning, Adaptive Choice-Based Conjoint (ACBC) and Maximum Difference scaling (MaxDiff) are useful tools for gauging consumer sentiment and relating that to consumer preference. Kano questioning is an effective method for understanding the direction of consumer attitudes towards individual qualities of a consumer product by questions to determine the direction of consumer sentiment (Kano et al. 1984). Bacon can be easily divided into specific attributes ranging from flavor, thickness of the cut, fat to lean ratio, or various label claims such as lower sodium, all natural or center cut. Individual qualities can be identified as having a positive or negative impact on consumer satisfaction. The Kano model abandons the strictly linear continuous scale that is used in hedonic testing to determine the impact of an overall product or attribute in favor of identifying individual attributes that have the potential to elicit consumer satisfaction or dissatisfaction (Mikulić et al. 2011). Consumers are asked how they feel about the presence of specific product qualities and then asked again when the same quality is not present to gauge consumer sentiment for that specific attribute or quality. Kano modeling has been used to evaluate a number of different food products including biscuits (Rivière et al. 2006), fresh eggs 26
38 (Wardy et al. 2014), chocolate milk (Kim et al. 2013), and fresh tomatoes (Oltman et al. 2014). Conjoint analysis is another useful tool for understanding consumer preferences towards the components of a product. Conjoint methods evolved from the field of mathematical psychology, statistics, and economics (Orme et al. 2010). Conjoint can be used to determine the attractiveness of individual product features collectively for a product and has been widely used in the fields of sensory and market research. Conjoint analysis has been used to evaluate product attribute appeal in many different food categories including sour cream (Jervis et al. 2012), chocolate milk (Kim et al. 2013; Li et al. 2014), protein beverages (Oltman et al. 2015), fresh tomatoes (Oltman et al. 2014), and strawberry yogurt (Vickers 1993). Unlike Kano questioning, which focuses on the satisfaction of individual attributes, conjoint evaluates how various attributes are perceived collectively. There has been an evolution of conjoint over the years, and there are a few types of conjoint available. Full-Profile Conjoint Analysis was designed to measure all possible combinations of attributes in a product, Adaptive Conjoint Analysis (ACA) was made to handle larger groups of attributes and levels by only presenting a partial presentation of possible combinations based on initial consumer responses, and Choice-Based Conjoint (CBC) is a method that uses consumer-made ideal product as a reference for product combinations that are presented (Orme, 2010). Adaptive Choice-Based Conjoint 27
39 (ACBC) recently combined the adaptive qualities of ACA and the starting reference point of CBC. Menu-Based Conjoint (MBC) is another recent form of conjoint that works in a similar fashion as CBC, the only difference being that levels within the attributes can be treated as check-all-that-apply, allowing consumers to select multiple levels within an attribute (Orme, 2010). Maximum Difference scaling (MaxDiff), also known as Best-Worst Scaling, is another way to compare the individual attributes of a product. MaxDiff allows for direct assessment of individual attributes. Unlike conjoint, MaxDiff does not split up products into attributes and levels. Instead, a list of individual products, attributes or statements are presented and the customer is asked to evaluate the best or most preferred option as well as the worst or least preferred one (Erdem et al. 2012). MaxDiff Scaling has been applied in food research for attributes of olive oils (Dekhili et al. 2011) and dark chocolate (Thomson et al. 2010). Pork bacon has been largely viewed as a commodity food product. As such, very little sensory research has been published, and sensory work that has been published has focused on advancements in processing technologies (Risvik and Einar, 1986) or quality assurance (Lowe et al. 2014). The objective of this study was to explore the attributes of retail bacon that influence consumers to purchase and consume it. In this study, we set out to find the positive aspects of bacon that influence consumers at the point of purchase 28
40 and demonstrate that bacon consumers can have diverse preferences in a product category that is largely viewed as ubiquitous and as a commodity. By using the three methods (Kano, MaxDiff and ACBC) that go beyond basic hedonic questioning, we will provide not only the liking of attributes but be able to provide guidance to a company on how to maximize resources by prioritizing attributes that are the most impactful on consumer purchase decisions. Materials and Methods Online surveys were constructed and launched using SSI Web (Sawtooth Software version number , Orem, UT, U.S.A.). The survey was uploaded to the internet and distributed to a database of 7000 consumers maintained by the North Carolina State University Sensory Service Center (Raleigh, NC, U.S.A.). Consumers were asked a series of demographic questions as well as consumption questions to make sure that they had purchased and consumed pork bacon in the last 60 days. Qualified respondents then proceeded to the Kano, ACBC, and MaxDiff portions of the survey as described below. After respondents completed the survey, they were entered into a drawing to receive one of ten $50 or $25 gift cards to a local shopping store. A total of 1410 qualified responses were collected. 29
41 Conjoint Survey Seven attributes (package size, brand, claims, thickness, flavor, an image representing fat to lean ratio, and price) were selected with different levels within each attribute (Table 2.1). These attributes were chosen based on representation of different characteristics observed in the retail bacon space. The ACBC began with a build-your -own (BYO) exercise where respondents were asked to construct their ideal product from the levels and attributes provided. This was followed by eight screening tasks with five products per task and possible responses of a possibility or will not work for me. Between screening tasks, four unacceptable questions and three must have questions were asked. The screening task section was followed by an eight-question choice task tournament section consisting of three choices each. A maximum of 16 products were brought into the choice tournament including the BYO configuration that the respondent made at the start of the exercise. Root likelihood values were analyzed to remove any respondents with values below ⅓ (Orme 2010; Jervis et al. 2012). Kano Analysis Kano questioning focused around a variety of attributes that can be present in bacon in order to determine how these attributes impacted consumer satisfaction or dissatisfaction. All respondents were asked to first indicate their opinion for each attribute when that attribute was present (ex. Bacon that is low sodium ) with the possible responses of I will like it, I must have it, I don t care, I can live with it, or I will dislike it. 30
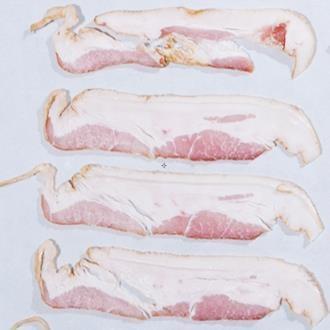
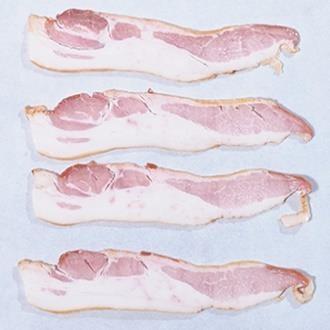
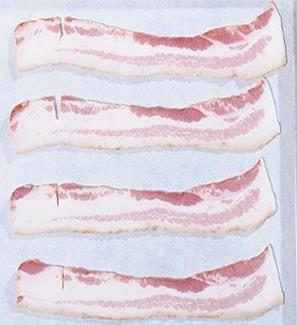
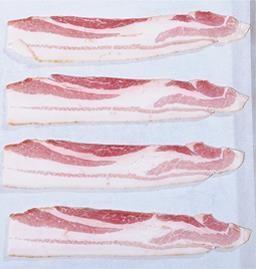
42 Respondents were then asked their opinions about the attributes in a reductive format (ex. Bacon that is not low sodium ) with the same possible responses. The answers chosen for the additive and reductive questions were then used to calculate a Kano contingency table (Xu et al. 2009). Consumer Importance and Emotions Following Kano questions, consumers were asked a series of questions about the importance of various bacon attributes using a 5-point scale that ranged from 5 ( very important ) to 1 ( Not important at all ). Importance questions were then followed by emotional response questions where consumers were asked how they felt about various bacon attributes with a CATA (check-all-that-apply) list of emotions adapted from Jervis et al. (2014). Emotions selected by over 20% of respondents were reported. MaxDiff Scaling Two MaxDiff exercises occurred after the conjoint exercise. The first exercise consisted of 20 photographs of bacon in flat board packages. For this exercise, the bacon appearance varied across the 20 samples in the amount of visible fat:lean or the shape of the bacon strip as seen in the package (Table 2.2). The purpose of this exercise was to determine visual cues in the appearance of packaged bacon that might influence consumers. The second exercise consisted of photographs of three strips from each of the same 20 bacon packages placed on butcher paper (Table 2.3). The purpose of this 31
43 exercise was to determine visual cues of bacon strips that might influence consumers. This task also allowed us to determine any correlations between consumer perception of bacon packaging and the same bacon viewed as individual strips. Each of the exercises was set up using best-worst scaling labeled as most appealing and least appealing. Each respondent completed best-worst questions for ten sets of bacon in each exercise. Each set consisted of five sample images with the following question: which of the bacons (or bacon packages) do you find most appealing and least appealing? Statistical Analysis Data analysis was performed using XLSTAT version (Addinsoft, New York, NY, USA). Importance questions were analyzed using a Kruskal-Wallis test with Dunn s post hoc test. Emotional questions were analyzed for frequency of choice using a Chi-squared significance test. A Kano index was calculated based on consumer responses to the satisfaction or dissatisfaction questions (Kano et al. 1984, Kim et al. 2013). For the ACBC survey, the individual utility scores were calculated using SSI web (Sawtooth Software , Orem Utah U.S.A.) by Hierarchical Bayesian estimation. An analysis of variance was used with Fisher's least significant difference to determine significance between levels and attributes within the sampled population (n=1410). Cluster analysis of utility scores was performed with k means clustering followed by analysis of variance with means separation for determination of differences within each cluster. MaxDiff 32
44 scores were also evaluated by SSI Web (Sawtooth Software , Orem Utah U.S.A.) by Hierarchical Bayesian estimation. Results and Discussion Demographics A total of 1410 consumers completed the survey based on self-reported consumption of pork bacon at least once per month. They were primarily female (72.3%) and identified as Caucasian (70.7%) with more than 75% having at least some college education. Thirty percent were between the ages of y, 34% ages y and 36% > 46 y. An even distribution of income was also self-reported with annual household income ranging from < $30,000 to more than $100,000. Conjoint Analysis No respondents had an RLH value below 0.333, so all data was carried into the analysis. Importance values with higher scores indicate that the attribute is more important than other attributes with lower importance scores (Orme 2009). Overall, consumers reported price to be the most important factor, followed by the visible fat:lean and then flavor type (Figure 2.1). For the utility scores (zero centered), within an attribute, higher scores represent more appealing levels, and lower scores represent less appealing levels (Orme 2009). Overall, consumers preferred bacon that came in a large package size, was low in 33
45 price, had a high lean:fat ratio, and was a normal hardwood smoked bacon flavor (Table 2.4). Three different clusters were identified based on the individual utility scores: a price motivated cluster (n=702), a flavor motivated cluster (n=317), and an appearance motivated cluster (n=391) (Figure 2.1, Table 2.4). Demographic information (age, ethnicity, household income, age, education) was not distinct among clusters (p>0.05) (data not shown). The price motivated cluster placed a significantly higher importance on the price and the package sizes of the bacon. Within the attributes of package size, the price motivated cluster also placed more utility on packages of a larger size (16oz, 20oz, 24oz), consistent with a price conscious mindset. In the attribute of price, all segments placed more utility on bacon that was a lower price, but the price motivated cluster placed the greatest utility on bacon that was a lower price. The flavor driven cluster placed their highest importance score on the flavor type of the bacon, showing an affinity towards bacon that was hickory, hardwood, or no flavor added (Table 2.4). All three of these flavors are representative of traditional bacon flavors. The flavor driven cluster placed a low utility on flavors like maple, pepper, honey, or cherry wood, flavors that are not viewed as standard. The flavor cluster placed their second highest importance score on the price of the bacon, showing a preference for bacon that is low in price. This shows that these consumers are price sensitive but are more likely to 34
46 narrow down their choice based on flavor rather than a purchase decision based on price alone. The visual cluster placed the highest importance scores on the visible fat: lean attribute which was represented by the five images of bacon packages that displayed a gradient of visible fat: lean (Table 2.1, Table 2.4). The visual segment showed a preference for bacon that had a high visible lean percentage. The price and the flavor segments also showed significant preference for high visible lean options, but this preference was more pronounced in the visual consumer segment. The visual segment placed their second highest importance score on the price of the bacon. Thickness was seen as the least important attribute of the seven attributes evaluated (Figure 2.1). The flavor driven cluster placed more importance on thickness then the other two (p<0.05), however the mean difference in importance was much smaller than other attributes such as price, visual fat to lean ratio and flavor. Within the clusters, the price and visual motivated clusters showed a preference for thick cut bacon while the flavor driven cluster showed a preference for normal cut bacon. This is an interesting result since thick cut bacon was seen as an attractive quality by all of the consumer clusters by Kano analysis. This suggests that consumers view thick cut bacon as a value added quality but are very willing to compromise it for of other attributes. 35
47 Brand was seen as the sixth most important attribute of the seven that were tested (Figure 2.1, Table 2.4). The flavor and visual clusters top three scoring brands were Boars Head, Smithfield and Oscar Mayer. These are national or regional brands available in the Raleigh, NC area, demonstrating that brand identity is meaningful to these consumers but is not as valued as it is with other products. The price motivated cluster listed their top three as Boars Head, Smithfield and Store brand (Table 2.4). The presence of store brand in the top 3 brands for this cluster once again emphasizes their primary desire for low price since store brands are typically less expensive than name brands. The utility score of store brand was higher in cluster one (price driven consumers) compared to the other two clusters (p<0.05) but again, the mean difference was much smaller than the difference in utility scores of the most important/valued attributes like flavor, price and visible fat to lean. Bacon is not a highly branded product so results are not surprising. Name brand was quantified as indifferent by Kano analysis for all three clusters as well. Label claims were listed as the fifth most imported attribute out of the seven that were tested. The flavor motivated consumers placed more importance on label claims then clusters motivated by price and appearance. The highest rated label claim by all three clusters was all natural and center cut. All natural was listed as a must have element by Kano analysis for all three of the consumer clusters. It is unclear if consumers are motivated by the label claim of all natural which requires that the bacon be uncured, or if they just want to perceive bacon as all natural and minimally processed. 36
48 Further consumer testing would be needed to determine if uncured bacon is seen as all natural and preferred to cured bacon. Kano Analysis Kano questions can be another way to understand how consumers perceive attributes present in bacon. Must-have attributes are attributes that must be present for the product to be acceptable, their stated presence does not necessarily add to consumer satisfaction, but if they are missing, can lead to dissatisfaction. One-dimensional attributes are directly related to consumer satisfaction in a linear way. Attractive attributes will lead to consumer satisfaction but will not decrease satisfaction if the product lacks these attributes. Indifferent attributes have no effect on consumer satisfaction (Kano et al. 1984). The bacon attribute that was a universal one-dimensional driver across all consumers and consumer clusters was bacon that was high in visible lean (Table 2.5). Thick cut bacon was regarded as an attractive quality across all consumers and in all three consumer clusters. The fact that it is attractive might explain why the thickness of cut was so low in importance from the ACBC, as there is not a penalty for not including the attribute in any of the consumer segmentations, but it remains an attractive bacon attribute. Center cut was also an attractive attribute in the price motivated and the appearance motivated 37
49 clusters. This is conducive to the ACBC fat to lean importence and utility score results, as center cut bacon has a higher lean to fat ratio than non-center cut bacon. Bacon that tastes good was listed as a must-have attribute across all consumers and in all three consumer clusters. This is unsurprising as people expect bacon to taste good. There would be a penalty in satisfaction for it not tasting good. This also shows that by not being listed as one-dimensional, consumers do not view bacon as a product that has an ability to taste exceptionally good. There is no increase in consumer appeal for bacon that is more apparently good tasting, perhaps because all bacon, even bacon that has less attractive attributes, would still be expected to taste good. A Kano result that was present in three clusters was bacon that is natural was a must have attribute. This is an interesting result because most bacon cannot make the label claim of all natural or natural. Bacon is a cured meat containing salts as well as nitrates and nitrites. The addition of nitrates and nitrites violates the Food Safety and Inspection Service (FSIS) requirements for bacon to be labeled as natural (21 CFR ). Curing bacon acts as a preservative but also provides bacon with characteristic color and flavor. The contribution of nitrite to cured meat flavor is well established (Gray and Paterson, 1984). Curing with nitrate causes bacon to have its characteristic red color as well as prevent microbial growth. Bacon that is not cured is labeled uncured bacon and lacks the distinct bright red color of cured bacon and its characteristic flavor. It is difficult to tell if 38
50 consumers care about the label claim of natural in bacon or if it is something desired across all food products or if consumers want to perceive bacon as natural or wholesome. When consumers were asked how they felt about bacon that was cured, all clusters were indifferent, most likely due to a lack of knowledge of what cured meant. When consumers were asked about preservatives in bacon, the visual and the flavor clusters both listed this as a rejector. Preservatives in food as a whole have a negative image with consumers and this result likely reflects this sentiment. Interestingly, only the visual cluster listed nitrite as a rejecter. The other two consumer groups listed nitrite as indifferent, again perhaps due to a lack of knowledge or understanding of what nitrite is (a preservative). Nitrite is also the component that causes the red cured meat color in bacon that the visual cluster was most positively driven by in the conjoint analysis. Sensory testing is needed to understand if the addition of a label claim or processing without nitrite would lead to a significant impact in consumer liking in the absence of the visual and flavor attributes that nitrite provides. There was also not a direction for consumer sentiment on many of the label claims that can come with bacon such as low sodium or polyunsaturated fats. This suggests that consumers do not expect bacon to be healthy or at least, it is not a quality that consumers place much value in when purchasing bacon. This was also reflected in the conjoint results, label claims had one of the lowest importance scores across all the attributes (Figure 2.1). A similar result was also given when asked if consumers prefer a bacon that 39
51 was a name brand. All consumer clusters were indifferent to brand, this result was also reflected in the conjoint where brand had one of the lowest importance scores (Figure 2.1). This result supports the commodity mindset for bacon that brands are not important. Importance and Emotions Importance scores were consistent with the results gathered in the ACBC exercise (Table 2.6). Consumers from the price motivated cluster rated bacon that is low in price higher than the other two clusters. The appearance segment rated bacon that looks high in lean and packaging where they were able to see the bacon highest in importance and higher than the other two segments. The price motivated segmented rated price to be more important the other two segment (p<0.05), consistent with the conjoint result. When ask about how important brand was for bacon, all three clusters gave it the lowest score out of all questions asked < 3 on a 5 point scale (1=not important at all 5= very important) again consistent with conjoint and Kano results. The value driven cluster gave the lowest importance scores for sodium content, polyunsaturated fats, and all natural. This result is consistent with their value-first mentality, showing that they are not easily influenced by label claims. The flavor driven consumers gave lower importance scores then the other two clusters for flavored bacon. These consumers were drawn to bacon flavors that are thought of as original flavors, 40
52 hardwood, hickory or no flavor added. This suggests that they are less inclined to try a new or different flavor of bacon. When asked about servings per package, there was no difference between the three clusters (p>0.05). This is a surprising result because the value driven cluster had a significantly larger importance score in package size in the conjoint results. This result likely suggests that all three clusters believe that package size is important to them but the flavor and appearance consumers are willing to compromise on package size for other attributes more easily. When asked about bacon that looks fatty or bacon that looks lean, the visual cluster placed a higher importance score compared to the other two clusters (p<0.05). All three clusters scored bacon that looks lean high in importance, consistent with the Kano results where bacon that looks lean was a positive driver. Overall, consumers had positive feelings towards bacon, with greater than 20% of the population stating that bacon made them feel Glad, Good, Happy, Joyful, Nostalgic, and Pleasant. Greater than 20% of the sampled population also reported bacon making them feel Nostalgic and Guilty. There was no significant difference in emotional response across the consumer clusters (p>0.05) (results not shown). MaxDiff Knowing that appearance is a significant factor in bacon appeal for all consumer clusters, it is important to know the impact that appearance can have at the point of purchase as 41
53 well as at the point of use. Two MaxDiff ranking exercises were performed to address this issue. The first with twenty photos of bacon in packages and the second with the same twenty bacons laid out in strips on butcher paper. There were sixteen significant groups in the exercise with bacon packages and fourteen significant groups in the exercise with bacon strips (Tables 2.7 and 2.8). The bacons that were considered to be the most appealing by the consumers were sample numbers 20, 15 and 18. These packaged samples had a high level of visible lean to fat and lacked any overt packaging defects. Samples 10, 11 and 7 were considered to be the least attractive options. These packages had very high levels of visual fat and were sliced in a way that made them atypical and not positioned in the package correctly. Although the individual exercises indicated differences, when the results of the strip and package exercises were compared for correlation, there was no significant correlation (rsquared value of 0.198, p>0.05). This result demonstrates that there is a lack of correlation between bacon that consumers found appealing in and out of the package. This result suggests a challenge in meeting consumer expectations where industry could improve packaging windows to better meet consumer expectations when the bacon is removed from the package. There has been no published work to our knowledge on bacon appearance, attributes and package claims that are appealing to consumers. It may exist within companies, but is 42
54 not available in the public domain. Work that has been published has focused on advancements in processing technologies (Risvik and Einar, 1986) or quality assurance (Lowe et al. 2014). The current study provides some key findings. Firstly, our results indicate that bacon has consumer appeal beyond a commodity. The commodity aspect of bacon was demonstrated by price being an important factor in all clusters and brand had minimal importance in conjoint and importance ratings. However, the most appealing attribute for two of the consumer clusters was not price, indicating industry and brands can develop reasons to buy that will delight the consumer and have the potential to make them brand loyal. A future areas of research should examine the production of a nitrate free bacon that will still deliver on taste important to the visual cluster. Another area of research would be to further optimize the flavor varieties. This research indicates that traditional flavors are important and more appealing to the flavor cluster, but more research could be done on combining the traditional flavor with a unique flavor. This could make the consumer more comfortable with a unique flavor that a company can market as a point of difference. Conclusions By utilizing all three methods of analysis, the key attributes of bacon were identified and distinct consumer clusters that have different expectations for bacon products were identified. Apart from price per pound, bacon is not treated as a commodity good by all consumers and flavor type and lean:fat appearance are also driving factors in bacon 43
55 appeal. It is also important to note that there does not appear to be a correlation between bacon appearance appeal when it is in versus out of the package. Manufacture research could shed light on how to remove this disconnect in appeal of bacon in and out of the packaging while also capitalizing on the value-added bacon attributes. Acknowledgements Use of tradenames does not imply endorsement nor lack of endorsement by those not mentioned. 44
 Levels 8oz 12oz 16oz 20oz 24oz Smithfield Oscar Meyer Hormel Boar s Head Store Brand Wright Gwaltney No Claims Low Sodium All Natural")
56 TABLES AND FIGURES Table 2.1 Attributes and levels used in the ACBC conjoint survey. Attributes Package size Brand Claims Front Image (fat to lean) Levels 8oz 12oz 16oz 20oz 24oz Smithfield Oscar Meyer Hormel Boar s Head Store Brand Wright Gwaltney No Claims Low Sodium All Natural Center Cut 48.02% Visible Lean to Fat 53.95% Visible Lean to Fat 57.96% Visible Lean to Fat 76.88% Visible Lean to Fat 45
57 Table 2.1 cont. Flavor Thickness Apple Wood Maple Honey Peppered Cherry Wood Hickory Hardwood No flavor added Normal cut Thick cut 81.25% Visible Lean to Fat 46


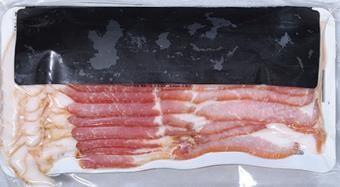
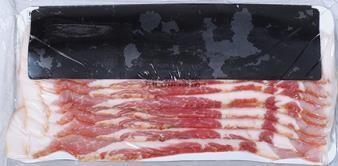
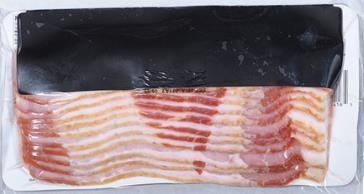
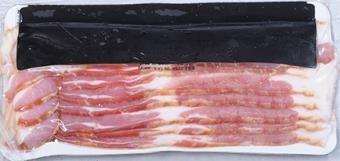
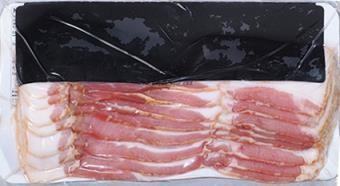
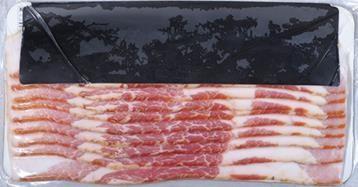
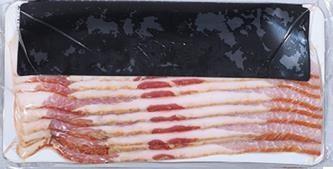
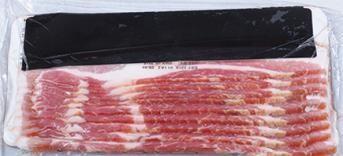


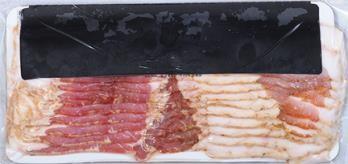
58 Table 2.2 Twenty images used for bacon pack appearance in MaxDiff exercise


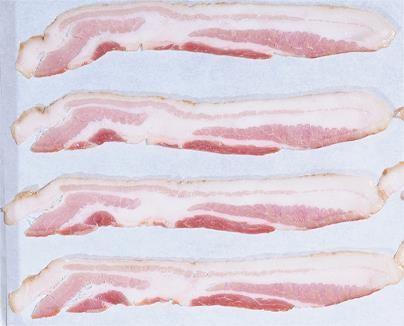

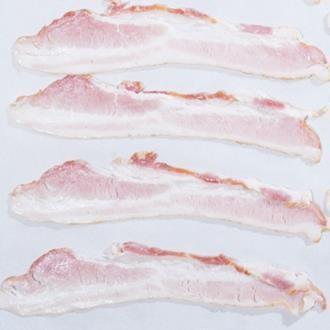
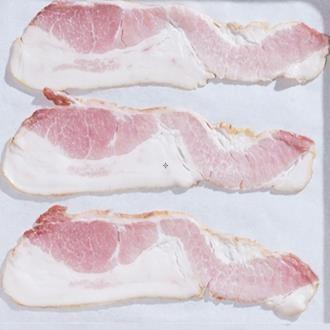


59 Table 2.3 Twenty images used for bacon strips appearance in MaxDiff exercises


60 Table 2.3 cont
61 Figure 2.1 Attribute average importance scores across consumer clusters. Letters above bars within each attribute signify differences (p<0.05). 50
62 Table 2.4 Utility scores for levels within attributes for consumer clusters. Cluster 1 n=702 Cluster 2 n=317 Cluster 3 n=391 All N=1410 Package size 8oz ce ac ac 12oz cd ab ab 16oz ab da ca 20oz ac cb cb 24oz aa cb cb bd bc bb ba ba Brand Smithfield aa ab aa Hormel bd bd ad aa ae Oscar Meyer ac ac ac ac Store brand ac bd bd Boars Head cb aa bc B Wright ae af af Gwaltney ad ae ae Claims No Claims ad bd ac abd bb ag af ad Low Sodium ac cc ab bc All Natural ca aa ca ba 51
63 Table 2.4 cont. Center Cut ab bb aa Thickness Normal cut bb aa ba Thick cut aa cb ba Flavor Apple Wood aa ab ba Maple ac cc ab C Honey ae ce ad Peppered bf bd ad ab ba ba ab bd be abf Cherry Wood ad cc bc bd Hickory ba ab ba Hardwood bb ab cb ba bc No flavor added cb C aa ba bb Fat to lean 48.02% Visible Lean to Fat ae bd de ce 53.95% Visible Lean to Fat ad ac cd bd 57.96% Visible Lean to Fat ac bc bc abc 52
64 Table 2.4 cont % Visible Lean to Fat 81.25% Visible Lean to Fat cb db ab ca da aa 1.21 bb ba Price Price: aa ba da Price: db bb ab ca cb 53
65 Table 2.5 Kano classifications. Cluster 1 n=702 Cluster 2 n=317 Cluster 3 n=391 Total populat ion Bacon that is low sodium n=1410 Indifferent Indifferent Indifferent Indifferent Bacon that is all natural Must-be Must-be Must-be Attractive Bacon that is certified humanely raised Indifferent Indifferent Indifferent Indifferent Bacon that has preservatives Indifferent Rejecter Rejecter Indifferent Bacon that is cured Indifferent Indifferent Indifferent Indifferent Bacon that is microwaved Rejecter Rejecter Rejecter Rejecter Bacon that is fried Indifferent Indifferent Indifferent Indifferent Bacon that tastes good Must-be Must-be Must-be Must-be Bacon that is flavored Indifferent Indifferent Indifferent Indifferent Bacon that is center cut Attractive Attractive Indifferent Attractive Bacon that is crispy Attractive Must-be Must-be Attractive Bacon that is chewy Rejecter Rejecter Rejecter Rejecter Bacon that is low in price Indifferent Indifferent Indifferent Indifferent Bacon that comes in bulk packaging Indifferent Indifferent Indifferent Indifferent Bacon that is low calorie Indifferent Indifferent Indifferent Indifferent Bacon that is thick Attractive Attractive Attractive Attractive Bacon that is name brand Indifferent Indifferent Indifferent Indifferent Bacon that has added nitrite Indifferent Indifferent Rejecter Indifferent Bacon that is dark in color Indifferent Indifferent Indifferent Indifferent 54
66 Table 2.5 cont. Bacon that is light in color Indifferent Indifferent Indifferent Indifferent Bacon that is firm when raw Indifferent Indifferent Indifferent Indifferent Bacon that is flimsy when raw Indifferent Indifferent Indifferent Indifferent Bacon that contains polyunsaturated fats Indifferent Indifferent Indifferent Indifferent Bacon that is thick cut Attractive Attractive Attractive Attractive Bacon that has a lot of visible (white) fat Rejecter Rejecter Rejecter Rejecter Bacon that has a lot of visible lean (meat) portion Onedimensional Onedimensional Onedimensional Onedimensional Kano classification was calculated by previously described methods (Kano et al. 1984). The contingency table of satisfaction and dissatisfaction answers was created for each feature. 55
67 Table 2.6 Importance scores for bacon attributes. Different letters in rows following means signify differences (P<0.05). Importance was scored on a 5-point scale where 1 = not at all important and 5 = very important. Cluster 1 n=702 Cluster 2 n=317 Cluster 3 n=391 All N=1410 How important is. Low price 4.07c 3.39a 3.65b 3.80b Brand 2.76a 2.9ab 2.96b 2.85ab Being able to see the bacon in the package 4.49a 4.46a 4.65b 4.53ab Sodium content 3.18a 3.36ab 3.51b 3.31ab Polyunsaturated fat content 2.86a 3.15b 3.14b 3.00ab Bacon that is all natural 3.17a 3.54b 3.48b 3.34ab Bacon that has a flavor (Maple or Apple Wood ) 3.03b 2.82a 3.12b 3.01b Servings per package 3.45a 3.3a 3.3a 3.37a Bacon that looks lean 3.94a 3.97a 4.46b 4.09a Bacon that looks fatty 3.09a 3.32ab 3.36b 3.22ab Lettering denotes significant difference based on 95% confidence interval. 56
68 Table 2.7 Mean MaxDiff scores for bacon packaged images (scaled to 100). Higher scores denote higher MaxDiff ranking (more appealing) images. Item Number Average score a b c d de 3 8.7e 2 6.4f 5 5.9f 1 5.3g h i 9 2.6j 4 2.3k 8 1.8l m n 6 0.6o o o 7 0.2p Lettering denotes significant difference based on 95% confidence interval. 57
69 Table 2.8 Mean MaxDiff scores for bacon strip images (scaled to 100). Higher scores denote higher MaxDiff ranking (more appealing) images. Item Number Average Score a b 5 10bc 2 9.8c d 4 7.5e 8 6.8f g h h i 1 3.2jk 3 3.0jk 9 3.0jk 7 2.8k l 6 0.5l m n n Lettering denotes significant difference based on 95% confidence interval. 58
70 REFERENCES DEKHILI, S., SIRIEIX, L. COHEN, E How consumers choose olive oil: The importance of origin cues. Food Qual Pref 22, ERDEM, S., RIGBY, D., WOSSINK, A Using best worst scaling to explore perceptions of relative responsibility for ensuring food safety. Food Policy 37, GRAY, J. I., AND A. M. PEARSON Cured meat flavor. Adv. Food Res. 29,1-86. JAEGER, S.R., JØRGENSEN, A.S., AASLYNG, M.D., BREDIE, W.L Best worst scaling: An introduction and initial comparison with monadic rating for preference elicitation with food products. Food Qual Pref 19, JERVIS, S., ENNIS, J., DRAKE, M A comparison of adaptive choice-based conjoint and choice-based conjoint to determine key choice attributes of sour cream with limited sample size. J Sens Stud 27, JERVIS, S., JERVIS, M., GUTHRIE, B., DRAKE, M The efficacy of using photographs to represent attributes of sliced sandwich bread in an adaptive choice-based conjoint. J Sens Stud 29, KIM, M., LOPETCHARAT, K. DRAKE, M Influence of packaging information on consumer liking of chocolate milk. J Dairy Sci 96,
71 LI, X.E., LOPETCHARAT, K. DRAKE, M Extrinsic attributes that influence parents purchase of chocolate milk for their children. J Food Sci LIECHTY, J., RAMASWAMY, V., COHEN, S.H Choice menus for mass customization: an experimental approach for analyzing customer demand with an application to a web-based information service. J. Mark. Res. 38, LOWE, B., BOHRER, B., HOLMER, S., BOLER, D., DILGER, A Effects of retail style or food service style packaging type and storage time on sensory characteristics of bacon manufactured from commercially sourced pork bellies. J Food Sci MCKAY, A., PENNINGTON, A.D., BAXTER, J Requirements management: a representation scheme for product specifications. Comput. Aided Des. 33, MIKULIĆ, J., PREBEŽAC, D A critical review of techniques for classifying quality attributes in the Kano model. Managing Service Quality: An International Journal 21, OLTMAN, A., JERVIS, S., DRAKE, M Consumer attitudes and preferences for fresh market tomatoes. J Food Sci OLTMAN, A., LOPETCHARAT, K., BASTIAN, E., DRAKE, M Identifying key attributes for protein beverages. J Food Sci
72 ORME, B.K Getting Started With Conjoint Analysis: Strategies For Product Design And Pricing Research. pp Research Publishers, LLC, Madison, WI. ORME, B. K Menu-based choice modeling using traditional tools. In sawtooth software conference proceedings, Sawtooth Software Research Paper Series, 1-22 Available at Accessed July 12, RISVIK, E Sensory evaluation of irradiated beef and bacon. J Sens Stud 1, RIVIÈRE, P., MONROZIER, R., ROGEAUX, M., PAGÈS, J., SAPORTA, G Adaptive preference target: Contribution of Kano s model of satisfaction for an optimized preference analysis using a sequential consumer test. Food Qual Pref 17, THOMSON, D.M., CROCKER, C. MARKETO, C.G Linking sensory characteristics to emotions: An example using dark chocolate. Food Qual Pref 21, VICKERS, Z.M Incorporating tasting into a conjoint analysis of taste, health claim, price and brand for purchasing strawberry yogurt. J Sens Stud 8, WARDY, W., MENA, B., NONGTAODUM, S., NO, H.K., PRINYAWIWATKUL, W Exploring the drivers of purchase intent and consumer satisfaction of 61
73 chicken eggs using principal component analysis and the kano model. J Sens Stud 29, XU, Q., JIAO, R.J., YANG, X., HELANDER, M., KHALID, H.M., OPPERUD, A An analytical Kano model for customer need analysis. Design Studies 30,
74 CHAPTER 3: COMPARISON OF TRADITIONAL PREFERENCE MAPPING WITH PROJECTIVE MAPPING FOR CHARACTERIZING CONSUMER PERCEPTION OF BREWED BLACK COFFEES Practical Application Descriptive analysis (DA) and consumer preference mapping can be very time and cost intensive. This study demonstrates that projective mapping techniques combined with check all that apply (PMCATA) profiling by consumers can be used as a rapid method for understanding a product landscape and how consumers might feel about the acceptability of products with particular attributes. It is not likely that PMCATA will replace traditional preference mapping practices. However, it might serve as a good alternative option for researchers and developers when time or budget is constrained or as a screening first step. Introduction Black coffee is one of the most widely consumed beverages, and the sensory profile of coffee can be impacted by many factors. Bhumiratana et al. (2011) evaluated coffee beans before roasting and after roasting as brewed coffees and reported sensory differences in brewed coffees attributed to geographical region, climate, growing practices, roast and brew methods. These authors also reported that sensory differences in coffee become much more apparent after roasting and brewing (Bhumiratana et al. 63
75 2011). Due to the large amount and popularity of many different types of coffees, consumers have differing preferences for an ideal coffee. Studies have demonstrated different groups of coffee consumers using both traditional profiling and free choice profiling (Narain et al. 2004). Preference ranking of brewed coffees has also been compared to traditional hedonic 9-pt scale scores to find consumer preference and segmentation. Both methods were useful for finding consumer preference, but only hedonic scaling was suitable for consumer preference segmentation (Varela et al. 2014). Trained panel sensory profiling (descriptive sensory analysis) is of great importance to the food industry as it allows researchers to describe and quantify perceived sensory attributes analogous to an instrument (Risvik et al. 1994; Drake et al. 2007). However, descriptive analysis methods can be exceedingly time and cost intensive with well-trained panels being the most costly and the most desirable for consistent reliable data (King et al.1995). Projective mapping (PM) techniques, in contrast, aim to provide a simple and direct approach to producing results similar to a trained descriptive panel without the labor and time requirements for a trained panel (Lawless and Heymann, 1998). In projective mapping, untrained consumers are asked to organize products into a 2- dimensional space based on the perceived similarity of the samples (Jervis and Drake, 2014). Cartesian plane data can be collected for each sample and using multiple factor analysis (MFA), a biplot can be generated to demonstrate how samples relate to one another. This is comparable to the PCA that might otherwise be produced using 64
76 traditional descriptive analysis methods (Jervis and Drake, 2014). Using MFA, researchers can also add supplemental data to further help distinguish samples (Perrin et al. 2008). Projective mapping has been used to categorize a number of different food products. Perrin et al. (2008) used projective mapping to distinguish 10 different samples of white wine using mapping. Projective mapping has also been used to distinguish different cheeses and apple varieties (Nestrud and Lawless, 2010) as well as commercial chocolates (Risvik et al. 1994). Check-all-that applies (CATA) questions have been commonly applied to consumer testing and advocated by some as an alternative to trained panel sensory profiling (Dooley et al. 2010). CATA questions can be used in a variety of different ways to learn more about a product. In its most generic sense, it can be used simply to ask consumers what items from a given list can be used to describe themselves or a product. However, many studies have used CATA style questioning either on its own or in conjunction with other types of questions coupled with different forms of statistical analysis to make more complex observations beyond the frequency at which a particular list item is selected. Dooley et al. (2010) conducted preference mapping of vanilla ice creams using hedonic data paired with CATA questions around the sensory qualities of the ice cream. Results from CATA questions showed agreement with traditional descriptive analysis. CATA has also been used to distinguish samples of fish species where 23 fish species were analyzed 65
77 using free choice profiling and compared to CATA questioning (Lazo et al. 2016). CATA questioning has also been used to distinguish milk desserts (Vidal et al. 2013). The application of CATA with PM may be an attractive alternative to traditional descriptive analysis and may provide insights on consumer liking. Our objective was to compare traditional preference mapping utilizing descriptive analysis and a consumer acceptance test to projective mapping with check all that apply (PMCATA) for consumer insights on brewed black coffee. Materials and Methods Coffees Fifteen retail ground coffees (all from Arabica beans) were selected to represent a range of commercial sources and roasts. The fifteen coffees were subsequently brewed and evaluated by 4 sensory experts (each with more than 500 h of prior experience with descriptive sensory analysis) and reduced to eleven representative coffees. All coffees for the study were prepared at manufacturer recommended concentrations using spring water (Table 3.1). Coffees were brewed using a Bunn pour over brewer (model number CWTF15-APS, Bunn-o-Matic, Springfield IL) and placed into 2.5L thermos pump pots that had been pre-warmed using hot tap water. Coffees were served black within 15 min of brewing for all evaluations. Coffees were served at 80C (65mL in a 177 ml white 66
78 Styrofoam cups with three-digit codes). The sensory protocols used in this study were in compliance with the NCSU Institutional Review Board (IRB) for human subjects. PMCATA Untrained black coffee consumers (n=22) who consumed black coffee at least 3 times per week were recruited from a database of 7000 consumers maintained by the North Carolina State University Sensory Service Center (Raleigh, NC, U.S.) to attend three 30 min evaluation sessions. For the first session, consumers were instructed on the concept of projective mapping and practiced using the computer ipads. At the two subsequent sessions, consumers evaluated the 11 brewed black coffees. Consumers were presented with all 11 coffees simultaneously and were permitted to taste each coffee as many times and in any order they liked. They also had the option to request an additional serving of each coffee if needed. Data was collected using Compusense At Hand projective mapping function (Version 7.6; Compusense, Guelph, ON, Canada). Panelists were asked to evaluate each coffee and place a corresponding pin with the coffee 3-digit blinding code on a two-dimensional plane with no axis or anchors. The coffees that were perceived to be the most similar were placed close together and the most different ones were placed the furthest apart. After placing each coffee on the map, panelists were then prompted to select descriptors chosen from literature (Table 3.2) to describe each coffee. Coffee attributes were selected to represent a broad array of flavor attributes present in black coffee (Hayakawa et al. 2010). Consumers were then asked to score overall liking 67
79 of the coffee using a 9 point hedonic scale. After completion of the three sessions, each consumer was compensated with a $10 gift card. Descriptive Analysis Ten trained panelists evaluated the eleven brewed coffees using an established lexicon (Table 3.3). Each panelist (8 females, 2 males, ages y) had a minimum of 60 h of prior training on the descriptive analysis of food flavors using the Spectrum TM method. An additional 40 h of training was dedicated to brewed black coffee. Panelists evaluated the coffees in 45 min sessions. During training, a range of black coffees was evaluated and discussed to define and calibrate attributes. Analysis of variance from preliminary sessions was used to confirm that the panelists and panel could consistently differentiate coffees using the identified lexicon. For data collection, no more than 4 coffees were evaluated per session and coffees were served sequentially in a balanced complete block design. Panelists expectorated coffees and a 4 min rest was enforced between coffees while panelists rinsed with deionized water and took a few bites of unsalted cracker. Each panelist evaluated each coffee in quadruplicate in different sets. The order of evaluation was randomized within each replication and all coffees were blinded by three digit codes. Paper ballots were used for data collection. 68
80 Consumer Acceptance Testing Black coffee consumers (n = 275) were recruited from an online consumer database of over 7000 individuals maintained by the North Carolina State Univ. Sensory Service Center (Raleigh, N.C., U.S.A.). The online survey was created with SSI Web (Sawtooth Software version 8.4.8, Orem, Utah, U.S.A.). Respondents were self-reported black coffee consumers at least 3 times per week. A balanced incomplete block design was used; each consumer evaluated 6 of the 11 coffees in a single session. Each session lasted approximately 35 min with a 3 min enforced rest between coffees. Consumers were provided deionized water and unsalted crackers for palate cleansing. The test took place over 3 days and resulted in 150 evaluations of each coffee. Consumers were asked to evaluate coffee including appearance, aroma, overall liking, mouth feels, flavor and bitterness using a 9 point hedonic scale. Consumers were also asked Just about right (JAR) questions about bitterness, color, aroma, and flavor intensity. Consumers were then asked how different each coffee was from the coffee that they normally consume. At the end of the tasting session, consumers were provided with a $10 gift card. All CLT data was collected using Compusense at Hand (Compusense Inc., Guelph, Ontario, Canada). 69
81 Data Analysis Projective Mapping Data was collected and organized so that each coffee sample represented a row and each consumer was represented by two sequential columns, the y-coordinate and the x- coordinate data. The sum of the descriptor frequency data was added as supplemental data and signified the number of times that each descriptor was used to describe each sample. Multiple factor analysis (MFA) was then applied. Cluster analysis was performed using K-means clustering of the overall liking scores from each session n= 47 was used to determine different consumer preference clusters (XLSTAT version 2015 Addinsoft, Paris, France). External preference mapping (PrefMap) was applied to the MFA biplot generated from the PMCATA exercise using the overall liking scores from the PMCATA consumers. Descriptive Data and Drivers of Liking Descriptive analysis data was analyzed by ANOVA with means separation and then principal component analysis (PCA) of the correlation matrix of the means was applied. Consumer acceptance data was analyzed by ANOVA with means separation. Prefmap was also applied to the PCA biplot generated from DA with the liking scores from the CLT test in order to compare the two methods for mapping consumer preference. Additionally, PLS regression was used for traditional external preference mapping with the DA and consumer acceptance data. Cluster analysis was performed using K-means 70
82 clustering of the overall liking scores to determine different consumer preference cluster, mean substitution was used to fill incomplete blocks for concumers. (XLSTAT version 2015 Addinsoft, Paris, France). Results and Discussions PMCATA Consumers differentiated the coffees in the PMCATA exercise with 70% of variability explained on factors 1 and 2 (Figure 3.1). Consumers divided coffees into two distinct groups: a dark roast group (P190, P938, P503) and a lighter roast group (P613, P570, P425, P329) at either end of Factor 1. P374 and P149 were distinct from both of the other groups and were separated by Factor 2. Factor 1 was comprised of woody, nutty/roasted, burnt ashy, earthy, chemical, cardboard, chocolate and bitter taste loading positively with fruity, floral, herbal and acidic taste loading negatively. Factor 2 was comprised of vanilla, caramel and metallic taste loading positively and nutty/roasted in the negative direction. Descriptors that were used for coffees in the darker category were bitter and burnt/ashy. Descriptors used most frequently for the lighter coffees were; fruity, herbal and acidic/sour. P374 was unique and was not associated with either cluster due to higher associations with flavor characteristics that comprised factor 2. P374 was frequently described by consumers as vanilla, chocolate and metallic (Figure 3.1). P149 was also unique from the two main clusters and was associated with fruity and nutty descriptors most frequently (Figure 3.1). For preference, consumers preferred darker 71
83 coffees, P190 and P938 scored the highest in overall liking, 5.7 and 5.4 on a 9 point liking scale, respectively (Table 3.4). From PMCATA, consumers most preferred darker roast coffees described most frequently as burnt/ashy and bitter. Descriptive Analysis Trained panelists distinguished the brewed coffees with 74% variability explained using factors 1 and 2 (Figure 3.2, Table 3.5). Factor 1 accounted for 56% of the variability among the coffees and was comprised of smoky and spicy/resin flavors and bitter taste. Factor 2 accounted for 18% of the explained variability and was comprised of woody/twig, caramel/molasses, and nutty flavors. From descriptive analysis (Figure 3.2, Table 3.5), the coffees were distinguished by all of the attributes (p<0.05) and were comprised of three basic groups (Figure 3.2). Coffees P190 and P938 were characterized by high overall aroma and flavor impact, smoky, ashy, and spicy/resin flavors and distinct bitterness. These two coffees had the lowest acidity (less than 1.0 on a 0 to 15 point scale). Coffees P503, P719, P329, P529, and P374 were distinguished from other coffees by low but distinct nutty flavors, moderate woody/twig flavors and moderate or balanced bitter and sour taste. Coffees P425, P149, P570 and P613 and were distinguished by caramel/molasses and beany aromatics and sour taste. These coffees had the highest sour taste (acidity) intensities. 72
84 CLT From the traditional consumer test with 150 consumer evaluations of the coffees, consumers identified overall liking and key hedonics and JAR scores (Table 3.6). The overall most preferred coffee was P374, scoring a 5.6 on a 9 point scale, followed by P190, P149, P570 and P938 (Table 3.6). Coffee P425 received the lowest score at 4.4 on a 9 point scale. Flavor liking was ranked similarly with the same coffee P374 scoring the highest at 5.6 and P425 scoring the lowest (4.4). All coffees scored within 0.1 hedonic points between overall liking and overall flavor liking, indicating flavor is a key driver to overall liking. Aroma liking had a higher range and slightly different ranking with P374 again being highest scoring 6.3 and P613 scoring lowest at 5.1. The higher range of aroma liking scores indicates that consumers like the aroma of coffee better than the flavor itself and suggests that some coffees do not deliver a desirable flavor with desirable liking. This might be due to lack of flavor intensity or bitter taste in coffees. Liking of mouthfeel and bitterness followed similar liking patterns to overall liking with P374 scoring the highest in both and P425 scoring the lowest in both. Looking at JAR scores, the lowest scoring coffee (P425) was too light in overall color (62% too light) too weak in aroma (58.4% too weak) and too weak in flavor (63.5% too weak). Respondents were split on bitterness for this coffee with 35% stating it was not bitter enough and 25.5% stating it was too bitter. This might suggest consumer clusters on desire for bitterness or confusion among untrained consumers on what bitterness is. 73
85 The best performing coffee, (P374) showed more desirable color (65.5% just right) and aroma (62.6% just right). These attributes alone do no explain why P425 scored so low. P329 was even lighter in color with a 76.1% too light and in aroma with 69.7% too weak but scored significantly higher in overall liking compared to P425. Cluster analysis was applied to identify preference clusters among the consumers that took part in the CLT (Table 3.7). Three clusters were identified form the 275 consumers that took part in the study based on the partial preference from all the consumer evaluations. Cluster 1 consumers (n=104) preferred coffees P149 and P374 with P613 and P425 being least preferred. The preferred coffees were moderately high in overall flavor and smoky and sweet/caramel/molasses notes. This cluster of consumers scored all of the coffees higher than the other two consumer clusters so they could also be called black coffee likers. The second cluster (n=112 consumers) preferred coffees P938, P374 and P190 with P719, P425 and P329 being least preferred, The preferred coffees were highest in overall aroma and overall flavor with higher smoky, ashy, spicy/resinous flavors and the lowest in sour taste. These consumers could be described as dark roast/ high impact coffee likers. The third cluster of consumers (n=59) preferred coffees P149 and P719 with P425 and P190 being least preferred. These consumers liked coffees that were low to moderate overall aroma and flavor impact and had moderate intensities of woody/twig sweet/caramel/molasses and beany flavors and distinct acidity. These consumers could be described as light/ low impact coffee likers. 74
86 Comparing PMCATA and CLT Results PMCATA demonstrated similarities to the CLT, but also some key differences. Two of the top CLT coffees, P190 and P938 were the most preferred coffees from the PMCATA exercise (Table 3.4), but P374 was less liked by this smaller consumer group. This result suggests one of the shortcomings of PMCATA: lack of differences observed with a smaller sample of consumers when researching a product that has significant consumer clusters. If the PMCATA does not contain the same balance of consumers across clusters, this can cause differences in results. The least preferred coffees by the traditional CLT (P425 and P503) were also the least liked by PMCATA and were two of the lowest scoring coffees in the largest consumer clusters, one and two. For determining overall liking between the two tests, the CLT was slightly more discriminating then the PMCATA test. The CLT was able to separate the 11 coffee samples into 4 significant groups (p<0.05) on a 9 point hedonic scale ranging from the least liked sample P425 (4.4) to the most liked sample P374 (5.6) with sharper groupings identified following cluster analysis In contrast, the PMCATA test found 3 significant groups (p<0.05) with its 24 participants in duplicate ranging from the most liked sample P190 (5.7) to the least liked sample P613 (4.1) (Table 3.4). The lack of discrimination power in overall acceptance in the CLT test when compared to the PMCATA despite having over five times the data point could be explained by the presence of consumer preference clusters masking a large amount of variability. It could also be explained by 75
87 the difference between the most and least liked samples was only 1.2 points in the case of the CLT total population and 1.6 points for the PMCATA. The lack of a large range on the nine point hedonic scale being used caused a lot of the 95% confidence intervals to overlap. When we looked at individual clusters, the range within a cluster is larger, with cluster 2 displaying a range of 1.9 hedonic points (Table 3.7). Despite all participants being reported black coffee drinkers, the highest overall liking score was 5.6 (P374) in the total population and was 6.1 (pp938) following cluster analysis. Coffees were served unbranded and black which might explain the depressed overall acceptance scores across all coffees. Respondents were recruited to drink black coffee but black coffee did not need to be their main or preferred method of drinking. However not having a point of reference it is hard to tell if introducing branding or allowing consumers to prepare the coffees with sweeter or cream would yield more or less discriminating data. There is evidence to support that consumer liking of coffee would be higher with additive. Research by Moraes and Bolini (2010) reported that the consumer ideal sweetness for coffee was prepared with 12.5% sucrose. They also showed that liking could be increased by the addition on non-caloric sweaters. The ability to use additives in tea has been shown to increase consumer ability to discriminate preference between black teas, and has shown to be more predictive to what was eventually achieved in home use testing. Posri and Macfie (2008) compared three CLT methods and HUT with brewed teas for consumer discrimination. In the CLT there were three consumer 76
88 protocols evaluated: controlled no additives allowed (CLT), controlled dosing of additives (DCLT), and free choice additive (FCCLT). When consumers were not permitted to add anything to their tea (CLT), the lowest amount of consumer discrimination of the teas was documented and of the three methods, the FCCLT test where consumers were allowed to add cream and various sweeteners freely showed the largest discrimination of liking scores. In contrast, the HUT test showed the highest discrimination of all the methods tested further suggesting that context can also play a critical role in consumer liking. Preference Mapping The overall preference map for PMCATA (Figure 3.3) compared to traditional consumer liking and DA results (Figure 3.4) showed similar results. For both techniques, an overall favorable opinion for dark roast coffees was demonstrated with liking being driven by ashy, spicy/resin, smoky and bitter taste (traditional consumer test with DA) and spicy, bitter taste, and burnt/ashy characteristics as well as woody, chemical, vanilla and metallic taste (PMCATA). More detailed results were obtained from the traditional CLT with DA (Figure 3.4) as well as the ability to cluster consumers which was not possible with by PMCATA due to the low number of observations (Figures ). Clusters 1 and 2 had similar drivers with Cluster 2 being driven by even higher levels of smoky, ashy and resinous notes. Cluster 3 was the most unique driven by woody/twig, nutty, and beany flavors and sour taste. 77
89 PLS Partial least squares regression was also used to analyze the descriptive analysis and CLT data (Figure 3.8). PLS confirmed preference maps (Figures ). Overall drivers of liking were overall flavor and aroma, overall drivers of dislike were nutty and sour taste. Due to distinct clusters, stronger drivers were observed in relation to individual clusters. Cluster 1 preferred smoky flavor and bitter taste while Cluster 2 drivers were also smoky flavor and bitter taste with overall aroma and flavor impact, spicy/resin and ashy flavors drivers of liking and sour taste a distinct dislike. Cluster 3 consumers were distinct from clusters 1 and 2 and preferred sour taste and sweet aromatics and beany notes and disliked spicy/resin and ashy flavors and bitter taste. Discussion Coffee clusters found in this study are similar to previous coffee studies. Geel et al. (2005) evaluated instant coffees, instant decaffeinated coffees, and chicory instant drinks and found four coffee drinking clusters pure coffee lovers which were driven by high flavor intensity, and bitter taste, Coffee blend drinkers who preferred coffees that were described as earthy or sweet and a consumer cluster that enjoyed all coffees. Moscowitz and Bernstein (1999) reported three consumer segments of coffee across different European countries. The segments had different opinions on optimal level of bitterness (low, medium and high), similar to clusters found by PLS which were driven by high intensity, medium high intensity and low bitter intensity. Masi et al. (2015) related 78
90 coffee preferences to density of fungiform papillae. They found that coffee drinkers with a high density of fungiform papillae added more sugar to coffee then those with lower density and that these high density fungiform papillae drinkers rated sour taste significantly higher that other coffee drinkers, possibly explaining why sour taste was a polarizing attribute for the consumers in the current study. Comparing the PMCATA with traditional drivers of liking identify several similarities that would promote use of PMCATA due to advantages in time and cost. The PMCATA and descriptive analysis biplots (Figures 3.1 and 3.2) were very similar with the two main groupings of coffees having similar descriptors. By both approaches, Factor 1 was driven by roast and smoke flavors and bitter taste and Factor 2 was driven by nutty and sweet notes. Coffee differentiation was also similar. There have been other studies to compare projective mapping to descriptive analysis. Kennedy and Heyman (2008) DA with PM to evaluate dark and milk chocolates. In this study DA was observed to explain more variance between the samples with an average of 84 % variance explained using the first two factors. Using projective mapping, an average of 66 % variance was explained by the first two factors. This result is consistent with the current coffee study were PMCATA was not as discriminatory as DA but suitable for showing sample differences in a rapid method. 79
91 Trained panel profiling was stronger in separation of the coffees (3 groups of coffee vs. 2 by PMCATA). It is not surprising that the training required by DA allows more discrimination. The application of consumer liking with PMCATA demonstrated that PMCATA identified similar trends, although not identical. Two of the coffees most preferred by PMCATA were also in the top grouping by CLT, but the top scoring coffee by CLT was liked less by PMCATA consumers, probably due to simply fewer consumers. PMCATA was able to identify many of the drivers of liking revealed by the traditional preference mapping (DA with CLT): burnt/ashy and bitter were drivers for consumers in Cluster 1 and 2 by preference mapping (smoky, bitter, ashy, spicy/resin). The one coffee that was distinct by the two methods for overall liking was coffee P938. This coffee was polarizing among the clusters identified in the CLT (Table 3.7). This coffee was the top liked coffee in Cluster 2 but the third least liked coffee in cluster 3. Given the small size of consumers used to conduct PMCATA, it is hypothesized that cluster 3 (the smallest cluster at N=59) was under represented within the PMCATA respondents resulting in the difference of scores. The differences in P938 does point to a caution in using PMCATA on categories with distinct clusters, given the lower base size in PMCATA and the difficulty to identify clusters, if a representation of liking clusters are not achieved in recruiting, the results of total population can be skewed. A future area of research could be in understanding these coffee consumer clusters and optimizing for them. 80
92 Conclusions Projective mapping is a good method for rapid profiling of samples and can be used for even more complex products like coffee as the current study demonstrates. Data from PMCATA in conjuntion with liking scores was also able to provide liking results that mostly aligned with those from a large traditional CLT. The methods used here can be implemented over a large number of samples to get quick descriptive results making PMCATA a good option for quick category surveys and preference mapping. For finding drivers of liking or performing higher resolution preference mapping which can identifies clusters, traditional descriptive analysis with consumer acceptance testing remains the ideal methodology. 81
93 TABLES AND FIGURES Table 3.1 Coffee brewing concentrations per 64 oz ( ml) of spring water. Identifier Roast Concentration P529 Medium 2.75oz (78.0g) P149 Medium 2.75oz (78.0g) P570 Light 3.25oz (92.1g) P938 Dark 3.25oz (92.1g) P503 Dark 2.75oz (78.0g) P613 Medium 2.75oz (78.0g) P190 Dark 3.25oz (92.1g) P374 Medium 3.25oz (92.1g) P425 Medium 3.25oz (92.1g) P719 Medium 2.5oz (70.9g) P329 Medium 2.25oz(63.8g) 82
94 Table 3.2 Coffee descriptors provided for PMCATA. Woody Caramel Spicy Burnt/Ashy Nutty/Roasted Earthy Fruity Chemical Floral Herbal Vanilla Metallic Cardboard Chocolate Bitter Sweet Acidic/Sour Adopted from Hayakawa et. al. (2010). 83
95 Table 3.3 Lexicon used for trained panel descriptive analysis of brewed black coffees. Attribute Overall Aroma Overall flavor Smoky Ashy Spicy /Resinous Caramel/Molasses Beany Woody Nutty Fruity Bitter Sour Definition The overall orthonasal aroma intensity of the coffee The overall flavor impact (aromatics and basic tastes) of the coffee when placed in the mouth Aromatics associated with wood smoke Aromatics associated with cigarette ash Aromatics associated with wood resins such as pine resin Sweet aromatics associated with cooked sugar, caramel and molasses Green aromatic associated with uncooked legumes Aromatics associated with dry wood Aromatic associated with roasted nuts Acidic aromatic associated with fruits/berries The basic taste associated with caffeine The basic taste associated with acids such as citric acid 84
96 F2 (16 %) Biplot (PMCATA) (axes F1 and F2: 70%) n=47 Caramel P719 Herbal P613 Floral P570 P329 Metallic V anilla sted P374 Chocolate Chemical Woody Burnt/ashy Earthy P503 P190 P F1 (54%) Figure 3.1 Multiple factor analysis biplot of PMCATA data on 11 coffees. (N=47 responses). 85
97 Table 3.4 Comparison of overall liking means between CLT and PMCATA. Coffee CLT (n=150) PMCATA (n=47) P aCD 4.7aABC P aAB 4.8bABC P aABC 5.0aAB P aAB 5.4aA P aCD 4.7aABC P aCD 4.1aC P aAB 5.7aA P aA 4.5bBC P aD 4.4aBC P aBC 4.6aBC P aC 4.5aBC Liking was scored on a 9 point hedonic scale were 1=dislike extremely and 9 = like extremely. Lowercase letters denote significant differences between PMCATA and CLT (p<0.05). Capital letters denotes significance between coffees within a column (p<0.05). 86
98 Table 3.5 Trained panel means for brewed black coffee. Samples Overall Aroma Overall Flavor Smoky Ashy Spicy / Resin Woody Twig Sweet / Caramel Molasses Nutty Beany Fruity Bitter Sour Taste p ND ND ND p ND ND p ND ND p ND 1.35 ND ND 2.72 ND p ND ND ND p ND ND 2.09 ND p ND ND p ND p ND ND 1.49 ND p ND ND 1.50 ND p ND LSD LSD: Fisher LSD significant difference p<0.05. Attributes were evaluated on a 0 to 15 point universal intensity scale. ND: Not Detected. 87
99 F2 (18%) 4 Biplot (DA) (F1 and F2: 74%) P503 P719Woody Twig P329 P425Beany Sweet P613 Sour Taste Nutty Fruity P149 P374 Ashy Spicy / Resin Bitter Smoky Overall Flavor Overall Aroma P190 P F1 (56%) Figure 3.2 Principal component analysis biplot of trained descriptive panel data on 11 coffees. 88
100 Table 3.6 Consumer results. P425 P190 P374 P719 P329 P613 P503 P149 P529 P570 P938 N APPEARANCE LIKING 5.3ef 6.7ab 6.6ab 5.7de 4.8g 6.1cd 5.5e 6.3bc 5.0fg 6.1c 6.9a AROMA LIKING 5.3cd 5.9ab 6.3a 5.7bc 5.2d 5.1d 5.2d 6.0ab 5.4cd 5.7bc 5.8b OVERALL LIKING 4.4d 5.5ab 5.6a 5.2bc 5.0c 4.7cd 4.8cd 5.5ab 4.8cd 5.2abc 5.5ab OVERALL FLAVOR LIKING 4.4e 5.4ab 5.6a 5.2abc 5.1bcd 4.6de 4.8cde 5.5ab 4.8cde 5.2abc 5.5ab MOUTHFEEL LIKING 5.0d 6.0a 5.9a 5.6ab 5.5bc 5.4bcd 5.2cd 5.9a 5.3bcd 5.4bc 5.9a BITTERNESS LIKING 4.6e 5.2abc 5.6a 5.1abc 5bcd 4.9cde 4.6de 5.4ab 4.9bcde 4.9cde 5.3abc How different is this from the coffee that you normally drink? 3.2a 3.1a 3.2a 3.7a 3.4a 3.7a 3.6a 3.2a 3.6a 3.5a 3.3a Too Light 62%efg 9.1%ab 12.9%abc 49.3%def 76.1%g 30%cd 59%efg 26.6%bcd 66.2%fg 39%de 2.1%a COLOR JAR 35%ab 60.8%cd 65.5%d 46.3%abcd 23.2%a 58.6%bcd 38.1%abc 61.2%cd 30.9%a 56.7%bcd 65.2%d Too Dark 2.9%a 30.1%bc 21.6%bc 4.4%a 0.7%a 11.4%ab 2.9%a 12.2%abc 2.9%a 4.3%a 32.6%c Too Weak 58.4%de 7.7%a 15.8%ab 47.8%cde 69.7%e 29.3%bc 56.8%de 30.9%bc 63.3%e 35.5%bcd 2.8%a JAR 38.7%abc 62.9%cd 62.6%cd 47.1%abcd 28.9%a 62.1%cd 39.6%abc 56.8%bcd 34.5%ab 59.6%cd 66.7%d AROMA Too 2.9%a 29.4%c 21.6%bc 5.1%ab 1.4%a 8.6%ab 3.6%a 12.2%abc 2.2%a 5%ab 30.5%c Strong FLAVOR STRENGTH BITTERNESS Too Weak 63.5%e 15.4%ab 30.2%abc 52.9%cde 62%e 47.1%cde 56.8%de 33.1%bcd 69.1%e 46.1%cde 12.1%a JAR 28.5%a 55.9%c 53.2%bc 41.9%abc 33.1%abc 40%abc 29.5%ab 49.6%abc 26.6%a 36.9%abc 54.6%c Too Strong 8.0%a 28.7%b 16.5%ab 5.1%a 4.9%a 12.9%ab 13.7%ab 17.3%ab 4.3%a 17%ab 33.3%b Not Bitter Enough 35%cd 7%ab 13.7%abc 30.1%cd 36.6%d 23.6%bcd 28.8%cd 16.5%abcd 38.1%d 29.1%cd 5.7%a JAR 39.4%a 55.2%a 58.3%a 50%a 50%a 47.9%a 40.3%a 60.4%a 48.9%a 47.5%a 50.4%a Too Bitter 25.5%abc 37.8%bc 28.1%abc 19.9%ab 13.4%a 28.6%abc 30.9%abc 23%abc 12.9%a 23.4%abc 44%c Data represents 150 responses for each coffee from 275 consumers. Liking attributes were scored on a 9-point hedonic scale where dislike extremely =1 and like extremely =9. JAR scales were scored on a 5-point scale where too little =1 or 2, just about right =3, and too much =4 or 5. The percentage of consumers that selected these options is presented. Different letters in rows following means signify significant differences (p<0.05). Difference from coffee you usually drink 5=very different, 1=very similar. 89
101 Table 3.7 Overall liking among consumer clusters from the traditional CLT (n=275). P938 P570 P529 P503 P613 P149 P374 P425 P719 P329 P190 Cluster 1 n=104 Cluster 2 n=112 Cluster 3 n=59 5.6aABC 6.1aA 4.3bBC 5.7aAB 4.8bCD 5.1abABC 5.0aBCD 4.5bD 4.9aABC 5.1aBCD 4.4bD 5.0aABC 4.9aCD 4.4bD 4.9aABC 6.0aA 5.3bBC 5.6abA 6.0aA 5.8aAB 4.9bABC 4.8aD 4.2bD 4.0bC 5.7aAB 4.0cD 5.2bAB 5.5aABC 4.2bD 5.1aABC 5.9aA 5.8aAB 4.2bBC Liking was scored on a 9 point scale where 1=dislike extremely and 9=like extremely. Lowercase letters denote significant differences within rows (p<0.05). Capital letters denote significance between coffees within a column (p<0.05). 90
102 F2 (16 %) 4 Biplot (PMCATA) (axes F1 and F2: 70%) n=47 P374 MetallicVanilla 2 Caramel Spicy Chocolate P425Acidic/sour Chemical P190 P719 Woody Herbal Burnt/ashy Bitter P503 0 P613 Floral P 570 Fruity P329 Nutty/roaste d -2 P529 Cardboard Earthy P938 P F1 (54%) Figure 3.3 Preference map of PMCATA results for black coffee. Percent represents the estimated percentage of consumers that would like the product above the mean. 91
 -3-2 -1 0 1 2 3 4 5 6 Figure 3.4 Preference map of trained panel and consumer acceptance scores of black coffee.")
103 F2 (18%) Biplot (DA/CLT) (F1 and F2: 74%) n= P503 P719Woody Twig Nutty 1 P329 P P613 Sour Taste Sweet Fruity P149 Ashy Spicy / Resin Bitter Smoky Overall Flavor Overall Aroma P190 P938-3 F1 (56%) Figure 3.4 Preference map of trained panel and consumer acceptance scores of black coffee. Results represent consumer acceptance scores from 150 consumer evaluations for each coffee from 275 consumers. Percent represents the estimated percentage of consumers that would like the product above the mean. 92
 Figure 3.")
104 F2 (18%) Biplot (F1 and F2: 74%) Cluster 1 n= P529 90%-100% 2 P503 P719 Woody Twig Nutty 80%-90% 70%-80% 1 P329 P374 60%-70% 0 Sour Taste Ashy Spicy / Resin Bitter Smoky P190 50%-60% 40%-50% 30%-40% 20%-30% -1-2 P425 Beany Sweet Fruity Overall Flavor Overall Aroma P938 10%-20% 0%-10% F1 (56%) Figure 3.5 Preference map for Cluster 1 consumers of trained panel and consumer acceptance scores of black coffee. Percent represents the estimated percentage of consumers that would like the product above the mean. 93
 Figure 3.")
105 F2 (18%) 4 Biplot (F1 and F2: 74%) Cluster 2 n=112 3 P P503 PP719Woody Twig P329 Sour Taste P425 Beany Sweet Nutty Fruity P374 Ashy Spicy / Resin Bitter Smoky Overall Flavor Overall Aroma P190 P938 90%-100% 80%-90% 70%-80% 60%-70% 50%-60% 40%-50% 30%-40% 20%-30% 10%-20% 0%-10% F1 (56%) Figure 3.6 Preference map of Cluster 2 consumers of trained panel and consumer acceptance scores of black coffee. Percent represents the estimated percentage of consumers that would like the product above the mean. 94
 Figure 3.")
106 F2 (18%) 4 Biplot (F1 and F2: 74%) Cluster 3 n=59 3 P529 90%-100% 2 P503 P719 Woody Twig Nutty 80%-90% 70%-80% P329 Sour Taste P425 Beany Sweet Fruity P374 Ashy Spicy / Resin Bitter Smoky Overall Flavor Overall Aroma 60%-70% 50%-60% 40%-50% 30%-40% 20%-30% 10%-20% 0%-10% F1 (56%) Figure 3.7 Preference map of Cluster 3 consumers of trained panel and consumer acceptance scores of black coffee. Percent represents the estimated percentage of consumers that would like the product above the mean. 95
What s the Best Way to Evaluate Benefits or Claims? Silvena Milenkova SVP of Research & Strategic Direction
 What s the Best Way to Evaluate Benefits or Claims? Silvena Milenkova SVP of Research & Strategic Direction November, 2013 What s In Store For You Today Who we are Case study The business need Implications
Wine-Tasting by Numbers: Using Binary Logistic Regression to Reveal the Preferences of Experts
 Wine-Tasting by Numbers: Using Binary Logistic Regression to Reveal the Preferences of Experts When you need to understand situations that seem to defy data analysis, you may be able to use techniques
MBA 503 Final Project Guidelines and Rubric
 MBA 503 Final Project Guidelines and Rubric Overview There are two summative assessments for this course. For your first assessment, you will be objectively assessed by your completion of a series of MyAccountingLab
Emerging Local Food Systems in the Caribbean and Southern USA July 6, 2014
 Consumers attitudes toward consumption of two different types of juice beverages based on country of origin (local vs. imported) Presented at Emerging Local Food Systems in the Caribbean and Southern USA
Work Sample (Minimum) for 10-K Integration Assignment MAN and for suppliers of raw materials and services that the Company relies on.
 for 10-K Integration Assignment MAN and for suppliers of raw materials and services that the Company relies on.") Work Sample (Minimum) for 10-K Integration Assignment MAN 4720 Employee Name: Your name goes here Company: Starbucks Date of Your Report: Date of 10-K: PESTEL 1. Political: Pg. 5 The Company supports the
Work Sample (Minimum) for 10-K Integration Assignment MAN 4720 Employee Name: Your name goes here Company: Starbucks Date of Your Report: Date of 10-K: PESTEL 1. Political: Pg. 5 The Company supports the
Fairfield Public Schools Family Consumer Sciences Curriculum Food Service 30
 Fairfield Public Schools Family Consumer Sciences Curriculum Food Service 30 Food Service 30 BOE Approved 05/09/2017 1 Food Service 30 Food Service 30 Students will continue to participate in the school
The University of Georgia
 The University of Georgia Center for Agribusiness and Economic Development College of Agricultural and Environmental Sciences A Survey of Pecan Sheller s Interest in Storage Technology Prepared by: Kent
RESEARCH UPDATE from Texas Wine Marketing Research Institute by Natalia Kolyesnikova, PhD Tim Dodd, PhD THANK YOU SPONSORS
 RESEARCH UPDATE from by Natalia Kolyesnikova, PhD Tim Dodd, PhD THANK YOU SPONSORS STUDY 1 Identifying the Characteristics & Behavior of Consumer Segments in Texas Introduction Some wine industries depend
DETERMINANTS OF DINER RESPONSE TO ORIENTAL CUISINE IN SPECIALITY RESTAURANTS AND SELECTED CLASSIFIED HOTELS IN NAIROBI COUNTY, KENYA
 DETERMINANTS OF DINER RESPONSE TO ORIENTAL CUISINE IN SPECIALITY RESTAURANTS AND SELECTED CLASSIFIED HOTELS IN NAIROBI COUNTY, KENYA NYAKIRA NORAH EILEEN (B.ED ARTS) T 129/12132/2009 A RESEACH PROPOSAL
The Roles of Social Media and Expert Reviews in the Market for High-End Goods: An Example Using Bordeaux and California Wines
 The Roles of Social Media and Expert Reviews in the Market for High-End Goods: An Example Using Bordeaux and California Wines Alex Albright, Stanford/Harvard University Peter Pedroni, Williams College
COMPARISON OF THREE METHODOLOGIES TO IDENTIFY DRIVERS OF LIKING OF MILK DESSERTS
 COMPARISON OF THREE METHODOLOGIES TO IDENTIFY DRIVERS OF LIKING OF MILK DESSERTS Gastón Ares, Cecilia Barreiro, Ana Giménez, Adriana Gámbaro Sensory Evaluation Food Science and Technology Department School
Running Head: MESSAGE ON A BOTTLE: THE WINE LABEL S INFLUENCE p. 1. Message on a bottle: the wine label s influence. Stephanie Marchant
 Running Head: MESSAGE ON A BOTTLE: THE WINE LABEL S INFLUENCE p. 1 Message on a bottle: the wine label s influence Stephanie Marchant West Virginia University Running Head: MESSAGE ON A BOTTLE: THE WINE
Predicting Wine Quality
 March 8, 2016 Ilker Karakasoglu Predicting Wine Quality Problem description: You have been retained as a statistical consultant for a wine co-operative, and have been asked to analyze these data. Each
EFFECT OF TOMATO GENETIC VARIATION ON LYE PEELING EFFICACY TOMATO SOLUTIONS JIM AND ADAM DICK SUMMARY
 EFFECT OF TOMATO GENETIC VARIATION ON LYE PEELING EFFICACY TOMATO SOLUTIONS JIM AND ADAM DICK 2013 SUMMARY Several breeding lines and hybrids were peeled in an 18% lye solution using an exposure time of
Academic Year 2014/2015 Assessment Report. Bachelor of Science in Viticulture, Department of Viticulture and Enology
 Academic Year 2014/2015 Assessment Report Bachelor of Science in Viticulture, Department of Viticulture and Enology Due to changes in faculty assignments, there was no SOAP coordinator for the Department
Tips for Writing the RESULTS AND DISCUSSION:
 Tips for Writing the RESULTS AND DISCUSSION: 1. The contents of the R&D section depends on the sequence of procedures described in the Materials and Methods section of the paper. 2. Data should be presented
NO TO ARTIFICIAL, YES TO FLAVOR: A LOOK AT CLEAN BALANCERS
 NO TO ARTIFICIAL, YES TO FLAVOR: A LOOK AT CLEAN BALANCERS 2018 TREND INSIGHT REPORT Out of four personas options, 46% of consumers self-identify as Clean Balancers. We re exploring this group in-depth
Awareness, Attitude & Usage Study Executive Summary
 Awareness, Attitude & Usage Study Executive Summary 8.4.11 Background The National Pecan Shellers Association (NPSA) is interested in encouraging the consumption of Pecans, particularly increasing the
A Comparison of X, Y, and Boomer Generation Wine Consumers in California
 A Comparison of,, and Boomer Generation Wine Consumers in California Marianne McGarry Wolf, Scott Carpenter, and Eivis Qenani-Petrela This research shows that the wine market in the California is segmented
US Chicken Consumption. Presentation to Chicken Marketing Summit July 18, 2017 Asheville, NC
 US Chicken Consumption Presentation to Chicken Marketing Summit July 18, 2017 Asheville, NC Primary research sponsor Contributing research sponsors Research findings presented by OBJECTIVES Analyze chicken
1. Continuing the development and validation of mobile sensors. 3. Identifying and establishing variable rate management field trials
 Project Overview The overall goal of this project is to deliver the tools, techniques, and information for spatial data driven variable rate management in commercial vineyards. Identified 2016 Needs: 1.
JCAST. Department of Viticulture and Enology, B.S. in Viticulture
 JCAST Department of Viticulture and Enology, B.S. in Viticulture Student Outcomes Assessment Plan (SOAP) I. Mission Statement The mission of the Department of Viticulture and Enology at California State
Results from the First North Carolina Wine Industry Tracker Survey
 Results from the First North Carolina Wine Industry Tracker Survey - 2009 Dr. Michael R. Evans Director and Professor of Hospitality and Tourism Management and Dr. James E. Stoddard Professor of Marketing
Update : Consumer Attitudes
 Blah blah blah blah blah Consumers developed 40 words/attributes to describe commercially available EVOOs. Sensory differences were independent of country of origin. Update : Consumer Attitudes There was
The changing face of the U.S. consumer: How shifting demographics are re-shaping the U.S. consumer market for wine
 The changing face of the U.S. consumer: How shifting demographics are re-shaping the U.S. consumer market for wine Prepared by: Wine Opinions LLC for WSET It is well understood that wine consumption in
Is Fair Trade Fair? ARKANSAS C3 TEACHERS HUB. 9-12th Grade Economics Inquiry. Supporting Questions
 9-12th Grade Economics Inquiry Is Fair Trade Fair? Public Domain Image Supporting Questions 1. What is fair trade? 2. If fair trade is so unique, what is free trade? 3. What are the costs and benefits
International Journal of Business and Commerce Vol. 3, No.8: Apr 2014[01-10] (ISSN: )
![International Journal of Business and Commerce Vol. 3, No.8: Apr 2014[01-10] (ISSN: )](/thumbs/86/94457514.jpg "International Journal of Business and Commerce Vol. 3, No.8: Apr 2014[01-10] (ISSN: )") The Comparative Influences of Relationship Marketing, National Cultural values, and Consumer values on Consumer Satisfaction between Local and Global Coffee Shop Brands Yi Hsu Corresponding author: Associate
The Comparative Influences of Relationship Marketing, National Cultural values, and Consumer values on Consumer Satisfaction between Local and Global Coffee Shop Brands Yi Hsu Corresponding author: Associate
New from Packaged Facts!
 New from Packaged Facts! FOODSERVICE MARKET INSIGHTS A fresh perspective on the foodservice marketplace Essential Insights on Consumer customerservice@packagedfacts.com (800) 298-5294 (240) 747-3095 (Intl.)
PARENTAL SCHOOL CHOICE AND ECONOMIC GROWTH IN NORTH CAROLINA
 PARENTAL SCHOOL CHOICE AND ECONOMIC GROWTH IN NORTH CAROLINA DR. NATHAN GRAY ASSISTANT PROFESSOR BUSINESS AND PUBLIC POLICY YOUNG HARRIS COLLEGE YOUNG HARRIS, GEORGIA Common claims. What is missing? What
Wine Purchase Intentions: A Push-Pull Study of External Drivers, Internal Drivers, and Personal Involvement
 Wine Purchase Intentions: A Push-Pull Study of External Drivers, Internal Drivers, and Personal Involvement Dennis Reynolds, Ph.D. Ivar Haglund Distinguished Professor School of Hospitality Business Management
An Advanced Tool to Optimize Product Characteristics and to Study Population Segmentation
 OP&P Product Research Utrecht, The Netherlands May 16, 2011 An Advanced Tool to Optimize Product Characteristics and to Study Population Segmentation John M. Ennis, Daniel M. Ennis, & Benoit Rousseau The
Comparative Analysis of Fresh and Dried Fish Consumption in Ondo State, Nigeria
 Comparative Analysis of Fresh and Dried Fish Consumption in Ondo State, Nigeria Mafimisebi, T.E. (Ph.D) Department of Agricultural Business Management School of Agriculture & Natural Resources Mulungushi
IMSI Annual Business Meeting Amherst, Massachusetts October 26, 2008
 Consumer Research to Support a Standardized Grading System for Pure Maple Syrup Presented to: IMSI Annual Business Meeting Amherst, Massachusetts October 26, 2008 Objectives The objectives for the study
STUDY REGARDING THE RATIONALE OF COFFEE CONSUMPTION ACCORDING TO GENDER AND AGE GROUPS
 STUDY REGARDING THE RATIONALE OF COFFEE CONSUMPTION ACCORDING TO GENDER AND AGE GROUPS CRISTINA SANDU * University of Bucharest - Faculty of Psychology and Educational Sciences, Romania Abstract This research
Retailing Frozen Foods
 61 Retailing Frozen Foods G. B. Davis Agricultural Experiment Station Oregon State College Corvallis Circular of Information 562 September 1956 iling Frozen Foods in Portland, Oregon G. B. DAVIS, Associate
A study on consumer perception about soft drink products
 A study on consumer perception about soft drink products Dr.S.G.Parekh Assistant Professor, Faculty of Business Administration, Dharmsinh Desai University, Nadiad, Gujarat, India Email: sg_parekh@yahoo.com
Is Your Restaurant Ready for the Growing Online Ordering Trend?
 Is Your Restaurant Ready for the Growing Online Ordering Trend? Are you looking for a new way to grow your restaurant business? Consider online ordering. According to QSR Web, digital ordering is growing
F&N 453 Project Written Report. TITLE: Effect of wheat germ substituted for 10%, 20%, and 30% of all purpose flour by
 F&N 453 Project Written Report Katharine Howe TITLE: Effect of wheat substituted for 10%, 20%, and 30% of all purpose flour by volume in a basic yellow cake. ABSTRACT Wheat is a component of wheat whole
AJAE Appendix: Testing Household-Specific Explanations for the Inverse Productivity Relationship
 AJAE Appendix: Testing Household-Specific Explanations for the Inverse Productivity Relationship Juliano Assunção Department of Economics PUC-Rio Luis H. B. Braido Graduate School of Economics Getulio
Delivering Great Cocktails Through Full Serve Testing. Jean A. McEwan and Janet McLean Diageo Innovation
 Delivering Great Cocktails Through Full Serve Testing Jean A. McEwan and Janet McLean Diageo Innovation Background 2 > Sip testing is a good screening tool, but does not always reflect liquid performance
Texas Wine Marketing Research Institute College of Human Sciences Texas Tech University CONSUMER ATTITUDES TO TEXAS WINES
 Texas Wine Marketing Research Institute College of Human Sciences Texas Tech University CONSUMER ATTITUDES TO TEXAS WINES Nelson Barber, M.S. D. Christopher Taylor, M.A.M. Natalia Kolyesnikova, Ph.D. Tim
THE EXPECTANCY EFFECTS OF CAFFEINE ON COGNITIVE PERFORMANCE. John E. Lothes II
 THE EXPECTANCY EFFECTS OF CAFFEINE ON COGNITIVE PERFORMANCE John E. Lothes II A Thesis Submitted to the University of North Carolina at Wilmington in Partial Fulfillment of the Requirements for the Degree
An application of cumulative prospect theory to travel time variability
 Katrine Hjorth (DTU) Stefan Flügel, Farideh Ramjerdi (TØI) An application of cumulative prospect theory to travel time variability Sixth workshop on discrete choice models at EPFL August 19-21, 2010 Page
Dietary Diversity in Urban and Rural China: An Endogenous Variety Approach
 Dietary Diversity in Urban and Rural China: An Endogenous Variety Approach Jing Liu September 6, 2011 Road Map What is endogenous variety? Why is it? A structural framework illustrating this idea An application
Cambridge International Examinations Cambridge International General Certificate of Secondary Education
 Cambridge International Examinations Cambridge International General Certificate of Secondary Education *3653696496* ENVIRONMENTAL MANAGEMENT 0680/11 Paper 1 October/November 2017 1 hour 30 minutes Candidates
INTERNATIONAL UNDERGRADUATE PROGRAM BINA NUSANTARA UNIVERSITY. Major Marketing Sarjana Ekonomi Thesis Odd semester year 2007
 INTERNATIONAL UNDERGRADUATE PROGRAM BINA NUSANTARA UNIVERSITY Major Marketing Sarjana Ekonomi Thesis Odd semester year 2007 THE RELATIVE IMPORTANCE OF FOOD, SERVER ATTENTIVENESS, AND WAIT TIME: THE CASE
A CASE STUDY: HOW CONSUMER INSIGHTS DROVE THE SUCCESSFUL LAUNCH OF A NEW RED WINE
 A CASE STUDY: HOW CONSUMER INSIGHTS DROVE THE SUCCESSFUL LAUNCH OF A NEW RED WINE Laure Blauvelt SSP 2010 0 Agenda Challenges of Wine Category Consumers: Foundation for Product Insights Successful Launch
MANAGEMENT PROGRAMME. Term-End Examination June, MS-68 : MANAGEMENT OF MARKETING COMMUNICATION AND ADVERTISING (L)
") No. of Printed Pages : 5 MANAGEMENT PROGRAMME Term-End Examination June, 2010 71- : MANAGEMENT OF MARKETING COMMUNICATION AND ADVERTISING (L) Time : 3 hours Maximum Marks : 100 (Weightage 70%) Note : Attempt
No. of Printed Pages : 5 MANAGEMENT PROGRAMME Term-End Examination June, 2010 71- : MANAGEMENT OF MARKETING COMMUNICATION AND ADVERTISING (L) Time : 3 hours Maximum Marks : 100 (Weightage 70%) Note : Attempt
The aim of the thesis is to determine the economic efficiency of production factors utilization in S.C. AGROINDUSTRIALA BUCIUM S.A.
 The aim of the thesis is to determine the economic efficiency of production factors utilization in S.C. AGROINDUSTRIALA BUCIUM S.A. The research objectives are: to study the history and importance of grape
Online Appendix to. Are Two heads Better Than One: Team versus Individual Play in Signaling Games. David C. Cooper and John H.
 Online Appendix to Are Two heads Better Than One: Team versus Individual Play in Signaling Games David C. Cooper and John H. Kagel This appendix contains a discussion of the robustness of the regression
THE ECONOMIC IMPACT OF BEER TOURISM IN KENT COUNTY, MICHIGAN
 THE ECONOMIC IMPACT OF BEER TOURISM IN KENT COUNTY, MICHIGAN Dan Giedeman, Ph.D., Paul Isely, Ph.D., and Gerry Simons, Ph.D. 10/8/2015 THE ECONOMIC IMPACT OF BEER TOURISM IN KENT COUNTY, MICHIGAN EXECUTIVE
Chapter 3. Labor Productivity and Comparative Advantage: The Ricardian Model. Pearson Education Limited All rights reserved.
 Chapter 3 Labor Productivity and Comparative Advantage: The Ricardian Model 1-1 Preview Opportunity costs and comparative advantage A one-factor Ricardian model Production possibilities Gains from trade
CHAPTER I BACKGROUND
 CHAPTER I BACKGROUND 1.1. Problem Definition Indonesia is one of the developing countries that already officially open its economy market into global. This could be seen as a challenge for Indonesian local
5. Supporting documents to be provided by the applicant IMPORTANT DISCLAIMER
 Guidance notes on the classification of a flavouring substance with modifying properties and a flavour enhancer 27.5.2014 Contents 1. Purpose 2. Flavouring substances with modifying properties 3. Flavour
Regression Models for Saffron Yields in Iran
 Regression Models for Saffron ields in Iran Sanaeinejad, S.H., Hosseini, S.N 1 Faculty of Agriculture, Ferdowsi University of Mashhad, Iran sanaei_h@yahoo.co.uk, nasir_nbm@yahoo.com, Abstract: Saffron
Buying Filberts On a Sample Basis
 E 55 m ^7q Buying Filberts On a Sample Basis Special Report 279 September 1969 Cooperative Extension Service c, 789/0 ite IP") 0, i mi 1910 S R e, `g,,ttsoliktill:torvti EARs srin ITQ, E,6
Roasting For Flavor. Robert Hensley, 2014 SpecialtyCoffee.com Page 1 of 7 71 Lost Lake Lane, Campbell, CA USA Tel:
 One of the wonderful things about coffee is how responsive it is to all the nuances and variations in growing, processing, roasting and brewing. In the roasting especially, these touches have a magic all
Summary Report Survey on Community Perceptions of Wine Businesses
 Summary Report Survey on Community Perceptions of Wine Businesses Updated August 10, 2018 Conducted by Professors David McCuan and Richard Hertz for the Wine Business Institute School of Business and Economics
Chapter 3. Labor Productivity and Comparative Advantage: The Ricardian Model
 Chapter 3 Labor Productivity and Comparative Advantage: The Ricardian Model Preview Opportunity costs and comparative advantage A one-factor Ricardian model Production possibilities Gains from trade Wages
Preview. Chapter 3. Labor Productivity and Comparative Advantage: The Ricardian Model
 Chapter 3 Labor Productivity and Comparative Advantage: The Ricardian Model Preview Opportunity costs and comparative advantage A one-factor Ricardian model Production possibilities Gains from trade Wages
Please sign and date here to indicate that you have read and agree to abide by the above mentioned stipulations. Student Name #4
 The following group project is to be worked on by no more than four students. You may use any materials you think may be useful in solving the problems but you may not ask anyone for help other than the
An update from the Competitiveness and Market Analysis Section, Alberta Agriculture and Forestry.
 An update from the Competitiveness and Market Analysis Section, Alberta Agriculture and Forestry. The articles in this series includes information on what consumers are buying and why they are buying it.
Structures of Life. Investigation 1: Origin of Seeds. Big Question: 3 rd Science Notebook. Name:
 3 rd Science Notebook Structures of Life Investigation 1: Origin of Seeds Name: Big Question: What are the properties of seeds and how does water affect them? 1 Alignment with New York State Science Standards
2004 PICKLING LINE MARKET STUDY
 2004 PICKLING LINE MARKET STUDY Final Report by: AIM Report No. 328 FOREWORD This Report was prepared by AIM Market Research. Neither AIM Market Research, nor any person acting on its behalf: a) makes
Leverage the Rising Sustainability Wave
 Leverage the Rising Sustainability Wave New Research and Best Practices Fair Trade USA October 2016 Who is Fair Trade USA? 3 rd Party sustainable and ethical certification Apparel & Shoes Quinoa & Rice
VQA Ontario. Quality Assurance Processes - Tasting
 VQA Ontario Quality Assurance Processes - Tasting Sensory evaluation (or tasting) is a cornerstone of the wine evaluation process that VQA Ontario uses to determine if a wine meets the required standard
Background & Literature Review The Research Main Results Conclusions & Managerial Implications
 Agenda Background & Literature Review The Research Main Results Conclusions & Managerial Implications Background & Literature Review WINE & TERRITORY Many different brands Fragmented market, resulting
The Effect of Almond Flour on Texture and Palatability of Chocolate Chip Cookies. Joclyn Wallace FN 453 Dr. Daniel
 The Effect of Almond Flour on Texture and Palatability of Chocolate Chip Cookies Joclyn Wallace FN 453 Dr. Daniel 11-22-06 The Effect of Almond Flour on Texture and Palatability of Chocolate Chip Cookies
Multiple Imputation for Missing Data in KLoSA
 Multiple Imputation for Missing Data in KLoSA Juwon Song Korea University and UCLA Contents 1. Missing Data and Missing Data Mechanisms 2. Imputation 3. Missing Data and Multiple Imputation in Baseline
The Grocer : Soft Drinks Research on behalf of The Grocer April 2018
 The Grocer : Soft Drinks Research on behalf of The Grocer April 2018 Lucia Juliano Head of CPG & Retail Research +44 (0) 161 242 1371 ljuliano@harrisinteractive.co.uk 1 Over 7 out of 10 (72%) respondents
Fair Trade C E R T I F I E D
 Fair Trade C E R T I F I E D Every Purchase Matters. Apparel & Home Goods Program What is Fair Trade? Safe Working Conditions Guarantee of safe factory working conditions Advancement of People Direct mechanism
Chair and members of the Board of Health. Jessica Morris, Manager, Environmental Health. Christopher Beveridge, Director, Health Protection
 HEALTHY MENU CHOICES ACT TO: Chair and members of the Board of Health MEETING DATE: December 6, 2017 REPORT NO: Pages: 6 PREPARED BY: APPROVED BY: SUBMITTED BY: Jessica Morris, Manager, Environmental Health
STUDY AND IMPROVEMENT FOR SLICE SMOOTHNESS IN SLICING MACHINE OF LOTUS ROOT
 STUDY AND IMPROVEMENT FOR SLICE SMOOTHNESS IN SLICING MACHINE OF LOTUS ROOT Deyong Yang 1,*, Jianping Hu 1,Enzhu Wei 1, Hengqun Lei 2, Xiangci Kong 2 1 Key Laboratory of Modern Agricultural Equipment and
From Selling to Supporting-Leveraging Mobile Services in the Field of Food Retailing
 From Selling to Supporting-Leveraging Mobile Services in the Field of Food Retailing Sudha.K.M 1, G.Raghunath 2 1 Assistant Professor, Sri Krishna Arts and Science College, Coimbatore, Tamilnadu, India
RESULTS OF THE MARKETING SURVEY ON DRINKING BEER
 Uri Dahahn Business and Economic Consultants RESULTS OF THE MARKETING SURVEY ON DRINKING BEER Uri Dahan Business and Economic Consultants Smith - Consulting & Reserch ltd Tel. 972-77-7032332, Fax. 972-2-6790162,
(A report prepared for Milk SA)
") South African Milk Processors Organisation The voluntary organisation of milk processors for the promotion of the development of the secondary dairy industry to the benefit of the dairy industry, the consumer
South African Milk Processors Organisation The voluntary organisation of milk processors for the promotion of the development of the secondary dairy industry to the benefit of the dairy industry, the consumer
Can You Tell the Difference? A Study on the Preference of Bottled Water. [Anonymous Name 1], [Anonymous Name 2]
![Can You Tell the Difference? A Study on the Preference of Bottled Water. [Anonymous Name 1], [Anonymous Name 2]](/thumbs/78/76759741.jpg "Can You Tell the Difference? A Study on the Preference of Bottled Water. [Anonymous Name 1], [Anonymous Name 2]") Can You Tell the Difference? A Study on the Preference of Bottled Water [Anonymous Name 1], [Anonymous Name 2] Abstract Our study aims to discover if people will rate the taste of bottled water differently
Can You Tell the Difference? A Study on the Preference of Bottled Water [Anonymous Name 1], [Anonymous Name 2] Abstract Our study aims to discover if people will rate the taste of bottled water differently
Supply & Demand for Lake County Wine Grapes. Christian Miller Lake County MOMENTUM April 13, 2015
 Supply & Demand for Lake County Wine Grapes Christian Miller Lake County MOMENTUM April 13, 2015 About Full Glass Research Provider of economic, market & industry research to food & drink companies and
Grade: Kindergarten Nutrition Lesson 4: My Favorite Fruits
 Grade: Kindergarten Nutrition Lesson 4: My Favorite Fruits Objectives: Students will identify fruits as part of a healthy diet. Students will sample fruits. Students will select favorite fruits. Students
Sensory Approaches and New Methods for Developing Grain-Based Products. Symposia Oglethorpe CC Monday 26 October :40 a.m.
 Sensory Approaches and New Methods for Developing Grain-Based Products Symposia Oglethorpe CC Monday 26 October 2016 8:40 a.m. 102-S Perception dynamics of grain-based ready-to-eat cereal products using
Danish Consumer Preferences for Wine and the Impact of Involvement
 Danish Consumer Preferences for Wine and the Impact of Involvement Polymeros Chrysochou MAPP Centre, Department of Management, Aarhus University, Denmark (email: polyc@asb.dk) Jacob Brunbjerg Jørgensen
Wine Futures: Pricing and Allocation as Levers against Quality Uncertainty
 Padua 2017 Abstract Submission I want to submit an abstract for: Conference Presentation Corresponding Author Burak Kazaz E-Mail bkazaz@syr.edu Affiliation Syracuse University, Whitman School of Management
Napa County Planning Commission Board Agenda Letter
 Agenda Date: 7/1/2015 Agenda Placement: 10A Continued From: May 20, 2015 Napa County Planning Commission Board Agenda Letter TO: FROM: Napa County Planning Commission John McDowell for David Morrison -
Analysis of Coffee Shops Within a One-Mile Radius of the University of North Texas
 Feasibility Report Analysis of Coffee Shops Within a One-Mile Radius of the University of North Texas Prepared by: Robert Buchanan, Christopher Douglas, Grant Koslowski and Miguel Martinez Prepared for:
Measuring economic value of whale conservation
 Measuring economic value of whale conservation Comparison between Australia and Japan Miho Wakamatsu, Kong Joo Shin, and Shunsuke Managi Urban Institute and Dept. of Urban & Env. Engineering, School of
KOREA MARKET REPORT: FRUIT AND VEGETABLES
 KOREA MARKET REPORT: FRUIT AND VEGETABLES 주한뉴질랜드대사관 NEW ZEALAND EMBASSY SEOUL DECEMBER 2016 Page 2 of 6 Note for readers This report has been produced by MFAT and NZTE staff of the New Zealand Embassy
VR-Business Partnership Profile
 VR-Business Partnership Profile + STARBUCKS INCLUSION ACADEMY: NEVADA ROASTING PLANT View the Starbucks Edition of the Vocational Rehabilitation- Business Partnership Profile to learn more about how the
OUR MARKET RESEARCH SOLUTIONS HELP TO:
 CONSUMER INTELLIGENCE AND INSIGHTS ON THE SA WINE INDUSTRY 31 MAY 2011 1 COMPANY OVERVIEW We are MARKET RESEARCH AND CONSUMER INTELLIGENCE EXPERTS who ensure you make smarter, more-profitable decisions
SYLLABUS. Departmental Syllabus. Food Production II CULN0140. Departmental Syllabus. Departmental Syllabus. Departmental Syllabus
 DATE OF LAST REVIEW: 02/2013 CIP CODE: 12.0505 SYLLABUS SEMESTER: COURSE TITLE: COURSE NUMBER: Food Production II CULN0140 CREDIT HOURS: 4 INSTRUCTOR: OFFICE LOCATION: OFFICE HOURS: TELEPHONE: EMAIL: KCKCC
Modeling Wine Quality Using Classification and Regression. Mario Wijaya MGT 8803 November 28, 2017
 Modeling Wine Quality Using Classification and Mario Wijaya MGT 8803 November 28, 2017 Motivation 1 Quality How to assess it? What makes a good quality wine? Good or Bad Wine? Subjective? Wine taster Who
Predictors of Repeat Winery Visitation in North Carolina
 University of Massachusetts Amherst ScholarWorks@UMass Amherst Tourism Travel and Research Association: Advancing Tourism Research Globally 2013 ttra International Conference Predictors of Repeat Winery
Volumetric Assessment of. the Foodservice. Potato Market. Prepared for. Project #17624 Add-on project # December 31, Technomic Inc.
 Volumetric Assessment of the Foodservice Potato Market Prepared for December 31, 2107 Project #17624 Add-on project #17787 Introduction Technomic has provided updated volume data relating to both fresh
Learning Connectivity Networks from High-Dimensional Point Processes
 Learning Connectivity Networks from High-Dimensional Point Processes Ali Shojaie Department of Biostatistics University of Washington faculty.washington.edu/ashojaie Feb 21st 2018 Motivation: Unlocking
Non-Structural Carbohydrates in Forage Cultivars Troy Downing Oregon State University
 Non-Structural Carbohydrates in Forage Cultivars Troy Downing Oregon State University Contact at: OSU Extension Service, Tillamook County, 2204 4 th St., Tillamook, OR 97141, 503-842-3433, Email, troy.downing@oregonstate.edu
Paper Reference IT Principal Learning Information Technology. Level 3 Unit 2: Understanding Organisations
 Centre No. Candidate No. Surname Signature Paper Reference(s) IT302/01 Edexcel Principal Learning Information Technology Level 3 Unit 2: Understanding Organisations Wednesday 3 June 2009 Morning Time:
R A W E D U C A T I O N T R A I N I N G C O U R S E S. w w w. r a w c o f f e e c o m p a n y. c o m
 R A W E D U C A T I O N T R A I N I N G C O U R S E S w w w. r a w c o f f e e c o m p a n y. c o m RAW COFFEE COMPANY RAW Coffee Company is a boutique roastery founded in 2007, owned by Kim Thompson and
Wine On-Premise UK 2016
 Wine On-Premise UK 2016 T H E M E N U Introduction... Page 5 The UK s Best On-Premise Distributors... Page 7 The UK s Most Listed Wine Brands... Page 17 The Big Picture... Page 26 The Style Mix... Page
The Market Potential for Exporting Bottled Wine to Mainland China (PRC)
") The Market Potential for Exporting Bottled Wine to Mainland China (PRC) The Machine Learning Element Data Reimagined SCOPE OF THE ANALYSIS This analysis was undertaken on behalf of a California company
The Market Potential for Exporting Bottled Wine to Mainland China (PRC) The Machine Learning Element Data Reimagined SCOPE OF THE ANALYSIS This analysis was undertaken on behalf of a California company
The Future Tortilla Market: Organic, Ancient Grains, Transitional
 The Future Tortilla Market: Organic, Ancient Grains, Transitional THE EVOLUTION OF VALUE CREATION FROM CONSUMER TO GRAINS Macro Exposures Consumer Values Consumer Trends Customer Responses Category Value
Chapter 3 Labor Productivity and Comparative Advantage: The Ricardian Model
 Chapter 3 Labor Productivity and Comparative Advantage: The Ricardian Model Introduction Theories of why trade occurs: Differences across countries in labor, labor skills, physical capital, natural resources,