COMPANY PRESENTATION STAR CONFERENCE LONDON 2006, 27 th September
|
|
|
- Miles Floyd
- 5 years ago
- Views:
Transcription
1 COMPANY PRESENTATION STAR CONFERENCE 2006 LONDON 2006, 27 th September
2 AGENDA 1. THE GROUP AT A GLANCE 2. MARKET OVERVIEW 3. FINANCIALS 4. SHARE PRICE 5. STRATEGY STAR CONFERENCE 2006 Pag. 2
3 SPEAKERS LUIGI LUZZATI Chairman of Centrale del Latte di Torino & C. S.p.A. RICCARDO POZZOLI Chief Executive Officer of Centrale del Latte di Torino & C. S.p.A. NICOLA CODISPOTI Sales Manager of Centrale del Latte di Torino & C. S.p.A. VITTORIO VAUDAGNOTTI Chief Financial Officer of Centrale del Latte di Torino & C. S.p.A. STAR CONFERENCE 2006 Pag. 3
4 1. THE GROUP AT A GLANCE STAR CONFERENCE 2006 Pag. 4

5 1. THE GROUP AT A GLANCE MISSION Providing the Italian market with the highest quality milk and milk-derivatives products by exploiting our interregional network STAR CONFERENCE 2006 Pag. 5
6 1. THE GROUP AT A GLANCE GROUP IDENTITY Since 1950 Centrale del Latte is the leading brand of milk in Turin. During the years the Group experienced a day by day growth becoming a multiregional company active in the production and distribution of milk, milk derivatives and other fresh products SHAREHOLDERS Source: Centrale del Latte di Torino & C. S.p.A. 36.2% 51% 6.9% 5.9% High-quality production, strong diversification strategy and effective distribution network enabled the Group to become a leading regional player, always aiming to preserve its daily and dairy relationship with its customers Finanziaria Centrale del Latte di Torino S.p.A. Lavia S.S. Other family groups Free float STAR CONFERENCE 2006 Pag. 6

7 1. THE GROUP AT A GLANCE EQUITY STORY Source: Centrale del Latte di Torino & C. S.p.A. Centrale del Latte di Torino starts its activity Market liberalization Listing on the Italian Stock Exchange and introduction of PET packaging for dairy milk Acquisition of Centrale del Latte di Vicenza Mid-sixties Introduction of UHT milk and TETRAPAK packaging Acquisition of Centro Latte Rapallo Acquisition of the 40% of Frascheri and admission to the STAR segment of the Italian Stock Exchange The Group starts the building of a new production plant in Vicenza STAR CONFERENCE 2006 Pag. 7
8 1. THE GROUP AT A GLANCE GROUP STRUCTURE Source: Centrale del Latte di Torino & C. S.p.A. 100% 85.4% 40% 25% SALADS & FRUITS s.r.l. 40% 25% GPP GENOVA PASTA E PESTO S.p.A. BELGRAVIA s.r.l. STAR CONFERENCE 2006 Pag. 8

9 1. THE GROUP AT A GLANCE AN INTERREGIONAL POLE Torino Pavia* Vicenza Carmagnola Bardineto Rapallo * Salads & Fruits, plant under construction STAR CONFERENCE 2006 Pag. 9


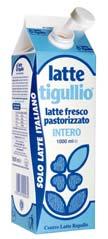
10 1. THE GROUP AT A GLANCE A FULL SET OF FRESH PRODUCTS Source: Centrale del Latte di Torino & C. S.p.A. MILK YOGURT and DESSERT CHEESE READY-TO-EAT SALAD EGGS FRESH PASTA STAR CONFERENCE 2006 Pag. 10


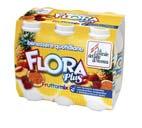
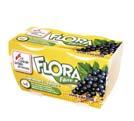
11 1. THE GROUP AT A GLANCE NEW PRODUCTS Source: Centrale del Latte di Torino & C. S.p.A. FRESH MILK PROBIOTIC YOGURT READY-TO-DRINK OTHER FRESH PRODUCTS PROBIOTIC YOGURT WITH BRANS STAR CONFERENCE 2006 Pag. 11


12 1. THE GROUP AT A GLANCE PRODUCTION PLANTS Source: Centrale del Latte di Torino & C. S.p.A. Fresh milk packaging plant Fresh milk packaging plant STAR CONFERENCE 2006 Pag. 12
13 1. THE GROUP AT A GLANCE SALES BREAKDOWN (I H 2006) Source: Centrale del Latte di Torino & C. S.p.A. By region By product By distribution channel 1.8% 8.1% 3.4% 11.0% 24.0% 49.8% 19.6% 46.3% 50.0% 39.0% 24.4% 22.6% Piemonte Liguria Veneto Other regions Fresh milk Other packed products UHT milk Yogurt Unbottled milk and cream Large-scale distribution (1) Shops (2) Others (1) Nearly 1,250 point of sale daily served (2) Nearly 8,000 point of sale daily served STAR CONFERENCE 2006 Pag. 13
14 2. MARKET OVERVIEW STAR CONFERENCE 2006 Pag. 14
15 2. MARKET OVERVIEW: FRESH MILK COMPETITORS ANALISYS (market shares value I H 2006) TOTAL ITALIAN MARKET OF FRESH MILK Source: IHA Italia Family consumption PIEMONTE+LIGURIA+VENETO (16.6% OF TOTAL ITALIAN MARKET) 32.3% 4.1% 23.5% ITALY Market value: 1,011 million 3.3% 28.6% 31.7% CLT Group Parmalat Granarolo Private labels Others 42.2% 13.1% 21.2% PIEM-LIG-VEN Market value: 168 million CLT VS MARKET* (sales trend ) CLT MARKET SHARE ** 5.0% 4.0% 3.0% 2,0% 1.0% 0,0% -1.0% -2.0% -3.0% Jan-Jun ' % 23.5% 23.0% 22.5% 22.0% 21.5% 21.0% 20.5% 20.0% Jan-Jun '06 CLT Group P+L+V Market * Total value of Piemonte, Liguria and Veneto market **On total market value of Piemonte, Liguria and Veneto STAR CONFERENCE 2006 Pag. 15
16 2. MARKET OVERVIEW: UHT MILK COMPETITORS ANALISYS (market shares value I H 2006) TOTAL ITALIAN MARKET OF UHT MILK Source: IHA Italia Family consumption PIEMONTE+LIGURIA+VENETO (17.8% OF TOTAL ITALIAN MARKET) 32.6% 2.3% 30.3% CLT Group 40.4% 13.2% ITALY Market value: 753 million 13.4% 21.4% Parmalat Granarolo Private labels Others 19.3% 16.2% 11.0% PIEM-LIG-VEN Market value: 134 million CLT VS MARKET* (sales trend ) CLT MARKET SHARE ** 8.0% 6.0% 4.0% 2.0% 0.0% -2.0% -4.0% -6.0% Jan-Jun '06 CLT Group P+L+V Market 14.0% 12.0% 10.0% 8.0% 6.0% 4.0% 2.0% 0,0% Jan-Jun '06 * CLT vs total market of Piemonte, Liguria and Veneto **On total market of Piemonte, Liguria and Veneto STAR CONFERENCE 2006 Pag. 16
17 2. MARKET OVERVIEW: YOGURT COMPETITORS ANALISYS (market shares value I H 2006) TOTAL ITALIAN MARKET OF YOGURT Source: IHA Italia Family consumption PIEMONTE+LIGURIA+VENETO (27.6% OF TOTAL ITALIAN MARKET) ITALY Market value: 522 million 17.9% 1.2% 3.1% 5.4% 11.0% 4.0% 6.2% 7.8% 11.0% 32.4% CLT Group Danone Muller Yomo Parmalat Granarolo Private Labels Nestlè Mila Others 29.2% 12.9% 4.3% 4.2% 9.2% 11.3% 28.9% PIEM-LIG-VEN Market value: 144 million CLT VS MARKET* (sales trend ) CLT MARKET SHARE ** 12.0% 10.0% 8.0% 6.0% 4.0% 2.0% 0.0% Jan-Jun '06 4.5% 4.0% 3.5% 3.0% 2.5% 2.0% 1.5% 1.0% 0.5% 0.0% Jan-Jun '06 CLT Group P+L+V Market * CLT vs total market of Piemonte, Liguria and Veneto **On total market of Piemonte, Liguria and Veneto STAR CONFERENCE 2006 Pag. 17
18 2. MARKET OVERVIEW MARKET PENETRATION (1) Source: Gfk IHA The Group s main products (fresh/uht milk and yogurt) market penetration (2) has been growing in the last three years FRESH MILK 53% 54% 54% BRAND AWARENESS* 2005 Source: Astra Demoscopea (quantitative research- CATI) The Group Brand Awareness reached almost 100% in % UHT MILK 32% 32% 33% 90% YOGURT 16% 17% 18% (1) Centrale del Latte di Vicenza data not available (2) Penetration % = n of families buying Centrale del Latte brand total n of brands marketing the same product class in Piemonte, Liguria and Veneto 94% * Brand awareness %: solicited awareness of the Group s brands in Piemonte, Liguria and Veneto STAR CONFERENCE 2006 Pag. 18


 1.")
19 2. MARKET OVERVIEW MARKETING INITIATIVES IN 2006 Source: Centrale del Latte di Torino & C. S.p.A. The Group reached a strong positioning in its interregional market also by exploiting high marketing and communications investments MARKETING INVESTMENTS 3.4 mln 2005 (3.6% on sales 05) 1.7 mln 1H 06 (3.4% on sales IH 06) STAR CONFERENCE 2006 Pag. 19

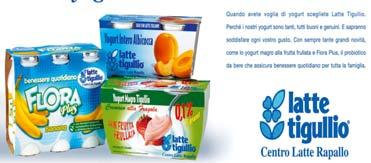
20 2. MARKET OVERVIEW MARKETING INITIATIVES IN 2006 Source: Centrale del Latte di Torino & C. S.p.A. STAR CONFERENCE 2006 Pag. 20
21 3. FINANCIALS STAR CONFERENCE 2006 Pag. 21
22 3. FINANCIALS CONSOLIDATED INCOME STATEMENT (IFRS compliant) Source: Centrale del Latte di Torino & C. S.p.A. Euro million 30-Jun Jun Dec-05 % % % IFRS IFRS IFRS Sales % % % Value of production % % % Services (11.67) (23.3%) (11.06) (22.8%) (22.20) (23.1%) Consumption of raw materials (26.44) (52.9%) (25.83) (53.2%) (51.61) (53.8%) Cost of production (39.07) (78.2%) (37.77) (77.8%) (75.49) (78.6%) Cost of labour (5.47) (10.9%) (5.71) (11.8%) (10.88) (11.3%) EBITDA % % % Depreciation & Amortization (2.11) (4.2%) (2.18) (4.5%) (4.51) (4.7%) EBIT % % % Financial income (expenses) (0.20) (0.4%) (0.27) (0.6%) (0.42) (0.4%) Profit (loss) before tax % % % Tax (1.69) (3.4%) (1.49) (3.1%) (2.83) (3.0%) Profit (loss) after tax % % % Minorities (0.08) (0.2%) (0.05) (0.1%) (0.16) (0.2%) Net profit % % % The consolidation perimeter includes financial statements of Centrale del Latte di Torino & C. S.p.A., Centro Latte Rapallo S.p.A. and Centrale del Latte di Vicenza S.p.A. It doesn t include stakes in affiliate companies. STAR CONFERENCE 2006 Pag. 22
23 3. FINANCIALS VALUE OF PRODUCTION TREND (06/ /2006) Source: elaboration on CLT data IH IH jun dec jun-2006 Euro million EBITDA ed EBIT TREND (06/ /2006) Source: elaboration on CLT data *Ebit adjusted on consolidation depreciation IH IH jun dec jun-2006 Ebitda Ebit* Euro million STAR CONFERENCE 2006 Pag. 23
24 3. FINANCIALS SALES BREAKDOWN BY PRODUCT (01/ /2006) Source: elaboration on CLT data Fresh milk UHT milk Other packed yogurt milk and cream products unbottled total Sales by product Total sales jan-jun 2006 Euro million SALES BREAKDOWN BY PRODUCT (01/ /2005) Source: elaboration on CLT data Sales by product Total sales jan-jun Fresh milk UHT milk Other packed yogurt milk and cream products unbottled total Euro million STAR CONFERENCE 2006 Pag. 24

25 3. FINANCIALS EBIT and EBITDA MARGINS Source: elaboration on CLT data IH IH 2006 IH 2005 IH 2006 Sales Ebitda 10.9% 10.4% 10% 9.6 Ebit % Ebitda/Sales 5.3% 6.7% 30-jun dec jun-06 Ebit/Sales 30-jun dec jun-06 12% 9% 6% 3% - NFP/EQUITY Source: elaboration on CLT data EBIT (1) /CAPITAL INVESTED (2) (Ki) Source: elaboration on CLT data IH 2005 IH x 0.07x 0.09x 0.2x 0.15x 0.1x 0.05x Equity NFP PFN/Equity Ki Ebit EBIT/Ki rolling 2005 EBIT/Ki rolling % 11% jun dec jun x LTM 05 LTM 06 - (1) EBIT I semester + EBIT II semester of the previous year (2) Average between Ki at 30/06 and Ki at 31/12 of the previous year STAR CONFERENCE 2006 Pag. 25
26 3. FINANCIALS CONSOLIDATED BALANCE SHEET Source: Centrale del Latte di Torino & C. S.p.A. Euro million 30-Jun-06 % 30-Jun-05 % 31-Dec-05 % IFRS IFRS IFRS Tangible assets % % % Intangible assets % % % Net fixed assets % % % Trade receivables % % % Inventories % % % Other current assets % % % Trade payables (17.94) (34.6%) (17.68) (37.2%) (21.66) (43.2%) Other current liabilities (8.13) (15.7%) (6.91) (14.5%) (5.60) (11.2%) Net working capital % % % NET ASSETS % % % Severance prov & other LT liab % % % Total LT liabilities % % % Cash and equivalents (10.56) (20.4%) (11.63) (24.4%) (11.97) (23.9%) Financial debt % % % Net financial position % % % Share capital % % % Profit and loss of the year % % % Shareholders Equity % % % Minorities % % % NET LIABILITIES % % % STAR CONFERENCE 2006 Pag. 26
27 4. SHARE PRICE STAR CONFERENCE 2006 Pag. 27
28 4. SHARE PRICE SHARE PRICE Source: elaboration on JCF and Bloomberg data IPO price at euro 6.80 NY September 11 th, /12/ /12/ /12/ /12/ /12/2004 CLT expressed its interest in acquisition of some industrial assets likely to be sold in Italy by the Parmalat Group /12/ /06/2006 Share price at 14/09/2006 (4.22) Price in euro PRICE PER SHARE ( ) Source: elaboration on JCF and Bloomberg data Year min Year avg Year max YTD Price in euro Share price at 14/09/2006 (4.22) STAR CONFERENCE 2006 Pag. 28
29 4. SHARE PRICE SHARE PRICE YTD Source: elaboration on JCF and Bloomberg data sep-05 oct-05 nov-05 dec-05 jan-06 feb-06 mar-06 apr-06 may-06 jun-06 jul-06 aug-06 sep CLT Mibtel Price in euro PRICE PER SHARE YTD (MONTHLY ANALYSIS) Source: elaboration on JCF and Bloomberg data Price per share at the end of each month * sep-05 oct-05 nov-05 dec-05 jan-06 feb-06 mar-06 apr-06 may-06 jun-06 jul-06 aug-06 sep-06 Price in euro *Last price at 14/09/2006 STAR CONFERENCE 2006 Pag. 29
30 5. STRATEGY STAR CONFERENCE 2006 Pag. 30
")
31 5. STRATEGY STRATEGY AND TARGETS 2007 Organic growth New production plant in Vicenza starts its activity Group sales expected to increase by 4.6% Packaging innovation for UHT and fresh milk and development of special milk and yogurt Start production of pre-packed salads and fruits in the new production plant of S&F in Casteggio (near Pavia) Highly effective production STAR CONFERENCE 2006 Pag. 31

32 5. STRATEGY STRATEGY AND TARGETS CLT sales and EBITDA are expected to grow in the next three years with a Compound Annual Growth Rate of 5.8% and 13.2% respectively Sales EBITDA CAGR 13.2% EBITDA margin 120, , , , ,000 95,000 90,000 85,000 97,600 CAGR 5.8% 102, , , ,000 16,000 14,000 12,000 10,000 8,000 6,000 4,000 2, ,100 13, % 10,400 11, % 11.1% 10.7% % 13.5% 13% 12.5% 12% 11.5% 11% 10.5% 10% Sales EBITDA STAR CONFERENCE 2006 Pag. 32


33 5. STRATEGY START PRODUCTION IN THE NEW PLANT OF SALADS & FRUITS The Group invested nearly Euro 3.4 million for the completion of the new plant of Salad & Fruits, which is expected to start its production activity in 2007 SALADS & FRUITS s.r.l. STAR CONFERENCE 2006 Pag. 33


34 5. STRATEGY START OF NEW PRODUCTION PLANT IN VICENZA New production plant in Vicenza is expected to start production of milk and yogurt by the Spring of 2007 Today Spring 2007 STAR CONFERENCE 2006 Pag. 34

35 CONTACTS THE GROUP Via Filadelfia, Torino ITALY Luigi Luzzati Vittorio Vaudagnotti Chairman Investor Relator Tel Fax THE SPECIALIST Via Gramsci, Torino ITALY Valentino Molino Analyst Tel Fax valentino.molino@gruppobim.it STAR CONFERENCE 2006 Pag. 35
COMPANY PRESENTATION STAR CONFERENCE MILAN 2008, 5 th March
 COMPANY PRESENTATION STAR CONFERENCE 2008 MILAN 2008, 5 th March AGENDA 1. The group at a glance 2. Market overview 3. Financials 4. Share price 5. Goals and strategies STAR CONFERENCE 2008 Pag. 2 SPEAKERS
ANALYST PRESENTATION Star Conference 2017 London, 8 th October 2017
 ANALYST PRESENTATION Star Conference 2017 London, 8 th October 2017 The Group 08/10/2017 Centrale del Latte d'italia S.p.A. 3 The Group Centrale del Latte d Italia S.p.A... 100% Centrale del Latte della
SFR Condo Residential Lot Sales Inventory Sales Inventory Sales Inventory. Month YTD Month Month YTD Month Month YTD Month
 Grand Strand Market Report 2018 was a strong month for sales activity in the Grand Strand with SFR and condo sales volume up 5.11% and 19.14%, respectively, for the month. Residential lot sales are also
SFR Condo Residential Lot Sales Inventory Sales Inventory Sales Inventory. Month YTD Month Month YTD Month Month YTD Month
 Grand Strand Market Report 2017 Grand Strand market activity took a slight step back in after 3 months of steady growth. SFR sales volume dropped 5.7% for the month but is still up 7.2% year-to-date. The
SFR Condo Residential Lot Sales Inventory Sales Inventory Sales Inventory. Month YTD Month Month YTD Month Month YTD Month
 Grand Strand Market Report 2016 Sales activity in the Grand Strand ended 2016 with a solid month of sales. SFR sales are up 2.0% for the month and up 4.1% for the year; setting a new market record for
SFR Condo Residential Lot Sales Inventory Sales Inventory Sales Inventory. Month YTD Month Month YTD Month Month YTD Month
 Grand Strand Market Report 2017 SFR sales activity slides in as full year production flat to 2016. Tightening inventory contributing to SFR sales price growth. Condo sales volume and median sales prices
The third milk and dairy hub in Italy p. 2. Shareholding structure p. 5. Economic-financial results p. 6. Distribution p. 7
 CENTRALE DEL LATTE D ITALIA S.P.A. PRESS KIT CONTENTS The third milk and dairy hub in Italy p. 2 Shareholding structure p. 5 Economic-financial results p. 6 Distribution p. 7 A programme of growth by mergers
The third milk and dairy hub in Italy p. 2. Shareholding structure and economic-financial results p. 5. Distribution p. 6
 CENTRALE DEL LATTE D ITALIA S.P.A. PRESS KIT CONTENTS The third milk and dairy hub in Italy p. 2 Shareholding structure and economic-financial results p. 5 Distribution p. 6 A programme of growth by mergers
Top 10 financial planning mistakes
 2017 Annual TWGAA Conference Top 10 financial planning mistakes Presented by: Amanda Sims, Associate, Silicon Valley Bank # 10 Improper sourcing strategies 2015 Annual Wine Conditions Survey 21 February
Pizza Pizza Royalty Corp. ANNUAL GENERAL MEETING May 29, 2013
 Pizza Pizza Royalty Corp. ANNUAL GENERAL MEETING May 29, 2013 1 Elizabeth Wright, Board Chair 2 Forward-Looking Statement This presentation will contain forward-looking statements. Investors should be
ONE YEAR ANNUAL RESULTS FONTERRA FONTERRA CO-OPERAT CO-OPERA IVE GROUP LTD
 ONE YEAR. 2012 ANNUAL RESULTS FONTERRA CO-OPERATIVE GROUP LTD 1 SIR HENRY VAN DER HEYDEN CHAIRMAN FONTERRA CO-OPERATIVE GROUP LTD 2 OVERVIEW Highlights Business performance Update on strategy Questions
$ BUY STARBUCKS CORPORATION (SBUX) Rena Kaufman. Valuation Methodology. Market Data. Financial Summary (7/1/2018) Profile. Financial Analysis
 Rena Kaufman. Valuation Methodology. Market Data. Financial Summary (7/1/2018) Profile. Financial Analysis") STARBUCKS CORPORATION (SBUX) Market Data Market Cap (intraday): $69,991M Enterprise Value (Aug 9, 2018): $74,898M Enterprise Value/EBITDA (ttm): 14.97x Rena Kaufman $51.88 - BUY Valuation Methodology Method
STARBUCKS CORPORATION (SBUX) Market Data Market Cap (intraday): $69,991M Enterprise Value (Aug 9, 2018): $74,898M Enterprise Value/EBITDA (ttm): 14.97x Rena Kaufman $51.88 - BUY Valuation Methodology Method
Value increase in the alcohol market
 Value increase in the alcohol market Warsaw, June 2018 Get to know AMBRA AMBRA Group is a leading manufacturer, importer and distributor of wines and other alcohol beverages in the Central-Eastern Europe.
Networkers Business Update. December 2014
 Networkers Business Update December 2014 Agenda Forecast Milk Price Global markets V3 Strategy Growing our share of New Zealand milk Page 2 Forecast Milk Price 110 100 2012/13 2013/14 2014/15 Forecast
Peet's Coffee & Tea, Inc. Reports 62% Increase in Second Quarter 2008 Diluted Earnings Per Share
 Peet's Coffee & Tea, Inc. Reports 62% Increase in Second Quarter 2008 Diluted Earnings Per Share EMERYVILLE, Calif., July 31, 2008 /PRNewswire-FirstCall via COMTEX News Network/ -- Peet's Coffee & Tea,
Company Presentation. Opportunity Day 3Q2013 December, 2013
 Company Presentation Opportunity Day 3Q2013 December, 2013 Company Presentation Opportunity Day 3Q2013 December, 2013 Disclaimer Copyright 2013 MK Restaurant Group Public Company Limited. All rights reserved.
Strategy and development perspectives
 Strategy and development perspectives Warsaw, 5 June 2017 AMBRA in brief 1992 establishment of AMBRA S.A. 1995 leader of the sparkling wines segment 1997 acquisition of the CIN&CIN brand 2005 IPO and formation
Financial Results for H1 Fiscal Year Ending December 31, August 6, 2015 Suntory Beverage & Food Limited
 Financial Results for H1 Fiscal Year Ending December 31, 2015 August 6, 2015 Suntory Beverage & Food Limited 2015 SUNTORY 2013 BEVERAGE SUNTORY BEVERAGE & FOOD & LIMITED. Limited. All Rights All Reserved
TRENDS IN SALES OF MILK & DAIRY PRODUCTS A RETAIL PERSPECTIVE. Milk Market Observatory 25 January 2017
 TRENDS IN SALES OF MILK & DAIRY PRODUCTS A RETAIL PERSPECTIVE Milk Market Observatory 25 January 2017 France Period ending 25 December 2016 Product category ) 4 weeks period (P13 15/P13 16) ) Year on year
GLOBAL DAIRY UPDATE KEY DATES MARCH 2017
 MARCH 2017 GLOBAL DAIRY UPDATE European milk production decreased for the seventh consecutive month, while the US remains strong. The rate of decline in New Zealand production is easing. US exports continue
Problem Set #3 Key. Forecasting
 Problem Set #3 Key Sonoma State University Business 581E Dr. Cuellar The data set bus581e_ps3.dta is a Stata data set containing annual sales (cases) and revenue from December 18, 2004 to April 2 2011.
Preliminary unaudited financial results for the full year ended 30 June Amount for this reporting period
 Marlborough Wine Estates Group Limited Results for Announcement to the Market Preliminary unaudited financial results for the full year ended 30 June 2017 Reporting Period 1st July to 30th June 2017 Previous
Massimo Zanetti Beverage Group the Group at a glance 2017
 1 Massimo Zanetti Beverage Group the Group at a glance 2017 CONTENTS 1. GROUP PROFILE 2. MARKET TRENDS 3. 2017 FINANCIAL RESULTS 4. INVESTMENT OPPORTUNITY 5. ANNEX Leva Luxury Coffee La San Marco Espresso
Record exports from Brazil weigh heavy on the coffee market
 Record exports from Brazil weigh heavy on the coffee market Coffee exports from Brazil reached a record high of 36.8 million bags in crop year 2014/15 (April to March), fuelled by domestic stocks and encouraged
Report on Performance and Results of the Corporate Group
 Report on Performance and Results of the Corporate Group Overview of the Market and Company's Management Strategy An OM2 Network owned meat shop Our Tasks and Long-Term Prospect Wagyu cuisine, shabu-shabu
CCL Products (India) Ltd.
 Ltd.") Jan-16 Feb-16 Mar-16 Apr-16 May-16 Jun-16 Jul-16 Aug-16 Sep-16 Oct-16 Nov-16 Dec-16 Jan-17 s. CCL Products (India) Ltd.. February 6, 2017 BSE Code: 519600 NSE Code: CCL Reuters Code: CCLP.NS Bloomberg
Jan-16 Feb-16 Mar-16 Apr-16 May-16 Jun-16 Jul-16 Aug-16 Sep-16 Oct-16 Nov-16 Dec-16 Jan-17 s. CCL Products (India) Ltd.. February 6, 2017 BSE Code: 519600 NSE Code: CCL Reuters Code: CCLP.NS Bloomberg
«We go where our customers want us to be»
 2 «We go where our customers want us to be» Our customers are expecting from us product innovation, consistency, outstanding quality and service, convenience. This is our task. And we want to accomplish
Jennie-O Turkey Store. Glenn Leitch Group Vice President President, Jennie-O Turkey Store
 Jennie-O Turkey Store Glenn Leitch Group Vice President President, Jennie-O Turkey Store Agenda Industry metrics Impact of avian influenza Brand strength Value added growth Summary Total Industry Live
Ontario Wine and Grape Industry Performance Study
 Ontario Wine and Grape Industry Performance Study 2016 Performed by VQA Ontario and Deloitte on behalf of the Ontario wine and grape industry March 2017 FINANCIAL INFORMATION I II 2016 ONTARIO WINE AND
... AND IT OWNS AN 8.8% 8% STAKE IN GRUPO FINANCIERO BANORTE, WHICH HAS A MARKET VALUE OF AROUND US$750 MILLION
 NOVEMBER 2010 I. COMPANY OVERVIEW GRUMA IS THE WORLD S LARGEST CORN FLOUR AND TORTILLA PRODUCER, WITH OPERATIONS IN THE UNITED STATES, MEXICO, VENEZUELA, CENTRAL AMERICA, EUROPE, ASIA, AND OCEANIA... RGB
Coffee prices maintain downward trend as 2015/16 production estimates show slight recovery
 Coffee prices maintain downward trend as 2015/16 production estimates show slight recovery The coffee market fell again in December 2015, reaching its second lowest monthly average of the year. This decrease
Coffee market remains volatile but lacks direction
 Coffee market remains volatile but lacks direction Prices fluctuated significantly during August, with the ICO composite indicator dropping by 10 cents before jumping back up another 12 cents by the end
much better than in As may be seen in Table 1, the futures market prices for the next 12 months
 Dairy Outlook December 2009 By Jim Dunn Professor of Agricultural Economics, Penn State University Market Psychology prices are higher than last month, especially Class IV. The outlook for dairy prices
July 2010 Barry Callebaut - Roadshow presentation
 Barry Callebaut 9-month key sales figures 2009/10 Agenda Barry Callebaut at a glance Highlights 9 months 2009-2010 Outlook 2 Barry Callebaut is active along the entire cocoa and chocolate value chain Cocoa
July 2010 Barry Callebaut - Roadshow presentation
 Barry Callebaut 9-month key sales figures 2009/10 July 2010 July 2010 Barry Callebaut - Roadshow presentation Agenda Barry Callebaut at a glance Highlights 9 months 2009-2010 Outlook July 2010 Barry Callebaut
For personal use only
 SEPTEMBER 216 GLOBAL DAIRY UPDATE European milk production has decreased for the first time since early 215, with volumes in June down 2 compared to last year. Last week we announced our annual results,
OUR POTENTIAL. Business Update MAY 2017
 OUR POTENTIAL Business Update MAY 2017 Disclaimer This presentation may contain forward-looking statements and projections. There can be no certainty of outcome in relation to the matters to which the
Global Considerations
 What Does Being a Global Player Mean to the U.S. Dairy Sector? Global Considerations 2 1 A Decade of Change $8, 4,5 $7, 4, (Million $) $6, $5, $4, $3, $2, $1, 3,5 3, 2,5 2, 1,5 1, 5 (Million Lbs.) $ 23
DELIVERING REFRESHING SOFT DRINKS
 BEVERAGES DIVISION DELIVERING REFRESHING SOFT DRINKS Swire Beverages manufactures, markets and distributes refreshing soft drinks to consumers in Hong Kong, Taiwan, Mainland China and the USA. 46 215 PERFORMANCE
Interim Result MARCH 2018 OUR POTENTIAL OUR CO-OPERATIVE OUR PERFORMANCE
 OUR CO-OPERATIVE OUR POTENTIAL OUR PERFORMANCE Interim Result 2018 21 MARCH 2018 Disclaimer This presentation may contain forward-looking statements and projections. There can be no certainty of outcome
INVESTOR PRESENTATION. Post FY2017 Volume Announcement
 v INVESTOR PRESENTATION Post FY2017 Volume Announcement FORWARD-LOOKING STATEMENTS This presentation may contain certain forward-looking statements concerning our future performance and should be considered
China Drinking Drinking Water Water Ind ustr stry Report,
 China Drinking Water Industry Report, 2009-2010 According to statistics, more than 300 million people do not have safe drinking water in Chinese rural areas, of which the drinking water of 190 million
I. COMPANY I. OVERVIEW
 I. COMPANY I. OVERVIEW GRUMA IS THE WORLD S LARGEST CORN FLOUR AND TORTILLA PRODUCER, WITH OPERATIONS IN THE UNITED STATES, MEXICO, CENTRAL AMERICA, EUROPE, ASIA AND OCEANIA S U B S I D I AR I E S P R
For personal use only
 7 December 2017 FONTERRA REVISES 2017/18 FORECAST FARMGATE MILK PRICE Fonterra Co-operative Group Limited today reduced its forecast Farmgate Milk Price for the 2017/18 season from $6.75 to $6.40 per kgms
3 rd Quarter & 9 Months 2014 Financial Results 10 November 2014
 3 rd Quarter & 9 Months 2014 Financial Results 10 November 2014 Disclaimer The presentation is prepared by Super Group Ltd ( Super or the Group ) and is solely for the purpose of corporate communication
World coffee consumption increases but prices still low
 World coffee consumption increases but prices still low The coffee market stabilised slightly in February, but prices remain at very low levels. A lack of news regarding fundamentals with expectations
What Does Being a Global Player Mean to the U.S. Dairy Sector?
 What Does Being a Global Player Mean to the U.S. Dairy Sector? Global Considerations Copyright of Daily Dairy Report, Inc. 2 A Decade of Change $8,000 4,500 $7,000 4,000 (Million $) $6,000 $5,000 $4,000
Everyday Fresh Maeil Dairies
 Everyday Fresh Maeil Dairies Jun 2013 Management Planning Team - page 1 - Contents 1. Overview 2. Foundation Story 3. Vision & Mission 4. Ownership Structure 5. Growth History 6. Sales Trend 7. Sales Breakdown
Strong Holiday Performance Drives 5% Global Comp Growth, Global Traffic Increases 2%
 Starbucks Delivers Record Q1 Revenue and EPS Strong Holiday Performance Drives 5% Global Comp Growth, Global Traffic Increases 2% Revenues rise 13% to a record $4.8 billion; EPS of $1.30 includes a gain
KFC Holdings Japan / 9873
 COVERAGE INITIATED ON: 2016.10.31 Shared Research Inc. has produced this report by request from the company discussed in the report. The aim is to provide an owner s manual to investors. We at Shared Research
Ontario Wine and Grape Industry Performance Study
 Ontario Wine and Grape Industry Performance Study 2015 Performed by VQA Ontario and Deloitte on behalf of the Ontario wine and grape industry March 2016 FINANCIAL INFORMATION I II 2015 ONTARIO WINE AND
Results April 2019
 Results 2018 April 2019 AGENDA BUSINESS EVOLUTION ECONOMIC ENVIRONMENT CONSOLIDATED KPI's TRAVEL CONCESSIONS SPAIN FINANCIAL STATEMENTS SHARE EVOLUTION OUTLOOK 2019 2 Who are we? BUSINESS EVOLUTION Opened
Coffee market ends 2017/18 in surplus
 Coffee market ends 217/18 in surplus World coffee production in coffee year 217/18 is estimated 5.7% higher at 164.81 million bags as output of Arabica increased by 2.2% to 11.82, and Robusta grew 11.7%
Corporate Presentation July 2016
 Corporate Presentation July 2016 I. Concha y Toro: At a Glance 2 Viña Concha y Toro Today Largest Chilean and Latin American Winery. Top 10 world s winery in volume commercialized. Unique business model
Private Equity Investments
 Overview for Private Equity Investments Strategic capital and expertise for the wine industry Prepared: September 2011 Copyright 2010 Bacchus Capital Management In classical mythology, Bacchus is the god
GPS Leaders Conference: Global Dairy & Milk Protein Opportunities November 2016
 GPS Leaders Conference: Global Dairy & Milk Protein Opportunities November 2016 2 If this can happen..anything can happen! 3 Topics covered + Hoogwegt Organization + US Dairy Export Update + Global Trends
2007 Sonoma Research Associates - All rights reserved.
 2007 Sonoma Research Associates - All rights reserved. Practical Applications of the Price Elasticity of Demand Presented by Dan Karnowsky, President Sonoma Research Associates Presented at Competitive
Record exports in coffee year 2017/18
 Record exports in coffee year 2017/18 Total coffee exports increased each year since 2010/11 with a new record reached in 2017/18 at 121.86 million bags, 2% higher than 2016/17. In the twelve months ending
2017 SANBWA AGM Presentation
 2017 SANBWA AGM Presentation Hayley van Schalkwijk October 2017 Introduction to BMi Research Background Experience 46 Consultation Philosophy Pricing Specialists South African Market Value Chain Knowledge
Financial Results for Fiscal Year Ending December 31, February 12, 2016 Suntory Beverage & Food Limited
 2016 SUNTORY 2013 BEVERAGE SUNTORY BEVERAGE & FOOD & LIMITED. Limited. All Rights All Reserved Rights Reserved. Financial for Fiscal Year Ending December 31, 2015 February 12, 2016 Suntory Beverage & Food
Corporate Presentation May 2017
 Corporate Presentation May 2017 I. Concha y Toro: At a Glance 2 Viña Concha y Toro Today Largest Chilean and Latin American Winery. Top 10 world s winery in volume commercialized. Unique business model
ABN Australian Vintage Limited Full Year Result to 30 June 2018 Profit up 79% and Record Cash Flow
 ABN 78 052 179 932 Company Announcements Australian Securities Exchange 29 August 2018 Key Points Australian Vintage Limited Full Year Result to 30 June 2018 Profit up 79% and Record Cash Flow Net Profit
The Food Industry Monitor
 The Food Industry Monitor The performance of the Italian food companies Report Presentation Prof. Carmine Garzia Pollenzo - June 22th - 2018 The sample 815 Companies 15 Sectors 8 Years of financial information
Overview of the Manganese Industry
 39th Annual Conference Istanbul, Turkey 2013 Overview of the Manganese Industry International Manganese Institute Alberto Saavedra Market Research Manager June, 2013 Introduction Global Production Supply,
MONTHLY COFFEE MARKET REPORT
 1 E MONTHLY COFFEE MARKET REPORT March 2014 Ongoing uncertainty over the Brazilian coffee crop has caused significant fluctuations in coffee prices during March, with monthly volatility of the International
Coffee Season 2013/14 Finishes in Balance but Deficit Expected Next Year
 Coffee Season 2013/14 Finishes in Balance but Deficit Expected Next Year Coffee prices were volatile again over the course of September, mostly reacting to weather news from Brazil. Daily prices fell initially
Market Consumer Expenditure ( m)
") Supplementary Information Market and Financial Preliminary i Results 26 November 2009 Market Consumer Expenditure ( m) 80000 1984 to 2008 Total Total (Nominal) (Real) 6.4% 1.4% 70000 60000 50000 8.3% 3.3%
Supplementary Information Market and Financial Preliminary i Results 26 November 2009 Market Consumer Expenditure ( m) 80000 1984 to 2008 Total Total (Nominal) (Real) 6.4% 1.4% 70000 60000 50000 8.3% 3.3%
STARBUCKS CORPORATION
 STARBUCKS CORPORATION Background Starbucks started operations in 1971 by opening its first retail store in Seattle and by 2003 had grown to be the world s leading retailer, roaster and brand of specialty
Financial results 2014/2015. Strategy and development perspectives
 Financial results 2014/2015 Strategy and development perspectives Warsaw, September 2015 1 Agenda Strategy of the AMBRA Group Wine market in Poland Financial results and KPIs for 2014/2015 Development
PINAR SÜT MAMULLERİ SAN. A.Ş
 PINAR SÜT MAMULLERİ SAN. A.Ş Pınar Süt Highlights Innovator and pioneer More than 200 SKUs R&D expertise #1 milk brand that comes to mind* Best brand in dairy ** Among Turkey s Superbrands*** Hygenic and
Dairy Outlook. December By Jim Dunn Professor of Agricultural Economics, Penn State University. Market Psychology
 Dairy Outlook December 2015 By Jim Dunn Professor of Agricultural Economics, Penn State University Market Psychology The Class III market has taken a beating lately as cheese prices have drifted down and
Downward correction as funds respond to increasingly positive supply outlook
 Downward correction as funds respond to increasingly positive supply outlook Coffee prices fell sharply at the end of April as institutional investors sold off their positions. The coffee market continues
Sugar scenario in CIS countries:
 Sugar scenario in CIS countries: on the way to self-sufficiency Andrey Bodin Eurasian Sugar Association Commonwealth of Independent States (CIS) consists of 11 countries CIS Moldova Belarus Population
John Wilson - Chairman. Fonterra Co-operative Group Ltd. #
 John Wilson - Chairman Fonterra Co-operative Group Ltd. # Key highlights FORECAST CASH PAYOUT VOLUME: MILK COLLECTIONS $6.12 6% Forecast Farmgate Milk Price lifted to $5.80 kgms. The full year dividend
2016 was Telepizza Group s best year for chain sales 1 and EBITDA growth over the last decade
 Telepizza Full-Year Results for 2016 2016 was Telepizza Group s best year for chain sales 1 and EBITDA growth over the last decade Chain sales 1 grew by 7% to 517M while Underlying EBITDA rose by 10% to
Strengthening our coffee leadership
 Strengthening our coffee leadership Nestlé enters agreement for the perpetual global licensing rights of Starbucks consumer and foodservice products May 7, 2018 Mark Schneider François-Xavier Roger Chief
Optimism paired with results Winery Benchmarking Publication date: May 2017
 Optimism paired with results Winery Benchmarking 0 Publication date: May 0 Contents Welcome Executive Summary Results - Profitability Results - Financial position Results - Vineyards Results - Ratios 0
Volatility returns to the coffee market as prices stay low
 Volatility returns to the coffee market as prices stay low Daily coffee prices hit their lowest level in 19 months during August, as commodity markets worldwide were negatively affected by currency movements
Mango Retail Performance Report 2017
 Mango Retail Performance Report 2017 1 Table of Contents Pages 3-9 Pages 10-15 Pages 16-34 Pages 35-44 Pages 45-51 Pages 52-54 Executive Summary Fruit and Tropical Fruit Performance Whole Mango Performance
Financial Results for Fiscal Year Ended December 31, 2018 February 14, 2019 Suntory Beverage & Food Limited
 Financial Results for Fiscal Year Ended December 31, 2018 February 14, 2019 Suntory Beverage & Food Limited 2019 SUNTORY BEVERAGE & FOOD LIMITED. All Rights Reserved. 1 FY2018 Review FY2019 Forecast Saburo
Source : Intl Coffee Org. Other Milds. Brazil 26,08 % 29,28 % 28,27 % 26,37 % 28,81 % 39,76 % 27,78 % 34,19 % Prices Kenya
 2 nd World Coffee Conference, Bahia 23-25 September 25 Lesson emerging from the crisis : New paths for the coffee sector Session 2 : Coffee policies in a market economy Giuseppe Lavazza Source : Intl Coffee
Preliminary Results 2008
 Preliminary Results 2008 1 Gerald Corbett Chairman 2 John Gibney Finance Director 3 Financial Headlines FY08 m FY07 m % change Revenue 926.5 716.3 29.3 EBIT 96.7 80.0 20.9 EBIT Margin 10.4% 11.2% (80)bps
May 18, Sato Restaurant Systems Co., Ltd. Financial year ending March 2017 Financial Results Explanatory Material
 Sato Restaurant Systems Co., Ltd. Financial year ending March 2017 Financial Results Explanatory Material Listed on TSE 1 st Section: Security Code 8163 1 May 18, 2017 Summary of Financial Results for
Viña Concha y Toro Investor Presentation Chile Conference Deutsche Bank
 Viña Concha y Toro Investor Presentation Chile Conference Deutsche Bank May, 2011 1 1 / 1 Concha y Toro Performance 2003 (*) 2010 CAGR Sales (Ch$ million) $ 190,303 $ 374,019 10% Exports ** (Ch$ million)
Seeka Limited. Retail Investors March 2019
 Seeka Limited Retail Investors March 2019 Orchard-to-market excellence Seeka is an international fresh produce business In Australia Grow, process and market - Kiwifruit - Nashi pears - European pears
THIS REPORT CONTAINS ASSESSMENTS OF COMMODITY AND TRADE ISSUES MADE BY USDA STAFF AND NOT NECESSARILY STATEMENTS OF OFFICIAL U.S.
 THIS REPORT CONTAINS ASSESSMENTS OF COMMODITY AND TRADE ISSUES MADE BY USDA STAFF AND NOT NECESSARILY STATEMENTS OF OFFICIAL U.S. GOVERNMENT POLICY Required Report - public distribution Date: GAIN Report
Financial Results for Q3 Fiscal Year Ending December 31, 2018 November 5, 2018 Suntory Beverage & Food Limited
 Financial Results for Q3 Fiscal Year Ending December 31, 2018 November 5, 2018 Suntory Beverage & Food Limited 2018 SUNTORY BEVERAGE & FOOD LIMITED. All Rights Reserved. 1 Results for Q3, FY2018 (9 months)
Market Outlook- Era of Oversupply?
 Rabobank Agri Commodity Markets Research Market Outlook- Era of Oversupply? Sintercafe November 9, 20 Keith Flury Senior Commodity Analyst - Agri Commodity Markets Research (ACMR) Food & Agribusiness Research
Outline. o Global Dairy Overview o U.S Milk Production o Dairy Product Production, Stocks, Trade o Outlook. Copyright 2017 Daily Dairy Report, Inc.
 Outline o Global Dairy Overview o U.S Milk Production o Dairy Product Production, Stocks, Trade o Outlook 2 Global Milk Production: Select Countries (in billion pounds) In Billion Pounds 21 67 216 333
Globalization of Agriculture: An Ownership and Market Perspective. Ken Sullivan March 7, 2017
 Globalization of Agriculture: An Ownership and Market Perspective Ken Sullivan March 7, 2017 History and Context 3 $14BN COMPANY THAT OPERATES IN 23 U.S. STATES AND 5 COUNTRIES Smithfield s vertically
Becle, S.A.B. de C.V. Santander s Consumer Day Corporate Presentation
 Becle, S.A.B. de C.V. Santander s Consumer Day Corporate Presentation Nov, 20 2018 Disclaimer This presentation has been prepared by Becle, S.A.B. de C.V. ( Becle, Cuervo or the Company ) for informational
KOTIPIZZA GROUP OYJ INTERIM REPORT 1 FEBRUARY APRIL 2018
 KOTIPIZZA GROUP OYJ INTERIM REPORT 1 FEBRUARY 2018 30 APRIL 2018 YEAR STARTS WITH HOME OF BRANDS STRATEGY, COMPARABLE NET SALES INCREASE 12% AND EBITDA 19% COMPARED TO PREVIOUS YEAR February 2018 April
Coffee market continues downward trend
 Coffee market continues downward trend Since August 2017, the ICO composite indicator price has declined in each month except January 2018. The composite indicator decreased by 1.1% in March 2018 to an
Business Update DECEMBER 2018
 Business Update DECEMBER 2018 Disclaimer This presentation may contain forward-looking statements and projections. There can be no certainty of outcome in relation to the matters to which the forward-looking
MBA 503 Final Project Guidelines and Rubric
 MBA 503 Final Project Guidelines and Rubric Overview There are two summative assessments for this course. For your first assessment, you will be objectively assessed by your completion of a series of MyAccountingLab
* Represents per share calculation based on number of shares o/s post issue; Source: Choice Broking Research, Company DRHP
 Healthy Coffee Business but Costly (CDEL) the parent company of the Coffee Day Group, pioneered the coffee culture in the chained cafe format in India under the brand Cafe Coffee Day (CCD). At the end
Outline. o Global Dairy Overview o U.S Milk Production o Dairy Product Production, Stocks, Trade o Outlook 12/7/2016
 Outline o Global Dairy Overview o U.S Milk Production o Dairy Product Production, Stocks, Trade o Outlook 2 1 A View From Abroad Germany 1983 2 Germany 1983 Japan 1984 3 Japan 1984 Kobe Cow Calf Show 4
Corn Futures Highs David Scheibel Toll Free
 March Corn Futures that traded above $ 3.00 YTD High Difference MAR 1974 Corn 343 2/26/1974 MAR 1975 Corn 409 10/4/1974 MAR 1976 Corn 358 10/15/1974 MAR 1977 Corn 309 9/8/1976 MAR 1980 Corn 338.5 7/6/1979
Coca-Cola beverages bring a refreshing taste to consumers.
 Coca-Cola beverages bring a refreshing taste to consumers. BEVERAGES DIVISION DELIVERING REFRESHING SOFT DRINKS Swire Beverages manufactures, markets and distributes refreshing soft drinks to consumers
OUR POTENTIAL. Interim Result MARCH 2017
 OUR POTENTIAL Interim Result 2017 22 MARCH 2017 Disclaimer This presentation may contain forward-looking statements and projections. There can be no certainty of outcome in relation to the matters to which