From VOC to IPA: This Beer s For You!
|
|
|
- Brook Horn
- 6 years ago
- Views:
Transcription
1 From VOC to IPA: This Beer s For You! Joel Smith Statistician Minitab Inc. jsmith@minitab.com 2013 Minitab, Inc.

2 Image courtesy of amazon.com
3 The Data Online beer reviews Evaluated overall and: Appearance Aroma Palate Taste Focus on American Porters 2013 Minitab, Inc.
4 The Data Text counter for descriptive terms i.e. THICK, COFFEE, BLACK Most common became variables Initial cleansing 2013 Minitab, Inc.
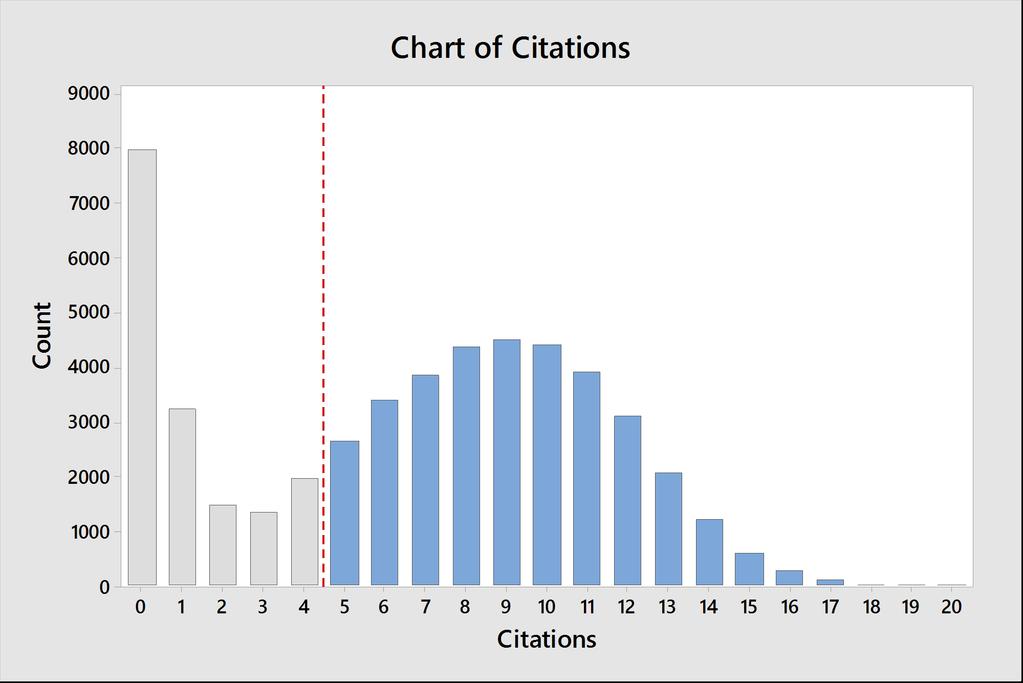
5 Count Chart of Citations Citations
6
7
8
9 Descriptive Statistics: HEAD, DARK, BROWN, BLACK, COFFEE, TAN, LIGHT, LACING,... Variable Mean Minimum Q1 Median Q3 Maximum HEAD DARK BROWN BLACK COFFEE TAN BOURBON FRUITx SMOKEx BITTERx SWEETx
10 Are American Porters Homogenous? Image courtesy of drinks.seriouseats.com

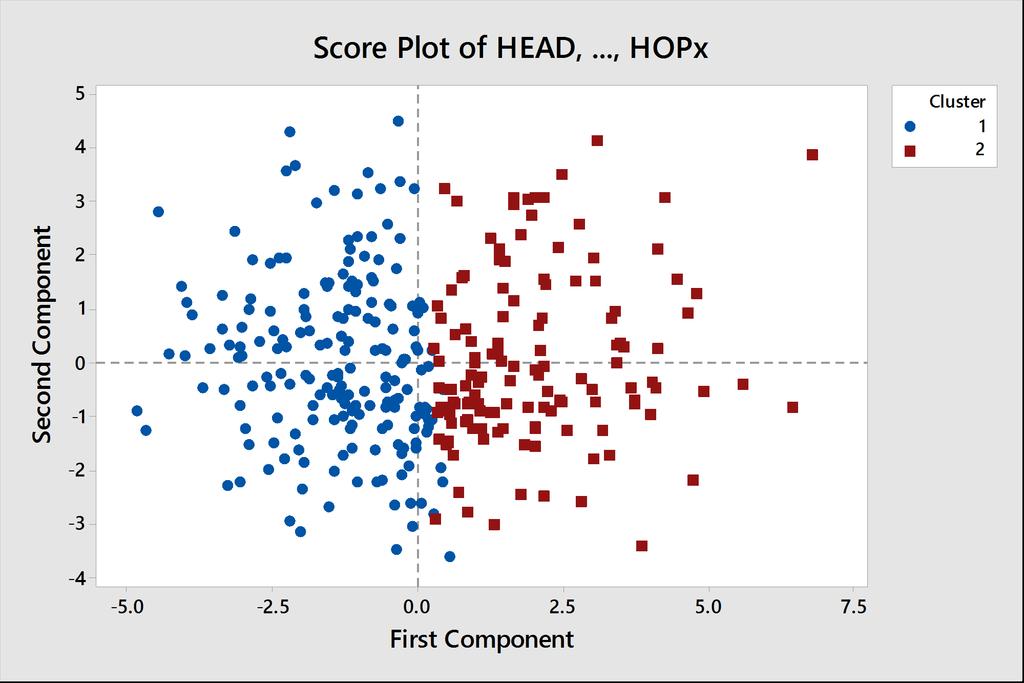
11 2013 Minitab, Inc. Stat > Multivariate > Cluster K-Means
12 K-means Cluster Analysis: HEAD, DARK, BROWN, BLACK, COFFEE, TAN, LIGHT, LACING, THICK, CARAMEL, VANILLA, OPAQUE, WHITE, SMOOTH, STRO Standardized Variables Final Partition Number of clusters: 2 Average Maximum Within distance distance Number of cluster sum from from observations of squares centroid centroid Cluster Cluster Distances Between Cluster Centroids Cluster1 Cluster2 Cluster Cluster
13 Cluster Centroids Grand Variable Cluster1 Cluster2 centroid HEAD DARK BROWN BLACK COFFEE DENSE BROWNISH SOUR BUBBLY WOOD HOPx
14
15
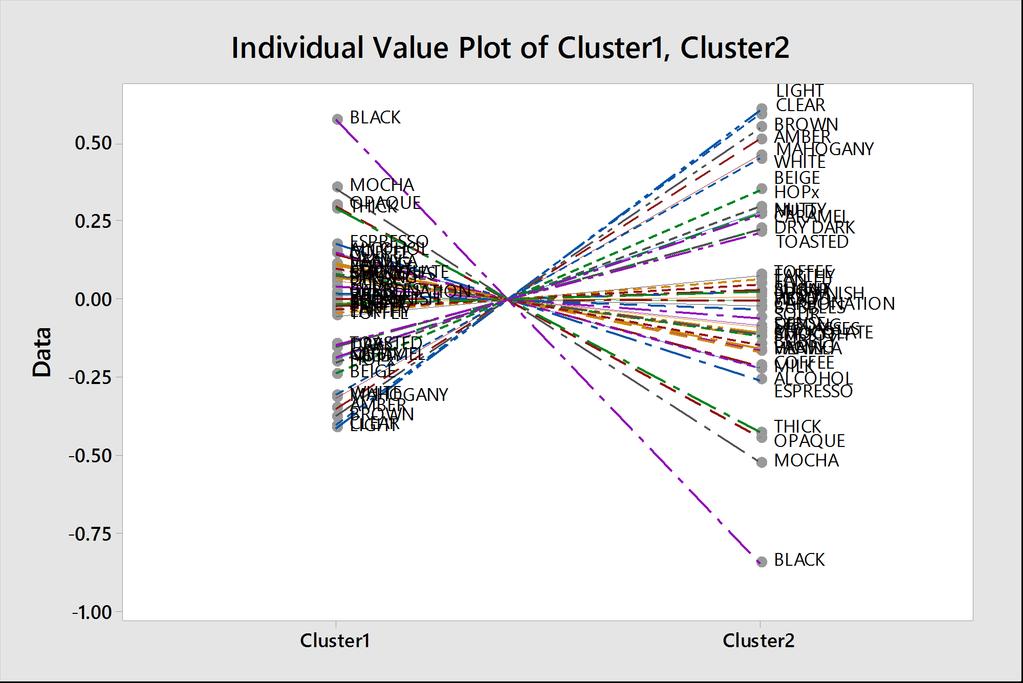
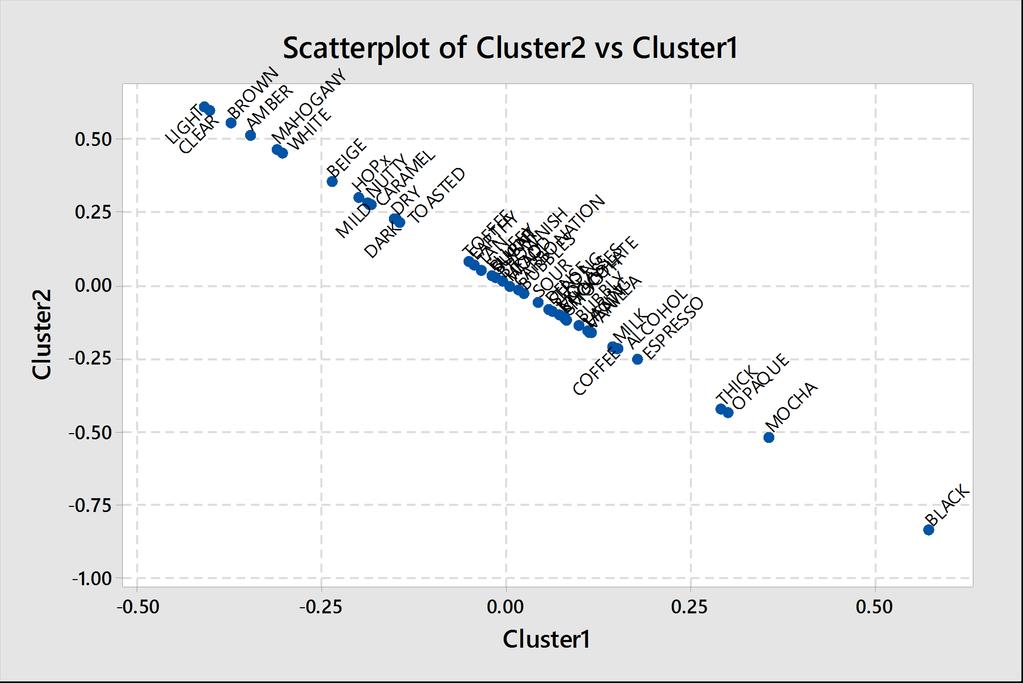
16 Cluster 1 Cluster 2 BLACK MOCHA OPAQUE THICK ESPRESSO ALCOHOL COFFEE MILK LIGHT CLEAR BROWN AMBER MAHOGANY WHITE BEIGE HOPX NUTTY MILD CARAMEL DRY DARK TOASTED 2013 Minitab, Inc.

17 What Are Customers Differentiating? Image courtesy of finedininglovers.com


18 2013 Minitab, Inc. Stat > Multivariate > Principal Components
19 Variable PC1 PC2 PC3 PC4 PC5 HEAD DARK BROWN BLACK COFFEE TAN LIGHT BROWNISH SOUR BUBBLY WOOD HOPx
20 Principal Component Analysis: HEAD, DARK, BROWN, BLACK, COFFEE, TAN, LIGHT, LACING, THICK, CARAMEL, VANILLA, OPAQUE, WHITE, SMOOTH, Eigenanalysis of the Correlation Matrix Eigenvalue Proportion Cumulative
21 Eigenvalue Scree Plot of HEAD,..., HOPx Component Number
22 Second Component Loading Plot of HEAD,..., HOPx 0.3 VANILLA 0.2 WOOD LACING SUGAR WHITE BLACK SOUR ALCOHOL FLUFFY BROWNISH BUBBLES TAN BEIGE MAHOGANY BROWN HEAD STRONG CLEAR MOLASSES DENSE OPAQUE DARK AMBER MOCHA NUTTY EARTHY LIGHT THICK ESPRESSO HEAVY STICKY BUBBLY MILD MILK CARBONATION TOFFEE CARAMEL BURNT SMOOTH COFFEE TOASTED DRY HOPx CHOCOLATE First Component
23

24 2013 Minitab, Inc. Stat > Regression > Regression > Best Subsets
25 Best Subsets Regression: Overall versus Appearance, Aroma, Palate, Taste Response is Overall A p p e a P r A a T a r l a n o a s R-Sq R-Sq c m t t Vars R-Sq (adj) PRESS (pred) Mallows Cp S e a e e X X X X X X X X X X X X X X X X X X X X X X X X X X X X X X
26 Regression Analysis: Overall versus Appearance, Aroma, Palate, Taste Stepwise Selection of Terms α to enter = 0.05, α to remove = 0.05 The stepwise procedure added terms during the procedure in order to maintain a hierarchical model at each step. Analysis of Variance Source DF Adj SS Adj MS F-Value P-Value Regression Aroma Palate Taste Error Total Model Summary S R-sq R-sq(adj) R-sq(pred) % 91.52% 91.37%

27 What are the characteristics of the best porter? Image courtesy of beerandbrewing.com
28


29 2013 Minitab, Inc. Stat > Regression > Regression > Fit Regression Model
30
31 HI Individual Value Plot of HI
32
33 HI_2 Individual Value Plot of HI_
34 Regression Analysis: Taste versus ABV, HEAD, DARK, BROWN, BLACK, COFFEE, TAN, LIGHT,... Analysis of Variance Source DF Adj SS Adj MS F-Value P-Value Regression ABV BLACK THICK CARAMEL SMOOTH SOUR Error Total Model Summary S R-sq R-sq(adj) R-sq(pred) % 38.94% 36.89%
35
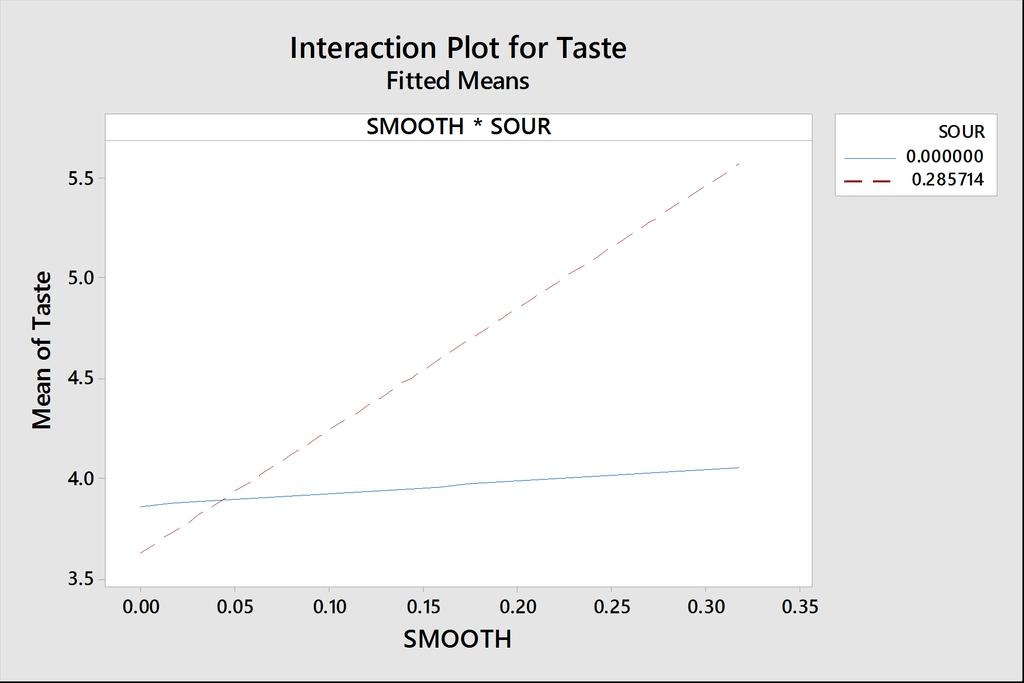
36 Regression Analysis: Taste versus ABV, BLACK, THICK, CARAMEL, SMOOTH, SOUR Analysis of Variance Source DF Adj SS Adj MS F-Value P-Value Regression ABV BLACK THICK SMOOTH SOUR SOUR*SOUR SMOOTH*SOUR Error Total Model Summary S R-sq R-sq(adj) R-sq(pred) % 40.72% 38.29%
37 Coded Coefficients Term Coef SE Coef T-Value P-Value VIF Constant ABV BLACK THICK SMOOTH SOUR SOUR*SOUR SMOOTH*SOUR
38 Mean of Taste ABV Main Effects Plot for Taste Fitted Means BLACK THICK SMOOTH SOUR
39
40 Matrix Plot of ABV, BLACK, THICK, SMOOTH, SOUR ABV BLACK THICK SMOOTH SOUR

41 Matrix Plot of ABV, BLACK, THICK, SMOOTH, SOUR ABV BLACK THICK SMOOTH SOUR


42 2013 Minitab, Inc. Stat > Regression > Regression > Response Optimizer
43
44 Response Optimization: Taste Parameters Response Goal Lower Target Upper Weight Importance Taste Maximum Solution Taste Composite Solution ABV BLACK THICK SMOOTH SOUR Fit Desirability % Lower 95% Lower Confidence Prediction Response Fit SE Fit Bound Bound Taste


45 So what does a great porter taste like? Image courtesy of deschutesbrewery.com
46 Summary Data cleaning Graphical analysis, descriptive statistics + manual review Examine homogeneity Clustering + sensory test Differentiation Principal components, regression Optimization Regression Verification Beer drinking 2013 Minitab, Inc.
47 From VOC to IPA: This Beer s For You! Joel Smith Statistician Minitab Inc. jsmith@minitab.com 2013 Minitab, Inc.
Wine-Tasting by Numbers: Using Binary Logistic Regression to Reveal the Preferences of Experts
 Wine-Tasting by Numbers: Using Binary Logistic Regression to Reveal the Preferences of Experts When you need to understand situations that seem to defy data analysis, you may be able to use techniques
Relation between Grape Wine Quality and Related Physicochemical Indexes
 Research Journal of Applied Sciences, Engineering and Technology 5(4): 557-5577, 013 ISSN: 040-7459; e-issn: 040-7467 Maxwell Scientific Organization, 013 Submitted: October 1, 01 Accepted: December 03,
IT 403 Project Beer Advocate Analysis
 1. Exploratory Data Analysis (EDA) IT 403 Project Beer Advocate Analysis Beer Advocate is a membership-based reviews website where members rank different beers based on a wide number of categories. The
STAT 5302 Applied Regression Analysis. Hawkins
 Homework 3 sample solution 1. MinnLand data STAT 5302 Applied Regression Analysis. Hawkins newdata
PSYC 6140 November 16, 2005 ANOVA output in R
 PSYC 6140 November 16, 2005 ANOVA output in R Type I, Type II and Type III Sums of Squares are displayed in ANOVA tables in a mumber of packages. The car library in R makes these available in R. This handout
THE IMPACT OF THE DEEPWATER HORIZON GULF OIL SPILL ON GULF COAST REAL ESTATE MARKETS
 THE IMPACT OF THE DEEPWATER HORIZON GULF OIL SPILL ON GULF COAST REAL ESTATE MARKETS Rebel A. Cole, PhD, CRE Kaye Family Endowed Professor Florida Atlantic University Department of Finance Richard J. Roddewig,
Panel A: Treated firm matched to one control firm. t + 1 t + 2 t + 3 Total CFO Compensation 5.03% 0.84% 10.27% [0.384] [0.892] [0.
![Panel A: Treated firm matched to one control firm. t + 1 t + 2 t + 3 Total CFO Compensation 5.03% 0.84% 10.27% [0.384] [0.892] [0.](/thumbs/90/101398922.jpg "Panel A: Treated firm matched to one control firm. t + 1 t + 2 t + 3 Total CFO Compensation 5.03% 0.84% 10.27% [0.384] [0.892] [0.") Online Appendix 1 Table O1: Determinants of CMO Compensation: Selection based on both number of other firms in industry that have CMOs and number of other firms in industry with MBA educated executives
Online Appendix 1 Table O1: Determinants of CMO Compensation: Selection based on both number of other firms in industry that have CMOs and number of other firms in industry with MBA educated executives
To: Professor Roger Bohn & Hyeonsu Kang Subject: Big Data, Assignment April 13th. From: xxxx (anonymized) Date: 4/11/2016
 Date: 4/11/2016") To: Professor Roger Bohn & Hyeonsu Kang Subject: Big Data, Assignment April 13th. From: xxxx (anonymized) Date: 4/11/2016 Data Preparation: 1. Separate trany variable into Manual which takes value of 1
To: Professor Roger Bohn & Hyeonsu Kang Subject: Big Data, Assignment April 13th. From: xxxx (anonymized) Date: 4/11/2016 Data Preparation: 1. Separate trany variable into Manual which takes value of 1
Ricco.Rakotomalala
 Ricco.Rakotomalala http://eric.univ-lyon2.fr/~ricco/cours 1 Data importation, descriptive statistics DATASET 2 Goal of the study Clustering of cheese dataset Goal of the study This tutorial describes a
You know what you like, but what about everyone else? A Case study on Incomplete Block Segmentation of white-bread consumers.
 You know what you like, but what about everyone else? A Case study on Incomplete Block Segmentation of white-bread consumers. Abstract One man s meat is another man s poison. There will always be a wide
Gail E. Potter, Timo Smieszek, and Kerstin Sailer. April 24, 2015
 Supplementary Material to Modelling workplace contact networks: the effects of organizational structure, architecture, and reporting errors on epidemic predictions, published in Network Science Gail E.
Analysis of Things (AoT)
") Analysis of Things (AoT) Big Data & Machine Learning Applied to Brent Crude Executive Summary Data Selecting & Visualising Data We select historical, monthly, fundamental data We check for correlations
Analysis of Things (AoT) Big Data & Machine Learning Applied to Brent Crude Executive Summary Data Selecting & Visualising Data We select historical, monthly, fundamental data We check for correlations
The SAS System 09:38 Wednesday, December 2, The CANDISC Procedure
 The SAS System 09:38 Wednesday, December 2, 2009 63 Observations 67 DF Total 66 Variables 43 DF Within Classes 65 Classes 2 DF Between Classes 1 Class Level Information Variable SPECIES Name Frequency
Flexible Imputation of Missing Data
 Chapman & Hall/CRC Interdisciplinary Statistics Series Flexible Imputation of Missing Data Stef van Buuren TNO Leiden, The Netherlands University of Utrecht The Netherlands crc pness Taylor &l Francis
Missing value imputation in SAS: an intro to Proc MI and MIANALYZE
 Victoria SAS Users Group November 26, 2013 Missing value imputation in SAS: an intro to Proc MI and MIANALYZE Sylvain Tremblay SAS Canada Education Copyright 2010 SAS Institute Inc. All rights reserved.
BORDEAUX WINE VINTAGE QUALITY AND THE WEATHER ECONOMETRIC ANALYSIS
 BORDEAUX WINE VINTAGE QUALITY AND THE WEATHER ECONOMETRIC ANALYSIS WINE PRICES OVER VINTAGES DATA The data sheet contains market prices for a collection of 13 high quality Bordeaux wines (not including
Online Appendix to Voluntary Disclosure and Information Asymmetry: Evidence from the 2005 Securities Offering Reform
 Online Appendix to Voluntary Disclosure and Information Asymmetry: Evidence from the 2005 Securities Offering Reform This document contains several additional results that are untabulated but referenced
Predicting Wine Quality
 March 8, 2016 Ilker Karakasoglu Predicting Wine Quality Problem description: You have been retained as a statistical consultant for a wine co-operative, and have been asked to analyze these data. Each
Imputation of multivariate continuous data with non-ignorable missingness
 Imputation of multivariate continuous data with non-ignorable missingness Thais Paiva Jerry Reiter Department of Statistical Science Duke University NCRN Meeting Spring 2014 May 23, 2014 Thais Paiva, Jerry
The R survey package used in these examples is version 3.22 and was run under R v2.7 on a PC.
 CHAPTER 7 ANALYSIS EXAMPLES REPLICATION-R SURVEY PACKAGE 3.22 GENERAL NOTES ABOUT ANALYSIS EXAMPLES REPLICATION These examples are intended to provide guidance on how to use the commands/procedures for
Final Exam Financial Data Analysis (6 Credit points/imp Students) March 2, 2006
 March 2, 2006") Dr. Roland Füss Winter Term 2005/2006 Final Exam Financial Data Analysis (6 Credit points/imp Students) March 2, 2006 Note the following important information: 1. The total disposal time is 60 minutes.
Dr. Roland Füss Winter Term 2005/2006 Final Exam Financial Data Analysis (6 Credit points/imp Students) March 2, 2006 Note the following important information: 1. The total disposal time is 60 minutes.
Comparing R print-outs from LM, GLM, LMM and GLMM
 3. Inference: interpretation of results, plotting results, confidence intervals, hypothesis tests (Wald,LRT). 4. Asymptotic distribution of maximum likelihood estimators and tests. 5. Checking the adequacy
Multiple Imputation for Missing Data in KLoSA
 Multiple Imputation for Missing Data in KLoSA Juwon Song Korea University and UCLA Contents 1. Missing Data and Missing Data Mechanisms 2. Imputation 3. Missing Data and Multiple Imputation in Baseline
Understanding the impact hopping rate has on the aroma quality and intensity of beer dry hopped with Cascade
 Understanding the impact hopping rate has on the aroma quality and intensity of beer dry hopped with Cascade Scott Lafontaine Ph. D. Advisor: Tom Shellhammer Oregon State University 36th European Brewery
Internet Appendix to. The Price of Street Friends: Social Networks, Informed Trading, and Shareholder Costs. Jie Cai Ralph A.
 Internet Appendix to The Price of Street Friends: Social Networks, Informed Trading, and Shareholder Costs Jie Cai Ralph A. Walkling Ke Yang October 2014 1 A11. Controlling for s Logically Associated with
Curtis Miller MATH 3080 Final Project pg. 1. The first question asks for an analysis on car data. The data was collected from the Kelly
 Curtis Miller MATH 3080 Final Project pg. 1 Curtis Miller 4/10/14 MATH 3080 Final Project Problem 1: Car Data The first question asks for an analysis on car data. The data was collected from the Kelly
The Importance of Dose Rate and Contact Time in the Use of Oak Alternatives
 W H I T E PA P E R The Importance of Dose Rate and Contact Time in the Use of Oak Alternatives David Llodrá, Research & Development Director, Oak Solutions Group www.oaksolutionsgroup.com Copyright 216
Grain and Flour Quality of Ethiopian Sorghum in Respect of their Injera Making Potential
 Grain and Flour Quality of Ethiopian Sorghum in Respect of their Injera Making Potential EIAR Senayit Yetneberk, Lloyd W. Rooney, John R. N. Taylor and H.L. de Kock UP Introduction Injera is an Ethiopian
wine 1 wine 2 wine 3 person person person person person
 1. A trendy wine bar set up an experiment to evaluate the quality of 3 different wines. Five fine connoisseurs of wine were asked to taste each of the wine and give it a rating between 0 and 10. The order
Online Appendix to. Are Two heads Better Than One: Team versus Individual Play in Signaling Games. David C. Cooper and John H.
 Online Appendix to Are Two heads Better Than One: Team versus Individual Play in Signaling Games David C. Cooper and John H. Kagel This appendix contains a discussion of the robustness of the regression
A CASE STUDY: HOW CONSUMER INSIGHTS DROVE THE SUCCESSFUL LAUNCH OF A NEW RED WINE
 A CASE STUDY: HOW CONSUMER INSIGHTS DROVE THE SUCCESSFUL LAUNCH OF A NEW RED WINE Laure Blauvelt SSP 2010 0 Agenda Challenges of Wine Category Consumers: Foundation for Product Insights Successful Launch
Growth in early yyears: statistical and clinical insights
 Growth in early yyears: statistical and clinical insights Tim Cole Population, Policy and Practice Programme UCL Great Ormond Street Institute of Child Health London WC1N 1EH UK Child growth Growth is
February 26, The results below are generated from an R script.
 February 26, 2015 The results below are generated from an R script. weights = read.table("http://www.bio.ic.ac.uk/research/mjcraw/therbook/data/growth.txt", header = T) R functions: aov(y~a+b+a:b, data=mydata)
Business Statistics /82 Spring 2011 Booth School of Business The University of Chicago Final Exam
 Business Statistics 41000-81/82 Spring 2011 Booth School of Business The University of Chicago Final Exam Name You may use a calculator and two cheat sheets. You have 3 hours. I pledge my honor that I
Wine Rating Prediction
 CS 229 FALL 2017 1 Wine Rating Prediction Ke Xu (kexu@), Xixi Wang(xixiwang@) Abstract In this project, we want to predict rating points of wines based on the historical reviews from experts. The wine
Internet Appendix for CEO Personal Risk-taking and Corporate Policies TABLE IA.1 Pilot CEOs and Firm Risk (Controlling for High Performance Pay)
") TABLE IA.1 Pilot CEOs and Firm Risk (Controlling for High Performance Pay) OLS regressions with annualized standard deviation of firm-level monthly stock returns as the dependent variable. A constant is
TABLE IA.1 Pilot CEOs and Firm Risk (Controlling for High Performance Pay) OLS regressions with annualized standard deviation of firm-level monthly stock returns as the dependent variable. A constant is
Lab 2: Phase transitions & ice cream
 Lab 2: Phase transitions & ice cream Lab sections on Tuesday Sept 18 Friday Sept 21 In this lab you will observe how changing two parameters, pressure and salt concentration, affects the two phase transitions
Session 4: Managing seasonal production challenges. Relationships between harvest time and wine composition in Cabernet Sauvignon.
 Session 4: Managing seasonal production challenges Relationships between harvest time and wine composition in Cabernet Sauvignon Keren Bindon Cristian Varela, Helen Holt, Patricia Williamson, Leigh Francis,
*p <.05. **p <.01. ***p <.001.
 Table 1 Weighted Descriptive Statistics and Zero-Order Correlations with Fatherhood Timing (N = 1114) Variables Mean SD Min Max Correlation Interaction time 280.70 225.47 0 1095 0.05 Interaction time with
Investment Wines. - Risk Analysis. Prepared by: Michael Shortell & Adiam Woldetensae Date: 06/09/2015
 Investment Wines - Risk Analysis Prepared by: Michael Shortell & Adiam Woldetensae Date: 06/09/2015 Purpose Look at investment wines & examine factors that affect wine prices over time We will identify
COMPARISON OF THREE METHODOLOGIES TO IDENTIFY DRIVERS OF LIKING OF MILK DESSERTS
 COMPARISON OF THREE METHODOLOGIES TO IDENTIFY DRIVERS OF LIKING OF MILK DESSERTS Gastón Ares, Cecilia Barreiro, Ana Giménez, Adriana Gámbaro Sensory Evaluation Food Science and Technology Department School
Increasing Toast Character in French Oak Profiles
 RESEARCH Increasing Toast Character in French Oak Profiles Beaulieu Vineyard 2006 Chardonnay Domenica Totty, Beaulieu Vineyard David Llodrá, World Cooperage Dr. James Swan, Consultant www.worldcooperage.com
November 9, Myde Boles, Ph.D. Program Design and Evaluation Services Multnomah County Health Department and Oregon Public Health Division
 November 9, 2010 Myde Boles, Ph.D. Program Design and Evaluation Services Multnomah County Health Department and Oregon Public Health Division Presenter Disclosures Myde Boles No Relationships to Disclose
Appendix A. Table A.1: Logit Estimates for Elasticities
 Estimates from historical sales data Appendix A Table A.1. reports the estimates from the discrete choice model for the historical sales data. Table A.1: Logit Estimates for Elasticities Dependent Variable:
Modeling Wine Quality Using Classification and Regression. Mario Wijaya MGT 8803 November 28, 2017
 Modeling Wine Quality Using Classification and Mario Wijaya MGT 8803 November 28, 2017 Motivation 1 Quality How to assess it? What makes a good quality wine? Good or Bad Wine? Subjective? Wine taster Who
Relationships Among Wine Prices, Ratings, Advertising, and Production: Examining a Giffen Good
 Relationships Among Wine Prices, Ratings, Advertising, and Production: Examining a Giffen Good Carol Miu Massachusetts Institute of Technology Abstract It has become increasingly popular for statistics
November K. J. Martijn Cremers Lubomir P. Litov Simone M. Sepe
 ONLINE APPENDIX TABLES OF STAGGERED BOARDS AND LONG-TERM FIRM VALUE, REVISITED November 016 K. J. Martijn Cremers Lubomir P. Litov Simone M. Sepe The paper itself is available at https://papers.ssrn.com/sol3/papers.cfm?abstract-id=364165.
Audrey Page. Brooke Sacksteder. Kelsi Buckley. Title: The Effects of Black Beans as a Flour Replacer in Brownies. Abstract:
 Audrey Page Brooke Sacksteder Kelsi Buckley Title: The Effects of Black Beans as a Flour Replacer in Brownies Abstract: One serving of beans can provide 30% of an average adult s daily recommendation for
Problem Set #3 Key. Forecasting
 Problem Set #3 Key Sonoma State University Business 581E Dr. Cuellar The data set bus581e_ps3.dta is a Stata data set containing annual sales (cases) and revenue from December 18, 2004 to April 2 2011.
Flexible Working Arrangements, Collaboration, ICT and Innovation
 Flexible Working Arrangements, Collaboration, ICT and Innovation A Panel Data Analysis Cristian Rotaru and Franklin Soriano Analytical Services Unit Economic Measurement Group (EMG) Workshop, Sydney 28-29
Activity 10. Coffee Break. Introduction. Equipment Required. Collecting the Data
 . Activity 10 Coffee Break Economists often use math to analyze growth trends for a company. Based on past performance, a mathematical equation or formula can sometimes be developed to help make predictions
SECTION 1 (BJCP/ETHICS/JUDGING PROCESS)
") PARTICIPANT CODE: 1012-MAPI- SECTION 1 (BJCP/ETHICS/JUDGING PROCESS) Part 1: BJCP This part of Section 1 is worth 5 of the 100 points possible on the essay portion. List three primary purposes of the BJCP
PARTICIPANT CODE: 1012-MAPI- SECTION 1 (BJCP/ETHICS/JUDGING PROCESS) Part 1: BJCP This part of Section 1 is worth 5 of the 100 points possible on the essay portion. List three primary purposes of the BJCP
Table A.1: Use of funds by frequency of ROSCA meetings in 9 research sites (Note multiple answers are allowed per respondent)
") Appendix Table A.1: Use of funds by frequency of ROSCA meetings in 9 research sites (Note multiple answers are allowed per respondent) Daily Weekly Every 2 weeks Monthly Every 3 months Every 6 months Total
Appendix Table A.1: Use of funds by frequency of ROSCA meetings in 9 research sites (Note multiple answers are allowed per respondent) Daily Weekly Every 2 weeks Monthly Every 3 months Every 6 months Total
Experimental design, sensorial and principal components analysis: Three complementary tools for cocktail optimization
 Experimental design, sensorial and principal components analysis: Three complementary tools for cocktail optimization C. Pierlot 1, A. Leprêtre 2 and J.M. Aubry 1,* 1 Laboratoire d Oxydation et de Formulation,
MICROWAVE DIELECTRIC SPECTRA AND THE COMPOSITION OF FOODS: PRINCIPAL COMPONENT ANALYSIS VERSUS ARTIFICIAL NEURAL NETWORKS.
 MICROWAVE DIELECTRIC SPECTRA AND THE COMPOSITION OF FOODS: PRINCIPAL COMPONENT ANALYSIS VERSUS ARTIFICIAL NEURAL NETWORKS. Michael Kent, Frank Daschner, Reinhard Knöchel Christian Albrechts University
Missing Data Treatments
 Missing Data Treatments Lindsey Perry EDU7312: Spring 2012 Presentation Outline Types of Missing Data Listwise Deletion Pairwise Deletion Single Imputation Methods Mean Imputation Hot Deck Imputation Multiple
Not to be published - available as an online Appendix only! 1.1 Discussion of Effects of Control Variables
 1 Appendix Not to be published - available as an online Appendix only! 1.1 Discussion of Effects of Control Variables Table 1 in the main text includes a number of additional control variables. We find
Zeitschrift für Soziologie, Jg., Heft 5, 2015, Online- Anhang
 I Are Joiners Trusters? A Panel Analysis of Participation and Generalized Trust Online Appendix Katrin Botzen University of Bern, Institute of Sociology, Fabrikstrasse 8, 3012 Bern, Switzerland; katrin.botzen@soz.unibe.ch
Style of the Quarter. English Mild
 Style of the Quarter English Mild A Mild is gentle, sweetish, certainly not bitter... an ale intended to be consumed in quantity, more as a restorative than a refresher. M. Jackson Club judging will be
TAP BEERS(A*) & CIDER (O*)
 & CIDER (O*)") TAP BEERS(A*) & CIDER (O*) MAD JACK S 6-PACK TASTING RACK 10 Any 6 (0,1L) Beers or Cider. Includes a bread basket. THORNBRIDGE (UK) ABV: 5.9% VIENNA IPA Hazy golden amber in color with a medium sized white
TAP BEERS(A*) & CIDER (O*) MAD JACK S 6-PACK TASTING RACK 10 Any 6 (0,1L) Beers or Cider. Includes a bread basket. THORNBRIDGE (UK) ABV: 5.9% VIENNA IPA Hazy golden amber in color with a medium sized white
Identification of Adulteration or origins of whisky and alcohol with the Electronic Nose
 Identification of Adulteration or origins of whisky and alcohol with the Electronic Nose Dr Vincent Schmitt, Alpha M.O.S AMERICA schmitt@alpha-mos.com www.alpha-mos.com Alpha M.O.S. Eastern Analytical
Online Appendix to The Effect of Liquidity on Governance
 Online Appendix to The Effect of Liquidity on Governance Table OA1: Conditional correlations of liquidity for the subsample of firms targeted by hedge funds This table reports Pearson and Spearman correlations
Sensory Characteristics and Consumer Acceptance of Mechanically Harvested California Black Ripe Olives
 Sensory Characteristics and Consumer Acceptance of Mechanically Harvested California Black Ripe Olives S.M. Lee, C. Sirimuangmoon, A. Gomez-Rico, K. Kitsawad, U. Rosa, J. Burns, W.H. Krueger, E. Fichtner,
Regression Models for Saffron Yields in Iran
 Regression Models for Saffron ields in Iran Sanaeinejad, S.H., Hosseini, S.N 1 Faculty of Agriculture, Ferdowsi University of Mashhad, Iran sanaei_h@yahoo.co.uk, nasir_nbm@yahoo.com, Abstract: Saffron
Summary of Main Points
 1 Model Selection in Logistic Regression Summary of Main Points Recall that the two main objectives of regression modeling are: Estimate the effect of one or more covariates while adjusting for the possible
VQA Ontario. Quality Assurance Processes - Tasting
 VQA Ontario Quality Assurance Processes - Tasting Sensory evaluation (or tasting) is a cornerstone of the wine evaluation process that VQA Ontario uses to determine if a wine meets the required standard
Method for the imputation of the earnings variable in the Belgian LFS
 Method for the imputation of the earnings variable in the Belgian LFS Workshop on LFS methodology, Madrid 2012, May 10-11 Astrid Depickere, Anja Termote, Pieter Vermeulen Outline 1. Introduction 2. Imputation
Discriminating terroirs by combination of phenolics and sensory profiles of Malbec wines from Mendoza
 Discriminating terroirs by combination of phenolics and sensory profiles of Malbec wines from Mendoza Roy Urvieta, his PhD Adviser Ariel Fontana, Fernando Buscema, Beatriz Coste and Rubén Bottini, published
EFFECT OF TOMATO GENETIC VARIATION ON LYE PEELING EFFICACY TOMATO SOLUTIONS JIM AND ADAM DICK SUMMARY
 EFFECT OF TOMATO GENETIC VARIATION ON LYE PEELING EFFICACY TOMATO SOLUTIONS JIM AND ADAM DICK 2013 SUMMARY Several breeding lines and hybrids were peeled in an 18% lye solution using an exposure time of
Perceptual Mapping and Opportunity Identification. Dr. Chris Findlay Compusense Inc.
 Perceptual Mapping and Opportunity Identification Dr. Chris Findlay Compusense Inc. What are we trying to accomplish? Outline Sensory experience of consumers Descriptive Analysis What is a Perceptual Map?
Previous analysis of Syrah
 Perception and interest of French consumers for Syrah / Shiraz Introduction Plan Previous analysis on Syrah vine and on consumer behaviour for this kind of wine Methods of research Building the General
The Development of a Weather-based Crop Disaster Program
 The Development of a Weather-based Crop Disaster Program Eric Belasco Montana State University 2016 SCC-76 Conference Pensacola, FL March 19, 2016. Belasco March 2016 1 / 18 Motivation Recent efforts to
SENSORY FLAVOR PROFILING AND MAPPING OF MARKET SAMPLES OF CUMIN (CUMINUM CYMINUM L.) ABSTRACT
 ABSTRACT") Blackwell Publishing Ltd.Oxford, UK and Malden, USAJFQJournal of Food Quality0146-94282004 Blackwell Publishing2004270264273Original Articles CUMIN FLAVOR, PROFILE, PCA AND MAPPINGA. DATTATREYA, M. PRAKASH
Blackwell Publishing Ltd.Oxford, UK and Malden, USAJFQJournal of Food Quality0146-94282004 Blackwell Publishing2004270264273Original Articles CUMIN FLAVOR, PROFILE, PCA AND MAPPINGA. DATTATREYA, M. PRAKASH
Credit Supply and Monetary Policy: Identifying the Bank Balance-Sheet Channel with Loan Applications. Web Appendix
 Credit Supply and Monetary Policy: Identifying the Bank Balance-Sheet Channel with Loan Applications By GABRIEL JIMÉNEZ, STEVEN ONGENA, JOSÉ-LUIS PEYDRÓ, AND JESÚS SAURINA Web Appendix APPENDIX A -- NUMBER
 Fig. 3.1 Ultrafiltration Plant proved to be the most useful parameter for the characterization of whitening ability. The L* a* b* value in coffee were 52.19, 4.12 and 19.32 for
COMMUNICATION II Moisture Determination of Cocoa Beans by Microwave Oven
 Pertanika 13(1), 67-72 (10) COMMUNICATION II Moisture Determination of Cocoa Beans by Microwave Oven ABSTRAK Analisa statistik telah dijalankan antara kaedah menggunakan ketuhar mikrogelumbang dan kaedah
What makes a good muffin? Ivan Ivanov. CS229 Final Project
 What makes a good muffin? Ivan Ivanov CS229 Final Project Introduction Today most cooking projects start off by consulting the Internet for recipes. A quick search for chocolate chip muffins returns a
End to End Chilled Water Optimization Merck West Point, PA Site
 End to End Chilled Water Optimization Merck West Point, PA Site Michael Nyhan, PE Associate Director at Merck Travis Smith, PE Principal at Smith Engineering Dan Shirley Utilities Engineer at Thermo Systems
This is a repository copy of Poverty and Participation in Twenty-First Century Multicultural Britain.
 This is a repository copy of Poverty and Participation in Twenty-First Century Multicultural Britain. White Rose Research Online URL for this paper: http://eprints.whiterose.ac.uk/105597/ Version: Supplemental
Tariff vs non tariff barriers in seafood trade
 (Debi Bishop/iStockphoto) Tariff vs non tariff barriers in seafood trade Kth Kathy Baylis, Lia Nogueira and Kathryn Kth Pace CATPRN workshop, Toronto, May 28, 2011 Objective To explore the effect and the
Guatemala. 1. Guatemala: Change in food prices
 Appendix I: Impact on Household Welfare: Guatemala 1. Guatemala: Change in food prices Group dp1 dp2 1. Rice 12.87% 10.00% 2. Corn 5.95% 10.00% 3. Bread and dried 29.17% 10.00% 4. Beans, roots, vegetables
Return to wine: A comparison of the hedonic, repeat sales, and hybrid approaches
 Return to wine: A comparison of the hedonic, repeat sales, and hybrid approaches James J. Fogarty a* and Callum Jones b a School of Agricultural and Resource Economics, The University of Western Australia,
ACCEPTABILITY CHARACTERISTICS OF DRAGON FRUIT CUPCAKE
 www.pitayaplus.com ACCEPTABILITY CHARACTERISTICS OF DRAGON FRUIT CUPCAKE JOANNA MARIE T. GUARIN ILOCOS SUR POLYTECHNIC STATE COLLEGE INSTITUTE OF HOSPITALITY MANAGEMENT SANTA MARIA, ILOCOS SUR OBJECTIVES
Learning Connectivity Networks from High-Dimensional Point Processes
 Learning Connectivity Networks from High-Dimensional Point Processes Ali Shojaie Department of Biostatistics University of Washington faculty.washington.edu/ashojaie Feb 21st 2018 Motivation: Unlocking
Evaluation and Analysis Model of Wine Quality Based on Mathematical Model
 Studies in Engineering and Technology Vol. 6, No. 1; August 2019 ISSN 2330-2038 E-ISSN 2330-2046 Published by Redfame Publishing URL: http://set.redfame.com Evaluation and Analysis Model of Wine Quality
The multivariate piecewise linear growth model for ZHeight and zbmi can be expressed as:
 Bi-directional relationships between body mass index and height from three to seven years of age: an analysis of children in the United Kingdom Millennium Cohort Study Supplementary material The multivariate
An application of cumulative prospect theory to travel time variability
 Katrine Hjorth (DTU) Stefan Flügel, Farideh Ramjerdi (TØI) An application of cumulative prospect theory to travel time variability Sixth workshop on discrete choice models at EPFL August 19-21, 2010 Page
AWRI Refrigeration Demand Calculator
 AWRI Refrigeration Demand Calculator Resources and expertise are readily available to wine producers to manage efficient refrigeration supply and plant capacity. However, efficient management of winery
Background & Literature Review The Research Main Results Conclusions & Managerial Implications
 Agenda Background & Literature Review The Research Main Results Conclusions & Managerial Implications Background & Literature Review WINE & TERRITORY Many different brands Fragmented market, resulting
Appendix Table A1 Number of years since deregulation
 Appendix Table A1 Number of years since deregulation This table presents the results of -in-s models incorporating the number of years since deregulation and using data for s with trade flows are above
Detecting Melamine Adulteration in Milk Powder
 Detecting Melamine Adulteration in Milk Powder Introduction Food adulteration is at the top of the list when it comes to food safety concerns, especially following recent incidents, such as the 2008 Chinese
Please sign and date here to indicate that you have read and agree to abide by the above mentioned stipulations. Student Name #4
 The following group project is to be worked on by no more than four students. You may use any materials you think may be useful in solving the problems but you may not ask anyone for help other than the
INFLUENCE OF THIN JUICE ph MANAGEMENT ON THICK JUICE COLOR IN A FACTORY UTILIZING WEAK CATION THIN JUICE SOFTENING
 INFLUENCE OF THIN JUICE MANAGEMENT ON THICK JUICE COLOR IN A FACTORY UTILIZING WEAK CATION THIN JUICE SOFTENING Introduction: Christopher D. Rhoten The Amalgamated Sugar Co., LLC 5 South 5 West, Paul,
Appendix A. Table A1: Marginal effects and elasticities on the export probability
 Appendix A Table A1: Marginal effects and elasticities on the export probability Variable PROP [1] PROP [2] PROP [3] PROP [4] Export Probability 0.207 0.148 0.206 0.141 Marg. Eff. Elasticity Marg. Eff.
Internet Appendix for Does Stock Liquidity Enhance or Impede Firm Innovation? *
 Internet Appendix for Does Stock Liquidity Enhance or Impede Firm Innovation? * This Internet Appendix provides supplemental analyses and robustness tests to the main results presented in Does Stock Liquidity
Napa Highway 29 Open Wineries
 4 5 6 7 8 9 35 4 45 5 55 Sonoma State University Business 58-Business Intelligence Problem Set #6 Key Dr. Cuellar Trend Analysis-Analyzing Tasting Room Strategies 1. Graphical Analysis a. Show graphically
Certified Spirits Educators (CSE) Exam - Society of Wine Educators Comparative Spirits Tasting Exam Sample Answer Sheet.
 Exam - Society of Wine Educators Comparative Spirits Tasting Exam Sample Answer Sheet.") Certified Spirits Educators (CSE) Exam - Society of Wine Educators Comparative Spirits Tasting Exam Sample Answer Sheet Candidate Name: Instructions: In the glasses labeled as numbers 1 3, you have been
Certified Spirits Educators (CSE) Exam - Society of Wine Educators Comparative Spirits Tasting Exam Sample Answer Sheet Candidate Name: Instructions: In the glasses labeled as numbers 1 3, you have been
A Hedonic Analysis of Retail Italian Vinegars. Summary. The Model. Vinegar. Methodology. Survey. Results. Concluding remarks.
 Vineyard Data Quantification Society "Economists at the service of Wine & Vine" Enometrics XX A Hedonic Analysis of Retail Italian Vinegars Luigi Galletto, Luca Rossetto Research Center for Viticulture
DATA MINING CAPSTONE FINAL REPORT
 DATA MINING CAPSTONE FINAL REPORT ABSTRACT This report is to summarize the tasks accomplished for the Data Mining Capstone. The tasks are based on yelp review data, majorly for restaurants. Six tasks are
The Sources of Risk Spillovers among REITs: Asset Similarities and Regional Proximity
 The Sources of Risk Spillovers among REITs: Asset Similarities and Regional Proximity Zeno Adams EBS Business School Roland Füss EBS Business School ZEW Mannheim Felix Schinder ZEW Mannheim Steinbeis University