Future Climate Scenarios for Kenya s Tea Growing Areas. Final report Cali, Managua: April, 2011
|
|
|
- Debra Pearson
- 6 years ago
- Views:
Transcription

1 Future Climate Scenarios for Kenya s Tea Growing Areas Final report Cali, Managua: April, 2011
2 Table of Contents 1 Authors and contact details Executive summary Project Background and Objectives Key objectives Methodology a Current climate... 3 Bioclimatic variables b Future climate... 5 Global circulation models... 5 Generation of predictions for future climate c Crop prediction... 6 Maximum Entropy... 6 Ecocrop d Measure of confidence e Environmental factors driving change in suitability Result I: Climate change summary of tea production sites a The summary climate characteristics for all tea factory sites in Kenya... 7 General climatic characteristics... 7 Extreme conditions... 8 Climate Seasonality... 8 Variability between models b Regional changes in the mean annual precipitation (2020) c Regional changes in the mean annual precipitation (2050) d Regional changes in the mean annual temperature (2020) e Regional changes in the mean annual temperature (2050) Result II: Suitability maps of tea production areas a Current suitability of tea production areas b Future suitability of tea production areas c Suitability change of tea production areas Result III: Environmental factors which drive the suitability of tea Result IV: Indications of adaptation strategies I
3 9.a Identification of potential diversification strategies b Suitability of potential diversification crops Suitability of Coffee (Arabica and Robusta) Suitability of Maize Suitability of Pea Suitability of Cabbage Suitability of Banana Suitability of Passion fruit Conclusions References Annex I: Suitability maps of Gianchore Tea Estate Annex II: Suitability maps of Imenti Tea Factory Annex III: Suitability maps of Kaisugu Tea Estate Annex IV: Suitability maps of Karirana Tea Estate Annex V: Suitability maps of Mudete Tea Factory II
4 Table of figures Figure 1: Study zone and Kenya s tea growing areas...3 Figure 2: Climate trend summary 2020 and 2050 for sample sites...7 Figure 3: Mean annual precipitation change by 2020 for 16 tea-growing districts of Kenya....8 Figure 4: Mean annual precipitation change by 2050 for 16 tea-growing districts of Kenya....9 Figure 5: Mean annual temperature change by 2020 for 16 tea-growing districts of Kenya....9 Figure 6: Mean annual temperature change by 2050 for 16 tea-growing districts of Kenya Figure 7: Current suitability for tea production within tea-growing districts of Kenya Figure 8: Suitability for tea production in Figure 9: Suitability for tea production in Figure 10: Mean coefficient of variance of bioclimatic variables in 2020 and Figure 11: Suitability change for tea production in Figure 12: Suitability change for tea production in Figure 13: Measure of agreement of models predicting changes in the same direction as the average of all models at a given location for 2020 and Figure 14: The relation between the suitability of areas for tea production and altitude for current climates, and predicted for 2020 and 2050 in Kenya Figure 15: Suitability change of Arabica coffee Figure 16: Suitability change of Robusta coffee Figure 17: Suitability change of maize Figure 18: Suitability change of pea Figure 19: Suitability change of cabbage Figure 20: Suitability change of banana Figure 21: Suitability change of passion fruit III
5 Table of tables Table 1: Contribution of different bioclimatic variables to the predicted shift in suitability for tea in Kenya, between the present and the 2020s, separating locations with decreasing and increasing suitability a Table 2: Contribution of different bioclimatic variables to the predicted shift in suitability for tea in Kenya, between the present and the 2050s, separating locations with decreasing and increasing suitability a Table 3: Comparison of suitability change of tea and diversification crops on 85 tea growing factories in Kenya IV
6 Index of Acronyms BIOCLIM CIAT CV DAPA ECOCROP ESG ETP FAO GARP GBIF GCM GHCN GIZ GPS IPCC Masl Maxent Bioclimatic Analysis and Prediction System International Center for Tropical Agriculture Coefficient of Variation Decision and Policy Analysis The Crop Environmental Requirements Database Earth System Grid Ethical Tea Partnership Food and Agriculture Organization Genetic Algorithm for Rule-set Production Global Biodiversity Information Facility Global Circulation Model Global Historical Climatology Network German International Cooperation Global Position System Inter-governmental Panel on Climate Change Meters above Sea Level Maximum entropy NWP Numerical Weather Prediction R-HYdroNET A Regional, Electronic Hydrmeteorological Data Network (for Latin America and the Caribbean) SPAM SRES SRTM WMO Spatial Production Allocation Model Special Report on Emissions Scenarios Shuttle Radar Topographic Mission World Meteorological Organization V
7 1 Authors and contact details The analyses presented here were conducted by the Decision and Policy Analyses group (DAPA) at CIAT under the leadership of Anton Eitzinger, with the collaboration of Peter Läderach, Audberto Quiroga, Antonio Pantoja and Jason Gordon. For further information please contact: Dr. Peter Laderach or Anton Eitzinger International Center for Tropical Agriculture (CIAT) A.A. 6713, Cali Colombia and 2 Executive summary This document reports on the methods and results of a consultancy with the title Future Climate Scenarios for Kenya s Tea Growing Areas conducted for the Ethical Tea Partnership (ETP) and German International Cooperation GIZ. The methodology applied was based on the combination of current climate data with future climate change predictions from 20 models for 2020 and The data of the current climate and the climate change was used as input to Maxent, a crop prediction model. The evidence data used for Maxent were collected by GPS through field work in Kenya. The analysis focused on the specific municipalities that were of interest to the client and provided predictions of the future climate and predictions of the suitability of current tea-growing areas to continue growing tea by 2020 and The results show that the change in suitability as climate change occurs is site-specific. There will be areas that become unsuitable for tea (Nandi, Kericho, Gucha), where farmers will need to identify alternative crops. There will be areas that remain suitable for tea (Bomet, Kisii, Nyamira), but only when the farmers adapt their agronomic management to the new conditions the area will experience. There will be areas where suitability of tea increases (Meru, Embu, Kirinyaga, Nyeri, Murangá, Kiambu). Finally, there will be areas where today no tea is grown but which in the future will become suitable (especially higher altitudes around Mount Kenya). However many of these latter areas are usually protected areas and it is not recommended to clear forest or invade protected areas in order to produce tea. Climate change brings not only bad news but also a lot of potential. The winners will be those who are prepared for change and know how to adapt. In Kenya the yearly and monthly rainfall will increase and the yearly and monthly minimum and maximum temperatures will increase moderately by 2020 and will continue to increase by progressively The overall climate will become less seasonal in terms of variation throughout the year with temperature in specific districts increasing by about 1 ºC by 2020 and 2.3 ºC by 2050 and more seasonal in precipitation with the maximum number of cumulative dry month staying constant at 3 months. The implications are that the distribution of suitability s within the current tea-growing areas in Kenya for 1
8 tea production in general will decrease quite seriously by The suitable areas will migrate up the altitudinal gradient. Areas that retain some suitability will see decreases to between 35 and 55%, compared with today s suitability of 60-80%. The optimum tea-producing zone is currently at an altitude between meters above sea level (masl) and, by 2050, will increase to an altitude between masl. Increasing altitude compensates for the increase in temperature. Compared with today, by 2050 areas at altitudes between masl will suffer the highest decrease in suitability and the areas around 2300 masl the highest increase in suitability. A comparison of potential diversification crops recommended by the project show that coffee performs similar to tea and would not be a good alternative crop. For more than 90% of these sites maize and cabbage will remain constant and pea will be much more suitable on 97% of this sites. Passion fruit will be much more suitable on 51% of these sites and banana on 14% of these sites more suitable for Project Background and Objectives The Ethical Tea Partnership (ETP) and the German International Cooperation (GIZ) aim to increase Kenyan tea producers resilience to climate change, to secure their future livelihoods and make these livelihoods more environmentally and economically sustainable. In order to achieve this, the two partners have formed a 3-year Public-Private Partnership, which will train approximately 10,000 vulnerable Kenyan farmers on the most appropriate adaptation techniques. The objectives of this study is to develop future climate scenarios indicating the adaptability/suitability of tea under changing climatic conditions for Kenya s tea growing zones, and indicating potentials for alternative crops suitable under predicted climate change. Currently the tea growing areas in Kenya are in the following districts: Bomet, Embu, Kakamega, Kericho, Kiambu, Kirinyaga, Kisii, Meru, Murang'a, Nakuru, Nandi, Nithi, Nyamira, Nyeri, Trans-Nzoia and Vihiga 2

9 Figure 1: Study zone and Kenya s tea growing areas 4 Key objectives To predict the change in climate for tea growing areas in Kenya To predict the impact of progressive climate change on tea suitability in Kenya To predict the impact of progressive climatic change on the most important diversification crops. 5 Methodology 5.a Current climate As current climate (baseline) we used historical climate data from database (Hijmans et al., 2005). The WorldClim data are generated through interpolation of average monthly climate data from weather stations on a 30 arc-second resolution grid (often referred to as "1 km" resolution). Variables included are monthly total precipitation, and monthly mean, minimum and maximum temperature, and 19 bioclimatic variables (Hijmans et al., 2005a). 3
10 In the WorldClim database, climate layers were interpolated using: Major climate databases compiled by the Global Historical Climatology Network (GHCN), the FAO, the WMO, the International Center for Tropical Agriculture (CIAT), R-HYdronet, and a number of additional minor databases for Australia, New Zealand, the Nordic European Countries, Ecuador, Peru, Bolivia, amongst others. The SRTM elevation database (aggregated to 30 arc-seconds, "1 km") The ANUSPLIN software. ANUSPLIN is a program for interpolating noisy multi-variate data using thin plate smoothing splines. We used latitude, longitude, and elevation as independent variables. For stations for which there were records for multiple years, the averages were calculated for the period. Only records for which there were at least 10 years of data were used. In some cases the time period was extended to the period to include records from areas for which there were few recent records available (e.g., Democratic Republic of the Congo) or predominantly recent records (e.g., Amazonia). After removing stations with errors, the database consisted of precipitation records from 47,554 locations, mean temperature from 24,542 locations, and minimum and maximum temperature for 14,835 locations. The data on which WorldClim is based in Kenya are from 736 stations with precipitation data, 708 stations with mean temperature, and 61 stations with minimum and maximum temperatures. Bioclimatic variables Within the WorldClim database, there are bioclimatic variables that were derived from the monthly temperature and rainfall values to generate more biologically meaningful variables, which are often used in ecological niche modeling (e.g., BIOCLIM, GARP). The bioclimatic variables represent annual trends (e.g., mean annual temperature, annual precipitation) seasonality (e.g., annual range in temperature and precipitation) and extreme or limiting environmental factors (e.g., temperature of the coldest and warmest month, and precipitation of the wettest and driest quarters). A quarter is a period of three months (1/4 of the year). The derived bioclimatic variables are: Bio1 = Annual Mean Temperature Bio2 = Mean Diurnal Range (Mean of monthly (max temp - min temp)) Bio3 = Isothermality (Bio2/Bio7) (* 100) Bio4 = Temperature Seasonality (standard deviation *100) Bio5 = Maximum Temperature of Warmest Month Bio6 = Minimum Temperature of Coldest Month Bio7 = Temperature Annual Range (Bio5 Bi06) Bio8 = Mean Temperature of Wettest Quarter Bio9 = Mean Temperature of Driest Quarter Bio10 = Mean Temperature of Warmest Quarter 4
11 Bio11 = Mean Temperature of Coldest Quarter Bio12 = Annual Precipitation Bio13 = Precipitation of Wettest Month Bio14 = Precipitation of Driest Month Bio15 = Precipitation Seasonality (Coefficient of Variation) Bio16 = Precipitation of Wettest Quarter Bio17 = Precipitation of Driest Quarter Bio18 = Precipitation of Warmest Quarter Bio19 = Precipitation of Coldest Quarter 5.b Future climate Global circulation models A global circulation model (GCM) is a computer-based model that calculates and predicts what climate patterns will be in a number of years in the future. GCMs use equations of motion as a numerical weather prediction (NWP) model, with the purpose of numerically simulating changes in the climate as a result of slow changes in some boundary conditions (such as the solar constant) or physical parameters (such as the concentration of greenhouse gases). The model focuses on each grid cell and the transfer of energy between grid cells. Once the simulation is calculated a number of climate patterns can be determined; from ocean and wind currents to patterns in precipitation and rates of evaporation that affect, for example, lake-levels and growth of agricultural plants. The GCMs are run in a number of specialized computer laboratories around the world. We used data in our analyses from these laboratories. Generation of predictions for future climate The Intergovernmental Panel on Climate Change (IPCC) Fourth Assessment Report was based on the results of 21 global climate models (GCMs), data for which are available through an IPCC interface, or directly from the institutions that developed each individual model. The spatial resolution of the GCM results is inappropriate for analyzing the impacts on agriculture as in almost all cases the grid cells measure more than 100 km a side. This is especially a problem in heterogeneous landscapes such as highly mountainous areas, where, in some places, one cell can cover the entire width of the range. Downscaling is therefore needed to provide higher-resolution surfaces of expected future climates if the likely impacts of climate change on agriculture are to be more accurately forecast. We used a simple downscaling method (named delta method), based on the sum of interpolated anomalies to high resolution monthly climate surfaces from WorldClim (Hijmans et al., 2005a). The method, basically, produces a smoothed (interpolated) surface of changes in climates (deltas or anomalies) and then applies this interpolated surface to the baseline climate (from WorldClim), taking into account the possible bias due to the difference in baselines. The method assumes that changes in climates are only relevant at coarse scales, and that relationships between variables are maintained towards the future (Ramirez and Jarvis, 2010). CIAT downloaded the data from the Earth System Grid (ESG) data portal and applied the downscaling method on over 19 GCMs from the IPCC Fourth Assessment Report (2007) for the emission scenario 5
12 SRES-A2 and for 2 different 30 year running mean periods (i.e [2020s], [2050s]). Each dataset (SRES scenario GCM time slice) comprises 4 variables at a monthly time-step (mean, maximum, minimum temperature, and total precipitation), on a spatial resolution of 30 arc-seconds (Ramirez and Jarvis, 2010). 5.c Crop prediction Maximum Entropy Maximum entropy (MAXENT) is a general-purpose method for making predictions or inferences from incomplete information. The idea is to estimate a target probability distribution by finding the probability distribution of maximum entropy, subject to a set of constraints that represent (one s) incomplete information about the target distribution. The information available about the target distribution often presents itself as a set of real-valued variables, called features, and the constraints are that the expected value of each feature should match its empirical average - average value for a set of sample points taken from the target distribution (Phillips et al., 2006 pg234). Similar to logistic regression, MAXENT weights each environmental variable by a constant. The probability distribution is the sum of each weighed variable divided by a scaling constant to ensure that the probability value ranges from 0 to 1. The program starts with a uniform probability distribution and iteratively alters one weight at a time to maximize the likelihood of reaching the optimum probability distribution. MAXENT is generally considered to be the most accurate model (Elith et al., 2006). Ecocrop For most of the crops that are not staples or commodity crops there is a lack of detailed information. Hijmans et al., (2005b) have developed a mechanistic model based on the Ecocrop database (FAO, 1998 available at to spatially predict crop suitability without having prior knowledge or data available. The model essentially uses minimum, maximum, and mean monthly temperatures, and total monthly rainfall to determine a suitability index based on each parameter separately (i.e. temperature, rainfall), to finally determine an overall suitability rating (from 0 to 100) by multiplying both temperature and rainfall indices. Ecocorp does not require any coordinates or ground data and is therefore rather generic. To improve the results we use existing knowledge of geographic crop distribution such as the Spatial Production Allocation Model (SPAM), the Global Biodiversity Information Facility (GBIF), CIAT own databases and expert knowledge gathered on the ground. With a minimum of geo-referenced sample sites gathered across the different sources we re-calculated the environmental factor ranges to improve the model. GPS-coordinates of the Kenyan tea growing sample sites are supplied by the project partners. 5.d Measure of confidence Future crop suitability is predicted using each of the GCM models via Ecocrop algorithms described above. Two measurements of uncertainty are computed: (1) the agreement among models calculated as percentage of models predicting changes in the same direction as the average of all models at a given location and (2) the coefficient of variation (CV) among models. After initial runs, models that are significantly different from those of the other models according to Tukey s (1977) outlier test will be removed from further analysis. 6

13 5.e Environmental factors driving change in suitability In order to understand the relative importance of different climatic drivers, we then carried out a forward, step-wise regression analysis with the suitability shift per data point as the dependent variable and the model-average changes in the bioclimatic variables between the present and future as the independent variables, and calculating the relative contribution of each variable to the total predicted suitability shift in terms of the proportion of R-square explained when adding each variable to the linear regression model. This analysis was carried out separately for the data points showing positive and negative shifts in suitability. 6 Result I: Climate change summary of tea production sites 6.a The summary climate characteristics for all tea factory sites in Kenya Figure 2: Climate trend summary 2020 and 2050 for sample sites General climatic characteristics Rainfall increases from 1658 millimeters to 1732 millimeters in 2050 passing through 1694 in 2020 Temperatures increase and the average increase is 2.3 ºC passing through an increment of 1.0 ºC in 2020 The mean daily temperature range keeps constant on 14.8 ºC in 2050 The maximum number of cumulative dry months keep constant in 3 months 7
14 Extreme conditions The maximum temperature of the year increases from 26.6 ºC to 29 ºC while the warmest quarter gets hotter by 2.3 ºC in 2050 The minimum temperature of the year increases from 8.9 ºC to 11.1 ºC while the coldest quarter gets hotter by 2.5 ºC in 2050 The wettest month gets wetter with 308 millimeters instead of 304 millimeters, while the wettest quarter gets wetter by 20 mm in 2050 The driest month stays constant with around 58 millimeters while the driest quarter gets wetter by 13 mm in 2050 Climate Seasonality Overall this climate becomes less seasonal as it relates to temperature and precipitation variability through-out the year Variability between models The coefficient of variation of temperature predictions between models is 5% Temperature predictions were uniform between models and thus no outliers were detected The coefficient of variation of precipitation predictions between models is 4.6% Precipitation predictions were uniform between models and thus no outliers were detected 6.b Regional changes in the mean annual precipitation (2020) Figure 3: Mean annual precipitation change by 2020 for 16 tea-growing districts of Kenya. The edges of the boxes indicate the mean maximum and mean minimum values and the ends of the line the maximum and minimum values. The mean maximum and mean minimum values are defined by the mean + or the standard deviation. The mean annual precipitation increases in 2020 on average by 36 mm and in 2050 by 74 mm. In 2020 the districts Meru and Nithi will have larger increase in precipitation than others (Figure 3) and in
15 Kisii and Nyamira will have the largest increase (Figure 4). We observed the smallest increase in precipitation for 2020 in Kakamega and in 2050 in Embu, Meru, Kirinyaga and Nithi. 6.c Regional changes in the mean annual precipitation (2050) Figure 4: Mean annual precipitation change by 2050 for 16 tea-growing districts of Kenya. The edges of the boxes indicate the mean maximum and mean minimum values and the ends of the line the maximum and minimum values. The mean maximum and mean minimum values are defined by the mean + or the standard deviation. 6.d Regional changes in the mean annual temperature (2020) Figure 5: Mean annual temperature change by 2020 for 16 tea-growing districts of Kenya. 9
16 The edges of the boxes indicate the mean maximum and mean minimum values and the ends of the line the maximum and minimum values. The mean maximum and mean minimum values are defined by the mean + or the standard deviation. The mean annual temperature will increase progressively. The increase by 2050 is between 2.1 and 2.2 ºC (Figures 6) and for 2020 between 0.7 and 0.9 ºC (Figures 5). 6.e Regional changes in the mean annual temperature (2050) Figure 6: Mean annual temperature change by 2050 for 16 tea-growing districts of Kenya. The edges of the boxes indicate the mean maximum and mean minimum values and the ends of the line the maximum and minimum values. The mean maximum and mean minimum values are defined by the mean + or the standard deviation. 10
.")
17 7 Result II: Suitability maps of tea production areas 7.a Current suitability of tea production areas Figure 7: Current suitability for tea production within tea-growing districts of Kenya. Currently, the main tea-producing areas in Kenya are located in the central region around Mount Kenya and between the Rift Valley and Nyanza in the west (Figure 7). According to the MAXENT model, the most suitable of them are concentrated in the higher areas of districts: Meru, Embu, Kirinyaga, Nyeri, Murangá, Kiambu, Kisii, Nyamira, Kericho, Bomet, Narok, Migori. The remaining districts are in general rather less suitable. Find more detailed maps of current and future tea suitability in focal regions in Annex I to V. 11

18 7.b Future suitability of tea production areas Figure 8: Suitability for tea production in Figure 9: Suitability for tea production in


. Figure 10: Mean coefficient of variance of bioclimatic variables in 2020 and 2050. 7.")
19 In 2020 suitable areas start shifting but the average suitability in all districts remains nearly constant (Figure 8). We assume that most areas will still be suitable enough to grow tea under similar climate conditions. In 2050 tea production according to its climate-suitability is predicted to be more concentrated in Central Kenya (Figure 9). In this region, areas with high suitable will expand. The western region in general is anticipated to have a lower suitability level. The coefficient of variance (CV) for 2020 and 2050 bioclimatic variables ranges between 0 and 15%, even lower for tea-growing areas and may therefore be accepted as reliable (Figure 10). Figure 10: Mean coefficient of variance of bioclimatic variables in 2020 and c Suitability change of tea production areas Figure 11: Suitability change for tea production in
. In 2050, suitability of tea growing decreases quite seriously in the western parts (Figure 12).")

 can be observed in Nandi district.")
20 While in the western area near Nandi the suitability of tea shows a slight decrease by 2020, some areas, especially in Central region and some parts of Rift valley are gaining suitability (Figure 11). In 2050, suitability of tea growing decreases quite seriously in the western parts (Figure 12). The average suitability of these areas decreases between 25 and 40%, whereas today they have suitability of 60-70%. Areas around Mount Kenya still remain on high suitability to climate in While there is a general shift to higher altitudes, those gaining areas increase suitability by around 15 to 20%. The most significant loss of suitability (up to -40%) can be observed in Nandi district. The measure of agreement of models predicting changes in the same direction as the average of all models at a given location is between 70% - 100% in tea growing areas (Figure 13). Figure 12: Suitability change for tea production in

21 Figure 13: Measure of agreement of models predicting changes in the same direction as the average of all models at a given location for 2020 and Figure 14: The relation between the suitability of areas for tea production and altitude for current climates, and predicted for 2020 and 2050 in Kenya. With progressive climate change, areas at higher altitudes benefit on tea-suitability (Figure 14). Altitude was not used in the suitability modeling and is therefore independent of the other variables. Altitude is however very much correlated with temperature-related variables. The optimum tea-producing zone is currently at an altitude between 1500 and 2100 masl and will by 2050 increase to an altitude between 2000 and 2300 masl. Compared with today, by 2050 areas at altitudes between 1400 and 2000 masl will suffer the highest decrease in suitability and the areas around 2300 masl the highest increase in suitability (Figure 14). 15
22 8 Result III: Environmental factors which drive the suitability of tea The regression analysis identifies primarily the bioclimatic variables related to precipitation increase and general increasing temperature as drivers of the predicted suitability shifts. The increases of precipitation and min temperature during the cold season together with Isothermality (quantification of how large the day-to-night temperature oscillation is in comparison to the summer-towinter oscillation) explain 97.5% of decreasing suitability for The 45% of observed locations with increasing suitability for 2020 are influenced by increasing precipitation during the wet season and a general annual and precipitation increase (Table 1). Table 1: Contribution of different bioclimatic variables to the predicted shift in suitability for tea in Kenya, between the present and the 2020s, separating locations with decreasing and increasing suitability a Variable Adjusted R2 R2 due to variable % of total variability Present mean Change by 2020s Locations with decreasing suitability (n=61, 55 % of all observations) BIO 19 Precipitation of coldest quarter mm + 31 mm BIO 03 Isothermality BIO 06 Min temperature of coldest month C C others Locations with constant or increasing suitability (n=50, 45 % of all observations) BIO 16 Precipitation of wettest quarter mm + 12 mm BIO 12 Annual precipitation mm + 41 mm BIO 01 Annual mean temperature C C BIO 17 Precipitation of driest quarter mm + 5 mm BIO 19 Precipitation of coldest quarter mm + 1 mm BIO 08 Mean temperature of wettest quarter C C others a Variables explaining less than 4% of total variability are not listed. The regression analysis for changes in suitability on observed sample points for 2050 describes temperature seasonality as main driving factor for negative suitability change (Table 2). Increasing precipitations explain 89.9% of positive suitability change for 22.5% of observed points. 16
23 Table 2: Contribution of different bioclimatic variables to the predicted shift in suitability for tea in Kenya, between the present and the 2050s, separating locations with decreasing and increasing suitability a. Variable Adjusted R2 R2 due to variable % of total variability Present mean Change by 2050s Locations with decreasing suitability (n=86, 77.5% of all observations) BIO 04 Temperature seasonality BIO 16 Precipitation of wettest quarter mm + 24 mm BIO 18 Precipitation of warmest quarter mm + 35 mm BIO 03 Isothermality BIO 19 Precipitation of coldest quarter mm + 47 mm BIO 09 Mean temperature od friest quarter C C BIO 13 Precipitation of wettest month mm + 7 mm others Locations with constant or increasing suitability (n=25, 22.5% of all observations) BIO 18 Precipitation of warmest quarter mm + 7 mm BIO 12 Annual precipitation mm + 69 mm BIO 01 Annual mean temperature C C BIO 03 Isothermality others a Variables explaining less than 4% of total variability are not listed. 9 Result IV: Indications of adaptation strategies 9.a Identification of potential diversification strategies To address potential diversification strategies for tea farms affected by progressive climate change on their tea production we identified six crops 1 : - Maize - Pea (pigeon variety) - Cabbage 1 In this work just crops were analyzed. Beyond that, dairy cow and dairy goats are potential diversification enterprises for tea farmers in Kenya. 17

24 - Banana - Passion fruit - Coffee (Arabica and Robusta) Because of a lack of detailed information from GPS ground data suitability of alternative crops, except coffee, were calculated using a mechanistic model based on the Ecocrop database. We improved the model by using existing knowledge of geographic crop distribution and calibrated the input-values on a regional scale. Suitability for coffee comes from previous CIAT work in Kenya, Climate Change Adaptation and Mitigation in the Kenyan Coffee Sector (Laderach et al., 2010), and was calculated same as tea by using the MaxEnt approach. 9.b Suitability of potential diversification crops Suitability of Coffee (Arabica and Robusta) Figure 15: Suitability change of Arabica coffee. Figure 16: Suitability change of Robusta coffee. Robusta coffee has its suitable areas in lower altitudes than tea and therefore would not be a diversification crop. Therefore we analyzed Arabica coffee. 18
25 Suitability of Maize Figure 17: Suitability change of maize. While suitability of maize (Figure 16) and cabbage (Figure 18) remains constant, Arabica coffee is losing most of its suitability in the same areas as tea by 2050 (Figure 15). Pea performs quite well on predicted changes (Figure 17) in general but especially in tea-growing regions, whereas banana has its suitable areas in lower altitudes than tea (Figure 19) and results of increasing passion-fruit suitability-change match with areas where tea is losing its suitability (Figure 20). Suitability of Pea Figure 18: Suitability change of pea. 19


26 Suitability of Cabbage Figure 19: Suitability change of cabbage. Suitability of Banana Figure 20: Suitability change of banana. Suitability of Passion fruit Figure 21: Suitability change of passion fruit. 20
 performs similar (even worse) to tea and would not be a good alternative crop to tea.")
27 Table 3: Comparison of suitability change of tea and diversification crops on 85 tea growing factories in Kenya Table 3 compares suitability change for tea growing factories and their potential for diversification into other crops. As mentioned above coffee (arabica) performs similar (even worse) to tea and would not be a good alternative crop to tea. While on 42% of all tea factory sites suitability of tea is predicted to be much less for 2050, on 97% of these sites suitability of coffee will be also much less, for more than 90% of these sites maize and cabbage will remain constant and pea will be much more suitable on 97% of this sites. Passion-fruit will be much more suitable on 51% of these sites and banana on 14% of these sites more suitable for
28 10 Conclusions In Kenya the yearly and monthly rainfall will increase and the yearly and monthly minimum and maximum temperatures will increase by 2020 and will continue to increase progressively by The implications are that the distribution of suitability within the current tea-growing areas in Kenya for tea production in general will decrease quite seriously by The optimum tea-producing zone is currently at an altitude between 1500 and 2100 masl and will by 2050 increase to an altitude between 2000 and 2300 masl. Compared with today, by 2050 areas at altitudes between 1400 and 2000 masl will suffer the highest decrease in suitability and the areas around 2300 masl the highest increase in suitability. A comparison of potential diversification crops recommended by the project shows that coffee performs similar to tea and would not be a good alternative crop. For more than 90% of these sites maize and cabbage will remain constant and pea will be much more suitable on 97% of these sites. Passion fruit will be much more suitable on 51% of these sites and banana will be more suitable on 14% of these sites for References Elith, J., Graham, C.H., Anderson, R.P., Dudík, M., Ferrier, S., Guisan, A., Hijmans, R.J., Huettmann, F., Leathwick, R., Lehmann, A., Li, J., Lohmann, L.G., Loiselle, B.A., Manion, G., Moritz, C., Nakamura, M., Nakazawa,Y., Overton, J.McC., Peterson, A.T., Phillips, J., Richardson, K., Scachetti-Pereira, R., Schapire, E., Soberon, J., Williams, S., Wisz, M., Zimmermann, E Novel methods improve prediction of species' distributions from occurrence data. Ecography 29: Hijmans, R.J., S.E. Cameron, J.L. Parra, P.G. Jones, and A. Jarvis. 2005a. Very high resolution interpolated climate surfaces for global land areas. International Journal of Climatology 25:1965. Hijmans, R.J., L. Guarino, A. Jarvis, R. O'Brien, P. Mathur, C. Bussink, M. Cruz, I. Barrantes, and E. Rojas. 2005b. DIVA-GIS Version 5.2, Manual. Laderach, P., A. Eitzinger, O. Ovalle, J. Ramírez and A. Jarvis Climate Change Adaptation and Mitigation in the Kenyan Coffee. Final report. Phillips, S.J., R.P. Anderson, and R.E. Schapire Maximum entropy modeling of species geographic distributions. Ecological Modelling 190: Ramirez & Jarvis Disaggregation of Global Circulation Model Outputs. Disaggregation of Global Circulation Model Outputs. Tukey J.W. (1977) Exploratory data analysis. Addison-Wesley Publishing Co., Reading, MA. 22


29 Annex I: Suitability maps of Gianchore Tea Estate 23


30 Annex II: Suitability maps of Imenti Tea Factory 24

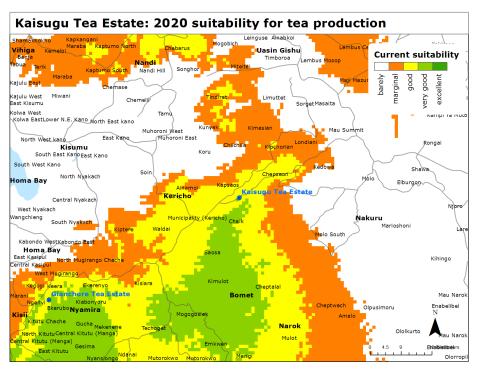
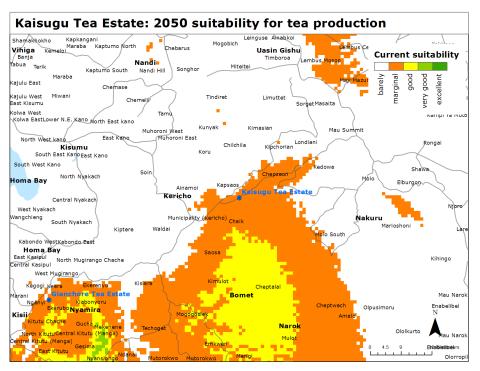
31 Annex III: Suitability maps of Kaisugu Tea Estate 25


32 Annex IV: Suitability maps of Karirana Tea Estate 26


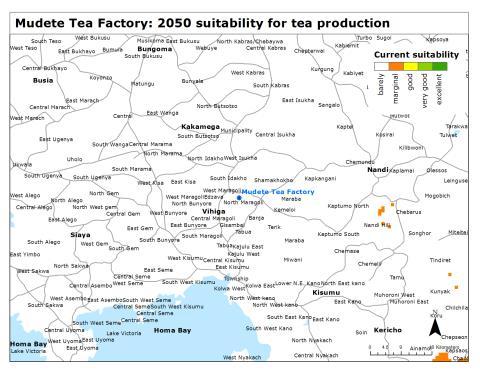
33 Annex V: Suitability maps of Mudete Tea Factory 27
Tropentag 2009 University of Hamburg, October 6-8, 2009
 Tropentag 2009 University of Hamburg, October 6-8, 2009 Conference on International Research on Food Security, Natural Resource Management and Rural Development The implications of climate change on Mesoamerican
Future Climate Scenarios for Tanzania s Arabica Coffee Growing Areas. Final report Cali, Colombia: October 2012
 Future Climate Scenarios for Tanzania s Arabica Coffee Growing Areas Final report Cali, Colombia: October 2012 Table of Contents 1 Authors and contact details... 1 2 Executive summary... 1 3 Project Background
SC 75/ September Original: English. Statistics Committee 13 th Meeting
 SC 75/17 20 September 2017 Original: English E Statistics Committee 13 th Meeting 26 September 2017 Yamoussoukro, Côte d Ivoire Advances in coffee economics: Recent studies on the impact of climate change
Coffee and climate change. Effectively guiding forward looking climate change adaptation of global coffee supply chains
 Coffee and climate change Effectively guiding forward looking climate change adaptation of global coffee supply chains The future of coffee production The future of coffee production Picture: N. Palmer
Regression Models for Saffron Yields in Iran
 Regression Models for Saffron ields in Iran Sanaeinejad, S.H., Hosseini, S.N 1 Faculty of Agriculture, Ferdowsi University of Mashhad, Iran sanaei_h@yahoo.co.uk, nasir_nbm@yahoo.com, Abstract: Saffron
IMPACT OF RAINFALL AND TEMPERATURE ON TEA PRODUCTION IN UNDIVIDED SIVASAGAR DISTRICT
 International Journal of Agricultural Science and Research (IJASR) ISSN (P): 2250-0057; ISSN (E): 2321-0087 Vol. 8, Issue 1 Feb 2018, 51-56 TJPRC Pvt. Ltd. IMPACT OF RAINFALL AND TEMPERATURE ON TEA PRODUCTION
Chapter 42 Predicted Impact of Climate Change on Coffee Supply Chains
 Chapter 42 Predicted Impact of Climate Change on Coffee Supply Chains Peter Laderach, Mark Lundy, Andy Jarvis, Julian Ramirez, Emiliano Perez Portilla, Kathleen Schepp, and Anton Eitzinger Abstract Global
Wine-Tasting by Numbers: Using Binary Logistic Regression to Reveal the Preferences of Experts
 Wine-Tasting by Numbers: Using Binary Logistic Regression to Reveal the Preferences of Experts When you need to understand situations that seem to defy data analysis, you may be able to use techniques
Statistics & Agric.Economics Deptt., Tocklai Experimental Station, Tea Research Association, Jorhat , Assam. ABSTRACT
 Two and a Bud 59(2):152-156, 2012 RESEARCH PAPER Global tea production and export trend with special reference to India Prasanna Kumar Bordoloi Statistics & Agric.Economics Deptt., Tocklai Experimental
Supporting information Table S1. The native and invasive ranges of 10 study aquatic plant invaders
 Supporting information Table S1. The native and invasive ranges of 10 study aquatic plant invaders Name Family Native ranges Invasive ranges Alternanthera philoxeroides Amaranthaceae Argentina, Bolivia,
ICC September 2018 Original: English. Emerging coffee markets: South and East Asia
 ICC 122-6 7 September 2018 Original: English E International Coffee Council 122 st Session 17 21 September 2018 London, UK Emerging coffee markets: South and East Asia Background 1. In accordance with
Decision making with incomplete information Some new developments. Rudolf Vetschera University of Vienna. Tamkang University May 15, 2017
 Decision making with incomplete information Some new developments Rudolf Vetschera University of Vienna Tamkang University May 15, 2017 Agenda Problem description Overview of methods Single parameter approaches
AJAE Appendix: Testing Household-Specific Explanations for the Inverse Productivity Relationship
 AJAE Appendix: Testing Household-Specific Explanations for the Inverse Productivity Relationship Juliano Assunção Department of Economics PUC-Rio Luis H. B. Braido Graduate School of Economics Getulio
COFFEE YIELD VARIATIONS AND THEIR RELATIONS TO RAINFALL EVENTS IN NICARAGUA
 PA 254 COFFEE YIELD VARIATIONS AND THEIR RELATIONS TO RAINFALL EVENTS IN NICARAGUA LARA, Leonel 1,2 *, HAGGAR, Jeremy 3, STOIAN, Dietmar 1, RAPIDEL, Bruno 1,4 1 2 Research Unit Sustainability and Global
Fleurieu zone (other)
") Fleurieu zone (other) Incorporating Southern Fleurieu and Kangaroo Island wine regions, as well as the remainder of the Fleurieu zone outside all GI regions Regional summary report 2006 South Australian
Fleurieu zone (other) Incorporating Southern Fleurieu and Kangaroo Island wine regions, as well as the remainder of the Fleurieu zone outside all GI regions Regional summary report 2006 South Australian
Investment Wines. - Risk Analysis. Prepared by: Michael Shortell & Adiam Woldetensae Date: 06/09/2015
 Investment Wines - Risk Analysis Prepared by: Michael Shortell & Adiam Woldetensae Date: 06/09/2015 Purpose Look at investment wines & examine factors that affect wine prices over time We will identify
Coffee weather report November 10, 2017.
 Coffee weather report November 10, 2017. awhere, Inc., an agricultural intelligence company, is pleased to provide this map-and-chart heavy report focused on the current coffee crop in Brazil. Global stocks
Climate change may alter human physical activity patterns
 In the format provided by the authors and unedited. SUPPLEMENTARY INFORMATION VOLUME: 1 ARTICLE NUMBER: 0097 Climate change may alter human physical activity patterns Nick Obradovich and James H. Fowler
SPATIAL-TEMPORAL ANALYSIS OF CLIMATE CHANGE AND INFLUENCE OF MEDITERRANEAN SEA ON VITICULTURE SITE VALENCIA DO
 SPATIAL-TEMPORAL ANALYSIS OF CLIMATE CHANGE AND INFLUENCE OF MEDITERRANEAN SEA ON VITICULTURE SITE VALENCIA DO Speaker: Igor Sirnik Supervisors: Hervé Quénol (Université Rennes 2, France), Miguel Ángel
Business opportunities and challenges of mainstreaming biodiversity into the agricultural sector
 Business opportunities and challenges of mainstreaming biodiversity into the agricultural sector Mainstreaming biodiversity into the agricultural sector what does this mean? Cultural service Regulating
EXECUTIVE SUMMARY OVERALL, WE FOUND THAT:
 THE ECONOMIC IMPACT OF CRAFT BREWERIES IN LOS ANGELES LA s craft brewing industry generates short-term economic impacts through large capital investments, equipment purchases, and the construction of new
DERIVED DEMAND FOR FRESH CHEESE PRODUCTS IMPORTED INTO JAPAN
 PBTC 05-04 PBTC 02-6 DERIVED DEMAND FOR FRESH CHEESE PRODUCTS IMPORTED INTO JAPAN By Andreas P. Christou, Richard L. Kilmer, James A. Stearns, Shiferaw T. Feleke, & Jiaoju Ge PBTC 05-04 September 2005
AWRI Refrigeration Demand Calculator
 AWRI Refrigeration Demand Calculator Resources and expertise are readily available to wine producers to manage efficient refrigeration supply and plant capacity. However, efficient management of winery
Buying Filberts On a Sample Basis
 E 55 m ^7q Buying Filberts On a Sample Basis Special Report 279 September 1969 Cooperative Extension Service c, 789/0 ite IP") 0, i mi 1910 S R e, `g,,ttsoliktill:torvti EARs srin ITQ, E,6
WP Board 1035/07. 3 August 2007 Original: English. Projects/Common Fund
 WP Board 1035/07 International Coffee Organization Organización Internacional del Café Organização Internacional do Café Organisation Internationale du Café 3 August 2007 Original: English Projects/Common
Identifying Climate Suitability for Oregon White Oak
 Introduction Identifying Climate Suitability for Oregon White Oak Lucas Rabins, Ben Larson, & Anders Dowell December 2016 As the earth s climate changes over the next century, many species adapted to specific
Analysis of Things (AoT)
") Analysis of Things (AoT) Big Data & Machine Learning Applied to Brent Crude Executive Summary Data Selecting & Visualising Data We select historical, monthly, fundamental data We check for correlations
Analysis of Things (AoT) Big Data & Machine Learning Applied to Brent Crude Executive Summary Data Selecting & Visualising Data We select historical, monthly, fundamental data We check for correlations
FACTORS DETERMINING UNITED STATES IMPORTS OF COFFEE
 12 November 1953 FACTORS DETERMINING UNITED STATES IMPORTS OF COFFEE The present paper is the first in a series which will offer analyses of the factors that account for the imports into the United States
UTZ Coffee Statistics Report 2017
 UTZ Coffee Statistics Report 2017 UTZ is the largest certification program in the world for sustainable coffee More than 480,000 coffee farmers and workers benefit from the UTZ program UTZ certified coffee
Multiple Imputation for Missing Data in KLoSA
 Multiple Imputation for Missing Data in KLoSA Juwon Song Korea University and UCLA Contents 1. Missing Data and Missing Data Mechanisms 2. Imputation 3. Missing Data and Multiple Imputation in Baseline
Uniform Rules Update Final EIR APPENDIX 6 ASSUMPTIONS AND CALCULATIONS USED FOR ESTIMATING TRAFFIC VOLUMES
 APPENDIX 6 ASSUMPTIONS AND CALCULATIONS USED FOR ESTIMATING TRAFFIC VOLUMES ASSUMPTIONS AND CALCULATIONS USED FOR ESTIMATING TRAFFIC VOLUMES This appendix contains the assumptions that have been applied
HONDURAS. A Quick Scan on Improving the Economic Viability of Coffee Farming A QUICK SCAN ON IMPROVING THE ECONOMIC VIABILITY OF COFFEE FARMING
 HONDURAS A Quick Scan on Improving the Economic Viability of Coffee Farming 1 OBJECTIVES OF STUDY Overall objective Identify opportunities for potential benefits to coffee farmers from improved farm profitability
Business Opportunities in Natural Capital Cases of Public-Private-non Profit Partnership for Conservation of Critical Natural Capital
 Business Opportunities in Natural Capital Cases of Public-Private-non Profit Partnership for Conservation of Critical Natural Capital To demonstrate and amplify sustainable development models by conserving
Temperature effect on pollen germination/tube growth in apple pistils
 FINAL PROJECT REPORT Project Title: Temperature effect on pollen germination/tube growth in apple pistils PI: Dr. Keith Yoder Co-PI(): Dr. Rongcai Yuan Organization: Va. Tech Organization: Va. Tech Telephone/email:
Sustainability Initiatives in Other Tropical Commodities Dr. Jean-Marc Anga Director, Economics and Statistics Division
 0 International Cocoa Organization Sustainability Initiatives in Other Tropical Commodities Dr. Jean-Marc Anga Director, Economics and Statistics Division 1 Sustainable Development 1983: Brundtland Commission
2016 China Dry Bean Historical production And Estimated planting intentions Analysis
 2016 China Dry Bean Historical production And Estimated planting intentions Analysis Performed by Fairman International Business Consulting 1 of 10 P a g e I. EXECUTIVE SUMMARY A. Overall Bean Planting
Plant root activity is limited to the soil bulbs Does not require technical expertise to. wetted by the water bottle emitter implement
 Case Study Bottle Drip Irrigation Case Study Background Data Tool Category: Adaptation on the farm Variety: Robusta Climatic Hazard: Prolonged dry spells and high temperatures Expected Outcome: Improved
Gasoline Empirical Analysis: Competition Bureau March 2005
 Gasoline Empirical Analysis: Update of Four Elements of the January 2001 Conference Board study: "The Final Fifteen Feet of Hose: The Canadian Gasoline Industry in the Year 2000" Competition Bureau March
EFFECT OF TOMATO GENETIC VARIATION ON LYE PEELING EFFICACY TOMATO SOLUTIONS JIM AND ADAM DICK SUMMARY
 EFFECT OF TOMATO GENETIC VARIATION ON LYE PEELING EFFICACY TOMATO SOLUTIONS JIM AND ADAM DICK 2013 SUMMARY Several breeding lines and hybrids were peeled in an 18% lye solution using an exposure time of
Emerging Local Food Systems in the Caribbean and Southern USA July 6, 2014
 Consumers attitudes toward consumption of two different types of juice beverages based on country of origin (local vs. imported) Presented at Emerging Local Food Systems in the Caribbean and Southern USA
Joseph G. Alfieri 1, William P. Kustas 1, John H. Prueger 2, Lynn G. McKee 1, Feng Gao 1 Lawrence E. Hipps 3, Sebastian Los 3
 Joseph G. Alfieri 1, William P. Kustas 1, John H. Prueger 2, Lynn G. McKee 1, Feng Gao 1 Lawrence E. Hipps 3, Sebastian Los 3 1 USDA, ARS, Hydrology & Remote Sensing Lab, Beltsville MD 2 USDA,ARS, National
CENTRAL AMERICA COFFEE RUST ACTION PLAN 2013 Component 1 Integrated Coffee Rust Management. LEADERS and PARTICIPANTS
 Component 1 Integrated Coffee Rust Management 1: INTEGRATED COFFE RUST MANAGEMENT 1.1 Establishment of a Regional Program of Integrated Coffee Rust Management for commonly used susceptible varieties grown
The Development of a Weather-based Crop Disaster Program
 The Development of a Weather-based Crop Disaster Program Eric Belasco Montana State University 2016 SCC-76 Conference Pensacola, FL March 19, 2016. Belasco March 2016 1 / 18 Motivation Recent efforts to
Missing value imputation in SAS: an intro to Proc MI and MIANALYZE
 Victoria SAS Users Group November 26, 2013 Missing value imputation in SAS: an intro to Proc MI and MIANALYZE Sylvain Tremblay SAS Canada Education Copyright 2010 SAS Institute Inc. All rights reserved.
Climate change and its mitigation in sustainable coffee production JOSEPH K KIMEMIA COFFEE RESEARCH INSTITUTE
 Climate change and its mitigation in sustainable coffee production JOSEPH K KIMEMIA COFFEE RESEARCH INSTITUTE Introduction Climate change is any substantial change in Earth s climate that lasts for an
Online Appendix to Voluntary Disclosure and Information Asymmetry: Evidence from the 2005 Securities Offering Reform
 Online Appendix to Voluntary Disclosure and Information Asymmetry: Evidence from the 2005 Securities Offering Reform This document contains several additional results that are untabulated but referenced
Outreach and Partnerships in the Coffee sector under the current governance
 KENYA AGRICULTURAL & LIVESTOCK RESEARCH ORGANIZATION COFFEE RESEARCH INSTITUTE Outreach and Partnerships in the Coffee sector under the current governance James Minai 1. INTRODUCTION Following the enactment
Information System Better-iS ZALF - Output
 Photos: Sieber, Uckert Information System Better-iS ZALF - Output Contact details: Leibniz-Zentrum für Agrarlandschaftsforschung (ZALF) e. V., Institute of Socio- Economics, Götz Uckert, Harry Hoffmann,
ECONOMICS OF COCONUT PRODUCTS AN ANALYTICAL STUDY. Coconut is an important tree crop with diverse end-uses, grown in many states of India.
 ECONOMICS OF COCONUT PRODUCTS AN ANALYTICAL STUDY Introduction Coconut is an important tree crop with diverse end-uses, grown in many states of India. Coconut palm is the benevolent provider of the basic
Coffee zone updating: contribution to the Agricultural Sector
 1 Coffee zone updating: contribution to the Agricultural Sector Author¹: GEOG. Graciela Romero Martinez Authors²: José Antonio Guzmán Mailing address: 131-3009, Santa Barbara of Heredia Email address:
What does radical price change and choice reveal?
 What does radical price change and choice reveal? A project by YarraValley Water and the Centre for Water Policy Management November 2016 CRICOS Provider 00115M latrobe.edu.au CRICOS Provider 00115M Objectives
MBA 503 Final Project Guidelines and Rubric
 MBA 503 Final Project Guidelines and Rubric Overview There are two summative assessments for this course. For your first assessment, you will be objectively assessed by your completion of a series of MyAccountingLab
INFLUENCE OF ENVIRONMENT - Wine evaporation from barrels By Richard M. Blazer, Enologist Sterling Vineyards Calistoga, CA
 INFLUENCE OF ENVIRONMENT - Wine evaporation from barrels By Richard M. Blazer, Enologist Sterling Vineyards Calistoga, CA Sterling Vineyards stores barrels of wine in both an air-conditioned, unheated,
Technical Memorandum: Economic Impact of the Tutankhamun and the Golden Age of the Pharoahs Exhibition
 Technical Memorandum: Economic Impact of the Tutankhamun and the Golden Age of the Pharoahs Exhibition Prepared for: The Franklin Institute Science Museum Prepared by: Urban Partners November 2007 Economic
Tea Statistics Report 2015
 Tea Statistics Report 215 Introduction This report presents the scope and scale of the UTZ tea program in 215. Throughout this report tea also includes rooibos unless otherwise specified. The statistics
Cafédirect AdapCC Wrap Report
 Cafédirect AdapCC Wrap Report 2009-2010 1 Date Publication Circulation Page Number About AdapCC - 3 AdapCC press release - 4 10.10.09 The Guardian 311,387 8 11.10.09 Oman Observer 6,973 10 12.10.09 Irish
PJ 53/ August 2013 English only. Report of the Virtual Screening Subcommittee (VSS) on three coffee project proposals
 on three coffee project proposals") PJ 53/13 15 August 2013 English only E Projects Committee 6 th Meeting 9 12 September 2013 Belo Horizonte, Brazil Report of the Virtual Screening Subcommittee (VSS) on three coffee project proposals Background
PJ 53/13 15 August 2013 English only E Projects Committee 6 th Meeting 9 12 September 2013 Belo Horizonte, Brazil Report of the Virtual Screening Subcommittee (VSS) on three coffee project proposals Background
Climate Change and Wine
 Gregory V. Jones Director: Center for Wine Education Chair: Wine Studies Professor: Environmental Studies 26-27 November, 2018 Amsterdam, Netherlands The global wine map is changing Climate change is
Quality of Canadian oilseed-type soybeans 2017
 ISSN 2560-7545 Quality of Canadian oilseed-type soybeans 2017 Bert Siemens Oilseeds Section Contact: Véronique J. Barthet Program Manager, Oilseeds Section Grain Research Laboratory Tel : 204 984-5174
Economic Contributions of the Florida Citrus Industry in and for Reduced Production
 Economic Contributions of the Florida Citrus Industry in 2014-15 and for Reduced Production Report to the Florida Department of Citrus Alan W. Hodges, Ph.D., Extension Scientist, and Thomas H. Spreen,
Using Growing Degree Hours Accumulated Thirty Days after Bloom to Help Growers Predict Difficult Fruit Sizing Years
 Using Growing Degree Hours Accumulated Thirty Days after Bloom to Help Growers Predict Difficult Fruit Sizing Years G. Lopez 1 and T. DeJong 2 1 Àrea de Tecnologia del Reg, IRTA, Lleida, Spain 2 Department
Colorado State University Viticulture and Enology. Grapevine Cold Hardiness
 Colorado State University Viticulture and Enology Grapevine Cold Hardiness Grapevine cold hardiness is dependent on multiple independent variables such as variety and clone, shoot vigor, previous season
Quality of western Canadian flaxseed 2012
 ISSN 1700-2087 Quality of western Canadian flaxseed 2012 Ann S. Puvirajah Oilseeds Contact: Ann S. Puvirajah Oilseeds Tel : 204 983-3354 Email: ann.puvirajah@grainscanada.gc.ca Fax : 204-983-0724 Grain
COMPARISON OF CORE AND PEEL SAMPLING METHODS FOR DRY MATTER MEASUREMENT IN HASS AVOCADO FRUIT
 New Zealand Avocado Growers' Association Annual Research Report 2004. 4:36 46. COMPARISON OF CORE AND PEEL SAMPLING METHODS FOR DRY MATTER MEASUREMENT IN HASS AVOCADO FRUIT J. MANDEMAKER H. A. PAK T. A.
Towards a climate change adaptation strategy for coffee communities and ecosystems in the Sierra Madre de Chiapas, Mexico
 Mitig Adapt Strateg Glob Change (2009) 14:605 625 DOI 10.1007/s11027-009-9186-5 ORIGINAL ARTICLE Towards a climate change adaptation strategy for coffee communities and ecosystems in the Sierra Madre de
COMMITTEE ON COMMODITY PROBLEMS
 August 2011 CCP:TE CRS/1 E COMMITTEE ON COMMODITY PROBLEMS INTERGOVERNMENTAL GROUP ON TEA Twentieth Session Colombo, Sri Lanka, 30 January - 1 February 2012 REPORT OF THE INTERSESSIONAL MEETING OF THE
P. Okinda Owuor; Department of Chemistry, Maseno University, Private Bag, Maseno, Kenya
 YIELD AND BLACK TEA QUALITY RESPONSES OF CLONE BBK 35 TEA TO NITROGEN FERTILIZER RATES AND HARVESTING INTERVALS IN THE LAKE VICTORIA BASIN OF KENYA P. Okinda Owuor; Department of Chemistry, Maseno University,
Shaping the Future: Production and Market Challenges
 Call for Papers Dear Sir/Madam At the invitation of the Ministry of Stockbreeding, Agriculture, and Fisheries of the Oriental Republic of Uruguay, the 41th World Congress of Vine and Wine and the 16 th
DonnishJournals
 DonnishJournals 2041-1162 Donnish Journal of Research in Environmental Studies Vol 2(2) pp. 005-017 March, 2015. http:///djres Copyright 2015 Donnish Journals Original Research Article Analysis of Links
Fromage Frais and Quark Market in Portugal: Market Profile to 2019
 Fromage Frais and Quark Market in Portugal: Market Profile to 2019 Fromage Frais and Quark Market in Portugal: Market Profile to 2019 Sector Publishing Intelligence Limited (SPi) has been marketing business
Oregon Wine Industry Sustainable Showcase. Gregory V. Jones
 Oregon Wine Industry Sustainable Showcase Gregory V. Jones Panel Framework Oregon wineries and vineyards are implementing innovative sustainability and environmental practices across the entire system
Rail Haverhill Viability Study
 Rail Haverhill Viability Study The Greater Cambridge City Deal commissioned and recently published a Cambridge to Haverhill Corridor viability report. http://www4.cambridgeshire.gov.uk/citydeal/info/2/transport/1/transport_consultations/8
The Sources of Risk Spillovers among REITs: Asset Similarities and Regional Proximity
 The Sources of Risk Spillovers among REITs: Asset Similarities and Regional Proximity Zeno Adams EBS Business School Roland Füss EBS Business School ZEW Mannheim Felix Schinder ZEW Mannheim Steinbeis University
Predicting Wine Quality
 March 8, 2016 Ilker Karakasoglu Predicting Wine Quality Problem description: You have been retained as a statistical consultant for a wine co-operative, and have been asked to analyze these data. Each
Gender equality in the coffee sector. Dr Christoph Sänger 122 nd Session of the International Coffee Council 17 September 2018
 Gender equality in the coffee sector Dr Christoph Sänger 122 nd Session of the International Coffee Council 17 September 2018 Gender equality and the Sustainable Development Agenda Achieving gender equality
Multiple Certification in Coffee & Cocoa Multiple certification patterns of ISEAL member schemes in the coffee and cocoa industries.
 Multiple Certification in Coffee & Cocoa Multiple certification patterns of ISEAL member schemes in the coffee and cocoa industries. October 2018 1 ISEAL MEMBER SCHEMES HAVE COLLABORATED ON SHARED REPORTING
Heat stress increases long-term human migration in rural Pakistan
 Supplementary Methods: SUPPLEMENTARY INFORMATION DOI: 10.1038/NCLIMATE2103 Heat stress increases long-term human migration in rural Pakistan Our sample includes the households surveyed by the International
Big Data and the Productivity Challenge for Wine Grapes. Nick Dokoozlian Agricultural Outlook Forum February
 Big Data and the Productivity Challenge for Wine Grapes Nick Dokoozlian Agricultural Outlook Forum February 2016 0 Big Data and the Productivity Challenge for Wine Grapes Outline Current production challenges
SA Winegrape Crush Survey Regional Summary Report 2017 South Australia - other
 SA Winegrape Crush Survey Regional Summary Report 2017 South Australia - other Vintage overview South Australia (other) includes the GI region of Southern Flinders Ranges, the Peninsulas zone, and the
Gail E. Potter, Timo Smieszek, and Kerstin Sailer. April 24, 2015
 Supplementary Material to Modelling workplace contact networks: the effects of organizational structure, architecture, and reporting errors on epidemic predictions, published in Network Science Gail E.
EXPANSION OF COFFEE FARMING TO NEW FRONTIERS IN KENYA. Mugo H.M
 Kenya Agricultural & Livestock Research Organization (KALRO) Coffee Research Institute (CRI) EXPANSION OF COFFEE FARMING TO NEW FRONTIERS IN KENYA Mugo H.M OVERVIEW Introduction Economic Importance Commercial
IDENTIFICATION OF SUITABLE TEA GROWING AREAS IN MALAWI UNDER CLIMATE CHANGE SCENARIOS
 IDENTIFICATION OF SUITABLE TEA GROWING AREAS IN MALAWI UNDER CLIMATE CHANGE SCENARIOS CALI, COLOMBIA; NOVEMBER 2017 UTZ IN PARTNERSHIP WITH CIAT TABLE OF CONTENTS Table of contents... i Table of figures...
Projected Shifts in Coffea arabica Suitability among Major Global Producing Regions Due to Climate Change
 RESEARCH ARTICLE Projected Shifts in Coffea arabica Suitability among Major Global Producing Regions Due to Climate Change Oriana Ovalle-Rivera 1, Peter Läderach 1 *, Christian Bunn 2, Michael Obersteiner
ANALYSIS OF THE EVOLUTION AND DISTRIBUTION OF MAIZE CULTIVATED AREA AND PRODUCTION IN ROMANIA
 ANALYSIS OF THE EVOLUTION AND DISTRIBUTION OF MAIZE CULTIVATED AREA AND PRODUCTION IN ROMANIA Agatha POPESCU University of Agricultural Sciences and Veterinary Medicine, Bucharest, 59 Marasti, District
Method for the imputation of the earnings variable in the Belgian LFS
 Method for the imputation of the earnings variable in the Belgian LFS Workshop on LFS methodology, Madrid 2012, May 10-11 Astrid Depickere, Anja Termote, Pieter Vermeulen Outline 1. Introduction 2. Imputation
WP Council 264/ February 2016 Original: English. Guidelines for the preparation of country coffee profiles
 WP Council 264/16 15 February 2016 Original: English E International Coffee Council 116 th Session 9 11 March 2016 Addis Ababa, Ethiopia Guidelines for the preparation of country coffee profiles Background
UNIVERSITY OF PLYMOUTH SUSTAINABLE FOOD PLAN
 UNIVERSITY OF PLYMOUTH SUSTAINABLE FOOD PLAN 2014 2020 Date Section Page Issue Modifications Approved (Print name) 28/03/2011 Issued. 1 First issue Procurement 09/07/2014 All All 2 Updated from original
THIS REPORT CONTAINS ASSESSMENTS OF COMMODITY AND TRADE ISSUES MADE BY USDA STAFF AND NOT NECESSARILY STATEMENTS OF OFFICIAL U.S.
 THIS REPORT CONTAINS ASSESSMENTS OF COMMODITY AND TRADE ISSUES MADE BY USDA STAFF AND NOT NECESSARILY STATEMENTS OF OFFICIAL U.S. GOVERNMENT POLICY Required Report - public distribution Date: GAIN Report
Migratory Soaring Birds Project. SEA & Wind Energy planning
 Migratory Soaring Birds Project SEA & Wind Energy planning Strategic Environmental Assessment SEAs provide overall assessment and guidance to inform where specific developments could occur SEA is a key
Chile. Tree Nuts Annual. Almonds and Walnuts Annual Report
 THIS REPORT CONTAINS ASSESSMENTS OF COMMODITY AND TRADE ISSUES MADE BY USDA STAFF AND NOT NECESSARILY STATEMENTS OF OFFICIAL U.S. GOVERNMENT POLICY Required Report - public distribution Date: GAIN Report
The Challenge of Using Regionalized LCA at Nestlé
 The Challenge of Using Regionalized LCA at Nestlé Urs Schenker, Nestlé Research Center Lausanne 2009-11-13 Overview Introduction Nestlé & the Environment Regionalized LCA for Packaging Packaging & the
Tackling with driver of deforestation in partnership with private sector: Case study from Alto Mayo, Peru
 Facilitating Private Sector Participation in REDD+ Activities Tackling with driver of deforestation in partnership with private sector: Case study from Alto Mayo, Peru Tuesday, 19 November Japan Pavilion,
Valuation in the Life Settlements Market
 Valuation in the Life Settlements Market New Empirical Evidence Jiahua (Java) Xu 1 1 Institute of Insurance Economics University of St.Gallen Western Risk and Insurance Association 2018 Annual Meeting
Roaster/Production Operative. Coffee for The People by The Coffee People. Our Values: The Role:
 Are you an enthusiastic professional with a passion for ensuring the highest quality and service for your teams? At Java Republic we are currently expanding, so we are looking for an Roaster/Production
This appendix tabulates results summarized in Section IV of our paper, and also reports the results of additional tests.
 Internet Appendix for Mutual Fund Trading Pressure: Firm-level Stock Price Impact and Timing of SEOs, by Mozaffar Khan, Leonid Kogan and George Serafeim. * This appendix tabulates results summarized in
Angela Mariani. University of Naples Parthenope
 Angela Mariani University of Naples Parthenope Workshop Mediterranean products in the global market Section 6: The global market for wine: issues and prospects p 17 June 2008 BRIEF COMMENTS ON THE FOLLOWING
The Potential Role of Latin America Food Trade in Asia Pacific PECC Agricultural and Food Policy Forum Taipei
 The Potential Role of Latin America Food Trade in Asia Pacific 2011 PECC Agricultural and Food Policy Forum Taipei Universidad EAFIT, Colombia December 2, 2011 1 CONTENTS 1. Introduction 2. Food Trade
Clilmate Analogies and Risk Analysis of Hungarian Viticulture
 Clilmate Analogies and Risk Analysis of Hungarian Viticulture Karoly Szenteleki 1, Levente Horvath 2 and Márta Ladányi 3 1 Corvinus University of Budapest, H-1118 Budapest, Villányi út 29, Hungary, karoly.szenteleki@uni-corvinus.hu
Tree Rings and Water Resource Management in the Southwest
 Tree Rings and Water Resource Management in the Southwest Connie Woodhouse* School of Geography and Regional Development and Laboratory of Tree-Ring Research, University of Arizona Water Management and
Adelaide Plains Wine Region
 SA Winegrape Crush Survey Regional Summary Report 2017 Adelaide Plains Wine Region Adelaide Plains Vintage overview OVERVIEW OF VINTAGE STATISTICS A total of 3,496 tonnes of Adelaide Plains winegrapes