South America Argentina Planting for 2017 Campaign Starts in Argentina
|
|
|
- Roderick Rose
- 6 years ago
- Views:
Transcription
1 South & Central America and Caribbean Market Report Submitted to USDA FAS and USDBC Prepared by USDBC Regional Representative Roman Kutnowski and International Representative Ellen Levinson March 21, 2017 Highlights: Worldwide: Between Sep and Jan. 2017, U.S. dry bean exports worldwide were down 11% compared to the same period last year. The most significant changes were: Mexico (down 44%); UK (down 34%), Dominican Republic (down 26%) and Haiti (down 68%). Conversely, exports to the following destinations increased sharply from last year: Brazil (11,155 MT vs. 0), South Africa, (7,033 MT vs. 0) and Mozambique (3,924 MT vs. 0). Argentina: Planting delays were reported in Argentina due to dry weather conditions in January and the first half of February. Much needed rains in the second half of February brought relief to local growers, who in most cases accomplished target acreage. Planting delays could pose a threat at harvest time, which is expected to take place in late May/June. Brazil: The Brazilian Government (Conab) projected a higher dry bean area for the 2016/17 second season harvest in April May. Higher production for carioca beans, black beans and brown eyed peas is expected. Costa Rica: Due to the impact of Hurricane Otto early in the growing season, the Costa Rican National Production Board (Consejo Nacional de la Producción, CNP) anticipates that 2016/17 dry bean production will be down 40% this year compared to the 3 year average (2013/14 to 2015/16). In late January, CNP recommended that the Ministry of Agriculture increase the amount of dry beans that can be imported under this year's zero duty shortfall quota by 5,139 MT, raising it to 14,555 MT. No decision has been made, yet. The quota is available until June 30, Guatemala: From September 2016 through January 2017, black bean exports from the U.S. to Guatemala were 41% above the level for the same period last year (1,340 MT compared to 954 MT). Dominican Republic: U.S. dry bean exports to the D.R. were 14,524 MT from September 2016 through January 2017, down 26% compared to the same period last year. The Ministry of Agriculture is limiting U.S dry bean imports under the DR CAFTA TRQ to April through December, rather than allowing imports during all 12 months of the calendar year. USDBC is monitoring the situation and consulting with importers, FAS and USTR to determine the impact on U.S. dry bean exports and full implementation of DR CAFTA. Nicaragua: Despite unfavorably wet weather conditions, the country seems headed towards an above average Apante crop; estimated production of 2 million quintals (cwt) (roughly 90,744 MT). The harvest kicks off at the end of March and accounts for 40% of the total production in Nicaragua. It is crucial for Central American countries where red beans are normally consumed, such as El Salvador, Costa Rica and Honduras. 1 Page
2 South America Argentina Planting for 2017 Campaign Starts in Argentina USDBC visited Argentina's dry bean growing region in mid February and issued a report with the following highlights: Due to Brazil s sharp drop in dry bean production in 2016 coupled with a poor Chinese harvest, Argentina's 2015/16 dry bean exports increased by roughly 69% compared to the previous year, with most beans exported to Brazil. Consequently, exportable carry over for black, cranberry, and dark red kidney beans will likely be lower at harvest (late May/June 2017) compared to last year was a good year for Argentine farmers, with prices up by an average 50%. Prices have now declined as Brazil s first 2016/17 harvest finished with an estimated 1.38 MMT up 33% compared to last year (Conab estimate). Still, analysts, farmers and traders alike expect higher acreage for varieties that performed well in Brazil last year namely black, cranberry and dark red kidney beans. Conversely, the area under mung beans and light red kidney beans is expected to drop from last year. Most alubia beans are grown in the north of Salta and Jujuy, in semi arid and dry subhumid areas where farmers do not have many alternative crops. Therefore, the area under alubia beans tends to remain stable. The Northwest of Argentina suffered dry weather conditions in January and the first half of February. This delayed planting in Southern Salta and Northern Tucuman. However, muchneeded rains were reported in the second half of February. As a consequence, most growers accomplished target acreage. 2 Page
 Source: Global Trade Atlas Brazil Higher Area and Production Expected for Second 2016/17 Harvest Conab")
")
3 Argentina Dry Bean Exports: , , and (MT) Source: Global Trade Atlas (HS Code ) Argentina Dry Bean Exports to Main Partners, , , and (MT) Source: Global Trade Atlas Brazil Higher Area and Production Expected for Second 2016/17 Harvest Conab revised down slightly its dry bean production estimate for the first 2016/17 bean campaign at 1.38 MMT, up 33% from 2015/16. Of the total, carioca beans dominate accounting for 962,000 MT; black beans come in second, accounting for 318,000 MT; and brown eye peas (cowpeas) account for 201,500 MT. 3 Page

 in MT Source: Conab Pricing As noted in")
4 For the second harvest, Conab is estimating a total area of million hectares while production is projected as follows: 617,100 MT of carioca beans; 198,200 of black beans; and 404,000 MT of brown eye beans. Harvest is set to kick start by April 5 th. Good weather conditions were reported when this report was being written. Dry Bean Area, Yield and Production in Brazil, 2014/15 to 2016/17 Source: Conab Brazil's Dry Bean Production by Type (Harvest I and Harvest II 2016/17) in MT Source: Conab Pricing As noted in previous reports, prices of carioca beans in 2016 were significantly higher than in The production increase for the First 2016/17 Harvest brought prices of carioca and black beans down sharply. Heading into the 2016/17 second season s harvest, prices increased in mid March compared to mid February and are expected to remain stable with the output of the second harvest, a recent Bolsinha report pointed out. 4 Page


5 Brazil Dry Bean Prices Reported by Conab and Bolsinha Report (USD/MT) Sources: Conab and Bolsinha Reports US Dollar to Brazilian Real One Year Exchange Rate Source: xe.com Brazil's 2015/16 Dry Bean Imports Up 62% Due to a significant domestic production shortfall, Brazil's 2015/16 dry bean imports increased by 62% from 2014/15 to 256,942 MT. 5 Page


6 Brazil Dry Bean Imports: Main Partners in 2013/14; 2014/15; and 2015/16 Source: Global Trade Atlas Dry beans from fellow Mercosur member countries enter Brazil duty free, which favors Argentine and Bolivian imports. Last year the U.S. became a supplier. The Global Trade Atlas reports that Brazil's dry bean imports from the U.S. from September 2016 through January 2017 reached 12,608 MT, making Brazil one of the top ten destinations for U.S. dry beans during that period. Brazil Dry Bean Imports, Sept Jan ; Sept Jan ; and Sept Jan (in MT) Source: Global Trade Atlas 6 Page
 So")
7 Brazil Dry Bean Imports, Sept Jan by Month (in MT) Source: Global Trade Atlas U.S. Dry Bean Exports to Brazil, by Bean Type (MT) Source: FAS GATS Black and Carioca Bean Market Outlook, Nov 2016 to Oct 2017 According to the February production/consumption estimate by Marcelo Luders (the Brazilian Institute for Dry Beans and Pulses, IBRAFE), carioca bean supplies will likely tighten around April May, 2017, and then again in October The black bean market should remain with adequate supplies until September October (new crop Argentine black beans normally enter the Brazilian marketplace by June). We expect to receive an updated projection in late March Page


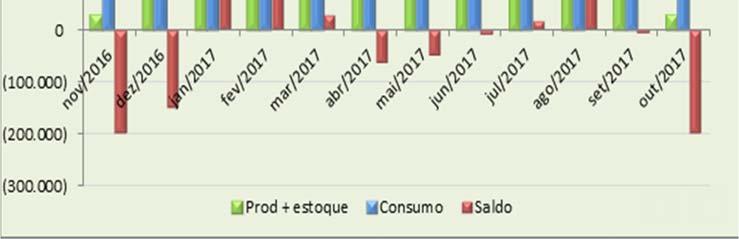
8 Black Beans in Brazil: Projected Consumption, Production/Stocks Nov 2016 Oct 2017 Source: IBRAFE Consumption: blue Production and carryovers: green Total stocks: red Carioca Beans in Brazil: Projected Consumption, Production/Stocks Nov 2016 Oct 2017 Source: IBRAFE Consumption: blue Production and carryovers: green Total stocks: red 8 Page

, in MT Source: FAS GATS Colombia Dry Bean Marketing Year Imports (MT) Source: Global Trade Atlas (HS Code 071333) 9 Page")
9 Colombia Record Level of U.S. Imports in 2015/16 U.S. dry bean exports to Colombia reached the record level of 12,206 MT in 2015/16, according to FAS GATS data. Several different classes of beans were exported, including cranberry beans, pinto beans, light red kidney beans, dark red kidney beans, black beans and navy beans. U.S. cranberry beans proved to be a highly popular substitute for the locally produced cargamanto bean, which is similar in appearance but significantly larger. Large domestic supplies in Q1 2016/17 drove U.S. dry bean exports to Colombia down for the September 2016 through January 2017 period compared to last year. Nonetheless, U.S. exports were higher than the 3 year past average for that period, as shown in the chart below. U.S. Dry Bean Exports to Colombia (September January), in MT Source: FAS GATS Colombia Dry Bean Marketing Year Imports (MT) Source: Global Trade Atlas (HS Code ) 9 Page


10 Colombia Dry Bean Imports, by Month Source: Global Trade Atlas (HS Code ) U.S. Dry Bean Exports to Colombia by Type, in MT Source: FAS GATS Some U.S. Containers Rejected due to Soil Contamination One challenge that U.S. pulse exporters have faced rejection of cargoes due to soil contamination. Since November, several cases have been reported at Cartagena. The Instituto Colombiano Agropecuario (Colombian Institute for Agriculture and Livestock, ICA) performs functions similar to USDA s APHIS. Among other things, ICA is responsible for certifying that imported plants and plant products comply with the country s health standards and requirements. The country has zero tolerance for soil contamination (as does the United States). In Colombia, if soil is found by the inspector, it must be noted on the port certificate and the container is rejected. Apparently, however, the standard is not evenly applied. USDBC discussed this matter with FAS Post in Bogota, USDA APHIS and affected U.S. exporters and continues to monitor the situation to determine its impact on U.S. dry bean trade. 10 Page

 Sources: Corabastos and trade estimates for red and")
11 Pricing Last summer, Colombia s dry bean sector started to rebound from two years of severe drought. With stronger domestic production, prices dropped quickly and, consequently, Colombia s bean sector began purchasing more local product and reduced imports. Colombia Specialty Crop Prices, as Reported by Corabastos (USD/MT) Sources: Corabastos and trade estimates for red and white cargamanto beans U.S. Dollar to Colombian Peso One Year Exchange Rate Source: xe.com 11 Page


12 Central America and the Caribbean According to FAO GIEWS Food Price Monitoring and Analysis (FPMA) Bulletin issued on March 9, 2017, Central American red bean prices increased seasonally in February ahead of the 2016/17 Apante harvest. The impact of late November s Hurricane Otto can be seen in lower harvest projects in Costa Rica, while southern parts of Haiti have still not recovered from Hurricane Matthew, which hit the country on October 5 6, In Honduras and Nicaragua prices were more than 10% higher than a year earlier due to seasonal pressure, which was exacerbated by sustained sub regional demand. In El Salvador prices of red beans also rose slightly, but prices were lower than last February as a result of adequate volumes of imports and good volumes from the main Postrera harvest. In Guatemala black bean prices weakened reflecting new supplies from the harvest in the northern Petén Department. In Haiti there were mixed trends in bean (black and red) prices during February. Prices were increasing in southern regions that had been hit hard by Hurricane Matthew in October 2016, wiping out crops, while declining in other regions due to the autumn harvest. In the Dominican Republic prices of red and black beans were stable in February after declining in the previous months. 12 Page
13 Nicaragua Nicaragua is the main dry bean exporter in Central America and 95% of the country's dry bean production depends on small and mid scale farmers. Average production stands at around 180,000 MT while domestic demand usually reaches roughly 122,000 MT. Nicaragua Dry Bean Prices at Wholesale (USD/MT) Exchange Rate: December 30, 2016: 1 USD=29.6 NIO 3 months ago: 1 USD=29.29 NIO 6 months ago: 1 USD=28.88 NIO Source: SIMPAH Apante Harvest Outlook The Apante season produces the largest dry bean harvest (March April) in Nicaragua, accounting for roughly 40% of the country's total production every year. Despite wet weather condition reports in parts of the country ( reportan baja cosechade frijol en nueva guinea), Nicaragua seems to be headed to an above average Apante Harvest Season. According to Alvaro Fiallos, President of the Nicaraguan Agricultural and Livestock Union (Unión Nacional de Agricultores y Ganaderos de Nicaragua, UNAG), the Apante dry bean production could stand at 2 million quintals or cwt (roughly 90,744 MT) ( millones de quitales de frijolproducidos en nicaragua garantizaran estabilidad en el precio dice unag/#.wnk4irlyvay). Traders within the country estimate production could actually be higher than Fiallos' estimate by 10 to 15%. Costa Rica, El Salvador and Honduras heavily depend on the output of the Nicaraguan Apante season to meet domestic demand of red beans. El Salvador El Salvador is the main red bean importer in Central America and also imports other types of beans for processing and blending. 13 Page
 Source: Salvadoran Ministry of Agriculture Guatemala Due to problems with the Postrera harvest, which usually takes place November December, the")
.")
14 For 2016/17, the Government of El Salvador estimates 2.6 million cwt (118,000 MT). Traders expect 2.5 million cwt (113,000 MT). The Marketing Year in El Salvador is May to April. El Salvador Dry Bean Prices at Wholesale (USD/MT) Source: Salvadoran Ministry of Agriculture Guatemala Due to problems with the Postrera harvest, which usually takes place November December, the Guatemalan Government announced a duty free quota for 5,000 MT of black beans for 2017 (all WTO members are eligible). From September 2016 through January 2017, black bean exports from the U.S. were 41% above the level for the same period last year (1,340 MT compared to 954 MT). In February March black bean prices weakened, reflecting new supplies from the harvest in the northern Petén Department. Guatemala Dry Bean Prices at Wholesale, as Reported by MAGA (USD/MT) Source: Guatemalan Ministry of Agriculture U.S. Dollar to Guatemalan Quetzal One Year Exchange Rate Source: xe.com 14 Page

15 U.S. Dry Bean Exports to Guatemala, by Bean Type (MT) Source: FAS GATS Costa Rica Dry Bean Production Down; Duty Free Shortfall Import Quota May Rise Costa Rica's dry bean production usually covers about 26 to 31% of the country's total demand, estimated at 47,000 MT. In 2016/17, however, weather events in late 2016 (mainly Hurricane Otto) reduced bean production: CNP estimates 8,720 MT compared to 14,178 MT in 2015/16. The regular import tariff for beans is 30%, but under DR CAFTA, in 2017 the tariff for U.S. dry beans is 9.2% and will be reduced to zero by Costa Rica also has a trade agreement with China that permits 10,000 MT of dry beans to enter duty free each year. The China quota plus domestic production is typically not enough to cover domestic demand. Thus, each year the Government can declare a shortfall and set a quota for additional duty free imports of dry beans (reds and blacks) from any origin. The shortfall quota for this year has been established at 9,432 MT (valid until June 30, 2017). As of Jan 1, 2017, 5,123 MT had already been imported. Based on updated harvest projections, in late January the CNP requested the Ministry of Agriculture to increase the duty free shortfall quota by an additional 5,139 MT (raising it to 14,555 MT for 2017). The industry, local sources say, is asking for twice as much. So far, the Ministry has not announced a revised shortfall quota. U.S. Dry Bean Exports Increase; Prices are Steady Total U.S. dry bean exports to Costa Rica for September 2016 through January 2017 were 3,316 MT, a ten fold increase compared to the 276 MT exported during the same period last year. Prices for black and red beans have remained fairly steady since February. 15 Page


16 Costa Rica Wholesale Dry Bean Prices (USD/MT) Source: CNP U.S. Dollar to Costa Rican Colon One Year Exchange Rate Source: xe.com U.S. Dry Bean Exports to Costa Rica, by Bean Type (MT) Source: FAS GATS 16 Page

17 Honduras Traditional red bean dishes are popular, such as fried, mashed beans and soups. Bean pastes and frozen cooked beans are produced for markets in Honduras, El Salvador, Nicaragua and the United States. The Honduran Ministry of Agriculture estimated domestic production of 135,000 MT for 2016, but that level has not been verified. The Ministry reported a production level of 112,500 MT for Most imported beans are from Nicaragua; imports from other countries varies considerably from year to year. A total of 13,298 MT was imported in 2015/16. Catholic Relief Services issued a freight tender with offers due by March 30, 2017 (June delivery) for several different commodities that will be used for its USDA McGovern Dole International Food for Education and Child Nutrition program in the department of Intibucá. The tender includes 180 MT of small red beans in 50kg bags. Honduras Dry Bean Prices at Wholesale (USD/MT) Exchange Rate: March 13, 2017: 1 USD=23.62 HLM 3 months ago: 1 USD=23.46 HLM 6 months ago: 1 USD=22.91 HLM Source: SIMPAH Haiti The Food and Agriculture Organization of the United Nations (FAO) reported that dry bean crop damage due to Hurricane Matthew in October 2016 was extensive in Grand Anse and the South departments. Dry beans are a critical food crop in Haiti. Prices have been high and increasing in southern regions that were hit hard by the hurricane, while in regions that were not affected by the hurricane, prices are declining due to the autumn harvest. The country continues to rebuild infrastructure and agriculture following the 2010 earthquake. The timing of Hurricane Matthew hindered the rebuilding effort and once again exacerbated the food security situation. The World Food Program s Special Operation programs following Hurricane Matthew ceased at the end of February, but large scale Protracted Relief and Recovery Operations and support for the National School Meals program continue, reaching many of the country s departments. 17 Page
 Source: FAS GATS Dominican Republic Since DR CAFTA went into effect in the Dominican Republic in 2007, U.S. exports to the DR have seen substantial growth and it is now a top market for U.")
18 USDA has both Food for Progress and McGovern Dole Food for Education programs in the country and USAID funds PL 480 Title II programs, including 6,333 MT of in kind emergency food aid for fiscal year 2017 U.S. Dry Bean Exports to Haiti, by Bean Type (MT) Source: FAS GATS Dominican Republic Since DR CAFTA went into effect in the Dominican Republic in 2007, U.S. exports to the DR have seen substantial growth and it is now a top market for U.S. dry beans, particularly pintos. From September 2016 through January 2017, 14,524 MT of U.S. dry beans were exported and 78% were pintos (FAS GATS). Overall, during that 4 month period exports were down 26% from last year. Two multi year USDA Food for Progress Programs are currently being conducted in the country: one is being implemented by the International Executive Service Corp. and the other by the National Cooperative Business Association. Production and Consumption: Dry Beans are a Dietary Mainstay Red beans (a category that includes Roja Larga/Buena Vista, Jose Beta and Cranberry beans) and black beans are the primary dry beans produced and consumed in traditional dishes. Small amounts of white beans are also produced. Red beans are the preferred bean in the country and U.S. pinto beans, when cooked, are similar to Dominican red beans and are now very popular. Pigeon peas are produced in large amounts and about half of the crop is exported. The main harvest season for reds and blacks starts in January, peaks in February and continues into mid March. Wholesale prices for domestic red beans tend to peak in October. The harvest 18 Page

.")

19 coincides with the start of Lent, when red beans are in high demand for the traditional Habicuelas con Dulce a sweet, creamy desert of beans, coconut milk and sweet potatoes. Packagers and retailers estimate that 80% of domestic red beans are sold in this period. DR Dry Bean Consumption, , MT (Min. Ag) Drought and yellow mosaic virus decreased dry bean production by 15.5% from 2012 to 2015 (Central Bank of DR Economic Report). Planted area and yields are also falling, mainly due to production and financing challenges. Imports In 2016, an estimated 55 60% of the bean supply was imported (Ministry of Agriculture). Both importers and producers do not expect import needs to decrease in Under DR CAFTA, in calendar year 2017 the TRQ for duty free entry of U.S. dry beans is 14,720 MT and the over quota duty is 17.8 percent. The Ministry of Agriculture issues licenses to domestic companies for imports under the TRQ. The chart below shows the total amount licensed and the amounts licensed to the five companies that received the largest share since Min. Ag. Dry Bean Import Licenses under the US TRQ, by Company, from (MT) 19 Page

20 The TRQ increased from 2013 to 2017, as follows (in MT): ,900 12,480 13,040 13,600 14,160 14,720 As can be seen from the chart below, significant over quota quantities of U.S. dry beans are imported. Thus, in addition to the TRQ license, obtaining out of quota beans is an important part of an importer s strategy. U.S. Dry Bean Exports to the DR by Type, 2012/ /17 and Sep Jan 2016/17, MT Bean Type 2012/ / / /16 Sep Jan 2016 Sep Jan 2017 Pinto 27,841 19,224 20,342 26,290 12,742 11,317 Black 2, ,084 8,692 3, Cranberry 9 1,252 2,667 3,442 2,796 0 Other , ,381 Great Northern , Small Red 0 2,553 3, Source: FAS GATS U.S. Dry Bean Exports to Dominican Republic, by Bean Type (MT) Source: FAS GATS 20 Page

 are concerned about this resolution and other actions taken by the DR government that can undermine implementation of DR CAFTA s market access measures.")
21 DR CAFTA Administrative Issues The Government of the Dominican Republic has used a variety of non tariff barriers to limit dry bean imports, particularly during the harvest season (January March). For 2017, the Ministry of Agriculture issued a resolution limiting imports under the U.S. dry bean TRQ to the months of April through December, even though the DR CAFTA TRQ applies to the full calendar year. Several importers have expressed concerns about how the TRQ and over quota imports are administered. UDSA/FAS and the U.S. Trade Representative (USTR) are concerned about this resolution and other actions taken by the DR government that can undermine implementation of DR CAFTA s market access measures. Bilateral discussions have been taking place between U.S. and D.R. government officials about these issues. USDBC is consulting with and providing input to USDA/FAS and USTR. We are monitoring the situation to determine the impact of the D.R. government s actions (1) on U.S. dry bean exports and (2) DR CAFTA provisions to phase out duties on all U.S. dry bean imports by A fuller analysis of the situation will be provided in an upcoming Jamaica Dominican Republic Trade Mission Report. Dominican Republic Dry Bean Prices at Wholesale (USD/MT) Dominican Ministry of Agriculture U.S. Dollar to Dominican Peso One Year Exchange Rate Source: xe.com 21 Page

22 Jamaica Red beans are consumed regularly in traditional Jamaican bean and rice dishes. Jamaica is the top U.S. market for small red beans. Red kidney beans are domestically produced in crop rotations on about 160,000 farms that are five acres or less. Production is rain fed and the main planting season is October with December/January harvest. When harvested, nearly all of the production is consumed fresh and it is therefore considered a different product the dry kidney beans. Once the harvest is underway, the Ministry of Agriculture does not issue any import licenses. Import duties are waived for Caribbean Community (CARICOM) members. For the US and other non members, there is a duty of 40%. For kidney beans, an additional % duty is levied. Plus, the internal general consumption tax is 16.5% for non CARICOM beans. Belize is the other country in the region that grows red kidney beans. The chart below shows the top 5 destinations for US small red beans. Jamaica is the largest buyer. Duty free imports of light red kidney beans from Belize are today a challenge for U.S. dry beans in Jamaica. The minimum import tax for U.S. dry beans is 16.5%, and can increase up to 100% in the case of light red kidney beans. [EL1]The World Trade Atlas data shows that Belize's dry bean exports to Jamaica tripled in 2015/16 to 2,915 MT. Belize's Dry Bean Exports to Jamaica, in MT Source: Global Trade Atlas (HS Code ) Jamaican importers reported that recent prices from Belize are: $55/cwt ($1,212/MT) for Light Red Kidney Beans (FOB) $40/cwt ($881/MT) for Small Red Beans (FOB) 22 Page

23 U.S. Dry Bean Exports to Jamaica, by Bean Type (MT) Source: U.S. Census Bureau Trade Data U.S.A. 2015/16 Marketing Year Exports The most notable changes in U.S. exports in marketing year to Latin America were for the markets of Mexico, Dominican Republic, Brazil and Colombia. Exports to Mexico, while not reaching the 5 year average, were much stronger than the two years prior. U.S. exports to the Dominican Republic and Colombia reached all time record highs for commercial (non food aid) shipments. South and Central America and the Caribbean (SCA&C) Trends and Market Developments In the first quarter of the 2016/17 marketing year, buyers from SCA&C black bean markets have been more actively seeking product from the United States. Dry bean exports to Brazil reached an all time record of 11,155 MT from September 2016 through January 2017, FAS GATS data show. However, this trend is unlikely to continue due to the bumper First Season harvest (completed in February) and an expected strong Second Season harvest in April/May Opportunities may arise later in the year. Dry bean exports to Guatemala in the 2016/17 marketing year started at a good pace (1,344 MT from September 2016 through January 2017 compared to 954 MT in the same period last year). U.S. exports to Costa Rica reached 3,311 MT in September 2016 January 2017 compared to 276 in 2015/16. Pinto bean exports to Colombia were up significantly in 2015/16 compared to 2014/ Page


24 However, they dropped off in the first months of the new marketing year as domestic bean prices fell. Top 20 U.S. Dry Bean Export Markets, 2011/12 to 2015/16 (in MT) Source: FAS GATS Top 15 U.S. Dry Bean Export Markets (September January), in MT Source: FAS GATS US Dry Bean Import Trends from Latin American Region While U.S. exports to Mexico gained some strength in marketing year, U.S. imports from Mexico remained higher than 5 year average. U.S. imports of small red beans from Nicaragua also remained higher than 5 year average. 24 Page
 beans between September 2016 and January 2017")


25 In contrast, imports from China and Peru were significantly below their 5 year average. Imports of Nicaraguan small reds (rojo seda) beans between September 2016 and January 2017 increased by 30% to 3,924 MT. Imports of Peruvian beans in that same period also increased by 44% to 2,007 MT. Conversely, dry bean imports from Argentina fell by 70% to 694 MT from 2,329 MT in the same period last year. Top 12 U.S. Dry Bean Import Markets 2011/12 to 2015/16 (in MT) Source: FAS GATS Top U.S. Dry Bean Import Markets (September-January), in MT Source: FAS GATS 25 Page


26 Global View World Dry Bean Exports, By Marketing Year Source: Global Trade Atlas and U.S. Census Bureau Trade Data 26 Page

27 Global View World Dry Bean Imports, By Marketing Year Source: Global Trade Atlas and U.S. Census Bureau Trade Data 27 Page
Costa Rica Colombia Dominican Republic El Salvador
 Highlights: South & Central America and Caribbean Market Report Submitted to USDA FAS and USDBC Prepared by USDBC Regional Representative Roman Kutnowski and International Representative Ellen Levinson
MONTHLY COFFEE MARKET REPORT
 E MONTHLY COFFEE MARKET REPORT February 2014 February 2014 has seen significant developments in the coffee market, with prices shooting upwards at a startling rate. The ICO composite daily price has increased
2018/19 expected to be the second year of surplus
 2018/19 expected to be the second year of surplus Coffee year 2018/19 is expected to be the second consecutive season of surplus, as global output, estimated at 167.47 million bags, exceeds world consumption,
Coffee Season 2013/14 Finishes in Balance but Deficit Expected Next Year
 Coffee Season 2013/14 Finishes in Balance but Deficit Expected Next Year Coffee prices were volatile again over the course of September, mostly reacting to weather news from Brazil. Daily prices fell initially
Citrus: World Markets and Trade
 United States Department of Agriculture Foreign Agricultural Service Citrus: World Markets and Trade Oranges Global orange production for 2012/13 is forecast to drop over 4 percent from the previous year
Coffee market ends 2014 at ten month low
 Coffee market ends 2014 at ten month low Coffee prices continued to slide downwards in December 2014, with the monthly average of the ICO composite indicator at its lowest level since February. Recent
Fresh Deciduous Fruit (Apples, Grapes, & Pears): World Markets and Trade
: World Markets and Trade") Million MT United States Department of Agriculture Foreign Agricultural Service December 21 Fresh Deciduous Fruit (Apples, Grapes, & Pears): World Markets and Trade 21/11 Forecast: World Apple Trade Declines;
Million MT United States Department of Agriculture Foreign Agricultural Service December 21 Fresh Deciduous Fruit (Apples, Grapes, & Pears): World Markets and Trade 21/11 Forecast: World Apple Trade Declines;
MONTHLY COFFEE MARKET REPORT
 E MONTHLY COFFEE MARKET REPORT June 2013 Coffee prices fell sharply in June 2013, as market fundamentals, combined with an uncertain macroeconomic outlook, drove the ICO composite indicator price to its
THIS REPORT CONTAINS ASSESSMENTS OF COMMODITY AND TRADE ISSUES MADE BY USDA STAFF AND NOT NECESSARILY STATEMENTS OF OFFICIAL U.S.
 THIS REPORT CONTAINS ASSESSMENTS OF COMMODITY AND TRADE ISSUES MADE BY USDA STAFF AND NOT NECESSARILY STATEMENTS OF OFFICIAL U.S. GOVERNMENT POLICY Required Report - public distribution Date: GAIN Report
UTZ Coffee Statistics Report 2017
 UTZ Coffee Statistics Report 2017 UTZ is the largest certification program in the world for sustainable coffee More than 480,000 coffee farmers and workers benefit from the UTZ program UTZ certified coffee
U.S. Dry Bean Market Update: 2018
 U.S. Dry Bean Market Update: 2018 Suzanne Thornsbury and Jennifer Bond U.S. Dry Bean Convention U.S. Dry Bean Market Update: 2013 Dr. Suzanne Bonita Thornsbury Springs, FL and Hodan Farah Wells July 24,
MONTHLY COFFEE MARKET REPORT
 E MONTHLY COFFEE MARKET REPORT May 2014 After five consecutive months of rising prices, the coffee market reversed lower in May. From a high of 179 cents/lb in April, the daily price of the ICO composite
LETTER FROM THE EXECUTIVE DIRECTOR
 E LETTER FROM THE EXECUTIVE DIRECTOR COFFEE MARKET REPORT December 2008 Price levels in December confirmed the downward trend recorded in the coffee market since September 2008. The monthly average of
July marks another month of continuous low prices
 July marks another month of continuous low prices In July 2018, the ICO composite indicator price decreased by 2.9% to an average of 107.20 US cents/lb, which is the lowest monthly average for July since
THIS REPORT CONTAINS ASSESSMENTS OF COMMODITY AND TRADE ISSUES MADE BY USDA STAFF AND NOT NECESSARILY STATEMENTS OF OFFICIAL U.S.
 THIS REPORT CONTAINS ASSESSMENTS OF COMMODITY AND TRADE ISSUES MADE BY USDA STAFF AND NOT NECESSARILY STATEMENTS OF OFFICIAL U.S. GOVERNMENT POLICY Required Report - public distribution Date: GAIN Report
Coffee market settles lower amidst strong global exports
 Coffee market settles lower amidst strong global exports The ICO composite indicator price declined by 1.2% in February 2018 to an average of 114.19 US cents/lb. Indicator prices for all three Arabica
Growing divergence between Arabica and Robusta exports
 Growing divergence between Arabica and Robusta exports In April 218, the ICO composite indicator decreased by.4% to an average of 112.56, with the daily price ranging between 11.49 and 114.73. Prices for
GLOBAL DAIRY UPDATE KEY DATES MARCH 2017
 MARCH 2017 GLOBAL DAIRY UPDATE European milk production decreased for the seventh consecutive month, while the US remains strong. The rate of decline in New Zealand production is easing. US exports continue
Record exports in coffee year 2017/18
 Record exports in coffee year 2017/18 Total coffee exports increased each year since 2010/11 with a new record reached in 2017/18 at 121.86 million bags, 2% higher than 2016/17. In the twelve months ending
Estudio de las Cadenas de Valor de Maíz Blanco y Frijol en Centroamérica, IICA, RED SICTA, Cooperación Suiza en America Central, 2013.
 REGIONAL MARKET FUNDAMENTALS Central America February 24, 2017 ABOUT THIS REPORT This report provides an overview of typical production and market behavior in Central America staple grains market. The
For personal use only
 SEPTEMBER 216 GLOBAL DAIRY UPDATE European milk production has decreased for the first time since early 215, with volumes in June down 2 compared to last year. Last week we announced our annual results,
The supply and demand for oilseeds in South Africa
 THIS REPORT CONTAINS ASSESSMENTS OF COMMODITY AND TRADE ISSUES MADE BY USDA STAFF AND NOT NECESSARILY STATEMENTS OF OFFICIAL U.S. GOVERNMENT POLICY Required Report - public distribution Date: GAIN Report
Soft Commodity Markets - Upcoming Milestones, and How the Market Could Be Affected
 Soft Commodity Markets - Upcoming Milestones, and How the Market Could Be Affected September 15, 2014 Judith Ganes President J. Ganes Consulting, LLC Weather & Politics Current Weather Expectations El
Volatility returns to the coffee market as prices stay low
 Volatility returns to the coffee market as prices stay low Daily coffee prices hit their lowest level in 19 months during August, as commodity markets worldwide were negatively affected by currency movements
Coffee: World Markets and Trade
 United States Department of Agriculture Foreign Agricultural Service June 2017 Coffee: World Markets and Trade 2017/18 Forecast Overview World coffee production for 2017/18 is forecast at 159 million bags
Prices for all coffee groups increased in May
 Prices for all coffee groups increased in May In May 2018, the ICO composite indicator increased by 0.7% to an average of 113.34 US cents/lb, following three months of declines. Prices for all coffee groups
Coffee prices rose slightly in January 2019
 Coffee prices rose slightly in January 2019 In January 2019, the ICO composite indicator rose by 0.9% to 101.56 US cents/lb as prices for all group indicators increased. After starting at a low of 99.16
Coffee market ends 2016/17 coffee year in deficit for the third consecutive year
 Coffee market ends 2016/17 coffee year in deficit for the third consecutive year The ICO composite indicator continued its downward trend that started at the end of August, averaging 124.46 US cents/lb.
Coffee market recovers slightly from December slump
 Coffee market recovers slightly from December slump After reaching its lowest level in 22 months in December 2017, the monthly average of the ICO composite indicator price increased by 1.4% to 115.60 US
Cocoa Prepared by Foresight December 5, 2017
 Cocoa Prepared by Foresight December 5, 2017 TABLES Cocoa Bean Price Forecast... P. 4 World Cocoa Supply/Demand, Crop Year... P. 7 World Cocoa Production... P. 8 Cocoa Crops in Major Producing Countries...
Cocoa Prepared by Foresight October 3, 2018
 Cocoa Prepared by Foresight October 3, 2018 TABLES Cocoa Bean Price Forecast... P. 4 World Cocoa Supply/Demand, Crop Year... P. 7 World Cocoa Production... P. 8 Cocoa Crops in Major Producing Countries...
Coffee market ends 2017/18 in surplus
 Coffee market ends 217/18 in surplus World coffee production in coffee year 217/18 is estimated 5.7% higher at 164.81 million bags as output of Arabica increased by 2.2% to 11.82, and Robusta grew 11.7%
THIS REPORT CONTAINS ASSESSMENTS OF COMMODITY AND TRADE ISSUES MADE BY USDA STAFF AND NOT NECESSARILY STATEMENTS OF OFFICIAL U.S.
 THIS REPORT CONTAINS ASSESSMENTS OF COMMODITY AND TRADE ISSUES MADE BY USDA STAFF AND NOT NECESSARILY STATEMENTS OF OFFICIAL U.S. GOVERNMENT POLICY Required Report - public distribution Date: GAIN Report
Record Exports for Coffee Year 2016/17
 Record Exports for Coffee Year 2016/17 Total exports in September 2017 reached 8.34 million bags, compared to 9.8 million in September 2016. While coffee year 2016/17 registered a decrease in its final
Peaches & Nectarines and Cherry Annual Reports
 THIS REPORT CONTAINS ASSESSMENTS OF COMMODITY AND TRADE ISSUES MADE BY USDA STAFF AND NOT NECESSARILY STATEMENTS OF OFFICIAL U.S. GOVERNMENT POLICY Required Report - public distribution Date: GAIN Report
Fresh Deciduous Fruit (Apples, Grapes, & Pears): World Markets and Trade
: World Markets and Trade") Fresh Deciduous Fruit (Apples, Grapes, & Pears): World Markets and Trade June 21 APPLES Record Production but Trade Estimate Revised Downward The world production estimate for 29/1 is virtually unchanged
Fresh Deciduous Fruit (Apples, Grapes, & Pears): World Markets and Trade June 21 APPLES Record Production but Trade Estimate Revised Downward The world production estimate for 29/1 is virtually unchanged
2016 China Dry Bean Historical production And Estimated planting intentions Analysis
 2016 China Dry Bean Historical production And Estimated planting intentions Analysis Performed by Fairman International Business Consulting 1 of 10 P a g e I. EXECUTIVE SUMMARY A. Overall Bean Planting
Downward correction as funds respond to increasingly positive supply outlook
 Downward correction as funds respond to increasingly positive supply outlook Coffee prices fell sharply at the end of April as institutional investors sold off their positions. The coffee market continues
STATE OF THE VITIVINICULTURE WORLD MARKET
 STATE OF THE VITIVINICULTURE WORLD MARKET April 2018 1 Table of contents 1. VITICULTURAL PRODUCTION POTENTIAL 3 2. WINE PRODUCTION 5 3. WINE CONSUMPTION 7 4. INTERNATIONAL TRADE 9 Abbreviations: kha: thousands
World of sugar PAGE 54
 World of sugar More than 1 countries produce sugar, about 8% of which is made from sugar cane grown primarily in the tropical and sub-tropical zones of the southern hemisphere, and the balance from sugar
Fresh Deciduous Fruit (Apples, Grapes, & Pears): World Markets and Trade
: World Markets and Trade") United States Department of Agriculture Foreign Agricultural Service Fresh Deciduous Fruit (Apples, Grapes, & Pears): World Markets and Trade 9 1, MT Deciduous Fruit on Seasonal Cycles 6 Northern Hemisphere
United States Department of Agriculture Foreign Agricultural Service Fresh Deciduous Fruit (Apples, Grapes, & Pears): World Markets and Trade 9 1, MT Deciduous Fruit on Seasonal Cycles 6 Northern Hemisphere
THIS REPORT CONTAINS ASSESSMENTS OF COMMODITY AND TRADE ISSUES MADE BY USDA STAFF AND NOT NECESSARILY STATEMENTS OF OFFICIAL U.S.
 THIS REPORT CONTAINS ASSESSMENTS OF COMMODITY AND TRADE ISSUES MADE BY USDA STAFF AND NOT NECESSARILY STATEMENTS OF OFFICIAL U.S. GOVERNMENT POLICY Required Report - public distribution Date: GAIN Report
Coffee: World Markets and Trade
 United States Department of Agriculture Foreign Agricultural Service June 2016 Coffee: World Markets and Trade 2016/17 Forecast Overview World coffee production for 2016/17 is forecast to rise 2.4 million
MARKET NEWSLETTER No 93 April 2015
 Focus on OLIVE OIL IMPORT TRENDS IN RUSSIA Russian imports of olive oil and olive pomace oil grew at a constant rate between 2/1 and 213/14 when they rose from 3 62 t to 34 814 t (Chart 1). The only exceptions
Record exports from Brazil weigh heavy on the coffee market
 Record exports from Brazil weigh heavy on the coffee market Coffee exports from Brazil reached a record high of 36.8 million bags in crop year 2014/15 (April to March), fuelled by domestic stocks and encouraged
QUARTERLY REVIEW OF THE PERFORMANCE OF THE DAIRY INDUSTRY 1
 QUARTERLY REVIEW OF THE PERFORMANCE OF THE DAIRY INDUSTRY 1 The information in this document is from sources deemed to be correct. Milk SA, the MPO and SAMPRO are not responsible for the results of any
Coffee prices maintain downward trend as 2015/16 production estimates show slight recovery
 Coffee prices maintain downward trend as 2015/16 production estimates show slight recovery The coffee market fell again in December 2015, reaching its second lowest monthly average of the year. This decrease
Jim Horvath President and Chief Executive Officer
 Changes and Challenges in the Sugar Industry Jim Horvath President and Chief Executive Officer American Crystal Sugar Company Bloomquist Lecture Series Al s Name Is Synonymous With Progressive Beet Sugar
LETTER FROM THE EXECUTIVE DIRECTOR COFFEE MARKET REPORT. November 2004
 International Coffee Organization Organización Internacional del Café Organização Internacional do Café Organisation Internationale du Café E LETTER FROM THE EXECUTIVE DIRECTOR COFFEE MARKET REPORT November
THE GLOBAL PULSE MARKETS: recent trends and outlook
 THE GLOBAL PULSE MARKETS: recent trends and outlook CICILS/IPTIC 2004 CONVENTION 10-12 12 June 2004 Beijing, China Boubaker BENBELHASSEN Commodities and Trade Division United Nations Food and Agriculture
THIS REPORT CONTAINS ASSESSMENTS OF COMMODITY AND TRADE ISSUES MADE BY USDA STAFF AND NOT NECESSARILY STATEMENTS OF OFFICIAL U.S.
 THIS REPORT CONTAINS ASSESSMENTS OF COMMODITY AND TRADE ISSUES MADE BY USDA STAFF AND NOT NECESSARILY STATEMENTS OF OFFICIAL U.S. GOVERNMENT POLICY Required Report - public distribution Date: GAIN Report
Coffee market continues downward trend
 Coffee market continues downward trend Since August 2017, the ICO composite indicator price has declined in each month except January 2018. The composite indicator decreased by 1.1% in March 2018 to an
MONTHLY COFFEE MARKET REPORT
 E MONTHLY COFFEE MARKET REPORT July 2012 Coffee prices rebounded in July 2012, with the ICO composite indicator increasing by 9.5% compared to June, following nine consecutive months of price falls. The
EMBARGO TO ON FRIDAY 16 SEPTEMBER. Scotch Whisky Association. Exports of Scotch Whisky; Year to end of June 2016 (2016 H1)
") EMBARGO TO 00.01 ON FRIDAY 16 SEPTEMBER Scotch Whisky Association Exports of Scotch Whisky; Year to end of June 2016 (2016 H1) VOLUME UP 3.1% to 531 MILLION bottles VALUE DOWN SLIGHTLY BY 1.0% TO 1.70
EMBARGO TO 00.01 ON FRIDAY 16 SEPTEMBER Scotch Whisky Association Exports of Scotch Whisky; Year to end of June 2016 (2016 H1) VOLUME UP 3.1% to 531 MILLION bottles VALUE DOWN SLIGHTLY BY 1.0% TO 1.70
MONTHLY COFFEE MARKET REPORT
 1 E MONTHLY COFFEE MARKET REPORT March 2014 Ongoing uncertainty over the Brazilian coffee crop has caused significant fluctuations in coffee prices during March, with monthly volatility of the International
CHAPTER 7.3 FOCUS ON FAIRTRADE PRODUCTS COCOA
 CHAPTER 7.3 FOCUS ON FAIRTRADE PRODUCTS COCOA MONITORING THE SCOPE AND BENEFITS OF FAIRTRADE SIXTH EDITION 2014 95 MONITORING THE SCOPE AND BENEFITS OF FAIRTRADE SIXTH EDITION 2014 96 7.3 Fairtrade Fact
Milk and Milk Products. Price and Trade Update. Weekly Newsletter. Milk and Milk Products. Price and Trade Update: April
 April Milk and Milk Products Price and Trade Update Weekly Newsletter Milk and Milk Products Price and Trade Update: April 1 PRICES: Remain depressed International dairy product prices began the year at
Dairy Market. May 2016
 Dairy Market R E P O R T Volume 19 No. 5 May 2016 DMI NMPF Overview Increased production per cow and expectations for additional milk production growth is dampening the outlook for milk prices for the
Tea Statistics Report 2015
 Tea Statistics Report 215 Introduction This report presents the scope and scale of the UTZ tea program in 215. Throughout this report tea also includes rooibos unless otherwise specified. The statistics
Brazil. Coffee Annual. Coffee
 THIS REPORT CONTAINS ASSESSMENTS OF COMMODITY AND TRADE ISSUES MADE BY USDA STAFF AND NOT NECESSARILY STATEMENTS OF OFFICIAL U.S. GOVERNMENT POLICY Required Report - public distribution Date: 5/7/2015
STATE OF THE VITIVINICULTURE WORLD MARKET
 STATE OF THE VITIVINICULTURE WORLD MARKET April 2015 1 Table of contents 1. 2014 VITIVINICULTURAL PRODUCTION POTENTIAL 3 2. WINE PRODUCTION 5 3. WINE CONSUMPTION 7 4. INTERNATIONAL TRADE 9 Abbreviations:
CHAPTER 7.1 FOCUS ON FAIRTRADE PRODUCTS COFFEE
 CHAPTER 7.1 FOCUS ON FAIRTRADE PRODUCTS COFFEE MONITORING THE SCOPE AND BENEFITS OF FAIRTRADE SIXTH EDITION 2014 77 MONITORING THE SCOPE AND BENEFITS OF FAIRTRADE SIXTH EDITION 2014 78 7.1 Fairtrade Fact
Chile. Tree Nuts Annual. Almonds and Walnuts Annual Report
 THIS REPORT CONTAINS ASSESSMENTS OF COMMODITY AND TRADE ISSUES MADE BY USDA STAFF AND NOT NECESSARILY STATEMENTS OF OFFICIAL U.S. GOVERNMENT POLICY Required Report - public distribution Date: GAIN Report
Fruit and Tree Nuts Outlook
 FTS-346 March 30, 2011 Fruit and Tree Nuts Outlook Agnes Perez Kristy Plattner acperez@ers.usda.gov kplattner@ers.usda.gov Katherine Baldwin Erik Dohlman kbaldwin@ers.usda.gov edohlman@ers.usda.gov U.S.
Coffee market remains volatile but lacks direction
 Coffee market remains volatile but lacks direction Prices fluctuated significantly during August, with the ICO composite indicator dropping by 10 cents before jumping back up another 12 cents by the end
Guatemala. Sugar Annual Guatemala Sugar Annual
 THIS REPORT CONTAINS ASSESSMENTS OF COMMODITY AND TRADE ISSUES MADE BY USDA STAFF AND NOT NECESSARILY STATEMENTS OF OFFICIAL U.S. GOVERNMENT POLICY Required Report - public distribution Date: GAIN Report
MONTHLY COFFEE MARKET REPORT
 E MONTHLY COFFEE MARKET REPORT December 2011 In December 2011 Arabica prices underwent significant downward corrections while Robusta prices increased slightly. The average of the 2 nd and 3 rd positions
Milk and Milk Products: Price and Trade Update
 Milk and Milk Products: Price and Trade Update June 217 * International dairy prices The FAO Dairy Price Index averaged 29 points in June, up 16 points (8.3 percent) from January 217 and 71 points (51.5
THIS REPORT CONTAINS ASSESSMENTS OF COMMODITY AND TRADE ISSUES MADE BY USDA STAFF AND NOT NECESSARILY STATEMENTS OF OFFICIAL U.S.
 THIS REPORT CONTAINS ASSESSMENTS OF COMMODITY AND TRADE ISSUES MADE BY USDA STAFF AND NOT NECESSARILY STATEMENTS OF OFFICIAL U.S. GOVERNMENT POLICY Voluntary - Public Date: 4/24/2013 GAIN Report Number:
The Potential Role of Latin America Food Trade in Asia Pacific PECC Agricultural and Food Policy Forum Taipei
 The Potential Role of Latin America Food Trade in Asia Pacific 2011 PECC Agricultural and Food Policy Forum Taipei Universidad EAFIT, Colombia December 2, 2011 1 CONTENTS 1. Introduction 2. Food Trade
MARKET OPORTUNITIES IN COLOMBIA BEAN DAY 2015 FARGO, NORTH DAKOTA JANUARY, 2015
 MARKET OPORTUNITIES IN COLOMBIA BEAN DAY 2015 FARGO, NORTH DAKOTA JANUARY, 2015 Market Overview National Bean Production (MT) Production Bean Imports (MT) Beans Imports 141,349 42,123 119,069 40,363 112,188
World Cocoa Prices. Commodity Prices Update: Coffee, Cocoa, and Cotton. Joelle Cook and Professor C. Leigh Anderson
 SDR per tonne Commodity Prices Update: Coffee, Cocoa, and Cotton Joelle Cook and Professor C. Leigh Anderson Prepared for the Agricultural Policy and Statistics Division of the Bill and Melinda Gates Foundation
2014 U.S. Dry Bean Outlook
 2014 U.S. Dry Bean Outlook Steven Zahniser and Hodan Farah Wells USDA Economic Research Service Presentation delivered at U.S. Dry Bean Convention Coeur d Alene, ID, August 5, 2014 The views expressed
Coffee market ends 2015/16 in deficit for the second consecutive year
 Coffee market ends 2015/16 in deficit for the second consecutive year The coffee market settled up by 5.5% in September, mostly driven by a steady increase in Robusta prices supported by concerns over
Dairy Market. Overview. Commercial Use of Dairy Products
 Dairy Market Dairy Management Inc. R E P O R T Volume 21 No. 6 June 2018 DMI NMPF Overview U.S. dairy markets received a one-two punch during the first weeks of June in the form of collateral damage from
The supply and demand for oilseeds in South Africa
 THIS REPORT CONTAINS ASSESSMENTS OF COMMODITY AND TRADE ISSUES MADE BY USDA STAFF AND NOT NECESSARILY STATEMENTS OF OFFICIAL U.S. GOVERNMENT POLICY Required Report - public distribution Date: GAIN Report
Vegetable Imports Approaching 20% of Total
 Vegetable Imports Approaching 20% of Total Domestic Supply The taste of imported vegetables has become more familiar to the palates of Japanese consumers in recent years. According to the Ministry of Finance,
January 2015 WORLD GRAPE MARKET SUPPLY, DEMAND AND FORECAST
 January 2015 WORLD GRAPE MARKET SUPPLY, DEMAND AND FORECAST Table of Contents Executive Summary... 4 1. VARIETIES OF GRAPES... 6 1.1. White table grapes... 6 1.2. Red table grapes... 6 2. WORLD DEMAND
U.S. Produce Imports from Mexico
 USDA iiiiillllllllll United States Department of Agriculture U.S. Produce Imports from Mexico Linda Calvin and Steven Zahniser U.S. Department of Agriculture Economic Research Service Presentation to the
UTZ Cocoa Statistics Report 2017
 UTZ Cocoa Statistics Report 2017 UTZ is the largest program in the world for sustainable cocoa There are more than 760,000 cocoa farmers in the UTZ program UTZ certified cocoa is produced in 21 countries
Coffee: World Markets and Trade
 United States Department of Agriculture Foreign Agricultural Service Circular Series December 213 Coffee: World Markets and Trade 4 in Producing Countries to Continue Rising Million 6 Kilogram Bags 3 2
Ecobank s pan-african footprint. Africa-Asia trade flows
 Ecobank s pan-african footprint Africa-Asia trade flows Ghana, Côte d Ivoire and Nigeria: The changing face of West African cocoa Dr Edward George Head of Group Research, Ecobank Lagos, February 3rd 2016
MONTHLY REPORTS PULSES JUNE - JULY 2016
 MONTHLY REPORTS PULSES Monthly Prices Movement Pulses prices overall remained firm throughout the month amid expectation of lower output, delayed Monsoon despite strict government measures to control price
Outlook for the. ASEAN INTERNATIONAL SEMINAR ON COFFEE June 2012 Kuta, Bali, Indonesia
 Outlook for the World Coffee Market ASEAN INTERNATIONAL SEMINAR ON COFFEE 12 13 June 212 Kuta, Bali, Indonesia José Sette Head of Operations ICO Composite Indicator Price (in current terms) Monthly averages:
Citrus: World Markets and Trade
 Department of Agriculture eign Agricultural Service January Citrus: World Markets and Trade Citrus: / ecast Global Orange Production and Trade Expand Global production and trade for is forecast at. million
Downward correction in coffee market as supply prospects improve
 Downward correction in coffee market as supply prospects improve The recent rally in coffee prices underwent a notable reversal in November 2016, attributed to improved weather prospects in Brazil and
Fonterra: GLOBAL DAIRY UPDATE AUGUST 2013 ISSUE TWELVE
 Fonterra: GLOBAL DAIRY UPDATE AUGUST 2013 ISSUE TWELVE Welcome to our latest Global Dairy Update. The Update is Fonterra s commitment to continually educating and informing our farmers and wider stakeholders
THIS REPORT CONTAINS ASSESSMENTS OF COMMODITY AND TRADE ISSUES MADE BY USDA STAFF AND NOT NECESSARILY STATEMENTS OF OFFICIAL U.S.
 THIS REPORT CONTAINS ASSESSMENTS OF COMMODITY AND TRADE ISSUES MADE BY USDA STAFF AND NOT NECESSARILY STATEMENTS OF OFFICIAL U.S. GOVERNMENT POLICY Required Report - public distribution Date: 5/7/2014
Update on ASEAN Steel Industry Development Scenario
 2017 ASEAN Iron and Steel Sustainability Forum Update on ASEAN Steel Industry Development Scenario Presented by: TAN AH YONG Secretary General South East Asia Iron and Steel Institute (SEAISI) CONTENTS:
THIS REPORT CONTAINS ASSESSMENTS OF COMMODITY AND TRADE ISSUES MADE BY USDA STAFF AND NOT NECESSARILY STATEMENTS OF OFFICIAL U.S.
 THIS REPORT CONTAINS ASSESSMENTS OF COMMODITY AND TRADE ISSUES MADE BY USDA STAFF AND NOT NECESSARILY STATEMENTS OF OFFICIAL U.S. GOVERNMENT POLICY Required Report - public distribution Date: GAIN Report
Overview of the Manganese Industry
 39th Annual Conference Istanbul, Turkey 2013 Overview of the Manganese Industry International Manganese Institute Alberto Saavedra Market Research Manager June, 2013 Introduction Global Production Supply,
Taiwan Fishery Trade: Import Demand Market for Shrimps. Bith-Hong Ling
 International Symposium Agribusiness Management towards Strengthening Agricultural Development and Trade III : Agribusiness Research on Marketing and Trade Taiwan Fishery Trade: Import Demand Market for
WORLD OILSEEDS AND PRODUCTS
 WORLD OILSEEDS AND PRODUCTS 218 / World Oilseeds and Products: FAPRI 2004 Agricultural Outlook World Soybean and Soybean Products The world soybean price climbed strongly in 2003/04, driven by robust demand
GLOBOIL INTERNATIONAL Emerging Trends In The Edible Oil Sector A View From Pakistan.. Abdul Rasheed Janmohammed
 GLOBOIL INTERNATIONAL 2018 27-29 April, 2018 Hotel JW Marriott Marquis, Dubai, U.A.E. Emerging Trends In The Edible Oil Sector A View From Pakistan.. By Abdul Rasheed Janmohammed Chief Executive Chief
Fruit and Tree Nuts Outlook
 United States Department of Agriculture Electronic Outlook Report from the Economic Research Service www.ers.usda.gov FTS-310 May 26, 2004 Fruit and Tree Nuts Outlook Agnes Perez and Susan Pollack Abundant
Economic Role of Maize in Thailand
 Economic Role of Maize in Thailand Hnin Ei Win Center for Applied Economics Research Thailand INTRODUCTION Maize is an important agricultural product in Thailand which is being used for both food and feed
Minutes for the Freshfel/SHAFFE Citrus Teleconference of 25 September 2009
 25th September 2009 Minutes for the Freshfel/SHAFFE Citrus Teleconference of 25 September 2009 Introduction: A declaration was made by all participants that the discussion will by no means involve matters
Dairy Market. November 2017
 Dairy Market Dairy Management Inc. R E P O R T Volume 20 No. 10 November 2017 DMI NMPF Overview U.S. Cheddar cheese prices hit a 10-month high in October, while butter prices softened but remained well
Outlook for FCOJ in 2019/20
 December 2018 Outlook for FCOJ in 2019/20 The Orange Juice Market Moves Towards Balance RaboResearch Food & Agribusiness far.rabobank.com Andrés Padilla Senior Analyst Beverages +55 11 5503 7000 Contents
MONTHLY COFFEE MARKET REPORT
 E MONTHLY COFFEE MARKET REPORT February 2012 Coffee prices presented a mixed performance in February, with Arabicas slipping and Robustas increasing by a similar amount. This resulted in a sharp narrowing