Growth in early yyears: statistical and clinical insights
|
|
|
- Regina Morgan
- 5 years ago
- Views:
Transcription
1 Growth in early yyears: statistical and clinical insights Tim Cole Population, Policy and Practice Programme UCL Great Ormond Street Institute of Child Health London WC1N 1EH UK
2 Child growth Growth is the unique paediatric indicator of well-being, which can monitor a child for endocrine, nutritional, emotional and physical health Ian Jefferson
3 How to assess growth Measure child Plot on growth chart Read growth chart Take action


4 Centiles and centile crossing high centile low centile centile tracking centiles UK-WHO chart
5 What is a centile? Centile - percentage point of the frequency distribution Cut-off identifies that percentage of children with measurements below it Examples 50% of children lie below 50th centile (median) 25% of children lie below 25th centile 99.6% of children lie below 99.6th centile (0.4% above) The cut-offs vary by age, so the centiles appear as curves on the growth chart
6 Growth distance and velocity Growth chart is road to health Current size (i.e. centile) indicates distance travelled Centile crossing indicates velocity of travel Growth chart quantifies size/distance Centile Growth chart does not quantify growth velocity Centile crossing is uncalibrated Ironic - growth chart does not measure growth
7 A new concept: growth acceleration Growth distance One measurement Centile Growth velocity Two measurements Centile crossing Growth acceleration Three measurements Change in centile crossing
8 Distance - one measurement
9 Velocity two measurements
10 Acceleration three measurements
11 Growth pattern many measurements
12 Growth pattern many measurements Modelling growth curves with SITAR Provides simple summary of individual growth patterns
13 Aims To show how statistics helps chart assessment for: 1. Growth distance 2. Growth velocity 3. Growth acceleration 4. Growth pattern
14 Growth distance One measurement
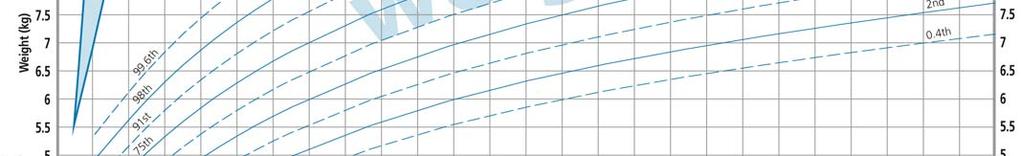
15 Constructing growth charts Growth charts designed to assess single measurements Compare measurement to distribution of reference measurements for age and sex LMS method popular way to construct growth charts Worked example for weight in girls Cole TJ, Green PJ. Smoothing reference centile curves: the LMS method and penalized likelihood. Stat Med 1992;11:
16 Constructing growth charts Weight in 4000 girls Age 1-21 years Aim: to define weight distribution at each age 95% below 95 th centile 50% below 50 th centile 5% below 5 th centile etc
17 Constructing growth charts Weight in 4000 girls Age 1-21 years Aim: to define weight distribution at each age Construct smooth centile curves 50% below 50 th centile 3% below 3 rd centile 97% below 97 th centile etc
18 LMS method Cole, JRSS A (1988) Split into narrow age groups Summarise distribution in each group Need to adjust for skewness Raise weight to Box-Cox power λ Calculate mean μ and coefficient of variation σ So λ μ and σ vary by age
19 LMS method Plot λ μ and σ against age and fit smooth curves L curve for Box-Cox power λ M curve for median μ S curve for coeff of variation σ Hence LMS method
20 LMS method Centile curves are functions of L M and S curves So if L M and S curves are smooth, centiles are too
21 Cole-Green LMS method Peter Green (1988) proposed using maximum penalized likelihood to improve LMS method Elegantly avoids arbitrary age groupings See Cole & Green, Stat Med (1992) Now the standard method Peter Green FRS

22 40 countries use LMS method WHO growth standard
23 Growth velocity Two measurements
24 Growth velocity Velocity appears as centile crossing on chart Two problems with chart centiles They assess distance not velocity Light babies grow faster, heavy babies slower Regression to the mean So velocity depends on starting weight Only experience can tell if centile crossing is abnormal Need a way to flag abnormal centile crossing on chart
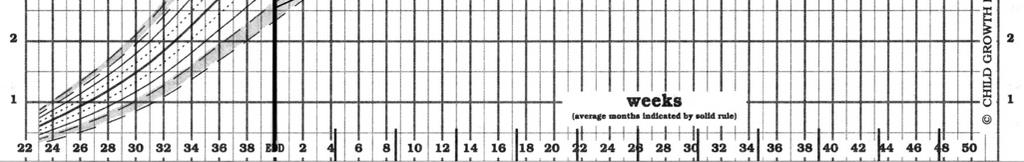
25 Velocity and centile crossing Show line on chart whose slope corresponds to 5 th velocity centile over 4 weeks Depends on age and initial centile
26 Centile crossing over 4 weeks
27 Statistics of centile crossing Two weights 4 weeks apart Convert to z-scores z 1 and z 2 Expected mean of z 2 is r.z 1 where r is correlation between z-scores SD of z 2 is 1-r 2 So 5 th centile for z 2 is z 2 = Mean 1.64 SD = r.z r 2 So z 2 depends on z 1 and r
28 Thrive lines for growth velocity For ages 0-4, 4-8, 8-12 weeks calculate correlations r 0-4 4, r 4-8 8, r 8-12 etc Choose baseline value z 0 Then using formula z 0 > z 4 > z 8 > z 12 defines a curve Call the curve a thrive line as it defines failure to thrive Cole TJ. Presenting information on growth distance and conditional velocity in one chart: practical issues of chart design. Stat Med 1998;17:
29 Thrive line overlay - 5th centile weight gain Boys weight 5th centile for 4-week intervals
30 Thrive lines Thrive lines assess weight velocity 5th velocity centile Over a 4-week period A child s plot that tracks along the thrive lines for 4 weeks is growing on the 5th velocity centile Tracking for longer is worse: e.g. for 8 weeks, growth < 1st velocity centile Thrive lines presented as plastic overlay to superimpose on chart
31 Mild centile crossing - 1 channel width over 8 weeks
32 Weight gain above 5th centile
33 Weight gain above 5th centile
34 Moderate centile crossing - 2 channel widths over 8 weeks


35 Weight gain below 5th centile
36 Weight gain below 5th centile
37 Thrive 95 lines Rapid infant weight gain also a concern Useful to identify rapid weight gain Hence Thrive 95 lines Define 95th centile for weight gain


38 Thrive 95 lines
39


40


41 Thrive 5 and Thrive 95 lines 5th centile weight gain 95th centile weight gain
42 Benefit of thrive lines Plastic overlay designed to fit on British 1990 chart format Distance and velocity both assessed yet data plotted just once No need for separate distance and velocity charts Useful addition to weight chart
43 Thrive lines and electronic charts Now easy to add thrive lines to electronic charts Thrive lines can be drawn for any required velocity centile, e.g. 1 st or 99 th Switch between distance and velocity centiles
44 Distance centiles
45 Velocity centiles
46 Growth acceleration Three measurements
47 Question You observe an infant grow over 4 weeks They show upward or downward centile crossing Ask yourself: How will they grow over the next 4 weeks? Will they stay on the same centile? Will they continue to cross centiles the same way? Or will they cross centiles the other way?


48 Centile crossing over 4 weeks
49 Statistics of centile crossing and deviation As before, convert weights to z-scores The change in z-score over 4 weeks is deviation e.g. from birth to 4 weeks: Deviation = z 4 z 0 = d 04 Deviation the same as centile crossing Research question: What is the correlation between successive deviations? e.g. correlation between d 04 and d 48 Possible answers: zero, positive or negative
50 Two growth studies of Cambridge infants Widdowson Study ( ) 1094 infants measured monthly from 0-12 months Representative of Cambridge infants in ~1960 Weights obtained from child welfare clinics Cambridge Infant Growth Study ( ) 255 infants measured every 4 weeks from 0-52 weeks Families more selected and of higher social class Infants weighed by experienced research nurse In brief, monthly weights in infancy
51 Correlation between successive deviations Widdowson Study C I G Study Age 3-4 months positive correlation
52 Correlation between successive deviations Widdowson Study C I G Study Age months negative correlation
53 Surprise - deviations are correlated! At 3-4 months there is a positive correlation Infants crossing centiles one month are likely to cross centiles in the same direction the next month At months there is a negative correlation Infants crossing centiles are likely to cross centiles in the opposite direction the next month Cole TJ, Singhal A, Fewtrell MS, et al. Weight centile crossing in infancy: correlations between successive months show evidence of growth feedback and an infant-child growth transition. Am J Clin Nutr 2016;104:
54 How does the correlation change with age?
55 Deviation and feedback Before 6 months infants crossing centiles tend to continue to cross centiles After 6 months they tend to cross back again Examples of feedback Positive feedback before 6 months Negative feedback after 6 months
56 Positive feedback Before 6 months, some young infants want to shift to a different centile Mismatch between fetal growth and target size? So need to cross centiles in same direction for a time But eventually reach their target Example of positive feedback
57 Negative feedback Older infants depart from growth trajectory due to some exposure e.g. infection leads to downward centile crossing Response is to compensate the following month e.g. catch-up following infection Example of negative feedback
58 Implications for chart assessment Centile crossing predicts centile crossing But depends on age Early centile crossing (before 6 months) Expect more centile crossing Late centile crossing (after 6 months) Expect reverse centile crossing Mid-age centile crossing Expect centile tracking Easiest to see on weight z-score scale
59 Growth velocity and growth assessment
60 Growth acceleration and feedback Assessment of acceleration a novel idea Highlights change from positive to negative feedback Reflects how and why centile crossing becomes less common with increasing age in infancy
61 Growth pattern Many measurements
62 Variation in growth pattern Interesting to look at individual growth curves To see how they differ, and how they are the same Here are a sample of growth curves from the Cambridge Infant Growth Study
63
64
65
66
67
68
69
70
71 Summarising growth pattern Curves largely the same shape But differing in position Some high, some low Some steep, some shallow SITAR is a growth curve model that adjusts each curve for being high/low h/l (size) early/late (timing) steep/shallow (intensity)
72 All growth curves, colour-coded measured every 4 weeks
73 SITAR SITAR adjustment makes all curves like the mean curve High curves shifted down, low curves up (size) Steep curves made shallower, shallow steeper (intensity) Early curves shifted later, late curves earlier (timing) Size, timing and intensity estimated as random effects Net effect is to superimpose curves Then fit mean curve through superimposed curves
74 All growth curves, colour-coded measured every 4 weeks
75 All growth curves, colour-coded after SITAR adjustment
76 All growth curves, colour-coded with SITAR mean curve
77 SITAR growth patterns SITAR converts growth curves: to a mean curve: and a growth pattern for each individual: size, timing, intensity Summary like growth distance or growth velocity SITAR - a useful instrument for growth curve analysis. Cole TJ, Donaldson MD, Ben-Shlomo Y. Int J Epidemiol 2010;39:
78 SITAR growth patterns SITAR explains over 95% of variance Very ygood fit So random effects define individual growth pattern Can be used as individual growth summary To relate to earlier exposures or later life course BUT note that SITAR not useful clinically It needs whole growth curve Comes too late to make clinical decisions
79 Conclusions Growth summary for one, two, three and many measurements Distance, velocity, acceleration and pattern Useful to assess growth in individuals Improving decision making Shows how statistics can help in the assessment of growth
STA Module 6 The Normal Distribution
 STA 2023 Module 6 The Normal Distribution Learning Objectives 1. Explain what it means for a variable to be normally distributed or approximately normally distributed. 2. Explain the meaning of the parameters
STA Module 6 The Normal Distribution. Learning Objectives. Examples of Normal Curves
 STA 2023 Module 6 The Normal Distribution Learning Objectives 1. Explain what it means for a variable to be normally distributed or approximately normally distributed. 2. Explain the meaning of the parameters
The multivariate piecewise linear growth model for ZHeight and zbmi can be expressed as:
 Bi-directional relationships between body mass index and height from three to seven years of age: an analysis of children in the United Kingdom Millennium Cohort Study Supplementary material The multivariate
SENIOR VCAL NUMERACY INVESTIGATION SENIOR VCAL NUMERACY INVESTIGATION Only A Little Bit Over. Name:
 Instructions SENIOR VCAL NUMERACY INVESTIGATION 2013 SENIOR VCAL NUMERACY INVESTIGATION Only A Little Bit Over Name: This investigation is split into 3 Sections (A, B & C). You must ensure the following
wine 1 wine 2 wine 3 person person person person person
 1. A trendy wine bar set up an experiment to evaluate the quality of 3 different wines. Five fine connoisseurs of wine were asked to taste each of the wine and give it a rating between 0 and 10. The order
Dietary Diversity in Urban and Rural China: An Endogenous Variety Approach
 Dietary Diversity in Urban and Rural China: An Endogenous Variety Approach Jing Liu September 6, 2011 Road Map What is endogenous variety? Why is it? A structural framework illustrating this idea An application
BORDEAUX WINE VINTAGE QUALITY AND THE WEATHER ECONOMETRIC ANALYSIS
 BORDEAUX WINE VINTAGE QUALITY AND THE WEATHER ECONOMETRIC ANALYSIS WINE PRICES OVER VINTAGES DATA The data sheet contains market prices for a collection of 13 high quality Bordeaux wines (not including
Activity 10. Coffee Break. Introduction. Equipment Required. Collecting the Data
 . Activity 10 Coffee Break Economists often use math to analyze growth trends for a company. Based on past performance, a mathematical equation or formula can sometimes be developed to help make predictions
CHAPTER 2 ANNUAL RETAIL FOOD PRICE MOVEMENTS
 Part 3 2.1 Introduction CHAPTER 2 ANNUAL RETAIL FOOD PRICE MOVEMENTS The Institute for Planning Research, a research institute attached to the University of Port Elizabeth started a longitudinal research
Using Growing Degree Hours Accumulated Thirty Days after Bloom to Help Growers Predict Difficult Fruit Sizing Years
 Using Growing Degree Hours Accumulated Thirty Days after Bloom to Help Growers Predict Difficult Fruit Sizing Years G. Lopez 1 and T. DeJong 2 1 Àrea de Tecnologia del Reg, IRTA, Lleida, Spain 2 Department
Predicting Wine Quality
 March 8, 2016 Ilker Karakasoglu Predicting Wine Quality Problem description: You have been retained as a statistical consultant for a wine co-operative, and have been asked to analyze these data. Each
Final Exam Financial Data Analysis (6 Credit points/imp Students) March 2, 2006
 March 2, 2006") Dr. Roland Füss Winter Term 2005/2006 Final Exam Financial Data Analysis (6 Credit points/imp Students) March 2, 2006 Note the following important information: 1. The total disposal time is 60 minutes.
Dr. Roland Füss Winter Term 2005/2006 Final Exam Financial Data Analysis (6 Credit points/imp Students) March 2, 2006 Note the following important information: 1. The total disposal time is 60 minutes.
From VOC to IPA: This Beer s For You!
 From VOC to IPA: This Beer s For You! Joel Smith Statistician Minitab Inc. jsmith@minitab.com 2013 Minitab, Inc. Image courtesy of amazon.com The Data Online beer reviews Evaluated overall and: Appearance
IT 403 Project Beer Advocate Analysis
 1. Exploratory Data Analysis (EDA) IT 403 Project Beer Advocate Analysis Beer Advocate is a membership-based reviews website where members rank different beers based on a wide number of categories. The
Lollapalooza Did Not Attend (n = 800) Attended (n = 438)
 Attended (n = 438)") D SDS H F 1, 16 ( ) Warm-ups (A) Which bands come to ACL Fest? Is it true that if a band plays at Lollapalooza, then it is more likely to play at Austin City Limits (ACL) that year? To be able to provide
D SDS H F 1, 16 ( ) Warm-ups (A) Which bands come to ACL Fest? Is it true that if a band plays at Lollapalooza, then it is more likely to play at Austin City Limits (ACL) that year? To be able to provide
ICC September 2018 Original: English. Emerging coffee markets: South and East Asia
 ICC 122-6 7 September 2018 Original: English E International Coffee Council 122 st Session 17 21 September 2018 London, UK Emerging coffee markets: South and East Asia Background 1. In accordance with
Business Statistics /82 Spring 2011 Booth School of Business The University of Chicago Final Exam
 Business Statistics 41000-81/82 Spring 2011 Booth School of Business The University of Chicago Final Exam Name You may use a calculator and two cheat sheets. You have 3 hours. I pledge my honor that I
Chapter 3. Labor Productivity and Comparative Advantage: The Ricardian Model. Pearson Education Limited All rights reserved.
 Chapter 3 Labor Productivity and Comparative Advantage: The Ricardian Model 1-1 Preview Opportunity costs and comparative advantage A one-factor Ricardian model Production possibilities Gains from trade
Emerging Local Food Systems in the Caribbean and Southern USA July 6, 2014
 Consumers attitudes toward consumption of two different types of juice beverages based on country of origin (local vs. imported) Presented at Emerging Local Food Systems in the Caribbean and Southern USA
Comparing R print-outs from LM, GLM, LMM and GLMM
 3. Inference: interpretation of results, plotting results, confidence intervals, hypothesis tests (Wald,LRT). 4. Asymptotic distribution of maximum likelihood estimators and tests. 5. Checking the adequacy
Online Appendix to The Effect of Liquidity on Governance
 Online Appendix to The Effect of Liquidity on Governance Table OA1: Conditional correlations of liquidity for the subsample of firms targeted by hedge funds This table reports Pearson and Spearman correlations
Panel A: Treated firm matched to one control firm. t + 1 t + 2 t + 3 Total CFO Compensation 5.03% 0.84% 10.27% [0.384] [0.892] [0.
![Panel A: Treated firm matched to one control firm. t + 1 t + 2 t + 3 Total CFO Compensation 5.03% 0.84% 10.27% [0.384] [0.892] [0.](/thumbs/90/101398922.jpg "Panel A: Treated firm matched to one control firm. t + 1 t + 2 t + 3 Total CFO Compensation 5.03% 0.84% 10.27% [0.384] [0.892] [0.") Online Appendix 1 Table O1: Determinants of CMO Compensation: Selection based on both number of other firms in industry that have CMOs and number of other firms in industry with MBA educated executives
Online Appendix 1 Table O1: Determinants of CMO Compensation: Selection based on both number of other firms in industry that have CMOs and number of other firms in industry with MBA educated executives
1.3 Box & Whisker Plots
 1.3 Box & Whisker Plots Box and Whisker Plots or box plots, are useful for showing the distribution of values in a data set. The box plot below is an example. A box plot is constructed from the five-number
Chapter 3. Labor Productivity and Comparative Advantage: The Ricardian Model
 Chapter 3 Labor Productivity and Comparative Advantage: The Ricardian Model Preview Opportunity costs and comparative advantage A one-factor Ricardian model Production possibilities Gains from trade Wages
Preview. Chapter 3. Labor Productivity and Comparative Advantage: The Ricardian Model
 Chapter 3 Labor Productivity and Comparative Advantage: The Ricardian Model Preview Opportunity costs and comparative advantage A one-factor Ricardian model Production possibilities Gains from trade Wages
Wine-Tasting by Numbers: Using Binary Logistic Regression to Reveal the Preferences of Experts
 Wine-Tasting by Numbers: Using Binary Logistic Regression to Reveal the Preferences of Experts When you need to understand situations that seem to defy data analysis, you may be able to use techniques
The Financing and Growth of Firms in China and India: Evidence from Capital Markets
 The Financing and Growth of Firms in China and India: Evidence from Capital Markets Tatiana Didier Sergio Schmukler Dec. 12-13, 2012 NIPFP-DEA-JIMF Conference Macro and Financial Challenges of Emerging
REPORT OF THE WORKING GROUP ON TEA BREW BY T C CHAUDHURI N MURALEEDHARAN ANOOP KUMAR BAROOAH
 REPORT OF THE WORKING GROUP ON TEA BREW BY T C CHAUDHURI N MURALEEDHARAN ANOOP KUMAR BAROOAH ON BEHALF OF RESIDUE SCIENTISTS WORKING AT TRA, JORHAT & UPASI TRF, INDIA Decisions in the 18 th Session IGG,
Transportation demand management in a deprived territory: A case study in the North of France
 Transportation demand management in a deprived territory: A case study in the North of France Hakim Hammadou and Aurélie Mahieux mobil. TUM 2014 May 20th, 2014 Outline 1) Aim of the study 2) Methodology
Analysis of Things (AoT)
") Analysis of Things (AoT) Big Data & Machine Learning Applied to Brent Crude Executive Summary Data Selecting & Visualising Data We select historical, monthly, fundamental data We check for correlations
Analysis of Things (AoT) Big Data & Machine Learning Applied to Brent Crude Executive Summary Data Selecting & Visualising Data We select historical, monthly, fundamental data We check for correlations
EXECUTIVE SUMMARY. 1. When do Asian clams reproduce in Lake George? 2. How fast do Asian clams grow in Lake George?
 Reproduction and Growth of Asian Clams in Lake George Report to the Lake George Association 3-21-16 Sandra Nierzwicki-Bauer, Jeremy Farrell Darrin Fresh Water Institute EXECUTIVE SUMMARY Asian clams have
DOES BEER PLAY A SOLE ROLE IN ALCOHOL AND HEALTH SYMPHONY?
 6 th Beer and Health Symposium: from Myths to Science Bibliothèque Solvay Leopoldpark Brussels, 20 September 2011 DOES BEER PLAY A SOLE ROLE IN ALCOHOL AND HEALTH SYMPHONY? Licia Iacoviello MD, PhD Simona
Biologist at Work! Experiment: Width across knuckles of: left hand. cm... right hand. cm. Analysis: Decision: /13 cm. Name
 wrong 0 1 2 3 4 5 6 7 8 9 10 11 12 13 14 15 16 17 18 19 20 right 72 71 70 69 68 67 66 65 64 63 62 61 60 59 58 57 56 55 54 53 52 score 100 98.6 97.2 95.8 94.4 93.1 91.7 90.3 88.9 87.5 86.1 84.7 83.3 81.9
Fairtrade Buying Behaviour: We Know What They Think, But Do We Know What They Do?
 Fairtrade Buying Behaviour: We Know What They Think, But Do We Know What They Do? Dr. Fred A. Yamoah Prof. Andrew Fearne Dr. Rachel Duffy Dr. Dan Petrovici Background/Context The UK is a major market for
*p <.05. **p <.01. ***p <.001.
 Table 1 Weighted Descriptive Statistics and Zero-Order Correlations with Fatherhood Timing (N = 1114) Variables Mean SD Min Max Correlation Interaction time 280.70 225.47 0 1095 0.05 Interaction time with
Haddock. Seafood Industry Factsheet. Market overview: haddock
 Seafood Industry Factsheet Haddock Market overview: haddock The UK s supply of haddock (Melanogrammus aeglefinus) relies on imports and domestic landings by the UK fleet. Haddock is popular in both retail
Napa County Planning Commission Board Agenda Letter
 Agenda Date: 7/1/2015 Agenda Placement: 10A Continued From: May 20, 2015 Napa County Planning Commission Board Agenda Letter TO: FROM: Napa County Planning Commission John McDowell for David Morrison -
Handling Missing Data. Ashley Parker EDU 7312
 Handling Missing Data Ashley Parker EDU 7312 Presentation Outline Types of Missing Data Treatments for Handling Missing Data Deletion Techniques Listwise Deletion Pairwise Deletion Single Imputation Techniques
Gail E. Potter, Timo Smieszek, and Kerstin Sailer. April 24, 2015
 Supplementary Material to Modelling workplace contact networks: the effects of organizational structure, architecture, and reporting errors on epidemic predictions, published in Network Science Gail E.
November K. J. Martijn Cremers Lubomir P. Litov Simone M. Sepe
 ONLINE APPENDIX TABLES OF STAGGERED BOARDS AND LONG-TERM FIRM VALUE, REVISITED November 016 K. J. Martijn Cremers Lubomir P. Litov Simone M. Sepe The paper itself is available at https://papers.ssrn.com/sol3/papers.cfm?abstract-id=364165.
STAT 5302 Applied Regression Analysis. Hawkins
 Homework 3 sample solution 1. MinnLand data STAT 5302 Applied Regression Analysis. Hawkins newdata
Gasoline Empirical Analysis: Competition Bureau March 2005
 Gasoline Empirical Analysis: Update of Four Elements of the January 2001 Conference Board study: "The Final Fifteen Feet of Hose: The Canadian Gasoline Industry in the Year 2000" Competition Bureau March
HW 5 SOLUTIONS Inference for Two Population Means
 HW 5 SOLUTIONS Inference for Two Population Means 1. The Type II Error rate, β = P{failing to reject H 0 H 0 is false}, for a hypothesis test was calculated to be β = 0.07. What is the power = P{rejecting
Preview. Introduction. Chapter 3. Labor Productivity and Comparative Advantage: The Ricardian Model
 Chapter 3 Labor Productivity and Comparative Advantage: The Ricardian Model 1-1 Preview Opportunity costs and comparative advantage A one-factor Ricardian model Production possibilities Gains from trade
Multiple Imputation for Missing Data in KLoSA
 Multiple Imputation for Missing Data in KLoSA Juwon Song Korea University and UCLA Contents 1. Missing Data and Missing Data Mechanisms 2. Imputation 3. Missing Data and Multiple Imputation in Baseline
Pitfalls for the Construction of a Welfare Indicator: An Experimental Analysis of the Better Life Index
 Clemens Hetschko, Louisa von Reumont & Ronnie Schöb Pitfalls for the Construction of a Welfare Indicator: An Experimental Analysis of the Better Life Index University Alliance of Sustainability Spring
A latent class approach for estimating energy demands and efficiency in transport:
 Energy Policy Research Group Seminars A latent class approach for estimating energy demands and efficiency in transport: An application to Latin America and the Caribbean Manuel Llorca Oviedo Efficiency
Imputation of multivariate continuous data with non-ignorable missingness
 Imputation of multivariate continuous data with non-ignorable missingness Thais Paiva Jerry Reiter Department of Statistical Science Duke University NCRN Meeting Spring 2014 May 23, 2014 Thais Paiva, Jerry
Missing value imputation in SAS: an intro to Proc MI and MIANALYZE
 Victoria SAS Users Group November 26, 2013 Missing value imputation in SAS: an intro to Proc MI and MIANALYZE Sylvain Tremblay SAS Canada Education Copyright 2010 SAS Institute Inc. All rights reserved.
Can You Tell the Difference? A Study on the Preference of Bottled Water. [Anonymous Name 1], [Anonymous Name 2]
![Can You Tell the Difference? A Study on the Preference of Bottled Water. [Anonymous Name 1], [Anonymous Name 2]](/thumbs/78/76759741.jpg "Can You Tell the Difference? A Study on the Preference of Bottled Water. [Anonymous Name 1], [Anonymous Name 2]") Can You Tell the Difference? A Study on the Preference of Bottled Water [Anonymous Name 1], [Anonymous Name 2] Abstract Our study aims to discover if people will rate the taste of bottled water differently
Can You Tell the Difference? A Study on the Preference of Bottled Water [Anonymous Name 1], [Anonymous Name 2] Abstract Our study aims to discover if people will rate the taste of bottled water differently
Which of the following are resistant statistical measures? 1. Mean 2. Median 3. Mode 4. Range 5. Standard Deviation
 Which of the following are resistant statistical measures? 1. Mean 2. Median 3. Mode 4. Range 5. Standard Deviation For the variable number of parking tickets in the past year would you expect the distribution
Structural Reforms and Agricultural Export Performance An Empirical Analysis
 Structural Reforms and Agricultural Export Performance An Empirical Analysis D. Susanto, C. P. Rosson, and R. Costa Department of Agricultural Economics, Texas A&M University College Station, Texas INTRODUCTION
Which of your fingernails comes closest to 1 cm in width? What is the length between your thumb tip and extended index finger tip? If no, why not?
 wrong 0 1 2 3 4 5 6 7 8 9 10 11 12 13 14 15 16 17 right 66 65 64 63 62 61 60 59 58 57 56 55 54 53 52 51 50 49 score 100 98.5 97.0 95.5 93.9 92.4 90.9 89.4 87.9 86.4 84.8 83.3 81.8 80.3 78.8 77.3 75.8 74.2
Problem Set #3 Key. Forecasting
 Problem Set #3 Key Sonoma State University Business 581E Dr. Cuellar The data set bus581e_ps3.dta is a Stata data set containing annual sales (cases) and revenue from December 18, 2004 to April 2 2011.
Preview. Introduction (cont.) Introduction. Comparative Advantage and Opportunity Cost (cont.) Comparative Advantage and Opportunity Cost
 Introduction. Comparative Advantage and Opportunity Cost (cont.) Comparative Advantage and Opportunity Cost") Chapter 3 Labor Productivity and Comparative Advantage: The Ricardian Model Preview Opportunity costs and comparative advantage A one-factor Ricardian model Production possibilities Gains from trade Wages
Chapter 3 Labor Productivity and Comparative Advantage: The Ricardian Model Preview Opportunity costs and comparative advantage A one-factor Ricardian model Production possibilities Gains from trade Wages
PEEL RIVER HEALTH ASSESSMENT
 PEEL RIVER HEALTH ASSESSMENT CONTENTS SUMMARY... 2 Overall River Health Scoring... 2 Overall Data Sufficiency Scoring... 2 HYDROLOGY... 3 Overall Hydrology River Health Scoring... 3 Hydrology Data Sufficiency...
Lack of Credibility, Inflation Persistence and Disinflation in Colombia
 Lack of Credibility, Inflation Persistence and Disinflation in Colombia Second Monetary Policy Workshop, Lima Andrés González G. and Franz Hamann Banco de la República http://www.banrep.gov.co Banco de
Experimental characterization of short channel bulk MOSFET devices with different gate LER
 1 Experimental characterization of short channel bulk MOSFET devices with different gate LER SFR Workshop Nov. 14, 2 Shiying Xiong, J. Bokor EECS of UC-Berkeley Qi Xiang, Philip Fisher, Ian Dudley, Paula
Preview. Introduction. Chapter 3. Labor Productivity and Comparative Advantage: The Ricardian Model
 Chapter 3 Labor Productivity and Comparative Advantage: The Ricardian Model. Preview Opportunity costs and comparative advantage A one-factor Ricardian model Production possibilities Gains from trade Wages
EFFECT OF TOMATO GENETIC VARIATION ON LYE PEELING EFFICACY TOMATO SOLUTIONS JIM AND ADAM DICK SUMMARY
 EFFECT OF TOMATO GENETIC VARIATION ON LYE PEELING EFFICACY TOMATO SOLUTIONS JIM AND ADAM DICK 2013 SUMMARY Several breeding lines and hybrids were peeled in an 18% lye solution using an exposure time of
Recent U.S. Trade Patterns (2000-9) PP542. World Trade 1929 versus U.S. Top Trading Partners (Nov 2009) Why Do Countries Trade?
 PP542. World Trade 1929 versus U.S. Top Trading Partners (Nov 2009) Why Do Countries Trade?") PP542 Trade Recent U.S. Trade Patterns (2000-9) K. Dominguez, Winter 2010 1 K. Dominguez, Winter 2010 2 U.S. Top Trading Partners (Nov 2009) World Trade 1929 versus 2009 4 K. Dominguez, Winter 2010 3 K.
PP542 Trade Recent U.S. Trade Patterns (2000-9) K. Dominguez, Winter 2010 1 K. Dominguez, Winter 2010 2 U.S. Top Trading Partners (Nov 2009) World Trade 1929 versus 2009 4 K. Dominguez, Winter 2010 3 K.
WINE GRAPE TRIAL REPORT
 WINE GRAPE TRIAL REPORT Stellenbosch, Western Cape Louisvale 2008/09 season Introduction A trial was conducted in the Stellenbosch area on an older wine grape vineyard to determine whether AnnGro alone,
Grape Growers of Ontario Developing key measures to critically look at the grape and wine industry
 Grape Growers of Ontario Developing key measures to critically look at the grape and wine industry March 2012 Background and scope of the project Background The Grape Growers of Ontario GGO is looking
Chapter 3: Labor Productivity and Comparative Advantage: The Ricardian Model
 Chapter 3: Labor Productivity and Comparative Advantage: The Ricardian Model Krugman, P.R., Obstfeld, M.: International Economics: Theory and Policy, 8th Edition, Pearson Addison-Wesley, 27-53 1 Preview
Structures of Life. Investigation 1: Origin of Seeds. Big Question: 3 rd Science Notebook. Name:
 3 rd Science Notebook Structures of Life Investigation 1: Origin of Seeds Name: Big Question: What are the properties of seeds and how does water affect them? 1 Alignment with New York State Science Standards
The Sources of Risk Spillovers among REITs: Asset Similarities and Regional Proximity
 The Sources of Risk Spillovers among REITs: Asset Similarities and Regional Proximity Zeno Adams EBS Business School Roland Füss EBS Business School ZEW Mannheim Felix Schinder ZEW Mannheim Steinbeis University
Update to A Comprehensive Look at the Empirical Performance of Equity Premium Prediction
 Update to A Comprehensive Look at the Empirical Performance of Equity Premium Prediction Amit Goyal UNIL Ivo Welch UCLA September 17, 2014 Abstract This file contains updates, one correction, and links
Specialty Coffee Market Research 2013
 Specialty Coffee Market Research 03 The research was divided into a first stage, consisting of interviews (37 companies), and a second stage, consisting of a survey using the Internet (0 companies/individuals).
ARE THERE SKILLS PAYOFFS IN LOW AND MIDDLE-INCOME COUNTRIES?
 ARE THERE SKILLS PAYOFFS IN LOW AND MIDDLE-INCOME COUNTRIES? Namrata Tognatta SKILLS GSG SEMINARS WEEK Earnings Returns to Schooling and Skills December 7, 2015 Outline Motivation and Research Questions
OF THE VARIOUS DECIDUOUS and
 (9) PLAXICO, JAMES S. 1955. PROBLEMS OF FACTOR-PRODUCT AGGRE- GATION IN COBB-DOUGLAS VALUE PRODUCTIVITY ANALYSIS. JOUR. FARM ECON. 37: 644-675, ILLUS. (10) SCHICKELE, RAINER. 1941. EFFECT OF TENURE SYSTEMS
An application of cumulative prospect theory to travel time variability
 Katrine Hjorth (DTU) Stefan Flügel, Farideh Ramjerdi (TØI) An application of cumulative prospect theory to travel time variability Sixth workshop on discrete choice models at EPFL August 19-21, 2010 Page
Online Appendix to Voluntary Disclosure and Information Asymmetry: Evidence from the 2005 Securities Offering Reform
 Online Appendix to Voluntary Disclosure and Information Asymmetry: Evidence from the 2005 Securities Offering Reform This document contains several additional results that are untabulated but referenced
The Elasticity of Substitution between Land and Capital: Evidence from Chicago, Berlin, and Pittsburgh
 The Elasticity of Substitution between Land and Capital: Evidence from Chicago, Berlin, and Pittsburgh Daniel McMillen University of Illinois Ph.D., Northwestern University, 1987 Implications of the Elasticity
Price & Time Symmetry DENNIS W. WILBORN, SR.
 Price & Time Symmetry WWW.ACTIVETRENDTRADING.COM DENNIS W. WILBORN, SR. DWW@ACTIVETRENDTRADING.COM Disclaimer U.S. GOVERNMENT REQUIRED DISCLAIMER COMMODITY FUTURES TRADING COMMISSION FUTURES AND OPTIONS
Application & Method. doughlab. Torque. 10 min. Time. Dough Rheometer with Variable Temperature & Mixing Energy. Standard Method: AACCI
 T he New Standard Application & Method Torque Time 10 min Flour Dough Bread Pasta & Noodles Dough Rheometer with Variable Temperature & Mixing Energy Standard Method: AACCI 54-70.01 (dl) The is a flexible
FOOD SAFETY RISK ASSESSMENT FOR CCS CANTEENS AND KITCHENS. General purpose Catering kitchen, Hot & Cold Drinks. Created on 22/11/2010
 C C S construction catering services tel 0207 682 2682 email info@constructioncateringservices.com 44 Staverton Rd London NW2 5HL Tel / Fax +44 207 682 2682 info@constructioncateringservices.com www.constructioncateringservices.com
RESULTS OF THE MARKETING SURVEY ON DRINKING BEER
 Uri Dahahn Business and Economic Consultants RESULTS OF THE MARKETING SURVEY ON DRINKING BEER Uri Dahan Business and Economic Consultants Smith - Consulting & Reserch ltd Tel. 972-77-7032332, Fax. 972-2-6790162,
Internet Appendix. For. Birds of a feather: Value implications of political alignment between top management and directors
 Internet Appendix For Birds of a feather: Value implications of political alignment between top management and directors Jongsub Lee *, Kwang J. Lee, and Nandu J. Nagarajan This Internet Appendix reports
EAT TOGETHER EAT BETTER BEAN MEASURING ACTIVITY
 EAT TOGETHER BEAN MEASURING ACTIVITY EAT BETTER TARGET AUDIENCE Grades 3 & 4 ESTIMATED TIME NUTRITION EDUCATION LEARNING OBJECTIVE CURRICULUM INTEGRATION 50 minutes (may also do in two lessons by teaching
Credit Supply and Monetary Policy: Identifying the Bank Balance-Sheet Channel with Loan Applications. Web Appendix
 Credit Supply and Monetary Policy: Identifying the Bank Balance-Sheet Channel with Loan Applications By GABRIEL JIMÉNEZ, STEVEN ONGENA, JOSÉ-LUIS PEYDRÓ, AND JESÚS SAURINA Web Appendix APPENDIX A -- NUMBER
To: Professor Roger Bohn & Hyeonsu Kang Subject: Big Data, Assignment April 13th. From: xxxx (anonymized) Date: 4/11/2016
 Date: 4/11/2016") To: Professor Roger Bohn & Hyeonsu Kang Subject: Big Data, Assignment April 13th. From: xxxx (anonymized) Date: 4/11/2016 Data Preparation: 1. Separate trany variable into Manual which takes value of 1
To: Professor Roger Bohn & Hyeonsu Kang Subject: Big Data, Assignment April 13th. From: xxxx (anonymized) Date: 4/11/2016 Data Preparation: 1. Separate trany variable into Manual which takes value of 1
Duration of resource: 17 Minutes. Year of Production: Stock code: VEA12062
 ADDITIONAL RESOURCES Vegetables, while often seen as accompaniments or sidedishes, are very versatile and flavoursome for the knowledgeable chef. This appealing, practical program is led by an experienced
Food Allergies on the Rise in American Children
 Transcript Details This is a transcript of an educational program accessible on the ReachMD network. Details about the program and additional media formats for the program are accessible by visiting: https://reachmd.com/programs/hot-topics-in-allergy/food-allergies-on-the-rise-in-americanchildren/3832/
Lesson 23: Newton s Law of Cooling
 Student Outcomes Students apply knowledge of exponential functions and transformations of functions to a contextual situation. Lesson Notes Newton s Law of Cooling is a complex topic that appears in physics
INFLUENCE OF ENVIRONMENT - Wine evaporation from barrels By Richard M. Blazer, Enologist Sterling Vineyards Calistoga, CA
 INFLUENCE OF ENVIRONMENT - Wine evaporation from barrels By Richard M. Blazer, Enologist Sterling Vineyards Calistoga, CA Sterling Vineyards stores barrels of wine in both an air-conditioned, unheated,
Evaluation of the Weltech PW-2050 dry matter assessment system
 Evaluation of the Weltech PW-2050 dry matter assessment system British Potato Council Sutton Bridge Experimental Unit East Bank, Sutton Bridge Spalding, Lincs. PE12 9YD Tel: 01406 351444 Fax: 01406 351125
The People of Perth Past, Present and Future
 The People of Perth Past, Present and Future John Henstridge Data Analysis Australia UDIA Pemberton 2003 Overview The Past Population growth Population Structure The Present Future How we forecast What
Labor Supply of Married Couples in the Formal and Informal Sectors in Thailand
 Southeast Asian Journal of Economics 2(2), December 2014: 77-102 Labor Supply of Married Couples in the Formal and Informal Sectors in Thailand Chairat Aemkulwat 1 Faculty of Economics, Chulalongkorn University
DRY BEANS PRICES AND INCOME DISTRIBUTION IN RWANDA: A NON- PARAMETRIC ANALYSIS
 Research article DRY BEANS PRICES AND INCOME DISTRIBUTION IN RWANDA: A NON- PARAMETRIC ANALYSIS Odunga, Pius Ongoro Jaramogi Oginga Odinga University of Science and Technology (JOOUST, Kenya) Kigali Institute
Decision making with incomplete information Some new developments. Rudolf Vetschera University of Vienna. Tamkang University May 15, 2017
 Decision making with incomplete information Some new developments Rudolf Vetschera University of Vienna Tamkang University May 15, 2017 Agenda Problem description Overview of methods Single parameter approaches
Missouri State University
 BCSSE 2008-NSSE 2009 Combined Report Cross-Sectional and Longitudinal Results August 2009 BCSSE 2008-NSSE 2009 Combined Report Interpreting the Cross-Sectional Results The cross-sectional results are based
1/17/manufacturing-jobs-used-to-pay-really-well-notanymore-e/
 http://www.washingtonpost.com/blogs/wonkblog/wp/2013/0 1/17/manufacturing-jobs-used-to-pay-really-well-notanymore-e/ Krugman s Trade Policy History Course: https://webspace.princeton.edu/users/pkrugman/wws%205
Rail Haverhill Viability Study
 Rail Haverhill Viability Study The Greater Cambridge City Deal commissioned and recently published a Cambridge to Haverhill Corridor viability report. http://www4.cambridgeshire.gov.uk/citydeal/info/2/transport/1/transport_consultations/8
This appendix tabulates results summarized in Section IV of our paper, and also reports the results of additional tests.
 Internet Appendix for Mutual Fund Trading Pressure: Firm-level Stock Price Impact and Timing of SEOs, by Mozaffar Khan, Leonid Kogan and George Serafeim. * This appendix tabulates results summarized in
COMPARISON OF EMPLOYMENT PROBLEMS OF URBANIZATION IN DISTRICT HEADQUARTERS OF HYDERABAD KARNATAKA REGION A CROSS SECTIONAL STUDY
 I.J.S.N., VOL. 4(2) 2013: 288-293 ISSN 2229 6441 COMPARISON OF EMPLOYMENT PROBLEMS OF URBANIZATION IN DISTRICT HEADQUARTERS OF HYDERABAD KARNATAKA REGION A CROSS SECTIONAL STUDY 1 Wali, K.S. & 2 Mujawar,
Determining the Optimum Time to Pick Gwen
 California Avocado Society 1988 Yearbook 72: 209-214 Determining the Optimum Time to Pick Gwen Gray Martin and Bob Bergh Department of Botany and Plant Sciences, University of California, Riverside. Predicting
Missing Data Treatments
 Missing Data Treatments Lindsey Perry EDU7312: Spring 2012 Presentation Outline Types of Missing Data Listwise Deletion Pairwise Deletion Single Imputation Methods Mean Imputation Hot Deck Imputation Multiple
Religion and Life - Year 8 ISBL
 Religion and Life - Year 8 ISBL Active Citizenship - Fairtrade KEYS SKILLS: Learning about and from different people Research important information Interpret information found Use numeracy skills Self
A Comparison of X, Y, and Boomer Generation Wine Consumers in California
 A Comparison of,, and Boomer Generation Wine Consumers in California Marianne McGarry Wolf, Scott Carpenter, and Eivis Qenani-Petrela This research shows that the wine market in the California is segmented
Table A.1: Use of funds by frequency of ROSCA meetings in 9 research sites (Note multiple answers are allowed per respondent)
") Appendix Table A.1: Use of funds by frequency of ROSCA meetings in 9 research sites (Note multiple answers are allowed per respondent) Daily Weekly Every 2 weeks Monthly Every 3 months Every 6 months Total
Appendix Table A.1: Use of funds by frequency of ROSCA meetings in 9 research sites (Note multiple answers are allowed per respondent) Daily Weekly Every 2 weeks Monthly Every 3 months Every 6 months Total