Growth Trends for Fresh-Cut, Ready-to Eat Produce November 2006 Canary Wharf
|
|
|
- Jade Gallagher
- 6 years ago
- Views:
Transcription

1 Growth Trends for Fresh-Cut, Ready-to Eat Produce November 26 Canary Wharf Edward Garner Communications Director TNS Worldpanel

2 Agenda Drivers of Growth Prepacked Produce Prepared Fruit Leafy Salads Mixed Tray Salads Prepared Vegetables

3 Agenda Drivers of Growth Prepacked Produce Prepared Fruit Leafy Salads Mixed Tray Salads Prepared Vegetables

4 Lifestyles changes

5 Lifestyles changes


6 The core drivers of consumption ENJOYMENT PRACTICALITY HEALTH
7 year trend 26 11% HEALTH BSE, Foot & Mouth, Sudan 1, Child Obesity, Jamie Oliver, Bird Flu, Supersize me, Salt & sugar content, Functional Foods, 5 a day, Fruit for schools 23% 34% ENJOYMENT Organics/ premium, Taste the difference, Sharing, Café culture, Eating out, Debit Credit, Treating 42% 55% PRACTICALITY Ready Meals, Light meals, Snacking, Budget, Microwave, Individual portions, Quick to cook E 35% H P Worldpanel Usage In Home Ann to May 26


8 Health affecting not just what we eat but how we eat! In home snacking has seen a +5% growth over the last 1 years But, in the last 3 years has seen a 4% decline Worldpanel Usage In Home


9 Core snacking categories at the heart of the declining occasions Last 1 years + 18% Last 3 years - 8% + 37% - 7% + 35% -1% Worldpanel TM division Usage of TNS In Home 26 Ann to Nov 25
10

11 5 A Day Consumption Younger adults have driven the growth in the last year although some way to go until they reach the level of older consumers Ann SA 2 Ann SA 4 Ann SA ALL CONSUMERS Children Adults


12 Its not all about health Growth in indulgence Health +9% Indulgence +7% TNS Worldpanel Usage 52 W/E May 26 Worldpanel TM division of TNS Indulgence 26 (Craving, Something Special/Treat, Social/Entertaining)
13 Both drivers don t have to be in the same product Treaters are more likely than the average person to also choose foods for health reasons. Credit / Debit lifestyle.

14 Frozen Chips & Potato Products
15 Chips & Potato Products Market Trends % % % % 3 Potato Products m 25 Oven Chips % % Microchips Fry Chips w/e Aug w/e Aug w/e Aug 13 6 Coated Oven/Fry Products Three Way Cook Chips
16 Real Household Disposable Income Per Head Constant Prices - Indexed on 197 Source: ONS Series IHXZ
17 25 Food and Drink as a Proportion of UK Household Expenditure % Source: ONS Series ABQI / ABZV

18 Bread
19 W rapped Bread Sector Trends m's 2 Premium Economy Organic Organic Premium Economy

20 Free Range
21 Hens Eggs - 'Free Range' Share Trends 52 Share - % Free Range

22 Organic
23 Total Organic Products m s Annualised Value = 99m
24 Mineral W ater Retail Sales 1, 9, 8, 7, Litres 6, 5, 4, 3, 2, 1,
25 Total Grocery Total PL Trends % within Outlet Tesco Sainsbury Asda Morrisons Safeway
26
27 Premium Private Label Sales Trends 8 7 Sales (Expenditure m) Tesco Finest Sainsbury Taste the Difference Asda Extra Special Safeway/MorrisonsThe Best

28 Cash-rich Time-poor

29 We are changing from this

30 To this

31 Agenda Drivers of Growth Prepacked Produce Prepared Fruit Leafy Salads Mixed Tray Salads Prepared Vegetables
32 Fresh Fruit Market Trends 4, 3,5 3,119 3, % 3, % 3, 2,5 1,61 1, % 1, % m 2, Prepacked 1,5 1, 1,59 1, % 1, % Loose 5 52 w/e Oct w/e Oct w/e Oct 8 6
33 Fresh Vegetables Market Trends 4,5 4, 3,5 3,553 3, % 3, % 3, m 2,5 2, 2,452 2, % 2, % Prepacked 1,5 1, Loose 5 1,11 1, % 1,17-3.6% 52 w/e Oct w/e Oct w/e Oct 8 6
34 Fruit - Weekly Seasonality Sales m Nov 9 23 Dec 7 23 Jan 4 24 Feb 1 24 Feb Mar Apr May Jun 2 24 Jul Aug Sep Loose Oct 1 24 Nov 7 24 Dec 5 24 Jan 2 25 Jan 3 25 Feb Mar Apr May Jun Jul Aug Sep Oct 9 25 Nov 6 25 Dec 4 25 Jan 1 26 Jan Feb Mar Prepacked Apr May Jun Jul Aug Sep 1 26 Oct 8 26 Weekly 3 Point Centred Moving Average
35 Fruit - Weekly Seasonality Sales m Nov 9 23 Dec 7 23 Jan 4 24 Feb 1 24 Feb Mar Apr May Jun 2 24 Jul Aug Sep Loose Oct 1 24 Nov 7 24 Dec 5 24 Jan 2 25 Jan 3 25 Feb Mar Apr May Jun Jul Aug Sep Oct 9 25 Nov 6 25 Dec 4 25 Jan 1 26 Jan Feb Mar Prepacked Apr May Jun Jul Aug Sep 1 26 Oct 8 26
36 Vegetables - Weekly Seasonality Sales m w/e Nov 9 23 w/e Dec 7 23 w/e Jan 4 24 w/e Feb 1 24 w/e Feb w/e Mar w/e Apr w/e May w/e Jun 2 24 w/e Jul w/e Aug w/e Sep Loose w/e Oct 1 24 w/e Nov 7 24 w/e Dec 5 24 w/e Jan 2 25 w/e Jan 3 25 w/e Feb w/e Mar w/e Apr w/e May w/e Jun w/e Jul w/e Aug w/e Sep w/e Oct 9 25 w/e Nov 6 25 w/e Dec 4 25 w/e Jan 1 26 w/e Jan w/e Feb w/e Mar Prepacked w/e Apr w/e May w/e Jun w/e Jul w/e Aug w/e Sep 1 26 w/e Oct 8 26 Weekly 3 Point Centred Moving Average
37 Vegetables - Weekly Seasonality Sales m w/e Nov 9 23 w/e Dec 7 23 w/e Jan 4 24 w/e Feb 1 24 w/e Feb w/e Mar w/e Apr w/e May w/e Jun 2 24 w/e Jul w/e Aug w/e Sep Loose w/e Oct 1 24 w/e Nov 7 24 w/e Dec 5 24 w/e Jan 2 25 w/e Jan 3 25 w/e Feb w/e Mar w/e Apr w/e May w/e Jun w/e Jul w/e Aug w/e Sep w/e Oct 9 25 w/e Nov 6 25 w/e Dec 4 25 w/e Jan 1 26 w/e Jan w/e Feb w/e Mar Prepacked w/e Apr w/e May w/e Jun w/e Jul w/e Aug w/e Sep 1 26 w/e Oct 8 26
38 Key Performance Indicators for Prepacked Fruit - Value up 9.5% worth 171.4m Expenditure ( s) 52 w/e 9 Oct w/e 8 Oct Actual Change % Change 9.5 Penetration % Trip Vol Purchase Frequency Price per Vol Volume (s Units) Penetration % Purchase Frequency AWP (Spend per Buyer) AWP (Vol per Buyer) Trip Spend Expenditure ( s) Trip Vol Price per Vol m +9.5% Increase of 171.4m Volume (s Units) 187.8m vol +2.5% Contribution = 46.8m Price per Vol % Contribution = 124.6m AWP (Vol per Buyer) 45.5 vol +2.2% Contribution = 41.1m Penetration % * 97.3% +.1% Contribution = 5715k Trip Vol 1.3 vol -.3% Contribution = - 621k Purchase Frequency 35.3 trips +2.6% Contribution = 47.3m * Pen Contribution includes Population growth of.2%
39 Key Performance Indicators for Prepacked Vegetables - Value up 4.2% worth 18.8m Expenditure ( s) 52 w/e 9 Oct w/e 8 Oct Actual Change % Change 4.2 Penetration % Trip Vol Purchase Frequency Price per Vol Volume (s Units) Penetration % Purchase Frequency AWP (Spend per Buyer) AWP (Vol per Buyer) Trip Spend Expenditure ( s) Trip Vol Price per Vol m +4.2% Increase of 18.8m Volume (s Units) 256.2m vol +3.2% Contribution = 82.9m Price per Vol % Contribution = 25.9m AWP (Vol per Buyer) 12.8 vol +3% Contribution = 79.1m Penetration % * 99.2% % Contribution = 3873k Trip Vol 1.9 vol +1.3% Contribution = 35.6m Purchase Frequency 54.6 trips +1.6% Contribution = 43.4m * Pen Contribution includes Population growth of.2%
40 Prepacked Fruit & Veg Demographic Signatures Fruit & Vegetables Sector Share within Demographic Group - MAT to October Social Class Household Size Class AB Class C1 Class C2 Class D Class E in HH 2 in HH 3 in HH 4 in HH 5+ in HH Housewife Age Age under 28 Age Age Age Age No. of Children No Children 1 Child HH 2 Child HH 3+ Child HH
41 Lifestyles Prepacked Fruit & Vegetables I am among the first to buy new products when they appear on the market 12 We often visit fast food outlets 119 I tend to give my children what they want for their meals 118 I would use cosmetic surgery to improve my appearance 114 People regularly smoke in my house 114 I often buy take-away meals to eat at home 113 I tend to spend money without thinking 112 It s more important that my children enjoy their food than they eat healthily 111 I often buy things just because I see them on the shelf 11 I like introducing new brands and products to my friends 19 I have little time to myself 19 My children eat what I eat 18 I try to give my children healthy meals 17 I rely heavily on convenience products to make cooking simple/quick 17 I regard myself as a connoisseur of food and wine 17 We really enjoy barbequeing in the summer 17 I am prepared to pay more for organic food 16 I like trying out new brands 16 I often visit a supermarket on the way home 16 It's always a struggle to pay the bills at the end of the month 16 Prepacked Spend indexed on Loose 52 w/e Oct 8 26
42 Prepared Fruit & Vegetable Market Trends % % % % -18.7% +29.5% m % % Mixed Tray Salads Fruit 2 Vegetables % % Leafy Salads 52 w/e Oct w/e Oct w/e Oct 8 6
43 Prepared Fruit & Vegetables Long-Term Trends - m 3 Leafy Salads 25 2 Vegetables 15 1 Fruit 5 Mixed Tray Salads Fruit Vegetables Leafy Salads Mixed Tray Salads

44 Agenda Drivers of Growth Prepacked Produce Prepared Fruit Leafy Salads Mixed Tray Salads Prepared Vegetables
45
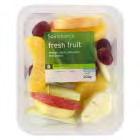
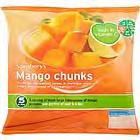
46 Prepared Fruit Classic Salad Sunshine Fruit Salad Luxury Fruit Salad Seasonal Melon Medley Melon Medley Fruit Medley Pineapple Chunks Apple Slices+Grapes Pineapple Slices Apple+Grape Fruit Selection Exotic Fruit Salads Pineapple Pieces Apple Segments Sliced Melon Selection Grape+Melon Fresh Fruit Salad Mango Pieces Fruit Salad Pineapple Cubes Melon+Grape Melon Slice Mango Chunks Red Grape Tropical Fruit Salad Watermelon Melon Selection Pineapple Mixed Fruit Salad Pineapple Rings
47 Prepared Fruit - Weekly Seasonality Sales m Nov 9 23 Dec 7 23 Jan 4 24 Feb 1 24 Feb Mar Apr May Jun 2 24 Jul Aug Sep Oct 1 24 Nov 7 24 Dec 5 24 Jan 2 25 Jan 3 25 Feb Mar Apr May Jun Jul Aug Sep Oct 9 25 Nov 6 25 Dec 4 25 Jan 1 26 Jan Feb Mar Apr May Jun Jul Aug Sep 1 26 Oct 8 26 Weekly 3 Point Centred Moving Average
48 Key Performance Indicators for Prepared Fruit - Value up 29.5% worth 18.1m Expenditure ( s) 52 w/e 9 Oct w/e 8 Oct Actual Change 1896 % Change 29.5 Penetration % Trip Vol Purchase Frequency Price per Vol Volume (s Units) Penetration % Purchase Frequency AWP (Spend per Buyer) AWP (Vol per Buyer) Trip Spend Expenditure ( s) Trip Vol Price per Vol m +29.5% Increase of 18.1m Volume (s Units) 13.7m vol +22.1% Contribution = 14m Price per Vol % Contribution = 453k AWP (Vol per Buyer) 2.2 vol +9.8% Contribution = 6611k Penetration % * 25.9% +1.9% Contribution = 7432k Trip Vol.4 vol -.4% Contribution = - 22k Purchase Frequency 5.7 trips +1.3% Contribution = 6831k * Pen Contribution includes Population growth of.2%
49 Prepared Fruit Demographic Signatures Prepared Fruit & Vegeteables Spend Profile % within Demographic Group Social Class Household Size Class AB Class C1 Class C2 Class D Class E in HH 2 in HH 3 in HH 4 in HH 5+ in HH Housewife Age Age under 28 Age Age Age Age No. of Children No Children 1 Child HH 2 Child HH 3+ Child HH
50 Lifestyles Prepared Fruit I'm prepared to pay more for products that make life easier 145 I am among the first to buy new products when they appear on the market 135 I tend to spend money without thinking 134 I eat out regularly 133 I like to pamper myself 13 I think of myself as a brand loyal consumer 128 It is important to me which brand I buy 125 I rely heavily on convenience products to make cooking simple/quick 123 I am prepared to pay more for organic food 122 I often buy things just because I see them on the shelf 121 I like introducing new brands and products to my friends 119 I regard myself as a connoisseur of food and wine 119 I buy free range products whenever I can 118 Country of origin is important to me when choosing groceries 117 The BBC is an institution that I can rely on 116 I am prepared to pay more for quality ingredients 115 I am actively trying to manage my cholesterol level 114 The brand name of the clothes I wear is important to me 114 I find it hard to spend all the money that I earn 114 We often visit fast food outlets 113 Spend indexed on Households 52 w/e Oct 8 26
51 Prepared Fruit Range Shares % 52 w/e Oct w/e Oct w/e Oct 8 26 M+S Tesco Sainsbury Asda Waitrose Morrisons Asda Great Stuff M+S Food To Go Co-op Somerfield All Others Total PL

52 Agenda Drivers of Growth Prepacked Produce Prepared Fruit Leafy Salads Mixed Tray Salads Prepared Vegetables
53
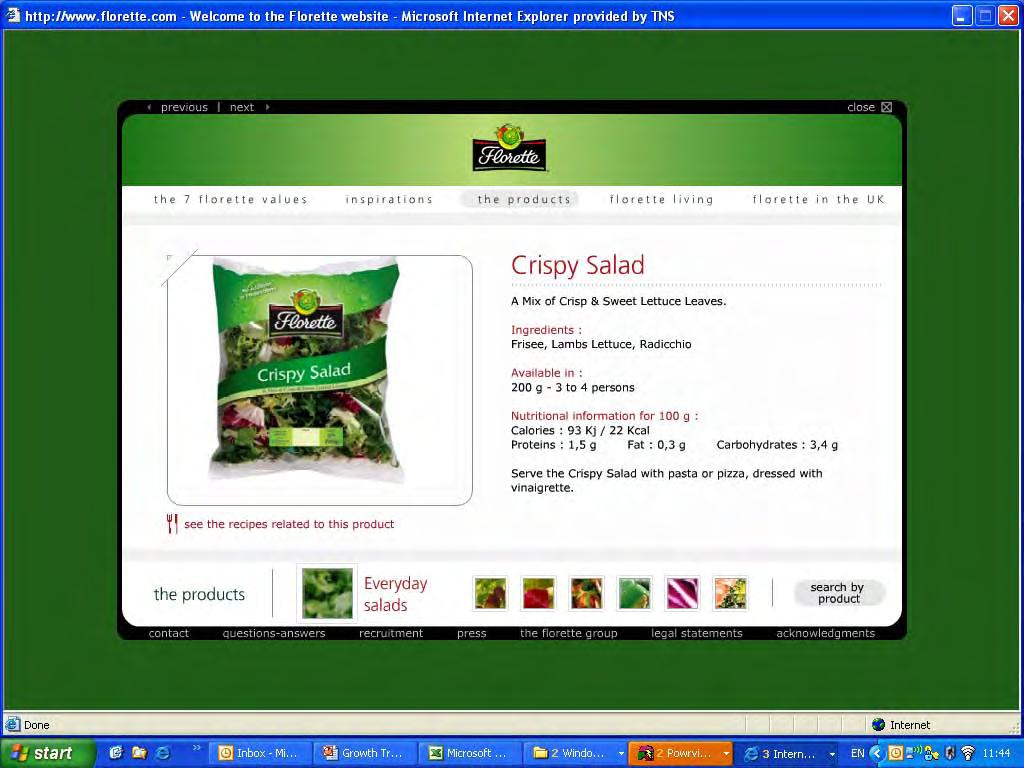
54 Leafy Salads Sweet+Crunchy Salad Leaf Salad Iceberg Lettuce Four Leaf Salad Watercress Tender Leaf Salad Italian Salad Crispy Leaf Salad Crispy Salad Mixed Leaf Salad Caesar Salad Rocket+Spinach+Watercress Mixed Salad Italian Leaf Salad Rocket Salad Fine Cut Salad Herb Salad Watercress+Spinach+Rocket Rocket Watercress Salad Bistro Salad Baby Leaf+Watercress Sld Baby Leaf Salad Seasonal Baby Leaf Salad Alfresco Salad Sweet Leaf Salad Spinach+Watercress+Rocket Sld Ruby Salad Crisp Mixed Salad Santa Plum Tomato Salad
55 Leafy Salads - Weekly Seasonality Sales m Nov 9 23 Dec 7 23 Jan 4 24 Feb 1 24 Feb Mar Apr May Jun 2 24 Jul Aug Sep Oct 1 24 Nov 7 24 Dec 5 24 Jan 2 25 Jan 3 25 Feb Mar Apr May Jun Jul Aug Sep Oct 9 25 Nov 6 25 Dec 4 25 Jan 1 26 Jan Feb Mar Apr May Jun Jul Aug Sep 1 26 Oct 8 26 Weekly 3 Point Centred Moving Average
56 Key Performance Indicators for Leafy Salads - Value up 1.9% worth 5229k Expenditure ( s) 52 w/e 9 Oct w/e 8 Oct Actual Change 5229 % Change 1.9 Penetration % Trip Vol Purchase Frequency Price per Vol Volume (s Units) Penetration % Purchase Frequency AWP (Spend per Buyer) AWP (Vol per Buyer) Trip Spend Expenditure ( s) Trip Vol Price per Vol m +1.9% Increase of 5229k Volume (s Units) 44.1m vol +2.7% Contribution = 7344k Price per Vol % Contribution = k AWP (Vol per Buyer) 2.6 vol +1.7% Contribution = 4487k Penetration % * 69.9% +.9% Contribution = 2857k Trip Vol.2 vol +2.2% Contribution = 598k Purchase Frequency 12.3 trips -.5% Contribution = k * Pen Contribution includes Population growth of.2%
57 Leafy Salads Demographic Signatures Prepared Fruit & Vegeteables Spend Profile % within Demographic Group Social Class Household Size Class AB Class C1 Class C2 Class D Class E in HH 2 in HH 3 in HH 4 in HH 5+ in HH Housewife Age Age under 28 Age Age Age Age No. of Children No Children 1 Child HH 2 Child HH 3+ Child HH
58 Lifestyles Leafy Salads I regard myself as a connoisseur of food and wine 142 I am prepared to pay more for organic food 134 My diet is very important to me 122 I/my partner enjoy cooking to entertain friends and family 121 The internet has been a positive innovation for society 119 I am prepared to pay more for quality ingredients 118 I believe in a holistic approach to medical treatment 117 I look out for the 'healthy' products 117 I enjoy eating foreign food 116 I like to keep up with fashion 116 I buy free range products whenever I can 115 I feel good about buying fair trade products 115 I never go out without putting on my makeup 115 I try to give my children healthy meals 115 I try to buy a healthy range of foods these days 115 I eat out regularly 115 I am among the first to buy new products when they appear on the market 114 I try to buy environmentally friendly products 114 I'm often on a diet to lose weight 114 I read the ingredients on the pack before buying 113 Spend indexed on Households 52 w/e Oct 8 26
59 Leafy Salads Range Shares % 52 w/e Oct w/e Oct w/e Oct 8 26 Tesco Sainsbury Asda Morrisons M+S Waitrose Florette Co-op Somerfield Tesco Eat / Keep All Others Total PL

60 Agenda Drivers of Growth Prepacked Produce Prepared Fruit Leafy Salads Mixed Tray Salads Prepared Vegetables

61
62 Mixed Tray Salads Potato+Egg Salad Crunchy Lettuce Sld+Cbbg Sweet+Crunchy Salad Crisp Mixed Salad Lettuce+Tom+Cucumber+Clry King Prawn+Pasta Salad Layered Salad With Cheese Tuna+Pasta Mediterranean Salad Egg Salad Fresh+Crispy Potato+Peas+Bean Salad Ribbon Sld Lettuce+Ccmbr Pasta+Pepper Salad Mixed Pepper Salad Salmon+Potato Prawn+Pasta Salad Chicken+Bacon Caesar Sld Tuna Nicoise Avocado Spinach+Tomato Pasta+Cheese Salad Gourmet Tuna Nicoise Mxd Sld White+Red Cabbage Apple+Seed+Raisin Salad Sweet Pepper Salad Mozzarella+Cherry Tomato Orientl Edamame Soya Bean King Prawn Noodle Salad Greek Salad Tomato+Mozrla Pasta Salad
63 Mixed Tray Salads - Weekly Seasonality Sales m w/e Nov 9 23 w/e Dec 7 23 w/e Jan 4 24 w/e Feb 1 24 w/e Feb w/e Mar w/e Apr w/e May w/e Jun 2 24 w/e Jul w/e Aug w/e Sep w/e Oct 1 24 w/e Nov 7 24 w/e Dec 5 24 w/e Jan 2 25 w/e Jan 3 25 w/e Feb w/e Mar w/e Apr w/e May w/e Jun w/e Jul w/e Aug w/e Sep w/e Oct 9 25 w/e Nov 6 25 w/e Dec 4 25 w/e Jan 1 26 w/e Jan w/e Feb w/e Mar w/e Apr w/e May w/e Jun w/e Jul w/e Aug w/e Sep 1 26 w/e Oct 8 26 Weekly 3 Point Centred Moving Average
64 Key Performance Indicators for Mixed Tray Salads - Value down 18.7% worth 6726k Expenditure ( s) 52 w/e 9 Oct w/e 8 Oct Actual Change % Change Penetration % Trip Vol Purchase Frequency Price per Vol Volume (s Units) Penetration % Purchase Frequency AWP (Spend per Buyer) AWP (Vol per Buyer) Trip Spend Expenditure ( s) Trip Vol Price per Vol m -18.7% Decrease of k Volume (s Units) 5478k vol -25.5% Contribution = k Price per Vol % Contribution = 393k AWP (Vol per Buyer) 1.1 vol -1.5% Contribution = - 615k Penetration % * 2.3% -24.5% Contribution = - 924k Trip Vol.3 vol +4.7% Contribution = 1596k Purchase Frequency 3.6 trips -5.9% Contribution = k * Pen Contribution includes Population growth of.2%
65 Mixed Tray Salads Demographic Signatures Prepared Fruit & Vegeteables Spend Profile % within Demographic Group Social Class Household Size Class AB Class C1 Class C2 Class D Class E in HH 2 in HH 3 in HH 4 in HH 5+ in HH Housewife Age Age under 28 Age Age Age Age No. of Children No Children 1 Child HH 2 Child HH 3+ Child HH
66 Lifestyles Mixed Tray Salads I rely heavily on convenience products to make cooking simple/quick 13 I am among the first to buy new products when they appear on the market 127 We often visit fast food outlets 124 I'm prepared to pay more for products that make life easier 119 I often buy take-away meals to eat at home 119 I am prepared to pay more for organic food 119 It is important to me which brand I buy 118 I often buy things just because I see them on the shelf 117 I tend to spend money without thinking 114 I think of myself as a brand loyal consumer 113 I am actively trying to manage my cholesterol level 112 I never go out without putting on my makeup 111 I would use cosmetic surgery to improve my appearance 11 I'm often on a diet to lose weight 11 I only eat to fill up 11 I should do a lot more about my health 19 My pet is very choosy about what it eats 19 I try to avoid products containing caffeine 17 I am actively trying to manage my blood pressure 17 I find out about new products from TV adverts 17 Spend indexed on Households 52 w/e Oct 8 26
67 Mixed Tray Salads Range Shares % 52 w/e Oct w/e Oct w/e Oct 8 26 M+S Tesco Sainsbury Morrisons Asda Sainsbury BGTY Asda Good For You M+S Healthily Balanced Waitrose Tesco Naturally Good...8 All Others Total PL

68 Agenda Drivers of Growth Prepacked Produce Prepared Fruit Leafy Salads Mixed Tray Salads Prepared Vegetables
69
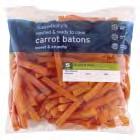
70 Prepared Vegetables Broccoli+Crrt+Cauliflower Vegetable Medley Sliced Runner Beans Mini Carrots Mushroom Stir Fry Mixed Peppers Stir Fry Vegetable Stir Fry Broccoli Florets Broccoli+Cauliflower Flrt Diced Carrot+Swede Carrot Batons Spinach Leaves Brussel Sprouts Roast Veg W Herb Baby Spinach Lyrd Veg Wth Seasoned Btr Chinese Veg Stir Fry Swede+Carrot For Mashing Bean Sprouts Crunchy Veg Stir Fry Mixed Vegetable Stir Fry Cabbage+Leek Peas Vegetable Selection Young Leaf Spinach Cabbage Medley Runner Beans Broccoli+Carrot New Potatoes+Herbs+Butter American Style Salad
71 Key Performance Indicators for Vegetables - Value up 5.4% worth 11.1m Expenditure ( s) 52 w/e 9 Oct w/e 8 Oct Actual Change 1157 % Change 5.4 Penetration % Trip Vol Purchase Frequency Price per Vol Volume (s Units) Penetration % Purchase Frequency AWP (Spend per Buyer) AWP (Vol per Buyer) Trip Spend Expenditure ( s) Trip Vol Price per Vol m +5.4% Increase of 11.1m Volume (s Units) 67.8m vol +5% Contribution = 1.4m Price per Vol % Contribution = 616k AWP (Vol per Buyer) 3.9 vol +4.4% Contribution = 919k Penetration % * 7.6% +.4% Contribution = 1332k Trip Vol.4 vol +3.8% Contribution = 797k Purchase Frequency 8.9 trips +.6% Contribution = 121k * Pen Contribution includes Population growth of.2%
72 Prepared Vegetables - Weekly Seasonality 6 New Year s Resolution Market 5 4 Sales m Nov 9 23 Dec 7 23 Jan 4 24 Feb 1 24 Feb Mar Apr May Jun 2 24 Jul Aug Sep Oct 1 24 Nov 7 24 Dec 5 24 Jan 2 25 Jan 3 25 Feb Mar Apr May Jun Jul Aug Sep Oct 9 25 Nov 6 25 Dec 4 25 Jan 1 26 Jan Feb Mar Apr May Jun Jul Aug Sep 1 26 Oct 8 26 Weekly 3 Point Centred Moving Average
73 7 Prepared Brussels Spouts - Weekly Seasonality 6 5 Sales m Nov 9 23 Dec 7 23 Jan 4 24 Feb 1 24 Feb Mar Apr May Jun 2 24 Jul Aug Sep Oct 1 24 Nov 7 24 Dec 5 24 Jan 2 25 Jan 3 25 Feb Mar Apr May Jun Jul Aug Sep Oct 9 25 Nov 6 25 Dec 4 25 Jan 1 26 Jan Feb Mar Apr May Jun Jul Aug Sep 1 26 Oct 8 26
74 Prepared Vegetables Demographic Signatures Prepared Fruit & Vegeteables Spend Profile % within Demographic Group Social Class Household Size Class AB Class C1 Class C2 Class D Class E in HH 2 in HH 3 in HH 4 in HH 5+ in HH Housewife Age Age under 28 Age Age Age Age No. of Children No Children 1 Child HH 2 Child HH 3+ Child HH
75 Lifestyles Prepared Vegetables I'm often on a diet to lose weight 124 I am among the first to buy new products when they appear on the market 123 I am prepared to pay more for organic food 122 I tend to spend money without thinking 117 I regard myself as a connoisseur of food and wine 116 I like introducing new brands and products to my friends 115 I buy free range products whenever I can 114 I'm prepared to pay more for products that make life easier 114 I am prepared to pay more for quality ingredients 114 I am actively trying to manage my blood pressure 112 I read the ingredients on the pack before buying 112 Recently I have become more aware of whether the foods I buy are good for m 112 I never go out without putting on my makeup 112 My diet is very important to me 112 The internet has been a positive innovation for society 111 I look out for the 'healthy' products 111 It is important to me which brand I buy 111 I am willing to travel further to shop at the supermarket I prefer 11 I like to pamper myself 11 I prefer to buy low salt products if they're available 11 Spend indexed on Households 52 w/e Oct 8 26
76 Prepared Vegetables Range Shares % 52 w/e Oct w/e Oct w/e Oct 8 26 Tesco M+S Asda Sainsbury Morrisons Waitrose Somerfield Co-op Sainsbury TTD Sainsbury Oriental All Others Total PL

77 The current consumer landscape Stepping into the background.. Processed Frozen 3 course meals Unhealthy snacks In the foreground.. Raw Proteins Chilled Traceability 5 a day Health Organic Smaller baskets Fast casual dining Homemade Indulgence Worldpanel Usage In Home Ann to Nov 25
78 Whilst the presence of Foodservice was gathering pace, Retailers have been quick to address to meal solutions opportunity In Store. Billion Great Britain: Shares of Consumer Spending on Food Drink & Alcohol Out of Home In Home

79 Making it easier to eat out, within your own home
 I like to spend as little time as possible food shopping (11) Sainsburys Local Share (Index) I regard myself as a connoisseur of food and wine (196) I often buy takeaway meals to")
80 Differing store fascia s now increasing competitive rivalry within the high street Eat now Tesco Metro Share (Index) I am not really worried about eating healthily (123) I often buy takeaway meals to eat at home (115) I like to spend as little time as possible food shopping (11) Sainsburys Local Share (Index) I regard myself as a connoisseur of food and wine (196) I often buy takeaway meals to eat at home (152) I tend to spend money without thinking (123) I am a busy person, so often eat on the run (117)

81 Profit Sector is worth 27bn +2% y-o-y but Volume is down -3% less people are eating out Premiumisation within Foodservice Source Worldpanel TNS Outlet TM division Tracker- of TNS 526 week to April 6
82 So within Foodservice, overall meals are down, but Coffee Shops, as well as Sandwich Bars are bucking the trend. 52 w/e 27th July w/e 25th July 26 % change QUICK SERVICE RESTAURANTS Burger House Pizza Place (Off Premise) Fish and Chips Chinese (Off Premise) Indian (Off Premise) Total Fried Chicken Sandwich bar/bakery Other QSR NON QUICK SERVICE RESTS Pub/Bar/Steakhouse/Carvery Hotels Chinese (On Premise) Indian (On Premise) Italian Rest(inc OnPrem Pizza) Other Restaurants Motorway services/roadside Sports club/leisure centre Total In Store Coffee Shop TNS Outlet Tracker - No. of Meals Y/E 25th July 26 (Millions)

83 Coffee Culture The growth of premium speciality coffee out of home seems to have benefited consumption at home 8 Speciality Coffee in Cafés 35 Speciality Coffee at Home Oct-99 - Sep- Oct- - Sep-1 Oct-2 - Sep-3 Oct-3 - Sep-4 Oct-4 - Sep-5 Oct- - Sep-1 Oct-1 - Sep-2 Oct-2 - Sep-3 Oct-3 - Sep-4 Oct-4 - Sep-5 Source: Worldpanel NDS

84 Meals Out of Home are getting lighter.. % of Meals featuring a Dessert % % % 16.4% of kids OOH meals feature a dessert also declining yr on yr
85 During the week is now becoming more important for Out of Home meals and snacks. This has implications for meal centres. 1% 9% 8% 7% 6% OOH Meals OOH Snacks Weekend Weekday rules Lighter meals Sandwiches key 5% 4% 3% 2% Weekday On the go formats Individualism Location, location 1% % l TNS Worldpanel Foodservice 52 W/E to May 26
86 Within the Out of home market, Fast Casual Dining has been a real area of growth on the high street. 35 Number of Meals ( ) Sandwich bar/bakery w/e 12th March w/e 7th May w/e 2nd July w/e 27th August w/e 22nd October w/e 17th December w/e 11th February w/e 8th April w/e 3rd June w/e 29th July w/e 23rd September w/e 18th November w/e 13th January w/e 9th March w/e 4th May w/e 29th June w/e 24th August w/e 19th October w/e 14th December w/e 8th February w/e 5th April w/e 1st June w/e 26th July w/e 2th September w/e 15th November w/e 1th January w/e 7th March w/e 3rd May w/e 27th June w/e 22nd August 26 TNS Outlet Tracker - No. of Meals Y/E 22 nd August 26 (Millions)
 52 w/e 8th February 25 52 w/e 8th March 25 52 w/e 5th April 25 52 w/e 4th May 25 52 w/e 1st June 25 52 w/e 28th June 25 52 w/e 26th July 25 52 w/e 23rd August 25")
87 Number of Meals ( ) 9 8 Number of Meals ( ) Subway TNS Outlet Tracker - No. of Meals Y/E 25th July 26 (Millions) 52 w/e 8th February w/e 8th March w/e 5th April w/e 4th May w/e 1st June w/e 28th June w/e 26th July w/e 23rd August w/e 2th September w/e 18th October w/e 15th November w/e 13th December w/e 1th January w/e 7th February w/e 7th March w/e 4th April w/e 3rd May w/e 31st May w/e 27th June w/e 25th July w/e 22nd August 26

88 Reminders Prepared Vegetables Mixed Tray Salads Leafy Salads Drivers of Growth Prepacked Produce Prepared Fruit
89 Thank you
Fresh Produce Report. P13: 12 w/e 3rd January Kantar Worldpanel
 Fresh Produce Report P13: 12 w/e 3rd January 2016 1 HOW IS TOTAL PRODUCE PERFORMING? Total Produce is worth 2.1bn and is growing by 4.1% compared to the same period last year. Much of this is driven by
Britain s best-selling baking magazines
 Britain s best-selling baking magazines 23,100 41,500 The Power of Print Print advertising is still very important it builds the strongest consumer trust and loyalty, plus it has more tangibility and gravitas
Bag In Box Consumer Preferences in the UK. Presented during the Performance BIB meetings in Bristol, England 24 & 25 October 2012
 Bag In Box Consumer Preferences in the UK Presented during the Performance BIB meetings in Bristol, England 24 & 25 October 2012 By: Katie Mollet, Wine Buyer Bag in Box is worth 579m each year, that s
New from Packaged Facts!
 New from Packaged Facts! FOODSERVICE MARKET INSIGHTS A fresh perspective on the foodservice marketplace Essential Insights on Consumer customerservice@packagedfacts.com (800) 298-5294 (240) 747-3095 (Intl.)
2007 Sonoma Research Associates - All rights reserved.
 2007 Sonoma Research Associates - All rights reserved. Practical Applications of the Price Elasticity of Demand Presented by Dan Karnowsky, President Sonoma Research Associates Presented at Competitive
Consumer Price Index
 KINGDOM OF Consumer Price Index Website: E-mail : Statistics Department P.O. Box 149 Nuku alofa Kingdom of Tonga www.spc.int/prism/tonga/ dept@stats.gov.to Mar, 2018 Price: $ 2.50 Fig 3: Contribution
Barilla Pasta Meal Seasons Post- Holiday Bemer For You
 Barilla Pasta Meal Seasons Post- Holiday Bemer For You January March Post- Holiday BFY Seasonal Opportunity Bemer For You Pasta and Sauces Barilla PLUS Barilla Whole Grain Barilla White Fiber Post- Holiday
Problem Set #3 Key. Forecasting
 Problem Set #3 Key Sonoma State University Business 581E Dr. Cuellar The data set bus581e_ps3.dta is a Stata data set containing annual sales (cases) and revenue from December 18, 2004 to April 2 2011.
COMMITTEE ON COMMODITY PROBLEMS INTERGOVERNMENTAL GROUP ON TEA NINETEENTH SESSION. New Delhi, India, May 2010
 May 2010 CCP:TE 10/CRS 19 E COMMITTEE ON COMMODITY PROBLEMS INTERGOVERNMENTAL GROUP ON TEA NINETEENTH SESSION New Delhi, India, 12 14 May 2010 MARKET DEVELOPMENTS IN SELECTED COUNTRIES INDIA Indian Tea-
Overview of Presentation
 The Changing Marketplace for California Crops: Focus on Fresh Fruits and Vegetables Dr. Roberta Cook Dept. of Agricultural and Resource Economics UC Davis March 2005 Overview of Presentation US food industry
GLOBAL DAIRY UPDATE KEY DATES MARCH 2017
 MARCH 2017 GLOBAL DAIRY UPDATE European milk production decreased for the seventh consecutive month, while the US remains strong. The rate of decline in New Zealand production is easing. US exports continue
Coffee market continues downward trend
 Coffee market continues downward trend Since August 2017, the ICO composite indicator price has declined in each month except January 2018. The composite indicator decreased by 1.1% in March 2018 to an
Annika Stensson. Director Research Communications National Restaurant Association Washington, D.C. Restaurant.org/Research.
 Annika Stensson Director Research Communications National Restaurant Association Washington, D.C. @WeRRestaurants /RestaurantDotOrg /NationalRestaurantAssociation Restaurant.org/Research 1 Agenda Overview
Coffee market ends 2017/18 in surplus
 Coffee market ends 217/18 in surplus World coffee production in coffee year 217/18 is estimated 5.7% higher at 164.81 million bags as output of Arabica increased by 2.2% to 11.82, and Robusta grew 11.7%
Premium Ale INSIGHT REPORT. Hall & Woodhouse Premium Ale Insight Report 2016
 Premium Ale INSIGHT REPORT 2016 Contents 02 Introduction:...03 Category Overview:...04 Beers, Wines & Spirits Performance Beer Category Trends Premium Ale Performance & Trends Deflation:...14 Impact of
Mango Retail Performance Report 2017
 Mango Retail Performance Report 2017 1 Table of Contents Pages 3-9 Pages 10-15 Pages 16-34 Pages 35-44 Pages 45-51 Pages 52-54 Executive Summary Fruit and Tropical Fruit Performance Whole Mango Performance
BRUSSELS, 4 OCTOBER 2012 HANS-CHRISTOPH BEHR, AMI, BONN
 The Demand for fresh Tomatoes in Europe BRUSSELS, 4 OCTOBER 2012 HANS-CHRISTOPH BEHR, AMI, BONN Agenda Fresh Tomato Consumption in different European Countries Development of Tomato Consumption in Germany
WEEKLY MAIZE REPORT 30 OCTOBER 2018
 WEEKLY MAIZE REPORT 30 OCTOBER 2018 Unigrain (Pty) Ltd Tel. No. : +27 11 692 4400 Fax. No. : +27 11 412 1183 INTERNATIONAL MARKET Table 1: CME Maize prices and weekly changes (cents/bushel) Currently 23/10/2018
Globalization of Agriculture: An Ownership and Market Perspective. Ken Sullivan March 7, 2017
 Globalization of Agriculture: An Ownership and Market Perspective Ken Sullivan March 7, 2017 History and Context 3 $14BN COMPANY THAT OPERATES IN 23 U.S. STATES AND 5 COUNTRIES Smithfield s vertically
CLG: Seafood Consumption. Richard Watson Seafish
 CLG: Seafood Consumption Richard Watson Seafish Agenda Seafish Insight Service Benchmark Consumption Trends Trend Drivers Growing Seafood Consumption Market Insight Service Provide 250 reports per year
Market Brief for Asia Fruit Logistica. Hong Kong & Macau, Makret Dynamic Markets for U.S. Exports
 Market Brief for Asia Fruit Logistica Hong Kong & Macau, Makret Dynamic Markets for U.S. Exports September 5, 2017 1 USDA Foreign Agricultural Service (FAS) - ATO Hong Kong - FAS offices are staffed by
Networkers Business Update. December 2014
 Networkers Business Update December 2014 Agenda Forecast Milk Price Global markets V3 Strategy Growing our share of New Zealand milk Page 2 Forecast Milk Price 110 100 2012/13 2013/14 2014/15 Forecast
For personal use only
 SEPTEMBER 216 GLOBAL DAIRY UPDATE European milk production has decreased for the first time since early 215, with volumes in June down 2 compared to last year. Last week we announced our annual results,
Price monitoring of key food items in Donetsk and Luhansk Oblasts
 Market update Issue (October ) UKRAINE Price monitoring of key food items in Donetsk and Luhansk Oblasts Fighting hunger worldwide Highlight Cost of food basket remained higher at national level throughout
Bread and Baked Goods Emma Clifford Associate Director Food and Drink
 2017 Mintel Group Ltd. All Rights Reserved. Bread and Baked Goods Emma Clifford Associate Director Food and Drink Agenda Consumer habits Market performance Market forecast Innovation trends Where next?
GRAPE GAINS: GETTING ACCESS TO THE BEST VARIETIES. By Mr. Manik Patil
 GRAPE GAINS: GETTING ACCESS TO THE BEST VARIETIES By Mr. Manik Patil Climatic Conditions for Grapes Grapes are grown under a variety of soil and climatic conditions in three distinct agro-climatic zones
Jennie-O Turkey Store. Glenn Leitch Group Vice President President, Jennie-O Turkey Store
 Jennie-O Turkey Store Glenn Leitch Group Vice President President, Jennie-O Turkey Store Agenda Industry metrics Impact of avian influenza Brand strength Value added growth Summary Total Industry Live
Record exports in coffee year 2017/18
 Record exports in coffee year 2017/18 Total coffee exports increased each year since 2010/11 with a new record reached in 2017/18 at 121.86 million bags, 2% higher than 2016/17. In the twelve months ending
American Craft Beer in the UK on-trade. Richard Yarnell, Category Manager Beer & Cider Mitchells & Butlers
 American Craft Beer in the UK on-trade Richard Yarnell, Category Manager Beer & Cider Mitchells & Butlers September 2011 1 Agenda The UK On-Trade Mitchells & Butlers Resurgence of Cask Ale in the UK Role
Foodservice Market Prospects
 Foodservice Market Prospects Australia & South East Asia Food SA Summit 5th June 2012 BIS Foodservice 3 4 Three Available Food & Beverage Markets The Three Food & Non-Alcoholic Beverage Markets Market
Jason McNally. 21 st of April 2009
 Coffee & Food On the Go How to maximise your Profits! Jason McNally Dubai 21 st of April 2009 Agenda Cafe Culture Convenience Retailing Coffee to Go Simply Coffee Food to Go Summary Questions COFFEE &
Downward correction as funds respond to increasingly positive supply outlook
 Downward correction as funds respond to increasingly positive supply outlook Coffee prices fell sharply at the end of April as institutional investors sold off their positions. The coffee market continues
Coffee market ends 2016/17 coffee year in deficit for the third consecutive year
 Coffee market ends 2016/17 coffee year in deficit for the third consecutive year The ICO composite indicator continued its downward trend that started at the end of August, averaging 124.46 US cents/lb.
CONSUMER PRICE INDEX : April April 2014 Local, imported and all items
 SDT:339 CONSUMER PRICE INDEX : 03 04, imported and all items 4.0.0 08.0 Index 06.0 0.0 98.0 96.0 94.0 Apr Apr Mar 03 Mar Feb Jan Dec Nov Oct Sep Aug Jul Jun Apr 9.0 04 All Items Fig : Graphical representation
Coffee prices rose slightly in January 2019
 Coffee prices rose slightly in January 2019 In January 2019, the ICO composite indicator rose by 0.9% to 101.56 US cents/lb as prices for all group indicators increased. After starting at a low of 99.16
WEEKLY MAIZE REPORT 28 NOVEMBER 2018
 WEEKLY MAIZE REPORT 28 NOVEMBER 2018 Unigrain (Pty) Ltd Tel. No. : +27 11 692 4400 Fax. No. : +27 11 412 1183 INTERNATIONAL MARKET Table 1: CME Maize prices and weekly changes (cents/bushel) Currently
WEEKLY MAIZE REPORT 13 JUNE 2018
 17/08/01 17/08/15 17/08/29 17/09/12 17/09/26 17/10/10 17/10/24 17/11/07 17/11/21 17/12/05 17/12/19 18/01/02 18/01/16 18/01/30 18/02/13 18/02/27 18/03/13 18/03/27 18/04/10 18/04/24 18/05/08 18/05/22 18/06/05
QUARTERLY REVIEW OF THE PERFORMANCE OF THE DAIRY INDUSTRY 1
 QUARTERLY REVIEW OF THE PERFORMANCE OF THE DAIRY INDUSTRY 1 The information in this document is from sources deemed to be correct. Milk SA, the MPO and SAMPRO are not responsible for the results of any
Foodservice perspective
 supporting a profitable, sustainable and socially responsible future for the seafood industry Foodservice perspective Julia Brooks, Seafish, 28 September 2016 Sources: Q2 2016 The NPD Group / CREST UK,
U.S. Retail Coffee. Joe Stanziano Senior Vice President and General Manager, Coffee
 U.S. Retail Coffee Joe Stanziano Senior Vice President and General Manager, Coffee 1 Our Coffee Vision Build BELOVED COFFEE BRANDS that ignite the senses and inspire passions every day. OUR STRATEGIC PRIORITIES
Market Brief for Seafood Expo Asia. Hong Kong & Macau, Makret Dynamic Markets for U.S. Exports
 Market Brief for Seafood Expo Asia Hong Kong & Macau, Makret Dynamic Markets for U.S. Exports September 4, 2017 1 USDA Foreign Agricultural Service (FAS) - ATO Hong Kong - FAS offices are staffed by Foreign
THOMSON REUTERS INDICES CONTINUOUS COMMODITY TOTAL RETURN INDEX
 THOMSON REUTERS INDICES CONTINUOUS COMMODITY TOTAL RETURN INDEX December 2012 1 TABLE OF CONTENTS Index Description 3 Methodology 3 Contract Roll 4 Real-Time Pricing Considerations 4 Constituent Contracts
TRENDS IN SALES OF MILK & DAIRY PRODUCTS A RETAIL PERSPECTIVE. Milk Market Observatory 25 January 2017
 TRENDS IN SALES OF MILK & DAIRY PRODUCTS A RETAIL PERSPECTIVE Milk Market Observatory 25 January 2017 France Period ending 25 December 2016 Product category ) 4 weeks period (P13 15/P13 16) ) Year on year
2018/19 expected to be the second year of surplus
 2018/19 expected to be the second year of surplus Coffee year 2018/19 is expected to be the second consecutive season of surplus, as global output, estimated at 167.47 million bags, exceeds world consumption,
The Portuguese clipfish market 2017
 The Portuguese clipfish market 2017 08.02.2018 Johnny Thomassen Fiskeriutsending i Portugal On this presentation we will try to answer: - How is the Portuguese economy doing? - Are the consumer habits
What do we know about fresh produce consumption
 What do we know about fresh produce consumption PMA A & NZ - Fresh Forum Newcastle March 2011 Martin Kneebone Director Freshlogic Content Macro food market trends Food shopping consumer behaviour Household
WEEKLY OILSEED REPORT 31 OCTOBER 2018
 WEEKLY OILSEED REPORT 31 OCTOBER 218 Unigrain (Pty) Ltd Tel. No. : +27 11 692 44 Fax. No. : +27 11 412 1183 INTERNATIONAL MARKET Table 1: CME Soybean prices and weekly change (cents/bushel) Currently 24/1/218
Lee Linthicum Head of Global Food Research Euromonitor International
 Lee Linthicum Head of Global Food Research Euromonitor International EUROMONITOR INTERNATIONAL: GLOBAL CONFECTIONERY About Euromonitor International A trusted business intelligence source Biggest global
much better than in As may be seen in Table 1, the futures market prices for the next 12 months
 Dairy Outlook December 2009 By Jim Dunn Professor of Agricultural Economics, Penn State University Market Psychology prices are higher than last month, especially Class IV. The outlook for dairy prices
UK Foodservice Trends & Implications for Suppliers
 UK Foodservice Trends & Implications for Suppliers Remember. UK accounts for 43% of Irish food & drink exports in 2009 Economic Overview Gross Domestic Product Average Earnings Unemployment Rate UK GDP
CHAPTER I BACKGROUND
 CHAPTER I BACKGROUND 1.1. Problem Definition Indonesia is one of the developing countries that already officially open its economy market into global. This could be seen as a challenge for Indonesian local
July marks another month of continuous low prices
 July marks another month of continuous low prices In July 2018, the ICO composite indicator price decreased by 2.9% to an average of 107.20 US cents/lb, which is the lowest monthly average for July since
WEEKLY MAIZE REPORT 06 FEBRUARY 2019
 WEEKLY MAIZE REPORT 06 FEBRUARY 2019 Unigrain (Pty) Ltd Tel. No. : +27 11 692 4400 Fax. No. : +27 11 412 1183 INTERNATIONAL MARKET Table 1: CME Maize prices and weekly changes (cents/bushel) Currently
Seasonal trends in hectares planted, sales volumes on markets and market prices. Pieter van Zyl, Potatoes South Africa
 Seasonal trends in hectares planted, sales volumes on markets and market prices Pieter van Zyl, Potatoes South Africa Producers plant between 5 and 54 hectares of potatoes each year. According to Figure
IMPORTANCE OF LODI WINES IN THE RETAIL CHANNEL AND OPPORTUNITIES FOR GROWTH. Curtis Mann Director of Wine & Beverage Raley s Family of Fine Stores
 IMPORTANCE OF LODI WINES IN THE RETAIL CHANNEL AND OPPORTUNITIES FOR GROWTH Curtis Mann Director of Wine & Beverage Raley s Family of Fine Stores Raley s Overview 3 Billion Dollar Company 120 Stores across
Bottled Water Category Overview
 Bottled Water Category Overview 2014-2015 Disclaimer The following information is offered in good faith and represents an unqualified interpretation of a range of industry commentary and market data. It
MANGO PERFORMANCE BENCHMARK REPORT
 MANGO PERFORMANCE BENCHMARK REPORT 2015-2016 TABLE OF CONTENTS Page 3 Page 5 Page 12 Page 15 Page 27 Page 36 Page 46 Approach and Data Set Parameters Overview and Mango Trend-Spotting Fruit and Tropical
Issue No. 7 SPOTLIGHT THE PHILIPPINES
 Issue No. 7 2 Greetings! Foreword Alex Duterrage General Manager for Kantar Worldpanel Philippines Health & wellness have been one of the trending topics across the world. Zooming into the Philippines,
Sugar scenario in CIS countries:
 Sugar scenario in CIS countries: on the way to self-sufficiency Andrey Bodin Eurasian Sugar Association Commonwealth of Independent States (CIS) consists of 11 countries CIS Moldova Belarus Population
Coffee market settles lower amidst strong global exports
 Coffee market settles lower amidst strong global exports The ICO composite indicator price declined by 1.2% in February 2018 to an average of 114.19 US cents/lb. Indicator prices for all three Arabica
Coffee prices maintain downward trend as 2015/16 production estimates show slight recovery
 Coffee prices maintain downward trend as 2015/16 production estimates show slight recovery The coffee market fell again in December 2015, reaching its second lowest monthly average of the year. This decrease
Overview of the Manganese Industry
 39th Annual Conference Istanbul, Turkey 2013 Overview of the Manganese Industry International Manganese Institute Alberto Saavedra Market Research Manager June, 2013 Introduction Global Production Supply,
WEEKLY OILSEED REPORT 22 NOVEMBER 2018
 WEEKLY OILSEED REPORT 22 NOVEMBER 2018 Unigrain (Pty) Ltd Tel. No. : +27 11 692 4400 Fax. No. : +27 11 412 1183 INTERNATIONAL MARKET Table 1: CME Soybean prices and weekly change (cents/bushel) Currently
SPIRITS PRODUCT NEEDS
 SPIRITS PRODUCT NEEDS -13 Spring & Summer Seasonal Brown Spirits Focus is on premium and deluxe products in tequila/mescal, non cream liqueurs. These products will be purchased on a one shot basis and
Advanced Paper 1: Markets and how they work. Sample assessment materials for first teaching September 2015 Time: 2 hours
 Write your name here Surname Other names Pearson Edexcel Level 3 GCE Centre Number Economics B Advanced Paper 1: Markets and how they work Candidate Number Sample assessment materials for first teaching
Dairy Outlook. December By Jim Dunn Professor of Agricultural Economics, Penn State University. Market Psychology
 Dairy Outlook December 2015 By Jim Dunn Professor of Agricultural Economics, Penn State University Market Psychology The Class III market has taken a beating lately as cheese prices have drifted down and
WEEKLY MAIZE REPORT 11 JULY 2018
 28 29 21 211 212 213 214 215 216 217 218 WEEKLY MAIZE REPORT 11 JULY 218 Unigrain (Pty) Ltd Tel. No. : +27 11 692 44 Fax. No. : +27 11 412 1183 INTERNATIONAL MARKET Table 1: CME Maize prices and weekly
TOTAL STORE CONNECTIVITY: REVEALING NEW PATHWAYS TO WIN SPECIALTY CHEESE
 TOTAL STORE CONNECTIVITY: REVEALING NEW PATHWAYS TO WIN SPECIALTY CHEESE International Dairy Deli Bakery Association In partnership with Nielsen Perishables Group May, 2015 AGENDA Study Objectives 3 Deli
Everclear still IS the NGS category with +95% share! Source(s): IRI Data 26 Weeks Ending 4/9/17 Total US MULO +C Nielsen Total US 7/15/17
: IRI Data 26 Weeks Ending 4/9/17 Total US MULO +C Nielsen Total US 7/15/17") Everclear still IS the NGS category with +95% share! Source(s): IRI Data 26 Weeks Ending 4/9/17 Total US MULO +C Nielsen Total US 7/15/17 MAKE IT YOUR OWN With a neutral profile and a unique ability to
Everclear still IS the NGS category with +95% share! Source(s): IRI Data 26 Weeks Ending 4/9/17 Total US MULO +C Nielsen Total US 7/15/17 MAKE IT YOUR OWN With a neutral profile and a unique ability to
Wine Trends & the U.S. Consumer Laura Maniec, MS. CVRVV Conference January 10 th & 11 th 2013
 Wine Trends & the U.S. Consumer Laura Maniec, MS CVRVV Conference January 10 th & 11 th 2013 Consumer Wine Consumption Core segment of wine drinkers continues to grow, driven mostly by younger Millennials
Thailand Packaging Machinery Market. Jorge Izquierdo VP Market Development PMMI
 Thailand Packaging Machinery Market Jorge Izquierdo VP Market Development PMMI jizquierdo@pmmi.org www.pmmi.org/global www.pmmi.org/research Today General Economic and Political Highlights Current Packaging
World coffee consumption increases but prices still low
 World coffee consumption increases but prices still low The coffee market stabilised slightly in February, but prices remain at very low levels. A lack of news regarding fundamentals with expectations
Fish and Chips in Commercial Foodservice 2016 JULIA BROOKS, JANUARY 2017
 Fish and Chips in Commercial Foodservice 2016 JULIA BROOKS, JANUARY 2017 INTRODUCTION Since the mid nineteenth century fish and chips have built their position as being a symbol of the UK s culinary culture
Source : Intl Coffee Org. Other Milds. Brazil 26,08 % 29,28 % 28,27 % 26,37 % 28,81 % 39,76 % 27,78 % 34,19 % Prices Kenya
 2 nd World Coffee Conference, Bahia 23-25 September 25 Lesson emerging from the crisis : New paths for the coffee sector Session 2 : Coffee policies in a market economy Giuseppe Lavazza Source : Intl Coffee
Consumer Insights into Lunchtime
 Consumer Insights into Lunchtime Ireland Foodservice Seminar 6 November 2013 Paula Donoghue, Insight & Brand Manager Growing the success of Irish food & horticulture About the study Lunchtime activities
Enter the Grocerant: Grocery Stores Winning at Foodservice
 Tweet 6 Competitive Edge A communication featuring information and analysis from The NPD Group's QSR Market Monitor QSR Market Monitor Competitive Edge March 2016 Home Download PDF Previous Issues Enter
Coffee market remains volatile but lacks direction
 Coffee market remains volatile but lacks direction Prices fluctuated significantly during August, with the ICO composite indicator dropping by 10 cents before jumping back up another 12 cents by the end
Welcome to the. Find out more about the parts of the world where SIAL Network is established, thanks to the Euromonitor s study.
 Welcome to the Find out more about the parts of the world where SIAL Network is established, thanks to the Euromonitor s study. SELECT A REGION TO SEE THE REPORT Canada China Indonesia Middle East & Africa
WEEKLY OILSEED REPORT 27 JUNE 2018
 WEEKLY OILSEED REPORT 27 JUNE 218 Unigrain (Pty) Ltd Tel. No. : +27 11 692 44 Fax. No. : +27 11 412 1183 INTERNATIONAL MARKET Table 1: CME Soybean prices and weekly change (cents/bushel) Currently 2/6/218
Pecan Shellers Association Presentation. Presented by:
 Pecan Shellers Association Presentation Presented by: Session Objectives Industry Update Consumer Trends Menu Trends Price Trends Opportunities For Nuts Conclusion 2 Industry Update 3 Disposable Personal
ONE YEAR ANNUAL RESULTS FONTERRA FONTERRA CO-OPERAT CO-OPERA IVE GROUP LTD
 ONE YEAR. 2012 ANNUAL RESULTS FONTERRA CO-OPERATIVE GROUP LTD 1 SIR HENRY VAN DER HEYDEN CHAIRMAN FONTERRA CO-OPERATIVE GROUP LTD 2 OVERVIEW Highlights Business performance Update on strategy Questions
THE FRENCH WINE MARKET LANDSCAPE REPORT SEPTEMBER 2017
 THE FRENCH WINE MARKET LANDSCAPE REPORT SEPTEMBER 2017 Landscape Wine Intelligence 2017-2017 1 Report overview 5 report credits Click here to purchase Report price: GBP 2,500 USD 3,250 AUD 4,500 EUR 3,00
Agenda. DEFINITION: Restaurant Industry Food Away from Home. FCP Webinar February 24, 2017 STATE OF THE RESTAURANT INDUSTRY
 2016 Restaurant Industry Forecast Annika Stensson Director Research Communications National Restaurant Association Washington, D.C. Food & Culinary Professionals Academy of Nutrition and Dietetics State
DISTILLERY REPORT. Prepared for Colorado Distillers Guild
 DISTILLERY REPORT Prepared for Colorado Distillers Guild Consumer Insights and Business Innovation Center (CiBiC) Daniels College of Business, University of Denver Intern Researcher: Federica Bologna Faculty
Germany a land of opportunities. January 16th 2018
 Germany a land of opportunities January 16th 2018 Agenda The German Market 1. Social and demographical characterization 2. Economic Data 3. Food and beverage exports from Portugal to Germany 4. The German
Pizza Pizza Royalty Corp. ANNUAL GENERAL MEETING May 29, 2013
 Pizza Pizza Royalty Corp. ANNUAL GENERAL MEETING May 29, 2013 1 Elizabeth Wright, Board Chair 2 Forward-Looking Statement This presentation will contain forward-looking statements. Investors should be
Chilled Seafood in Multiple Retail (2018)
") Market Insight Factsheet Chilled Seafood in Multiple Retail () This factsheet provides a summary of the performance of the chilled seafood sector in the multiple retail seafood market up to June. The chilled
Market Insight Factsheet Chilled Seafood in Multiple Retail () This factsheet provides a summary of the performance of the chilled seafood sector in the multiple retail seafood market up to June. The chilled
An update from the Competitiveness and Market Analysis Branch, Alberta Agriculture and Forestry.
 An update from the Competitiveness and Market Analysis Branch, Alberta Agriculture and Forestry. The articles in this series includes information on what consumers are buying and why they are buying it.
China s Export of Key Products of Pharmaceutical Raw Materials
 China s Export of Key Products of Pharmaceutical Raw Materials During the period of the 62nd API China& INTERPHEX CHINA, China Pharmaceutical Industry Association released its annual Report on Analysis
Haddock. Seafood Industry Factsheet. Market overview: haddock
 Seafood Industry Factsheet Haddock Market overview: haddock The UK s supply of haddock (Melanogrammus aeglefinus) relies on imports and domestic landings by the UK fleet. Haddock is popular in both retail
More information from: https://www.wiseguyreports.com/reports/ global-online-food-delivery-and-takeaway-marketanalysis-by-order-type
 Report Information More information from: https://www.wiseguyreports.com/reports/1079744-global-online-food-delivery-and-takeaway-marketanalysis-by-order-type Global Online Food Delivery and Takeaway Market
WEEKLY MAIZE REPORT 13 DECEMBER 2017
 90/91 91/92 92/93 93/94 94/95 95/96 96/97 97/98 98/99 99/00 00/01 01/02 02/03 03/04 04/05 05/06 06/07 07/08 08/09 09/10 10/11 11/12 12/13 13/14 14/15 15/16 16/17 17/18 WEEKLY MAIZE REPORT 13 DECEMBER 2017
Market Insight Factsheet. Haddock (2018 Update)
") Market Insight Factsheet Haddock (2018 Update) Market Overview: This factsheet provides a summary of the UK value chain for haddock. It is intended to inform stakeholders of the UK seafood industry about
Market Insight Factsheet Haddock (2018 Update) Market Overview: This factsheet provides a summary of the UK value chain for haddock. It is intended to inform stakeholders of the UK seafood industry about
Sugar Industry Update
 January 19, 217 I Industry Research Sugar Industry Update Contact: Madan Sabnavis Chief Economist mailto:madan.sabnavis@careratings.com 91-22-6743489 Bhagyashree Bhati Research Analyst bhagyashree.bhati@careratings.com
Consumer Insights. Chewy Candy. Empowering Manufacturers and Retailers for Category 1 Growth
 Consumer Insights Chewy Candy Empowering Manufacturers and Retailers for Category 1 Growth NCA Sweet Insights Contributing Partners The NPD Group SymphonyIRI The Futures Group The Capre Group 2 Why NCA
Raw Materials Usage and Feed Production Returns
 Exhibition Park, Samora Machel Avenue West, Belvedere P. O. Box BE209, Belvedere, Harare Phone: 04-756 600, 772 915, 777391 Email: admin@lit.co.zw Raw Materials Usage and Feed Production Returns September
TRENDS IN SALES OF MEAT PRODUCTS A RETAIL PERSPECTIVE. Meat Market Observatory 25 June 2018
 TRENDS IN SALES OF MEAT PRODUCTS A RETAIL PERSPECTIVE Meat Market Observatory 25 June 2018 Belgium Product category Total pigmeat Price evolution (% change Apr-18 vs Apr-17) Price evolution (% change Jan-Apr
SFR Condo Residential Lot Sales Inventory Sales Inventory Sales Inventory. Month YTD Month Month YTD Month Month YTD Month
 Grand Strand Market Report 2018 was a strong month for sales activity in the Grand Strand with SFR and condo sales volume up 5.11% and 19.14%, respectively, for the month. Residential lot sales are also
Economics and Poverty
 Economics and Poverty Commodity Prices in Real Terms: Jute Commodity Prices in Real Terms: Jute 1200 1000 800 US cents/lb 600 400 200 0 1971-73 1981-83 1991-93 2001-02 Figures from FAO The State of Agricultural
SFR Condo Residential Lot Sales Inventory Sales Inventory Sales Inventory. Month YTD Month Month YTD Month Month YTD Month
 Grand Strand Market Report 2017 SFR sales activity slides in as full year production flat to 2016. Tightening inventory contributing to SFR sales price growth. Condo sales volume and median sales prices