September 21 th, 2018
|
|
|
- Dulcie Anthony
- 5 years ago
- Views:
Transcription
1 Crop rotation implications in water balance through land use change scenarios using SWAT model David Rivas-Tabares, Ana María Tarquis, Bárbara Willaarts, Ángel de Miguel September 21 th, 2018
2 Outline I. Case Study II. Crop rotation strategy (SWAT model set-up) III. Model application IV. Model results V. Discussion VI. Conclusions


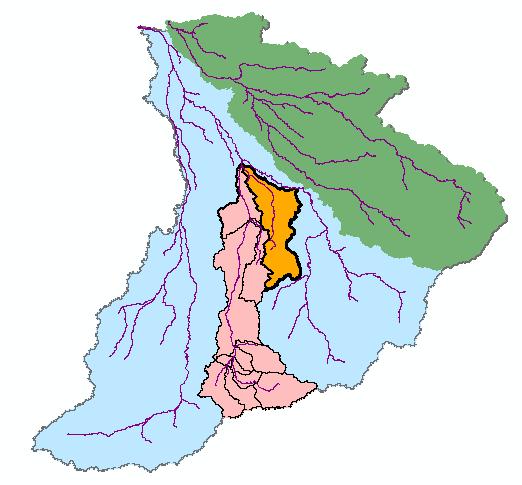
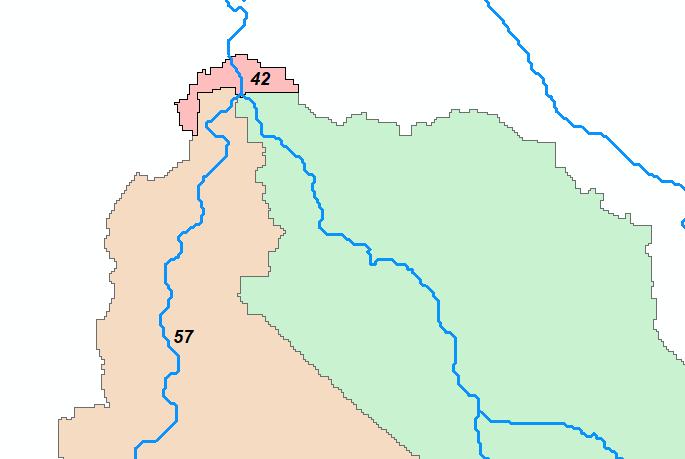
3 Flow gauge Case study


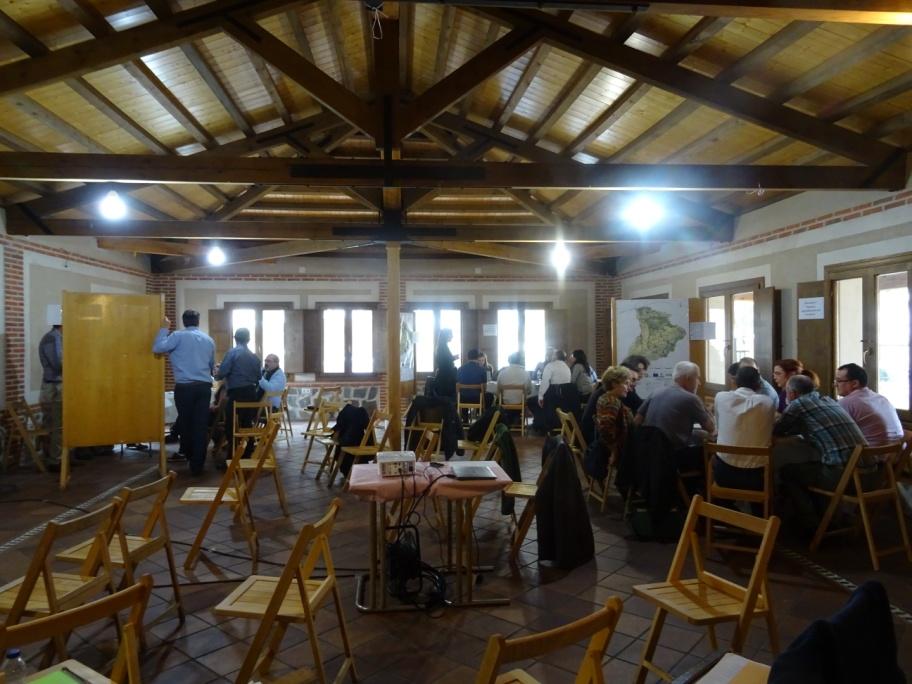
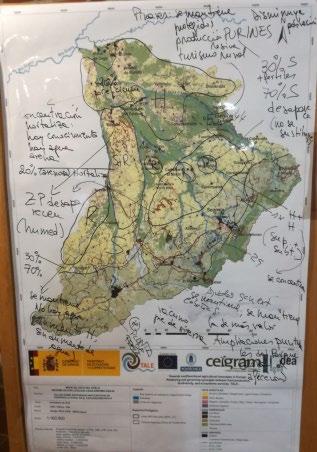
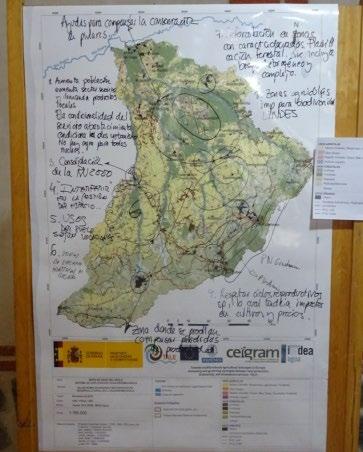
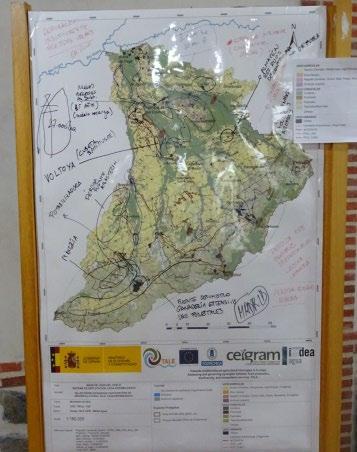
4 Land use maps Stakeholders Mapping activity Cega-Eresma-Adaja LSH LBA LSP 4

5 Land use dynamics (HRU level) HRUs Land Use Distribution LSP 41% 3.5% 24% 19% 12.6% LBA 57% 4.4%7.3% 19% 12.6% LSH 33% 2.6% 2.6% 19% 12.6% BASE 58% 2.6%8% 19% 12.6% 0% 20% 40% 60% 80% 100% RAINFED IRRI FALLOW GRASSLAND AND SHRUBS FOREST URBAN WATER
6 HRUs Selection (simplification) TOTAL HRUs (224) STATIC HRUs (203) 1). 0-5 ha (111) 2) ha (80) 3). Fixed HRUs (12) DYNAMIC HRUs 41% >100ha (21) 59% 1% 9% 31% Urban/ transport.(4) 12% 69% 1). Barley (6) 2). Wheat (5) 3). Grassland & Shrubs (4) 4). Sunflower (2) 30% 13% 8% 7% Actual Forest (6) 18% 5). Other Cereals (2) 2% Actual Horticulture(2) 1% 6). Hay (1) 7). Vineyard (1) 0.5% 0.4%
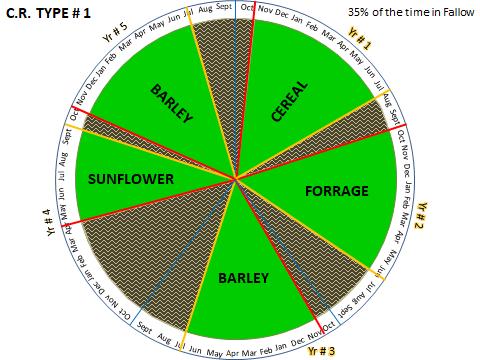
7 Baseline Crop Rotation Simplified schema 1 14% 16 HRUs ( 12,448 ha) Aggregated Pattern Type Year 1 Year 2 Year 3 Year 4 Year 5 1 Cereal/Forrage Cereal/Forrage Barley Sunflower Barley 2 Barley Sunflower Wheat Barley/ Other Cereal Barley/ Other Cereal 3 Other Cereals Legumes Sunflower Wheat Barley 4 Sunflower Barley Sunflower Cereal Cereal 5 Cereal Cereal Other cereal Sunflower/Legumes Sunflower/Legumes Monocrop Barley Wheat Barley Wheat Barley Cereals: Barley and wheat Monocrop 25% HRU 2004_2005* 2005_2006* 2006_2007* 2007_2008* 2008_2009* 2009_2010* 2010_2011* 2011_2012* 2012_2013* 2013_2014* 1 AGRC PEAS SUNF WWHT BARL AGRC PEAS SUNF WWHT BARL 2 BARL SUNF WWHT AGRC AGRC BARL SUNF WWHT AGRC AGRC 3 HAY BARL BARL SUNF BARL HAY BARL BARL SUNF BARL 4 SUNF BARL SUNF WWHT BARL SUNF BARL SUNF WWHT BARL 5 WWHT BARL AGRC PEAS BARL WWHT BARL AGRC PEAS BARL 6 AGRC PEAS SUNF WWHT BARL AGRC PEAS SUNF WWHT BARL 7 BARL SUNF WWHT BARL BARL BARL SUNF WWHT BARL BARL 8 SUNF BARL WWHT SUNF BARL SUNF BARL WWHT SUNF BARL 9 WWHT BARL BARL WWHT SUNF WWHT BARL BARL WWHT SUNF 10 BARL AGRC SUNF WWHT PEAS BARL AGRC SUNF WWHT PEAS 11 WWHT BARL BARL SUNF BARL WWHT BARL BARL SUNF BARL 12 BARL WWHT BARL BARL WWHT BARL WWHT BARL BARL WWHT 13 WWHT WWHT SUNF WWHT BARL WWHT WWHT SUNF WWHT BARL 14 BARL BARL AGRC PEAS SUNF BARL BARL AGRC PEAS SUNF 15 WWHT AGRC PEAS WWHT SUNF WWHT AGRC PEAS WWHT SUNF 16 BARL HAY BARL AGRC SUNF BARL HAY BARL AGRC SUNF 5 20% 4 13% 3 4% 2 24%

8 Scenarios LU Reference Maps 224 HRUs 224 HRUs 224 HRUs 224 HRUs
9 Hydrological years Rotation scheme template Sept 5 1 Jul Apr
10
11


12 HRU 1 Baseline Crop Rotation Timeline Schema AGRC PEAS SUNF WWHT BARL AGRC PEAS SUNF WWHT BARL BARL SUNF WWHT AGRC AGRC BARL SUNF WWHT AGRC AGRC HAY BARL BARL SUNF BARL HAY BARL BARL SUNF BARL SUNF BARL SUNF WWHT BARL SUNF BARL SUNF WWHT BARL WWHT BARL AGRC PEAS BARL WWHT BARL AGRC PEAS BARL AGRC PEAS SUNF WWHT BARL AGRC PEAS SUNF WWHT BARL BARL SUNF WWHT BARL BARL BARL SUNF WWHT BARL BARL SUNF BARL WWHT SUNF BARL SUNF BARL WWHT SUNF BARL WWHT BARL BARL WWHT SUNF WWHT BARL BARL WWHT SUNF BARL AGRC SUNF WWHT PEAS BARL AGRC SUNF WWHT PEAS WWHT BARL BARL SUNF BARL WWHT BARL BARL SUNF BARL BARL WWHT BARL BARL WWHT BARL WWHT BARL BARL WWHT WWHT WWHT SUNF WWHT BARL WWHT WWHT SUNF WWHT BARL BARL BARL AGRC PEAS SUNF BARL BARL AGRC PEAS SUNF WWHT AGRC PEAS WWHT SUNF WWHT AGRC PEAS WWHT SUNF BARL HAY BARL AGRC SUNF BARL HAY BARL AGRC SUNF
13 LSH Crop Rotation Schema LSH HRU area distribution [%] LU(baseline) Area [ha] AGRC BARL RNGE RNGE RNGE RNGE RNGE RNGE 7174 HAY RNGE 118 SUNF 1 RNGE 1591 WWHT Total HRU 2004_2005* 2005_2006* 2006_2007* 2007_2008* 2008_2009* 2009_2010* 2010_2011* 2011_2012* 2012_2013* 2013_2014* 1 BARL SUNF WWHT AGRC AGRC BARL SUNF WWHT AGRC AGRC 2 WWHT BARL AGRC PEAS BARL WWHT BARL AGRC PEAS BARL 3 RNGE RNGE RNGE RNGE RNGE RNGE RNGE RNGE RNGE RNGE 4 RNGE RNGE RNGE RNGE RNGE RNGE RNGE RNGE RNGE RNGE 5 RNGE RNGE RNGE RNGE RNGE RNGE RNGE RNGE RNGE RNGE 6 RNGE RNGE RNGE RNGE RNGE RNGE RNGE RNGE RNGE RNGE 7 RNGE RNGE RNGE RNGE RNGE RNGE RNGE RNGE RNGE RNGE 8 RNGE RNGE RNGE RNGE RNGE RNGE RNGE RNGE RNGE RNGE 9 RNGE RNGE RNGE RNGE RNGE RNGE RNGE RNGE RNGE RNGE 10 AGRC PEAS SUNF WWHT BARL AGRC PEAS SUNF WWHT BARL 11 RNGE RNGE RNGE RNGE RNGE RNGE RNGE RNGE RNGE RNGE 12 BARL WWHT BARL BARL WWHT BARL WWHT BARL BARL WWHT 13 WWHT WWHT SUNF WWHT BARL WWHT WWHT SUNF WWHT BARL 14 BARL BARL AGRC PEAS SUNF BARL BARL AGRC PEAS SUNF 15 WWHT AGRC PEAS WWHT SUNF WWHT AGRC PEAS WWHT SUNF 16 BARL HAY BARL AGRC SUNF BARL HAY BARL AGRC SUNF
14 LBA Crop Rotation Schema LSH HRU area distribution [%] LU(baseline) Area [ha] AGRC BARL HORT HAY WWHI 118 SUNF WWHT Total HRU 2004_2005* 2005_2006* 2006_2007* 2007_2008* 2008_2009* 2009_2010* 2010_2011* 2011_2012* 2012_2013* 2013_2014* 1 BARL SUNF WWHT AGRC AGRC BARL SUNF WWHT AGRC AGRC 2 HAY BARL BARL SUNF BARL HAY BARL BARL SUNF BARL 3 WWHT BARL BARL WWHT SUNF WWHT BARL BARL WWHT SUNF 4 BARL SUNF WWHT BARL BARL BARL SUNF WWHT BARL BARL 5 WWHT BARL BARL WWHT SUNF WWHT BARL BARL WWHT SUNF 6 BARL SUNF WWHT BARL BARL BARL SUNF WWHT BARL BARL 7 HORT HORT HORT HORT HORT HORT HORT HORT HORT HORT 8 BARL SUNF WWHT BARL BARL BARL SUNF WWHT BARL BARL 9 WWHI BARI BARI WWHI BARI WWHI BARI BARI WWHI BARI 10 SUNF BARL WWHT SUNF BARL SUNF BARL WWHT SUNF BARL 11 SUNF BARL WWHT SUNF BARL SUNF BARL WWHT SUNF BARL 12 BARL WWHT BARL BARL WWHT BARL WWHT BARL BARL WWHT 13 WWHT WWHT SUNF WWHT BARL WWHT WWHT SUNF WWHT BARL 14 BARL BARL AGRC PEAS SUNF BARL BARL AGRC PEAS SUNF 15 WWHT AGRC PEAS WWHT SUNF WWHT AGRC PEAS WWHT SUNF 16 BARL HAY BARL AGRC SUNF BARL HAY BARL AGRC SUNF
15 LSP Crop Rotation Schema LSH HRU area distribution [%] LU(baseline) Area [ha] AGRC RNGE RNGE 496 BARL 7 RNGE HAY HORT 118 SUNF 8 RNGE 1591 WWHT Total HRU 2004_2005* 2005_2006* 2006_2007* 2007_2008* 2008_2009* 2009_2010* 2010_2011* 2011_2012* 2012_2013* 2013_2014* 1 RNGE RNGE RNGE RNGE RNGE RNGE RNGE RNGE RNGE RNGE 2 RNGE RNGE RNGE RNGE RNGE RNGE RNGE RNGE RNGE RNGE 3 BARL SUNF WWHT BARL BARL BARL SUNF WWHT BARL BARL 4 RNGE RNGE RNGE RNGE RNGE RNGE RNGE RNGE RNGE RNGE 5 BARL SUNF WWHT BARL BARL BARL SUNF WWHT BARL BARL 6 BARL SUNF WWHT BARL BARL BARL SUNF WWHT BARL BARL 7 BARL SUNF WWHT BARL BARL BARL SUNF WWHT BARL BARL 8 BARL SUNF WWHT BARL BARL BARL SUNF WWHT BARL BARL 9 HORT HORT HORT HORT HORT HORT HORT HORT HORT HORT 10 SUNF BARL WWHT SUNF BARL SUNF BARL WWHT SUNF BARL 11 RNGE RNGE RNGE RNGE RNGE RNGE RNGE RNGE RNGE RNGE 12 BARL WWHT BARL BARL WWHT BARL WWHT BARL BARL WWHT 13 WWHT WWHT SUNF WWHT BARL WWHT WWHT SUNF WWHT BARL 14 BARL BARL AGRC PEAS SUNF BARL BARL AGRC PEAS SUNF 15 WWHT AGRC PEAS WWHT SUNF WWHT AGRC PEAS WWHT SUNF 16 BARL HAY BARL AGRC SUNF BARL HAY BARL AGRC SUNF
16 Calibration Process Calibration Daily time step Flow Yield Yearly Barley Wheat 1. CN2 2. Alpha_BF 3. GW_DELAY 4. GWQMN 5. SOL_AWC 6. SOL_Z 7. SURLAG 8. CANMX 9. SHALLST Parameters 10. REVAPMN 11. RCHRG_DP 12. ESCO 13. EPCO 14. LAT_TIME 15. EVRCH 16. GW_REVAP 17. PLAPS 18. HRU_SLP 19. OV_N 20. SLSUBBSN 21. CH_K1 22. CH_K2 23. CH_N1 24. CH_N2 25. SLSOIL
17 Baseline Flow Calibration C.R. Objective function (maximize): Nash-Sutcliffe (1970) STATISTIC SUMMARY Variable FLOW_OUT_1 p-factor 1.00 r-factor 0.38 R NS 0.99 br MSE SSQR PBIAS -2.5 KGE 0.96 RSR 0.11 MNS 0.95 VOL_FR 0.98 Parameter_Name Fitted_Value Min_value Max_value 1:V GW_REVAP.gw :V ESCO.hru :R SOL_AWC(..).sol :R CN2.mgt :R REVAPMN.gw :R ALPHA_BF.gw :R SOL_Z(..).sol Type of change: v_ value replaced by a given value r_ means an existing value is multiplied by (1+ a given value)

18 Flow Validation C.R. Variable STATISTIC SUMMARY FLOW_OUT_1 p-factor 0.86 r-factor 0.40 R NS 0.95 br MSE SSQR PBIAS -4.1 KGE 0.95 RSR 0.21 MNS 0.85 VOL_FR 0.96
19 [mm/month] Oct Nov Dec Jan Feb Mar Apr May Jun Jul Aug Sept Rain [mm/month] PET [mm/month] ET [mm/month] [mm/month] Oct Nov Dec Jan Feb Mar Apr May Jun Jul Aug Sept Lat Q [mm/month] Surf Q [mm/month] Gw Flow [mm/month] Water Yield [mm/month]
20 Scenario Analysis C.R. results (with calibration parameter value transfer) Scenario Water Balance variation C.R. with respect to Baseline 2% 1.5% 1.7% 1% 0% 0.3% 0.0% 0.7% 0.8% -1% -0.3% -0.2% -0.5% -0.6% -2% -3% -4% -3.5% LSH LBA LSP -3.0% Evapotranspiration[mm/yr] Flow Out [mm/yr] Soil Storage [mm/yr] DA recharge [mm/yr] Scenario Precipitation [mm/yr] Evapotranspiration [mm/yr] Flow Out [mm/yr] Soil Storage [mm/yr] DA recharge [mm/yr] Baseline LSH LBA LSP
21 Water Provision Results Scenario Precipitation Evapotranspiration Total Flow Out Soil Storage Irrigation* DA recharge [hm 3 /yr] [hm 3 /yr] [hm 3 /yr] [hm 3 /yr] [hm 3 /yr] [hm 3 /yr] Baseline LSH LBA LSP * Irrigation volume is included in Evapotranspiration volume. Table. 2. System Water Flows with SWAT model. 15% 10% LSH LBA LSP 12.3% 9.4% 5% 0% -5% -0.3% 1.5% -0.1% 1.7% -0.9% 0.3% 0.0% 0.6% -0.7% -0.6% -2.4% -2.1% 0.6% Evapotranspiration [m3/yr] Flow Out [m3/yr] Soil Storage [m3/yr] DA recharge [m3/yr] Irrigation [m3/yr] Fig. 4. Scenario Water Balance variation with respect to Baseline. Scenario Evapotranspiration Total Flow Out Soil Storage DA recharge Total variation [hm 3 /yr] [hm 3 /yr] [hm 3 /yr] [hm 3 /yr] [hm 3 /yr] LSH LBA LSP Table. 3. Total Volume Water Balance variation with respect to Baseline.
22 10 Years Water Provision Results Scenario Precipitation Evapotranspiration Total Flow Out Soil Storage & DA recharge [mm]/[hm 3 ] [mm]/[hm 3 ] [mm]/[hm 3 ] SA[mm]/[hm 3 ] [mm]/[hm 3 ] Baseline 4343 / ,09 / 768,09 663,29 / 160,91 480,15 / 116,88 33,47 / 8,12 LSH 4343 / ,61 / 770,40 656,16 / 159, / 116,43 32,94 / 7,99 LBA 4343 / ,85 / ,39 / 158,51 481,94 / 117,31 32,82 / 7,96 LSP 4343 / ,47 / 770,36 655, 86 / 159,11 544,62 / 116,54 32,95 / 7, % 0.00% -0.50% -1.00% -1.50% -2.00% -2.50% 0.30% LSH LBA LSP 0.28% 0.37% 0.30% -0.39% -0.29% -1.08% -1.12% -1.60% -1.49% -1.97% Evapotranspiration Total Flow Out Soil Storage & SA DA recharge -1.60% hm LSH LBA LSP Evapotranspiration [hm3] Total Flow Out [hm3] Soil Storage & SA[hm3] DA recharge [hm3]
23 Q95 Q90 DRBA limit Low Flow Baseline: Q95 (percentil 5) and Q90 (percentil 10) Volume[hm3] Oct Nov Dec Jan Feb Mar Apr May Jun Jul Aug Sept Q95 Q90 DRBA limit LSP: Q95 (percentil 5) and Q90 (percentil 10) Volume[hm3] Oct Nov Dec Jan Feb Mar Apr May Jun Jul Aug Sept
24 Low Flow LBA: Q95 (percentil 5) and Q90 (percentil 10) Volume[hm3] Oct Nov Dec Jan Feb Mar Apr May Jun Jul Aug Sept Q95 Q90 DRBA limit LSH: Q95 (percentil 5) and Q90 (percentil 10) Volume[hm3] Oct Nov Dec Jan Feb Mar Apr May Jun Jul Aug Sept Q95 Q90 DRBA limit
25 Low Flow Q95 (percentil 5) 6.0% 4.0% 2.0% 0.0% -2.0% -4.0% -6.0% -8.0% Oct Nov Dec Jan Feb Mar Apr May Jun Jul Aug Sept Q95_LSH Q95_ LBA Q95_LSP Q90 (percentil 10) 6.0% 4.0% 2.0% 0.0% -2.0% -4.0% -6.0% -8.0% -10.0% -12.0% Oct Nov Dec Jan Feb Mar Apr May Jun Jul Aug Sept Q90_LSH Q90_ LBA Q90_LSP
26 Economic Analysis 50% 40% 30% 20% 10% 0% -10% -20% -30% Warm-Up Agricultural economy variation with respect to Baseline (C.R.) DRY NORMAL WET WET DRY WET DRY DRY WET NORMAL LSH LBA LSP 25% 20% 15% 10% 5% Total Variation in 10 years ( ) (C.R.) 4.15% 19.43% Scenario TOTAL_SCENARIO ( ) Baseline LSH LBA LSP % -5% -3.44% LSH LBA LSP
27 Conclusions C.R. setup in SWAT its important to obtain more realistic models. C.R. scenarios could provide further insights to optimize land use change and rotational crop patterns in a more sustainable way. Water balance components in sub-arid areas are sensitive to C.R. due of low flow during spring-summer periods. Irrigation schemas have to be reformulated in this subbasin facing to CC and to achieve a good ecological status. Fallow land use its important in subarid watersheds


28 Thanks! Ana Tarquis Bárbara Willaarts Angel de Miguel David Rivas
CMG GardenNotes #746 Climate Summary: Fort Collins, Greeley, and Estes Park, Colorado
 CMG GardenNotes #746 Climate Summary: Fort Collins, Greeley, and Estes Park, Colorado Monthly Temperatures Jan Feb Mar Apr Jun Jul Aug Sept Oct Nov Dec Annual Estes Park average extreme high 53 55 60 69
Problem Set #3 Key. Forecasting
 Problem Set #3 Key Sonoma State University Business 581E Dr. Cuellar The data set bus581e_ps3.dta is a Stata data set containing annual sales (cases) and revenue from December 18, 2004 to April 2 2011.
SFR Condo Residential Lot Sales Inventory Sales Inventory Sales Inventory. Month YTD Month Month YTD Month Month YTD Month
 Grand Strand Market Report 2018 was a strong month for sales activity in the Grand Strand with SFR and condo sales volume up 5.11% and 19.14%, respectively, for the month. Residential lot sales are also
Fresh Produce Report. P13: 12 w/e 3rd January Kantar Worldpanel
 Fresh Produce Report P13: 12 w/e 3rd January 2016 1 HOW IS TOTAL PRODUCE PERFORMING? Total Produce is worth 2.1bn and is growing by 4.1% compared to the same period last year. Much of this is driven by
SFR Condo Residential Lot Sales Inventory Sales Inventory Sales Inventory. Month YTD Month Month YTD Month Month YTD Month
 Grand Strand Market Report 2017 Grand Strand market activity took a slight step back in after 3 months of steady growth. SFR sales volume dropped 5.7% for the month but is still up 7.2% year-to-date. The
SFR Condo Residential Lot Sales Inventory Sales Inventory Sales Inventory. Month YTD Month Month YTD Month Month YTD Month
 Grand Strand Market Report 2016 Sales activity in the Grand Strand ended 2016 with a solid month of sales. SFR sales are up 2.0% for the month and up 4.1% for the year; setting a new market record for
SFR Condo Residential Lot Sales Inventory Sales Inventory Sales Inventory. Month YTD Month Month YTD Month Month YTD Month
 Grand Strand Market Report 2017 SFR sales activity slides in as full year production flat to 2016. Tightening inventory contributing to SFR sales price growth. Condo sales volume and median sales prices
Composition and Value of Loin Primals
 Composition and Value of Loin Primals Tom J. Baas, Ph.D. Iowa State University Pork producers today are interested in adding value over and above traditional commodity markets to the hogs they produce
The Changing Landscape of Dairy: A Regional Outlook. Mark Stephenson Director of Dairy Policy Analysis
 The Changing Landscape of Dairy: A Regional Outlook Mark Stephenson Director of Dairy Policy Analysis Millions of Pounds Let s remember when 32,000 30,000 28,000 Wisconsin Annual Milk Production It s the
CONSUMER PRICE INDEX : April April 2014 Local, imported and all items
 SDT:339 CONSUMER PRICE INDEX : 03 04, imported and all items 4.0.0 08.0 Index 06.0 0.0 98.0 96.0 94.0 Apr Apr Mar 03 Mar Feb Jan Dec Nov Oct Sep Aug Jul Jun Apr 9.0 04 All Items Fig : Graphical representation
Chef And Team Derby Green Ooty
 Chef And Team Derby Green Ooty Sr. No. Name Token No./ ID 1. Chef Niraj Kumar Team Kitchen Awards 2017 Name of the Project :To reduce food cost and food wastage without affecting the customer dining exper
Smoke Taint Risk Management Tools
 Smoke Taint Risk Management Tools Glynn Ward, Art Diggle, Michael Saam-Renton 2, and Michael Airey 2, Kristen Kennison, Diana Fisher, Drew Haswell 3, John Gillard 3 Department of Agriculture and Food WA
MGEX Spring Wheat 2013
 MGEX Spring Wheat 213 The Minneapolis Grain Exchange, Inc. (MGEX) has been the principal market for hard red spring (HRS) wheat since 1881, offering futures and options contracts based on this unique commodity.
Consumer Price Index
 KINGDOM OF Consumer Price Index Website: E-mail : Statistics Department P.O. Box 149 Nuku alofa Kingdom of Tonga www.spc.int/prism/tonga/ dept@stats.gov.to Mar, 2018 Price: $ 2.50 Fig 3: Contribution
Coffee weather report November 10, 2017.
 Coffee weather report November 10, 2017. awhere, Inc., an agricultural intelligence company, is pleased to provide this map-and-chart heavy report focused on the current coffee crop in Brazil. Global stocks
2012 Estimated Acres Producers Estimated Production Units Estimated Farm Value Farm Crawfish 182,167 1,251 90,973,725 Lbs.
 www.lsuagcenter.com 2012 Estimated Acres Producers Estimated Production Units Estimated Farm Value Farm Crawfish 182,167 1,251 90,973,725 Lbs. $152,835,858 Crawfish Biology Life Cycles evolved in nature,
Price monitoring of key food items in Donetsk and Luhansk Oblasts
 Market update Issue (October ) UKRAINE Price monitoring of key food items in Donetsk and Luhansk Oblasts Fighting hunger worldwide Highlight Cost of food basket remained higher at national level throughout
EPO 2013/ CR-34 Obed Mountain Mine Monthly Status Report - January 2017
 WESTMORELAND COAL COMPANY -Obed Mountain Mine EPO 2013/ CR-34 Obed Mountain Mine Monthly Status Report - January 2017 Issued February 7th, 2017 Monthly Status Report January Issued February 7th, 2017 Table
Mitigation, adaptation or innovation?
 Mitigation, adaptation or innovation? Mardi Longbottom mardi.longbottom@awri.com.au @The_AWRI #newclimate The AWRI Mitigation, adaptation or innovation? Mitigation Adaptation Extension and outreach Why
HUNTINGTON PRECIPITATION Water Accumulation in Inches
 0 6/30/2017 6/2/2017 5/5/2017 AVERAGE 4/7/2017 3/10/2017 HUNTINGTON PRECIPITATION Water Accumulation in Inches 2/10/2017 1/13/2017 12/16/2016 11/18/2016 10/21/2016 9/23/2016 8/26/2016 7/29/2016 7/1/2016
Outline. Long-term Outlook for Cotton Consumption. World End-Use Consumption of Textile Fibers. World Consumption of Textile Fibers
 World Cotton Supply and Use International Cotton Advisory Committee Secretariat Outline! Long-term Outlook for Consumption! Outlook for /! Developments in World Cotton Trade Fifth Open Session: Cotton
Seasonal trends in hectares planted, sales volumes on markets and market prices. Pieter van Zyl, Potatoes South Africa
 Seasonal trends in hectares planted, sales volumes on markets and market prices Pieter van Zyl, Potatoes South Africa Producers plant between 5 and 54 hectares of potatoes each year. According to Figure
Haystack at Scale in Australia & Data Driven Gap Analysis
 Data Modeling #1 Haystack at Scale in Australia & Data Driven Gap Analysis Leon Wurfel BUENO (Built Environment Optimisation) Tuesday, May 19, 2015 Who is BUENO? A 2-year old Australian-based analytics
Coffee market ends 2017/18 in surplus
 Coffee market ends 217/18 in surplus World coffee production in coffee year 217/18 is estimated 5.7% higher at 164.81 million bags as output of Arabica increased by 2.2% to 11.82, and Robusta grew 11.7%
World coffee consumption increases but prices still low
 World coffee consumption increases but prices still low The coffee market stabilised slightly in February, but prices remain at very low levels. A lack of news regarding fundamentals with expectations
CBH 2015/16 QUALITY REPORT
 CBH 2015/16 QUALITY REPORT CBH GROUP Our business OUR CUSTOMERS Flour millers, Maltsters Feed manufacturers Food processors OUR GROWERS 4500 members 10 million tonnes production average Largest Co-op in
Growing divergence between Arabica and Robusta exports
 Growing divergence between Arabica and Robusta exports In April 218, the ICO composite indicator decreased by.4% to an average of 112.56, with the daily price ranging between 11.49 and 114.73. Prices for
Gavin Quinney s Bordeaux Report
 Gavin Quinney s Bordeaux Report THE WEATHER 214 To understand the weather is to understand the vintage - and the wines. My first vintage was in 1964 and I can honestly say that, since then, no two vintages
Coffee market ends 2016/17 coffee year in deficit for the third consecutive year
 Coffee market ends 2016/17 coffee year in deficit for the third consecutive year The ICO composite indicator continued its downward trend that started at the end of August, averaging 124.46 US cents/lb.
Phenolics of WA State Wines*
 Phenolics of WA State Wines* Jim Harbertson Washington State University * And Grapes! Introduction Impacts of deficit irrigation on grape and wine phenolics Impacts of grape ripening on wine phenolic development
Coffee market settles lower amidst strong global exports
 Coffee market settles lower amidst strong global exports The ICO composite indicator price declined by 1.2% in February 2018 to an average of 114.19 US cents/lb. Indicator prices for all three Arabica
Coffee market remains volatile but lacks direction
 Coffee market remains volatile but lacks direction Prices fluctuated significantly during August, with the ICO composite indicator dropping by 10 cents before jumping back up another 12 cents by the end
Record Exports for Coffee Year 2016/17
 Record Exports for Coffee Year 2016/17 Total exports in September 2017 reached 8.34 million bags, compared to 9.8 million in September 2016. While coffee year 2016/17 registered a decrease in its final
Coffee market recovers slightly from December slump
 Coffee market recovers slightly from December slump After reaching its lowest level in 22 months in December 2017, the monthly average of the ICO composite indicator price increased by 1.4% to 115.60 US
WEEKLY OILSEED REPORT 31 OCTOBER 2018
 WEEKLY OILSEED REPORT 31 OCTOBER 218 Unigrain (Pty) Ltd Tel. No. : +27 11 692 44 Fax. No. : +27 11 412 1183 INTERNATIONAL MARKET Table 1: CME Soybean prices and weekly change (cents/bushel) Currently 24/1/218
Mango Retail Performance Report 2017
 Mango Retail Performance Report 2017 1 Table of Contents Pages 3-9 Pages 10-15 Pages 16-34 Pages 35-44 Pages 45-51 Pages 52-54 Executive Summary Fruit and Tropical Fruit Performance Whole Mango Performance
Record exports in coffee year 2017/18
 Record exports in coffee year 2017/18 Total coffee exports increased each year since 2010/11 with a new record reached in 2017/18 at 121.86 million bags, 2% higher than 2016/17. In the twelve months ending
MONTHLY COFFEE MARKET REPORT
 E MONTHLY COFFEE MARKET REPORT May 2014 After five consecutive months of rising prices, the coffee market reversed lower in May. From a high of 179 cents/lb in April, the daily price of the ICO composite
MONTHLY COFFEE MARKET REPORT
 1 E MONTHLY COFFEE MARKET REPORT March 2014 Ongoing uncertainty over the Brazilian coffee crop has caused significant fluctuations in coffee prices during March, with monthly volatility of the International
QUARTERLY REVIEW OF THE PERFORMANCE OF THE DAIRY INDUSTRY 1
 QUARTERLY REVIEW OF THE PERFORMANCE OF THE DAIRY INDUSTRY 1 The information in this document is from sources deemed to be correct. Milk SA, the MPO and SAMPRO are not responsible for the results of any
CANE PRICING POLICY SS INDIAN SUGAR MILLS ASSOCIATION, NEW DELHI
 CANE PRICING POLICY 2017-18 SS INDIAN SUGAR MILLS ASSOCIATION, NEW DELHI FRP has increased by almost 77% in 7 years 2 240 Rs. /qtl. 230 220 210 200 210 220 230 230 190 180 170 160 170 150 140 145 130 139.12
SOYBEAN GROWTH & DEVELOPMENT
 SOYBEAN GROWTH & DEVELOPMENT Keith Glewen, Nebraska Extension Educator 1 Soybean Growth Stages SOYBEAN GROWTH STAGES VEGETATIVE VE - Emergence VC - Unfoliolate V1-1st Trifoliolate V2-2nd Trifoliolate V3-3rd
Agricultural Exports, Economic Prospects and Jobs
 Agricultural Exports, Economic Prospects and Jobs West Hills Community College District Essential Elements Harris Ranch Inn and Conference Center November 6, 2014 Daniel A. Sumner University of California
Corn and Soybean CORN OUTLOOK SOYBEAN OUTLOOK STATISTICS AND ANALYSIS
 Corn and Soybean CORN OUTLOOK SOYBEAN OUTLOOK STATISTICS AND ANALYSIS CLAL (and its officers, employees and auxiliary persons) shall not be liable to clients, web users or anyone else for any loss or injury
Prices for all coffee groups increased in May
 Prices for all coffee groups increased in May In May 2018, the ICO composite indicator increased by 0.7% to an average of 113.34 US cents/lb, following three months of declines. Prices for all coffee groups
Import Export of fresh fruit & vegetables 2007
 Import Export of fresh fruit & vegetables 2007 Prepared by: Luan Hoti Pristina, March 2008 Project financed by the Swiss and Danish governments Intercooperation: Imports & Exports of fresh fruits and vegetables
BRUSSELS, 4 OCTOBER 2012 HANS-CHRISTOPH BEHR, AMI, BONN
 The Demand for fresh Tomatoes in Europe BRUSSELS, 4 OCTOBER 2012 HANS-CHRISTOPH BEHR, AMI, BONN Agenda Fresh Tomato Consumption in different European Countries Development of Tomato Consumption in Germany
IN THE MATTER of the Resource Management Act 1991 ( the Act )
") BEFORE THE BOARD OF INQUIRY IN THE MATTER of the Resource Management Act 1991 ( the Act ) AND IN THE MATTER of a Board of Inquiry appointed under section 149J of the Resource Management Act 1991 to consider
BEFORE THE BOARD OF INQUIRY IN THE MATTER of the Resource Management Act 1991 ( the Act ) AND IN THE MATTER of a Board of Inquiry appointed under section 149J of the Resource Management Act 1991 to consider
Coffee market continues downward trend
 Coffee market continues downward trend Since August 2017, the ICO composite indicator price has declined in each month except January 2018. The composite indicator decreased by 1.1% in March 2018 to an
much better than in As may be seen in Table 1, the futures market prices for the next 12 months
 Dairy Outlook December 2009 By Jim Dunn Professor of Agricultural Economics, Penn State University Market Psychology prices are higher than last month, especially Class IV. The outlook for dairy prices
Dairy Outlook. December By Jim Dunn Professor of Agricultural Economics, Penn State University. Market Psychology
 Dairy Outlook December 2015 By Jim Dunn Professor of Agricultural Economics, Penn State University Market Psychology The Class III market has taken a beating lately as cheese prices have drifted down and
2017 U.S. DISTILLERS GRAINS EXPORTS
 217 U.S. DISTILLERS GRAINS EXPORTS 14, Annual U.S. Distillers Grains Exports 12, 12,695 1, 8, 6, 4, 2, 2,358 4,532 5,651 9,5 7,676 7,421 9,67 11,284 11,314 11,77 U.S. exports of distillers grains (DG)
Coffee prices maintain downward trend as 2015/16 production estimates show slight recovery
 Coffee prices maintain downward trend as 2015/16 production estimates show slight recovery The coffee market fell again in December 2015, reaching its second lowest monthly average of the year. This decrease
Tea Production Mn Kg (2015 & 2016)
") 233 rd Experiments & Extension Forum Keynote Address I Sarath B Abeysinghe Director, Tea Research Institute Tea Production Mn Kg (2015 & 2016) Elevation 2016 2015 Change % Change High 64.40 75.53-11.13-14.73
233 rd Experiments & Extension Forum Keynote Address I Sarath B Abeysinghe Director, Tea Research Institute Tea Production Mn Kg (2015 & 2016) Elevation 2016 2015 Change % Change High 64.40 75.53-11.13-14.73
2018/19 expected to be the second year of surplus
 2018/19 expected to be the second year of surplus Coffee year 2018/19 is expected to be the second consecutive season of surplus, as global output, estimated at 167.47 million bags, exceeds world consumption,
Treating vines after hail: Trial results. Bob Emmett, Research Plant Pathologist
 Treating vines after hail: Trial results Bob Emmett, Research Plant Pathologist Treating vines after hail: Trial results Overview Hail damage recovery pruning trial Background and trial objectives Post-hail
Drought in Northern Mexico by Andrea Munoz-Hernandez
 Drought in Northern Mexico by Andrea Munoz-Hernandez Objective and Tasks The objective of this presentation is to perform a brief overview of the impacts of drought during the late twentieth century and
Coffee Supply Chain Development and Tourism in Timor-Leste
 Coffee Supply Chain Development and Tourism in Timor-Leste David Freedman, Asian Development Bank Country Economist, Timor-Leste. 18 July, 2016, Pacific Update Conference, Suva, Fiji. Today s Presentation
MARKETING TRENDS FOR COCONUT PRODUCTS IN SRI LANKA
 ,'6 b l\o L( cl/\r!y ~?\ 1IJ7'X ~.fsool- CR Cc~~ ~t).> MARKETING TRENDS FOR COCONUT PRODUCTS IN SRI LANKA 1950-1981 By Sunil Chandra ~~nnapperuma B.A. (Ceylon) A dissertation submitted in partial fulfilment
2007 Sonoma Research Associates - All rights reserved.
 2007 Sonoma Research Associates - All rights reserved. Practical Applications of the Price Elasticity of Demand Presented by Dan Karnowsky, President Sonoma Research Associates Presented at Competitive
Tomatoes - Red. Markon First Crop (MFC) Tomatoes are rich in vitamins A, B, and C, beta-carotene, iron, phosphorous, potassium, and fiber.
 Tomatoes are rich in vitamins A, B, and C, beta-carotene, iron, phosphorous, potassium, and fiber.") Tomatoes - Red Markon First Crop (MFC) Tomatoes are rich in vitamins A, B, and C, beta-carotene, iron, phosphorous, potassium, and fiber. Seasonality: Jan Feb Mar Apr May Jun Jul Aug Sep Oct Nov Dec Product
Tomatoes - Red Markon First Crop (MFC) Tomatoes are rich in vitamins A, B, and C, beta-carotene, iron, phosphorous, potassium, and fiber. Seasonality: Jan Feb Mar Apr May Jun Jul Aug Sep Oct Nov Dec Product
Economic Losses from Pollution Closure of Clam Harvesting Areas in Machias Bay
 Economic Losses from Pollution Closure of Clam Harvesting Areas in Machias Bay Kevin Athearn, Ph.D. University of Maine at Machias June 8, 2012 Tora Johnson (UMM) and Brian Beal (UMM) assisted with this
Deficit Irrigation Scheduling for Quality Winegrapes
 Deficit Irrigation Scheduling for Quality Winegrapes Terry Prichard, Water Management Specialist Dept. LAWR, Hydrology UC Davis Improving Fruit Quality Improving Fruit Quality Crop Crop Load Management
IMPACT LEARNING CENTER WEEKLY MENU
 Aug. 15-19 Sept. 26-30 Nov. 7-11 Dec. 19-23 Jan. 30-Feb. 3 Mar. 13-17 Apr. 24-28 June 5-9 Jul. 17-21 Juice, fruit or Veg. Mandarin Strawberries Honey Dew Bananas Cantaloupe Rice Chex Frosted Flakes Nature
Effect of Planting Date and Maturity Group on Soybean Yield in the Texas South Plains in 2001
 Effect of Planting Date and Maturity Group on Soybean Yield in the Texas South Plains in 2001 Calvin Trostle, Extension Agronomy, Lubbock, (806) 746-6101, c-trostle@tamu.edu Brent Bean, Extension Agronomy,
Improving Capacity for Crime Repor3ng: Data Quality and Imputa3on Methods Using State Incident- Based Repor3ng System Data
 Improving Capacity for Crime Repor3ng: Data Quality and Imputa3on Methods Using State Incident- Based Repor3ng System Data July 31, 2014 Justice Research and Statistics Association 720 7th Street, NW,
Overview of the Manganese Industry
 39th Annual Conference Istanbul, Turkey 2013 Overview of the Manganese Industry International Manganese Institute Alberto Saavedra Market Research Manager June, 2013 Introduction Global Production Supply,
IMPOSING WATER DEFICITS TO IMPROVE WINE QUALITY AND REDUCE COSTS
 IMPOSING WATER DEFICITS TO IMPROVE WINE QUALITY AND REDUCE COSTS Terry L. Prichard, Water Management Specialist University of California Davis 420 S. Wilson Way, Stockton, CA 95205 (209) 468-2085; fax
Federal Milk Market Administrator U.S. Department of Agriculture. H. Paul Kyburz, Market Administrator
 Federal Milk Market Administrator U.S. Department of Agriculture UPPER MIDWEST DAIRY NEWS H. Paul Kyburz, Market Administrator Volume 9, Issue 7 Upper Midwest Marketing Area, Federal Order No. 30 July
Field water balance of final landfill covers: The USEPA s Alternative Cover Assessment Program (ACAP)
") Field water balance of final landfill covers: The USEPA s Alternative Cover Assessment Program (ACAP) William H. Albright Desert Research Institute, University of Nevada and Craig H. Benson University
Field water balance of final landfill covers: The USEPA s Alternative Cover Assessment Program (ACAP) William H. Albright Desert Research Institute, University of Nevada and Craig H. Benson University
School Year WEEKLY MENU Head Start & Early Head Start
 School Year 2018-2019 WEEKLY MENU Head Start & Early Head Start NAVAJO HEAD START MENU WEEK #1 ¾ cup 1% milk ½ oz. Granola Bar ½ oz. Boil Egg ½ oz. Mini Cheddar Cheese ½ cup Oranges Aug 6, 2018 Sept
THOMSON REUTERS INDICES CONTINUOUS COMMODITY TOTAL RETURN INDEX
 THOMSON REUTERS INDICES CONTINUOUS COMMODITY TOTAL RETURN INDEX December 2012 1 TABLE OF CONTENTS Index Description 3 Methodology 3 Contract Roll 4 Real-Time Pricing Considerations 4 Constituent Contracts
ARIMNet2 Young Researchers Seminar
 ARIMNet2 Young Researchers Seminar How to better involve end-users throughout the research process to foster innovation-driven research for a sustainable Mediterranean agriculture at the farm and local
Coffee prices rose slightly in January 2019
 Coffee prices rose slightly in January 2019 In January 2019, the ICO composite indicator rose by 0.9% to 101.56 US cents/lb as prices for all group indicators increased. After starting at a low of 99.16
MANGO PERFORMANCE BENCHMARK REPORT
 MANGO PERFORMANCE BENCHMARK REPORT 2015-2016 TABLE OF CONTENTS Page 3 Page 5 Page 12 Page 15 Page 27 Page 36 Page 46 Approach and Data Set Parameters Overview and Mango Trend-Spotting Fruit and Tropical
Recent Trends in Certified Organic Tree Fruit
 Recent Trends in Certified Organic Tree Fruit Washington State 212 Data as of Dec.15, 212 Document date: April 3, 213 Elizabeth Kirby and David Granatstein WSU-Center for Sustaining Agriculture and Natural
Coffee Season 2013/14 Finishes in Balance but Deficit Expected Next Year
 Coffee Season 2013/14 Finishes in Balance but Deficit Expected Next Year Coffee prices were volatile again over the course of September, mostly reacting to weather news from Brazil. Daily prices fell initially
Effect of Planting Date and Maturity Group on Soybean Yield in the Texas High Plains in 2000
 Effect of Planting Date and Maturity Group on Soybean Yield in the Texas High Plains in 2000 Brent Bean (806) 359-5401, b-bean@tamu.edu Calvin Trostle 1 (806) 746-4044, c-trostle@tamu.edu Matt Rowland,
Networkers Business Update. December 2014
 Networkers Business Update December 2014 Agenda Forecast Milk Price Global markets V3 Strategy Growing our share of New Zealand milk Page 2 Forecast Milk Price 110 100 2012/13 2013/14 2014/15 Forecast
Sugar scenario in CIS countries:
 Sugar scenario in CIS countries: on the way to self-sufficiency Andrey Bodin Eurasian Sugar Association Commonwealth of Independent States (CIS) consists of 11 countries CIS Moldova Belarus Population
APPENDIX A SUMMARY OF WELLS HYDRAULICALLY FRACTURED UP TO DECEMBER 2015
 APPENDIX A SUMMARY OF WELLS HYDRAULICALLY FRACTURED UP TO DECEMBER 2015 APPENDIX A SUMMARY OF WELLS HYDRAULICALLY FRACTURED UP TO DECEMBER 2015 Appendix A. Summary of wells hydraulically fractured up to
July marks another month of continuous low prices
 July marks another month of continuous low prices In July 2018, the ICO composite indicator price decreased by 2.9% to an average of 107.20 US cents/lb, which is the lowest monthly average for July since
Bell peppers (Capsicum annuum L.) grown under diffuse glass. Christien Sauviller Research Centre Hoogstraten Meerle, Belgium
 grown under diffuse glass. Christien Sauviller Research Centre Hoogstraten Meerle, Belgium") Bell peppers (Capsicum annuum L.) grown under diffuse glass Christien Sauviller Research Centre Hoogstraten Meerle, Belgium Pepper production in Belgium Bell pepper: red, green, yellow, orange Heated greenhouse
Bell peppers (Capsicum annuum L.) grown under diffuse glass Christien Sauviller Research Centre Hoogstraten Meerle, Belgium Pepper production in Belgium Bell pepper: red, green, yellow, orange Heated greenhouse
Introduction. Introduction. Introduction. Cistus. Cistus Pyrophytic ecology. Cistus 07/03/2014
 Predictive empirical models for mushroom production in ladanifer stands. Guzman y Vargas (Molecular Phylogenetics and Evolution Volume 37, Issue 3 644-6 Fig. Distribution map and number of species. Pie
Ukrainian Market for Fruits and Vegetables. Oksana Varodi International Finance Corporation Berlin, Fruit Logistica 2011
 Ukrainian Market for Fruits and Vegetables Oksana Varodi International Finance Corporation Berlin, Fruit Logistica 2011 Content of the Presentation Production Trade Current challenges and opportunities
WFP MONTHLY MARKET UPDATE
 WFP MONTHLY MARKET UPDATE SUDAN, MAY 218 Highlights The national average retail price of sorghum significantly increased by 9.7 percent, in WFP areas, compared to the previous month. The retail prices
Washington State Wine 101
 Washington State Wine 101 Washington 2 nd Largest Producer in US Washington State produces: Premium wines of superior quality Range of varieties Distinctive character Unique balance of Old World and New
Commitment of. Traders. Managed Money. Fund Positions
 October 5, 2018 Market Summary The USDA will issue its October Supply and Demand report this next Thursday and will incorporate updated ending stocks data from last weeks report. Additionally, they will
UPPER MIDWEST DAIRY NEWS
 Federal Milk Market Administrator U.S. Department of Agriculture UPPER MIDWEST DAIRY NEWS Victor J. Halverson, Market Administrator Volume 19, Issue 10 Upper Midwest Marketing Area, Federal Order No. 30
CHAPTER 9 THE DRY BEAN SUPPLY CHAIN
 Part 4 CHAPTER 9 THE DRY BEAN SUPPLY CHAIN 9.1 Introduction The market for dry beans in South Africa is a relatively small market; nevertheless, it plays an important role. The production and marketing
Soft Commodity Markets - Upcoming Milestones, and How the Market Could Be Affected
 Soft Commodity Markets - Upcoming Milestones, and How the Market Could Be Affected September 15, 2014 Judith Ganes President J. Ganes Consulting, LLC Weather & Politics Current Weather Expectations El
Drosophila suzukii: Local infestation patterns and monitoring around Wädenswil. Stefan Kuske
 Eidgenössisches Departement für Wirtschaft, Bildung und Forschung WBF Agroscope Drosophila suzukii: Local infestation patterns and monitoring around Wädenswil Stefan Kuske COST FA 1104, WG 3 Meeting, Wädenswil
1. Continuing the development and validation of mobile sensors. 3. Identifying and establishing variable rate management field trials
 Project Overview The overall goal of this project is to deliver the tools, techniques, and information for spatial data driven variable rate management in commercial vineyards. Identified 2016 Needs: 1.
ANALYSIS OF THE EVOLUTION AND DISTRIBUTION OF MAIZE CULTIVATED AREA AND PRODUCTION IN ROMANIA
 ANALYSIS OF THE EVOLUTION AND DISTRIBUTION OF MAIZE CULTIVATED AREA AND PRODUCTION IN ROMANIA Agatha POPESCU University of Agricultural Sciences and Veterinary Medicine, Bucharest, 59 Marasti, District
WORLD SPICE CONGRESS 2010 Black & White Pepper Crop Report. Harris Freeman & Co.
 WORLD SPICE CONGRESS 2010 Black & White Pepper Crop Report Harris Freeman & Co. 1 The Past BLACK & WHITE PEPPER CROP REPORT A 5-Year PERSPECTIVE 5 year Supply & Demand statistics Factors Affecting Supply
Hass Seasonality. Avocado Postharvest Handling. Avocado Postharvest Handling. Mary Lu Arpaia University of California, Riverside
 Avocado Postharvest Handling Avocado Postharvest Handling Mary Lu Arpaia University of California, Riverside Major California Avocado Cultivars Bacon Fuerte Gwen Hass Lamb Hass Pinkerton Reed Zutano Hass
Pet Products Mintel Global New Products Database. American Pet Nutrition USA USA USA USA Nov 2018 Nov 2018 Oct 2018 Oct 2018.
 Pet Products 2018 Sunshine Mills American Pet Nov 2018 Nov 2018 Oct 2018 Oct 2018 Grain Free Turkey, Garbanzo Bean & Pea Recipe Super Premium Dog Whitefish Meal and Salmon Meal Recipe Grain Free Adult
Opportunities for strawberry production using new U.C. day-neutral cultivars
 Opportunities for strawberry production using new U.C. day-neutral cultivars Kirk Larson Pomologist and CE Specialist Dept. of Plant Sciences, UC Davis Professor Douglas Shaw Quantitative Geneticist UC
Export Essentials Pulse Trade Data
 Export Essentials Pulse Trade Data North America and Australia Q1 2013 Introduction There are many ways of telling stories. Words and pictures are the most common and easiest to understand. Our Export
Agricultural scenario JRODOS calculations
 Agricultural scenario JRODOS calculations C. Turcanu G. Olyslaegers Belgian Nuclear Research Centre SCK CEN Institute for Environment, Health and Safety catrinel.turcanu@sckcen.be 1 EMRAS II WG8 Meeting