Traffic and Transportation Technical Report
|
|
|
- Godfrey Washington
- 5 years ago
- Views:
Transcription


1 raffic and ransportation echnical eport Prepared in Support of the Supplemental Environmental Impact Statement VDO Virginia Department of ransportation U.S. Department of ransportation Federal Highway Administration April 2017

2 raffic and ransportation echnical eport Prepared in support of the Supplemental Environmental Impact Statement VDO Project #: , P101 UPC#: April 2017
3 raffic and ransportation echnical eport able of Contents 1. Introduction Project Description Purpose and Need Alternatives he No-Build Alternative Alternative A Alternative B Alternative C Alternative D Operationally Independent Sections Methodology Data Collection Development of Balanced Existing raffic Volumes Peak Hour Volumes Daily Volumes Capacity Analyses Forecasting Process Hampton oads ransportation Planning Organization ravel Demand Model Post-Processing oll and Managed ane Forecasts Existing Conditions imited Access Highways Connecting State outes and ocals oads Major Bridges and unnels ransit outes and Facilities Metro Area Express (MAX) outes ocal Bus outes Port Facilities Freight ailroad Network Intercity Passenger ail Service (Amtrak) Airports Emergency Evacuation outes Bicycle and Pedestrian Network Existing raffic Volumes Crash Analysis Eastbound I-64 Crash Analysis Westbound I-64 Crash Analysis Eastbound I-664 Crash Analysis Westbound I-664 Crash Analysis Eastbound I-564 Crash Analysis Westbound I-564 Crash Analysis Eastbound VA 164 Crash Analysis Westbound VA 164 Crash Analysis Assessment of Vehicle Speeds Capacity Analysis Alternatives Considered Design Year 2040 Forecasts and Analyses Summary Key Study Area Segment Impacts HB I MMMB I-664 Bowers Hill Distribution of Naval Station Norfolk rips No-Build Alternative Operational Analysis ravel ime Alternative A Operational Analysis ravel ime Alternative B Operational Analysis ravel ime Alternative C Operational Analysis ravel ime Alternative D April 2017 i
4 raffic and ransportation echnical eport Operational Analysis ravel ime Opening Year 2028 Forecasts and Analyses Summary Implications of Implementing olls and/or HO anes ravel Demand Model Modifications Fixed olls Preliminary esults (Scenario 1) HO ane Preliminary esults (Scenario 2) Updated Year 2040 Forecasts and Analyses Summary Key Study Area Segment Impacts HB I MMMB I-664 Bowers Hill Updated 2040 No-Build Alternative Operational Analysis ravel ime Preferred Alternative Operational Analysis ravel ime eferences Appendices A No-Build raffic Volumes and Analyses B Alternative A raffic Volumes and Analyses C Alternative B raffic Volumes and Analyses D Alternative C raffic Volumes and Analyses E Alternative D raffic Volumes and Analyses F No-Build raffic Volumes and Analyses G Alternative A raffic Volumes and Analyses H Alternative B raffic Volumes and Analyses I Alternative C raffic Volumes and Analyses J Alternative D raffic Volumes and Analyses K. ravel Demand Model Output for Forecast Segments. Navy and Port Facility rip Information M. rip Origin Information By Alternative (From HPO) N Updated No-Build raffic Volumes and Analyses O Preferred Alternative raffic Volumes and Analyses P. Photo Documentation April 2017 ii
5 raffic and ransportation echnical eport ist of ables able 1-1: Alternative A ane Configurations... 2 able 1-2: Alternative B ane Configurations... 4 able 1-3: Alternative C ane Configurations... 4 able 1-4: Alternative D ane Configurations... 4 able 2-1: Mainline and amp Count ocations... 5 able 2-2: Intersection urning Movement Count ocations... 7 able 2-3: Study Area Peak Hours... 8 able 3-1: imited Access Highways...41 able 3-2: Connecting State outes and ocals oads...41 able 3-3: Metro Area Express (MAX) outes...42 able 3-4: Existing Commercial Port Facilities...44 able 3-5: Freight ailroad Network...45 able 3-6: Amtrak outes...45 able 3-7: Commercial and General Aviation Airports...46 able 3-8: Emergency Evacuation outes...47 able 5-1: 2040 Daily raffic Volumes at Key oadway Segments...77 able 5-2: 2040 Projected OS at Key oadway Segments...78 able 5-3: 2040 Estimated End-to-End ravel imes by Study Area Corridor...78 able 5-4: 2040 Intersection Capacity Analyses esults...97 able 5-5: I-64 HB PM Peak ravel ime Comparison able 5-6: I-564 AM Peak ravel ime Comparison able 5-7: I-664 MMMB PM Peak ravel ime Comparison able 5-8: I-664 Bowers Hill PM Peak ravel ime Comparison able 5-9: Distribution of Naval Station Norfolk rips able 5-10: 2040 No-Build OS at Key oadway Segments able 5-11: 2040 No-Build Estimated End-to-End ravel ime by Study Area Corridor able 5-12: 2040 Alternative A Projected OS at Key oadway Segments able 5-13: 2040 Alternative A Estimated End-to-End ravel ime by Study Area Corridor able 5-14: 2040 Alternative B Projected OS at Key oadway Segments able 5-15: 2040 Alternative B Estimated End-to-End ravel ime by Study Area Corridor able 5-16: 2040 Alternative C Projected OS at Key oadway Segments able 5-17: 2040 Alternative C Estimated End-to-End ravel ime by Study Area Corridor able 5-18: 2040 Alternative D Projected OS at Key oadway Segments able 5-19: 2040 Alternative D Estimated End-to-End ravel ime by Study Area Corridor able 6-1: 2028 Daily raffic Volumes at Key oadway Segments able 6-2: 2028 Intersection Capacity Analysis esults able 7-1: Alternative A HO ravel Demand Model ane Configurations able 7-2: Alternative B HO ravel Demand Model ane Configurations able 7-3: Alternative C HO ravel Demand Model ane Configurations able 7-4: Alternative D HO ravel Demand Model ane Configurations able 7-5: Modeled HO oll ates (in dollars per mile) able 7-6: oll Scenario 1 Output able 7-7: oll Scenario 2 Output able 8-1: 2040 Daily raffic Volumes at Key oadway Segments able 8-2: 2040 Projected OS at Key oadway Segments able 8-3: 2040 Estimated End-to-End ravel imes by Study Area Corridor able 8-4: 2040 Intersection Capacity Analyses esults able 8-5: I-64 HB PM Peak ravel ime Comparison between I-664 and I able 8-6: I-564 AM Peak ravel ime Comparison - between I-64 and the Proposed NI/Navy Interchange able 8-7: I-664 MMMB PM Peak ravel ime Comparison - between I-64 and College Drive able 8-8: I-664 Bowers Hill PM Peak ravel ime Comparison - between VA 164 and I able 8-9: 2040 No-Build (Updated) OS at Key oadway Segments able 8-10: 2040 No-Build (Updated) Estimated End-to-End ravel ime by Study Area Corridor able 8-11: 2040 Preferred Alternative Projected OS at Key oadway Segments able 8-12: 2040 Preferred Alternative Estimated End-to-End ravel ime by Study Area Corridor ist of Figures Figure 1-1: HCS Study Area Corridors... 2 Figure 1-2: Build Alternatives... 3 Figure 1-3: oadway Alignments... 3 Figure 2-1: 2015 Existing Peak Hour Volumes... 9 Figure 2-2: 2015 Existing Weekday Daily Volumes Figure 3-1: H MAX outes Figure 3-2: Port Facilities and Freight ail Network Figure 3-3: Amtrak outes and Airports Figure 3-4: Emergency Evacuation outes Figure 3-5: I-64 Eastbound Crash Summary Figure 3-6: I-64 Westbound Crash Summary Figure 3-7: I-664 Eastbound Crash Summary Figure 3-8: I-664 Westbound Crash Summary Figure 3-9: I-564 Eastbound Crash Summary Figure 3-10: I-564 Westbound Crash Summary Figure 3-11: VA 164 Eastbound Crash Summary Figure 3-12: VA 164 Westbound Crash Summary Figure 3-13: I-64 Speed Profiles, 2011 and Figure 3-14: I-664 Speed Profiles, 2011 and Figure 3-15: 2015 Existing Capacity Analysis esults Figure 5-1: 2040 Projected Daily raffic Volumes at the HB and MMMB Figure 5-2: 2040 Peak Hour Mainline Volumes Summary Figure 5-3: 2040 Peak Hour Mainline Capacity Analyses esults Figure 5-4: 2040 Peak Hour Mainline Average ravel Speeds Figure 5-5: Forecast Segments Figure 5-6: I-64 HB PM Peak raffic ravel ime Comparison Figure 5-7: I-64 HB 2034 PM Peak Hour ravel ime for No-Build Conditions Figure 5-8: 2034 PM Peak Hour ravel ime Savings along I-64 HB compared to No-Build Conditions Figure 5-9: I-564 AM Peak raffic ravel ime Comparison Figure 5-10: I AM Peak Hour ravel ime for No-Build Conditions Figure 5-11: 2034 AM Peak Hour ravel ime Savings along I-564 compared to No-Build Conditions April 2017 iii
6 raffic and ransportation echnical eport Figure 5-12: I-664 MMMB PM Peak raffic ravel ime Comparison Figure 5-13: I-664 MMMB 2034 PM Peak Hour ravel ime for No-Build Conditions Figure 5-14: 2034 PM Peak Hour ravel ime Savings along I-664 MMMB compared to No-Build Conditions Figure 5-15: I-664 Bowers Hill PM Peak raffic ravel ime Comparison Figure 5-16: I-664 Bowers Hill 2034 PM Peak Hour ravel ime by Direction (No-Build) Figure 5-17: 2034 PM Peak Hour ravel ime Savings along I-664 Bowers Hill Compared to No-Build Conditions Figure 6-1: 2028 Projected Daily raffic Volumes at the HB and MMMB Figure 6-2: 2028 Peak Hour Mainline Volumes Summary Figure 6-3: 2028 Peak Hour Mainline Capacity Analyses esults Figure 6-4: 2028 Peak Hour Mainline Average ravel Speeds Figure 8-1: 2040 Projected Daily raffic Volumes at the HB and MMMB Figure 8-2: 2040 Peak Hour Mainline Volumes Summary Figure 8-3: 2040 Peak Hour Mainline Capacity Analyses esults Figure 8-4: 2040 Peak Hour Mainline Average ravel Speeds Figure 8-5: I-64 HB PM Peak raffic ravel ime Comparison (Preferred Alternative) Figure 8-6: I-64 HB 2040 PM Peak Hour ravel ime for No-Build Conditions Figure 8-7: 2040 PM Peak Hour ravel ime Savings along I-64 HB Compared to No-Build Conditions Figure 8-8: I-564 AM Peak raffic ravel ime Comparison Figure 8-9: I AM Peak Hour ravel ime for No-Build Conditions Figure 8-10: I-664 MMMB PM Peak raffic ravel ime Comparison Figure 8-11: I-664 MMMB 2040 PM Peak Hour ravel ime for No-Build Conditions Figure 8-12: 2040 PM Peak Hour ravel ime Savings along I-664 MMMB Compared to No-Build Conditions Figure 8-13: I-664 Bowers Hill PM Peak raffic ravel ime Comparison Figure 8-14: I-664 Bowers Hill 2040 PM Peak Hour ravel ime for No Build Conditions Figure 8-15: 2040 PM Peak Hour ravel ime Savings along I-664 Bowers Hill Compared to No-Build Conditions April 2017 iv
7 raffic and ransportation echnical eport 1. INODUCION 1.1 POJEC DESCIPION he Virginia Department of ransportation (VDO), in cooperation with the Federal Highway Administration (FHWA) as the lead federal agency, is preparing a Supplemental Environmental Impact Statement (SEIS) for the Hampton oads Crossing Study (HCS). he Study is located in the cities of Chesapeake, Hampton, Newport News, Norfolk, Portsmouth, and Suffolk, Virginia. he SEIS re-evaluates the findings of the 2001 HCS Final Environmental Impact Statement (FEIS) and ecord of Decision (OD). he three alternatives retained for analysis in the 2001 FEIS, as well as input received from the public during initial scoping for the SEIS, were used to establish the Study Area Corridors shown in Figure 1-1. he purpose and need of the SEIS is summarized below. Improve transit access the lack of transit access across the Hampton oads waterway; Increase regional accessibility limited number of water crossings and inadequate highway capacity and severe congestion decrease accessibility; Address geometric deficiencies insufficient vertical and horizontal clearance at the HB contribute to congestion; Enhance emergency evacuation capability increase capacity for emergency evacuation, particularly at the HB; Improve strategic military connectivity congestion impedes military movement missions; and, Increase access to port facilities inadequate access to interstate highway travel in the Study Area Corridors impacts regional commerce. Pursuant to the National Environmental Policy Act (NEPA) of 1969, as amended, FHWA is preparing an SEIS because of the time that has lapsed since the 2001 FEIS and new information indicating significant environmental impacts not previously considered. he SEIS, prepared in accordance with the implementing regulations of NEPA (23 CF ), is intended to aid in ensuring sound decision-making moving forward by providing a comparative understanding of the potential effects of the various options. he purpose of this HCS raffic and ransportation echnical eport is to document the data collection, traffic forecasting, and analysis efforts performed to assess potential operational improvements for the Study Area Corridors. Information in this report, described below, will support discussions presented in the SEIS: Section 1 provides an overview of the study. Section 2 outlines the methods used to assess traffic operations. Section 3 describes existing conditions including an inventory of multimodal transportation infrastructure, as well as peak hour and daily traffic volumes, crash trends, vehicle speeds, and traffic operations along the Study Area Corridors. Sections 4 provides an overview of alternatives considered for the study. Section 5 outlines potential impacts to traffic operations in the design year (2040) associated with each of the alternatives retained for analysis in the SEIS. Section 6 outlines potential impacts to traffic operations in the opening year (2028) associated with each of the alternatives retained for analysis in the SEIS. Section 7 describes the potential toll diversion impacts of tolls and/or HO lanes implemented in conjunction with each of the alternatives retained for analysis in the SEIS. Section 8 presents an updated analysis of the potential impacts to traffic operations in the design year (2040) associated with the No Build and Preferred Alternatives, based on the updated HPO travel demand model, which was released after the publication of the DSEIS Purpose and Need he purpose of the HCS SEIS is to relieve congestion at the I-64 Hampton oads Bridge-unnel (HB) in a manner that improves accessibility, transit, emergency evacuation, and military and goods movement along the primary transportation corridors in the Hampton oads region, including the I-64, I-664, I-564, and VA 164 corridors. he HCS will address the following needs (in the order of presentation in Chapter 1 of the Draft SEIS): Accommodate travel demand capacity is inadequate on the Study Area Corridors, contributing to congestion at the HB; April

 for each alternative.")

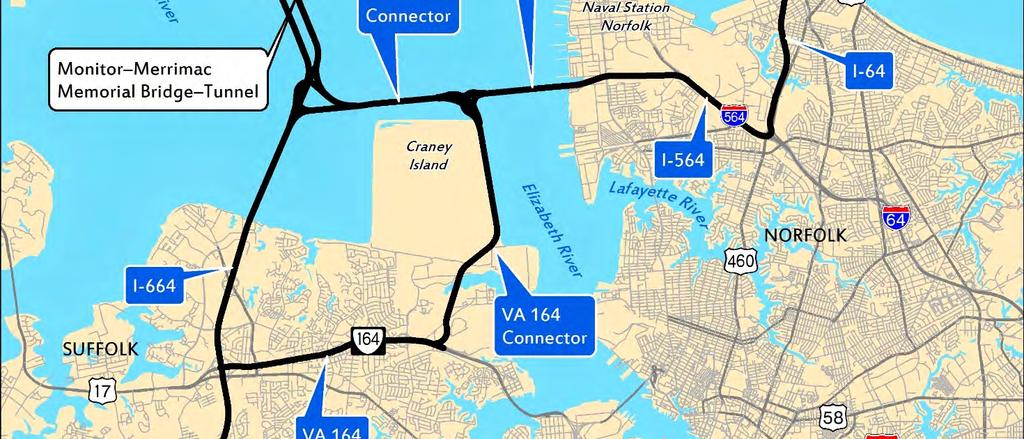
8 raffic and ransportation echnical eport Figure 1-1: HCS Study Area Corridors Alternatives Five alternatives, including the No-Build Alternative, are under consideration for the Draft SEIS and are assessed in this echnical eport. he proposed limits of the four Build Alternatives are shown on Figure 1-2. Each echnical eport and Memorandum prepared in support of the Draft SEIS assesses existing conditions and environmental impacts along the Study Area Corridors (Figure 1-1) for each alternative. Each alternative is comprised of various roadway alignments, used to describe the alternatives and proposed improvements, shown on Figure he No-Build Alternative his alternative includes continued routine maintenance and repairs of existing transportation infrastructure within the Study Area Corridors, but there would be no major improvements Alternative A Alternative A begins at the I-64/I-664 interchange in Hampton and creates a consistent six-lane facility by widening I- 64 to the I-564 interchange in Norfolk. A parallel bridge-tunnel would be constructed west of the existing I-64 HB. During the public review of the HB DEIS, there was a clear lack of public or political support for the level of impacts associated with any of the build alternatives. Specifically, potential impacts to the historic district at Hampton University, Hampton National Cemetery, and the high number of displacements were key issues identified by the public, elected officials, and University and Veterans Affairs officials. Given this public opposition, a Preferred Alternative was not identified and the study did not advance. On August 20, 2015, FHWA rescinded its Notice of Intent to prepare the HB DEIS, citing public and agency comments and concerns over the magnitude of potential environmental impacts to a variety of resources, such as impacts to historic resources as well as communities and neighborhoods. Consequently, VDO and FHWA have committed that improvements proposed in the HCS SEIS to the I-64 corridor would be largely confined to existing right-of-way. o meet this commitment, Alternative A considers a six-lane facility. Alternative A lane configurations are summarized in able 1-1. able 1-1: Alternative A ane Configurations oadway Alignments Existing anes Proposed anes I-64 (Hampton) I-64 (HB and Norfolk) Alternative B Alternative B includes all of the improvements included under Alternative A, and the existing I-564 corridor that extends from its intersection with I-64 west towards the Elizabeth iver. I-564 would be extended to connect to a new bridge-tunnel across the Elizabeth iver (I-564 Connector). A new roadway (VA 164 Connector) would extend south from the I-564 Connector, along the east side of the Craney Island Dredged Material Management Area (CIDMMA), and connect to existing VA 164. VA 164 would be widened from this intersection west to I-664. Alternative B lane configurations are summarized in able 1-2. April


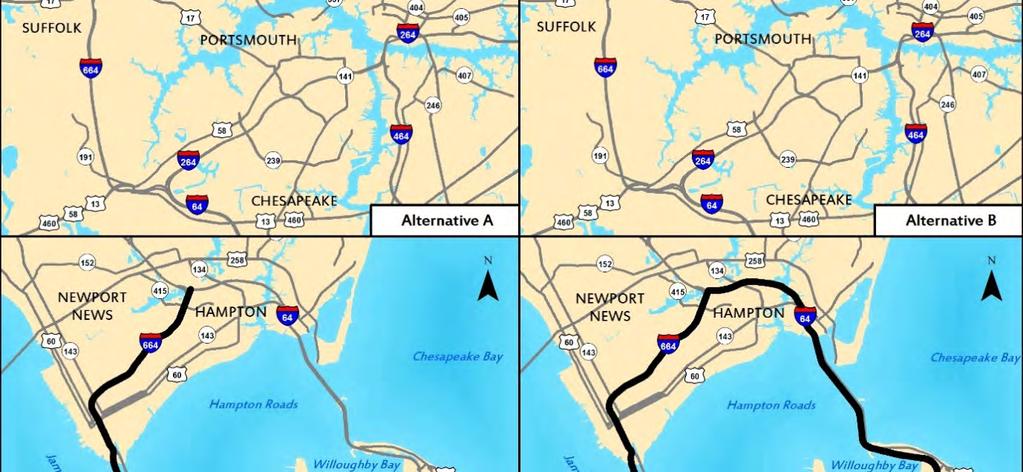

9 raffic and ransportation echnical eport Figure 1-2: Build Alternatives Figure 1-3: oadway Alignments April
10 raffic and ransportation echnical eport able 1-2: Alternative B ane Configurations oadway Alignments Existing anes Proposed anes I-64 (Hampton) I-64 (HB and Norfolk) 4 6 I I-564 Connector none 4 VA 164 Connector none 4 VA Note: he I-564 Intermodal Connector (IC) project is a separate project from HCS that lies between the I-564 Connector and I-564. It would be constructed regardless of whether the HCS improvements are made and therefore is included under the No-Build Alternative and is not listed with other proposed improvements Alternative C Alternative C includes the same improvements along I-564, the I-564 Connector, and the VA 164 Connector that are considered in Alternative B. his alternative would not propose improvements to I-64 or VA 164 beyond the VA 164 Connector. Alternative C includes dedicated transit facilities in specific locations. DP completed a study in November 2015 that recommended high frequency bus rapid transit (B) service in a fixed guideway or in a shared high occupancy vehicle (HOV) or high occupancy toll (HO) lanes (DP, 2015). Based on that recommendation, for the purposes of this Draft SEIS, transit assumes Bus apid ransit (B). In the Final SEIS, transit could be redefined or these lanes may be used as managed lanes. Alternative C converts one existing HOV lane in each direction on I- 564 in Norfolk to transit only. he I-564 Connector and the I-664 Connector would be constructed with transit only lanes. his alternative also includes widening along I-664 beginning at I-664/I-64 in Hampton and continuing south to the I-264 interchange in Chesapeake. One new transit lane is included along I-664 between I-664/I-64 in Hampton and the new interchange with the I-664 Connector. Alternative C lane configurations are summarized in able 1-3. able 1-3: Alternative C ane Configurations oadway Alignments Existing anes Proposed anes I-664 (from I-64 to the proposed I-664 Connector) ransit Only I-664 (from the proposed I-664 Connector to VA 164) 4 8 I-664 (from VA 164 to I-264) 4 6 I ransit Only I-564 Connector none ransit Only VA 164 Connector none 4 I-664 Connector none ransit Only Note: he I-564 IC project is a separate project from HCS that lies between the I-564 Connector and I-564. It would be constructed regardless of whether the HCS improvements are made and therefore is included under the No-Build Alternative and is not listed with other proposed improvements. able 1-4: Alternative D ane Configurations oadway Alignments Existing anes Proposed anes I-64 (Hampton) I-64 (HB and Norfolk) 4 6 I-664 (from I-64 to VA 164) I-664 (from VA 164 to I-264) 4 6 I-664 Connector None 4 I I-564 Connector none 4 VA 164 Connector none 4 VA Note: he I-564 IC project is a separate project from HCS that lies between the I-564 Connector and I-564. It would be constructed regardless of whether the HCS improvements are made and therefore is included under the No-Build Alternative and is not listed with other proposed improvements Operationally Independent Sections Given the magnitude and scope of the alternatives, it is expected that a Preferred Alternative would be constructed in stages or operationally independent sections (OIS). An OIS is a portion of an alternative that could be built and function as a viable transportation facility even if other portions of the alternative are not advanced. he OIS are comprised of various roadway alignments and were developed by identifying sections of roadway improvements that if constructed, could function independently. For traffic forecasting and analysis purposes, however, each alternative was considered in its entirety. raffic pattern and volume changes that occur when capacity is added in one location of the network affect volumes elsewhere, and it would not be possible to isolate traffic impacts to the OIS alone. he relevant operational impacts will be presented in this technical report for each alternative Alternative D Alternative D is a combination of the sections that comprise Alternatives B and C. Alternative D lane configurations are summarized in able 1-4. April
11 raffic and ransportation echnical eport 2. MEHODOOGY he traffic analysis study area extends along the mainline roadway segments, and includes interchange ramps and signalized and unsignalized intersections within the interchanges at ramp termini for all Study Area Corridors. ravel forecasting and analysis efforts undertaken to support the SEIS process include data collection, development of balanced peak hour and daily volume forecasts, and capacity analyses for the peak hour, as described in the following subsections. he traffic study was initiated in June he study relied on traffic data collected in the spring and fall of 2015, as well as the 2034 Hampton oads ong ange ransportation Plan (P) and the 2034 Hampton oads travel demand model. Both 2034 travel demand model and 2034 P were the latest adopted regional planning tools and documents at the time of the study initiation. Outputs of the 2034 travel demand model were grown to 2040 values as described in Section 2.4. Analyses for the Preferred Alternative will be updated using the adopted 2040 travel demand model if it becomes available in time for use in the Final SEIS. 2.1 DAA COECION An extensive data collection effort was undertaken in June, September, and October 2015 to establish baseline traffic conditions for the study area. Automatic ramp counts and manual intersection turning movement counts were conducted, and data from VDO s permanent count stations were reviewed for the Study Area Corridors. amp and mainline vehicle classification counts were conducted for a minimum of 48 consecutive hours on nonholiday uesdays, Wednesdays, and hursdays, during typical school and non-holiday periods. amp and mainline counts were performed using tube and video count equipment. All turning movement counts were conducted on a typical, non-holiday uesday, Wednesday, or hursday when schools were in session, from 6:00 AM 10:00 AM and from 3:00 PM 7:00 PM. urning movement counts were performed manually and using video count equipment. amp and mainline vehicle classification counts were conducted around key study area interchanges (I-64 and I-664; I-64 and I-564; I-664 and VA 164; and I-664 and I-264) between June 2 and June 18, All other counts were conducted between September 22 and October 22, 2015, with the exception of supplemental vehicle classification counts on Hampton Boulevard in Norfolk that were conducted January 20 and January 21, able 2-1 provides the locations of the mainline and ramp vehicle classification counts conducted for the study. able 2-2 provides the locations of the intersection turning movement counts. able 2-1: Mainline and amp Count ocations Exit Mainline/amp Movement From o I-64 Interchanges 264 I-664 WB I-64 EB 264 I-664 WB I-64 WB 264 I-64 EB I-664 EB 264 I-64 WB I-664 EB Mainline I-64 EB Exit 264 Mainline I-64 WB Exit I-64 EB asalle Ave SB 265 asalle Ave SB I-64 EB 265 Armistead Ave I-64 WB 265 I-64 WB Armistead Ave/aSalle Ave SB Exit Mainline/amp Movement From o 265 asalle Ave NB I-64 EB 265 I-64 WB Armistead Ave NB 265 I-64 EB ip ap d 267 I-64 EB Settlers anding d 267 Settlers anding d I-64 EB 267 Settlers anding d I-64 WB 267 I-64 WB Settlers anding d 268 I-64 EB Mallory St 268 Mallory St I-64 EB 268 Mallory St I-64 WB 268 I-64 WB Mallory St 273 I-64 WB 4th View St 273 4th View St I-64 WB 273 I-64 EB 4th View St 273 4th View St I-64 EB 274 I-64 WB Bay Ave WB 274 Bay Ave EB I-64 EB 276 US 460/Granby St I-64 WB 276 Patrol d I-64 EB 276 I-64 EB I-564 WB 276 I-64 EB US 460 SB 276 US 460 NB I-564 WB 276 I-564 EB I-64 WB 276 I-64 WB I-564 WB 276 I-564 EB I-64 EB 276 I-564 EB ittle Creek d Mainline I-64 HOV Exit I-64 WB US 460 NB N/A erminal Blvd US 460 N/A I-564 EB I-64/US 460 WB N/A erminal Blvd I-564/US 460 EB Mainline I-64 WB Exit 276 Mainline I-64 EB Exit 276 N/A erminal Blvd I-564 EB N/A I-564 WB erminal Blvd N/A I-564 WB Bainbridge Ave N/A Bainbridge Ave I-564 WB N/A I-564 EB Bainbridge Ave N/A Bainbridge Ave I-564 EB I-664 Interchanges 2 I-664 WB Powhatan Pkwy 2 Powhatan Pkwy I-664 EB 2 Powhatan Pkwy I-664 WB 2 I-664 EB Powhatan Pkwy 3 I-664 WB Aberdeen d April
12 raffic and ransportation echnical eport Exit Mainline/amp Movement From o 3 Aberdeen d I-664 EB 3 Aberdeen d I-664 WB 3 I-664 EB Aberdeen d 4 oanoke Ave I-664 EB 4 I-664 WB oanoke Ave 4 I-664 EB Chestnut Ave 4 Chestnut Ave I-664 WB 5 Huntington Ave and 34th St I-664 EB 5 I-664 EB Warwick Blvd NB 5 Jefferson Ave SB I-664 EB 5 I-664 WB 35th St 5 Huntington Ave and 34th St Jefferson Ave 5 I-664 WB Jefferson Ave 5 Huntington Ave and 34th St I-664 WB 5 Jefferson Ave SB Huntington Ave and Warwick Blvd 5 I-664 EB Huntington Ave and Warwick Blvd 6 23rd St/MK Jr. Way EB I-664 EB 6 26th St/US 60 WB I-664 EB 6 I-664 WB 25th St EB 6 26th St/US 60 WB Huntington Ave and 26th St WB 6 I-664 EB Huntington Ave and 26th St WB 6 I-664 EB 27th St EB 6 23rd St/MK Jr. Way EB I-664 WB 6 I-664 WB Huntington Ave and 26th St WB 6 26th St/US 60 WB I-664 WB 6 28th St EB Jefferson Ave and 27th St 7 erminal Ave I-664 EB 7 I-664 EB erminal Ave 7 I-664 WB erminal Ave 7 erminal Ave I-664 WB 8 College Dr SB I-664 EB 8 I-664 EB College Dr SB 8 College Dr SB I-664 WB 8 I-664 WB College Dr SB 8 College Dr NB I-664 EB 8 I-664 EB College Dr NB 8 College Dr NB I-664 WB 8 I-664 WB College Dr NB 9 I-664 EB US 17/Bridge d WB 9 VA164 WB I-664 EB 9 VA164 WB I-664 WB 9 I-664 WB VA164 WB 9 US 17/Bridge d VA164 EB 9 I-664 EB VA164 EB 9 VA164 EB I-664 WB Exit Mainline/amp Movement From o 9 US 17/Bridge d WB I-664 EB 9 US 17/Bridge d I-664 EB 9 I-664 WB VA164 EB 9 I-664 WB US 17/Bridge d EB Mainline College Dr SB South of I-664 Mainline College Dr NB South of I I-664 EB Pughsville d 10 I-664 EB Pughsville d WB 10 Pughsville d WB I-664 EB 10 Pughsville d EB I-664 EB Mainline Pughsville d WB West of I-664 Mainline Pughsville d EB West of I Pughsville d WB I-664 WB 10 Pughsville d EB I-664 WB 10 I-664 WB Pughsville d EB 10 I-664 WB Pughsville d 11 I-664 EB Portsmouth Blvd WB 11 Portsmouth Blvd WB I-664 EB 11 I-664 EB Portsmouth Blvd EB 11 Portsmouth Blvd EB I-664 EB 11 Portsmouth Blvd WB I-664 WB 11 I-664 WB Portsmouth Blvd WB 11 Portsmouth Blvd EB I-664 WB 11 I-664 WB Portsmouth Blvd EB Mainline Portsmouth Blvd WB East of I-664 Mainline Portsmouth Blvd EB East of I I-664 EB Dock anding d 12 I-664 EB Dock anding d WB 12 Dock anding d WB I-664 EB 12 Dock anding d I-664 EB 12 Dock anding d I-664 WB 12 Dock anding d EB I-664 WB 12 I-664 WB Dock anding d EB 12 I-664 WB Dock anding d Mainline Dock anding d WB East of I-664 Mainline Dock anding d EB East of I I-664 EB US 58/Military Hwy WB 13 US 58/Military Hwy WB I-664 EB 13 I-664 EB US 58/Military Hwy EB 13 US 58/Military Hwy EB I-664 EB 13 US 58/Military Hwy WB I-664 WB 13 US 58/Military Hwy EB I-664 WB 13 I-664 WB US 58/Military Hwy WB 13 I-664 WB US 58/Military Hwy EB 14 I-664 EB US 460/Military Hwy/Schaefer Ave April
13 raffic and ransportation echnical eport Exit Mainline/amp Movement From o 14 I-664 EB I-64 EB 14 I-664 WB I-64 EB 14 I-64 WB I-664 WB 14 I-64 WB I-664 EB VA 164 Interchanges N/A VA 164 WB College Dr NB N/A VA 164 WB College Dr N/A College Dr VA 164 EB N/A owne Point d VA 164 WB N/A VA 164 EB owne Point d N/A VA 164 WB owne Point d N/A owne Point d VA 164 EB N/A Cedar n VA 164 WB N/A VA 164 EB Cedar n N/A VA 164 WB Cedar n SB N/A Cedar n SB VA 164 EB N/A Cedar n NB VA 164 EB N/A Virginia International Gateway Blvd VA 164 WB N/A VA 164 EB Virginia International Gateway Blvd N/A VA 164 WB Virginia International Gateway Blvd N/A Virginia International Gateway Blvd VA 164 EB N/A Norfolk d VA 164 EB N/A VA 164 EB Norfolk d N/A Norfolk d VA 164 WB N/A VA 164 WB Norfolk d N/A ee Ave and Harper Ave VA 164 EB N/A VA 164 WB ailroad Ave N/A MK Fwy unnel VA 164 EB N/A VA 164 EB ailroad Ave N/A ailroad Ave MK Fwy unnel N/A ailroad Ave VA 164 WB N/A MK Fwy unnel ailroad Ave and VA 164 EB N/A VA 164 EB MK Fwy unnel N/A MK Fwy unnel VA 164 WB N/A VA 164 WB MK Fwy unnel N/A VA 164 EB ondon Blvd WB N/A ondon Blvd WB VA 164 WB N/A ondon Blvd EB VA 164 WB Hampton Blvd Mainline Hampton Blvd SB Between Seabee d and 90 th St Mainline Hampton Blvd NB Between Seabee d and 90 th St able 2-2: Intersection urning Movement Count ocations Exit ocation I-64 Interchanges 265 Armistead Ave at I-64 WB On-amp 265 Armistead Ave at asalle Ave 265 I-64 EB Off-amp at ip ap d 267 I-64 EB Off-amp at Settlers anding d/yler St 267 Settlers anding d at I-64 EB On-amp 267 Settlers anding d at I-64 WB amps 268 I-64 EB Off-amp at Mallory St 268 Mallory St at I-64 WB amps 273 4th View St at I-64 WB amps 273 4th View St at I-64 EB amps 276 US 460/Granby St at I-64 WB On-amp N/A Bainbridge Ave at I-564 amps I-664 Interchanges 2 Powhatan Pkwy at I-664 WB amps 2 Powhatan Pkwy at I-664 EB amps 3 Aberdeen d at I-664 WB amps 3 Aberdeen d at I-664 EB amps 4 oanoke Ave at 41st St/I-664 EB On-amp 4 I-664 WB Off-amp at oanoke Ave 4 oanoke Ave at 39th St 4 41st St/I-664 EB Off-amp at Chestnut Ave 4 Chestnut Ave at I-664 WB On-amp 4 Chestnut Ave at 39th St 5 Huntington Ave at 34th St 5 Huntington Ave at 35th St 5 Jefferson Ave at 35th St 5 Jefferson Ave at 36th St 6 Huntington Ave at 23rd St/MK Jr. Way 6 Huntington Ave at 26th St 6 Huntington Ave at 28th St 6 Jefferson Ave at 25th St/MK Jr. Way 6 Jefferson Ave at 26th St 6 Jefferson Ave at 27th St 7 erminal Ave at I-664 WB amps 13 Jolliff d at Airline Blvd 13 S Military Hwy at W Military Hwy 13 I-664 EB amps at US 13/US 460 Business VA 164 Interchanges N/A College Dr at VA 164 EB On-amp N/A College Dr at US 17/Bridge d N/A owne Point d at VA 164 WB amps N/A owne Point d at VA 164 EB amps N/A VA 164 EB Off-amp at Cedar n April
14 raffic and ransportation echnical eport Exit ocation N/A Cedar n at Coast Guard Blvd/VA 164 WB On-amp N/A Virginia International Gateway Blvd at Wild Duck n N/A Virginia International Gateway Blvd at VA 164 WB amps N/A Virginia International Gateway Blvd at VA 164 EB amps N/A Norfolk d at VA 164 EB amps N/A Norfolk d at VA 164 WB amps N/A ee Ave at Woodrow St/Harper Ave N/A ee Ave at Cleveland St/ailroad Ave N/A VA 164 EB Off-amp at ailroad Ave N/A ailroad Ave at VA 164 WB amps Count data were obtained from VDO permanent count stations for the HB and Monitor-Merrimac Memorial Bridge-unnel (MMMB) for all of 2011 and 2014, as well as June he 2014 data were compared with 2011 data to evaluate growth in daily traffic and to assess whether peak spreading has occurred over the past years. Count data were obtained from other VDO permanent count stations along the Study Area Corridors for April and August 2014, as well as June he ramp, mainline, and intersection turning movement counts and data from VDO s permanent count stations were analyzed to determine heavy vehicle percentages used in the capacity analyses. INIX data were used to develop speed profiles of I-64 and I-664 over the course of an average day to help identify recurring areas of congestion and quantify the level of congestion. he 2015 data were compared with 2011 data to evaluate whether congestion has increased over the past years. Finally, crash data from VDO s GIS database for the Study Area Corridors were obtained to identify crash trends and crash hotspots, and to compare with crash rates on similar facilities within the state. 2.2 DEVEOPMEN OF BAANCED EXISING AFFIC VOUMES o support the traffic analysis of alternatives for the HCS SEIS, peak hour and weekday Average Daily raffic (AD) volumes were developed for each alternative to provide a comprehensive assessment of operations during both the highest volume peak hour conditions and over the course of a typical weekday Peak Hour Volumes aw traffic counts were reviewed to identify the peak hour at each data collection location (mainline segments, ramps, intersections, and VDO mainline permanent count stations). In locations where the data were collected over multiple days, peak hour data were averaged for data collected on a uesday, Wednesday, or hursday. After reviewing the peak hours for the individual data collection locations, common peak hours for major sections within the study area were selected. he hourly traffic volumes and heavy vehicle percentages for the common peak hour were then extracted from the raw count data at each location. he identified peak hours are identified in able 2-3. Peak hour volumes were manually adjusted for balance between interchanges and intersections by holding the volumes at the major interchanges in the study area (I-64 and I-664; I-64 and I-564; I-664 and VA 164; and I-664 and I-264) constant, then proportionally adding and subtracting ramp volumes between the major interchanges. he balanced 2015 peak hour volumes are provided in Figure Daily Volumes Development of the daily volumes followed the same approach as the development of peak hour volumes, with the exception that daily volumes were modified to account for seasonal variations. raffic volumes for the entire year 2014 on the HB and MMMB were reviewed to determine the month-to-month variation, as well as the daily variations within each month. First, the monthly totals were computed for hen, the percentage variation for each month compared to the annual average volume was computed. he computed percentage was applied to the counts conducted in June 2015 to normalize the data. he computed percentages indicate that counts conducted in October and September did not need to be seasonally adjusted, as counts conducted during those months represent typical annual conditions. he balanced daily volumes represent average weekday conditions, although higher weekend and seasonal volumes have been observed on the HB. At some locations only peak hour data were collected. o estimate daily volumes from these peak hour data, k- factors (ratio of peak period versus daily traffic volume) were computed by dividing AM and PM peak hour volumes by the seasonally adjusted daily volume at nearby locations where both peak and daily data were available. he computed k-factors at these nearby locations were then used at locations where only peak hour counts were conducted to estimate a daily volume. Balancing procedures identical to those followed for the peak hour volumes were used to balance the daily volumes. wo key reasonableness checks were performed on the final balanced peak hour and daily volumes. First, k-factors were re-computed using the balanced daily and peak hour volumes. hese factors were then reviewed to ensure that there were no ramps or intersections where the ratio of peak-to-daily volume is beyond typical values, and that k-factors reflect existing traffic patterns, in particular near military facilities (such as I-564) where highly directional traffic volumes entering and departing the facility tend to coincide with work shifts. Second, the daily volumes were compared to the latest available (2014) traffic data published by VDO to ensure 2015 volumes are consistent with the established 2014 volumes. he balanced 2015 weekday daily volumes are provided in Figure 2-2. able 2-3: Study Area Peak Hours oadway Alignments AM Peak Hour PM Peak Hour I-64 7:15 AM 8:15 AM 3:30 PM 4:30 PM I-564 6:45 AM 7:45 AM 3:30 PM 4:30 PM I-664 (from I-64 to VA 164) 7:00 AM 8:00 AM 4:00 PM 5:00 PM I-664 (from VA 164 to I-264) 7:30 AM 8:30 AM 4:30 PM 5:30 PM VA 164 7:00 AM 8:00 AM 4:00 PM 5:00 PM April
15 5 (15) 3,815 (3,710) 5,290 (6,970) 270 (310) 70 (80) ,550 (4,205) 1,075 (885) 1,080 (1,040) 2,580 (2,605) 35 (40) 6,080 (4,580) 4,085 (3,935) 530 (490) 3,660 (3,645) 2,295 (3,500) 815 (1,130) 70 (160) 2,810 (1,775) 1,555 (735) (125) 640 (900) 685 (925) 910 (770) 35 (50) Armistead Ave Armistead Ave I-64 amp 30 (50) 630 (725) 570 (790) 380 (450) 165 (115) 165 (305) 450 (315) 5 (15) 475 (305) 135 (200) 35 (40) 390 (440) 195 (190) 5 (40) 255 (225) ip ap d 100 (205) egend x,xxx (x,xxx) AM (PM) Peak Hour Volume 2015 Existing Peak Hour Volumes I-64 Corridor April 2017 Figure 2-1.1
 550 (1,105) 545 (555) 305 (485) 3,370 (3,155) 3,440 (3,445) 3 630 (310) 3,405 (3,455) 640 (410) 2,780 (2,705) 50 (45) Settlers and ing d 360 (505) 10 (40) 85 (430) 465 (675) 150 (215) 155")
16 3,815 (3,710) 1 25 (40) 305 (205) 335 (385) 255 (385) 215 (65) 2,580 (2,605) Settlers and ing d 665 (630) 670 (875) 310 (115) 30 (125) 90 (400) 715 (740) (450) 320 (175) Settlers and ing d 865 (730) 550 (1,105) 545 (555) 305 (485) 3,370 (3,155) 3,440 (3,445) (310) 3,405 (3,455) 640 (410) 2,780 (2,705) 50 (45) Settlers and ing d 360 (505) 10 (40) 85 (430) 465 (675) 150 (215) 155 (270) 325 (205) 105 (65) 30 (105) 3,330 (3,150) (50) 25 (40) 5 (10) 75 (15) 315 (75) 580 (385) 4 3,480 (3,390) S. Mallory St 70 (340) 180 (410) 765 (805) 3,370 (3,155) (40) 0 (0) 125 (165) 265 (225) 680 (390) 5 (0) 3,440 (3,445) S. Mallory St 35 (245) 55 (125) 5 (10) 15 (30) 60 (35) 5 (5) egend x,xxx (x,xxx) AM (PM) Peak Hour Volume 2015 Existing Peak Hour Volumes I-64 Corridor April 2017 Figure 2-1.2
 60 (545) 70 (80) 3,480 (3,390) 445 (810) 2 300 (880) 410 (385) 255 (145) 400 (435)")
 3 50 (40) 955 (665) US 460 3,660 (4,000) 3,465 (2,545) 355 (1,070) 305 (385) 355")
 AM (PM) Peak Hour Volume 2015 Existing Peak Hour Volumes I-64 Corridor April 2017")
17 3,330 (3,150) 3,360 (3,120) 3,005 (2,450) (55) 200 (380) 95 (95) 210 (85) 4th View St 460 (95) 60 (545) 70 (80) 3,480 (3,390) 445 (810) (880) 410 (385) 255 (145) 400 (435) 4th View St 35 (425) 2 3,660 (4,000) 3,465 (2,545) 225 (500) 50 (35) 70 (75) 280 (165) (110) 3 50 (40) 955 (665) US 460 3,660 (4,000) 3,465 (2,545) 355 (1,070) 305 (385) 355 (425) 3,360 (3,120) 3,005 (2,450) (605) 4,020 (4,605) 3,110 (2,120) egend x,xxx (x,xxx) AM (PM) Peak Hour Volume 2015 Existing Peak Hour Volumes I-64 Corridor April 2017 Figure 2-1.3
 100 (645) 180 (985) 985 (2,105) 3,760 (1,230) 350 (360) 2,300 (435) 495 (360) 2,370 (1,625) 385")
 470 (0) Bellinger Blvd U 0 (5) 255 (100) U 0 (0) 5 (0) 805 (170) 130 (680) 0 (885)")
 egend x,xxx (x,xxx) AM (PM) Peak Hour Volume 2015 Existing Peak Hour Volumes I-64 Corridor")
18 4,020 (4,605) 3,110 (2,120) 1,655 (510) 1,460 (795) (2,135) 810 (170) 285 (2,370) 1,195 (690) 255 (105) 100 (645) 180 (985) 985 (2,105) 3,760 (1,230) 350 (360) 2,300 (435) 495 (360) 2,370 (1,625) 385 (3,015) 300 (530) 345 (170) 700 (330) 685 (1,575) 2,655 (900) 270 (495) 405 (0) (240) 180 (985) Bainbridge Ave 0 (1,155) 470 (0) Bellinger Blvd U 0 (5) 255 (100) U 0 (0) 5 (0) 805 (170) 130 (680) 0 (885) 970 (3,060) EB HOV PM: (2,040) WB HOV AM: 875 2,825 (2,760) 5,030 (2,715) 85 (270) 3,710 (5,550) (to I-64/564 Diverge) egend x,xxx (x,xxx) AM (PM) Peak Hour Volume 2015 Existing Peak Hour Volumes I-64 Corridor April 2017 Figure 2-1.4
19 2,810 (1,775) 2,295 (3,500) 815 (1,130) 1,555 (735) (395) 280 (520) 400 (465) 175 (135) Powhatan Pkwy 75 (95) 230 (385) Powhatan Pkwy 55 (45) 230 (410) 405 (750) 110 (110) I-664 amp I-664 amp 55 (190) 180 (250) 4,365 (2,510) 3,110 (4,630) 235 (440) 305 (480) 285 (245) (440) 4,345 (2,275) (440) 2,870 (4,630) egend x,xxx (x,xxx) AM (PM) Peak Hour Volume 2015 Existing Peak Hour Volumes I-664 Corridor April 2017 Figure 2-1.5
20 255 (235) 4,345 (2,275) 615 (375) 1 2,870 (4,630) (215) 425 (610) 75 (75) Aberdeen oad 395 (815) 180 (160) 160 (160) I-664 amp Aberdeen oad 150 (325) 405 (650) I-64 amp 160 (205) 160 (165) 340 (480) 65 (90) 3,985 (2,135) (295) 310 (490) (375) 95 (205) 95 (205) 365 (150) 425 (145) Chestnut Avenue Chestnut Avenue 80 (155) 285 (350) 650 (365) 35 (15) 20 (25) 3,280 (1,940) 85 (100) 2,670 (3,990) 790 (295) (85) (530) 2,785 (4,435) 5 30 (50) 130 (235) 20 (45) Chestnut Avenue 35 (45) (5) 90 (135) 50 (130) 10 (50) oanoke Avenue oanoke Avenue 5 (5) 220 (165) 25 (65) 180 (205) 445 (95) 20 (5) 15 (45) 10 (5) 85 (300) 120 (285) 20 (35) 15 (20) 95 (75) 105 (80) 55 (45) 55 (60) 65 (25) 8 10 (30) 20 (80) 20 (20) oanoke Avenue 20 (25) 635 (250) 20 (35) 60 (55) 90 (15) 30 (30) 10 (25) 195 (555) 15 (20) egend x,xxx (x,xxx) AM (PM) Peak Hour Volume 2015 Existing Peak Hour Volumes I-664 Corridor April 2017 Figure 2-1.6
 5 (20) 160 (80) 420 (375) 2 7 1,070 (495) 480 (1,045) 295 (445) 20 (15) 645 (275) 260 (220) 2,390 (1,660) 6 7 35 (100) 34th Street 35th Street Huntington Ave 15 (50) 195 (560)")
21 890 (280) 3,280 (1,940) 390 (1,185) 2,670 (3,990) (40) 425 (115) 420 (150) 15 (10) 35th Street 36th Street 90 (35) 1,130 (1,390 Huntington Ave 290 (440) 305 (355) 105 (10) 10 (10) 20 (35) Jefferson Ave 185 (405) 5 (20) 160 (80) 420 (375) 2 7 1,070 (495) 480 (1,045) 295 (445) 20 (15) 645 (275) 260 (220) 2,390 (1,660) (100) 34th Street 35th Street Huntington Ave 15 (50) 195 (560) 5 (25) 25 (15) 15 (25) Jefferson Ave 175 (375) 10 (15) 845 (265) (200) 220 (710) 440 (180) 3,140 (3,360) 135 (150) 45 (105) (15) 30 (25) 40 (15) 28h Street 27th Street 45 (10) 580 (685) 15 (40) Huntington Ave 55 (70) 30 (65) 50 (115) 15 (25) 90 (175) 225 (410) 25 (50) Jefferson Ave 130 (260) 15 (15) 615 (1,485) 280 (35) 650 (370) 150 (255) 500 (115) (420) (60) (40) 440 (180) 115 (105) 430 (70) 5 (25) 26th Street 26th Street 45 (30) 385 (845) Huntington Ave 80 (105) 235 (480) Jefferson Ave 70 (120) 115 (235) 40 (80) 4 85 (560) 50 (170) 345 (95) (20) 5 (10) 165 (965) 190 (415) 50 (90) 5 95 (715) 2,190 (1,710) 3,265 (2,745) 23rd Street 25th Street Huntington Ave 15 (40) 65 (480) 70 (85) 15 (75) 30 (105) Jefferson Ave 170 (315) 15 (25) egend x,xxx (x,xxx) AM (PM) Peak Hour Volume 2015 Existing Peak Hour Volumes I-664 Corridor April 2017 Figure 2-1.7
 135 (795) 170 (95) 2,325 (2,505) 3,265 (2,745) 185 (490) 475 (385) 20 (55) 325 (395) 51 170 (90) 80 (55) 125")
 egend x,xxx (x,xxx) AM (PM) Peak Hour Volume 2015 Existing Peak Hour Volumes I-664 Corridor April 2017 Figure")
22 2,190 (1,710) 360 (390) 440 (290) 2,290 (3,195) 3,325 (2,745) 1 30 (720) 10 (40) erminal Ave 50 (50) 30 (5) 35 (25) 10 (15) 135 (795) 170 (95) 2,325 (2,505) 3,265 (2,745) 185 (490) 475 (385) 20 (55) 325 (395) (90) 80 (55) 125 (170) 85 (25) 135 (105) 760 (980) 600 (215) 3,325 (2,745) 2,105 (3,365) 1,025 (725) 50 (715) 2,290 (3,195) 3,485 (2,560) egend x,xxx (x,xxx) AM (PM) Peak Hour Volume 2015 Existing Peak Hour Volumes I-664 Corridor April 2017 Figure 2-1.8
23 1 15 (10) 270 (670) 35 (50) US 17 2,105 (3,365) 3,485 (2,560) 90 (85) 1,070 (975) 50 (130) 35 (35) 55 (20) 105 (90) (730) 690 (880) US (380) 505 (510) 465 (515) 1,455 (2,105) 405 (530) 1,860 (2,635) 565 (560) 610 (505) 75 (310) 650 (780) 305 (95) 3 2,365 (2,150) (1,165) 320 (395) 85 (135) VA 164 amp 800 (1,540) 15 (10) 2 1,100 (1,120) 450 (340) 2,095 (1,735) (415) 475 (735) (380) (955) 185 (345) 1,140 (595) VA 164 amp 970 (885) College Dr 475 (735) 85 (70) 2,855 (3,670) 3,720 (2,820) (455) 255 (465) 400 (645) 10 (15) US 17 5 (5) 300 (330) 570 (595) 10 (15) 230 (495) 5 (10) 5 (10) 5 (15) egend x,xxx (x,xxx) AM (PM) Peak Hour Volume 2015 Existing Peak Hour Volumes I-664 Corridor April 2017 Figure 2-1.9
 245 (285) 255 (300) 285 (105) 290 (410) 150 (270) 850 (1,210) 2 405 (295) 645 (515) 125 (215) 415 (175) 485 (740) 405 (295) 745 (1,000)")
 3 545 (255) 3 80 (100) 45 (115) 175 (140) 230 (105) Dock anding oad 330 (225) 195 (65) 780 (380) 110 (85) 505 (685) 290 (175) 525 (290) 4 4")
 3,710 (3,125) 3,525 (3,325) 3,530 (3,550) egend x,xxx (x,xxx) AM (PM) Peak Hour Volume 2015 Existing Peak Hour Volumes I-664 Corridor April")
24 2,855 (3,670) 3,720 (2,820) 3,150 (3,310) 3,710 (3,125) 3,225 (3,370) 3,795 (3,450) (250) 245 (490) 230 (450) 495 (275) Pughsville oad 280 (215) 245 (285) 255 (300) 285 (105) 290 (410) 150 (270) 850 (1,210) (295) 645 (515) 125 (215) 415 (175) 485 (740) 405 (295) 745 (1,000) Pughsville oad 390 (705) 110 (85) 425 (475) 80 (210) 900 (1,295) 470 (700) (240) 1,050 (810) 785 (820) 160 (175) 225 (310) (1,180) 340 (515) (255) 3 80 (100) 45 (115) 175 (140) 230 (105) Dock anding oad 330 (225) 195 (65) 780 (380) 110 (85) 505 (685) 290 (175) 525 (290) (75) 350 (180) 540 (405) 3,225 (3,370) 3,795 (3,450) 425 (170) 150 (275) Dock anding oad 220 (100) 155 (240) 55 (65) 95 (210) 250 (450) 3,150 (3,310) 3,710 (3,125) 3,525 (3,325) 3,530 (3,550) egend x,xxx (x,xxx) AM (PM) Peak Hour Volume 2015 Existing Peak Hour Volumes I-664 Corridor April 2017 Figure
25 3,525 (3,325) 3,530 (3,550) 1,570 (2,625) 2,305 (1,625) 375 (415) 655 (750) 30 (25) 275 (285) 705 (590) 1,350 (2,310) 195 (200) 2,900 (2,975) 1,195 (2,210) 4 4,095 (5,185) 435 (275) 1,870 (1,350) 230 (185) 45 (35) 2 3 4,810 (3,575) 2,940 (2,225) 2,130 (3,375) 200 (125) 1 2,450 (1,475) 310 (315) 920 (755) 2,605 (1,565) 3,315 (2,640) 3,335 (3,250) (30) 55 (75) 75 (55) 250 (635) 510 (370) 5 (5) 195 (120) W. Military Hwy W. Military Hwy S. Military Hwy 5 (5) 275 (145) 70 (50) 30 (50) 745 (490) 170 (180) 235 (120) 195 (225) 20 (50) 240 (605) 10 (20) 300 (295) 50 (25) 295 (130) 75 (30) 170 (395) 85 (60) 210 (205) 95 (70) 55 (205) 45 (55) egend x,xxx (x,xxx) AM (PM) Peak Hour Volume 2015 Existing Peak Hour Volumes I-664 Corridor April 2017 Figure
26 1 15 (10) 270 (670) 35 (50) US 17 2,105 (3,365) 3,485 (2,560) 90 (85) 1,070 (975) 50 (130) 35 (35) 55 (20) 105 (90) (730) 690 (880) US (380) 505 (510) 465 (515) 1,455 (2,105) 405 (530) 1,860 (2,635) 565 (560) 610 (505) 75 (310) 650 (780) 305 (95) 3 2,365 (2,150) (1,165) 320 (395) 85 (135) VA 164 amp 800 (1,540) 160 (115) 2 1,100 (1,120) 450 (340) 2,095 (1,735) (415) 475 (735) (380) (955) 185 (345) 1,140 (595) VA 164 amp 970 (885) 475 (735) 85 (70) 2,855 (3,670) 3,720 (2,820) (455) 5 (5) 230 (495) 255 (465) 400 (645) 10 (15) 300 (330) 570 (595) 10 (15) 5 (10) 5 (10) 5 (15) egend x,xxx (x,xxx) AM (PM) Peak Hour Volume 2015 Existing Peak Hour Volumes VA 164 Corridor April 2017 Figure
27 270 (320) 475 (490) 1,570 (2,915) 3 1,365 (2,745) 225 (635) 515 (355) 1,860 (2,635) 1 2,690 (1,935) 775 (510) 200 (125) 4 75 (60) 2,190 (1,610) (360) 2,365 (2,150) 265 (575) (330) 5 (15) 10 (135) 140 (305) 20 (70) 365 (175) 790 (565) owne Point oad 100 (250) 55 (165) 430 (155) 65 (10) 165 (325) 150 (145) 345 (355) 150 (180) 240 (830) 530 (705) 400 (165) owne Point oad 290 (760) 190 (195) 215 (135) 495 (335) 20 (10) 250 (220) 440 (395) 295 (30) 465 (425) Cedar ane 630 (550) egend x,xxx (x,xxx) AM (PM) Peak Hour Volume 2015 Existing Peak Hour Volumes VA 164 Corridor April 2017 Figure
28 1,365 (2,745) 1 0 (5) 150 (170) 0 (0) 0 (5) 0 (0) 5 (10) 95 (90) 0 (5) 0 (0) 5 (5) 5 (5) 220 (80) 20 (10) 2,190 (1,610) 145 (40) (55) 1,415 (2,710) (60) 0 (0) 0 (0) Wyatt Dr 70 (85) 90 (100) VIG Blvd 115 (100) 25 (5) 95 (35) 2,160 (1,670) 3 90 (100) 4 VA 164 amp 70 (95) (40) 25 (0) VIG Blvd 100 (80) (130) 90 (230) 60 (205) 30 (55) W Norfolk d 2,475 (1,705) 1,405 (2,860) 115 (60) 355 (75) 25 (70) 45 (25) 5 5 (5) 30 (55) 15 (35) W Norfolk d 10 (25) 70 (20) 80 (40) 20 (10) 5 (5) 5 (5) 40 (195) 5 (10) 45 (25) egend x,xxx (x,xxx) AM (PM) Peak Hour Volume 2015 Existing Peak Hour Volumes VA 164 Corridor April 2017 Figure
29 1 1,405 (2,860) 5 (15) 20 (25) 65 (65) 110 (55) 155 (210) 140 (80) 695 (1,125) 1,135 (1,555) Cleveland St 15 (10) 235 (220) 5 (5) 5 (5) 5 (5) 55 (90) 2,475 (1,705) 750 (785) 710 (1,735) 440 (430) 1,725 (920) 1,925 (1,425) (275) 245 (10) 70 (70) 450 (200) 405 (165) 1,175 (640) Cleveland St 770 (475) 355 (375) 310 (345) 205 (305) (85) 3 50 (20) 25 (15) 25 (5) 60 (100) 45 (55) 8,888 (8,888) Cleveland St 550 (370) (15) 1,585 (1,065) 4 70 (110) 4 5 (5) 35 (30) 125 (75) 40 (70) 20 (30) 30 (70) Woodrow St 25 (25) 80 (40) 5 (10) I-664 amp 1,655 (1,175) 1,325 (1,925) egend x,xxx (x,xxx) AM (PM) Peak Hour Volume 2015 Existing Peak Hour Volumes VA 164 Corridor April 2017 Figure
30 100 51,600 80,300 3,600 1, ,200 13,200 10,700 44,700 78, ,700 5,900 55,400 32,600 10,600 1,800 30,700 12, ,100 9,300 10,700 11, Armistead Ave Armistead Ave I-64 amp 600 7,300 8,700 5,100 1,600 3,100 3, ,900 2, ,300 2, ,200 ip ap d 2,000 egend xx,xxx Weekday Daily Volume 2015 Existing Weekday Daily Volumes I-64 Corridor April 2017 Figure 2-2.1
31 1 44,700 51,600 1,100 3,100 4,500 3,700 1,500 Settlers and ing d 8,700 6,600 2, ,200 9, ,200 5, Settlers and ing d 7,100 10,800 3,500 5,300 44,700 46, ,500 47,200 6,300 43, Settlers and ing d 5, ,200 7,600 2,500 2,800 2,800 2,700 1,000 44, , ,000 1, ,000 3, ,300 S. Mallory St 1,900 1,900 5, ,700 1, ,600 3,600 4, ,300 S. Mallory St 1,200 1, egend xx,xxx Weekday Daily Volume 2015 Existing Weekday Daily Volumes I-64 Corridor April 2017 Figure 2-2.2
32 1 44,400 43,400 40,000 1,800 3,800 1,100 1,800 4th View St 3,800 2, ,300 6, ,600 4,500 2,400 5,600 4th View St 2, ,000 43,800 4, , ,700 2, ,500 US ,000 43,800 9,900 4,400 4,800 43,400 40, ,500 52,500 39,000 egend xx,xxx Weekday Daily Volume 2015 Existing Weekday Daily Volumes I-64 Corridor April 2017 Figure 2-2.3
33 52,500 39,000 15,500 18, ,900 6,700 14,600 12,200 2,800 4,500 6,900 17,900 37,000 4,600 19,000 5,600 29,900 19,000 5,600 6,600 3,400 12,300 27,000 5,200 3, ,000 6,800 Bainbridge Ave 7,500 3,900 Bellinger Blvd U 100 U 2, ,500 4,900 5,900 21,000 EB HOV: 13,400 WB HOV: 7,300 32,800 58,100 2,100 51,700 (to I-64/564 Diverge) egend xx,xxx Weekday Daily Volume 2015 Existing Weekday Daily Volumes I-64 Corridor April 2017 Figure 2-2.4


34 30,700 32,600 10,600 12, ,000 5,400 5,900 2,200 Powhatan Pkwy 1,200 4,400 Powhatan Pkwy 700 4,800 8,500 1,600 I-664 amp I-664 amp 1,700 2,000 43,200 43,200 3,700 5,600 3, ,700 41, ,700 41,200 egend xx,xxx Weekday Daily Volume 2015 Existing Weekday Daily Volumes I-664 Corridor April 2017 Figure 2-2.5

35 3,600 6,100 41, , ,000 7, Aberdeen oad 8,600 2,700 2,100 I-664 amp Aberdeen oad 3,300 7,400 I-64 amp 2,500 2,400 5, , ,100 5, ,000 2,200 2,200 Chestnut Avenue 2,700 2,500 Chestnut Avenue 1,700 4,400 5, ,900 1,200 35, , , ,700 38, , Chestnut Avenue 500 2, ,500 2, ,200 2, ,600 1, oanoke Avenue oanoke Avenue ,000 1, oanoke Avenue 300 4, , egend xx,xxx Weekday Daily Volume 2015 Existing Weekday Daily Volumes I-664 Corridor April 2017 Figure 2-2.6
36 8,100 34,900 6,900 35, ,200 3, th Street 36th Street ,600 Huntington Ave 4,400 4, Jefferson Ave 4, ,600 4, ,800 7,700 4, ,300 3,400 26, th Street 35th Street Huntington Ave 3, Jefferson Ave 3, , ,600 5,300 4,600 37,200 1,900 1, h Street 27th Street 400 6, Huntington Ave ,500 3, Jefferson Ave 2, ,400 1,600 4, ,800 2,400 6, ,800 1,400 2, th Street 26th Street 500 5,500 Huntington Ave 1,000 4,400 Jefferson Ave 1,400 2, ,400 1,300 2, , , ,700 28,600 34,300 23rd Street 25th Street Huntington Ave 2, Jefferson Ave 3, egend xx,xxx Weekday Daily Volume 2015 Existing Weekday Daily Volumes I-664 Corridor April 2017 Figure 2-2.7
37 1 2, ,600 4,600 4,500 34,600 34,700 erminal Ave ,400 1,400 33,000 34,300 3,900 4, , , , ,200 9,600 4,300 34,700 35,100 9,700 2,000 34,600 35,200 egend xx,xxx Weekday Daily Volume 2015 Existing Weekday Daily Volumes I-664 Corridor April 2017 Figure 2-2.8
38 , ,100 35,200 1,200 13, , ,700 US 17 7,300 5,300 6,900 7,100 19,100 7,000 7,900 7,600 2,100 2,000 14,900 18,900 1,700 7,300 13, ,500 4,400 13,200 45,600 45,300 egend xx,xxx Weekday Daily Volume 2015 Existing Weekday Daily Volumes I-664 Corridor April 2017 Figure 2-2.9
39 1 45,600 45,300 46,100 46,400 48,200 48,700 1,800 4,300 6,200 4,600 Pughsville oad 2,700 4,700 5,500 2,000 5,700 3,000 15, ,500 8,800 2,000 2,700 6,100 11,000 Pughsville oad 4,500 8,500 1,300 2,000 4,900 15,600 2, , ,300 10,700 2,300 4, ,400 6, ,200 1,000 1,000 1,600 2,000 Dock anding oad 2,400 2,700 6,600 1,300 6,900 3,200 5, ,400 2,800 7,500 48,200 48,700 4,700 2,700 Dock anding oad 1,300 2, ,900 4,000 46,100 46,400 50,900 48,700 egend xx,xxx Weekday Daily Volume 2015 Existing Weekday Daily Volumes I-664 Corridor April 2017 Figure
40 50,900 48,700 29,500 29,700 5,700 9, ,100 9,800 23,900 2,000 37,900 23, ,700 4,200 25,500 2, ,100 36,600 36,200 1, ,900 2,600 42,100 11,800 25,800 42, ,900 3, ,400 W. Military Hwy W. Military Hwy S. Military Hwy 100 1, ,700 2,200 1,800 1, , , , , , , egend xx,xxx Weekday Daily Volume 2015 Existing Weekday Daily Volumes I-664 Corridor April 2017 Figure
41 , ,100 35,200 1,200 13, , ,300 7,700 US 17 5,300 6,900 7,100 19,100 5,700 24,800 7,000 7,900 7,600 2, ,000 12,700 4,500 24,200 1,200 VA 164 amp 14,900 18, ,300 1,700 7,300 8,600 13, , ,900 4,000 4,400 VA 164 amp 13,200 8,600 1, ,600 45,300 4, ,100 5,400 7, ,400 7, egend xx,xxx Weekday Daily Volume 2015 Existing Weekday Daily Volumes VA 164 Corridor April 2017 Figure
42 3,300 5,800 25, ,900 6,300 5,700 24, ,000 6,500 2, ,000 21, ,700 24,200 5, , ,000 3, ,300 9,000 owne Point oad 8,500 3,700 3,200 1,500 2, ,700 1,400 3,600 2,400 8,100 owne Point oad 7,300 3,000 1,800 4, ,000 4,400 1,600 4,400 Cedar ane 7,100 egend xx,xxx Weekday Daily Volume 2015 Existing Weekday Daily Volumes VA 164 Corridor April 2017 Figure
43 1 22, , , , ,600 1, ,600 23, , Wyatt Dr 1,300 1,200 VIG Blvd 1, ,000 21, ,200 4 VA 164 amp 1, , VIG Blvd 1, ,400 2,000 1, W Norfolk d 23,000 24, , W Norfolk d , egend xx,xxx Weekday Daily Volume 2015 Existing Weekday Daily Volumes VA 164 Corridor April 2017 Figure


44 1 24, ,500 1,900 11,800 18,300 Cleveland St 200 2, ,000 11,300 12,200 6,500 11,700 20, ,400 1, ,900 2,700 9,600 Cleveland St 6,900 4,100 4,700 3, , , Cleveland St 5, , , , Woodrow St 200 1, I-664 amp 13,800 16,300 egend xx,xxx Weekday Daily Volume 2015 Existing Weekday Daily Volumes VA 164 Corridor April 2017 Figure
45 raffic and ransportation echnical eport 2.3 CAPACIY ANAYSES Capacity analyses along mainlines of the Study Area Corridors were conducted for weekday AM and PM peak hour conditions under Existing, 2028 No-Build, 2028 Build Alternative, 2040 No-Build, and 2040 Build Alternative scenarios using the latest version of the Highway Capacity Software (HCS 2010 Version 6.70), which was developed based on the methodologies presented in the 2010 Highway Capacity Manual (B, 2010). he Freeway Facilities module was used to conduct the mainline capacity analyses. he I-64, I-564, I-664, VA 164 corridors and proposed new alignments crossing the Elizabeth iver were each divided into segments, representing either a mainline basic freeway segment, a weaving segment, or a ramp junction (merge or diverge segment). Segments along each corridor were then evaluated to determine the AM and PM peak hour evel of Service (OS) based on existing (2015) and future (2040) volumes developed for this study. Capacities for the HB and MMMB were assumed to be 1,600 vehicles per hour per lane, consistent with assumptions for the bridge-tunnels developed by the HPO. evel of Service is a letter-grade description of the quality of traffic flow, ranging from A (best) to F (worst). OS A represents free-flow conditions where vehicles can travel unimpeded, and where incidents can generally be absorbed. OS E represents operations near the roadway s capacity, with very unstable flow in which even minor incidents lead to significant queueing. OS F represents a breakdown in traffic flow with demand exceeding capacity. However, it should be noted that in an urban environment, such as the one that surrounds the Study Area Corridors, OS is not considered the best indicator of improvements to the network, as it does not capture measurable improvements made within a given letter grade. FHWA has acknowledged this issue in recent revisions to its guidance, which removes previous OS requirements for interstate improvements. herefore, additional measures of effectiveness including estimated travel time, speed, and delay, as well as daily Vehicle Hours raveled (VH) and daily Vehicle Miles raveled (VM) were developed. Capacity analyses at intersections within the interchanges were conducted for weekday AM and PM peak hour conditions under Existing, 2028 No-Build, 2028 Build Alternative, 2040 No-Build, and 2040 Build Alternative scenarios using the latest version of Synchro with Simraffic (Version 9.1), which implements the methodologies presented in the 2010 Highway Capacity Manual. Intersections were evaluated to determine the AM and PM peak hour delay (in seconds) and OS based on existing (2015) and future (2028 and 2040) volumes developed for this study. 2.4 FOECASING POCESS Hampton oads ransportation Planning Organization ravel Demand Model Year 2028 and 2040 travel demand forecasts were developed for both No-Build conditions and all Build Alternatives using the latest adopted regional ravel Demand Forecast Model maintained by the Hampton oads ransportation Planning Organization (HPO). A travel demand forecast model is a set of computer-based mathematical relationships that attempts to capture the interaction of travel activities and choices made by a population in a specific region given a proposed network (e.g., highway, transit, etc.) and demographic or land use inputs (e.g., population, employment, etc.). he main inputs to a travel demand model are: Demographic and economic changes in the region, specifically the location of employment and housing; and, Characteristics of the region s transportation system, including proposed changes in the transportation facilities and operating policies. ravel demand models have been used in Virginia for the past three decades for all NEPA studies that involve traffic forecasting and air quality evaluation, including the 2001 hird Crossing EIS, 2011 HB DEIS, 2012 I-64 Peninsula EIS, and US 460 EIS. Use of travel demand models ensures a consistent analysis approach to all NEPA studies in Virginia. he current HPO model is an advanced four-step forecasting model to support air quality analysis and project planning in the Hampton oads region. he HPO model generally follows the Virginia ransportation Modeling Policies and Procedures Manual, as documented in the 2013 Hampton oads Model Methodology eport (HPO, 2013) and 2014 Hampton oads Model elease Notes (HPO, 2014). he HPO travel demand model was calibrated for the 2009 base year against trip distribution and mode choice data contained in the National Household ransportation Survey. Additional validation tests were performed to ensure that final model output was within reasonable tolerance of observed ground data and produced reasonable outputs when future-year transportation system assumptions were changed (such as the inclusion of new roadway facilities). he HPO model employs a conventional gravity model to estimate trip distribution. he HPO model has a 2009 base year and a 2034 horizon year, which is the latest year for which the HPO has adopted regional land use forecasts. he HPO model was provided by VDO for use in the HCS project in July he HPO model was considered validated for use in the HCS and used as the baseline travel demand model. he HPO model was used without modifications to any of the components of the four-step model process. Similarly, no changes were made to any land use or socioeconomic inputs or other model constants for either the 2009 base year or the 2034 No-Build and Build scenarios. In accordance with accepted model practice, the same land use data were used as inputs for both No-Build and Build conditions. However, the HPO model included several projects that are not anticipated to be place by hese projects were removed from all future-scenario model runs. One project which is anticipated to be in place by 2040 but was not coded in the HPO model was added. Details on these projects are provided below: Eliminated the US 460/US 58/US 13 Connector project; emoved tolls from all existing and proposed river crossings except for the Midtown unnel (US 58) and the Downtown unnel (I-264); and, Added third General Purpose lane to I-64 between I-264 (Bowers Hill interchange) and I-464, and one HOV lane in each direction. he HOV lane ties into the existing HOV system east of I-464, and has the same peak hour occupancy restrictions as the existing system. In addition, the facility type for the proposed new crossings (VA 164 Connector, I-564 Connector, and I-664 Connector; used in Alternatives B-D) was set to freeway for their entire length (some VA 164 Connector segments north of VA 164 were originally coded as collector in the 2034 HPO model). he new crossings were not included in the No-Build or Alternative A model runs. he 2034 HPO model was used to develop 2034 traffic forecasts which were then extrapolated to Year 2040 forecasts. he growth rates used to extrapolate 2034 daily volumes to 2040 daily volumes were based on the annual linear growth rate that was calculated from the model from 2015 to hese growth rates, which range from 1 to 1.2 percent per year, were applied to all Study Area Corridor roadways, including new links across the Elizabeth iver. Shortly before the publication of the HCS Draft SEIS, HPO adopted its 2040 ong ange ransportation Plan (P). he timing of this action did not allow the 2040 model to be incorporated into the analysis to support the April
46 raffic and ransportation echnical eport Draft SEIS. he 2040 P model, however, will be used to analyze the Preferred Alternative in the Final SEIS, should one be identified. Interim year 2028 travel demand forecasts were also developed using the HPO model, using the planned 2028 transportation network. In consultation with HPO, the 2028 land use data were interpolated between the adopted 2009 and 2034 models. he 2028 network excluded the anticipated widening of the I-64 south side between the Bowers Hill Interchange and I-464, including widening of the High ise Bridge Post-Processing Post-processing refers to analyses performed after execution of the travel demand forecast model run. Postprocessing activities are applied to the travel demand forecast model results to compensate for the limitations of the model. he model used for the study produced raw daily link volumes. In order to develop daily and hourly volumes for the peak travel periods, the link-level model outputs were refined for the segments of interest along the Study Area Corridors and the arterial approaches. he freeway system included all mainline links, collector/distributor roads, and ramps. he arterial links included the approaches to each interchange within each Study Area Corridor. Highway post-processing involves three stages: efinement of the raw link volumes, which is done with the direct output from the model for the AD volumes; Calculation of the turning movements; and, Derivation of the peak hour link volumes. For this study, all post-processing activities for refining the highway link AD volumes and developing turning movement volumes involved procedures outlined in National Cooperative Highway esearch Program (NCHP) eport 255 Highway raffic Data for Urbanized Area Project Planning and Design (Pedersen et al., 1982) and NCHP eport 765 Analytical ravel Forecasting Approaches for Project-evel Planning and Design (Horowitz et al., 2014). hese technical reports provide a set of procedures for refining raw link volumes output directly from the model. Iterative proportional fitting (IPF) methods outlined in NCHP 765 and 1287 Model of urning Movement Propensity (Furth, 1990) were used to estimate 2040 daily turning movement volumes at interchanges and intersections. he existing 2015 daily ramp and turning movement volumes were used as the seed for the IPF procedure, and the 2040 link volumes were used as the target inflows and outflows. he IPF routine iteratively adjusted the existing turning movement volumes to balance the turns given the forecasted approach inbound and outbound link volumes. he 2040 daily link and turning movement volumes were manually adjusted as necessary to achieve volume balance between interchanges and intersections by holding volumes at the major interchanges in the study area (I-64 and I- 664; I-64 and I-564; I-664 and VA 164; and I-664 and I-264) constant, then proportionally adding and subtracting ramp volumes between these interchanges. Final 2040 daily forecasts were checked for reasonableness against previous forecasts including the 2012 HB EIS and the 2014 High ise Bridge Environmental Assessment, which extended to the Bowers Hill interchange (FHWA, 2012; FHWA 2014). Peak hour traffic projections are required for design and analysis purposes. o compute peak hour volumes, the ratios between peak hour and daily traffic volumes (k-factor) for 2015 conditions were computed by dividing the AM and PM peak hour volumes by the corresponding daily volume for each mainline and ramp segment and each intersection turning movement. hese k-factors were then applied to the 2040 daily volumes to develop unbalanced 2040 peak hour volumes. he unbalanced 2040 peak hour link and turning movement volumes were manually adjusted as necessary to achieve volume balance between interchanges and intersections by holding volumes at the major interchanges in the study area constant, similar to the manual balancing of 2040 daily forecasts. aw model output for the 2028 opening year was post-processed in the same manner as the 2034 output, with the exception that it was not necessary to extrapolate the daily volumes beyond the model horizon year, as the HPO model by design produces 2028 output, based on the roadway network that is expected to be in place in O AND MANAGED ANE FOECASS Each of the Build Alternatives could accommodate tolls. he alternatives evaluation has incorporated a preliminary assessment of how tolls could potentially result in traffic diversion to other river crossings. he toll assessment has not determined final future traffic volume projections; has not recommended toll rates; and is not appropriate for toll revenue estimation. Moreover, the preliminary toll diversion results were not analyzed for environmental impact; however, the physical limits of disturbance for each alternative take into account the potential for future tolling, where appropriate. he determination of whether tolls would be implemented as part of any of the alternatives would take place after alternative selection, if appropriate. hree separate toll diversion scenarios have been considered for the Build Alternatives: no tolls, Elizabeth iver tolls, and High Occupancy oll (HO) lanes. he no toll scenario is the baseline for alternatives development and is being used to identify environmental impacts and perform the traffic analyses discussed later in this technical report. Under the Elizabeth iver toll scenario, tolls would apply to all traffic traveling on the new crossing of the Elizabeth iver in Alternatives B, C, or D. he HO ane scenario assumes that in addition to the Elizabeth iver tolls, any new travel lanes proposed under the Build Alternatives would be HO lanes. It is assumed that any tolls would be collected electronically by overhead gantry. April
47 raffic and ransportation echnical eport 3. EXISING CONDIIONS ransportation facilities in the Hampton oads region comprise all modes of surface, air and marine transportation. Hampton oads is one of the deepest harbors on the US East Coast, sheltering the largest naval base in the world and the sixth largest containerized cargo complex in the United States. As a result of the abundance of water, the importance of the harbor, and the presence of the military, the region abounds with bridges, tunnels, rail lines, and airport facilities. Norfolk Southern (NS) and CSX ransportation (CSX), the Class I freight railroads which serve the region, have a large commercial base due to the presence of the harbor and the shipping industry. he region is also served by intercity passenger rail service provided by Amtrak as well as a regional transit system. he region contains two international airports and three general aviation airports. Environmental consequences to transportation facilities are described in Chapter 3 of the Draft SEIS. 3.1 IMIED ACCESS HIGHWAYS imited access highways which comprise the Study Area Corridors are summarized in able 3-1 and shown in Figure 1-1. hey include I-64, I-664, I-564, and VA 164. hese highways serve a critical transportation function for commuters, interstate and intrastate freight movement, national defense, emergency evacuation, and commercial activities. I-64 crosses Hampton oads via the HB and I-664 crosses via the MMMB. Both of these crossings are critical links in the regional transportation network connecting Southside and the Peninsula. Highway Functional Classification I-64 Interstate I-564 Interstate I-664 Interstate VA 164 Other Freeway or Expressway able 3-1: imited Access Highways 3.2 CONNECING SAE OUES AND OCAS OADS Description I-64 extends from 1.7 miles west of the I-664 interchange in Hampton to approximately 0.5 miles south of the I-564 interchange in Norfolk, a distance of approximately 14 miles, including the 3.5-mile long HB. I-564 is the primary access between NAVSA Norfolk, NSA Hampton oads, and the NI on the west and I-64 on the east, a distance of approximately 3 miles. I-664 is 20.8 miles in length, beginning at Interchange 1 in Hampton and ending at Interchange 13 in Chesapeake. he Western Freeway extends for 3.4 miles east-west through Portsmouth and Suffolk from Virginia International Gateway Boulevard to I-664. State routes and local roads which link to the limited access roadways of the Study Area Corridors are summarized in able 3-2 and shown in Figure 1-1. able 3-2: Connecting State outes and ocals oads Numerical Designation Functional Classification oadway Name Connecting Interstate Interchange/Exit Number ocality US 258 Other Principal Arterial Mercury Boulevard I A/B Hampton asalle Avenue/ S 167/S 134 Minor Arterial Armistead Avenue, ip ap oad I Hampton Numerical Designation Functional Classification oadway Name Connecting Interstate Interchange/Exit Number ocality US 60/S 143 Minor Arterial Settlers anding oad I Hampton S 169 Minor Arterial South Mallory Street I Hampton US 60 Minor Arterial 4 th View Street I Norfolk S 1070 Major Collector 1 st View Street I-64 Underpass Norfolk S 907 Minor Arterial Bay Avenue I Norfolk US 460 Other Principal Arterial Granby Street I /276A Norfolk S 165 Other Principal Arterial ittle Creek oad I /276C Norfolk S 337 Other Principal Arterial Admiral aussig Boulevard I-564 Future Exit Norfolk S 406 Other Principal Arterial International erminal I-564 erminal Boulevard Boulevard Norfolk S 415 Minor Arterial Power Plant Parkway I Hampton S 905 Minor Arterial Aberdeen oad I Hampton Chestnut S 945/S Newport Major Collector Avenue/oanoke I News Avenue S 143 Other Principal Arterial Jefferson Avenue I US 60 Other Principal Arterial Warwick Boulevard/26 th Street I Newport News Newport News --- amps erminal Avenue I Newport News S 135 Minor Arterial College Drive I-664 8A/B Suffolk S 133 US 17/VA164 Major Collector Other Freeway/Expressway New own Point oad Western Freeway/Western Branch Boulevard I-664 Overpass Suffolk I-664 9A/B Suffolk S 947 Minor Arterial Pughsville oad/aylor oad I Chesapeake S 337 Minor Arterial Portsmouth Boulevard I A/B Chesapeake S 1036 Major Collector Dock anding oad I Chesapeake US 58 Minor Arterial Airline Boulevard/West Military Highway I A/B Chesapeake US 13 Minor Arterial South Military Highway I A/B & 14 Chesapeake S 905 Major Collector Cedar ane S164 Cedar ane Portsmouth S 947 Major Collector own Point oad S164 own Point oad Portsmouth Source: Virginia Department of ransportation, April
48 raffic and ransportation echnical eport 3.3 MAJO BIDGES AND UNNES he HB is a four-lane facility with two, two-lane tunnels under the Hampton oads channel shipping lanes, two man-made tunnel portal islands, and concrete twin trestle bridges on the approaches in both directions. he HB first opened in 1957 with the second tunnel added in he MMMB opened in 1992 and is a four-lane facility comprised of two, two-lane tunnels with 14 6 vertical clearance. It has two man-made portal islands with two concrete twin trestle bridges on the south approach and a four-lane concrete trestle bridge on the north approach. 3.4 ANSI OUES AND FACIIIES Public transportation in the region is provided by Hampton oads ransit (H). H serves six cities: Chesapeake, Hampton, Newport News, Norfolk, Portsmouth and Virginia Beach. H operates a total of 56 local fixed bus routes, eight regional express commuter bus routes, seven major employer shuttles (e.g. Newport News Shipyard) as well as seasonal routes at the Virginia Beach oceanfront. In Fiscal Year 2015, H provided a total of 14.2 million unlinked passenger trips on its fixed route buses which includes the local bus routes, regional commuter express routes, and employer shuttles. Within its fixed route service area, H also provides complementary paratransit bus service in compliance with the Americans with Disabilities Act. H reported a total of 324,000 trips on its paratransit buses in fiscal year In addition to fixed route and paratransit bus service, H operates the ide, a light-rail system which extends 7.4 miles from the Eastern Virginia Medical Center complex east through downtown Norfolk to Newtown oad at the border of Virginia Beach. H also operates a ferry route on the Elizabeth iver between Norfolk and Portsmouth. he ide and Elizabeth iver ferry service do not currently operate within the Study Area Corridors. he City of Suffolk does not have a contractual agreement with H, and therefore operates its own transit system called Suffolk ransit. Suffolk ransit operates six routes within the City, as well as complementary paratransit service in compliance with the Americans with Disabilities Act. he bus routes operate Monday through Friday on one hour headways Metro Area Express (MAX) outes able 3-3: Metro Area Express (MAX) outes oute Number ocality Connection oute ermini Study Area Corridors Overlap 918/919 Virginia Beach Norfolk Silver eaf Park & ide to afayette iver Annex I Chesapeake Norfolk Greenbrier Mall to Naval Station Norfolk I Norfolk Newport News Downtown Norfolk to Newport News ransit Center I-64, HB, and I Newport News - Norfolk Patrick Henry Mall to Naval Station Norfolk I-64, HB, and I Norfolk Newport News Military Highway ight ail Station to Newport News ransit Center I-664 and MMMB Source: Hampton oads ransit, ocal Bus outes ocal H bus routes intersect the Study Area Corridors in Hampton, Norfolk, Portsmouth, and Newport News via minor arterial roadways and/or major and minor collectors to serve local destinations. hese local bus routes do not generally utilize I-64, I-664, I-564 or VA 164. One H commuter service bus uses I-664 and I-64 to connect Newport News with Williamsburg. In addition to the routes, the Wards Corner Bus ransfer Station is located near the intersection of Granby Street and Admiral aussig Boulevard in Norfolk adjacent to the interchange of I-64 and I-564. Suffolk ransit uses I-664 for approximately 4 miles along the Gold oute, extending from the Bowers Hill area northbound to Pughsville oad. he Blue oute travels along the Hampton oads Parkway and crosses over I-664 in North Suffolk. he H Metro Area Express bus service ( the MAX ) is a commuter express bus service which uses the Study Area Corridors to provide regional express bus service between the Peninsula and Southside. Service is provided to Park and ide facilities throughout the region, connecting commuters to major employment destinations, such as Naval Station (NAVSA) Norfolk and Northrop Grumman in Newport News. able 3-3 summarizes the MAX routes which use the Study Area Corridors, and Figure 3-1 illustrates the route patterns. he MAX is the only public transit option that connects the Peninsula and Southside. April


49 raffic and ransportation echnical eport Figure 3-1: H MAX outes 3.5 PO FACIIIES he Hampton oads waterbody acts as one large harbor with multiple docking and mooring locations for military, commercial, ship yards, and recreational watercraft. wo designated shipping lanes pass through the harbor and are federally maintained by the US Army Corps of Engineers (USACE): the Newport News Channel and the Norfolk Harbor each Channel which are shown in Figure 3-2. he existing depths of the channels are a minimum of 50 feet; however, the Port of Virginia has gained approval to dredge the channels to 55 feet depths. he deeper channels will allow the port facilities to accommodate the largest container ships that pass through the Panama Canal, referred to as Super Post Panamax ships. he harbor and shipping lanes allow commercial shipping lines to access major commercial ports in the region located in Newport News, Norfolk, and Portsmouth. hese port facilities are substantial generators of traffic on area roadways resulting from employee work trips and long and short-haul truck traffic on and adjacent to the Study Area Corridors. All of the commercial ports are accessible by roadway, water, and rail, to varying degrees. he Port of Virginia is a public organization overseen by the Virginia Port Authority to market and operate port facilities in the Commonwealth of Virginia. In the Hampton oads region, the Port of Virginia operates four deepwater marine terminals and an upriver barge terminal. hese facilities are summarized in able 3-4 and shown in Figure 3-2. Outside of the Hampton oads region, the Port of Virginia also operates the Port of ichmond and Virginia Inland Port located in Warren County. Collectively, Port of Virginia facilities processed 19.7 million tons of cargo in 2015, with an estimated value of $60 billion. here are three privately-owned port facilities in Hampton oads that store and transload coal to bulk carrier ships. Kinder Morgan and Dominion erminal Associates operate port facilities southeast and adjacent to the Newport News Marine erminal (NNM) which is owned and operated by the Port of Virginia. Coal is transported to these facilities by CSX where it can be loaded onto ships. oadway access to these facilities is provided via I-664. NS operates the amberts Point Coal erminal in Norfolk which is located on the Elizabeth iver. amberts Point erminal is accessed by US 460 via I-64/I-564. Newport News Shipbuilding (NNS) is the United States sole designer, builder and refueler of nuclear powered aircraft carriers and one of only two shipyards in the country which designs and builds nuclear powered submarines. NNS is largest industrial employer in Virginia, employing more than 20,000 people. he Craney Island Marine erminal is a facility under development by the Port of Virginia with a scheduled completion year of he terminal will be an automated container terminal with the capability to handle up to 50 percent of its container volume by rail. he existing Commonwealth ailway ine (shortline railroad) will be extended from VA 164 to Craney Island. Extension of the rail line will provide access to the terminal for both NS and CSX, and allow for double-stack intermodal rail service. he terminal will be designed to serve Super Post Panamax class ships and will also have direct access to the interstate highway system. In addition to commercial and military activities, the harbor provides a safe port and anchorage destination for ships and boats to shelter during storms, and an open area for recreational use. o access the harbor, ships must pass over the HB, and to access the western reaches of the James iver, they must pass over the MMMB. Smaller rivers and creeks that feed into Hampton oads act as harbors as well, including the Hampton iver, the Elizabeth iver, and the ower James iver. April
 Newport News Marine erminal (NNM) Norfolk International erminals (NI) Virginia International Gateway (VIG) Portsmouth Marine erminal (PM) Pier IX VA erminal Dominion Coal Shipping")

50 raffic and ransportation echnical eport able 3-4: Existing Commercial Port Facilities Figure 3-2: Port Facilities and Freight ail Network Port Facility Owner ocality Access Description Newport News Shipbuilding (NNS) Newport News Marine erminal (NNM) Norfolk International erminals (NI) Virginia International Gateway (VIG) Portsmouth Marine erminal (PM) Pier IX VA erminal Dominion Coal Shipping and Ground Storage Facility amberts Point Coal erminal Huntington Ingalls Industries Port of Virginia Port of Virginia Port of Virginia Port of Virginia Kinder Morgan Dominion erminal Associates Norfolk Southern Newport News Newport News Norfolk Portsmouth Portsmouth Newport News Newport News Norfolk oad: I-664 ail: CSX Marine: Newport News Channel oad: I-664 ail: CSX Marine: Newport News Channel oad: Hampton Blvd/I-564 ail: NS Marine: Norfolk Harbor each Channel oad: Hampton Blvd/I-564 ail: CSX and NS Marine: Norfolk Harbor each Channel oad: VA 164/US 58 ail: CSX, NS and NBP Marine: Norfolk Harbor each Channel oad: 18th Street ail: CSX Marine: Newport News Channel oad: 18th Street ail: CSX Marine: Newport News Channel oad: US 460/I-64 ail: NS Marine: Norfolk Harbor each Channel Shipyard which builds and refuels nuclear powered aircraft carriers and submarines. 165-acre general cargo terminal supporting oll- On/oll-Off, break-bulk, and warehouse operations. Gated entrance. 567-acre container terminal with six 50 deep berths and 14 Super Post Panamax shipto-shore cranes. Current operations rely primarily on straddle carriers. Gated entrance. 231-acre container terminal with three 50 deep berths and 8 Super Post Panamax ship-to-shore cranes. 285-acre mixed use terminal with two 43 deep berths and 6 Post Panamax ship-to-shore cranes currently allocated to container operations. Primarily an over-the-road truck terminal. hree-dock marine terminal for the purpose of coal shipping and ground storage with a capacity of 1.4 million tons. Coal shipping and ground storage facility with a storage capacity of 1.7 million tons. NS-served and operated transshipment coal terminal located on the Elizabeth iver. April
51 raffic and ransportation echnical eport Military vessels use the harbor to access NAVSA Norfolk, the Naval Supply Center, the Coast Guard base, and Navy Shipyard in Portsmouth. hese military installations are shown in Figure 3-2. he Ports for National Defense Program is a program established by the Department of Defense (DoD) to identify and asses the adequacy and responsiveness of defense-important infrastructure at ports that support DoD deployments. he Program identifies the Port of Virginia facilities as a designated strategic seaport. 3.6 FEIGH AIOAD NEWOK With the regional importance and location of the Port of Virginia, the freight rail network is critical to the local economy and goods movement. he Hampton oads region is served by two Class I freight railroad operators and three Class III shortline railroads. hese railroads serve the port facilities and other businesses along the routes. Goods and natural resources are brought by rail to Hampton oads to be exported, and imports are distributed nationwide via rail lines that service the marine terminals in Hampton oads. he freight rail network within and adjacent to the Study Area Corridors is shown in Figure 3-2 and summarized in able 3-5. able 3-5: Freight ailroad Network Freight ail Corridor Owner(s) ermini Description Peninsula Subdivision CSX ichmond-newport News 74-mile Class I freight rail corridor serving the NNM. Portsmouth Subdivision CSX Portsmouth-Weldon, North Carolina 68-mile Class I freight rail corridor serving the PM. Norfolk District NS Norfolk-Crewe, Virginia 134-mile Class I freight rail corridor serving amberts Point Coal erminal. Sewalls Point District NS Norfolk 9.4-mile Class I freight rail corridor serving the NI. Norfolk and Portsmouth Belt ine ailroad (NPB) CSX/NS Norfolk-Portsmouth 26-mile Class III terminal switching railroad through Norfolk, Portsmouth and Chesapeake. Jointly-owned by CSX and NS. Commonwealth Genesee & Portsmouth-Suffolk 19-mile Class III shortline railroad serving the ailway (CWY) Bay Coast ailroad (BC) Wyoming Bay Coast ailroad Norfolk-Pocomoke City, Maryland VIG. 68-mile shortline railroad and 26-mile car float (ferry) operation from Cape Charles, Maryland to ittle Creek (Norfolk). Interchanges with NS and NPB railroads in Norfolk. Sources: Genesee & Wyoming; Norfolk and Portsmouth Belt ine ailroad; Virginia ailroad Association; CSX ransportation; Norfolk Southern Corporation. Amtrak provides two daily round trips from the Newport News train station and one daily round trip from the Norfolk train station. Amtrak uses the CSX Peninsula Subdivision to serve the Newport News train station on Warwick Boulevard, and the NS Norfolk District rail corridor to serve Norfolk train station on Park Avenue. Amtrak also provides a connecting bus shuttle from Norfolk to Newport News for those passengers who want to board at the Newport News Station. Amtrak routes and stations are shown in Figure 3-3 and summarized in able 3-6. oute Name Station Daily ound rips Northeast egional Northeast egional Source: Amtrak, Newport News able 3-6: Amtrak outes Annual idership (2015) Description 2 348,581 Daily roundtrips to Washington, DC/Northeast Corridor terminating in Boston, MA (12-14 hour travel time). oute travels the CSX Peninsula Subdivision. Norfolk 1 153,857 Daily roundtrip to Washington, DC/Northeast Corridor terminating in New York City (8 hour travel time). Connecting bus shuttle to Newport News Amtrak station. he primary interstate and intrastate rail corridors in the Hampton oads region are the Peninsula and Portsmouth Subdivisions which are owned and operated by CSX; and the Norfolk District which is owned and operated by NS in Southside. he shortline railroads which operate in the Hampton oads region complement and facilitate long-haul freight movements carried by NS and CSX outside the region and state. hese railroad corridors cross and parallel the Study Area Corridors as shown in Figure INECIY PASSENGE AI SEVICE (AMAK) Intercity passenger rail service in the Hampton oads region is provided by the National ailroad Passenger Corporation (Amtrak). Amtrak operates its Northeast egional route with service to Norfolk and Newport News. he Northeast egional route provides service north to Washington, DC; New York City; and Boston, Massachusetts. April


52 raffic and ransportation echnical eport Figure 3-3: Amtrak outes and Airports 3.8 AIPOS he Hampton oads region is served by two commercial airports and three general aviation airports. hese airports are summarized in able 3-7 and shown in Figure 3-3. Norfolk International Airport is the largest airport in the region serving an estimated 4 million passenger trips annually and 68 million pounds of air cargo. he Norfolk Airport Authority reports that the airport directly employs 1,700 people, and indirectly generates as many as 12,500 jobs for the region. he Peninsula Airport Commission reports that Newport News/Williamsburg International Airport served 524,518 passenger trips in aken together, the airports are substantial generators of roadway traffic in the region resulting from employee work trips and travelers using the airports. able 3-7: Commercial and General Aviation Airports Airport Name Owner ocation Description Norfolk International Airport (OF) Norfolk Airport Authority Norview Avenue Norfolk, VA Public small hub commercial airport Newport News/ Williamsburg International Airport (PHF) Peninsula Airport Commission 900 Bland Blvd Newport News, VA Public non hub commercial airport Hampton oads Executive Airport (PVG) Virginia Aviation Associates 5172 West Military Highway Chesapeake, VA Private high-capacity general aviation airport Chesapeake egional Airport (CPK) Chesapeake Airport Authority 2800 Airport Drive Chesapeake, VA Public regional general aviation airport Suffolk Executive Airport (SFQ) City of Suffolk 1200 Gene Bolton Drive Suffolk, VA Public regional general aviation airport Source: Federal Aviation Administration, EMEGENCY EVACUAION OUES As described in the Purpose and Need (Chapter 1 of the SEIS), one need for the project is to enhance emergency evacuation capabilities of the region. In the event of a hurricane, the Virginia Department of Emergency Management (VDEM) has designated evacuation routes for the region which are summarized in able 3-8 and shown in Figure 3-4. hese evacuation routes include the Study Area Corridors of I-64 and I-664. he HB and MMMB may be overtopped by water during extreme storm events. he Study Area Corridor tunnels are equipped with storm doors which can be shut to prevent flooding. While this preserves the tunnel structures, it would close off a vital route for evacuees and/or emergency personnel. Another impediment to evacuation is that the Hampton oads region is low lying, and US 17, US 460, and US 58 are prone to flooding, further exacerbating evacuation conditions even after evacuees make it past the available water crossings. Norfolk and Virginia Beach residents located north of I-264 are directed to use I-64 and the HB in the event of an evacuation. However, because of increased regional population, limited water crossings for large area evacuations, and peak congestion during typical daily use already occurring on designated emergency routes, the ability to effectively evacuate the population is hampered. he study routes and HB and MMMB crossings are known bottlenecks during daily traffic and would be more so during evacuations. April

53 raffic and ransportation echnical eport able 3-8: Emergency Evacuation outes Figure 3-4: Emergency Evacuation outes oute Name Designated Jurisdictions Description Peninsula Hampton Newport News Evacuation route for Peninsula jurisdictions using the following routes: I-64 I-664 North US oute 17 North US oute 60 West Southside Norfolk and Virginia Beach Suffolk Chesapeake Portsmouth Virginia Beach Norfolk Virginia Beach Source: Virginia Department of Emergency Management S 143 Evacuation route for Southside jurisdictions using the following routes: I-64 and I-264 I-664 MMMB US oute 17 North US oute 58 West US oute 460 West S 10 West Evacuation of Southside jurisdictions via I-64 operating with reversed eastbound lanes (westbound). April
54 raffic and ransportation echnical eport 3.10 BICYCE AND PEDESIAN NEWOK here are no bicycle or pedestrian facilities on the Study Area Corridors nor do any bicycle or pedestrian facilities link Southside and the Peninsula. State law generally does not permit bicyclists to ride on interstate and certain controlled access highways, unless the operation is limited to bicycle or pedestrian facilities that are barrier separated from the roadway and automobile traffic EXISING AFFIC VOUMES Existing 2015 peak hour volumes and Average Daily raffic volumes were provided in Figure 2-1 and Figure 2-2. he balanced daily volumes represent average weekday conditions, although higher weekend and seasonal volumes have been observed on the HB CASH ANAYSIS Crash data for the years were analyzed for the following roadway sections: I-64 from I-664 to I-564 (milepost to ) I-664 from I-64 to I-264 (milepost 0.00 to 20.68) I-564 from S 337 to I-64 (milepost 0.00 to 3.00) VA 164 from I-664 to US 58 (milepost 0.85 to 7.04) Crash data were analyzed by quarter-mile segments and referenced to major landmarks along each segment (tunnel portals, major interchanges, etc.). Crash data were tabulated by crash type, severity, pavement condition and time of day. Crash rates (calculated per 100 Million Vehicle Miles raveled) were calculated for each quarter-mile segment. he analysis summaries for each section are presented in Figures 3-5 through In general, the highest crash rates (in crashes per 100 Million Vehicle Miles raveled) occur on eastbound and westbound I-64, with rates of 152 and 135 crashes per 100 Million Vehicle Miles raveled, respectively. hese rates are significantly higher than those experienced elsewhere within the study area. ikewise, rear-end and property damage only crashes are most prevalent along I-64; the share of rear-end crashes on other facilities is lower, while the share of injury crashes is higher. Details on the crash analyses are provided below Eastbound I-64 Crash Analysis A total of 930 crashes were reported along eastbound I-64 during the study period. As shown in Figure 3-5, crashes are primarily rear-end crashes (71%), with fixed-object (16%) and sideswipe crashes (7%) being the next most frequent. Along eastbound I-64, there is a pronounced increase in the number of crashes at mile point , which corresponds to the entry point of the elevated structure of the HB, where the number of lanes is reduced from three to two. A total of five (5) fatal crashes were reported along the entire segment, which is the highest number of all segments that were analyzed. wo-hundred sixty-five (265) crashes (28%) resulted in injuries, while the remaining 660 (71%) crashes resulted in property damage only. Approximately 47 percent of all crashes occurred during the peak periods between 6 AM 9 AM and 3 PM 6 PM. More than 80 percent of all crashes occurred on dry pavement. he average crash rate along eastbound I-64 is 152 crashes per 100 Million Vehicle Miles raveled; there are five quarter-mile segments along eastbound I-64 that experience a crash rate more than double the average crash rate. he critical segments are for the most part located on the approaches to the HB Westbound I-64 Crash Analysis A total of 800 crashes were reported along westbound I-64 during the study period. As shown in Figure 3-6, crashes are primarily rear-end crashes (74%), with fixed-object (15%) and sideswipe crashes (7%) being the next most frequent. Although there are some areas along westbound I-64 where there is an increase in crash frequency, the magnitudes of the increases are less pronounced than along eastbound I-64. Areas where there is an increase in crash frequencies along westbound I-64 are near Bayville Street, just upstream from the entry point to the elevated structure of the HB (mile point ) and mile point , which corresponds to the westbound tunnel portal. here was one (1) fatal crash reported along this segment. wo-hundred seventeen (217) crashes (27%) resulted in injuries, while the remaining 582 (73%) crashes resulted in property damage only. Approximately 31 percent of all crashes occurred during the peak periods between 6 AM 9 AM and 3 PM 6 PM, but the time period that experienced the highest number of crashes was 12 PM 3 PM (187 crashes, or 23% of all crashes). More than 80 percent of all crashes occurred on dry pavement. he average crash rate along westbound I-64 is 135 crashes per 100 Million Vehicle Miles raveled; there are six quarter-mile segments along westbound I-64 that experience a crash rate more than double the average crash rate. he critical segments are for the most part located on the approaches to the HB Eastbound I-664 Crash Analysis A total of 531 crashes were reported along eastbound I-664 during the study period. As shown in Figure 3-7, crashes are primarily rear-end crashes (54%), with fixed-object (24%) and sideswipe crashes (11%) being the next most frequent. Crashes along eastbound I-664 are concentrated on the approaches to the MMMB and throughout the MMMB elevated structure and tunnel. All nine (9) critical quarter-mile segments where the average crash rate is more than double the crash rate for the entire eastbound I-664 study area are within this area of the MMMB. here were three (3) fatal crashes reported along this segment. One-hundred fifty-three (153) crashes (29%) resulted in injuries, while the remaining 375 (71%) crashes resulted in property damage only. Approximately 52 percent of all crashes occurred during the peak periods between 6 AM 9 AM and 3 PM 6 PM. Close to 80 percent of all crashes occurred on dry pavement. he average crash rate along eastbound I-664 is 71 crashes per 100 Million Vehicle Miles raveled; as mentioned above, there are nine quarter-mile segments along eastbound I-664 that experience a crash rate more than double the average crash rate Westbound I-664 Crash Analysis A total of 588 crashes were reported along westbound I-664 during the study period. As shown in Figure 3-8, crashes are primarily rear-end crashes (56%), with fixed-object (25%) and sideswipe crashes (11%) being the next most frequent. Unlike crashes along eastbound I-664, there are two quarter-mile segments areas along westbound I-664 that experienced a significantly higher number of crashes between 2012 and 2014 relative to the rest of the section. hese segments are located at mile points 6.0 and 9.0, which correspond to the entry and exit points of the MMMB. here were three (3) fatal crashes reported along this segment. One-hundred seventy-three (173) crashes (29%) resulted in injuries, while the remaining 412 (70%) crashes resulted in property damage only. April
55 raffic and ransportation echnical eport Approximately 44 percent of all crashes occurred during the peak periods between 6 AM 9 AM and 3 PM 6 PM. Close to 80 percent of all crashes occurred on dry pavement. he average crash rate along westbound I-664 is 71 crashes per 100 Million Vehicle Miles raveled; as mentioned above, there are two quarter-mile segments along westbound I-664 that experience a crash rate more than double the average crash rate Eastbound I-564 Crash Analysis A total of 65 crashes were reported along the 3-mile section of eastbound I-564 during the study period. As shown in Figure 3-9, crashes are primarily rear-end crashes (45%), with fixed-object (26%) and sideswipe crashes (12%) being the next most frequent. ear-end crashes on I-564 comprise the lowest share of crashes of all Study Area Corridors, which may indicate a lower degree of congestion compared to other facilities for which crash analyses were performed. Crashes are concentrated near the I-64 interchange. here were no fatal crashes reported along this segment. Sixteen (16) crashes (25%) resulted in injuries, while the remaining 49 (75%) crashes resulted in property damage only. Approximately 45 percent of all crashes occurred during the afternoon peak period between 3 PM and 6 PM. his reflects the heavy directionality of traffic volumes leaving the Navy base in the afternoon. Approximately 65 percent of all crashes occurred on dry pavement. Due to the short distance of this section of I-564, average crash rates were not computed Westbound I-564 Crash Analysis A total of 71 crashes were reported along the 3-mile section of westbound I-564 during the study period. As shown in Figure 3-10, crashes are primarily rear-end crashes (61%), with fixed-object (17%) and sideswipe crashes (13%) being the next most frequent. Crashes are concentrated near the I-64 interchange. here were no fatal crashes reported along this segment. wenty-four (24) crashes (34%) resulted in injuries, while the remaining 47 (66%) crashes resulted in property damage only. Approximately 46 percent of all crashes occurred during the morning peak period between 6 AM and 9 AM. his reflects the heavy directionality of traffic volumes entering the Navy base in the morning (and leaving it in the afternoon). Approximately 70 percent of all crashes occurred on dry pavement. Due to the short distance of this section of I-564, average crash rates were not computed Eastbound VA 164 Crash Analysis Approximately 48 percent of all crashes occurred during the peak periods between 6 AM 9 AM and 3 PM 6 PM. Approximately 65 percent of all crashes occurred on dry pavement. he average crash rate along eastbound VA 164 is 22 crashes per 100 Million Vehicle Miles raveled; there are five quarter-mile segments along eastbound VA 164 that experience a crash rate more than double the average crash rate. he critical segments are for the most part located near the US 58 (Pinners Point) interchange Westbound VA 164 Crash Analysis A total of 55 crashes were reported along westbound VA 164 during the study period. As shown in Figure 3-12, crashes are primarily rear-end crashes (38%), with fixed-object (27%) and sideswipe crashes (11%) being the next most frequent. Westbound VA 164 experiences a comparatively large increase in crashes at mile point 5.75, which is near the West Norfolk oad interchange, and approaching the I-664 interchange. here were no fatal crashes reported along this segment. wenty-seven (27) crashes (49%) resulted in injuries, while the remaining 28 (51%) crashes resulted in property damage only. his is the highest percentage of injury crashes of all roadways being analyzed. Crashes are distributed relatively evenly throughout the day. Approximately 33 percent of all crashes occurred during the peak periods between 6 AM 9 AM and 3 PM 6 PM, but the time period that experienced the highest number of crashes was 12 PM 3 PM (10 crashes, or 18% of all crashes). Approximately 65 percent of all crashes occurred on dry pavement. he average crash rate along westbound VA 164 is 16 crashes per 100 Million Vehicle Miles raveled; there are seven quarter-mile segments along westbound VA 164 that experience a crash rate more than double the average crash rate. he critical segments coincide with the locations where the highest number of crashes occur. A total of 73 crashes were reported along the 7-mile section of eastbound VA 164 during the study period. As shown in Figure 3-11, crashes are primarily rear-end crashes (42%), with fixed-object (21%) and sideswipe crashes (21%) being the next most frequent. Along eastbound VA 164, there is a pronounced increase in the number of crashes between mile points 5.0 and 6.25, which corresponds to the area between the erminal oad, West Norfolk oad, and US 58 (Pinners Point) interchanges, which are key access points to the Port of Virginia. here were no fatal crashes; 29 crashes (40%) resulted in injuries, while the remaining 44 (60%) crashes resulted in property damage only. Crashes along both eastbound and westbound VA 164 involve a larger percentage of injuries than crashes along all other Study Area Corridors, which may indicate higher travel speeds and possibly the involvement of larger vehicles (trucks). April
56 200 Crash ype by Mile Point, Eastbound I Number of crashes Average Crash ate (per 100 MVM) Other Ped Head On Angle Sideswipe Fixed Object ear End Crash ate (per 100MVM) Critical Segment Sideswipe 7% Angle 5% Ped 0% Head On 0% Other 1% Severity By Crash ype ime of Day by Crash ype Severity by Pavement Condition ear End Fixed Object Sideswipe Angle Head On Ped Other Fixed Object 16% ear End 71% 0AM O 3AM O 6AM O 9AM O 12PM O 3PM O 6PM O 9PM O Fatal Injury PDO otal 3AM 6AM 9AM 12PM 3PM 6PM 9PM 12AM otal Fatal Injury PDO otal ear End ear End Dry Fixed Object Fixed Object Slush 1 1 Sideswipe Sideswipe Wet Angle Angle Snowy Head On 3 3 Head On Icy 8 8 Ped 1 1 Ped 1 1 Other 1 1 Other Other Water Grand otal Grand otal Grand otal Crash Summary Eastbound I-64 April 2017 Figure 3-5
57 200 Crash ype by Mile Point, Westbound I Number of crashes Average Crash ate (per 100 MVM) Other Ped Head On Angle Sideswipe Fixed Object ear End Crash ate (per 100MVM) Critical Segment Sideswipe 7% Angle 3% Ped 0% Head On 0% Other 1% Severity By Crash ype ime of Day by Crash ype Severity by Pavement Condition ear End Fixed Object Sideswipe Angle Head On Ped Other Fixed Object 15% ear End 74% 0AM O 3AM O 6AM O 9AM O 12PM O 3PM O 6PM O 9PM O Fatal Injury PDO otal 3AM 6AM 9AM 12PM 3PM 6PM 9PM 12AM otal Fatal Injury PDO otal ear End ear End Dry Fixed Object Fixed Object Wet Sideswipe Sideswipe Snowy 1 1 Angle Angle Icy 5 5 Head On 1 1 Head On 1 1 Water 2 2 Ped 1 1 Ped 1 1 Grand otal Other Other Grand otal Grand otal Crash Summary Westbound I-64 April 2017 Figure 3-6
58 80 Crash ype by Mile Point,Eastbound I Number of crashes Average Crash ate (per 100 MVM) Other Ped Head On Angle Sideswipe Fixed Object ear End Crash ate (per 100MVM) Critical Segment 0 0 ear End Fixed Object Sideswipe Angle Head On Ped Other Sideswipe 11% Fixed Object 24% Angle 6% Ped 0% Head On 1% Other 4% ear End 54% Severity By Crash ype ime of Day by Crash ype Severity by Pavement Condition 0AM O 3AM O 6AM O 9AM O 12PM O 3PM O 6PM O 9PM O Fatal Injury PDO otal 3AM 6AM 9AM 12PM 3PM 6PM 9PM 12AM otal Fatal Injury PDO otal ear End ear End Dry Fixed Object Fixed Object Wet Sideswipe Sideswipe Snowy 4 4 Angle Angle Icy Head On Head On Fluids 2 2 Ped 2 2 Ped Water 1 1 Other Other Grand otal Grand otal Grand otal Crash Summary Eastbound I-664 April 2017 Figure 3-7
59 80 Crash ype by Mile Point, Westbound I Number of crashes Average Crash ate (per 100 MVM) Other Ped Head On Angle Sideswipe Fixed Object ear End Crash ate (per 100MVM) Critical Segment 0 0 Sideswipe 10% Angle 5% Ped 0% Head On 1% Other 3% Severity By Crash ype ime of Day by Crash ype Severity by Pavement Condition ear End Fixed Object Sideswipe Angle Head On Ped Other Fixed Object 25% ear End 56% 0AM O 3AM O 6AM O 9AM O 12PM O 3PM O 6PM O 9PM O Fatal Injury PDO otal 3AM 6AM 9AM 12PM 3PM 6PM 9PM 12AM otal Fatal Injury PDO otal ear End ear End Dry Fixed Object Fixed Object Wet Sideswipe Sideswipe Snowy Angle Angle Icy Head On Head On Fluids Ped 1 1 Ped 1 1 Other Other Other Water Grand otal Grand otal Grand otal Crash Summary Westbound I-664 April 2017 Figure 3-8
60 25 Crash ype by Mile Point, Eastbound I Number of crashes Average Crash ate (per 100 MVM) Other Angle Sideswipe Fixed Object ear End Crash ate (per 100MVM) Angle 11% Other 6% Severity By Crash ype ime of Day by Crash ype Severity by Pavement Condition ear End Sideswipe 12% Fixed Object Sideswipe Angle Other ear End 45% 0AM O 3AM O 6AM O 9AM O 12PM O 3PM O 6PM O 9PM O Fatal Injury PDO otal 3AM 6AM 9AM 12PM 3PM 6PM 9PM 12AM otal Fatal Injury PDO otal ear End ear End Dry Fixed Object Fixed Object Wet Sideswipe Sideswipe Snowy 1 1 Angle Angle Icy 3 3 Other Other Water 1 1 Grand otal Grand otal Grand otal Fixed Object 26% Crash Summary Eastbound I-564 April 2017 Figure 3-9
61 25 Crash ype by Mile Point, Westbound I Number of crashes Average Crash ate (per 100 MVM) Other Head On Angle Sideswipe Fixed Object ear End Crash ate (per 100MVM) Angle Fixed Object Other ear End Sideswipe Other 13% Fixed Object 17% ear End 7% Sideswipe 3% Angle 60% Severity By Crash ype ime of Day by Crash ype Severity by Pavement Condition 0AM O 3AM O 6AM O 9AM O 12PM O 3PM O 6PM O 9PM O Fatal Injury PDO otal 3AM 6AM 9AM 12PM 3PM 6PM 9PM 12AM otal Fatal Injury PDO otal Angle ear End Dry Fixed Object Fixed Object Wet Other Sideswipe Icy ear End Angle Fluids 1 1 Sideswipe Other Water 1 1 Grand otal Grand otal Grand otal Crash Summary Westbound I-564 April 2017 Figure 3-10
62 10 Crash ype by Mile Point,Eastbound VA Number of crashes Average Crash ate (per 100 MVM) Other Head On Angle Sideswipe Fixed Object ear End Crash ate (per 100MVM) Critical Segment Angle 7% Head Other On 4% 5% Severity By Crash ype ime of Day by Crash ype Severity by Pavement Condition ear End Fixed Object Sideswipe Angle Head On Other Sideswipe 21% ear End 42% 0AM O 3AM O 6AM O 9AM O 12PM O 3PM O 6PM O 9PM O Fatal Injury PDO otal 3AM 6AM 9AM 12PM 3PM 6PM 9PM 12AM otal Fatal Injury PDO otal ear End ear End Dry Fixed Object Fixed Object Wet Sideswipe Sideswipe Snowy 1 1 Angle Angle Icy Head On 3 3 Head On Grand otal Other Other Grand otal Grand otal Fixed Object 21% Crash Summary Eastbound VA 164 April 2017 Figure 3-11
63 10 Crash ype by Mile Point,Westbound VA Number of crashes Average Crash ate (per 100 MVM) Other Head On Angle Sideswipe Fixed Object ear End Crash ate (per 100MVM) Critical Segment Other Head On 9% 7% Severity By Crash ype ime of Day by Crash ype Severity by Pavement Condition ear End Fixed Object Sideswipe Angle Head On Other Angle 8% Sideswipe 11% ear End 38% 0AM O 3AM O 6AM O 9AM O 12PM O 3PM O 6PM O 9PM O Fatal Injury PDO otal 3AM 6AM 9AM 12PM 3PM 6PM 9PM 12AM otal Fatal Injury PDO otal ear End ear End Dry Fixed Object Fixed Object Wet Sideswipe Sideswipe Icy Angle Angle Grand otal Head On Head On Other Other Grand otal Grand otal Fixed Object 27% Crash Summary Westbound VA 164 April 2017 Figure 3-12
64 raffic and ransportation echnical eport 3.13 ASSESSMEN OF VEHICE SPEEDS As part of the HCS SEIS, INIX speed data for the I-64 and I-664 corridors within the study area were analyzed. INIX provides average speed data for individual segments (generally between consecutive ramp terminals) in 15- minute increments. Corridor data from March 2011 June 2011 and March 2015 June 2015 were analyzed. Data from two different years were analyzed to assess whether typical weekday travel speeds have decreased since the HB study was performed in Speeds for each segment and each 15-minute period were averaged and crosstabulated by mile point and time period. he results are shown as speed contour plots in Figure 3-13 and Figure hese figures show the average speed on uesdays, Wednesdays and hursdays along the I-64 and I-664 corridors between 5:00 AM and 9:00 PM. In these figures, the mile points are shown on the vertical axis, and time of day is shown along the horizontal axis. he color gradations indicate average speed, with green being the highest and red being the lowest speed. Page intentionally left blank As shown in Figure 3-13, along eastbound I-64, the 2011 and 2015 data show that two pronounced periods with slow traffic occur. Speeds begin to decrease approximately near mile point 266 and do not begin to increase until mile point 270. In 2015, during the AM peak period, speeds through the HB fall below 40 Miles Per Hour (MPH) as early as 6:30 AM and remain below 40 MPH until 10:00 AM. During the PM peak, speeds fall below 40 MPH as early as 3:00 PM and remain below 40 MPH until 6:45 PM. Speeds are below 40 MPH for as many as 9 hours between the times of 5:00 AM and 9:00 PM, and below 20 MPH for as many as 4.5 hours during the day. Comparing the 2011 and 2015 speeds, the periods of low speeds (red and yellow areas) span a longer period of time in 2015 during the AM period and in particular during the PM period. In addition, PM speeds in 2015 are significantly lower (darker red) for a longer period of time compared to 2011, indicating that congestion has increased significantly between 2011 and ikewise, westbound I-64 experiences the lowest speeds during the PM peak, although speeds on the HB are low throughout the day. Speeds fall below 40 MPH as early as 6:30 AM and remain below 40 MPH for most of the day (through 7:30 PM). Speeds are below 40 MPH for as many as 12 hours between the times of 5:00 AM and 9:00 PM, and below 20 MPH for as many as 2.5 hours. Comparing the 2011 and 2015 data in Figure 3-13, it is clear that severe congestion is occurring over a longer distance and in 2015 consistently starts as far south/east as the I-564 interchange. Figure 3-14 shows the speed profile for I-664 between I-64 and I-264. In 2015, speeds at the southern terminus of the study segment fall below 40 MPH by 3:30 PM and remain below 40 MPH until 5:45 PM. More significantly, whereas in 2011 congestion along eastbound I-664 occurred over an approximately one-mile segment, in 2015 the congested area has almost tripled in length. Along westbound I-664, minor congestion is occurring just north of the I-264 interchange. Appendix P contains photographs that illustrate the level of congestion along I-64 during the peak periods. April


.")
 in over which congestion occurs.")


65 EASBOUND I-64 WESBOUND I Eastbound I-64 HB End HB Begin Westbound I-64 HB Begin HB End 2015 Eastbound I-64 HB End HB Begin Westbound I-64 HB Begin HB End Observations Compared to 2011, in 2015 the duration of the congested number of hours has increased in both directions, as well as the extent and severity of the congestion. he increase in the number of hour of congestion is reflected in the earlier start and later ending of the yellow and red bubbles (they are wider). he increase in the extent of congestion is indicated by the longer distance (milepoint interval) in over which congestion occurs. he increase in the severity of congestion is indicated by the significantly lower average speeds seen during the worst of the congestion. Note Speed profiles are based on INIX data obtained for uesdays, Wednesdays and hursdays from March - June in 2011 and Speed (MPH) Comparison of 2011 and 2015 Speed Profiles - I-64 Corridor April 2017 Figure 3-13


.")
 in over which congestion")


66 EASBOUND I-64 WESBOUND I Eastbound I-664 MMMB North MMMB South Westbound I-664 MMMB North MMMB South MMMB North MMMB North 2015 Eastbound I-664 MMMB South Westbound I-664 MMMB South Observations Compared to 2011, in 2015 the duration of the congested number of hours has increased in both directions, as well as the extent and severity of the congestion. he increase in the number of hour of congestion is reflected in the earlier start and later ending of the yellow and red bubbles (they are wider). he increase in the extent of congestion is indicated by the longer distance (milepoint interval) in over which congestion occurs. he increase in the severity of congestion is indicated by the significantly lower average speeds seen during the worst of the congestion. Note Speed profiles are based on INIX data obtained for uesdays, Wednesdays and hursdays from March - June in 2011 and Speed (MPH) Comparison of 2011 and 2015 Speed Profiles - I-664 Corridor April 2017 Figure 3-14
67 raffic and ransportation echnical eport 3.14 CAPACIY ANAYSIS he 2015 peak hour volumes shown in Figure 2-1 were analyzed using the methodologies outlined in Section 2.3. he results of these mainline and intersection capacity analyses are provided in Figure As shown in Figure 3-15, the capacity analyses confirm the existing areas that experience congestion and poor traffic operations. Along I-64, OS F operations occur in both directions during the AM and PM peak hours on the HB. raffic volumes reach capacity (OS E) in isolated locations along the Study Area Corridor, including the weaving segment in both directions west of asalle Avenue, and westbound I-64 near Bay Avenue and Granby Street. Page intentionally left blank Along I-664, poor operations occur during the AM peak hour in the westbound direction of the MMMB as well as through the Bowers Hill interchange area. During the PM peak hour, OS F operations occur on the MMMB in the eastbound direction, and again through the Bowers Hill interchange in both the eastbound and westbound directions. Generally acceptable operating conditions prevail on VA 164 during both peak hours; along I-564, near-capacity conditions (OS E) are experienced during the PM peak hour in the westbound direction. Along I-564, poor operating conditions occur during the PM peak hour in the eastbound direction approaching the off-ramps to ittle Creek oad. April
68 B -Signalized: B (C) A -Signalized: B (B) 224 -Diverge: C (C) 223 -Mainline: C (C) 225 -Mainline: C (C) 226 -Diverge: C (C) 227 -Mainline: C (C) 106 -Mainline: C (C) 107 -Diverge: C (C) 229 -Mainline: B (C) 228 -Weave: F (C) 105 -Merge: C (C) C -Signalized: B (B) 104 -Merge: C (C) 103 -Mainline: C (C) 101 -Mainline: C (B) 102 -Weave: E (F) egend X (X) AM (PM) evel of Service Numbered items correspond to freeway segments, evaluated using HCS 100 series I-64 Eastbound 200 series I-64 Westbound 300 series I-564 Eastbound 400 series I-564 Westbound ettered items correspond to intersections, evaluated using Synchro 2015 Existing evel of Service I-64 Corridor April 2017 Figure
 219 -ane Add: B (C) 111 -Weave: E (C) 218 -Diverge: D (D) H -Signalized: E (B) 114 -Mainline: F (F) 216 -Merge: F (D) 215 -Mainline: F (D) 214 -Diverge: F (D) 115 -Diverge: D (D) 213 -Mainline:")
69 108 -Mainline: B (B) 222 -Merge: C (C) F -Signalized: C (C) 109 -Diverge: B (B) 221 -Mainline: C (C) D -Signalized: C (B) 110 -ane Drop: C (C) 217 -Mainline: F (F) 220 -Weave: B (C) E -Yield Control: B (B) 219 -ane Add: B (C) 111 -Weave: E (C) 218 -Diverge: D (D) H -Signalized: E (B) 114 -Mainline: F (F) 216 -Merge: F (D) 215 -Mainline: F (D) 214 -Diverge: F (D) 115 -Diverge: D (D) 213 -Mainline: D (D) 116 -Mainline: D (D) 117 -Merge: D (D) 112 -Mainline: F (E) 118 -Mainline: D (D) G -Signalized: A (F) 113 -Merge: F (F) egend X (X) AM (PM) evel of Service Numbered items correspond to freeway segments, evaluated using HCS 100 series I-64 Eastbound 200 series I-64 Westbound 300 series I-564 Eastbound 400 series I-564 Westbound ettered items correspond to intersections, evaluated using Synchro 2015 Existing evel of Service I-64 Corridor April 2017 Figure
 123 -Merge: D (E) 210 -Diverge: D (C) 121 -Merge: D (D) 205 -Mainline: D (C) 125 -Weave: D (D) 124 -Mainline: D (D) 209 -Mainline: D (C) 122 -Mainline: D (D) 207")

70 212 -Merge: D (D) I -Stop Control: B (F) 119 -Diverge: D (D) 206 -Merge: E (C) 120 -Mainline: D (C) 208 -Diverge: E (C) J -Stop Control: A (B) 211 -Mainline: D (C) K -Yield Control: B (B) 123 -Merge: D (E) 210 -Diverge: D (C) 121 -Merge: D (D) 205 -Mainline: D (C) 125 -Weave: D (D) 124 -Mainline: D (D) 209 -Mainline: D (C) 122 -Mainline: D (D) 207 -Mainline: D (C) egend X (X) AM (PM) evel of Service Numbered items correspond to freeway segments, evaluated using HCS 100 series I-64 Eastbound 200 series I-64 Westbound 300 series I-564 Eastbound 400 series I-564 Westbound ettered items correspond to intersections, evaluated using Synchro 2015 Existing evel of Service I-64 Corridor April 2017 Figure
71 AK -Signalized: B (D) 404 -Mainline: B (A) 204 -Merge: D (C) 304 -Diverge: A (B) 406 -Mainline: B (A) 305 -Mainline: A (B) 301 -Mainline: A (C) 405 -Diverge: C (A) 403 -Weave: B (A) 302 -Merge: A (D) 203 -Mainline: C (B) 303 -Mainline: A (C) 126 -Diverge: C (E) Merge: D (A) 401 -Mainline: C (A) 202 -Diverge: C (C) 306 -Merge: A (C) 127 -Mainline: C (C) 201 -Mainline: D (C) 307 -Mainline: A (E) 308 -Diverge: B (E) 309 -Mainline: A (D) 128 -Merge: E (F) egend X (X) AM (PM) evel of Service Numbered items correspond to freeway segments, evaluated using HCS 100 series I-64 Eastbound 200 series I-64 Westbound 300 series I-564 Eastbound 400 series I-564 Westbound ettered items correspond to intersections, evaluated using Synchro 2015 Existing evel of Service I-64 Corridor April 2017 Figure
 506 -Merge: C (B) 507 -Mainline: C (B) -Signalized: C (C) 650 -Mainline: B (C) 649 -Diverge: B (C) egend X (X) AM (PM) evel")

72 502 -Merge: D (C) 653 -Diverge: B (C) 503 -Mainline: C (B) 652 -Mainline: B (C) 504 -Diverge: C (B) 505 -Mainline: C (B) M -Signalized: B (C) 651 -Merge: B (C) 506 -Merge: C (B) 507 -Mainline: C (B) -Signalized: C (C) 650 -Mainline: B (C) 649 -Diverge: B (C) egend X (X) AM (PM) evel of Service Numbered items correspond to freeway segments, evaluated using HCS 500 series I-664 Eastbound/Southbound 600 series I-664 Westbound/Northbound ettered items correspond to intersections, evaluated using Synchro 2015 Existing evel of Service I-664 Corridor April 2017 Figure
 P -Stop Control: A (B) 511 -Mainline: B (A) -Signalized: A (B) 512 -Merge: B (B) Q -Signalized: B (B) U -Signalized: C (B) 644 -Mainline: B (C) 513 -Mainline: B (B)")

73 508 -Diverge: C (B) 648 -Mainline: B (C) 509 -Mainline: C (B) O -Signalized: B (B) 647 -Merge: B (C) 646 -Mainline: B (C) N -Signalized: B (A) 510 -Weave: C (B) 645 -Weave: B (C) S -Signalized: A (A) P -Stop Control: A (B) 511 -Mainline: B (A) -Signalized: A (B) 512 -Merge: B (B) Q -Signalized: B (B) U -Signalized: C (B) 644 -Mainline: B (C) 513 -Mainline: B (B) 642 -Mainline: C (E) 643 -Diverge: B (C) -Signalized: B (A) egend X (X) AM (PM) evel of Service Numbered items correspond to freeway segments, evaluated using HCS 500 series I-664 Eastbound/Southbound 600 series I-664 Westbound/Northbound ettered items correspond to intersections, evaluated using Synchro 2015 Existing evel of Service I-664 Corridor April 2017 Figure
 517 -Mainline: B (B) 638 -Mainline: C (C) AF -Signalized: B (B) AE -Signalized: A (B) AD -Signalized: A (B) AC -Signalized: A (A) AB -Signalized: C (C) 518")

74 641 -ane Add: C (E) 514 -Diverge: B (B) 640 -Mainline: C (C) 515 -Mainline: B (A) Y -Signalized: C (B) X -Signalized: A (A) W -Signalized: B (B) 516 -Diverge: B (A) 639 -Weave: C (C) V -Signalized: B (C) 517 -Mainline: B (B) 638 -Mainline: C (C) AF -Signalized: B (B) AE -Signalized: A (B) AD -Signalized: A (B) AC -Signalized: A (A) AB -Signalized: C (C) 518 -Merge: B (B) 637 -Diverge: D (C) AA -Stop Control: A (A) egend X (X) AM (PM) evel of Service Numbered items correspond to freeway segments, evaluated using HCS 500 series I-664 Eastbound/Southbound 600 series I-664 Westbound/Northbound ettered items correspond to intersections, evaluated using Synchro 2015 Existing evel of Service I-664 Corridor April 2017 Figure
 528 -Weave: B (C) 521 -Diverge: B (B) 634 -Mainline: D (C) 629 -Weave: C (B) 529 -Mainline: B (D) 633 -Diverge: D (C) 628 -Mainline: C (C) 522 -ane Drop: B (B) 530 -Merge: B")

75 525 -Mainline: C (F) 632 -Mainline: F (C) 519 -Merge: B (C) 636 -Mainline: D (C) 526 -Diverge: B (D) 631 -Merge: E (C) 527 -Mainline: B (D) 520 -Mainline: C (C) 635 -Merge: D (C) 630 -Mainline: C (C) AG -Stop Control: A (A) 528 -Weave: B (C) 521 -Diverge: B (B) 634 -Mainline: D (C) 629 -Weave: C (B) 529 -Mainline: B (D) 633 -Diverge: D (C) 628 -Mainline: C (C) 522 -ane Drop: B (B) 530 -Merge: B (D) 627 -Diverge: D (C) 523 -Mainline: B (C) 524 -Merge: B (D) 531 -Mainline: A (C) 626 -Mainline: C (B) 525 -Mainline: C (F) egend X (X) AM (PM) evel of Service Numbered items correspond to freeway segments, evaluated using HCS 500 series I-664 Eastbound/Southbound 600 series I-664 Westbound/Northbound ettered items correspond to intersections, evaluated using Synchro 2015 Existing evel of Service I-664 Corridor April 2017 Figure
76 532 -Diverge: B (C) 625 -Merge: D (C) 533 -Mainline: A (C) 624 -Mainline: C (B) 534 -Merge: B (C) BA -Signalized: A (A) 623 -Weave: C (B) 535 -Mainline: B (C) 622 -Mainline: C (B) A -Signalized: A (A) AM -Signalized: C (E) BB -Stop Control: F (F) 536 -Merge: C (D) egend X (X) AM (PM) evel of Service Numbered items correspond to freeway segments, evaluated using HCS 500 series I-664 Eastbound/Southbound 600 series I-664 Westbound/Northbound ettered items correspond to intersections, evaluated using Synchro 2015 Existing evel of Service I-664 Corridor April 2017 Figure
 544 -Weave: C (C) 547 -Diverge: D (D) 610 -Merge: D (C) 539 -Mainline: C (C) 619 -Mainline: C (B) 614 -Weave: C (B) BD -Signalized: A (A) 545")
 540 -Merge: D (D) 618 -Diverge: D (C) 549 -Merge: D (D) 608 -Diverge: D (C) 541 -Mainline: D (D) 617 -Mainline: D (C) 550 -Mainline: D (D) 607")

77 537 -Mainline: B (C) 621 -Weave: C (B) 542 -Diverge: D (D) 616 -Merge: D (C) 611 -Mainline: D (C) 620 -Merge: D (B) 538 -Diverge: C (E) 543 -Mainline: C (D) 615 -Mainline: D (C) 544 -Weave: C (C) 547 -Diverge: D (D) 610 -Merge: D (C) 539 -Mainline: C (C) 619 -Mainline: C (B) 614 -Weave: C (B) BD -Signalized: A (A) 545 -Mainline: C (D) 613 -Mainline: D (C) 548 -Mainline: C (D) 609 -Mainline: C (C) BC -Signalized: B (E) BE -Signalized: A (B) BF -Signalized: A (A) 546 -Merge: D (D) 612 -Diverge: D (C) 540 -Merge: D (D) 618 -Diverge: D (C) 549 -Merge: D (D) 608 -Diverge: D (C) 541 -Mainline: D (D) 617 -Mainline: D (C) 550 -Mainline: D (D) 607 -Mainline: D (C) egend X (X) AM (PM) evel of Service Numbered items correspond to freeway segments, evaluated using HCS 500 series I-664 Eastbound/Southbound 600 series I-664 Westbound/Northbound ettered items correspond to intersections, evaluated using Synchro 2015 Existing evel of Service I-664 Corridor April 2017 Figure
78 551 -Diverge: D (D) 606 -Merge: D (C) 601 -Mainline: A (C) 552 -Mainline: C (C) 553 -Weave: C (C) 605 -Mainline: C (C) AH -Signalized: D (D) 604 -Merge: C (C) 603 -Mainline: C (B) 602 -Weave: F (F) 559 -Mainline: B (B) 554 -Mainline: C (C) 555 -Merge: F (E) 558 -Diverge: F (E) AI -Stop Control: D (C) 556 -Mainline: F (E) 557 -Diverge: C (B) BG -Stop Control: F (F) AJ -Stop Control: B (B) egend X (X) AM (PM) evel of Service Numbered items correspond to freeway segments, evaluated using HCS 500 series I-664 Eastbound/Southbound 600 series I-664 Westbound/Northbound ettered items correspond to intersections, evaluated using Synchro 2015 Existing evel of Service I-664 Corridor April 2017 Figure
79 829 -Weave: A (B) 826 -Mainline: B (C) 830 -Mainline: A (A) 828 -Mainline: A (A) 827 -Diverge: B (C) BA -Signalized: A (A) 825 -Diverge: B (C) 703 -Mainline: A (A) 706 -Merge: C (B) 702 -Weave: A (A) 704 -Merge: B (B) 705 -Mainline: C (B) A -Signalized: A (A) 701 -Mainline: A (A) AM -Signalized: C (E) BB -Stop Control: F (F) egend X (X) AM (PM) evel of Service Numbered items correspond to freeway segments, evaluated using HCS 700 series VA 164 Eastbound 800 series VA 164 Westbound ettered items correspond to intersections, evaluated using Synchro 2015 Existing evel of Service VA 164 Corridor April 2017 Figure
80 AQ -Signalized: B (B) 820 -Mainline: B (C) 819 -Merge: B (C) 818 -Mainline: A (C) 817 -Diverge: B (D) AN -Signalized: B (B) 821 -Diverge: B (D) 822 -Mainline: B (C) 712 -Diverge: C (B) 824 -Mainline: B (C) 711 -Mainline: C (B) 713 -Mainline: B (B) 715 -Mainline: C (B) 716 -Merge: C (B) 823 -Merge: B (C) 710 -Merge: C (B) 714 -Merge: C (B) AP -Signalized: B (A) 709 -Mainline: C (B) 707 -Mainline: C (C) 708 -Diverge: C (C) AO -Signalized: B (C) egend X (X) AM (PM) evel of Service Numbered items correspond to freeway segments, evaluated using HCS 700 series VA 164 Eastbound 800 series VA 164 Westbound ettered items correspond to intersections, evaluated using Synchro 2015 Existing evel of Service VA 164 Corridor April 2017 Figure
81 816 -Mainline: B (C) 815 -Merge: B (C) A -Stop Control: B (B) 717 -Mainline: C (B) AS -Stop Control: B (A) 814 -Mainline: B (C) 718 -Diverge: C (B) 719 -Mainline: B (B) A -Signalized: A (A) 813 -Diverge: B (C) 720 -Merge: C (B) 812 -Mainline: B (D) 721 -Mainline: C (B) AV -Stop Control: B (B) AU -Stop Control: B (B) 811 -Merge: B (C) 722 -Diverge: C (B) 810 -Mainline: B (C) 723 -Mainline: C (B) 809 -Diverge: B (D) 724 -Merge: C (B) 808 -Mainline: B (D) 725 -Mainline: C (B) egend X (X) AM (PM) evel of Service Numbered items correspond to freeway segments, evaluated using HCS 700 series VA 164 Eastbound 800 series VA 164 Westbound ettered items correspond to intersections, evaluated using Synchro 2015 Existing evel of Service VA 164 Corridor April 2017 Figure
 729 -Mainline: B (A) 730 -Merge: B (B) AX -Signalized: C (C) AZ -Signalized: B (B) AY -Signalized: F (B) AW -Signalized: A (A) 802 -Weave: A (B) 731")

82 806 -Mainline: A (B) 807 -ane Drop: B (D) 805 -Merge: B (D) 727 -Diverge: C (B) 726 -ane Add: B (A) 804 -Merge: A (B) 728 -Diverge: B (A) 803 -Mainline: A (B) 729 -Mainline: B (A) 730 -Merge: B (B) AX -Signalized: C (C) AZ -Signalized: B (B) AY -Signalized: F (B) AW -Signalized: A (A) 802 -Weave: A (B) 731 -Weave: A (A) egend X (X) AM (PM) evel of Service Numbered items correspond to freeway segments, evaluated using HCS 700 series VA 164 Eastbound 800 series VA 164 Westbound ettered items correspond to intersections, evaluated using Synchro 2015 Existing evel of Service VA 164 Corridor April 2017 Figure
83 raffic and ransportation echnical eport 4. AENAIVES CONSIDEED A detailed discussion on alternatives development, alternatives considered and alternatives not carried forward is included in the Chapter 2 of the Draft SEIS. Chapter 2 of the Draft SEIS is incorporated by reference in the HCS raffic and ransportation echnical eport. 5. DESIGN YEA 2040 FOECASS AND ANAYSES As discussed in Section 2.4, traffic forecasts were developed using the Hampton oads PO travel demand model. he model output was post-processed to obtain design year 2040 daily and peak hour volumes. hese peak hour volumes were analyzed to obtain peak hour evel of Service (OS) and estimated end-to-end travel time for each Study Area Corridor. he results of these analyses are summarized in Section 5.1; detailed analysis results are provided in Sections 5.3 through 5.7. In addition, upon request from some of the stakeholder agencies, raw model output (for the horizon year 2034) was aggregated to provide additional insight in the operational benefits of each alternative. his information is presented in Section SUMMAY A summary of daily traffic volumes on key roadway links within the study area under each of the alternatives is provided in able 5-1. A comparison of daily traffic volumes on the HB and MMMB for 2015 and 2040 conditions for each alternative is provided in Figure 5-1. A summary of projected OS is provided in able 5-2. A summary of estimated travel times along key Study Area Corridors between major interchanges is provided in able 5-3. It should be noted that the travel time estimates were developed from planning-level capacity analysis output and are intended only to indicate relative changes in travel time between alternatives. Additional and/or different segments could be reported in the Final SEIS depending on the Preferred Alternative. able 5-1: 2040 Daily raffic Volumes at Key oadway Segments oadway Segment Alt A 2040 Alt B 2040 Alt C 2040 Alt D No-Build HB 91, , , , , ,200 MMMB, north of I-664C 69,300 90,700 89,200 83, , ,900 MMMB, south of I-664C 69,300 90,700 89,200 83, , ,700 VA 164* 49,000 65,600 64,000 78,400 54,000 55,700 VA 164C ,800 29,400 31,000 I-564C ,800 89,600 86,400 I-664C ,800 65,800 * Between the owne Point oad and College Drive Interchanges April


84 raffic and ransportation echnical eport 160, , ,000 Figure 5-1: 2040 Projected Daily raffic Volumes at the HB and MMMB Figure 5-3 presents a summary of the projected mainline OS. his summary is provided in the same format as the volume exhibit in Figure 5-2, and shows the projected mainline OS as well as the projected OS for each merge, diverge, and weaving area along all Study Area Corridors for each alternative. Mainline average travel speeds, which are the basis for summaries in able 5-3, are presented in Figure 5-4. able 5-4 presents the intersection OS for all ramp terminal intersections for the Existing, 2040 No-Build, and 2040 Build Alternatives. oadway Segment able 5-2: 2040 Projected OS at Key oadway Segments AM Peak Eastbound Westbound Existing 2040 NB 2040 Alt A 2040 Alt B 2040 Alt C 2040 Alt D Existing 2040 NB 2040 Alt A 2040 Alt B 2040 Alt C HB F F F F F E F F F F F E MMMB C C C C A A F F F F B B VA 164 C D D C C B B C C B B B VA 164C C A A B A A I-564C C C C B C C I-664C C C C B oadway Segment 100,000 80,000 60,000 40,000 20, NB 2040 A 2040 B 2040 C 2040 D HB MMMB, north of I-664C PM Peak Eastbound Westbound Existing 2040 NB 2040 Alt A 2040 Alt B 2040 Alt C 2040 Alt D Existing 2040 NB 2040 Alt A 2040 Alt B 2040 Alt C HB F F F F F E F F F D F D MMMB F F F F B B C F F F A A VA 164 C C C C C B C D D C C B VA 164C B A A C A A I-564C B C C C D C I-664C C C C C 2040 Alt D 2040 Alt D able 5-3: 2040 Estimated End-to-End ravel imes by Study Area Corridor Segment Direction AM Peak ravel ime (minutes/vehicle) Existing 2040 NB 2040 Alt A 2040 Alt B 2040 Alt C 2040 Alt D I-64 I-664 (I-64 to VA 164) I-664 (VA 164 to I- 264) VA 164 I-564; I-664 and I- 564 Connectors Eastbound Westbound Eastbound Westbound Eastbound Westbound Eastbound Westbound Eastbound Westbound I-564; I-564 and VA Eastbound Connectors Westbound Segment Direction PM Peak ravel ime (minutes/vehicle) Existing 2040 NB 2040 Alt A 2040 Alt B 2040 Alt C 2040 Alt D I-64 I-664 (I-64 to VA 164) I-664 (VA 164 to I- 264) VA 164 I-564; I-664 and I- 564 Connectors I-564; I-564 and VA 164 Connectors Eastbound Westbound Eastbound Westbound Eastbound Westbound Eastbound Westbound Eastbound Westbound Eastbound Westbound Figure 5-2 shows the mainline volume for each roadway segment along the Study Area Corridors for the Existing, 2040 No-Build, and 2040 Build Alternatives. April
85 I-64 AM PEAK VOUMES AENAIVES COMPAISON I-64 PM PEAK VOUMES AENAIVES COMPAISON EASBOUND WESBOUND EASBOUND WESBOUND Existing 2040 NB 2040 Alt A 2040 Alt B 2040 Alt C 2040 Alt D Existing 2040 NB 2040 Alt A 2040 Alt B 2040 Alt C 2040 Alt D Existing 2040 NB 2040 Alt A 2040 Alt B 2040 Alt C 2040 Alt D Existing 2040 NB 2040 Alt A 2040 Alt B 2040 Alt C 2040 Alt D I-664 NB ,270 4,200 4,570 4,490 3,910 4,270 2,995 4,030 4,310 4,315 3,505 3, I-664 SB I-664 NB ,805 3,785 4,025 4,030 3,335 3,760 3,470 4,370 4,695 4,700 4,065 4, I-664 SB ,085 5,060 5,425 5,335 4,755 5,055 4,550 5,655 5,920 5,915 5,105 5, ,935 4,985 5,215 5,205 4,510 4,850 4,205 5,145 5,460 5,460 4,825 5, asalle Avenue SB 455 3,555 4,510 5,010 4,805 4,260 4,645 3,475 4,155 4,540 4,415 3,605 3, Armistead Ave EB/a Salle Ave asalle Avenue SB 455 3,445 4,480 4,845 4,715 4,055 4,475 3,320 3,925 4,345 4,240 3,605 4, Armistead Ave EB/a Salle Ave asalle Avenue NB 1080 (merge) 3,625 4,610 5,130 4,920 4,360 4,765 (diverge) 1500 asalle Avenue NB 1080 (merge) 3,605 4,710 5,125 4,980 4,285 4,755 (diverge) ,545 4,260 4,675 4,545 3,715 4,100 3,400 4,040 4,490 4,380 3,725 4, (merge) 645 Armistead Ave WB 200 (merge) 645 Armistead Ave WB 3,660 4,645 5,165 4,955 4,395 4,800 3,645 4,750 5,170 5,020 4,325 4, (diverge) (diverge) (diverge) 200 (diverge) 3,815 4,660 5,160 5,005 4,110 4,560 3,710 4,500 5,025 4,910 4,180 4, ip ap d ,580 3,475 3,880 3,785 3,180 3,545 ip ap d ,605 3,625 3,960 3,895 3,150 3, (diverge) (merge) (diverge) (merge) 1500 yler St / Settlers anding d 1435 (lane drop) 1,915 2,650 3,240 3,080 2,405 2,835 3,100 3,810 4,465 4,200 3,140 3, Settlers anding d yler St / Settlers anding d 1435 (lane drop) 1,975 2,805 3,360 3,230 2,400 2,955 2,970 3,520 4,140 3,965 3,150 3, Settlers anding d ,780 3,530 4,350 4,150 3,205 3,875 3,405 4,210 4,895 4,650 3,575 4, ,705 3,550 4,400 4,170 3,095 3,940 3,455 4,150 4,825 4,685 3,840 4, S. Mallory St ,675 3,385 4,200 4,000 3,055 3,720 3,045 3,835 4,545 4,290 3,250 3,825 (lane add) 605 S. Mallory St S. Mallory St ,640 3,450 4,285 4,060 2,980 3,825 2,950 3,615 4,365 4,180 3,365 3,875 (lane add) 605 S. Mallory St 1500 (merge) (diverge) (merge) (diverge) 1500 HB ,440 4,175 4,815 4,765 3,635 4,315 3,370 4,250 4,975 4,690 3,605 4, HB HB ,445 4,285 4,970 4,865 3,575 4,475 3,155 3,915 4,710 4,485 3,630 4, HB 1500 (diverge) (merge) (diverge) (merge) 1500 Bayville St 200 3,410 4,135 4,775 4,725 3,595 4,275 3,320 4,185 4,910 4,625 3,540 4, W. Ocean View Ave Bayville St 200 3,340 4,150 4,835 4,730 3,440 4,360 3,110 3,860 4,655 4,430 3,575 4, W. Ocean View Ave 1500 (merge) (diverge) (merge) (diverge) ,480 4,205 4,845 4,795 3,665 4,345 3,330 4,195 4,920 4,635 3,550 4,200 3,390 4,200 4,885 4,780 3,490 4,425 3,150 3,910 4,705 4,480 3,625 4, (diverge) (merge) (diverge) (merge) th View St ,080 3,685 4,275 4,230 3,175 3,815 2,885 3,670 4,345 4,035 3,080 3, th View St 4th View St ,955 3,630 4,260 4,160 2,960 3,840 2,340 3,020 3,695 3,485 2,805 3, th View St 1500 (merge) (diverge) (merge) (diverge) 1500 W. Bay Ave ,360 3,985 4,580 4,565 3,445 4,190 3,005 3,825 4,500 4,205 3,225 3, W. Bay Ave W. Bay Ave ,120 3,810 4,430 4,345 3,115 4,080 2,450 3,160 3,825 3,640 2,935 3, W. Bay Ave 1500 (merge) (diverge) (merge) (diverge) ,465 4,390 5,045 4,715 3,795 4,420 2,545 3,275 3,935 3,745 3,030 3, Patrol d ,660 4,290 4,875 4,865 3,700 4,425 (merge) 1500 Patrol d ,000 4,710 5,290 5,225 3,860 4,770 (merge) ,110 4,030 4,520 4,185 3,405 3,975 2,120 2,840 3,310 3,120 2,590 3, Granby St 1840 Granby St ,020 4,650 5,240 5,225 4,060 4,785 (merge) ,605 5,315 5,895 5,830 4,465 5,375 (merge) 1500 I-564 / US 460 I-64 HOV I-564 I-564 / US 460 I-64 HOV I-564 2,825 3,405 4,110 3,980 3,105 3,695 3,915 4,655 5,265 5,160 3,970 4,780 2,370 2,965 3,525 3,150 2,465 2, ,625 2,130 2,730 2,455 2,050 2, (diverge) US (diverge) US 460 I I-64 HOV 2,825 3,405 4,110 3,980 3,105 3,695 (diverge) 1500 I I-64 HOV 2,760 3,345 3,730 3,645 2,740 3,330 (diverge) ,720 3,315 3,935 3,575 2,960 3,425 1,985 2,490 3,150 2,890 2,560 2, (merge) 3,710 4,350 5,440 5,445 4,880 5, (merge) 5,550 6,320 6,660 6,990 6,755 7, Notes Peak hour mainline volumes 2015 volumes based on 2015 traffic count data I-64 Alternatives Comparison Peak Hour Volumes April 2017 Figure 5-2.1
86 I-564 AM PEAK VOUMES AENAIVES COMPAISON I-564 PM PEAK VOUMES AENAIVES COMPAISON EASBOUND WESBOUND EASBOUND WESBOUND Existing 2040 NB 2040 Alt A 2040 Alt B 2040 Alt C 2040 Alt D Existing 2040 NB 2040 Alt A 2040 Alt B 2040 Alt C 2040 Alt D Existing 2040 NB 2040 Alt A 2040 Alt B 2040 Alt C 2040 Alt D Existing 2040 NB 2040 Alt A 2040 Alt B 2040 Alt C 2040 Alt D Bainbridge Ave/Bellinger Blvd ,370 1,365 1, ,025 1, Bainbridge Ave/Bellinger Blvd Bainbridge Ave/Bellinger Blvd 670 2,030 1,805 1,935 1,330 1,905 1, Bainbridge Ave/Bellinger Blvd (merge) (diverge) (merge) (diverge) Intermodal Connector ,165 2,000 1,440 1,675 1, Intermodal Connector Intermodal Connector ,705 2,755 2,145 2,690 2, Intermodal Connector (2040 NB and Build Alternatives) (2040 NB and Build Alternatives) (2040 NB and Build Alternatives) (2040 NB and Build Alternatives) 385 3, (merge) (diverge) (merge) (diverge) ,060 1,175 1,500 1,515 2, ,790 3,840 4,433 5,655 5, ,855 2,690 3,475 3,990 4, ,085 1, (diverge) (diverge) 1465 erminal Blvd ,385 1,380 erminal Blvd erminal Blvd ,370 3,175 3,240 3,588 4,900 4,767 erminal Blvd 350 (merge) 3,640 4,275 4,050 4,845 5,245 5, (merge) 1,230 1,415 1,370 1,725 1,765 1, ,050 1,435 1,610 1,920 1,900 3,040 3,305 3,300 3,930 4,470 4,430 3,945 4,315 4,510 5,088 6,120 5, ,015 1,295 1,400 1, (merge) 950 I-64 EB 700 (merge) 950 I-64 EB US US 460 (diverge) NB (diverge) NB 2,695 2,980 2,915 3,455 3,975 3, ,060 1,155 1,150 W ittle Creek d ,330 1,465 1,775 1, W ittle Creek d ,675 3,980 4,175 4,623 5,645 5,472 Notes Peak hour mainline volumes 2015 volumes based on 2015 traffic count data I-564 Alternatives Comparison Peak Hour Volumes April 2017 Figure 5-2.2
87 I-664 AM PEAK VOUMES AENAIVES COMPAISON I-664 AM PEAK VOUMES AENAIVES COMPAISON (CONINUED) EASBOUND WESBOUND EASBOUND WESBOUND Existing 2040 NB 2040 Alt A 2040 Alt B 2040 Alt C 2040 Alt D Existing 2040 NB 2040 Alt A 2040 Alt B 2040 Alt C 2040 Alt D Existing 2040 NB 2040 Alt A 2040 Alt B 2040 Alt C 2040 Alt D Existing 2040 NB 2040 Alt A 2040 Alt B 2040 Alt C 2040 Alt D I ,555 1,625 1,610 1,600 1,600 1,490 2,295 3,015 2,785 2,770 3,190 3, I-64 MACHINE A ,105 2,755 2,490 2,375 2,945 2,960 3,485 4,590 4,435 4,330 5,055 5, MACHINE A (merge) (diverge) (diverge) (merge) 4,365 5,345 5,090 5,065 5,585 5,280 3,110 3,875 3,640 3,615 4,035 3,935 1,380 1,875 1,675 1,390 2,125 2,100 2,795 3,780 3,670 3,400 4,500 4, VA VA 164 WB 1500 (diverge) (merge) (merge) 3,260 4,370 4,360 4,075 5,190 5, Power Plant Pkwy/Powhatan Pkwy ,060 5,030 4,785 4,760 5,270 4,970 2,635 3,390 3,165 3,150 3,585 3, Power Plant Pkwy/Powhatan Pkwy US ,885 2,510 2,295 2,110 2,585 2,555 2,955 3,885 3,885 3,625 4,425 4, US 17/VA 164 EB 1500 (merge) (diverge) (merge) 4,345 5,375 5,140 5,095 5,645 5,350 2,870 3,680 3,460 3,440 3,885 3,800 2,855 3,705 3,615 3,445 3,955 3,915 3,720 4,855 4,860 4,710 5,270 5, (diverge) (merge) (diverge) Aberdeen d 3,315 4,285 4,280 4,130 4,690 4, ,730 4,575 4,365 4,315 4,830 4,570 2,560 3,300 3,095 3,075 3,520 3, Aberdeen d (merge) 1500 Pughsville d WB Pughsville d ,370 2,995 2,870 2,725 3,170 3,120 3,205 4,100 4,105 3,940 4,485 4, ,985 4,945 4,725 4,665 5,260 4,960 2,785 3,625 3,410 3,380 3,865 3, Pughsville d EB Chestnut Ave/oanoke Ave ,195 4,025 3,930 3,775 4,505 4,200 2,550 3,325 3,145 3,105 3,620 3, Chestnut Ave/oanoke Ave 1500 (merge) (diverge) ,150 4,020 3,890 3,720 4,195 4,135 3,710 4,725 4,755 4,555 5,120 5, (merge) (diverge) ,280 4,175 4,050 3,890 4,680 4,330 2,670 3,505 3,325 3,275 3,880 3, (diverge) (merge) ,870 3,615 3,490 3,315 3,770 3,710 3,465 4,385 4,425 4,220 4,770 4, (diverge) (merge) 1500 Portsmouth Blvd WB Portsmouth Blvd WB 35th St ,390 3,155 3,015 2,850 3,700 3, ,160 4,010 3,875 3,700 4,140 4,075 3,615 4,595 4,645 4,440 4,980 4, ,280 3,105 2,900 2,850 3,470 3, th St/36th St 2,935 3,695 3,565 3,390 3,815 3,750 3,455 4,365 4,415 4,210 4,730 4, (diverge) Portsmouth Blvd EB Portsmouth Blvd EB 26th St 3,140 4,040 3,880 3,765 4,685 4, (merge) (diverge) ,740 2,200 2,055 1,930 2,695 2,455 3,225 4,110 3,975 3,805 4,230 4, th St 3,795 4,825 4,880 4,670 5,160 5, ,920 3,745 3,600 3,490 4,320 4, US 60 US (merge) 2,190 2,755 2,560 2,455 3,265 3, (diverge) (merge) ,100 3,855 3,705 3,535 3,920 3,855 3,380 4,245 4,290 4,075 4,545 4, (merge) (diverge) 1500 Dock anding d Dock anding d 2,325 2,975 2,770 2,630 3,570 3,335 3,265 4,225 4,120 3,965 5,020 4, (merge) (diverge) ,525 4,385 4,225 4,040 4,385 4,320 3,530 4,495 4,560 4,335 4,770 4, (diverge) (merge) erminal Ave 585 2,240 2,870 2,725 2,545 3,525 3, (diverge) (merge) ,245 4,160 4,105 3,945 5,005 4, erminal Ave erminal Ave 1005 (lane drop) US 58 SB 480 2,870 3,515 3,320 3,105 3,365 3,305 3,255 3,975 4,060 3,835 4,185 4, US 58 SB 1500 (merge) (diverge) ,900 3,555 3,360 3,145 3,395 3,335 (merge) 1500 MMMB 3,580 3,345 5,095 4,945 MMMB US 58 NB ,670 3,225 3,030 2,820 3,020 2,965 2,550 3,010 3,070 2,850 3,170 3, US 58 NB 490 (merge) I-664 Connector ,290 2,960 2,760 2,595 2,285 2,365 3,325 4,310 4,175 4,025 3,900 4, I-664 Connector ,120 6,215 6,025 5,745 5,890 5,795 4,095 4,780 4,840 4,525 4,605 4,565 (Build Alternatives C and D) (Build Alternatives C and D) (diverge) MMMB 3,305 3,300 4,990 5,040 MMMB S Military Hwy 4, (diverge) 5,595 5,425 5,155 5,250 5,185 1,870 2,300 1,980 1,870 1,880 1,860 1,195 1,295 1,205 1,195 1,180 1, (diverge) (merge) 1500 I-64 SB I-64 NB College Dr NB 220 2,120 2,720 2,500 2,350 2,955 2,970 2,850 3,650 3,470 3,385 4,265 4, College Dr NB ,305 2,980 2,775 2,610 3,230 3,245 3,020 3,930 3,740 3,665 4,545 4, College Dr SB 630 1,980 2,555 2,295 2,175 2,730 2,745 2,885 3,735 3,535 3,470 4,310 4, College Dr SB 1500 (merge) (diverge) ,105 2,755 2,490 2,375 2,945 2,960 3,485 4,590 4,435 4,330 5,055 5,095 MACHINE A MACHINE A Notes Peak hour mainline volumes 2015 volumes based on 2015 traffic count data I-664 Alternatives Comparison AM Peak Hour Volumes April 2017 Figure 5-2.3
88 I-664 PM PEAK VOUMES AENAIVES COMPAISON I-664 PM PEAK VOUMES AENAIVES COMPAISON (CONINUED) EASBOUND WESBOUND EASBOUND WESBOUND Existing 2040 NB 2040 Alt A 2040 Alt B 2040 Alt C 2040 Alt D Existing 2040 NB 2040 Alt A 2040 Alt B 2040 Alt C 2040 Alt D Existing 2040 NB 2040 Alt A 2040 Alt B 2040 Alt C 2040 Alt D Existing 2040 NB 2040 Alt A 2040 Alt B 2040 Alt C 2040 Alt D I ,500 4,470 4,255 4,235 4,880 4, I-64 MACHINE A ,365 4,435 4,225 4,145 4,615 4,715 2,560 3,300 3,180 3,185 3,570 3, MACHINE A ,365 4,435 4,225 4,145 4,615 4,715 2,560 3,300 3,180 3,185 3,570 3, (merge) (diverge) (diverge) (merge) 2,510 3,165 2,960 2,945 3,275 3,100 4,630 5,670 5,445 5,410 6,055 5,710 2,275 3,050 2,915 2,655 3,300 3,350 1,680 2,275 2,210 2,005 2,740 2, VA VA 164 WB 1500 (diverge) (merge) (merge) 2,785 3,695 3,540 3,385 3,765 3,810 2,195 2,940 2,975 2,750 3,515 3, Power Plant Pkwy/Powhatan Pkwy ,030 2,665 2,465 2,465 2,775 2,595 4,190 5,225 5,005 4,980 5,605 5, Power Plant Pkwy/Powhatan Pkwy US ,785 3,695 3,540 3,385 3,765 3,810 2,100 2,790 2,825 2,610 3,275 3, US 17/VA 164 EB 1500 (merge) (diverge) (merge) 3,670 4,790 4,735 4,600 5,105 5,140 2,275 2,960 2,780 2,750 3,100 2,925 4,630 5,745 5,560 5,525 6,180 5,825 3,670 4,790 4,735 4,600 5,105 5,140 2,820 3,710 3,730 3,610 4,110 3, (diverge) (merge) (diverge) 3,670 4,790 4,735 4,600 5,105 5,140 Aberdeen d 2,525 3,290 3,305 3,185 3,685 3, ,900 2,490 2,330 2,295 2,605 2,445 4,140 5,120 4,955 4,945 5,480 5, Aberdeen d (merge) 1500 Pughsville d WB Pughsville d ,930 3,710 3,655 3,540 3,950 3,975 2,440 3,150 3,170 3,040 3,530 3, ,135 2,810 2,665 2,615 2,990 2,790 4,435 5,520 5,365 5,345 5,890 5, Pughsville d EB Chestnut Ave/oanoke Ave ,840 2,445 2,365 2,285 2,675 2,470 3,905 4,855 4,775 4,755 5,280 4, Chestnut Ave/oanoke Ave 1500 (merge) 3,310 4,205 4,135 4,020 4,465 4,485 3,125 4,010 3,995 3,865 4,400 4,235 (diverge) ,310 4,205 4,135 4,020 4,465 4,485 3,125 4,010 3,995 3,865 4,400 4, (merge) (diverge) 1,940 2,600 2,515 2,435 2,975 2,640 3,990 4,975 4,900 4,875 5,465 5, (diverge) 3,310 4,205 4,135 4,020 4,465 4,485 3,125 4,010 3,995 3,865 4,400 4,235 (merge) ,095 3,895 3,825 3,710 4,140 4,160 2,840 3,610 3,605 3,470 3,990 3, (diverge) (merge) Portsmouth Blvd WB Portsmouth Blvd WB 35th St ,660 2,275 2,185 2,105 2,650 2, ,505 4,455 4,375 4,255 4,660 4,675 3,110 3,990 3,975 3,845 4,360 4, ,805 3,770 3,660 3,635 4,265 3, th St/36th St 3,195 4,020 3,970 3,845 4,210 4,225 2,935 3,740 3,725 3,595 4,085 3, (diverge) Portsmouth Blvd EB Portsmouth Blvd EB 26th St 3,360 4,360 4,305 4,240 5,020 4, (merge) 3,450 4,440 4,385 4,280 4,725 4,570 (diverge) ,290 1,745 1,675 1,585 2,075 1,785 3,370 4,270 4,215 4,095 4,470 4, th St 3,450 4,440 4,385 4,280 4,725 4, ,650 3,365 3,290 3,260 3,915 3, US 60 US (merge) 1,710 2,265 2,170 2,075 2,670 2, (diverge) 3,450 4,440 4,385 4,280 4,725 4,570 (merge) ,155 3,865 3,810 3,680 3,970 3,985 3,275 4,195 4,135 4,025 4,465 4, (merge) (diverge) 1500 Dock anding d Dock anding d 2,505 3,265 3,440 3,150 4,200 3,880 2,745 3,495 3,450 3,395 4,125 3, (merge) 3,325 4,075 4,005 3,880 4,175 4,190 3,550 4,630 4,550 4,450 4,865 4,695 (diverge) ,325 4,075 4,005 3,880 4,175 4,190 3,550 4,630 4,550 4,450 4,865 4, (diverge) (merge) erminal Ave 585 2,480 3,235 3,425 3,125 4,185 3, (diverge) 3,325 4,075 4,005 3,880 4,175 4,190 3,550 4,630 4,550 4,450 4,865 4,695 (merge) ,690 3,430 3,400 3,340 4,075 3, erminal Ave erminal Ave 1005 (lane drop) US 58 SB 480 2,575 3,080 2,985 2,830 3,005 3,030 3,265 4,095 4,035 3,935 4,260 4, US 58 SB 1500 (merge) (diverge) ,600 3,115 3,020 2,865 3,030 3,055 3,265 4,095 4,035 3,935 4,260 4,105 (merge) 1500 MMMB 4,640 4,320 4,125 3,705 MMMB US 58 NB ,415 2,850 2,775 2,620 2,725 2,760 2,675 3,290 3,210 3,115 3,415 3, US 58 NB 490 (merge) 3,890 4,640 4,550 4,370 4,470 4,480 I-664 Connector ,195 4,150 3,940 3,840 3,370 3,235 2,745 3,530 3,450 3,395 2,795 2, I-664 Connector ,890 4,640 4,550 4,370 4,470 4,480 5,185 6,170 5,980 5,820 5,750 5,605 (Build Alternatives C and D) (Build Alternatives C and D) (diverge) 3,890 4,640 4,550 4,370 4,470 4,480 MMMB 4,475 4,555 3,920 3,860 MMMB S Military Hwy 3, (diverge) 4,075 4,025 3,845 3,845 3,885 1,350 1,565 1,385 1,350 1,275 1,350 2,210 2,640 2,315 2,285 2,280 2, (diverge) (merge) 1500 I-64 SB I-64 NB College Dr NB 220 3,100 4,015 3,795 3,705 4,250 4,340 2,360 2,995 2,875 2,875 3,285 3, College Dr NB ,590 4,710 4,530 4,405 4,985 5,070 2,450 3,145 3,020 3,025 3,435 3, College Dr SB 630 3,195 4,165 3,960 3,875 4,335 4,435 2,345 2,995 2,860 2,875 3,250 3, College Dr SB 1500 (merge) (diverge) ,365 4,435 4,225 4,145 4,615 4,715 2,560 3,300 3,180 3,185 3,570 3,505 MACHINE A MACHINE A Notes Peak hour mainline volumes 2015 volumes based on 2015 traffic count data I-664 Alternatives Comparison PM Peak Hour Volumes April 2017 Figure 5-2.4
89 VA 164 AM PEAK VOUMES AENAIVES COMPAISON VA 164 PM PEAK VOUMES AENAIVES COMPAISON EASBOUND WESBOUND EASBOUND WESBOUND Existing 2040 NB 2040 Alt A 2040 Alt B 2040 Alt C 2040 Alt D Existing 2040 NB 2040 Alt A 2040 Alt B 2040 Alt C 2040 Alt D Existing 2040 NB 2040 Alt A 2040 Alt B 2040 Alt C 2040 Alt D Existing 2040 NB 2040 Alt A 2040 Alt B 2040 Alt C 2040 Alt D US 17/Bridge d ,140 1,710 1,720 2,070 2,030 2, ,080 1,115 1,065 1, I-664 SB US 17/Bridge d ,125 1,105 1,120 1,230 1,690 1,785 1,955 1,795 1, I-664 SB ,300 1,900 1,890 2,240 2,220 2,250 1,230 1,600 1,700 1,835 1,525 1, ,025 1,020 1,245 1,240 1,255 1,740 2,335 2,410 2,685 2,260 2, I ,415 1,415 1,790 1,455 1, ,010 1,010 1, I-664 NB I ,105 1,000 1,010 1,225 1,670 1,645 1,940 1,485 1, I-664 NB 1500 (merge) (diverge) (merge) (diverge) 1500 College Dr 585 2,095 2,750 2,685 3,325 2,505 2,550 1,455 1,820 1,775 2,090 1,390 1, College Dr College Dr 585 1,735 2,225 2,140 2,650 1,975 2,030 2,105 2,695 2,615 3,120 2,315 2, College Dr 1500 (merge) (diverge) (merge) (diverge) ,365 3,115 3,040 3,705 2,835 2,890 1,860 2,350 2,290 2,650 1,865 1,935 2,150 2,790 2,700 3,240 2,500 2,570 2,635 3,390 3,270 3,860 2,930 3, (diverge) (merge) (diverge) (merge) 1500 owne Point d ,100 2,780 2,705 3,355 2,505 2,550 1,345 1,690 1,605 2,010 1,295 1, owne Point d owne Point d ,575 2,050 1,960 2,475 1,780 1,830 2,280 2,965 2,825 3,445 2,550 2, owne Point d 1500 (merge) (diverge) (merge) (diverge) ,690 3,455 3,340 4,055 3,080 3,135 1,570 1,965 1,845 2,285 1,535 1,595 1,935 2,450 2,340 2,885 2,130 2,185 2,915 3,670 3,490 4,240 3,220 3, (diverge) (merge) (diverge) (merge) 1500 Cedar n SB ,915 2,385 2,280 1,095 1,305 1,220 1, , Cedar n Cedar n SB ,425 1,765 1,660 2,425 3,020 2,850 3,575 2,615 2, Cedar n (Existing and 2040 NB) (Existing and 2040 NB) (merge) (diverge) (merge) (diverge) 3,045 2,220 2,240 1,925 1,305 1,355 2,190 1,560 1,580 3,925 2,985 3,065 Cedar n NB 110 2,115 2,630 2,570 Cedar n NB 110 1,550 1,920 1,845 (Existing and 2040 NB) (Existing and 2040 NB) Craney Island Connector Craney Island Connector 1,365 1,640 1, ,745 3,380 3,190 2,750 2,355 2, (merge) 1300 (Build Alternatives) 1000 (merge) 1300 (Build Alternatives) 2,190 2,765 2,710 1,610 2,025 1, Craney Island Connector Craney Island Connector (Build Alternatives) 1000 (diverge) (merge) 1000 (Build Alternatives) 1000 (diverge) (merge) 1000 Virginia International Gateway Blvd ,045 2,590 2,565 2,020 1,705 1,710 1,270 1,545 1, Virginia International Gateway Blvd Virginia International Gateway Blvd ,570 1,975 1,915 1,435 1,085 1,100 2,655 3,270 3,095 2,670 2,270 2, Virginia International Gateway Blvd (Existing and 2040 NB) (Existing and 2040 NB) (merge) (diverge) (merge) (diverge) Craney Island Connector 475 2,160 2,710 2,710 1,415 1,725 1,615 1,955 1,350 1, Craney Island Connector 475 1,670 2,105 2,045 2,710 3,335 3,160 3,490 2,770 2, (Build Alternatives) (Build Alternatives) (diverge) 2,825 2,705 2,715 (merge) (diverge) 2,590 1,960 1,960 (merge) W. Norfolk d 625 2,090 2,610 2,610 2,610 2,610 2,610 1,315 1,605 1,485 1,565 1,235 1, W Norfolk d W. Norfolk d 625 1,575 1,975 1,915 2,245 1,850 1,845 2,630 3,235 3,050 3,205 2,665 2, W Norfolk d 1500 (merge) (diverge) (merge) (diverge) ,475 3,170 3,160 3,005 2,960 2,885 1,705 2,170 2,115 2,380 2,005 1, ,405 1,740 1,650 1,675 1,345 1,395 (lane drop) 415 2,860 3,565 3,380 3,445 2,890 2,870 (lane drop) (lane add) (lane add) (lane drop) (merge) (lane drop) (merge) ,725 2,340 2,370 2,255 2,430 2, ,300 1,285 1,595 1,455 1,510 1,735 2,250 2,120 2,320 2,030 2,150 (diverge) 1375 US 58 EB (merge) 1050 US 58 SB (diverge) 1375 US 58 EB (merge) 1050 US 58 SB ee Ave/ailroad Ave 1500 US 58 WB 1,275 1,845 1,875 1,695 1,870 1, ailroad Ave/US 58 NB ee Ave/ailroad Ave 1500 US 58 WB 720 1,080 1,065 1,345 1,205 1,260 1,430 1,875 1,745 1,945 1,655 1, ailroad Ave/US 58 NB ee Ave / Harper Ave ee Ave / Harper Ave 1500 (merge) 1,585 2,205 2,230 2,005 2,165 2,135 1,325 1,530 1,470 1,565 1,270 1, (merge) 1,065 1,480 1,460 1,690 1,535 1,550 1,925 2,385 2,255 2,445 2,080 2, ,655 2,310 2,335 2,110 2,270 2, ,175 1,635 1,615 1,845 1,690 1, ondon Blvd ondon Blvd Notes Peak hour mainline volumes 2015 volumes based on 2015 traffic count data VA 164 Alternatives Comparison Peak Hour Volumes April 2017 Figure 5-2.5
90 JAMES IVE CONNECOS AM PEAK VOUMES AENAIVE B JAMES IVE CONNECOS AM PEAK VOUMES AENAIVES C & D WESBOUNDEASBOUND WESBOUND EASBOUND 2040 Alt B 2040 Alt B 2040 Alt C 2040 Alt D 2040 Alt C 2040 Alt D , ,315 2,245 1,305 1, (diverge) (merge) (diverge) (merge) 1500 Hampton Blvd , Hampton Blvd Hampton Blvd ,545 1, Hampton Blvd 1500 (merge) (diverge) (merge) (diverge) ,650 2,155 2,440 2,400 2,560 2, (diverge) (merge) (diverge) (merge) 1500 Future Craney Island Access ,545 2, Future Craney Island Access Craney Island Connector ,775 1,565 1,900 1, Craney Island Connector 1500 (merge) (diverge) (merge) (diverge) ,085 2,215 1,835 2,385 1, , (merge) ,165 VA 164 EB 1100 Craney Island Connector SOUHBOUND NOHBOUND 2040 Alt C 2040 Alt D 2040 Alt C 2040 Alt D ,150 1,245 1,100 1, (diverge) (merge) 1500 Future Craney Island Access ,015 1,090 1,025 1, Future Craney Island Access 1500 (merge) (diverge) ,045 1, ,050 1, (merge) VA 164 EB 1100 JAMES IVE CONNECOS PM PEAK VOUMES AENAIVE B JAMES IVE CONNECOS PM PEAK VOUMES AENAIVES C & D WESBOUNDEASBOUND WESBOUND EASBOUND 2040 Alt B 2040 Alt B 2040 Alt C 2040 Alt D 2040 Alt C 2040 Alt D , ,965 2, (diverge) (merge) (diverge) (merge) 1500 Hampton Blvd , Hampton Blvd Hampton Blvd ,735 1, Hampton Blvd 1500 (merge) (diverge) (merge) (diverge) ,145 1,680 2,815 2,735 2,645 2, (diverge) (merge) (diverge) (merge) 1500 Future Craney Island Access ,045 1, Future Craney Island Access Craney Island Connector ,120 1,925 1,875 1, Craney Island Connector 1500 (merge) (diverge) (merge) (diverge) ,600 2,435 2,245 2,395 2, , (merge) VA 164 EB 1100 Craney Island Connector SOUHBOUND NOHBOUND 2040 Alt C 2040 Alt D 2040 Alt C 2040 Alt D ,215 1,200 1,085 1, (diverge) (merge) 1500 Future Craney Island Access ,160 1, Future Craney Island Access 1500 (merge) (diverge) , ,175 1, (merge) VA 164 EB 1100 Notes Peak hour mainline volumes 2015 volumes based on 2015 traffic count data Elizabeth iver Crossing Alternatives Comparison Peak Hour Volumes April 2017 Figure 5-2.6
91 (not to I-64 AM PEAK OS AENAIVES COMPAISON I-64 PM PEAK OS AENAIVES COMPAISON EASBOUND WESBOUND EASBOUND WESBOUND (not to Existing 2040 NB 2040 Alt A 2040 Alt B 2040 Alt C 2040 Alt D Existing 2040 NB 2040 Alt A 2040 Alt B 2040 Alt C 2040 Alt D Existing 2040 NB 2040 Alt A 2040 Alt B 2040 Alt C 2040 Alt D Existing 2040 NB 2040 Alt A 2040 Alt B 2040 Alt C 2040 Alt D I-664 NB 1810 C D D D C D B C C C B C 1140 I-664 SB I-664 NB 1810 B C C C C C C C D D C D 1140 I-664 SB 3150 E F F F E F F F F F F F F F F F F F C D E E D E 2360 asalle Avenue SB 455 C D D D D D C C D F C C 405 Armistead Ave EB/a Salle Ave asalle Avenue SB 455 C D D D C D C C D D C C 405 Armistead Ave EB/a Salle Ave asalle Avenue NB 1080 (merge) C D E D D D C C D F C C (diverge) 1500 asalle Avenue NB 1080 (merge) C D D D D D C C D D C D (diverge) (merge) C D E D D D C C D D C C (merge) C D E D D D C C D D C D 645 Armistead Ave WB Armistead Ave WB 1300 C D E D D D C D E D D D 1500 C C D D C D (diverge) C C D D C D (diverge) (diverge) C D D D D D (diverge) C D D D D D C C D D C D C C D D C D ip ap d 6790 B C C C C C ip ap d 6790 B C C C C C 1500 (diverge) B C C C C C C C D D C D (merge) (diverge) B C C C C C C C D D C D (merge) 1500 yler St / Settlers anding d 1435 (lane drop) C E C C C B C C D D B C 1310 Settlers anding d yler St / Settlers anding d 1435 (lane drop) C E C C C C C C D C B C 1310 Settlers anding d 1900 E F D D F D B B D D B C C F D D E C C C D D C C 1835 S. Mallory St 1640 F F D C F C B B D D B C (lane add) 605 S. Mallory St S. Mallory St 1640 E F D C F C C C D D C C (lane add) 605 S. Mallory St 1500 (merge) F F F E F D D D D D D C (diverge) (merge) F F F F F D D D D D D D (diverge) 1500 HB F F F F F E F F F F F E HB HB F F F F F E F F F D F D HB 1500 (diverge) D D D D D C F F F D F D (merge) (diverge) D D D D D D D F D D F D (merge) 1500 Bayville St 200 D D D D D D F F E D F D 190 W. Ocean View Ave Bayville St 200 D D D D D D D F D D F D 190 W. Ocean View Ave 1500 (merge) D D D D D D F F D D F C (diverge) (merge) D D D D D D D F D D F C (diverge) 1500 D D D D D D D F D D E D D D D D D D D F D D F C (diverge) D D D D D D D F D D E C (merge) (diverge) D D D D D D D F D D E C (merge) th View St 2320 D C C C C C D F D C D C th View St 4th View St 2320 C C C C C C C E C C D C th View St 1500 (merge) D D D D D C D F D C D C (diverge) (merge) D D D D C C C D C C D C (diverge) 1500 W. Bay Ave 3445 D D D D D D D E D D D C 2590 W. Bay Ave W. Bay Ave 3445 D D D D C C C D C C D C 2590 W. Bay Ave 1500 (merge) D D D D D D E F D D E D (diverge) (merge) E F D D E D C D C C D C (diverge) 1500 D E D D E D C D C C D C Patrol d 3740 D D D D D D E E D D E D (merge) 1500 Patrol d 3740 D F E E D D C D C C D C (merge) 1500 D E D D D C C D C C C C 1840 Granby St 1840 Granby St 1730 D D F F C E D E F E D E (merge) D D F F C F C D D D C D (merge) 1500 I-564 / US 460 I-64 HOV I-564 I-564 / US 460 I-64 HOV I-564 C D F F D F E F F F E F C D F D C D 1510 B C C C C C (diverge) US (diverge) US 460 I I-64 HOV C C F F C F C D E E D E (diverge) 1500 I I-64 HOV C C D D C D C C D D C D (diverge) 1500 D D E E D D C C D D C D 1250 (merge) E E F F F F (merge) F F F F F F 525 egend Basic Segment Density (pc/mi/ln) OS Merge, Diverge, Weave Density (pc/mi/ln) OS 11 A 10 A >11-18 B >10-20 B >18-26 C >20-28 C >26-35 D >28-35 D >35-45 E >35 E >45; Demand exceeds capacity F Demand exceeds capacity F Notes evel of Service (OS) evaluated using HCS Freeway Facilities module I-64 Alternatives Comparison evel of Service April 2017 Figure 5-3.1
92 I-564 AM PEAK OS AENAIVES COMPAISON I-564 PM PEAK OS AENAIVES COMPAISON EASBOUND WESBOUND EASBOUND WESBOUND Existing 2040 NB 2040 Alt A 2040 Alt B 2040 Alt C 2040 Alt D Existing 2040 NB 2040 Alt A 2040 Alt B 2040 Alt C 2040 Alt D Existing 2040 NB 2040 Alt A 2040 Alt B 2040 Alt C 2040 Alt D Existing 2040 NB 2040 Alt A 2040 Alt B 2040 Alt C 2040 Alt D Bainbridge Ave/Bellinger Blvd 670 A A A A A A B B B A A A 525 Bainbridge Ave/Bellinger Blvd Bainbridge Ave/Bellinger Blvd 670 C B B B B C A A A A A A 525 Bainbridge Ave/Bellinger Blvd 1500 A A A A A A C C C B B B D B B B C B A A A A A A 1500 (merge) (diverge) (merge) (diverge) Intermodal Connector 3000 A A A A A B B A B B 4675 Intermodal Connector Intermodal Connector 3000 B B B C B A A A A A 4675 Intermodal Connector (2040 NB and Build Alternatives) (2040 NB and Build Alternatives) (2040 NB and Build Alternatives) (2040 NB and Build Alternatives) A C 1500 (merge) A A A A A B B C E C (diverge) (merge) B B C F C A A A B A (diverge) 1500 A A A A A B B B C F C A B B B C C A A A A A 1500 (diverge) A A A A B A (diverge) B C C D F E 1465 erminal Blvd 2530 A A A A B A erminal Blvd erminal Blvd 2530 B C C C F F erminal Blvd 350 (merge) A A B B B B B C C D D C (merge) C D D F F F A A A A A A A B B B C C D D D E F F E F F F F F A A B B B B 950 (merge) I-64 EB (merge) I-64 EB US US 460 (diverge) B B B B B B NB (diverge) E E F F F F NB C D D D F F A A A A A A W ittle Creek d A A B B B B 1450 W ittle Creek d 1450 D E E F F F egend Basic Segment Density (pc/mi/ln) OS Merge, Diverge, Weave Density (pc/mi/ln) OS 11 A 10 A >11-18 B >10-20 B >18-26 C >20-28 C >26-35 D >28-35 D >35-45 E >35 E >45; Demand exceeds capacity F Demand exceeds capacity F Notes evel of Service (OS) evaluated using HCS Freeway Facilities module I-564 Alternatives Comparison evel Of Service April 2017 Figure 5-3.2
93 I-664 AM PEAK OS AENAIVES COMPAISON I-664 AM PEAK OS AENAIVES COMPAISON (CONINUED) EASBOUND WESBOUND EASBOUND WESBOUND Existing 2040 NB 2040 Alt A 2040 Alt B 2040 Alt C 2040 Alt D Existing 2040 NB 2040 Alt A 2040 Alt B 2040 Alt C 2040 Alt D Existing 2040 NB 2040 Alt A 2040 Alt B 2040 Alt C 2040 Alt D Existing 2040 NB 2040 Alt A 2040 Alt B 2040 Alt C 2040 Alt D I B B B B B B C C C C D D 1085 I-64 MACHINE A 1600 A B B B B B C E C C C C 1310 MACHINE A 1500 D F F F F F B B B B A A B A A A A A D F F C C C 1500 (merge) (diverge) (diverge) (merge) 1000 C C C C B B B C C C B B A B B A A A C D D D C C 1140 VA 164 VA 164 WB 1500 (diverge) C D D D B B B B B B B B (merge) (merge) B B B B B B C E D D C C 1715 Power Plant Pkwy/Powhatan Pkwy 1660 C C C C B B B B B B B B 1945 Power Plant Pkwy/Powhatan Pkwy US B C B B B B C D D D C C 510 US 17/VA 164 EB 1500 C B B B B B B B B B B B C C C C B B (merge) (diverge) (merge) C C C C B B B B B B B B B C C C B B C D D D C C (diverge) C C C C B B B B B B B B (merge) (diverge) C C C B B B Aberdeen d D D D D C C 1505 C C C C B B B B B B B B 1300 Aberdeen d (merge) 1500 Pughsville d WB Pughsville d 2525 C C C C B B C D D D C C 3040 C C C C B B B B B B B B Pughsville d EB Chestnut Ave/oanoke Ave 2230 B B B B B B B B B B B B 2020 Chestnut Ave/oanoke Ave 1500 (merge) D C C C B B D F F F C C (diverge) B B B B A A B B B B B B D D D D C C D F F F C C 5350 (merge) (diverge) 300 B C C C B B C C C C B B (diverge) D D D D C C D F F F C C (merge) C D D D C C D F F D C C 520 (diverge) B C C C B B C B B B A A (merge) Portsmouth Blvd WB Portsmouth Blvd WB 35th St 1105 B B B B B A 1700 C D D D C C C D D D C C 1680 C C C C B B th St/36th St C D D D C C D F F D C C 1500 (diverge) B A A A A A Portsmouth Blvd EB Portsmouth Blvd EB 26th St C C C C C C (merge) D F F F C C (diverge) 1500 B B B B A A D D D C B B th St D F F F D D 200 US 60 C C C C C B 2410 US 60 D D D D C C 1475 (merge) 1500 (diverge) D F F F C C (merge) 1500 B B B B B B C D D D C C C D D D C C 1100 (merge) B B B B B A D C C C B B (diverge) 1500 Dock anding d Dock anding d 410 C C C C B B D D D D C C (merge) D D D D C C D F F F B B (diverge) D E E D C C D F F F C C 1180 (diverge) B B B B B B D C C C B B (merge) erminal Ave 585 B B B B B B 1500 (diverge) D E E D C C D F F F C C (merge) 1500 D D D D C C 1690 erminal Ave erminal Ave 1005 (lane drop) B C C C B B US 58 SB 480 C D D C C C C D D D C C 410 US 58 SB 1500 (merge) B B B B A A 2045 C D C C C C C C C C C C 1500 D C C C B B (diverge) 1500 (merge) MMMB B B C C MMMB US 58 NB 1260 C D C C B B C C C C B B 1225 US 58 NB B B C B 490 (merge) F F F F C C I-664 Connector C C C C A A F F F F B B I-664 Connector 1020 F F F F D D F F F F F F (Build Alternatives C and D) (Build Alternatives C and D) 4675 B B C C 490 (diverge) C C C C C C MMMB B B C C MMMB S Military Hwy F 1500 (diverge) C C C C C B B B B B B A B A A A A 1500 (diverge) B B B B B B E F F F B B (merge) 1500 I-64 SB I-64 NB College Dr NB 220 B C C B A B C F F F B B 640 College Dr NB 1820 B B B B B B C F F F B B 1695 College Dr SB 630 B C B B A A C F C C B B 500 College Dr SB 1500 (merge) B B B B A A D F F C B B (diverge) 1500 A B B B B B C E C C C C MACHINE A MACHINE A egend Basic Segment Density (pc/mi/ln) OS Merge, Diverge, Weave Density (pc/mi/ln) OS 11 A 10 A >11-18 B >10-20 B >18-26 C >20-28 C >26-35 D >28-35 D >35-45 E >35 E >45; Demand exceeds capacity F Demand exceeds capacity F Notes evel of Service (OS) evaluated using HCS Freeway Facilities module I-664 Alternatives Comparison AM Peak Hour evel of Service April 2017 Figure 5-3.3
94 I-664 PM PEAK OS AENAIVES COMPAISON I-664 PM PEAK OS AENAIVES COMPAISON (CONINUED) EASBOUND WESBOUND EASBOUND WESBOUND Existing 2040 NB 2040 Alt A 2040 Alt B 2040 Alt C 2040 Alt D Existing 2040 NB 2040 Alt A 2040 Alt B 2040 Alt C 2040 Alt D Existing 2040 NB 2040 Alt A 2040 Alt B 2040 Alt C 2040 Alt D Existing 2040 NB 2040 Alt A 2040 Alt B 2040 Alt C 2040 Alt D I A A A A A A D F E E F F 1085 I-64 MACHINE A 1600 C C C C C C B B B B B B 1310 MACHINE A 1500 C B B B C B C C B B F C C B B B A B C B B B B B 1500 (merge) (diverge) (diverge) (merge) 1000 B B B B B B C D D D B C C C C C C C B B B B B B 1140 VA 164 VA 164 WB 1500 (diverge) B C C C B B C D C C C B (merge) (merge) C C C B B B B B B B B B 1715 Power Plant Pkwy/Powhatan Pkwy 1660 B B B B B B C D D D C C 1945 Power Plant Pkwy/Powhatan Pkwy US C D D D C C B C C B B B 510 US 17/VA 164 EB 1500 B B B B B B C C C C C C D F F F C C (merge) (diverge) (merge) B B B B B B C D D D C C C C C C C C B B B B B B (diverge) B B B B B B C C C C B B (merge) (diverge) E F F F C C Aberdeen d B C C C B B 1505 B B B B B A C D D D C C 1300 Aberdeen d (merge) 1500 Pughsville d WB Pughsville d 2525 C D D D C C B C C C B B 3040 B B B B B B C C C C C C Pughsville d EB Chestnut Ave/oanoke Ave 2230 A B B B B A C C C C C C 2020 Chestnut Ave/oanoke Ave 1500 (merge) D C C C B B C C C C B B (diverge) B B B B B A C C C C B B D D D D C C C C C C C C 5350 (merge) (diverge) 300 B B B B B B E F F F C C (diverge) D D D D C C C C C C B B (merge) D D D D C C C C C C B B 520 (diverge) B B B B B B E F F F B B (merge) Portsmouth Blvd WB Portsmouth Blvd WB 35th St 1105 A B B B B A 1700 C D D D C C B C C C B B 1680 C D D D B B th St/36th St D D D D C C C C C C B B 1500 (diverge) A A A A A A Portsmouth Blvd EB Portsmouth Blvd EB 26th St C D D D C C (merge) C C C C B B (diverge) 1500 B B B B A A D D D D C C th St C D D D C C 200 US 60 C C C C B B 2410 US 60 D D D D C C 1475 (merge) 1500 (diverge) C C C C B B (merge) 1500 B D C B B B D D D D C C C C C C C B 1100 (merge) C F E D B B C C C C B B (diverge) 1500 Dock anding d Dock anding d 410 C F F E C B C D D D B B (merge) D C C C B B C F F C B B (diverge) D D D D C C C F F D C C 1180 (diverge) B F F F B B C C C C B B (merge) erminal Ave 585 B F F F C B 1500 (diverge) D D D D C C C F F C B B (merge) 1500 C D C C B B 1690 erminal Ave erminal Ave 1005 (lane drop) C F F F B B US 58 SB 480 C C C C B B C C C C B B 410 US 58 SB 1500 (merge) D F F F B B 2045 C C C C B B C B B B B B 1500 C C C C B A (diverge) 1500 (merge) MMMB C C B B MMMB US 58 NB 1260 C C C C B B B B B B B B 1225 US 58 NB C C B B 490 (merge) E F F D C C I-664 Connector F F F F B B C F F F A A I-664 Connector 1020 E E E E D D F F F F F F (Build Alternatives C and D) (Build Alternatives C and D) 4675 B C B B 490 (diverge) B B B B C C MMMB C C B B MMMB S Military Hwy E B B 1500 (diverge) B B B B B B B A B C C C C C C 1500 (diverge) D C C C B B C C C C B B (merge) 1500 I-64 SB I-64 NB College Dr NB 220 D D D D C C C C C C B B 640 College Dr NB 1820 C D D D C C B B B B B B 1695 College Dr SB 630 D D D D C C C C C C B B 500 College Dr SB 1500 (merge) D C C C B B C B B B A A (diverge) 1500 C C C C C C B B B B B B MACHINE A MACHINE A egend Basic Segment Density (pc/mi/ln) OS Merge, Diverge, Weave Density (pc/mi/ln) OS 11 A 10 A >11-18 B >10-20 B >18-26 C >20-28 C >26-35 D >28-35 D >35-45 E >35 E >45; Demand exceeds capacity F Demand exceeds capacity F Notes evel of Service (OS) evaluated using HCS Freeway Facilities module I-664 Alternatives Comparison PM Peak Hour evel of Service April 2017 Figure 5-3.4
95 VA 164 AM PEAK OS AENAIVES COMPAISON VA 164 PM PEAK OS AENAIVES COMPAISON EASBOUND WESBOUND EASBOUND WESBOUND Existing 2040 NB 2040 Alt A 2040 Alt B 2040 Alt C 2040 Alt D Existing 2040 NB 2040 Alt A 2040 Alt B 2040 Alt C 2040 Alt D Existing 2040 NB 2040 Alt A 2040 Alt B 2040 Alt C 2040 Alt D Existing 2040 NB 2040 Alt A 2040 Alt B 2040 Alt C 2040 Alt D US 17/Bridge d 2600 A B B B B B A A A A A A 1670 I-664 SB US 17/Bridge d 2600 A A A A A A A B B B B B 1670 I-664 SB 2680 A B B B B B A B B B B B A A A A A A B B B B B B 1610 I A B B B B B A A A A A A 970 I-664 NB I A A A A A A A B B B B B 970 I-664 NB 1500 (merge) B C C C B B B B B B A A (diverge) (merge) B B B C B B C B B B B B (diverge) 1500 College Dr 585 C C C C C B B B B B B A 1025 College Dr College Dr 585 B C C B B B C C C B C B 1025 College Dr 1500 (merge) C D D B C B B B B B B B (diverge) (merge) B C C B B B C C C C C B (diverge) 1500 C D D C C B B C C B B B C C C C C B C D D C C B (diverge) C D D C C B B B B B B B (merge) (diverge) C D D C C B C C C C C B (merge) 1500 owne Point d 2000 C C C C C B B B B B B A 1970 owne Point d owne Point d 2000 B B B B B A C C C C C B 1970 owne Point d 1500 (merge) C D D C C B B B B B B A (diverge) (merge) B C C B B B D D D C C B (diverge) 1500 C D D C D C B B B B B A B C C B C B C D D C D C (diverge) C E D C C B B B B B B B (merge) (diverge) B C C B B B C D D C C B (merge) 1500 Cedar n SB 1135 B C C A B A A A A 1140 Cedar n Cedar n SB 1135 B B B C D C C C B 1140 Cedar n (Existing and 2040 NB) (Existing and 2040 NB) 1500 C C C B B B B A A B B B D C C E C C 1500 (merge) (diverge) (merge) (diverge) C C B B A A B B A D C C Cedar n NB 110 C C C Cedar n NB 110 B B B (Existing and 2040 NB) (Existing and 2040 NB) Craney Island Connector Craney Island Connector B B B 1300 (Build Alternatives) 1000 (merge) B B B C D D A A A C C B B B B C C C 1000 (merge) C C C 1300 (Build Alternatives) 500 C D D 500 B C C Craney Island Connector Craney Island Connector (Build Alternatives) 1000 (diverge) C D D B B B A A A (merge) 1000 (Build Alternatives) 1000 (diverge) B C C C C C C B B (merge) 1000 Virginia International Gateway Blvd 2245 B C C B B B B B B A A A 2330 Virginia International Gateway Blvd Virginia International Gateway Blvd 2245 B B B B A A C D D C C C 2330 Virginia International Gateway Blvd (Existing and 2040 NB) (Existing and 2040 NB) 1025 C C C B B B B B B B B B C D D D C C 1225 (merge) (diverge) (merge) (diverge) Craney Island Connector 475 C D D B C B C B B 275 Craney Island Connector 475 B C C D D D E D D 275 (Build Alternatives) (Build Alternatives) 1025 C D D B B B B A A B C C C C C C C C 1225 (diverge) B B B (merge) (diverge) B B B (merge) W. Norfolk d 625 C C C C C C B B B B B B 810 W Norfolk d W. Norfolk d 625 B C B C B B C D D D C C 810 W Norfolk d 1500 (merge) C D D C C C B B B B B B (diverge) (merge) B C B C B B D D D D C C (diverge) 1500 B B B B B B D D D D D D C D D D C C B C C C B B B B B B B B (lane drop) 415 D D D D D D (lane drop) 415 B C C C C C A B A A A A A B B B B B B C C C B B 2330 (lane add) (lane add) (lane drop) C D D B B B B A A A A A (merge) (lane drop) B C C C A C D C C C B B (merge) 1500 B C C B C C A A A A A A A B B B B B B B B B B B 1375 US 58 EB (merge) US 58 EB (merge) 1050 (diverge) US 58 SB (diverge) US 58 SB ee Ave/ailroad Ave 1500 US 58 WB B B B B B B A A A A A A 1765 ailroad Ave/US 58 NB ee Ave/ailroad Ave 1500 US 58 WB A A A B B B B B B B B B 1765 ailroad Ave/US 58 NB ee Ave / Harper Ave ee Ave / Harper Ave 1500 (merge) B C C B B B A B B B A A (merge) B B B B A B B B B B B B 3150 A B B B B B A A A A A A A A A B A A A A A A A A ondon Blvd ondon Blvd egend Basic Segment Density (pc/mi/ln) OS Merge, Diverge, Weave Density (pc/mi/ln) OS 11 A 10 A >11-18 B >10-20 B >18-26 C >20-28 C >26-35 D >28-35 D >35-45 E >35 E >45; Demand exceeds capacity F Demand exceeds capacity F Notes evel of Service (OS) evaluated using HCS Freeway Facilities module VA 164 Alternatives Comparison evel Of Service April 2017 Figure 5-3.5
96 JAMES IVE CONNECOS AM PEAK OS AENAIVE B JAMES IVE CONNECOS AM PEAK OS AENAIVES C & D WESBOUNDEASBOUND WESBOUND EASBOUND 2040 Alt B 2040 Alt B 2040 Alt C 2040 Alt D 2040 Alt C 2040 Alt D 3675 C A C C B B (diverge) C A (merge) (diverge) C C B B (merge) 1500 Hampton Blvd 2850 A A 2970 Hampton Blvd Hampton Blvd 2850 B B A A 2970 Hampton Blvd 1500 (merge) B C (diverge) (merge) C C C C (diverge) 1500 B C C C C C (diverge) B C (merge) (diverge) C C C C (merge) 1500 Future Craney Island Access 2700 B C 2000 Future Craney Island Access Craney Island Connector 4135 B B B B 3660 Craney Island Connector 1500 (merge) B C (diverge) (merge) C B C C (diverge) 1500 C C B C C B 5350 C (merge) 1500 A VA 164 EB 1100 Craney Island Connector SOUHBOUND NOHBOUND 2040 Alt C 2040 Alt D 2040 Alt C 2040 Alt D 7095 A B A B (diverge) B B B B (merge) 1500 Future Craney Island Access 2700 A A A A 2000 Future Craney Island Access 1500 (merge) B B A B (diverge) 1500 A A 5050 A A 5350 B B (merge) 1500 A A VA 164 EB 1100 JAMES IVE CONNECOS PM PEAK OS AENAIVE B JAMES IVE CONNECOS PM PEAK OS AENAIVES C & D WESBOUNDEASBOUND WESBOUND EASBOUND 2040 Alt B 2040 Alt B 2040 Alt C 2040 Alt D 2040 Alt C 2040 Alt D 3675 A C A A D D (diverge) A C (merge) (diverge) A A D D (merge) 1500 Hampton Blvd 2850 A A 2970 Hampton Blvd Hampton Blvd 2850 A A B B 2970 Hampton Blvd 1500 (merge) C B (diverge) (merge) C C C C (diverge) 1500 C B D C C C (diverge) C B (merge) (diverge) D D C C (merge) 1500 Future Craney Island Access 2700 C B 2000 Future Craney Island Access Craney Island Connector 4135 C C B B 3660 Craney Island Connector 1500 (merge) C B (diverge) (merge) C C C C (diverge) 1500 B C C C C C 5350 B (merge) 1500 A VA 164 EB 1100 Craney Island Connector SOUHBOUND NOHBOUND 2040 Alt C 2040 Alt D 2040 Alt C 2040 Alt D 7095 B B A A (diverge) B B B B (merge) 1500 Future Craney Island Access 2700 A A A A 2000 Future Craney Island Access 1500 (merge) B B A A (diverge) 1500 A A 5050 A A 5350 B A (merge) 1500 A A VA 164 EB 1100 egend Basic Segment Density (pc/mi/ln) OS Merge, Diverge, Weave Density (pc/mi/ln) OS 11 A 10 A >11-18 B >10-20 B >18-26 C >20-28 C >26-35 D >28-35 D >35-45 E >35 E >45; Demand exceeds capacity F Demand exceeds capacity F Notes evel of Service (OS) evaluated using HCS Freeway Facilities module Elizabeth iver Crossing Alternatives Comparison Peak Hour evel of Service April 2017 Figure 5-3.6
97 (not to I-64 AM PEAK OS AENAIVES COMPAISON I-64 PM PEAK OS AENAIVES COMPAISON EASBOUND WESBOUND EASBOUND WESBOUND (not to Existing 2040 NB 2040 Alt A 2040 Alt B 2040 Alt C 2040 Alt D Existing 2040 NB 2040 Alt A 2040 Alt B 2040 Alt C 2040 Alt D Existing 2040 NB 2040 Alt A 2040 Alt B 2040 Alt C 2040 Alt D Existing 2040 NB 2040 Alt A 2040 Alt B 2040 Alt C 2040 Alt D I-664 NB I-664 SB I-664 NB I-664 SB asalle Avenue SB Armistead Ave EB/a Salle Ave asalle Avenue SB Armistead Ave EB/a Salle Ave asalle Avenue NB 1080 (merge) (diverge) 1500 asalle Avenue NB 1080 (merge) (diverge) (merge) (merge) Armistead Ave WB Armistead Ave WB (diverge) (diverge) (diverge) (diverge) ip ap d ip ap d (diverge) (merge) (diverge) (merge) 1500 yler St / Settlers anding d 1435 (lane drop) Settlers anding d yler St / Settlers anding d 1435 (lane drop) Settlers anding d S. Mallory St (lane add) 605 S. Mallory St S. Mallory St (lane add) 605 S. Mallory St 1500 (merge) (diverge) (merge) (diverge) 1500 HB HB HB HB 1500 (diverge) (merge) (diverge) (merge) 1500 Bayville St W. Ocean View Ave Bayville St W. Ocean View Ave 1500 (merge) (diverge) (merge) (diverge) (diverge) (merge) (diverge) (merge) th View St th View St 4th View St th View St 1500 (merge) (diverge) (merge) (diverge) 1500 W. Bay Ave W. Bay Ave W. Bay Ave W. Bay Ave 1500 (merge) (diverge) (merge) (diverge) Patrol d (merge) 1500 Patrol d (merge) Granby St 1840 Granby St (merge) (merge) 1500 I-564 / US 460 I-64 HOV I-564 I-564 / US 460 I-64 HOV I (diverge) US (diverge) US 460 I I-64 HOV (diverge) 1500 I I-64 HOV (diverge) (merge) (merge) egend Speed (mph) > Notes Speeds evaluated using HCS Freeway Facilities module I-64 Alternatives Comparison Speed April 2017 Figure 5-4.1
98 I-564 AM PEAK OS AENAIVES COMPAISON I-564 PM PEAK OS AENAIVES COMPAISON EASBOUND WESBOUND EASBOUND WESBOUND Existing 2040 NB 2040 Alt A 2040 Alt B 2040 Alt C 2040 Alt D Existing 2040 NB 2040 Alt A 2040 Alt B 2040 Alt C 2040 Alt D Existing 2040 NB 2040 Alt A 2040 Alt B 2040 Alt C 2040 Alt D Existing 2040 NB 2040 Alt A 2040 Alt B 2040 Alt C 2040 Alt D Bainbridge Ave/Bellinger Blvd Bainbridge Ave/Bellinger Blvd Bainbridge Ave/Bellinger Blvd Bainbridge Ave/Bellinger Blvd (merge) (diverge) (merge) (diverge) Intermodal Connector Intermodal Connector Intermodal Connector Intermodal Connector (2040 NB and Build Alternatives) (2040 NB and Build Alternatives) (2040 NB and Build Alternatives) (2040 NB and Build Alternatives) (merge) (diverge) (merge) (diverge) (diverge) (diverge) erminal Blvd erminal Blvd erminal Blvd erminal Blvd 350 (merge) (merge) (merge) I-64 EB (merge) I-64 EB US US 460 (diverge) NB (diverge) NB W ittle Creek d W ittle Creek d egend Speed (mph) > Notes Speeds evaluated using HCS Freeway Facilities module I-564 Alternatives Comparison Speed April 2017 Figure 5-4.2
99 I-664 AM PEAK OS AENAIVES COMPAISON I-664 AM PEAK OS AENAIVES COMPAISON (CONINUED) EASBOUND WESBOUND EASBOUND WESBOUND Existing 2040 NB 2040 Alt A 2040 Alt B 2040 Alt C 2040 Alt D Existing 2040 NB 2040 Alt A 2040 Alt B 2040 Alt C 2040 Alt D Existing 2040 NB 2040 Alt A 2040 Alt B 2040 Alt C 2040 Alt D Existing 2040 NB 2040 Alt A 2040 Alt B 2040 Alt C 2040 Alt D I I-64 MACHINE A MACHINE A (merge) (diverge) (diverge) (merge) VA 164 VA 164 WB 1500 (diverge) (merge) (merge) Power Plant Pkwy/Powhatan Pkwy Power Plant Pkwy/Powhatan Pkwy US US 17/VA 164 EB (merge) (diverge) (merge) (diverge) (merge) (diverge) Aberdeen d Aberdeen d (merge) 1500 Pughsville d WB Pughsville d Pughsville d EB Chestnut Ave/oanoke Ave Chestnut Ave/oanoke Ave 1500 (merge) (diverge) (merge) (diverge) (diverge) (merge) (diverge) (merge) Portsmouth Blvd WB Portsmouth Blvd WB 35th St th St/36th St (diverge) Portsmouth Blvd EB Portsmouth Blvd EB 26th St (merge) (diverge) th St US US (merge) 1500 (diverge) (merge) (merge) (diverge) 1500 Dock anding d Dock anding d (merge) (diverge) (diverge) (merge) erminal Ave (diverge) (merge) erminal Ave erminal Ave 1005 (lane drop) US 58 SB US 58 SB 1500 (merge) (diverge) 1500 (merge) MMMB MMMB US 58 NB US 58 NB (merge) I-664 Connector I-664 Connector (Build Alternatives C and D) (Build Alternatives C and D) (diverge) MMMB MMMB S Military Hwy (diverge) (diverge) (merge) 1500 I-64 SB I-64 NB College Dr NB College Dr NB College Dr SB College Dr SB 1500 (merge) (diverge) MACHINE A MACHINE A egend Speed (mph) > Notes Speeds evaluated using HCS Freeway Facilities module I-664 Alternatives Comparison AM Peak Hour Speed April 2017 Figure 5-4.3
100 I-664 PM PEAK OS AENAIVES COMPAISON I-664 PM PEAK OS AENAIVES COMPAISON (CONINUED) EASBOUND WESBOUND EASBOUND WESBOUND Existing 2040 NB 2040 Alt A 2040 Alt B 2040 Alt C 2040 Alt D Existing 2040 NB 2040 Alt A 2040 Alt B 2040 Alt C 2040 Alt D Existing 2040 NB 2040 Alt A 2040 Alt B 2040 Alt C 2040 Alt D Existing 2040 NB 2040 Alt A 2040 Alt B 2040 Alt C 2040 Alt D I I-64 MACHINE A MACHINE A (merge) (diverge) (diverge) (merge) VA 164 VA 164 WB 1500 (diverge) (merge) (merge) Power Plant Pkwy/Powhatan Pkwy Power Plant Pkwy/Powhatan Pkwy US US 17/VA 164 EB (merge) (diverge) (merge) (diverge) (merge) (diverge) Aberdeen d Aberdeen d (merge) 1500 Pughsville d WB Pughsville d Pughsville d EB Chestnut Ave/oanoke Ave Chestnut Ave/oanoke Ave 1500 (merge) (diverge) (merge) (diverge) (diverge) (merge) (diverge) (merge) Portsmouth Blvd WB Portsmouth Blvd WB 35th St th St/36th St (diverge) Portsmouth Blvd EB Portsmouth Blvd EB 26th St (merge) (diverge) th St US US (merge) 1500 (diverge) (merge) (merge) (diverge) 1500 Dock anding d Dock anding d (merge) (diverge) (diverge) (merge) erminal Ave (diverge) (merge) erminal Ave erminal Ave 1005 (lane drop) US 58 SB US 58 SB 1500 (merge) (diverge) 1500 (merge) MMMB MMMB US 58 NB US 58 NB (merge) I-664 Connector I-664 Connector (Build Alternatives C and D) (Build Alternatives C and D) (diverge) MMMB MMMB S Military Hwy (diverge) (diverge) (merge) 1500 I-64 SB I-64 NB College Dr NB College Dr NB College Dr SB College Dr SB 1500 (merge) (diverge) MACHINE A MACHINE A egend Speed (mph) > Notes Speeds evaluated using HCS Freeway Facilities module I-664 Alternatives Comparison PM Peak Hour Speed April 2017 Figure 5-4.4
101 VA 164 AM PEAK OS AENAIVES COMPAISON VA 164 PM PEAK OS AENAIVES COMPAISON EASBOUND WESBOUND EASBOUND WESBOUND Existing 2040 NB 2040 Alt A 2040 Alt B 2040 Alt C 2040 Alt D Existing 2040 NB 2040 Alt A 2040 Alt B 2040 Alt C 2040 Alt D Existing 2040 NB 2040 Alt A 2040 Alt B 2040 Alt C 2040 Alt D Existing 2040 NB 2040 Alt A 2040 Alt B 2040 Alt C 2040 Alt D US 17/Bridge d I-664 SB US 17/Bridge d I-664 SB I I-664 NB I I-664 NB 1500 (merge) (diverge) (merge) (diverge) 1500 College Dr College Dr College Dr College Dr 1500 (merge) (diverge) (merge) (diverge) (diverge) (merge) (diverge) (merge) 1500 owne Point d owne Point d owne Point d owne Point d 1500 (merge) (diverge) (merge) (diverge) (diverge) (merge) (diverge) (merge) 1500 Cedar n SB Cedar n Cedar n SB Cedar n (Existing and 2040 NB) (Existing and 2040 NB) (merge) (diverge) (merge) (diverge) Cedar n NB Cedar n NB (Existing and 2040 NB) (Existing and 2040 NB) Craney Island Connector Craney Island Connector (Build Alternatives) 1000 (merge) (merge) (Build Alternatives) Craney Island Connector Craney Island Connector (Build Alternatives) 1000 (diverge) (merge) 1000 (Build Alternatives) 1000 (diverge) (merge) 1000 Virginia International Gateway Blvd Virginia International Gateway Blvd Virginia International Gateway Blvd Virginia International Gateway Blvd (Existing and 2040 NB) (Existing and 2040 NB) (merge) (diverge) (merge) (diverge) Craney Island Connector Craney Island Connector (Build Alternatives) (Build Alternatives) (diverge) (merge) (diverge) (merge) W. Norfolk d W Norfolk d W. Norfolk d W Norfolk d 1500 (merge) (diverge) (merge) (diverge) (lane drop) (lane drop) (lane add) (lane add) (lane drop) (merge) (lane drop) (merge) US 58 EB (merge) US 58 EB (merge) 1050 (diverge) US 58 SB (diverge) US 58 SB ee Ave/ailroad Ave 1500 US 58 WB ailroad Ave/US 58 NB ee Ave/ailroad Ave 1500 US 58 WB ailroad Ave/US 58 NB ee Ave / Harper Ave ee Ave / Harper Ave 1500 (merge) (merge) ondon Blvd ondon Blvd egend Speed (mph) > Notes Speeds evaluated using HCS Freeway Facilities module VA 164 Alternatives Comparison Speed April 2017 Figure 5-4.5
102 JAMES IVE CONNECOS AM PEAK OS AENAIVE B JAMES IVE CONNECOS AM PEAK OS AENAIVES C & D WESBOUNDEASBOUND WESBOUND EASBOUND 2040 Alt B 2040 Alt B 2040 Alt C 2040 Alt D 2040 Alt C 2040 Alt D (diverge) (merge) (diverge) (merge) 1500 Hampton Blvd Hampton Blvd Hampton Blvd Hampton Blvd 1500 (merge) (diverge) (merge) (diverge) (diverge) (merge) (diverge) (merge) 1500 Future Craney Island Access Future Craney Island Access Craney Island Connector Craney Island Connector 1500 (merge) (diverge) (merge) (diverge) (merge) VA 164 EB 1100 Craney Island Connector SOUHBOUND NOHBOUND 2040 Alt C 2040 Alt D 2040 Alt C 2040 Alt D (diverge) (merge) 1500 Future Craney Island Access Future Craney Island Access 1500 (merge) (diverge) (merge) VA 164 EB 1100 JAMES IVE CONNECOS PM PEAK OS AENAIVE B JAMES IVE CONNECOS PM PEAK OS AENAIVES C & D WESBOUNDEASBOUND WESBOUND EASBOUND 2040 Alt B 2040 Alt B 2040 Alt C 2040 Alt D 2040 Alt C 2040 Alt D (diverge) (merge) (diverge) (merge) 1500 Hampton Blvd Hampton Blvd Hampton Blvd Hampton Blvd 1500 (merge) (diverge) (merge) (diverge) (diverge) (merge) (diverge) (merge) 1500 Future Craney Island Access Future Craney Island Access Craney Island Connector Craney Island Connector 1500 (merge) (diverge) (merge) (diverge) (merge) VA 164 EB 1100 Craney Island Connector SOUHBOUND NOHBOUND 2040 Alt C 2040 Alt D 2040 Alt C 2040 Alt D (diverge) (merge) 1500 Future Craney Island Access Future Craney Island Access 1500 (merge) (diverge) (merge) VA 164 EB 1100 egend Speed (mph) > Notes Speeds evaluated using HCS Freeway Facilities module Elizabeth iver Crossing Alternatives Comparison Speed April 2017 Figure 5-4.6
103 raffic and ransportation echnical eport able 5-4: 2040 Intersection Capacity Analyses esults Intersection Control ype Existing 2040 No-Build 2040 Alternative A 2040 Alternative B 2040 Alternative C 2040 Alternative D AM PM AM PM AM PM AM PM AM PM AM PM Delay OS Delay OS Delay OS Delay OS Delay OS Delay OS Delay OS Delay OS Delay OS Delay OS Delay OS Delay OS (s) (s) (s) (s) (s) (s) (s) (s) (s) (s) (s) (s) I-64 Interchanges VA-134 at I-64 WB On amp* Signalized 17.9 B 19.1 B 21.5 C 22.9 C 20.8 C 23.9 C 22.3 C 24.6 C 21.9 C 24.1 C 20.4 C 24.0 C asalle Ave at Armistead Ave* Signalized 19.7 B 23.8 C 22.3 C 27.2 C 22.6 C 26.9 C 22.7 C 27.5 C 21.8 C 26.4 C 22.3 C 26.8 C I-64 EB Off amp at ip ap d Signalized 15.3 B 17.5 B 16.6 B 18.2 B 20.2 C 24.3 C 17.0 B 19.4 B 17.8 B 20.7 C 18.6 B 21.0 C Settlers anding d at E yler St Signalized 24.5 C 17.4 B 31.3 C 26.9 C 31.1 C 25.2 C 33.7 C 27.9 C 29.0 C 23.6 C 32.7 C 26.8 C Settlers anding d at I-64 SB On amp Yield Control*** 11.5 B 13.9 B 14.7 B 27.4 D 12.5 B 17.7 C 13.0 B 17.4 C 11.5 B 16.1 C 12.3 B 16.5 C Settlers anding d at I-64 NB On amp Signalized 21.3 C 23.2 C 36.2 D 72.1 E 34.6 C 79.0 E 34.5 C 72.7 E 57.1 E 87.0 F 37.4 D 96.4 F I-64 SB amps at S Mallory St Signalized 8.4 A 98.6 F 10.7 B F 10.3 B 63.4 E 11.4 B F 11.0 B 58.0 E 11.2 B 67.5 E I-64 NB amps at S Mallory St Signalized 72.2 E 19.9 B F 31.9 C 56.8 E 28.0 C 76.0 E 30.0 C 45.0 D 22.5 C 77.0 E 32.2 C I-64 SB amps at 4th View St Stop Control** 7.5 A 14.1 B 9.3 A F 14.0 B F 21.2 C F 7.8 A 68.8 F 29.5 D F I-64 NB amps at 4th View St Stop Control** 11.9 B 95.6 F 13.5 B F 13.6 B F 14.4 B F 12.7 B F 14.4 B F US 460 at I-64 NB On amp Yield Control*** 15.7 B 12.8 B 15.9 C 13.0 B 30.2 D 20.8 C 27.3 D 19.4 C 18.4 C 13.9 B 21.3 C 17.4 C I-564 Interchanges I-564 at Bainbridge Ave Signalized 13.9 B 37.6 D 12.0 B 30.3 C 11.5 B 23.6 C 13.5 B 24.3 C 12.7 B 19.8 B 12.7 B 18.8 B I-564 at Hampton Blvd**** Signalized B 15.3 B 24.5 C 20.6 C 27.1 C 20.0 C I-664 Interchanges PowhatanPkwy at I-664 North amp Signalized 24.8 C 27.3 C 14.4 B 20.5 C 15.1 B 21.6 C 15.0 B 21.4 C 15.2 B 24.0 C 15.2 B 23.2 C Powhatan Pkwy at I-664 South amp Signalized 14.2 B 20.3 C 25.1 C 26.7 C 24.8 C 27.3 C 24.6 C 26.5 C 24.5 C 27.3 C 24.6 C 27.6 C Aberdeen d at I-664 North amp Signalized 14.9 B 7.7 A 11.8 B 20.2 C 12.2 B 20.2 C 11.9 B 18.8 B 12.5 B 25.6 C 12.2 B 24.8 C Aberdeen d at I-664 South amp Signalized 10.2 B 12.8 B 26.6 C 7.7 A 26.9 C 7.3 A 26.8 C 7.3 A 26.2 C 7.8 A 26.4 C 9.8 A Chestnut Ave at I-664 South Off amp Signalized 0.2 A 0.2 A 0.3 A 0.2 A 0.3 A 0.2 A 0.3 A 0.2 A 0.6 A 0.2 A 0.6 A 0.2 A Chestnut Ave at I-664 North On amp Signalized 3.1 A 13.6 B 4.3 A 18.5 B 3.4 A 15.4 B 3.8 A 16.3 B 3.5 A 18.0 B 3.3 A 17.7 B Chestnut Ave at 39th St Signalized 22.1 C 16.9 B 16.4 B 16.7 B 16.2 B 16.4 B 18.3 B 16.2 B 16.2 B 16.3 B 15.8 B 16.0 B oanoke Ave at I-664 South On-amp Stop Control** 9.9 A 10.3 B 10.6 B 11.0 B 10.0 B 10.2 B 10.2 B 10.8 B 10.6 B 12.7 B 10.4 B 11.4 B oanoke Ave at I-664 North Off-amp Signalized 17.2 B 11.7 B 14.4 B 18.9 B 13.5 B 19.3 B 14.2 B 19.2 B 13.0 B 19.6 B 14.7 B 19.7 B oanoke Ave at 39th St Signalized 10.6 B 8.4 A 22.8 C 17.8 B 21.8 C 17.5 B 22.2 C 19.2 B 22.7 C 19.7 B 21.8 C 18.3 B Jefferson Ave at 36th St Signalized 21.2 C 19.5 B 20.6 C 16.7 B 20.7 C 18.0 B 20.3 C 17.1 B 22.2 C 19.6 B 21.8 C 19.0 B Jefferson Ave at 35th St Signalized 3.6 A 7.0 A 9.2 A 8.5 A 9.4 A 10.9 B 9.3 A 9.0 A 9.4 A 11.1 B 9.6 A 11.0 B Jefferson Ave at 27th St Signalized 10.8 B 13.5 B 10.8 B 13.1 B 10.9 B 12.8 B 11.2 B 13.2 B 10.8 B 13.2 B 10.4 B 12.6 B Jefferson Ave at 26th St Signalized 9.8 A 10.5 B 10.5 B 10.8 B 11.0 B 11.1 B 8.6 A 9.1 A 10.7 B 12.4 B 10.5 B 12.6 B Jefferson Ave at MK J At 25th St Signalized 9.6 A 11.4 B 11.3 B 13.5 B 11.8 B 14.4 B 10.9 B 13.5 B 13.2 B 15.8 B 13.1 B 15.5 B Huntington Ave at 35th St Signalized 17.9 B 12.9 B 18.5 B 12.8 B 18.7 B 13.9 B 19.2 B 13.3 B 20.2 C 13.9 B 19.7 B 13.8 B Huntington Ave at 34th St Signalized 18.9 B 21.5 C 21.8 C 23.1 C 22.1 C 24.3 C 21.7 C 24.1 C 22.5 C 23.7 C 22.4 C 23.9 C Huntington Ave at 28th St Signalized 8.7 A 9.6 A 12.5 B 12.2 B 12.3 B 10.9 B 12.4 B 11.0 B 12.3 B 10.9 B 12.3 B 10.8 B Huntington Ave at 26th St Signalized 23.5 C 20.1 C 20.2 C 22.6 C 21.2 C 23.8 C 21.4 C 23.6 C 21.6 C 24.5 C 21.6 C 24.4 C Huntington Ave at MK J At 25th St Stop Control** 9.3 A 10.2 A 10.4 B 10.4 B 10.1 B 11.4 B 10.4 B 10.4 B 10.3 B 12.3 B 10.1 B 12.7 B erminal Ave at WB I-664 Off amp Stop Control** 9.1 A 9.6 A 9.8 A 10.8 B 9.3 A 10.2 B 9.4 A 11.1 B 9.6 A 10.0 B 9.6 A 10.0 B US 17 at ownpoint d Stop Control** F 85.0 F F F F F F F F F F F amp to I-664 South On US 17 Yield Control*** 11.2 B 11.7 B 18.5 C 21.3 C 17.4 C 20.2 C 16.6 C 19.2 C 9.2 C 8.1 C 17.8 C 21.0 C I-664 SB amps at Pughsville d Signalized 17.5 B 57.4 E 33.0 C 35.2 D 31.9 C 33.8 C 30.2 C 32.9 C 33.2 C 35.4 D 32.3 C 35.2 D I-664 NB Off-amp at Pughsville d Signalized 5.3 A 8.5 A 6.1 A 10.3 B 6.4 A 10.2 B 6.4 A 10.4 B 6.3 A 10.7 B 6.3 A 10.7 B April
104 raffic and ransportation echnical eport Intersection Control ype Existing 2040 No-Build 2040 Alternative A 2040 Alternative B 2040 Alternative C 2040 Alternative D AM PM AM PM AM PM AM PM AM PM AM PM Delay OS Delay OS Delay OS Delay OS Delay OS Delay OS Delay OS Delay OS Delay OS Delay OS Delay OS Delay OS (s) (s) (s) (s) (s) (s) (s) (s) (s) (s) (s) (s) I-664 SB amps at Dock anding d Signalized 7.4 A 11.6 B 13.1 B 14.1 B 13.2 B 14.1 B 13.4 B 14.3 B 13.7 B 15.4 B 13.7 B 15.4 B I-664 NB amps at Dock anding d Signalized 9.6 A 8.6 A 13.4 B 13.8 B 13.3 B 15.6 B 12.9 B 13.8 B 11.9 B 14.7 B 11.7 B 14.6 B W Military Hwy (US 13/58)/Airline Blvd at US 460 Alt/Joliff d Signalized 40.8 D 43.9 D 79.3 E 61.5 E 90.9 F 89.6 F 91.6 F 85.7 F 90.0 F 90.5 F 91.1 F 90.4 F W Military Hwy (US 460) at US 58/I-664 EB amps Stop Control** 15.2 B 10.8 B F 19.3 C 95.1 F 36.1 E F 38.5 E 27.6 D 23.3 C 25.5 D 22.9 C S Military Hwy (US 460) at S Military Hwy (US 13/460) Stop Control** 43.4 D 26.1 C F F F F F F F F F F I-664 EB Off-amp/Schaefer Ave at S Military Hwy (US 460) Stop Control** 83.3 F F F F F F F F F F F F VA 164 Interchanges VA 164 WB Off-amp at College Dr Signalized 5.5 A 6.2 A 6.0 A 9.5 A 5.7 A 8.7 A 6.2 A 10.1 B 5.5 A 8.1 A 5.6 A 8.5 A VA 164 EB On-amp at College Dr Signalized 5.2 A 6.0 A 6.0 A 8.9 A 6.1 A 9.1 A 6.1 A 9.3 A 5.8 A 8.3 A 5.8 A 8.6 A US 17 at College Dr Signalized 26.3 C 62.5 E 54.3 D F 72.5 E F 64.9 E F 68.0 E F 68.4 E F VA 164 WB amps at owne Point d* Signalized 18.9 B 18.9 B 22.3 C 21.0 C 20.4 C 20.6 C 23.2 C 22.6 C 21.7 C 20.7 C 19.8 B 20.7 C VA 164 EB amps at owne Point d* Signalized 19.6 B 30.6 C 25.5 C 63.8 E 25.1 C 64.0 E 34.9 C 69.1 E 19.7 B 56.0 E 20.3 C 61.2 E VA 164 WB amps at Cedar n Signalized 12.4 B 17.5 B 16.7 B 20.0 C 14.3 B 19.5 B 13.3 B 43.9 D 13.3 B 36.5 D 13.5 B 36.7 D VA 164 EB amps at Cedar n Signalized 11.2 B 5.6 A 17.2 B 6.5 A 17.2 B 6.5 A 39.8 D 6.9 A 42.2 D 5.2 A 49.8 D 5.3 A VA 164 WB amps at Virginia International Gateway Blvd Stop Control** 10.6 B 9.8 A 11.7 B 10.1 B 11.5 B 10.0 B 10.9 B 9.8 A 10.5 B 9.7 A 10.4 B 9.7 A Virginia International Gateway Blvd at Wild Duck n Stop Control** 11.7 B 10.5 B 16.1 C 11.4 B 16.0 C 11.1 B 15.4 C 11.1 B 11.7 B 10.9 B 11.6 B 10.8 B VA 164 EB amps at Virginia International Gateway Blvd Signalized 2.1 A 2.2 A 1.8 A 2.1 A 1.9 A 2.2 A 1.4 A 1.9 A 1.4 A 1.8 A 1.4 A 1.8 A VA 164 WB amps at W Norfolk d Stop Control** 10.2 B 12.9 B 12.7 B 22.4 C 12.5 B 23.5 C 13.4 B 28.7 D 11.7 B 16.3 C 11.2 B 15.2 C VA 164 EB amps at W Norfolk d Stop Control** 10.7 B 12.4 B 11.9 B 16.6 C 13.3 B 18.1 C 18.6 C 45.4 E 12.0 B 14.5 B 11.5 B 13.3 B aild Ave at ee Ave* Signalized 22.3 C 23.5 C 27.4 C 23.3 C 27.0 C 24.3 C 25.2 C 24.1 C 23.1 C 23.7 C 21.2 C 23.4 C aild Ave at VA 164 EB Off-amp* Signalized 98.8 F 12.9 B 47.5 D 14.6 B 48.5 D 13.0 B 68.8 E 14.9 B 49.4 D 14.6 B 50.1 D 14.7 B aild Ave at US 58 NB/VA 164 WB amps Signalized 17.5 B 17.0 B 18.5 B 18.0 B 18.2 B 16.2 B 18.2 B 16.1 B 17.2 B 16.2 B 17.2 B 16.4 B ee Ave at Woodrow St/Harper Ave Signalized 6.0 A 5.1 A 6.1 A 5.9 A 6.1 A 5.8 A 6.1 A 5.8 A 6.1 A 5.8 A 6.1 A 5.8 A April


")
105 raffic and ransportation echnical eport 5.2 KEY SUDY AEA SEGMEN IMPACS Figure 5-5: Forecast Segments o evaluate how the alternatives could improve traffic operations along the Study Area Corridors, VDO and FHWA worked with the Cooperating and Participating Agencies to identify four hot spots along the Study Area Corridors that currently experience high levels of congestion. As these areas experience high levels of congestion now, it can be anticipated that they also would be the most highly congested areas along the Study Area Corridors in the future. he agencies identified data available from the travel demand model that could be used to compare the alternatives. hese four sections are presented below along with summary tables and figures that show how different alternatives could improve operations in these hot spots. he four key study area segments are listed below, and shown in Figure 5-5: Hampton oads Bridge-unnel (HB) Segments F, G and H I-564 Segment I I Monitor Merrimac Memorial Bridge-unnel (MMMB) Segments C, D and E I Bowers Hill Segment A he impacts on these segments are discussed in Sections through he complete travel demand output from which the data for the above four segments was extracted is provided in Appendix K. April
106 raffic and ransportation echnical eport HB Figure 5-6: I-64 HB PM Peak raffic ravel ime Comparison able 5-5 shows the travel demand model output for the section of I-64 between I-664 and I-564, which includes the HB bottleneck. Several performance measures are provided that indicate projected travel demand on the facility (daily vehicles miles traveled) and the level of congestion (travel time delay and daily vehicle hours traveled). able 5-5 indicates that under No-Build conditions, both VM and VH are projected to increase, along with significant increases in delay, in particular in the westbound direction. Compared to the No-Build alternative, delays are projected to decline under all alternatives, with the largest reductions projected under Alternative D. Additionally, the improvements in travel time and reductions in delay are illustrated in Figures 5-6 through 5-8. Performance Measure PM Peak ravel ime (minutes) Speed (congested speed MPH) able 5-5: I-64 HB PM Peak ravel ime Comparison Existing (2015) No-Build (2034) Alternative A (2034) Alternative B (2034) Alternative C (2034) Alternative D (2034) EB WB EB WB Minutes % Decrease 31% Decrease 27% Decrease 42% Decrease 29% Decrease 31% Decrease 33% Decrease 49% Decrease ravel ime (EB) ravel ime (WB) No Build (2034) A (2034) B (2034) C (2034) D (2034) Delay (minutes) EB WB Figure 5-7: I-64 HB 2034 PM Peak Hour ravel ime for No-Build Conditions Daily VH 32,234 49,300 47,800 46,100 34,700 35,200 Daily VM 1,099,600 1,313,900 1,673,800 1,654,900 1,209,800 1,506,000 Minutes No Build ravel ime (minutes) ravel ime (EB) ravel ime (WB) April
107 raffic and ransportation echnical eport Figure 5-8: 2034 PM Peak Hour ravel ime Savings along I-64 HB compared to No-Build Conditions Figure 5-9: I-564 AM Peak raffic ravel ime Comparison Minutes ravel ime Savings (EB) A B C D ravel ime Savings (WB) Minutes No Change 100% Increase 67% Increase 67% Increase No Change 33% Increase 67% Increase 33% Increase ravel ime (EB) ravel ime (WB) No Build A B C D I-564 able 5-6 shows the travel demand model output for the section of I-564 and the Intermodal Connector between I- 64 and the proposed NI/Navy interchange. able 5-6 indicates that under No-Build and Alternative A conditions, both VM and VH are projected to increase, compared to existing conditions, although delays are projected to remain minimal. However, with the construction of the I-564 Connector, VA 164 Connector and I-664 Connector under Alternatives B, C and D, VM as well as VH is projected to increase considerably, because I-564 will carry traffic that will cross the Elizabeth iver. Along with these traffic volume increases, travel times are projected to increase, but because this section of I-564 comprises a relatively short segment, delay is not projected to increases more than two minutes under Alternative D. Additionally, changes in travel time and delay are illustrated in Figures 5-9 through Performance Measure AM Peak ravel ime (minutes) Speed (congested speed MPH) Delay (minutes) able 5-6: I-564 AM Peak ravel ime Comparison Existing (2015) No-Build (2034) Alternative A (2034) Alternative B (2034) Alternative C (2034) Alternative D (2034) EB WB EB WB EB WB Daily VH 1,024 1,200 1,200 2,900 5,800 5,400 Daily VM 51,200 67,500 68, , , ,500 Figure 5-10: I AM Peak Hour ravel ime for No-Build Conditions Minutes No Build ravel ime (minutes) ravel ime (EB) ravel ime (WB) April
108 raffic and ransportation echnical eport Minutes Figure 5-11: 2034 AM Peak Hour ravel ime Savings along I-564 compared to No-Build Conditions Note: Alternatives B, C, D include new location connections to VA 164 and/or I-664; the alternatives see in increase in travel time along I-564. here is no change in travel time under Alternative A MMMB A B* C* D* 2034 ravel ime Savings (EB) 2034 ravel ime Savings (WB) able 5-7 shows the travel demand model output for the section of I-664 between I-64 and College Drive, which includes the MMMB bottleneck. able 5-7 indicates that under No-Build conditions, both VM and VH are projected to increase, along with significant increases in delay, in particular in the eastbound direction. Compared to the No-Build alternative, delays are projected to decline under all alternatives, with the largest reductions projected under Alternatives C and D. Additionally, improvements in travel time and reductions in delay are illustrated in Figures 5-12 through Performance Measure PM Peak ravel ime (minutes) Speed (congested speed MPH) Delay (minutes) able 5-7: I-664 MMMB PM Peak ravel ime Comparison Existing (2015) No-Build (2034) Alternative A (2034) Alternative B (2034) Alternative C (2034) Alternative D (2034) EB WB EB WB EB WB Daily VH 18,551 26,100 21,300 20,900 26,300 23,400 Daily VM 838,200 1,087,800 1,018,300 1,006,900 1,475,500 1,352, Figure 5-12: I-664 MMMB PM Peak raffic ravel ime Comparison 14% Decrease 19% Decrease 43% Decrease 43% Decrease ravel ime (EB) 23% Decrease 23% Decrease 41% Decrease 46% Decrease ravel ime (WB) No Build A B C D April
 Figure 5-14: 2034 PM Peak Hour ravel ime Savings along I-664 MMMB compared to No-Build Conditions under Alternatives C and D in the eastbound direction, and under Alternatives B, C and D in")
109 raffic and ransportation echnical eport Figure 5-13: I-664 MMMB 2034 PM Peak Hour ravel ime for No-Build Conditions Minutes No Build ravel ime (minutes) ravel ime (EB) ravel ime (WB) Figure 5-14: 2034 PM Peak Hour ravel ime Savings along I-664 MMMB compared to No-Build Conditions under Alternatives C and D in the eastbound direction, and under Alternatives B, C and D in the westbound direction. In fact, under Alternatives C and D, delays are projected to be minimal with speeds at or near free-flow conditions during the PM peak period. Additionally, improvements in travel time and reductions in delay are illustrated in Figures 5-15 through Performance Measure PM Peak ravel ime (minutes) Speed (congested speed MPH) Delay (minutes) able 5-8: I-664 Bowers Hill PM Peak ravel ime Comparison Existing (2015) No-Build (2034) Alternative A (2034) Alternative B (2034) Alternative C (2034) Alternative D (2034) EB WB EB WB EB WB Daily VH 12,330 13,300 12,400 12,500 13,500 12,800 Daily VM 622, , , , , ,500 A B C D Figure 5-15: I-664 Bowers Hill PM Peak raffic ravel ime Comparison Minutes ravel ime Savings (EB) 2034 ravel ime Savings (WB) 5 5 Minutes No Change No Change 13% decrease 13% decrease 10% decrease 10% decrease 30% decrease 30% decrease I-664 Bowers Hill able 5-8 shows the travel demand model output for the section of I-664 between VA 164 and I-264, which includes the Bowers Hill bottleneck. able 5-8 indicates that under No-Build conditions, both VM and VH are projected to increase, along with a minor increase in delay in the westbound direction. Compared to the No-Build alternative, delays are projected to decline April
 5.2.")

110 raffic and ransportation echnical eport Figure 5-16: I-664 Bowers Hill 2034 PM Peak Hour ravel ime by Direction (No-Build) Distribution of Naval Station Norfolk rips A major traffic generator within Norfolk is the Naval Station Norfolk, for which I-564 is the primary access route. Construction of additional Elizabeth iver crossings could provide alternate access routes and provide relief to existing, over-saturated facilities. able 5-9 below indicates the percentage of trips that would be expected to use the HB, MMMB, I-564, I-564C, I-664C and VA 164C under each of the alternatives. able 5-9: Distribution of Naval Station Norfolk rips Minutes No-Build Alternative A Alternative B Alternative C Alternative D I-64 (HB) 8% 10% 9% 2% 3% I-664 (MMMB) 0.1% 0.1% 1% 8% 8% I-564 (Segment I) 35% 35% 31% 23% 25% I-564 C (Segment J) 14% 25% 25% I-664C (Segment K) 17% 17% VA 164C (Segment ) 14% 8% 8% Additional information on the distribution of trips related to the Naval base and various port facilities is provided in Appendix. Appendix M contains material prepared by the HPO depicting the source of trips using the Hampton oads crossings under each alternative NO-BUID AENAIVE Figure 5-17: 2034 PM Peak Hour ravel ime Savings along I-664 Bowers Hill Compared to No-Build Conditions Minutes As described in Section , the No-Build Alternative does not assume any improvements or capacity enhancements along any of the Study Area Corridors. All projects that are contained in the region s ong ange ransportation Plan are assumed to be in place. In consultation with VDO, the following roadway network modification were made as part of the 2040 No-Build forecast: Eliminated the US 460/US 58/US 13 Connector project; emoved tolls from all existing and proposed river crossings except for the Midtown unnel (US 58) and the Downtown unnel (I-264);and, Added third General Purpose lane to I-64 between I-264 (Bowers Hill interchange) and I-464, and one HOV lane in each direction. he HOV lane ties into the existing HOV system east of I-464, and has the same peak hour occupancy restrictions as the existing system hese roadway network modifications were retained for all 2040 modeling scenarios. he 2040 No-Build forecast shows continuing growth in regional traffic volumes throughout the region. Daily traffic volumes on the HB are projected to increase 23 percent compared to 2015 volumes (from 91,000 to 112,200 vehicles per day), while daily traffic volumes on the MMMB and VA 164 are projected to grow by 31 and 34 percent, respectively (from 69,300 to 90,700 and 49,000 to 65,600 vehicles per day, respectively). Detailed daily volumes for 2040 No-Build conditions, including daily turning movement volumes at the ramp terminal intersections, are provided in Appendix A in Figures A.1-1 through A Along with the daily volumes, AM and PM peak hour volumes increase correspondingly on the Study Area Corridor roadways. A summary of the 2040 No-Build mainline peak hour volumes is provided in Figure 5-2. Detailed AM and PM peak hour volumes for the 2040 No-Build Alternative, including turning movement volumes at the ramp terminal intersections, are provided in Appendix A in Figures A.2-1 through A April
111 raffic and ransportation echnical eport able 5-4 presents the intersection OS for all ramp terminal intersections. Detailed OS exhibits for the No-Build Alternative are provided in Appendix A in Figures A.3-1 through A Operational Analysis Capacity analyses of the 2040 No-Build peak hour volumes, shown in Figure 5-3, indicate increasingly poor operating conditions along I-64 and I-664, with a number of additional segments projected to operate at OS F, which represents a breakdown in traffic flow with volumes exceeding capacity. In particular, I-64 approaching the HB is projected to experience OS F beginning at interchanges that are further upstream compared to 2015 conditions. Similarly, I-664 westbound approaching the MMMB during the AM peak hour and I-664 eastbound during the PM peak hour is projected to experience OS F beginning at interchanges that are further upstream of the bridge-tunnel compared to 2015 conditions. raffic operations along VA 164 are projected to be worse than under existing conditions but remain generally acceptable (OS D or better). Along I-564, acceptable operating conditions of OS D or better are projected in the non-peak directions (eastbound during the AM peak hour, westbound during the PM peak hour). During the PM peak hour, OS F operating conditions are projected along eastbound I-564 between the erminal Boulevard onramp and the I-64/I-564 interchange. able 5-10 summarizes the No-Build OS by Study Area Corridor for key roadway segments. able 5-10: 2040 No-Build OS at Key oadway Segments oadway Segment AM Peak Eastbound Westbound Existing 2040 NB Existing 2040 NB HB F F F F MMMB C C F F VA 164 C D B C VA 164C I-564C I-664C oadway Segment PM Peak Eastbound Westbound Existing 2040 NB Existing 2040 NB HB F F F F MMMB F F C F VA 164 C C C D VA 164C I-564C I-664C Note: VA 164C, I-564C, and I-664C do not exist under this alternative. he same table is being presented for all alternatives for comparison purposes ravel ime In addition to worsening OS due to highly congested conditions, the end-to-end travel times along Study Area Corridors are generally projected to increase in the future along I-64 and I-664. Along VA 164, travel times would be similar to existing conditions. able 5-11 summarizes the average existing and No-Build travel times in minutes per vehicle by Study Area Corridor. It should be noted that these estimates were developed from planning-level capacity analysis output and are intended only to indicate relative changes in travel time between alternatives. Additional and/or different segments could be reported in the Final SEIS depending on the Preferred Alternative. able 5-11: 2040 No-Build Estimated End-to-End ravel ime by Study Area Corridor Segment Direction AM Peak ravel ime (minutes/vehicle) Existing 2040 NB I-64 Eastbound Westbound I-664 (I-64 to VA 164) Eastbound Westbound I-664 (VA 164 to I-264) Eastbound Westbound VA 164 Eastbound Westbound I-564; I-664 and I-564 Connectors Eastbound - - Westbound - - I-564; I-564 and VA 164 Connectors Eastbound - - Westbound - - Segment Direction PM Peak ravel ime (minutes/vehicle) Existing 2040 NB I-64 Eastbound Westbound I-664 (I-64 to VA 164) Eastbound Westbound I-664 (VA 164 to I-264) Eastbound Westbound VA 164 Eastbound Westbound I-564; I-664 and I-564 Connectors Eastbound - - Westbound - - I-564; I-564 and VA 164 Connectors Eastbound - - Westbound - - Note: VA 164C, I-564C, and I-664C do not exist under this alternative. he same table is being presented for all alternatives for comparison purposes. Estimates are based on HCS Facilities analysis results AENAIVE A As described in Section , Alternative A involves widening I-64 to three lanes in each direction from South Mallory Street to the I-64/I-564 interchange and construction of a new bridge-tunnel on the HB. he new lanes were coded into the HPO travel demand model, and the raw model output was processed as described in Section 2.4. he resulting daily traffic volumes on the key roadways are summarized in able 5-1. he 2040 Alternative A traffic forecast shows that the widening of I-64 between South Mallory Street and I-564 would result in a considerable shift of traffic volumes to the HB, along with a slight decrease in daily volume on April
112 raffic and ransportation echnical eport the MMMB compared to No-Build conditions. Projected daily traffic volumes on the HB would increase 23 percent compared to 2040 No-Build volumes (from 112,200 to 137,700 vehicles per day). Volumes would decrease approximately two percent both on the MMMB and on VA 164 (from 90,700 to 89,200 and from 65,600 to 64,000 vehicles per day, respectively), but would be greater than 2015 volumes. Detailed daily volumes for 2040 Alternative A conditions, including daily turning movement volumes at the ramp terminal intersections, are provided in Appendix B in Figures B.1-1 through B Detailed AM and PM peak hour volumes for Alternative A conditions, including turning movement volumes at the ramp terminal intersections, are provided in Appendix B in Figures B.2-1 through B able 5-4 presents the intersection OS for all ramp terminal intersections. Detailed OS exhibits for Alternative A are provided in Appendix B in Figures B.3-1 through B Operational Analysis Capacity analyses of the 2040 Alternative A peak hour volumes, provided in Figure 5-3, show that operations along I- 64 west of the HB are generally projected to be worse than 2040 No-Build conditions, with some segments approaching capacity (OS E). East of the HB, where additional capacity would be provided by widening the existing four-lane section to six lanes, operations are generally projected to improve compared to No-Build conditions, from OS E and OS F to OS D or better, except east of the ramp to I-564/Granby Street. Along I-664 and VA 164, where no capacity would be added, operations are generally projected to be comparable to 2040 No-Build conditions. Along I-564, acceptable operating conditions of OS D or better are projected in the non-peak directions (eastbound during the AM peak hour, westbound during the PM peak hour). During the PM peak hour, OS F operating conditions are projected between the erminal Boulevard on-ramp and the I-64/I-564 interchange, similar to the 2040 No-Build conditions. able 5-12 summarizes the Alternative A OS by Study Area Corridor. able 5-12: 2040 Alternative A Projected OS at Key oadway Segments oadway AM Peak Segment Eastbound Westbound Existing 2040 NB 2040 Alt A Existing 2040 NB 2040 Alt A HB F F F F F F MMMB C C C F F F VA 164 C D D B C C VA 164C I-564C I-664C oadway PM Peak Segment Eastbound Westbound Existing 2040 NB 2040 Alt A Existing 2040 NB 2040 Alt A HB F F F F F F MMMB F F F C F F VA 164 C C C C D D VA 164C I-564C I-664C Note: VA 164C, I-564C, and I-664C do not exist under this alternative. he same table is being presented for all alternatives for comparison purposes ravel ime Compared to 2040 No-Build conditions, end-to-end travel times along I-64 are projected to improve under Alternative A. he travel times along I-664 and VA 164 would be approximately the same under No-Build conditions and Alternative A conditions, with some slight improvements to the westbound I-664 travel time north of VA 164 during the AM peak and eastbound during the PM peak. able 5-13 summarizes the average travel times in minutes per vehicle by Study Area Corridor for Alternative A. It should be noted that these estimates were developed from planning-level capacity analysis output and are intended only to indicate relative changes in travel time between alternatives. Additional and/or different segments could be reported in the Final SEIS depending on the Preferred Alternative. April
113 raffic and ransportation echnical eport able 5-13: 2040 Alternative A Estimated End-to-End ravel ime by Study Area Corridor Segment Direction AM Peak ravel ime (minutes/vehicle) Existing 2040 NB 2040 Alt A I-64 Eastbound Westbound I-664 (I-64 to VA 164) Eastbound Westbound I-664 (VA 164 to I-264) Eastbound Westbound VA 164 Eastbound Westbound I-564; I-664 and I-564 Eastbound Connectors Westbound I-564; I-564 and VA 164 Eastbound Connectors Westbound Segment Direction PM Peak ravel ime (minutes/vehicle) Existing 2040 NB 2040 Alt A I-64 Eastbound Westbound I-664 (I-64 to VA 164) Eastbound Westbound I-664 (VA 164 to I-264) Eastbound Westbound VA 164 Eastbound Westbound I-564; I-664 and I-564 Eastbound Connectors Westbound I-564; I-564 and VA 164 Eastbound Connectors Westbound Note: VA 164C, I-564C, and I-664C do not exist under this alternative. he same table is being presented for all alternatives for comparison purposes. Estimates are based on HCS Facilities analysis results AENAIVE B As described in Section , Alternative B involves widening I-64 to three lanes in each direction from South Mallory Street to the I-64/I-564 interchange and construction of a new bridge-tunnel on the HB; construction of the I-564 and VA 164 connectors; and widening VA 164 between the proposed VA 164/VA 164 Connector interchange and the VA 164/I-664 interchange from four to six lanes. his alternative also assumes completion of the interchange (currently under construction) at I-564 and the Norfolk International erminal (NI) and Naval Station Norfolk. Under the Alternative B forecast, this interchange would not only provide access to the Port and Navy facilities but also to other destinations along Hampton Boulevard. he Alternative B forecast does not assume that traffic using this interchange is restricted to Port or Navy traffic only and assumes full access to and from areas to the west. However, as the study advances and stakeholder input is received, it may be necessary to consider access limitations on this interchange. Forecasts would be revised accordingly. he new lanes were coded into the HPO travel demand model; and, the raw model output was processed as described in Section 2.4. he resulting daily traffic volumes on the key roadways are summarized in able 5-1. As shown in able 5-1, compared to 2040 No-Build conditions, the capacity expansions under Alternative B would result in an increase in daily traffic volume on the HB, and a decrease in traffic on the MMMB. Projected daily traffic volumes on the HB would increase 19 percent compared to 2040 No-Build volumes (to 133,400). Volumes on the MMMB would decrease eight percent (to 83,100) and increase 20 percent on VA 164 (to 78,400). he increase in traffic on the HB is smaller than that under Alternative A; likewise, the decrease in traffic on the MMMB is larger than under Alternative A. raffic volumes on VA 164 would increase substantially compared to Alternative A, due to the additional capacity provided in the Study Area Corridor. here is substantial traffic demand on the I-564 and VA 164 Connectors, indicating that this new connection serves a need for improved connectivity between the southwestern Hampton oads region and the Naval and port facilities in the Norfolk area. Detailed daily volumes for Alternative B conditions, including daily turning movement volumes at the ramp terminal intersections, are provided in Appendix C in Figures C.1-1 through C Detailed AM and PM peak hour volumes for Alternative B conditions, including turning movement volumes at the ramp terminal intersections, are provided in Appendix C in Figures C.2-1 through C able 5-4 presents the intersection OS for all ramp terminal intersections. Detailed OS exhibits are provided in Appendix C in Figures C.3-1 through C Operational Analysis Capacity analyses of the 2040 Alternative B peak hour volumes, provided in Figure 5-3, show that operations along I- 64 would improve slightly compared to No-Build and Alternative A conditions, with fewer segments approaching or exceeding capacity (OS E or OS F), but the HB and some other segments east of the ramp to I-564/Granby Street would continue to operate at OS F. he HB is projected to operate at OS D in the westbound direction during the PM peak only, but OS F in the westbound direction during the AM peak hour and in the eastbound direction during both the AM and the PM peak hour. Along I-664, where no capacity would be added, operations are generally projected to be comparable to 2040 No- Build conditions and Alternative A conditions. Along VA 164 where capacity is added, operations are generally projected to be comparable to existing conditions and OS D or better, with the exception of westbound VA 164 during the PM peak hour, where four segments between the West Norfolk oad interchange and the Cedar ane interchange would be approaching capacity (OS E). Along I-564, acceptable operating conditions of OS D or better are projected in the non-peak directions (eastbound during the AM peak hour, westbound during the PM peak hour). During the PM peak hour, OS F operating conditions are projected between the erminal Boulevard on-ramp and the I-64/I-564 interchange. able 5-14 summarizes the Alternative B OS by Study Area Corridor. April
114 raffic and ransportation echnical eport able 5-14: 2040 Alternative B Projected OS at Key oadway Segments oadway AM Peak Segment Eastbound Westbound Existing 2040 NB 2040 Alt B Existing 2040 NB 2040 Alt B HB F F F F F F MMMB C C C F F F VA 164 C D C B C B VA 164C - - C - - B I-564C - - C - - B I-664C oadway PM Peak Segment Eastbound Westbound Existing 2040 NB 2040 Alt B Existing 2040 NB 2040 Alt B HB F F F F F D MMMB F F F C F F VA 164 C C C C D C VA 164C - - B - - C I-564C - - B - - C I-664C Note: I-664C does not exist under this alternative. he same table is being presented for all alternatives for comparison purposes ravel ime Compared to 2040 No-Build conditions, end-to-end travel times along I-64 and I-664 are projected to improve under Alternative B. he reduction in travel times for I-64 would be greater under Alternative B than under Alternative A, particularly in the westbound direction during the PM peak hour. he travel times along I-664, both north and south of VA 164 would be approximately the same under No-Build conditions and Alternative B conditions. he travel times along VA 164 would be approximately the same under No-Build conditions and Alternative B conditions. able 5-15 summarizes the average travel times in minutes per vehicle by Study Area Corridor for Alternative B. It should be noted that these estimates were developed from planning-level capacity analysis output and are intended only to indicate relative changes in travel time between alternatives. Additional and/or different segments could be reported in the Final SEIS depending on the Preferred Alternative. able 5-15: 2040 Alternative B Estimated End-to-End ravel ime by Study Area Corridor Segment Direction AM Peak ravel ime (minutes/vehicle) Existing 2040 NB 2040 Alt B I-64 Eastbound Westbound I-664 (I-64 to VA 164) Eastbound Westbound I-664 (VA 164 to I-264) Eastbound Westbound VA 164 Eastbound Westbound I-564; I-664 and I-564 Eastbound Connectors Westbound I-564; I-564 and VA 164 Eastbound Connectors Westbound Segment Direction PM Peak ravel ime (minutes/vehicle) Existing 2040 NB 2040 Alt B I-64 Eastbound Westbound I-664 (I-64 to VA 164) Eastbound Westbound I-664 (VA 164 to I-264) Eastbound Westbound VA 164 Eastbound Westbound I-564; I-664 and I-564 Eastbound Connectors Westbound I-564; I-564 and VA 164 Eastbound Connectors Westbound Note: I-664C does not exist under this alternative. he same table is being presented for all alternatives for comparison purposes. Estimates are based on HCS Facilities analysis results AENAIVE C As described in Section , Alternative C involves widening I-664 to four lanes in each direction from the I-64 interchange to the VA 164 interchange and construction of a new bridge-tunnel on the MMMB; widening I-664 to three lanes in each direction from the VA 164 interchange to the I-64/I-264 interchange; and construction of the I- 564, I-664 and VA 164 connectors. Although this alternative also includes transit-only lanes along the I-564 and I-664 connectors, as well as I-664 north of the MMMB, for traffic forecasting and analysis purposes, these transit-only lanes were not considered, because the November 2015 DP assessment of future transit ridership indicated minimal impact on the number of vehicle trips within the study area. his alternative also assumes completion of the interchange (currently under construction) at I-564 and the Norfolk International erminal (NI) and Naval Station Norfolk. Under the Alternative C forecast, this interchange would not only provide access to the Port and Navy facilities but also to other destinations along Hampton Boulevard. he Alternative C forecast does not assume that traffic using this interchange is restricted to Port or Navy traffic only and April
115 raffic and ransportation echnical eport assumes full access to and from areas to the west. However, as the study advances and stakeholder input is received, it may be necessary to consider access limitations on this interchange. Forecasts would be revised accordingly. he new lanes were coded into the HPO travel demand model; and, the raw model output was processed as described in Section 2.4. he resulting daily traffic volumes on the key roadways are summarized in able 5-1. As shown in able 5-1, the capacity expansions under Alternative C would result in an opposite shift in traffic patterns compared to the traffic pattern changes in Alternatives A and B. With the added capacity on the MMMB, compared to 2040 No-Build conditions, daily traffic volumes are projected to decrease eight percent on the HB (to 103,600) and increase 41 percent on the MMMB (to 127,700). raffic volumes on VA 164 are projected to decrease approximately 18 percent compared to No-Build conditions. Projected traffic volumes on VA 164 are lower than the increases under Alternatives A and B, with the I-664 Connector absorbing some of the traffic volume instead. Detailed daily volumes for Alternative C conditions, including daily turning movement volumes at the ramp terminal intersections, are provided in Appendix D in Figures D.1-1 through D Detailed AM and PM peak hour volumes for Alternative C conditions, including turning movement volumes at the ramp terminal intersections, are provided in Appendix D in Figures D.2-1 through D able 5-4 presents the intersection OS for all ramp terminal intersections. Detailed OS exhibits are provided in Appendix D in Figures D.3-1 through D Operational Analysis Capacity analyses of the 2040 Alternative C peak hour volumes show that operations along I-64 would be worse than those under Alternative A and B, but generally slightly better than under 2040 No-Build conditions, with five fewer segments during each peak hour in which volume exceeds capacity (OS F). he additional capacity along I-664 is generally expected to result in acceptable operating conditions of OS D or better along the I-664 Study Area Corridor, including the MMMB. However, without additional improvements, increased peak hour volumes are projected to result in OS F operations along westbound I-664 during the PM peak hour, approaching I-64. he section of I-664 through the Bowers Hill interchange would continue to operate at OS E or OS F in both directions during both the AM and the PM peak hour. raffic operations along VA 164 would be acceptable; even without widening of this Study Area Corridor, the shift in volume to the I-664 Connector would result in OS D or better along VA 164. Along I-564, acceptable operating conditions of OS D or better are projected in the non-peak directions (eastbound during the AM peak hour, westbound during the PM peak hour). Under Alternative C, westbound I-564 would operate at OS F through the I-64/I-564 interchange during the AM peak hour, compared to OS D under 2040 No- Build conditions. During the PM peak hour, OS F operations are projected between the Intermodal Connector onramp and the I-64/I-564 interchange. able 5-16 summarizes the Alternative C OS by Study Area Corridor. able 5-16: 2040 Alternative C Projected OS at Key oadway Segments oadway AM Peak Segment Eastbound Westbound Existing 2040 NB 2040 Alt C Existing 2040 NB 2040 Alt C HB F F F F F F MMMB C C A F F B VA 164 C D C B C B VA 164C - - A - - A I-564C - - C - - C I-664C - - C - - C oadway PM Peak Segment Eastbound Westbound Existing 2040 NB 2040 Alt C Existing 2040 NB 2040 Alt C HB F F F F F F MMMB F F B C F A VA 164 C C C C D C VA 164C - - A - - A I-564C - - C - - D I-664C - - C - - C ravel ime Compared to 2040 No-Build conditions, end-to-end travel times along I-64 and I-664 are generally projected to improve under Alternative C. he reduction in travel times for I-64 would be less under Alternative C than under Alternative A or B, and remain greater than existing conditions. ravel time along I-664 from VA 164 to I-664, in the westbound direction, would be greater under Alternative C compared to 2040 No-Build conditions, due to the shift in traffic volumes from the HB to the I-664 Connector and MMMB. he eastbound travel times during both peaks and the westbound travel time in the AM peak along I-664 would be reduced by Alternative C improvements. he travel times along VA 164 would be approximately the same under No-Build conditions and Alternative C conditions. he end-to-end travel times along I-564, the I-564 Connector, and VA 164 connector would be similar between Alternative B and Alternative C. able 5-17 summarizes the average travel times in minutes per vehicle by Study Area Corridor for Alternative C. It should be noted that these estimates were developed from planning-level capacity analysis output and are intended only to indicate relative changes in travel time between alternatives. Additional and/or different segments could be reported in the Final SEIS depending on the Preferred Alternative. April
116 raffic and ransportation echnical eport able 5-17: 2040 Alternative C Estimated End-to-End ravel ime by Study Area Corridor Segment Direction AM Peak ravel ime (minutes/vehicle) Existing 2040 NB 2040 Alt C I-64 Eastbound Westbound I-664 (I-64 to VA 164) Eastbound Westbound I-664 (VA 164 to I-264) Eastbound Westbound VA 164 Eastbound Westbound I-564; I-664 and I-564 Eastbound Connectors Westbound I-564; I-564 and VA 164 Eastbound Connectors Westbound Segment Direction PM Peak ravel ime (minutes/vehicle) Existing 2040 NB 2040 Alt C I-64 Eastbound Westbound I-664 (I-64 to VA 164) Eastbound Westbound I-664 (VA 164 to I-264) Eastbound Westbound VA 164 Eastbound Westbound I-564; I-664 and I-564 Eastbound Connectors Westbound I-564; I-564 and VA 164 Eastbound Connectors Westbound Estimates are based on HCS Facilities analysis results AENAIVE D As described in Section , Alternative D involves widening I-64 to three lanes in each direction from South Mallory Street to the I-64/I-564 interchange and construction of a new bridge-tunnel on the HB; widening I-664 to four lanes in each direction from the I-64 interchange to the VA 164 interchange and construction of a new bridgetunnel on the MMMB; widening I-664 to three lanes in each direction from the VA 164 interchange to the I-64/I- 264 interchange; widening VA 164 to three lanes in each direction between the proposed VA 164/VA 164 Connector interchange and the VA 164/I-664 interchange; and construction of the I-564, I-664 and VA 164 connectors. his alternative also assumes completion of the interchange (currently under construction) at I-564 and the Norfolk International erminal (NI) and Naval Station Norfolk. Under the Alternative D forecast, this interchange would not only provide access to the Port and Navy facilities but also to other destinations along Hampton Boulevard. he Alternative D forecast does not assume that traffic using this interchange is restricted to Port or Navy traffic only and assumes full access to and from areas to the west. However, as the study advances and stakeholder input is received, it may be necessary to consider access limitations on this interchange. Forecasts would be revised accordingly. he new lanes were coded into the HPO travel demand model; and, the raw model output was processed as described in Section 2.4. he resulting daily traffic volumes on the key roadways are summarized in able 5-1. As shown in able 5-1, the capacity expansions under Alternative D would result in the highest combined volumes on the HB and MMMB. Daily traffic volumes are projected to increase 11 percent on the HB and 27 percent on the MMMB compared to 2040 No-Build conditions, to 124,200 and 114,900, respectively. raffic volumes on VA 164 are projected to decrease approximately 14 percent compared to No-Build conditions, less than the decrease under Alternative C, but increase approximately 14 percent compared to existing conditions. he projected increase along VA 164 is lower than the increases under Alternatives A and B and 2040 No-Build Conditions, with the I-664 Connector absorbing some of this traffic volume increase, despite the additional capacity provided on VA 164 under Alternative D. Detailed daily volumes for Alternative D conditions, including daily turning movement volumes at the ramp terminal intersections, are provided in Appendix E in Figures E.1-1 through E Detailed AM and PM peak hour volumes for Alternative D conditions, including turning movement volumes at the ramp terminal intersections, are provided in Appendix E in Figures E.2-1 through E able 5-4 presents the intersection OS for all ramp terminal intersections. Detailed OS exhibits are provided in Appendix E in Figures E.3-1 through E Operational Analysis Capacity analyses of the 2040 Alternative D peak hour volumes, provided in Figure 5-3, show that operations along I- 64 are generally projected to be acceptable (OS D or better), except east of the ramp to I-564/Granby Street. Volumes on the HB would approach capacity (OS E) under this alternative in all but the westbound PM peak hour, when acceptable OS D operations are projected. However, Alternative D is the only alternative that does not project OS F operations on the HB. Similar to 2040 No-Build conditions, OS F operations are projected between the I-664 interchange and asalle Avenue during the AM peak hour in both directions. Operating conditions along I-664 under Alternative D would be comparable to Alternative C and improved compared to No-Build conditions. he additional capacity along I-664 generally would result in acceptable operating conditions throughout this Study Area Corridor, including the MMMB. However, without additional improvements, increased peak hour volumes are projected to result in OS F operations along westbound I-664 during the PM peak hour, approaching I-64. he section of I-664 through the Bowers Hill interchange would continue to operate at OS E or F in both directions during both the AM and the PM peak hour. raffic operations along VA 164 are projected to be acceptable; the shift in volume to the I-664 Connector would result in OS D or better along VA 164. Along I-564, acceptable operating conditions of OS D or better are projected in the non-peak directions (eastbound during AM peak, westbound during PM peak). Under Alternative D, westbound I-564 would operate at OS F through the I-64/I-564 interchange during the AM peak hour, compared to OS D under 2040 No-Build conditions. During the PM peak hour, failing OS is projected between the Intermodal Connector on-ramp and the I-64/I-564 interchange. able 5-18 summarizes the Alternative D OS by Study Area Corridor. April
117 raffic and ransportation echnical eport able 5-18: 2040 Alternative D Projected OS at Key oadway Segments oadway AM Peak Segment Eastbound Westbound Existing 2040 NB 2040 Alt D Existing 2040 NB 2040 Alt D HB F F E F F E MMMB C C A F F B VA 164 C D B B C B VA 164C - - A - - A I-564C - - C - - C I-664C - - C - - B oadway PM Peak Segment Eastbound Westbound Existing 2040 NB 2040 Alt D Existing 2040 NB 2040 Alt D HB F F E F F D MMMB F F B C F A VA 164 C C B C D B VA 164C - - A - - A I-564C - - C - - C I-664C - - C - - C ravel ime Compared to 2040 No-Build conditions, end-to-end travel times along I-64 and I-664 are projected to improve the most under Alternative D. he reduction in travel times for I-64 would be greatest under Alternative D and travel times are projected to be less than the existing conditions. ravel time along I-664 from VA 164 to I-664, in the westbound direction, would be greater under Alternative D compared to 2040 No-Build conditions, but less than the travel time under Alternative C conditions. ravel times along I-664 in the westbound direction during the AM peak and the eastbound direction during the PM peak are projected to be similar under Alternative C and Alternative D and less than the travel times under 2040 No-Build conditions. he travel times along VA 164 would be approximately the same under No-Build conditions and Alternative D conditions. he end-to-end travel times along I-564, the I-564 Connector, and VA 164 connector would be similar between Alternative B, Alternative C, and Alternative D. he travel times along I-564, the I-564 Connector, and the I-664 Connector would be similar between Alternative C and Alternative D. able 5-19 summarizes the average travel times in minutes per vehicle by Study Area Corridor for Alternative D. It should be noted that these estimates were developed from planning-level capacity analysis output and are intended only to indicate relative changes in travel time between alternatives. Additional and/or different segments could be reported in the Final SEIS depending on the Preferred Alternative. able 5-19: 2040 Alternative D Estimated End-to-End ravel ime by Study Area Corridor Segment Direction AM Peak ravel ime (minutes/vehicle) Existing 2040 NB 2040 Alt D I-64 Eastbound Westbound I-664 (I-64 to VA 164) Eastbound Westbound I-664 (VA 164 to I-264) Eastbound Westbound VA 164 Eastbound Westbound I-564; I-664 and I-564 Eastbound Connectors Westbound I-564; I-564 and VA 164 Eastbound Connectors Westbound Segment Direction PM Peak ravel ime (minutes/vehicle) Existing 2040 NB 2040 Alt D I-64 Eastbound Westbound I-664 (I-64 to VA 164) Eastbound Westbound I-664 (VA 164 to I-264) Eastbound Westbound VA 164 Eastbound Westbound I-564; I-664 and I-564 Eastbound Connectors Westbound I-564; I-564 and VA 164 Eastbound Connectors Westbound Estimates are based on HCS Facilities analysis results. April

118 raffic and ransportation echnical eport 6. OPENING YEA 2028 FOECASS AND ANAYSES 6.1 SUMMAY A summary of daily traffic volumes on key roadway links within the study area is provided in able 6-1. A comparison of daily traffic volumes on the HB and MMMB for 2015 and 2028 conditions is provided in Figure 6-1. able 6-1: 2028 Daily raffic Volumes at Key oadway Segments oadway Segment No Alt A 2028 Alt B 2028 Alt C 2028 Alt D Build HB 91, , , ,900 91, ,500 MMMB, north of I-664C 69,300 81,200 79,600 74, ,400 97,400 MMMB, south of I-664C 69,300 81,200 79,600 74, , ,800 VA 164* 49,000 59,400 57,700 68,700 49,300 49,700 VA 164C ,800 24,800 26,200 I-564C ,800 75,000 72,600 I-664C ,600 54,600 * Between the owne Point oad and College Drive Interchanges Daily Volume 140, , ,000 80,000 60,000 40,000 20,000 Figure 6-1: 2028 Projected Daily raffic Volumes at the HB and MMMB able 6-2 presents the intersection OS for all ramp terminal intersections for the Existing, 2028 No-Build, and 2028 Build Alternatives. Detailed daily volumes for 2028 No-Build conditions, including daily turning movement volumes at the ramp terminal intersections, are provided in Appendix F in Figures F.1-1 through F Detailed AM and PM peak hour volumes for 2028 No-Build conditions, including turning movement volumes at the ramp terminal intersections, are provided in Appendix F in Figures F.2-1 through F Detailed OS exhibits for the 2028 No-Build Alternative are provided in Appendix F in Figures F.3-1 through F Detailed daily volumes for 2028 Alternative A conditions, including daily turning movement volumes at the ramp terminal intersections, are provided in Appendix G in Figures G.1-1 through G Detailed AM and PM peak hour volumes for 2028 Alternative A conditions, including turning movement volumes at the ramp terminal intersections, are provided in Appendix G in Figures G.2-1 through G Detailed OS exhibits for 2028 Alternative A are provided in Appendix G in Figures G.3-1 through G Detailed daily volumes for 2028 Alternative B conditions, including daily turning movement volumes at the ramp terminal intersections, are provided in Appendix H in Figures H.1-1 through H Detailed AM and PM peak hour volumes for 2028 Alternative B conditions, including turning movement volumes at the ramp terminal intersections, are provided in Appendix H in Figures H.2-1 through H Detailed OS exhibits for 2028 Alternative B are provided in Appendix H in Figures H.3-1 through H Detailed daily volumes for 2028 Alternative C conditions, including daily turning movement volumes at the ramp terminal intersections, are provided in Appendix I in Figures I.1-1 through I Detailed AM and PM peak hour volumes for 2028 Alternative C conditions, including turning movement volumes at the ramp terminal intersections, are provided in Appendix I in Figures I.2-1 through I Detailed OS exhibits for 2028 Alternative C are provided in Appendix I in Figures I.3-1 through I Detailed daily volumes for 2028 Alternative D conditions, including daily turning movement volumes at the ramp terminal intersections, are provided in Appendix J in Figures J.1-1 through J Detailed AM and PM peak hour volumes for 2028 Alternative D conditions, including turning movement volumes at the ramp terminal intersections, are provided in Appendix J in Figures J.2-1 through J Detailed OS exhibits for 2028 Alternative D are provided in Appendix J in Figures J.3-1 through J NB 2028 A 2028 B 2028 C 2028 D HB MMMB, north of I-664C Figure 6-2 shows the mainline volume for each roadway segment along the Study Area Corridors for the Existing, 2028 No-Build, and 2028 Build Alternatives. Figure 6-3 presents a summary of the projected mainline OS. his summary is provided in the same format as the volume exhibit in Figure 6-2, and shows the projected mainline OS as well as the projected OS for each merge, diverge, and weaving area along all Study Area Corridors for each alternative. Mainline average travel speeds are presented in Figure 6-4. April
DRAFT SECTION 4(F) EVALUATION FAIRVIEW CEMETERY
 EVALUATION FAIRVIEW CEMETERY") DRAFT SECTION 4(F) EVALUATION I. DESCRIPTION OF SECTION 4(F) RESOURCE The Section 4(f) resource that could be affected by the proposed action is Fairview Cemetery. The proposed action would require the
DRAFT SECTION 4(F) EVALUATION I. DESCRIPTION OF SECTION 4(F) RESOURCE The Section 4(f) resource that could be affected by the proposed action is Fairview Cemetery. The proposed action would require the
Attachments: Memo from Lisa Applebee, ACHD Project Manager PowerPoint Slides for October 27, 2009 Work Session
 Date: October 22, 2009 To: From: Re: Mayor and City Council Karen Gallagher Transportation Planner Fairview Avenue Concept Design and Access Management Plan Update and Public Outreach Plan Requested Action:
Napa County Planning Commission Board Agenda Letter
 Agenda Date: 7/1/2015 Agenda Placement: 10A Continued From: May 20, 2015 Napa County Planning Commission Board Agenda Letter TO: FROM: Napa County Planning Commission John McDowell for David Morrison -
APPENDIX C. TRANSPORTATION TECHNICAL REPORT
 APPENDIX C. TRANSPORTATION TECHNICAL REPORT Environmental Assessment November 2016 South Central Light Rail Extension This page is intentionally left blank. Environmental Assessment November 2016 South
Chapter 12 Summary Merrimack Valley Regional Transportation Plan 206
 Chapter 12 Summary Two overarching themes emerge through this RTP. First, the MVMPO is focusing its efforts on repairing and improving existing infrastructure to be safer and operate for multiple modes.
ORLEANS GARDENS SHOPPING CENTRE 1615 ORLEANS BOULEVARD CITY OF OTTAWA, ONTARIO TRAFFIC UPDATE. Prepared for:
 ORLEANS GARDENS SHOPPING CENTRE 1615 ORLEANS BOULEVARD CITY OF OTTAWA, ONTARIO TRAFFIC UPDATE Prepared for: Orleans Gardens Shopping Centre Inc. 2851 John Street, Suite 1 Markham, ON K3R 5R7 June 12, 2015
Uniform Rules Update Final EIR APPENDIX 6 ASSUMPTIONS AND CALCULATIONS USED FOR ESTIMATING TRAFFIC VOLUMES
 APPENDIX 6 ASSUMPTIONS AND CALCULATIONS USED FOR ESTIMATING TRAFFIC VOLUMES ASSUMPTIONS AND CALCULATIONS USED FOR ESTIMATING TRAFFIC VOLUMES This appendix contains the assumptions that have been applied
UNIVERSITY OF FLORIDA CAMPUS MASTER PLAN, : YEAR 2020 ROADWAY SYSTEM NEEDS PLAN
 UNIVERSITY OF FLORIDA CAMPUS MASTER PLAN, 2010-2020: YEAR 2020 ROADWAY SYSTEM NEEDS PLAN Prepared for: UNIVERSITY OF FLORIDA Prepared by: Revised July 2011 UF Campus Master Plan, 2010-2020, Year 2020 UF
Napa County Planning Commission Board Agenda Letter
 Agenda Date: 3/4/2015 Agenda Placement: 10A Napa County Planning Commission Board Agenda Letter TO: FROM: Napa County Planning Commission David Morrison - Director Planning, Building and Environmental
Our Project file: TPI-2017P Highway 27, Vaughan, Proposed Restaurant, Parking Justification Study Letter Response to Study Peer Review
 13 February 22, 2018 c/o Ms. Nicole Sampogna Associate Planner Evans Planning Inc. 8481 Keele Street, Unit 12 Vaughan, Ontario, L4K1Z7 Our Project file: TPI-2017P004 Re: 9732 Highway 27, Vaughan, Proposed
Illinois Asphalt Pavement Association. March 12, 2013
 Illinois Asphalt Pavement Association March 12, 2013 Illinois Tollway Perspective Collaboration Common goals Comprehensive solutions Communications People will pay for value Commitment Leadership Building
Rail Haverhill Viability Study
 Rail Haverhill Viability Study The Greater Cambridge City Deal commissioned and recently published a Cambridge to Haverhill Corridor viability report. http://www4.cambridgeshire.gov.uk/citydeal/info/2/transport/1/transport_consultations/8
FOR IMMEDIATE RELEASE Contact: Jan Kemp, ext June 29, 2009 Joelle McGinnis, ext
 NEWS FOR IMMEDIATE RELEASE Contact: Jan Kemp, ext. 2381 June 29, 2009 Joelle McGinnis, ext. 2380 630-241-6800 www.illinoistollway.com ILLINOIS TOLLWAY SUSPENDS CONSTRUCTION LANE CLOSURES OVER FOURTH OF
AGENDA ITEM 2 A Action Item. Brian James, Planning and Marketing Manager. Cameron Park Route Changes with Expansion of Service to El Dorado Hills
 AGENDA ITEM 2 A Action Item MEMORANDUM DATE: June 1, 2017 TO: FROM: SUBJECT: Brian James, Planning and Marketing Manager Cameron Park Route Changes with Expansion of Service to El Dorado Hills REQUESTED
Rebuilding And Expanding The Illinois Tollway With Minimal Impact To The Daily Customer
 Rebuilding And Expanding The Illinois Tollway With Minimal Impact To The Daily Customer Paul D. Kovacs, P.E., Chief Engineering Officer September 26, 2017 Illinois Tollway 292-mile system comprised of
Napa County Planning Commission Board Agenda Letter
 Agenda Date: 4/21/2010 Agenda Placement: 9A Napa County Planning Commission Board Agenda Letter TO: FROM: Napa County Planning Commission John McDowell for Hillary Gitelman - Director Conservation, Development
TABLE OF CONTENTS. Page. Page
 TABLE OF CONTENTS Chapter 1 INTRODUCTION... 1-1 Background... 1-1 Planning Benefits... 1-1 Comprehensive Planning Law... 1-4 County Partnership... 1-5 Advisory Committee and Staff Structure... 1-5 Plan
Food Primary Liquor License Amendment
 City of Surrey PLANNING & DEVELOPMENT REPORT Food Primary Liquor License Amendment Proposal: Permit a food primary liquor license with hours of liquor service past midnight for a newly-approved eating
Members. Ex-Officio Members
 Nogales Border Crossing Update By: James B. Manson Chairman Nogales, Arizona December 12, 2011 Who We Are Created in December 2004 Main purpose is to foster the economic growth of the region, to improve
Special Interchange Design National Perception vs. Urban Reality. Traffic Engineering and Safety Conference October 14, 2015
 Special Interchange Design National Perception vs. Urban Reality Traffic Engineering and Safety Conference October 14, 2015 Presentation Purpose System interchanges interstate-to-interstate Myth vs. reality
COLORADO REVISED STATUTES, TITLE 35, AGRICULTURE
 COLORADO REVISED STATUTES, TITLE 35, AGRICULTURE ARTICLE 29.5: COLORADO WINE INDUSTRY DEVELOPMENT ACT Section 35-29.5-101. Short title. 35-29.5-101.5. Legislative declaration. 35-29.5-102. Definitions.
MBA 503 Final Project Guidelines and Rubric
 MBA 503 Final Project Guidelines and Rubric Overview There are two summative assessments for this course. For your first assessment, you will be objectively assessed by your completion of a series of MyAccountingLab
Whether to Manufacture
 Whether to Manufacture Butter and Powder or Cheese A Western Regional Research Publication Glen T. Nelson Station Bulletin 546 November 1954 S S De&dim9 S Whether to Manufacture Butterand Powder... or
Waterways Suitability Assessment Process. LCDR Dan McQuate Office of Facility and Port Compliance, Facilities and Cargo Division (CG-FAC-2)
") Waterways Suitability Assessment Process LCDR Dan McQuate Office of Facility and Port Compliance, Facilities and Cargo Division (CG-FAC-2) References 33 CFR 127 NFPA 59A NVIC 01-2011 Sandia National Laboratory
Waterways Suitability Assessment Process LCDR Dan McQuate Office of Facility and Port Compliance, Facilities and Cargo Division (CG-FAC-2) References 33 CFR 127 NFPA 59A NVIC 01-2011 Sandia National Laboratory
How Rest Area Commercialization Will Devastate the Economic Contributions of Interstate Businesses. Acknowledgements
 How Rest Area Commercialization Will Devastate the Economic Contributions of Interstate Businesses Acknowledgements The NATSO Foundation, a charitable 501(c)(3) organization, is the research and educational
Mango Retail Performance Report 2017
 Mango Retail Performance Report 2017 1 Table of Contents Pages 3-9 Pages 10-15 Pages 16-34 Pages 35-44 Pages 45-51 Pages 52-54 Executive Summary Fruit and Tropical Fruit Performance Whole Mango Performance
1. Expressed in billions of real dollars, seasonally adjusted, annual rate.
 ROUTPUT -- Real GNP/GDP 1. Expressed in billions of real dollars, seasonally adjusted, annual rate. 2. First Monthly Vintage: 1965:M11 First Quarterly Vintage: 1965:Q4 3. First Observation: 1947:Q1 4.
PART 2. SIGNS Chapter 2J. Specific Service (Logo) Signs
 Signs") PART 2. SIGNS Chapter 2J. Specific Service (Logo) Signs TABLE OF CONTENTS Chapter 2J. SPECIFIC SERVICE SIGNS Page Section 2J.a Introduction............................................................ 2J-1
PART 2. SIGNS Chapter 2J. Specific Service (Logo) Signs TABLE OF CONTENTS Chapter 2J. SPECIFIC SERVICE SIGNS Page Section 2J.a Introduction............................................................ 2J-1
Economic Contributions of the Florida Citrus Industry in and for Reduced Production
 Economic Contributions of the Florida Citrus Industry in 2014-15 and for Reduced Production Report to the Florida Department of Citrus Alan W. Hodges, Ph.D., Extension Scientist, and Thomas H. Spreen,
AWRI Refrigeration Demand Calculator
 AWRI Refrigeration Demand Calculator Resources and expertise are readily available to wine producers to manage efficient refrigeration supply and plant capacity. However, efficient management of winery
Standing Committee on Planning, Transportation and Environment
 ADMINISTRATIVE REPORT Report Date: September 20, 2013 Contact: Tom Hammel Contact No.: 604.873.7545 RTS No.: 10229 VanRIMS No.: 08-2000-20 Meeting Date: October 9, 2013 TO: FROM: SUBJECT: Standing Committee
TYPE II LAND USE APPLICATION Winery Events Special Use Permit
 LAND MANAGEMENT DIVISION Date Received: TYPE II LAND USE APPLICATION Winery Events Special Use Permit PUBLIC WORKS DEPARTMENT 3050 N. DELTA HWY, EUGENE OR 97408 Planning: 541-682-3577 For Office Use Only
Retailing Frozen Foods
 61 Retailing Frozen Foods G. B. Davis Agricultural Experiment Station Oregon State College Corvallis Circular of Information 562 September 1956 iling Frozen Foods in Portland, Oregon G. B. DAVIS, Associate
Moscone Center Garage Parking Analysis FINAL REPORT. Prepared for. Prepared by. Adavant Consulting. and. LCW Consulting
 Moscone Center Garage Parking Analysis FINAL REPORT Prepared for Prepared by Adavant Consulting and LCW Consulting October 20, 2017 Moscone Center Garage Parking Analysis FINAL REPORT Prepared for Prepared
ECONOMIC IMPACT OF LEGALIZING RETAIL ALCOHOL SALES IN BENTON COUNTY. Produced for: Keep Dollars in Benton County
 ECONOMIC IMPACT OF LEGALIZING RETAIL ALCOHOL SALES IN BENTON COUNTY Produced for: Keep Dollars in Benton County Willard J. Walker Hall 545 Sam M. Walton College of Business 1 University of Arkansas Fayetteville,
Ergon Energy Corporation Limited 21 July 2010
 Ergon Energy Corporation Limited 21 July 2010 Disclaimer While care was taken in preparation of the information in this discussion paper, and it is provided in good faith, Ergon Energy Corporation Limited
Multi-State Truck Stop Inventory and Assessment Update on Activities in NYMTC Region
 Multi-State Truck Stop Inventory and Assessment Update on Activities in NYMTC Region presented to Stakeholder Group Meeting presented by Howie Mann, NYMTC Dan Baer, STV Christopher Titze, Cambridge Systematic
Resource Consent Applications for Te Ara o Hei (Coromandel Walks) Project
 Project") Memo Information 1 Resource Consent Applications for Te Ara o Hei (Coromandel Walks) Project TO FROM DATE 24 August 2017 SUBJECT Thames-Coromandel District Council Sam Napia, Director Strategic Relationships
Memo Information 1 Resource Consent Applications for Te Ara o Hei (Coromandel Walks) Project TO FROM DATE 24 August 2017 SUBJECT Thames-Coromandel District Council Sam Napia, Director Strategic Relationships
THE ECONOMIC IMPACT OF BEER TOURISM IN KENT COUNTY, MICHIGAN
 THE ECONOMIC IMPACT OF BEER TOURISM IN KENT COUNTY, MICHIGAN Dan Giedeman, Ph.D., Paul Isely, Ph.D., and Gerry Simons, Ph.D. 10/8/2015 THE ECONOMIC IMPACT OF BEER TOURISM IN KENT COUNTY, MICHIGAN EXECUTIVE
Updating Training Package Products Cookery Qualifications. Consultation Briefing Paper
 Updating Training Package Products Cookery Qualifications Consultation Briefing Paper January 2019 Contents 1.0 Background... 3 2.0 Training Package Products in scope... 4 3.0 Proposed changes streamline,
Preserving New Orleans Bridges
 Preserving New Orleans Bridges THE CONDITION AND FUNDING NEEDS OF NEW ORLEANS AGING BRIDGE SYSTEM OCTOBER 2018 WWW.TRIPNET.ORG Founded in 1971, TRIP of Washington, DC, is a nonprofit organization that
TITLE: AMENDMENT TO STANDISH TOWN CODE, CHAPTER 181, LAND USE PART I (ZONING)
") DRAFT 11/13/12 TITLE: AMENDMENT TO STANDISH TOWN CODE, CHAPTER 181, LAND USE PART I (ZONING) ORDERED, that the Town of Standish hereby ordains the following amendments to the Land Use Ordinance, effective
DRAFT 11/13/12 TITLE: AMENDMENT TO STANDISH TOWN CODE, CHAPTER 181, LAND USE PART I (ZONING) ORDERED, that the Town of Standish hereby ordains the following amendments to the Land Use Ordinance, effective
Date: April 3, Project #: Re: Burlington Mall Retail Collection Transportation Evaluation
 To: Chuck Schneider Burlington S&S, LLC 225 West Washington Street Indianapolis, IN 46204 From: Patrick Dunford, P.E. Senior Project Manager Date: Project #: 13482.01 Re: Burlington Mall Retail Collection
1) What proportion of the districts has written policies regarding vending or a la carte foods?
 What proportion of the districts has written policies regarding vending or a la carte foods?") Rhode Island School Nutrition Environment Evaluation: Vending and a La Carte Food Policies Rhode Island Department of Education ETR Associates - Education Training Research Executive Summary Since 2001,
Rhode Island School Nutrition Environment Evaluation: Vending and a La Carte Food Policies Rhode Island Department of Education ETR Associates - Education Training Research Executive Summary Since 2001,
School Breakfast and Lunch Program Request for Proposal
 School Breakfast and Lunch Program Provident Charter School 1400 Troy Hill Road Pittsburgh, PA 15212 412-709-5160 Date Proposal Opens: Wednesday, July 12, 2017 @ 12pm Bid Due Date: Wednesday, July 26,
OIV Revised Proposal for the Harmonized System 2017 Edition
 OIV Revised Proposal for the Harmonized System 2017 Edition TABLE OF CONTENTS 1. Preamble... 3 2. Proposal to amend subheading 2204.29 of the Harmonized System (HS)... 4 3. Bag-in-box containers: a growing
Ideas for group discussion / exercises - Section 3 Applying food hygiene principles to the coffee chain
 Ideas for group discussion / exercises - Section 3 Applying food hygiene principles to the coffee chain Activity 4: National level planning Reviewing national codes of practice and the regulatory framework
Notes on the Philadelphia Fed s Real-Time Data Set for Macroeconomists (RTDSM) Capacity Utilization. Last Updated: December 21, 2016
 Capacity Utilization. Last Updated: December 21, 2016") 1 Notes on the Philadelphia Fed s Real-Time Data Set for Macroeconomists (RTDSM) Capacity Utilization Last Updated: December 21, 2016 I. General Comments This file provides documentation for the Philadelphia
1 Notes on the Philadelphia Fed s Real-Time Data Set for Macroeconomists (RTDSM) Capacity Utilization Last Updated: December 21, 2016 I. General Comments This file provides documentation for the Philadelphia
Architectural Review Board Report
 Architectural Review Board Report To: From: Subject: Architectural Review Board Architectural Review Board Meeting: August 16, 2010 Steve Traeger, Principal Urban Designer Laura Beck, ARB Liaison Agenda
MOBILE FOOD VENDING TEXT AMENDMENT COMMUNITY INPUT MEETING
 MOBILE FOOD VENDING TEXT AMENDMENT COMMUNITY INPUT MEETING August 11, 2016 Welcome & Introductions Meeting Purpose Project background Review current standards and recommended standards Concerns and Feedback
1. Continuing the development and validation of mobile sensors. 3. Identifying and establishing variable rate management field trials
 Project Overview The overall goal of this project is to deliver the tools, techniques, and information for spatial data driven variable rate management in commercial vineyards. Identified 2016 Needs: 1.
IL. l I. j: : ~i~' t 1. Gf1 ' fxcifang_e JAN J.~r1 t ~OMMISSION OF THE EUROPEAN COMMUNITIES. ai~vfr51ty CF PITTSBURGt' LIBRARIES
 1 l t 1 t i l I H 1,,. ' :,! ~,. ~. IL. JCd.Motf6t{ j: : ~i~' ~OMMISSION OF THE EUROPEAN COMMUNITIES COl4(78) 588 final Brussels, 9 NoV.ember 1978 \. ai~vfr51ty CF PITTSBURGt' LIBRARIES J.~r1 t 61979 Gf1
Fromage Frais and Quark (Dairy and Soy Food) Market in Australia - Outlook to 2020: Market Size, Growth and Forecast Analytics
 Market in Australia - Outlook to 2020: Market Size, Growth and Forecast Analytics") Fromage Frais and Quark (Dairy and Soy Food) Market in Australia - Outlook to 2020: Market Size, Growth and Forecast Analytics Fromage Frais and Quark (Dairy and Soy Food) Market in Australia - Outlook
Fromage Frais and Quark (Dairy and Soy Food) Market in Australia - Outlook to 2020: Market Size, Growth and Forecast Analytics Fromage Frais and Quark (Dairy and Soy Food) Market in Australia - Outlook
North America Ethyl Acetate Industry Outlook to Market Size, Company Share, Price Trends, Capacity Forecasts of All Active and Planned Plants
 North America Ethyl Acetate Industry Outlook to 2016 - Market Size, Company Share, Price Trends, Capacity Forecasts of All Active and Planned Plants Reference Code: GDCH0416RDB Publication Date: October
Grape Growers of Ontario Developing key measures to critically look at the grape and wine industry
 Grape Growers of Ontario Developing key measures to critically look at the grape and wine industry March 2012 Background and scope of the project Background The Grape Growers of Ontario GGO is looking
IN THE TRUMBULL COUNTY COURT EASTERN DISTRICT TRUMBULL COUNTY, OHIO
 IN THE TRUMBULL COUNTY COURT EASTERN DISTRICT TRUMBULL COUNTY, OHIO RE: AMENDMENT OF BOND ) SCHEDULE AND TRAFFIC ) JOURNAL ENTRY VIOLATIONS BUREAU OF ) THE COURT ) Effective January 31, 2018 and pursuant
Fedima Position Paper on Labelling of Allergens
 Fedima Position Paper on Labelling of Allergens Adopted on 5 March 2018 Introduction EU Regulation 1169/2011 on the provision of food information to consumers (FIC) 1 replaced Directive 2001/13/EC. Article
COUNTY OF MONTEREY CONTRACTS/PURCHASING DIVISION
 COUNTY OF MONTEREY CONTRACTS/PURCHASING DIVISION Date: August 13, 2009 To: From: Department Heads Michael R. Derr- Contracts/Purchasing Officer Subject: County Vending Machine Policy The following information
A. CALL TO ORDER B. STATEMENT OF THE CHAIR C. BYLAWS D. ADJOURNMENT
 TOWN OF OLIVER Public Hearing Meeting Agenda October 10, 2017, at 7:00 PM Council Chambers Page A. CALL TO ORDER B. STATEMENT OF THE CHAIR C. BYLAWS 1. Zoning Amendment Bylaw 365 Zinfandel Avenue - Contract
Saudi Arabia Iced/Rtd Coffee Drinks Category Profile
 Saudi Arabia Iced/Rtd Coffee Drinks Category Profile - 2015 Saudi Arabia Iced/Rtd Coffee Drinks Category Profile - 2015 The Business Research Store is run by Sector Publishing Intelligence Ltd. SPi has
P O L I C I E S & P R O C E D U R E S. Single Can Cooler (SCC) Fixture Merchandising
 Fixture Merchandising") P O L I C I E S & P R O C E D U R E S Single Can Cooler (SCC) Fixture Merchandising Policies and s for displaying non-promotional beer TBS Marketing Written: August 2017 Effective date: November 2017 1
P O L I C I E S & P R O C E D U R E S Single Can Cooler (SCC) Fixture Merchandising Policies and s for displaying non-promotional beer TBS Marketing Written: August 2017 Effective date: November 2017 1
Illinois State Toll Highway Authority Minutes of the Engineering-Planning Committee Meeting January 27, 2011
 Illinois State Toll Highway Authority Minutes of the Engineering-Planning Committee Meeting January 27, 2011 The Illinois State Toll Highway Authority held an Engineering-Planning Committee Meeting on
Fleurieu zone (other)
") Fleurieu zone (other) Incorporating Southern Fleurieu and Kangaroo Island wine regions, as well as the remainder of the Fleurieu zone outside all GI regions Regional summary report 2006 South Australian
Fleurieu zone (other) Incorporating Southern Fleurieu and Kangaroo Island wine regions, as well as the remainder of the Fleurieu zone outside all GI regions Regional summary report 2006 South Australian
Simplified Summer Feeding Program
 Simplified Summer Feeding Program 1 Meal Requirements Morning: Program Basics Afternoon: Program Details Review regulations on meal service Identify the rules around offer vs serve and practice identifying
COMMISSION OF THE EUROPEAN COMMUNITIES. Proposal for a COUNCIL REGULATION
 EN COMMISSION OF THE EUROPEAN COMMUNITIES Brussels, 19.10.1999 COM(1999) 489 final 99/0206 (ACC) Proposal for a COUNCIL REGULATION on the conclusion of Agreements in the form of Exchanges of Letters amending
TOWN OF EMMITSBURG 2009 COMPREHENSIVE PLAN
 TOWN OF EMMITSBURG 2009 COMPREHENSIVE PLAN Emmitsburg Town Council Public Comment Draft August 13, 2009 Town of Emmitsburg 300A South Seton Avenue Emmitsburg, MD 21727 www.emmitsburgmd.gov TOWN OF EMMITSBURG
77th OREGON LEGISLATIVE ASSEMBLY Regular Session
 th OREGON LEGISLATIVE ASSEMBLY--0 Regular Session House Bill 0 Introduced and printed pursuant to House Rule.00. Presession filed (at the request of Governor John A. Kitzhaber, M.D., for Department of
Healthy Food Procurement in the County of Los Angeles Public Health Alliance of Southern California Leadership Council May 31, 2013
 Healthy Food Procurement in the County of Los Angeles Public Health Alliance of Southern California Leadership Council May 31, 2013 Michelle Wood, MPP Division of Chronic Disease and Injury Prevention
DEVELOPMENT OF A WDM STRATEGY USING BALANCED SCORECARD METHODOLOGY R S Mckenzie and J N Bhagwan*
 DEVELOPMENT OF A WDM STRATEGY USING BALANCED SCORECARD METHODOLOGY R S Mckenzie and J N Bhagwan* Presented by Ronnie McKenzie WRP (Pty) Ltd, South Africa Photo: Courtesy Zama Siqalaba Dual Water meter
Dairy Market R E P O R T
 Volume 17 No. 5 Dairy Market R E P O R T May 2014 DMI NMPF Overview Many key milk and dairy product prices continued to set records in April. And while the dairy futures markets indicate that prices will
Ideas + Action for a Better City learn more at SPUR.org. tweet about this #IsDrivingReallyFree?
 Ideas + Action for a Better City learn more at SPUR.org tweet about this event: @SPUR_Urbanist #IsDrivingReallyFree? Austin Brown, Ph.D. Executive Director SPUR Forum 9/26/2017 Is Driving Really Free?
(A report prepared for Milk SA)
") South African Milk Processors Organisation The voluntary organisation of milk processors for the promotion of the development of the secondary dairy industry to the benefit of the dairy industry, the consumer
South African Milk Processors Organisation The voluntary organisation of milk processors for the promotion of the development of the secondary dairy industry to the benefit of the dairy industry, the consumer
1407 San Pablo Avenue
 Z O N I N G A D J U S T M E N T S B O A R D S t a f f R e p o r t FOR BOARD ACTION APRIL 26, 2012 1407 San Pablo Avenue UP #11-10000054 to establish a full service restaurant with incidental service of
MARKET NEWSLETTER No 93 April 2015
 Focus on OLIVE OIL IMPORT TRENDS IN RUSSIA Russian imports of olive oil and olive pomace oil grew at a constant rate between 2/1 and 213/14 when they rose from 3 62 t to 34 814 t (Chart 1). The only exceptions
ECONOMICS OF COCONUT PRODUCTS AN ANALYTICAL STUDY. Coconut is an important tree crop with diverse end-uses, grown in many states of India.
 ECONOMICS OF COCONUT PRODUCTS AN ANALYTICAL STUDY Introduction Coconut is an important tree crop with diverse end-uses, grown in many states of India. Coconut palm is the benevolent provider of the basic
Get Schools Cooking Application
 Get Schools Cooking Application Application Instructions Get Schools Cooking (GSC) provides a broad range of support to participating districts, offering peer to peer relationships, training opportunities,
Trip Generation at Fast Food Restaurants
 Trip Generation at Fast Food Restaurants in Saudi Arabia This study developed trip generation rates at fast food restaurants in Jeddah, Saudi Arabia. The results showed that vehicle trip rates were not
Liquor License Amendment - Change of Hours
 City of Surrey PLANNING & DEVELOPMENT REPORT Liquor License Amendment - Change of Hours Proposal: Liquor primary license amendment to extend hours of liquor service. Recommendation: Denial Location: 10458-137
OREGON WINE COUNTRY PLATES TOURISM PROMOTION DISTRIBUTION GUIDELINES
 OREGON WINE COUNTRY PLATES TOURISM PROMOTION DISTRIBUTION GUIDELINES OREGON TOURISM COMMISSION 250 Church Street SE, Suite 100 Salem, Oregon 97301 503.967.1560 Overview ORS 805.274 mandates that, After
Food and beverage services statistics - NACE Rev. 2
 Food and beverage services statistics - NACE Rev. 2 Statistics Explained Data extracted in October 2015. Most recent data: Further Eurostat information, Main tables and Database. This article presents
Demand for Commercial Heavy Truck Parking on Interstate Highways: A Case Study of I-81 in Virginia
 Demand for Commercial Heavy Truck Parking on Interstate Highways: A Case Study of I-81 in Virginia Nicholas J. Garber Professor Department of Civil Engineering University of Virginia Charlottesville, VA
STAFF REPORT. Zoning Text Amendment #PLN , Limited/Craft Breweries and Distilleries (Countywide)
") COUNTY OF PRINCE WILLIAM 5 County Complex Court, Prince William, Virginia 22192-9201 PLANNING MAIN (703) 792-7615 FAX (703) 792-4758 OFFICE wwwpwcgovorg/planning Christopher M Price, AICP Director of Planning
COUNTY OF PRINCE WILLIAM 5 County Complex Court, Prince William, Virginia 22192-9201 PLANNING MAIN (703) 792-7615 FAX (703) 792-4758 OFFICE wwwpwcgovorg/planning Christopher M Price, AICP Director of Planning
Streamlining Food Safety: Preventive Controls Brings Industry Closer to SQF Certification. One world. One standard.
 Streamlining Food Safety: Preventive Controls Brings Industry Closer to SQF Certification One world. One standard. Streamlining Food Safety: Preventive Controls Brings Industry Closer to SQF Certification
IFPTI Fellowship Cohort V: Research Presentation Matthew Coleman, R.S., CP-FS
 ifpti.org IFPTI Fellowship Cohort VI: IFPTI Fellowship Cohort V: Research Presentation Matthew Coleman, R.S., CP-FS Priya Nair 2016-2017 2015-2016 Use of Critical Control Points(CCPs) In Florida Seafood
APPENDIX F. Lee County, FL Gasparilla Island CSRM draft integrated section 934 report & draft environmental assessment
 APPENDIX F Lee County, FL Gasparilla Island CSRM draft integrated section 934 report & draft environmental assessment I. Overview Public Access and Sharing Assessment The project is located in Lee County,
SYLLABUS. Departmental Syllabus. Food Production II CULN0140. Departmental Syllabus. Departmental Syllabus. Departmental Syllabus
 DATE OF LAST REVIEW: 02/2013 CIP CODE: 12.0505 SYLLABUS SEMESTER: COURSE TITLE: COURSE NUMBER: Food Production II CULN0140 CREDIT HOURS: 4 INSTRUCTOR: OFFICE LOCATION: OFFICE HOURS: TELEPHONE: EMAIL: KCKCC
PUBLIC NOTICE The Illinois State Toll Highway Authority Schedule of Committee Meetings September 11, 2015
 PUBLIC NOTICE The Illinois State Toll Highway Authority Schedule of Committee Meetings September 11, 2015 Public Notice is hereby given of the schedule for the Board Committee Meetings to be held during
THE ECONOMIC IMPACT OF WINE AND WINE GRAPES ON THE STATE OF TEXAS 2015
 THE ECONOMIC IMPACT OF WINE AND WINE GRAPES ON THE STATE OF TEXAS 2015 A Frank, Rimerman + Co. LLP Report Updated January 2017 This study was commissioned by the Texas Wine and Grape Growers Association
Napa Highway 29 Open Wineries
 4 5 6 7 8 9 35 4 45 5 55 Sonoma State University Business 58-Business Intelligence Problem Set #6 Key Dr. Cuellar Trend Analysis-Analyzing Tasting Room Strategies 1. Graphical Analysis a. Show graphically
Step 1: Prepare To Use the System
 Step : Prepare To Use the System PROCESS Step : Set-Up the System MAP Step : Prepare Your Menu Cycle MENU Step : Enter Your Menu Cycle Information MODULE Step 5: Prepare For Production Step 6: Execute
2016 Traffic Data Report For The Illinois Tollway System
 2016 Traffic Data Report For The Illinois Tollway System Prepared for Illinois State Highway Authority Prepared by: Illinois State Toll Highway Authority Traffic Data Report 2016 C O T E T S SECTIO 1:
Academic Year 2014/2015 Assessment Report. Bachelor of Science in Viticulture, Department of Viticulture and Enology
 Academic Year 2014/2015 Assessment Report Bachelor of Science in Viticulture, Department of Viticulture and Enology Due to changes in faculty assignments, there was no SOAP coordinator for the Department
Gasoline Empirical Analysis: Competition Bureau March 2005
 Gasoline Empirical Analysis: Update of Four Elements of the January 2001 Conference Board study: "The Final Fifteen Feet of Hose: The Canadian Gasoline Industry in the Year 2000" Competition Bureau March
Pasta Market in Italy to Market Size, Development, and Forecasts
 Pasta Market in Italy to 2019 - Market Size, Development, and Forecasts Published: 6/2015 Global Research & Data Services Table of Contents List of Tables Table 1 Demand for pasta in Italy, 2008-2014 (US
TOWN OF GAWLER POLICY
 TOWN OF GAWLER POLICY Policy Section: Policy Name: Classification: 3. Development, Environment & Regulatory Services Mobile Food Vendors Public Council Policy Adopted: June 2018 Frequency of Review: Triennial
Lab Evaluation of Tollway SMA Surface Mixes With Varied ABR Levels Steve Gillen Illinois Tollway
 Lab Evaluation of Tollway SMA Surface Mixes With Varied ABR Levels Steve Gillen Illinois Tollway Illinois Asphalt Pavement Association March 14, 2016 Tollway s Green Initiatives for Stone Matrix Asphalt
The Elefsina Stavros Spata A/P motorway (ESSM), extending along approximately 51 km,
, extending along approximately 51 km,") Managing traffic on Urban Limited Access Facilities. Ingress through tolling and egress to large scale generators as keys to relieve congestion. The case of Attica Tollway in Athens, Greece. Bill Halkias
Managing traffic on Urban Limited Access Facilities. Ingress through tolling and egress to large scale generators as keys to relieve congestion. The case of Attica Tollway in Athens, Greece. Bill Halkias
Supports Item No. 2 CS&B Committee Agenda November 18, 2010
 Supports Item No. 2 CS&B Committee Agenda November 18, 2010 ADMINISTRATIVE REPORT Report Date: October 29, 2010 Contact: Lucia Cumerlato Contact No.: 604.871.6461 RTS No.: 08884 VanRIMS No.: 08-2000-20
BOARD OF ZONING ADJUSTMENT STAFF REPORT Date: June 4, 2018
 # 5 BOA-000511-2018 BOARD OF ZONING ADJUSTMENT STAFF REPORT Date: June 4, 2018 CASE NUMBER 6182 APPLICANT NAME LOCATION VARIANCE REQUEST ZONING ORDINANCE REQUIREMENT ZONING AREA OF PROPERTY ENGINEERING
Acreage Forecast
 World (John Sandbakken and Larry Kleingartner) The sunflower is native to North America but commercialization of the plant took place in Russia. Sunflower oil is the preferred oil in most of Europe, Mexico