To: Professor Roger Bohn & Hyeonsu Kang Subject: Big Data, Assignment April 13th. From: xxxx (anonymized) Date: 4/11/2016
|
|
|
- Mitchell West
- 6 years ago
- Views:
Transcription
1 To: Professor Roger Bohn & Hyeonsu Kang Subject: Big Data, Assignment April 13th. From: xxxx (anonymized) Date: 4/11/2016 Data Preparation: 1. Separate trany variable into Manual which takes value of 1 and 0 (1 means manual, 0 means automatic), and Speed that takes category of 3-speed, 4 speed and 5 speed. 2. Change variable tcharger and scharger to dummy variables that take value of 1 and 0 (1 means tcharger, 0 means not tcharger; same with scharger ) 3. Convert displ into gallon instead of liter. 4. Convert year variable in to dummy variable after 2014 which indicates whether it is before or after Generate an interaction term using after 2014 * Manual Part A: Summary: Our target is MPG. While including many factors that we think are important to MPG, we also tried different model variations such as adding interaction terms manual ## after 2014, subtracting variables one by one. Our conclusion is that variables that included in Model 1 explains MPG the best, also the interpretation of the result makes sense in the real world. Model 1: Based on my understanding of the topic, I believe there are several important factors that affects the MPG of a car: # of cylinders, engine displacement, drive type, fuel type, manual or automatic, year made, turbocharged or supercharged. Unit: all relevant variable in the model is in the unit of gallon. Target: combo08 Input: cylinders, displ_gal, drive, fueltype1, manual, speed, year, tcharger, scharger Other parameters: seed: , partition: 70/30/0
2 MPG = * # of cylinders 7.25 * Engine displacement {0.58 if drive4-wheel Drive, 1.58 if drive4-wheel or All-Wheel Drive, if driveall-wheel Drive, if drivefront- Wheel Drive, 1.77 if drive Part-time 4-Wheel Drive, 0.17 if driverear-wheel Drive} {5.19 if fuletype1 Midgrade, 7.85 if fueltype1nuaturalgas, 6.99 if fueltype1premium, 7.1 if fueltype1regular} + {0.69 if manual, 0 if automatic} * # of year {1.19 if turbocharged, 0 if not} {0.84 if supercharged, 0 if not} This training output shows that all variables included in the model are significant except the drive type driverear-wheel Drive and driveall-wheel Drive. In addition, # of cylinders, Engine displacement, drive types, fueltype, turbocharged, and supercharged are all negatively associated with MPG; while # of year and transmission type is positively associated with MPG. Evaluation: The result actually makes sense, as technology getting more and more advanced, the cars that were made more recently will have higher MPG. Also, manual cars on average have higher MPG than automatic cars. The Pseudo R-square is 0.80, which means 80% of the variation in y can explained by all the predictors. Figure 1 Model 2: Considering the fact that far more cars in 2014 are automatic than manual, but that may not be true at the start of the data set, we generated a after 2014 variable which denotes the cars

3 are produced after 2014 if it is 1, and before 2014 if it is 0. We created an interaction term of after 2014 * manual, to see is there an additional effect of being manual car that were produced after Unit: all relevant variable in the model is in the unit of gallon. Target: combo08 Input: cylinders, displ_gal, drive, fueltype1, manual, year after 2014, tcharger, scharger, year after 2014##manual Other parameters: seed: , partition: 70/30/0 MPG = * # of cylinders 6.24 * Engine displacement + {1.35 if drive4-wheel Drive, if drive4-wheel or All-Wheel Drive, 1.66 if driveall-wheel Drive, 3.43 if drivefront-wheel Drive, if drive Part-time 4-Wheel Drive, 0.17 if driverear-wheel Drive} + {0.55 if manual, 0 if automatic} + {3.28 if year after 2014, 0 if before 2014} {0.46 if turbocharged, 0 if not} {0.68 if supercharged, 0 if not} + {-0.19 if manual after 2014, 0 if not manual after 2014} Evaluation: As Figure 2 shows, the Pseudo R-square is 0.66, which is lower than Model 1. In addition, reading the actual regression equation for Model 2 above, the interpretation doesn t make as much sense as Model 1. Especially for the coefficient on the interaction term manual after 2014, it is hard to comprehend why there is a negative effect. Figure 2:

4 Part B: Summary: The target is Manual. We comparing different models trying to find out the one that has the highest accuracy prediction percentage based on confusion matrix. We conclude that Model 2 including Speed and vclass is the best model based on analysis, which can correctly predict 92% of validation dataset. Model 1: Unit: all relevant variable in the model is in the unit of gallon. Target: Manual Input: city08, Co2TailpipeGpm, cylinders, displ_gal, drive, fueltype1, year, highway08, tcharger, scharger Other parameters: seed: , partition: 70/30/0 Manual (0,1) = β1 * mpg in city + β2 * Co2TailpipeGpm + β3 * # OF CYLINDERS + β4 * displacement in gallon + β5* drive type + β6 * fuel type + β7 * year + β8 * mgp in highway + β9 * turbo charged + β10 * super changed Coefficients Table:
5 Table 1 and 2 show that the model can correctly predict 7003 automatic cases, which is 63% of all the validation data; and it can also correctly predict 947 manual cases, which is 9% of all the validation data. For the rest of 28%, the model failed to predict. Table 1 Confusion Matrix of Model 1 Prediction on Validation dataset (count) Predicted Automatic Manual Actual Automatic Manual Table 2 Confusion Matrix of Model 1 Prediction on Validation dataset (percentage) Predicted Error Rate Automatic Manual Actual Automatic Manual Model 2: We include speed and vclass variable, while dropping drive and fueltype1. Unit: all relevant variable in the model is in the unit of gallon. Target: Manual Input: city08, Co2TailpipeGpm, cylinders, displ_gal, drive, fueltype1, year after 2014, highway08, tcharger, scharger Other parameters: seed: , partition: 70/30/0 Manual (0,1) = β1 * mpg in city + β2 * Co2TailpipeGpm + β3 * # OF CYLINDERS + β4 * displacement in gallon + β5i* speed type + β6i * EPA vehicle size class + β7 * year + β8 * mgp in highway + β9 * turbo charged + β10 * super changed
6

7 *As we can see from the coefficient table, the Speed variable is insignificant in the model. Thus, we tried to exclude Speed; however, in the confusion matrix showed a dramatic accuracy percentage drop. Thus, we decide to keep it in our model. Table 3 and 4 show that the model can correctly predict 6698 automatic cases, which is 62% of all the validation data; and it can also correctly predict 3227 manual cases, which is 30% of all the validation data. For the rest of 8%, the model failed to predict. The accuracy rate is higher than the previous model. Table 3 Confusion Matrix of Model 2 Prediction on Validation dataset (count) Predicted Automatic Manual Actual Automatic Manual Table 4 Confusion Matrix of Model 2 Prediction on Validation dataset (percentage) Predicted Error Rate Automatic Manual Actual Automatic Manual
8 Part C: Summary: After running a linear regression and classifying cars according to the transmission type, we want to create a model that determines how the variables interact with other variables to play an effect on determining the outcome of the combined MPG for fuel type 1. The inclusion of these interaction terms will provide a more accurate model that assesses the relationship between the inputs and target variable. Specifically, the age of the car should be interacted with the input variables because cars are engineered to become more efficient over time. For our working model, we categorized the years into decades, where the variable names are: eighties, nineties, twothousand, and twoten. Respectively, these variables translate into these values: values from the 1980s, values from the 1990s, values from the 2000s, and values from the 2010s. Model without interaction terms Unit: all relevant variable in the model is in the unit of gallon. Target: combo08 Input: cylinders, displ_gal, drive, fueltype1, manual, year dummies, tcharger, scharger Other parameters: seed: 12345, partition: 70/30/0 Before we create models with interacted terms, we ran a model with the created year dummy variables. We will use the results from this model as our baseline case to compare our interacted models. The Rattle output is shown in Appendix A while the graphical results are shown below: A) Graphical depiction of the data distribution
9 B) Predicted vs. Observed Model
10 Model with year##manual Next, we included the interaction term between years and whether the car runs on manual transmission or not. This is an important interaction to observe because we can hypothesize that cars that manufactured in more recent years are less likely to be run on manual transmission. Thus, this pattern could be correlated with patterns observed in MPG. The model is as follows: comb08=b 0 +city08+b 1 co2tailpipegpm+ B 2 cylinders + B 3 displ_ga+ B 4 drive +.B K eighties*manual +B K+1 nineties*manual + B k+2 twothousand*manual+ B k+3 twoten*manual When the model was placed into Rattle, it produced the following results: 1 A) Predicted vs. Observed Model 1 The summary of the linear regression model is shown in Appendix B.
11 The model shows the Pseudo R-squared is.9952, which shows that the observed points fit the predicted model very well. Also, the regression analysis shows that two of the interactions showed statistical significance, implying that they have some effect on determining the target variable. Model with year##pv4 In addition, we created an interaction term between the 4-door passenger volume and year. This is an important interaction to observe because we hypothesize that cars with greater volume would have lower fuel efficiency as the car would need to move more weight. comb08=b 0 +city08+b 1 co2tailpipegpm+ B 2 cylinders + B 3 displ_ga+ B 4 drive +.B K eighties*pv4 +B K+1 nineties* pv4 + B k+2 twothousand* pv4+ B k+3 twoten* pv4 Rattle produced the following results: 2 A) Predicted vs. Observed Model 2 The summary of the linear regression model is shown in Appendix C.
12 While the pseudo r-squared stayed the same, including this particular interaction term changed the B coefficients for the model. However, none of the coefficients of the interaction terms showed statistical significance, implying that the interaction between the terms did not have an effect on the target variable. Model with year##co2tailpipgpm For our third interaction term, we interacted tailpipe CO2 in grams/mile and year. This is an important interaction to observe because newer cars that face higher emission standards tend to have lower emission of tailpipe CO2. We want to observe if this decrease in emission of CO2 also reflects a relationship with better MPG. comb08=b 0 +city08+b 1 co2tailpipegpm+ B 2 cylinders + B 3 displ_ga+ B 4 drive +.B K eighties* co2tailpipgpm +B K+1 nineties* co2tailpipgpm + B k+2 twothousand* co2tailpipgpm + B k+3 twoten* co2tailpipgpm Rattle produced the following results: 3 A) Predicted vs. Observed Model 3 The summary of the linear regression model is shown in Appendix D.
13 Once again, the r-squared value stayed the same, reflecting that the observed data points fit the predicted model well. In this model, all interaction terms showed high statistical significance, implying that all interaction terms had an effect on the target variable. Other Issues: In addition to the inputs provided in the vehicle data from the U.S. Department of Energy, it would be useful to have information on whether the car has air conditioning and the other technological systems (sound system) given that they also expend energy and thus would also play a role in influencing the MPG efficiency. Furthermore, it would be useful to include the total weight of the car because we would hypothesize that heavier cars consume more energy to move the car.
14 Appendix A Call: lm(formula = comb08 ~., data = crs$dataset[crs$train, c(crs$input, crs$target)]) Residuals: Min 1Q Median 3Q Max Coefficients: (26 not defined because of singularities) Estimate Std. Error t value Pr(> t ) (Intercept) city < 2e-16 co2tailpipegpm e-12 cylinders e-11 displ_ga displ_ga displ_ga displ_ga displ_ga displ_ga displ_ga displ_ga displ_ga displ_ga displ_ga displ_ga displ_ga displ_ga displ_ga displ_ga displ_ga displ_ga displ_ga displ_ga displ_ga displ_ga displ_ga displ_ga displ_ga displ_ga displ_ga displ_ga displ_ga displ_ga displ_ga displ_ga displ_ga displ_ga displ_ga displ_ga displ_ga displ_ga displ_ga
15 displ_ga displ_ga displ_ga displ_ga displ_ga displ_ga displ_ga displ_ga displ_ga displ_ga displ_ga displ_ga displ_ga displ_ga displ_ga displ_ga displ_ga displ_ga displ_ga displ_ga displ_ga displ_ga displ_ga displ_ga displ_ga displ NA NA NA NA drive4-wheel Drive drive4-wheel or All-Wheel Drive driveall-wheel Drive drivefront-wheel Drive drivepart-time 4-Wheel Drive driverear-wheel Drive engid e-05 CA.model fuelcost e-05 fueltype1midgrade Gasoline e-15 fueltype1natural Gas e-10 fueltype1premium Gasoline fueltype1regular Gasoline < 2e-16 highway < 2e-16 pv tranyauto (AV-S8) tranyauto (AV) tranyautomatic (A1) tranyautomatic (A6) tranyautomatic (AM5) tranyautomatic (AV-S6) tranyautomatic (AV) tranyautomatic (S4) tranyautomatic (S5) tranyautomatic (S6) tranyautomatic (S7) tranyautomatic (S8) tranyautomatic (S9) tranyautomatic (variable gear ratios) tranyautomatic 3-spd
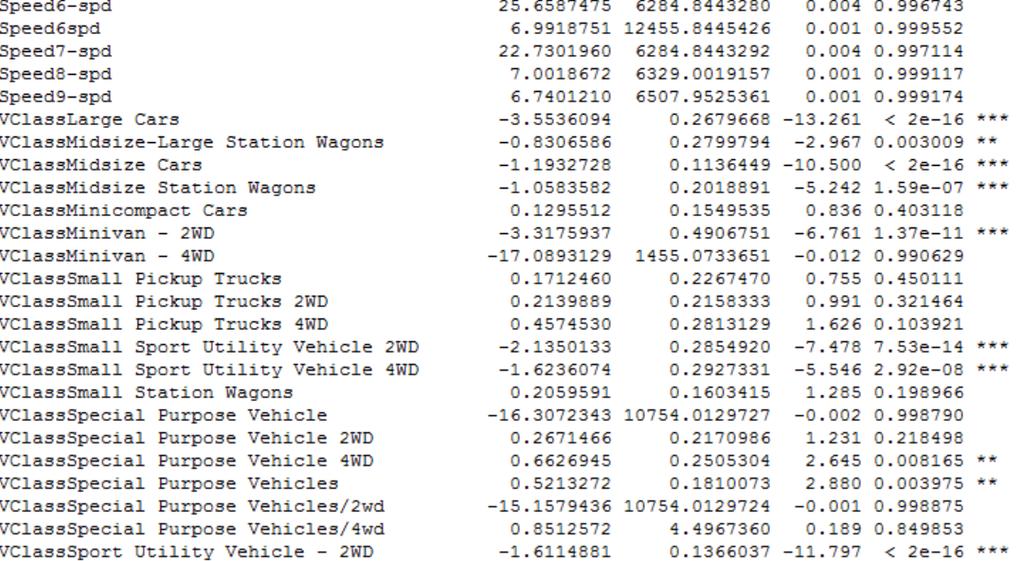
16 tranyautomatic 4-spd tranyautomatic 5-spd tranyautomatic 6-spd tranyautomatic 6spd tranyautomatic 7-spd tranyautomatic 8-spd tranyautomatic 9-spd tranymanual 3-spd tranymanual 4-spd tranymanual 5-spd tranymanual 6-spd tranymanual 7-spd Manual NA NA NA NA TransmissionAutomatic NA NA NA NA TransmissionManual NA NA NA NA Speed(A6) NA NA NA NA Speed(AM5) NA NA NA NA Speed(AV-S6) NA NA NA NA Speed(AV-S8) NA NA NA NA Speed(AV) NA NA NA NA Speed(S4) NA NA NA NA Speed(S5) NA NA NA NA Speed(S6) NA NA NA NA Speed(S7) NA NA NA NA Speed(S8) NA NA NA NA Speed(S9) NA NA NA NA Speed(variable NA NA NA NA Speed3-spd NA NA NA NA Speed4-spd NA NA NA NA Speed5-spd NA NA NA NA Speed6-spd NA NA NA NA Speed6spd NA NA NA NA Speed7-spd NA NA NA NA Speed8-spd NA NA NA NA Speed9-spd NA NA NA NA VClassLarge Cars VClassMidsize Cars VClassMidsize Station Wagons VClassMidsize-Large Station Wagons VClassMinicompact Cars VClassMinivan - 2WD VClassMinivan - 4WD VClassSmall Pickup Trucks VClassSmall Pickup Trucks 2WD VClassSmall Pickup Trucks 4WD VClassSmall Sport Utility Vehicle 2WD VClassSmall Sport Utility Vehicle 4WD VClassSmall Station Wagons VClassSpecial Purpose Vehicle VClassSpecial Purpose Vehicle 2WD VClassSpecial Purpose Vehicle 4WD VClassSpecial Purpose Vehicles VClassSpecial Purpose Vehicles/2wd VClassSpecial Purpose Vehicles/4wd VClassSport Utility Vehicle - 2WD VClassSport Utility Vehicle - 4WD
17 VClassStandard Pickup Trucks VClassStandard Pickup Trucks 2WD VClassStandard Pickup Trucks 4WD VClassStandard Pickup Trucks/2wd VClassStandard Sport Utility Vehicle 2WD VClassStandard Sport Utility Vehicle 4WD VClassSubcompact Cars VClassTwo Seaters VClassVans VClassVans Passenger VClassVans, Cargo Type VClassVans, Passenger Type after e-05 year yousavespend tcharger scharger decade Eighties Nineties Twothousand NA NA NA NA Twoten NA NA NA NA --- Signif. codes: 0 '***' '**' 0.01 '*' 0.05 '.' 0.1 ' ' 1 Residual standard error: on degrees of freedom (1463 observations deleted due to missingness) Multiple R-squared: , Adjusted R-squared: F-statistic: 3.394e+04 on 150 and DF, p-value: < 2.2e-16 ==== ANOVA ==== Analysis of Variance Table Response: comb08 Df Sum Sq Mean Sq F value Pr(>F) city < 2.2e-16 *** co2tailpipegpm < 2.2e-16 *** cylinders < 2.2e-16 *** displ_ga < 2.2e-16 *** drive < 2.2e-16 *** engid < 2.2e-16 *** CA.model e-14 *** fuelcost < 2.2e-16 *** fueltype < 2.2e-16 *** highway < 2.2e-16 *** pv * trany e-08 *** VClass e-10 *** after e-07 *** year * yousavespend ** tcharger ** scharger decade
18 Eighties e-06 *** Nineties Residuals Signif. codes: 0 '***' '**' 0.01 '*' 0.05 '.' 0.1 ' ' 1 [1] "\n" Time taken: 1.81 secs Rattle timestamp: :30:01 seungkookang Appendix B Call: lm(formula = comb08 ~., data = crs$dataset[crs$train, c(crs$input, crs$target)]) Residuals: Min 1Q Median 3Q Max Coefficients: (2 not defined because of singularities) Estimate Std. Error t value Pr(> t ) (Intercept) e-13 *** city < 2e-16 *** co2tailpipegpm < 2e-16 *** cylinders * displ engid * camodel fuelcost e-06 *** highway < 2e-16 *** pv manual e-06 *** after ** yousavespend e-05 *** tcharger *** scharger eighties e-07 *** nineties ** twothousand *** twoten NA NA NA NA drive * vclass e-05 *** manual_eighties ** manual_nineties ** manual_twothousand manual_twoten NA NA NA NA --- Signif. codes: 0 '***' '**' 0.01 '*' 0.05 '.' 0.1 ' ' 1 Residual standard error: on degrees of freedom (913 observations deleted due to missingness) Multiple R-squared: 0.995, Adjusted R-squared: F-statistic: 2.238e+05 on 22 and DF, p-value: < 2.2e-16
19 ==== ANOVA ==== Analysis of Variance Table Response: comb08 Df Sum Sq Mean Sq F value Pr(>F) city < 2.2e-16 *** co2tailpipegpm < 2.2e-16 *** cylinders < 2.2e-16 *** displ *** engid < 2.2e-16 *** camodel < 2.2e-16 *** fuelcost < 2.2e-16 *** highway < 2.2e-16 *** pv ** manual *** after yousavespend *** tcharger ** scharger eighties * nineties twothousand *** drive vclass *** manual_eighties * manual_nineties ** manual_twothousand Residuals Signif. codes: 0 '***' '**' 0.01 '*' 0.05 '.' 0.1 ' ' 1 [1] "\n" Time taken: 0.16 secs Rattle timestamp: :02:48 seungkookang Appendix C Call: lm(formula = comb08 ~., data = crs$dataset[crs$train, c(crs$input, crs$target)]) Residuals: Min 1Q Median 3Q Max Coefficients: (2 not defined because of singularities) Estimate Std. Error t value Pr(> t ) (Intercept) e-13 *** city < 2e-16 *** co2tailpipegpm < 2e-16 *** cylinders * displ
20 engid camodel fuelcost e-06 *** highway < 2e-16 *** pv manual e-07 *** after * yousavespend e-05 *** tcharger *** scharger eighties e-05 *** nineties * twothousand ** twoten NA NA NA NA drive * vclass e-05 *** pv4_eighties pv4_nineties pv4_twothousand pv4_twoten NA NA NA NA --- Signif. codes: 0 '***' '**' 0.01 '*' 0.05 '.' 0.1 ' ' 1 Residual standard error: on degrees of freedom (913 observations deleted due to missingness) Multiple R-squared: , Adjusted R-squared: F-statistic: 2.237e+05 on 22 and DF, p-value: < 2.2e-16 ==== ANOVA ==== Analysis of Variance Table Response: comb08 Df Sum Sq Mean Sq F value Pr(>F) city < 2.2e-16 *** co2tailpipegpm < 2.2e-16 *** cylinders < 2.2e-16 *** displ *** engid < 2.2e-16 *** camodel < 2.2e-16 *** fuelcost < 2.2e-16 *** highway < 2.2e-16 *** pv ** manual *** after yousavespend *** tcharger ** scharger eighties * nineties twothousand *** drive vclass *** pv4_eighties pv4_nineties pv4_twothousand
21 Residuals Signif. codes: 0 '***' '**' 0.01 '*' 0.05 '.' 0.1 ' ' 1 [1] "\n" Time taken: 0.15 secs Rattle timestamp: :05:26 seungkookang ====================================================================== Appendix D Call: lm(formula = comb08 ~., data = crs$dataset[crs$train, c(crs$input, crs$target)]) Residuals: Min 1Q Median 3Q Max Coefficients: (2 not defined because of singularities) Estimate Std. Error t value Pr(> t ) (Intercept) < 2e-16 *** city < 2e-16 *** co2tailpipegpm < 2e-16 *** cylinders e-05 *** displ engid e-06 *** camodel fuelcost e-10 *** highway < 2e-16 *** pv manual e-08 *** after yousavespend e-10 *** tcharger ** scharger eighties < 2e-16 *** nineties < 2e-16 *** twothousand *** twoten NA NA NA NA drive ** co2_eighties < 2e-16 *** co2_nineties < 2e-16 *** co2_twothousand e-07 *** co2_twoten NA NA NA NA vclass e-08 *** --- Signif. codes: 0 '***' '**' 0.01 '*' 0.05 '.' 0.1 ' ' 1 Residual standard error: on degrees of freedom (913 observations deleted due to missingness) Multiple R-squared: 0.995, Adjusted R-squared: F-statistic: 2.253e+05 on 22 and DF, p-value: < 2.2e-16 ==== ANOVA ====
22 Analysis of Variance Table Response: comb08 Df Sum Sq Mean Sq F value Pr(>F) city < 2.2e-16 *** co2tailpipegpm < 2.2e-16 *** cylinders < 2.2e-16 *** displ e-08 *** engid < 2.2e-16 *** camodel < 2.2e-16 *** fuelcost < 2.2e-16 *** highway < 2.2e-16 *** pv ** manual e-09 *** after yousavespend e-05 *** tcharger ** scharger eighties * nineties twothousand *** drive co2_eighties < 2.2e-16 *** co2_nineties e-16 *** co2_twothousand e-06 *** vclass e-08 *** Residuals Signif. codes: 0 '***' '**' 0.01 '*' 0.05 '.' 0.1 ' ' 1 [1] "\n" Time taken: 0.14 secs Rattle timestamp: :07:00 seungkookang ======================================================================
STAT 5302 Applied Regression Analysis. Hawkins
 Homework 3 sample solution 1. MinnLand data STAT 5302 Applied Regression Analysis. Hawkins newdata
PSYC 6140 November 16, 2005 ANOVA output in R
 PSYC 6140 November 16, 2005 ANOVA output in R Type I, Type II and Type III Sums of Squares are displayed in ANOVA tables in a mumber of packages. The car library in R makes these available in R. This handout
Predicting Wine Quality
 March 8, 2016 Ilker Karakasoglu Predicting Wine Quality Problem description: You have been retained as a statistical consultant for a wine co-operative, and have been asked to analyze these data. Each
Wine-Tasting by Numbers: Using Binary Logistic Regression to Reveal the Preferences of Experts
 Wine-Tasting by Numbers: Using Binary Logistic Regression to Reveal the Preferences of Experts When you need to understand situations that seem to defy data analysis, you may be able to use techniques
Gail E. Potter, Timo Smieszek, and Kerstin Sailer. April 24, 2015
 Supplementary Material to Modelling workplace contact networks: the effects of organizational structure, architecture, and reporting errors on epidemic predictions, published in Network Science Gail E.
Curtis Miller MATH 3080 Final Project pg. 1. The first question asks for an analysis on car data. The data was collected from the Kelly
 Curtis Miller MATH 3080 Final Project pg. 1 Curtis Miller 4/10/14 MATH 3080 Final Project Problem 1: Car Data The first question asks for an analysis on car data. The data was collected from the Kelly
The R survey package used in these examples is version 3.22 and was run under R v2.7 on a PC.
 CHAPTER 7 ANALYSIS EXAMPLES REPLICATION-R SURVEY PACKAGE 3.22 GENERAL NOTES ABOUT ANALYSIS EXAMPLES REPLICATION These examples are intended to provide guidance on how to use the commands/procedures for
Comparing R print-outs from LM, GLM, LMM and GLMM
 3. Inference: interpretation of results, plotting results, confidence intervals, hypothesis tests (Wald,LRT). 4. Asymptotic distribution of maximum likelihood estimators and tests. 5. Checking the adequacy
Relationships Among Wine Prices, Ratings, Advertising, and Production: Examining a Giffen Good
 Relationships Among Wine Prices, Ratings, Advertising, and Production: Examining a Giffen Good Carol Miu Massachusetts Institute of Technology Abstract It has become increasingly popular for statistics
AJAE Appendix: Testing Household-Specific Explanations for the Inverse Productivity Relationship
 AJAE Appendix: Testing Household-Specific Explanations for the Inverse Productivity Relationship Juliano Assunção Department of Economics PUC-Rio Luis H. B. Braido Graduate School of Economics Getulio
wine 1 wine 2 wine 3 person person person person person
 1. A trendy wine bar set up an experiment to evaluate the quality of 3 different wines. Five fine connoisseurs of wine were asked to taste each of the wine and give it a rating between 0 and 10. The order
Regression Models for Saffron Yields in Iran
 Regression Models for Saffron ields in Iran Sanaeinejad, S.H., Hosseini, S.N 1 Faculty of Agriculture, Ferdowsi University of Mashhad, Iran sanaei_h@yahoo.co.uk, nasir_nbm@yahoo.com, Abstract: Saffron
BORDEAUX WINE VINTAGE QUALITY AND THE WEATHER ECONOMETRIC ANALYSIS
 BORDEAUX WINE VINTAGE QUALITY AND THE WEATHER ECONOMETRIC ANALYSIS WINE PRICES OVER VINTAGES DATA The data sheet contains market prices for a collection of 13 high quality Bordeaux wines (not including
IT 403 Project Beer Advocate Analysis
 1. Exploratory Data Analysis (EDA) IT 403 Project Beer Advocate Analysis Beer Advocate is a membership-based reviews website where members rank different beers based on a wide number of categories. The
Panel A: Treated firm matched to one control firm. t + 1 t + 2 t + 3 Total CFO Compensation 5.03% 0.84% 10.27% [0.384] [0.892] [0.
![Panel A: Treated firm matched to one control firm. t + 1 t + 2 t + 3 Total CFO Compensation 5.03% 0.84% 10.27% [0.384] [0.892] [0.](/thumbs/90/101398922.jpg "Panel A: Treated firm matched to one control firm. t + 1 t + 2 t + 3 Total CFO Compensation 5.03% 0.84% 10.27% [0.384] [0.892] [0.") Online Appendix 1 Table O1: Determinants of CMO Compensation: Selection based on both number of other firms in industry that have CMOs and number of other firms in industry with MBA educated executives
Online Appendix 1 Table O1: Determinants of CMO Compensation: Selection based on both number of other firms in industry that have CMOs and number of other firms in industry with MBA educated executives
Missing Data Treatments
 Missing Data Treatments Lindsey Perry EDU7312: Spring 2012 Presentation Outline Types of Missing Data Listwise Deletion Pairwise Deletion Single Imputation Methods Mean Imputation Hot Deck Imputation Multiple
Investment Wines. - Risk Analysis. Prepared by: Michael Shortell & Adiam Woldetensae Date: 06/09/2015
 Investment Wines - Risk Analysis Prepared by: Michael Shortell & Adiam Woldetensae Date: 06/09/2015 Purpose Look at investment wines & examine factors that affect wine prices over time We will identify
Gasoline Empirical Analysis: Competition Bureau March 2005
 Gasoline Empirical Analysis: Update of Four Elements of the January 2001 Conference Board study: "The Final Fifteen Feet of Hose: The Canadian Gasoline Industry in the Year 2000" Competition Bureau March
Analysis of Things (AoT)
") Analysis of Things (AoT) Big Data & Machine Learning Applied to Brent Crude Executive Summary Data Selecting & Visualising Data We select historical, monthly, fundamental data We check for correlations
Analysis of Things (AoT) Big Data & Machine Learning Applied to Brent Crude Executive Summary Data Selecting & Visualising Data We select historical, monthly, fundamental data We check for correlations
Missing Data Methods (Part I): Multiple Imputation. Advanced Multivariate Statistical Methods Workshop
: Multiple Imputation. Advanced Multivariate Statistical Methods Workshop") Missing Data Methods (Part I): Multiple Imputation Advanced Multivariate Statistical Methods Workshop University of Georgia: Institute for Interdisciplinary Research in Education and Human Development
Missing Data Methods (Part I): Multiple Imputation Advanced Multivariate Statistical Methods Workshop University of Georgia: Institute for Interdisciplinary Research in Education and Human Development
THE STATISTICAL SOMMELIER
 THE STATISTICAL SOMMELIER An Introduction to Linear Regression 15.071 The Analytics Edge Bordeaux Wine Large differences in price and quality between years, although wine is produced in a similar way Meant
OF THE VARIOUS DECIDUOUS and
 (9) PLAXICO, JAMES S. 1955. PROBLEMS OF FACTOR-PRODUCT AGGRE- GATION IN COBB-DOUGLAS VALUE PRODUCTIVITY ANALYSIS. JOUR. FARM ECON. 37: 644-675, ILLUS. (10) SCHICKELE, RAINER. 1941. EFFECT OF TENURE SYSTEMS
Multiple Imputation for Missing Data in KLoSA
 Multiple Imputation for Missing Data in KLoSA Juwon Song Korea University and UCLA Contents 1. Missing Data and Missing Data Mechanisms 2. Imputation 3. Missing Data and Multiple Imputation in Baseline
Emerging Local Food Systems in the Caribbean and Southern USA July 6, 2014
 Consumers attitudes toward consumption of two different types of juice beverages based on country of origin (local vs. imported) Presented at Emerging Local Food Systems in the Caribbean and Southern USA
Online Appendix to The Effect of Liquidity on Governance
 Online Appendix to The Effect of Liquidity on Governance Table OA1: Conditional correlations of liquidity for the subsample of firms targeted by hedge funds This table reports Pearson and Spearman correlations
Summary of Main Points
 1 Model Selection in Logistic Regression Summary of Main Points Recall that the two main objectives of regression modeling are: Estimate the effect of one or more covariates while adjusting for the possible
Flexible Working Arrangements, Collaboration, ICT and Innovation
 Flexible Working Arrangements, Collaboration, ICT and Innovation A Panel Data Analysis Cristian Rotaru and Franklin Soriano Analytical Services Unit Economic Measurement Group (EMG) Workshop, Sydney 28-29
Effect of SPT Hammer Energy Efficiency in the Bearing Capacity Evaluation in Sands
 Proceedings of the 2 nd World Congress on Civil, Structural, and Environmental Engineering (CSEE 17) Barcelona, Spain April 2 4, 2017 Paper No. ICGRE 123 ISSN: 2371-5294 DOI: 10.11159/icgre17.123 Effect
INFLUENCE OF ENVIRONMENT - Wine evaporation from barrels By Richard M. Blazer, Enologist Sterling Vineyards Calistoga, CA
 INFLUENCE OF ENVIRONMENT - Wine evaporation from barrels By Richard M. Blazer, Enologist Sterling Vineyards Calistoga, CA Sterling Vineyards stores barrels of wine in both an air-conditioned, unheated,
From VOC to IPA: This Beer s For You!
 From VOC to IPA: This Beer s For You! Joel Smith Statistician Minitab Inc. jsmith@minitab.com 2013 Minitab, Inc. Image courtesy of amazon.com The Data Online beer reviews Evaluated overall and: Appearance
Relation between Grape Wine Quality and Related Physicochemical Indexes
 Research Journal of Applied Sciences, Engineering and Technology 5(4): 557-5577, 013 ISSN: 040-7459; e-issn: 040-7467 Maxwell Scientific Organization, 013 Submitted: October 1, 01 Accepted: December 03,
ONLINE APPENDIX APPENDIX A. DESCRIPTION OF U.S. NON-FARM PRIVATE SECTORS AND INDUSTRIES
 ONLINE APPENDIX APPENDIX A. DESCRIPTION OF U.S. NON-FARM PRIVATE SECTORS AND INDUSTRIES 1997 NAICS Code Sector and Industry Title IT Intensity 1 IT Intensity 2 11 Agriculture, forestry, fishing, and hunting
Using Growing Degree Hours Accumulated Thirty Days after Bloom to Help Growers Predict Difficult Fruit Sizing Years
 Using Growing Degree Hours Accumulated Thirty Days after Bloom to Help Growers Predict Difficult Fruit Sizing Years G. Lopez 1 and T. DeJong 2 1 Àrea de Tecnologia del Reg, IRTA, Lleida, Spain 2 Department
STA Module 6 The Normal Distribution
 STA 2023 Module 6 The Normal Distribution Learning Objectives 1. Explain what it means for a variable to be normally distributed or approximately normally distributed. 2. Explain the meaning of the parameters
STA Module 6 The Normal Distribution. Learning Objectives. Examples of Normal Curves
 STA 2023 Module 6 The Normal Distribution Learning Objectives 1. Explain what it means for a variable to be normally distributed or approximately normally distributed. 2. Explain the meaning of the parameters
Northern Region Central Region Southern Region No. % of total No. % of total No. % of total Schools Da bomb
 Some Purr Words Laurie and Winifred Bauer A number of questions demanded answers which fell into the general category of purr words: words with favourable senses. Many of the terms supplied were given
Missing value imputation in SAS: an intro to Proc MI and MIANALYZE
 Victoria SAS Users Group November 26, 2013 Missing value imputation in SAS: an intro to Proc MI and MIANALYZE Sylvain Tremblay SAS Canada Education Copyright 2010 SAS Institute Inc. All rights reserved.
Statistics & Agric.Economics Deptt., Tocklai Experimental Station, Tea Research Association, Jorhat , Assam. ABSTRACT
 Two and a Bud 59(2):152-156, 2012 RESEARCH PAPER Global tea production and export trend with special reference to India Prasanna Kumar Bordoloi Statistics & Agric.Economics Deptt., Tocklai Experimental
Evaluating Population Forecast Accuracy: A Regression Approach Using County Data
 Evaluating Population Forecast Accuracy: A Regression Approach Using County Data Jeff Tayman, UC San Diego Stanley K. Smith, University of Florida Stefan Rayer, University of Florida Final formatted version
AMERICAN ASSOCIATION OF WINE ECONOMISTS
 AMERICAN ASSOCIATION OF WINE ECONOMISTS AAWE WORKING PAPER No. 25 Economics THE SIDEWAYS EFFECT: A TEST FOR CHANGES IN THE DEMAND FOR MERLOT AND PINOT NOIR WINES Steven Cuellar, Dan Karnowsky and Frederick
Bt Corn IRM Compliance in Canada
 Bt Corn IRM Compliance in Canada Canadian Corn Pest Coalition Report Author: Greg Dunlop (BSc. Agr, MBA, CMRP), ifusion Research Ltd. 15 CONTENTS CONTENTS... 2 EXECUTIVE SUMMARY... 4 BT CORN MARKET OVERVIEW...
Wine Rating Prediction
 CS 229 FALL 2017 1 Wine Rating Prediction Ke Xu (kexu@), Xixi Wang(xixiwang@) Abstract In this project, we want to predict rating points of wines based on the historical reviews from experts. The wine
What makes a good muffin? Ivan Ivanov. CS229 Final Project
 What makes a good muffin? Ivan Ivanov CS229 Final Project Introduction Today most cooking projects start off by consulting the Internet for recipes. A quick search for chocolate chip muffins returns a
This appendix tabulates results summarized in Section IV of our paper, and also reports the results of additional tests.
 Internet Appendix for Mutual Fund Trading Pressure: Firm-level Stock Price Impact and Timing of SEOs, by Mozaffar Khan, Leonid Kogan and George Serafeim. * This appendix tabulates results summarized in
Napa Highway 29 Open Wineries
 4 5 6 7 8 9 35 4 45 5 55 Sonoma State University Business 58-Business Intelligence Problem Set #6 Key Dr. Cuellar Trend Analysis-Analyzing Tasting Room Strategies 1. Graphical Analysis a. Show graphically
 Homework 1 - Solutions Problem 2 a) soma
 Modeling Wine Quality Using Classification and Regression. Mario Wijaya MGT 8803 November 28, 2017
 Modeling Wine Quality Using Classification and Mario Wijaya MGT 8803 November 28, 2017 Motivation 1 Quality How to assess it? What makes a good quality wine? Good or Bad Wine? Subjective? Wine taster Who
Appendix A. Table A.1: Logit Estimates for Elasticities
 Estimates from historical sales data Appendix A Table A.1. reports the estimates from the discrete choice model for the historical sales data. Table A.1: Logit Estimates for Elasticities Dependent Variable:
STACKING CUPS STEM CATEGORY TOPIC OVERVIEW STEM LESSON FOCUS OBJECTIVES MATERIALS. Math. Linear Equations
 STACKING CUPS STEM CATEGORY Math TOPIC Linear Equations OVERVIEW Students will work in small groups to stack Solo cups vs. Styrofoam cups to see how many of each it takes for the two stacks to be equal.
Buying Filberts On a Sample Basis
 E 55 m ^7q Buying Filberts On a Sample Basis Special Report 279 September 1969 Cooperative Extension Service c, 789/0 ite IP") 0, i mi 1910 S R e, `g,,ttsoliktill:torvti EARs srin ITQ, E,6
Appendix A. Table A1: Marginal effects and elasticities on the export probability
 Appendix A Table A1: Marginal effects and elasticities on the export probability Variable PROP [1] PROP [2] PROP [3] PROP [4] Export Probability 0.207 0.148 0.206 0.141 Marg. Eff. Elasticity Marg. Eff.
Zeitschrift für Soziologie, Jg., Heft 5, 2015, Online- Anhang
 I Are Joiners Trusters? A Panel Analysis of Participation and Generalized Trust Online Appendix Katrin Botzen University of Bern, Institute of Sociology, Fabrikstrasse 8, 3012 Bern, Switzerland; katrin.botzen@soz.unibe.ch
Handling Missing Data. Ashley Parker EDU 7312
 Handling Missing Data Ashley Parker EDU 7312 Presentation Outline Types of Missing Data Treatments for Handling Missing Data Deletion Techniques Listwise Deletion Pairwise Deletion Single Imputation Techniques
Not to be published - available as an online Appendix only! 1.1 Discussion of Effects of Control Variables
 1 Appendix Not to be published - available as an online Appendix only! 1.1 Discussion of Effects of Control Variables Table 1 in the main text includes a number of additional control variables. We find
Missing Data: Part 2 Implementing Multiple Imputation in STATA and SPSS. Carol B. Thompson Johns Hopkins Biostatistics Center SON Brown Bag 4/24/13
 Missing Data: Part 2 Implementing Multiple Imputation in STATA and SPSS Carol B. Thompson Johns Hopkins Biostatistics Center SON Brown Bag 4/24/13 Overview Reminder Steps in Multiple Imputation Implementation
*p <.05. **p <.01. ***p <.001.
 Table 1 Weighted Descriptive Statistics and Zero-Order Correlations with Fatherhood Timing (N = 1114) Variables Mean SD Min Max Correlation Interaction time 280.70 225.47 0 1095 0.05 Interaction time with
Valuation in the Life Settlements Market
 Valuation in the Life Settlements Market New Empirical Evidence Jiahua (Java) Xu 1 1 Institute of Insurance Economics University of St.Gallen Western Risk and Insurance Association 2018 Annual Meeting
Lesson 23: Newton s Law of Cooling
 Student Outcomes Students apply knowledge of exponential functions and transformations of functions to a contextual situation. Lesson Notes Newton s Law of Cooling is a complex topic that appears in physics
Credit Supply and Monetary Policy: Identifying the Bank Balance-Sheet Channel with Loan Applications. Web Appendix
 Credit Supply and Monetary Policy: Identifying the Bank Balance-Sheet Channel with Loan Applications By GABRIEL JIMÉNEZ, STEVEN ONGENA, JOSÉ-LUIS PEYDRÓ, AND JESÚS SAURINA Web Appendix APPENDIX A -- NUMBER
INSTITUTE AND FACULTY OF ACTUARIES CURRICULUM 2019 SPECIMEN SOLUTIONS. Subject CS1B Actuarial Statistics
 INSTITUTE AND FACULTY OF ACTUARIES CURRICULUM 2019 SPECIMEN SOLUTIONS Subject CS1B Actuarial Statistics Question 1 (i) # Data entry before
Temperature effect on pollen germination/tube growth in apple pistils
 FINAL PROJECT REPORT Project Title: Temperature effect on pollen germination/tube growth in apple pistils PI: Dr. Keith Yoder Co-PI(): Dr. Rongcai Yuan Organization: Va. Tech Organization: Va. Tech Telephone/email:
Internet Appendix for Does Stock Liquidity Enhance or Impede Firm Innovation? *
 Internet Appendix for Does Stock Liquidity Enhance or Impede Firm Innovation? * This Internet Appendix provides supplemental analyses and robustness tests to the main results presented in Does Stock Liquidity
Problem Set #3 Key. Forecasting
 Problem Set #3 Key Sonoma State University Business 581E Dr. Cuellar The data set bus581e_ps3.dta is a Stata data set containing annual sales (cases) and revenue from December 18, 2004 to April 2 2011.
EFFECT OF TOMATO GENETIC VARIATION ON LYE PEELING EFFICACY TOMATO SOLUTIONS JIM AND ADAM DICK SUMMARY
 EFFECT OF TOMATO GENETIC VARIATION ON LYE PEELING EFFICACY TOMATO SOLUTIONS JIM AND ADAM DICK 2013 SUMMARY Several breeding lines and hybrids were peeled in an 18% lye solution using an exposure time of
MBA 503 Final Project Guidelines and Rubric
 MBA 503 Final Project Guidelines and Rubric Overview There are two summative assessments for this course. For your first assessment, you will be objectively assessed by your completion of a series of MyAccountingLab
Decision making with incomplete information Some new developments. Rudolf Vetschera University of Vienna. Tamkang University May 15, 2017
 Decision making with incomplete information Some new developments Rudolf Vetschera University of Vienna Tamkang University May 15, 2017 Agenda Problem description Overview of methods Single parameter approaches
A Hedonic Analysis of Retail Italian Vinegars. Summary. The Model. Vinegar. Methodology. Survey. Results. Concluding remarks.
 Vineyard Data Quantification Society "Economists at the service of Wine & Vine" Enometrics XX A Hedonic Analysis of Retail Italian Vinegars Luigi Galletto, Luca Rossetto Research Center for Viticulture
Internet Appendix to. The Price of Street Friends: Social Networks, Informed Trading, and Shareholder Costs. Jie Cai Ralph A.
 Internet Appendix to The Price of Street Friends: Social Networks, Informed Trading, and Shareholder Costs Jie Cai Ralph A. Walkling Ke Yang October 2014 1 A11. Controlling for s Logically Associated with
Structural Reforms and Agricultural Export Performance An Empirical Analysis
 Structural Reforms and Agricultural Export Performance An Empirical Analysis D. Susanto, C. P. Rosson, and R. Costa Department of Agricultural Economics, Texas A&M University College Station, Texas INTRODUCTION
The Role of Calorie Content, Menu Items, and Health Beliefs on the School Lunch Perceived Health Rating
 The Role of Calorie Content, Menu Items, and Health Beliefs on the School Lunch Perceived Health Rating Matthew V. Pham Landmark College matthewpham@landmark.edu Brian E. Roe The Ohio State University
What does radical price change and choice reveal?
 What does radical price change and choice reveal? A project by YarraValley Water and the Centre for Water Policy Management November 2016 CRICOS Provider 00115M latrobe.edu.au CRICOS Provider 00115M Objectives
Online Appendix to Voluntary Disclosure and Information Asymmetry: Evidence from the 2005 Securities Offering Reform
 Online Appendix to Voluntary Disclosure and Information Asymmetry: Evidence from the 2005 Securities Offering Reform This document contains several additional results that are untabulated but referenced
Method for the imputation of the earnings variable in the Belgian LFS
 Method for the imputation of the earnings variable in the Belgian LFS Workshop on LFS methodology, Madrid 2012, May 10-11 Astrid Depickere, Anja Termote, Pieter Vermeulen Outline 1. Introduction 2. Imputation
Preferred citation style
 Preferred citation style Axhausen, K.W. (2016) How many cars are too many? A second attempt, distinguished transport lecture at the University of Hong Kong, Hong Kong, October 2016.. How many cars are
November K. J. Martijn Cremers Lubomir P. Litov Simone M. Sepe
 ONLINE APPENDIX TABLES OF STAGGERED BOARDS AND LONG-TERM FIRM VALUE, REVISITED November 016 K. J. Martijn Cremers Lubomir P. Litov Simone M. Sepe The paper itself is available at https://papers.ssrn.com/sol3/papers.cfm?abstract-id=364165.
COMPARISON OF CORE AND PEEL SAMPLING METHODS FOR DRY MATTER MEASUREMENT IN HASS AVOCADO FRUIT
 New Zealand Avocado Growers' Association Annual Research Report 2004. 4:36 46. COMPARISON OF CORE AND PEEL SAMPLING METHODS FOR DRY MATTER MEASUREMENT IN HASS AVOCADO FRUIT J. MANDEMAKER H. A. PAK T. A.
CAUTION!!! Do not eat anything (Skittles, cylinders, dishes, etc.) associated with the lab!!!
 associated with the lab!!!") Physical Science Period: Name: Skittle Lab: Conversion Factors Date: CAUTION!!! Do not eat anything (Skittles, cylinders, dishes, etc.) associated with the lab!!! Estimate: Make an educated guess about
Physical Science Period: Name: Skittle Lab: Conversion Factors Date: CAUTION!!! Do not eat anything (Skittles, cylinders, dishes, etc.) associated with the lab!!! Estimate: Make an educated guess about
Statistics 5303 Final Exam December 20, 2010 Gary W. Oehlert NAME ID#
 Statistics 5303 Final Exam December 20, 2010 Gary W. Oehlert NAME ID# This exam is open book, open notes; you may use a calculator. Do your own work! Use the back if more space is needed. There are nine
THE ECONOMIC IMPACT OF BEER TOURISM IN KENT COUNTY, MICHIGAN
 THE ECONOMIC IMPACT OF BEER TOURISM IN KENT COUNTY, MICHIGAN Dan Giedeman, Ph.D., Paul Isely, Ph.D., and Gerry Simons, Ph.D. 10/8/2015 THE ECONOMIC IMPACT OF BEER TOURISM IN KENT COUNTY, MICHIGAN EXECUTIVE
The Development of a Weather-based Crop Disaster Program
 The Development of a Weather-based Crop Disaster Program Eric Belasco Montana State University 2016 SCC-76 Conference Pensacola, FL March 19, 2016. Belasco March 2016 1 / 18 Motivation Recent efforts to
Effects of Election Results on Stock Price Performance: Evidence from 1976 to 2008
 Effects of Election Results on Stock Price Performance: Evidence from 1976 to 2008 Andreas Oehler, Bamberg University Thomas J. Walker, Concordia University Stefan Wendt, Bamberg University 2012 FMA Annual
Flexible Imputation of Missing Data
 Chapman & Hall/CRC Interdisciplinary Statistics Series Flexible Imputation of Missing Data Stef van Buuren TNO Leiden, The Netherlands University of Utrecht The Netherlands crc pness Taylor &l Francis
Napa County Planning Commission Board Agenda Letter
 Agenda Date: 7/1/2015 Agenda Placement: 10A Continued From: May 20, 2015 Napa County Planning Commission Board Agenda Letter TO: FROM: Napa County Planning Commission John McDowell for David Morrison -
Poisson GLM, Cox PH, & degrees of freedom
 Poisson GLM, Cox PH, & degrees of freedom Michael C. Donohue Alzheimer s Therapeutic Research Institute Keck School of Medicine University of Southern California December 13, 2017 1 Introduction We discuss
1. Continuing the development and validation of mobile sensors. 3. Identifying and establishing variable rate management field trials
 Project Overview The overall goal of this project is to deliver the tools, techniques, and information for spatial data driven variable rate management in commercial vineyards. Identified 2016 Needs: 1.
PREDICTION MODEL FOR ESTIMATING PEACH FRUIT WEIGHT AND VOLUME ON THE BASIS OF FRUIT LINEAR MEASUREMENTS DURING GROWTH
 Journal of Fruit and Ornamental Plant Research Vol. 15, 2007: 65-69 PREDICTION MODEL FOR ESTIMATING PEACH FRUIT WEIGHT AND VOLUME ON THE BASIS OF FRUIT LINEAR MEASUREMENTS DURING GROWTH H ü s n ü D e m
F&N 453 Project Written Report. TITLE: Effect of wheat germ substituted for 10%, 20%, and 30% of all purpose flour by
 F&N 453 Project Written Report Katharine Howe TITLE: Effect of wheat substituted for 10%, 20%, and 30% of all purpose flour by volume in a basic yellow cake. ABSTRACT Wheat is a component of wheat whole
Risk Assessment Project II Interim Report 2 Validation of a Risk Assessment Instrument by Offense Gravity Score for All Offenders
 Highlights Risk Assessment Project II Interim Report 2 Validation of a Risk Assessment Instrument by Offense Gravity Score for All Offenders [February 2016] The purpose of this report is to present the
Lollapalooza Did Not Attend (n = 800) Attended (n = 438)
 Attended (n = 438)") D SDS H F 1, 16 ( ) Warm-ups (A) Which bands come to ACL Fest? Is it true that if a band plays at Lollapalooza, then it is more likely to play at Austin City Limits (ACL) that year? To be able to provide
D SDS H F 1, 16 ( ) Warm-ups (A) Which bands come to ACL Fest? Is it true that if a band plays at Lollapalooza, then it is more likely to play at Austin City Limits (ACL) that year? To be able to provide
TEACHER NOTES MATH NSPIRED
 Math Objectives Students will use a ratio to create and plot points and will determine a mathematical relationship for plotted points. Students will compute the unit rate given a ratio. Students will predict
> Y=degre=="deces" > table(y) Y FALSE TRUE
 Y FALSE TRUE") - PARTIE 0 - > preambule=read.table( + "http://freakonometrics.free.fr/preambule.csv",header=true,sep=";") > table(preambule$y) 0 1 2 3 4 5 6 45 133 160 101 51 8 2 > reg0=glm(y/n~1,family="binomial",weights=n,data=preambule)
- PARTIE 0 - > preambule=read.table( + "http://freakonometrics.free.fr/preambule.csv",header=true,sep=";") > table(preambule$y) 0 1 2 3 4 5 6 45 133 160 101 51 8 2 > reg0=glm(y/n~1,family="binomial",weights=n,data=preambule)
Figure S2. Measurement locations for meteorological stations. (data made available by KMI: https://www.meteo.be).
.") A High Resolution Spatiotemporal Model for In-Vehicle Black Carbon Exposure: Quantifying the In-Vehicle Exposure Reduction Due to the Euro 5 Particulate Matter Standard Legislation Supplementary data Spatial
A High Resolution Spatiotemporal Model for In-Vehicle Black Carbon Exposure: Quantifying the In-Vehicle Exposure Reduction Due to the Euro 5 Particulate Matter Standard Legislation Supplementary data Spatial
Can You Tell the Difference? A Study on the Preference of Bottled Water. [Anonymous Name 1], [Anonymous Name 2]
![Can You Tell the Difference? A Study on the Preference of Bottled Water. [Anonymous Name 1], [Anonymous Name 2]](/thumbs/78/76759741.jpg "Can You Tell the Difference? A Study on the Preference of Bottled Water. [Anonymous Name 1], [Anonymous Name 2]") Can You Tell the Difference? A Study on the Preference of Bottled Water [Anonymous Name 1], [Anonymous Name 2] Abstract Our study aims to discover if people will rate the taste of bottled water differently
Can You Tell the Difference? A Study on the Preference of Bottled Water [Anonymous Name 1], [Anonymous Name 2] Abstract Our study aims to discover if people will rate the taste of bottled water differently
Rituals on the first of the month Laurie and Winifred Bauer
 Rituals on the first of the month Laurie and Winifred Bauer Question 5 asked about practices on the first of the month: 5 At your school, do you say or do something special on the first day of a month?
MAIN FACTORS THAT DETERMINE CONSUMER BEHAVIOR FOR WINE IN THE REGION OF PRIZREN, KOSOVO
 MAIN FACTORS THAT DETERMINE CONSUMER BEHAVIOR FOR WINE IN THE REGION OF PRIZREN, KOSOVO Isuf LUSHI 1, Remzi KECO 2, Ilir TOMORRI 2, Ilir KAPAJ 2 1 State University of Prizren, Prizren, Kosovo 2 Agricultural
RELATIVE EFFICIENCY OF ESTIMATES BASED ON PERCENTAGES OF MISSINGNESS USING THREE IMPUTATION NUMBERS IN MULTIPLE IMPUTATION ANALYSIS ABSTRACT
 RELATIVE EFFICIENCY OF ESTIMATES BASED ON PERCENTAGES OF MISSINGNESS USING THREE IMPUTATION NUMBERS IN MULTIPLE IMPUTATION ANALYSIS Nwakuya, M. T. (Ph.D) Department of Mathematics/Statistics University
The Financing and Growth of Firms in China and India: Evidence from Capital Markets
 The Financing and Growth of Firms in China and India: Evidence from Capital Markets Tatiana Didier Sergio Schmukler Dec. 12-13, 2012 NIPFP-DEA-JIMF Conference Macro and Financial Challenges of Emerging
Health Effects due to the Reduction of Benzene Emission in Japan
 Health Effects due to the Reduction of Benzene Emission in Japan Hideo Kajihara 1, Akihiro Fushimi 2 1 Graduate School of Science and Technology, Niigata University, 8050, Ikarashi 2nocho, Niigata, 950-2181,
Soybean Yield Loss Due to Hail Damage*
 1 of 6 6/11/2009 9:22 AM G85-762-A Soybean Yield Loss Due to Hail Damage* This NebGuide discusses the methods used by the hail insurance industry to assess yield loss due to hail damage in soybeans. C.
Vibration Damage to Kiwifruits during Road Transportation
 International Journal of Agriculture and Food Science Technology. ISSN 2249-3050, Volume 4, Number 5 (2013), pp. 467-474 Research India Publications http://www.ripublication.com/ ijafst.htm Vibration Damage