ANNUAL GENERAL MEETING 2016 INTERNATIONAL WINE MARKET REVIEW
|
|
|
- Pauline Wright
- 6 years ago
- Views:
Transcription
1 GREAT WINE CAPITALS RESEARCH ANNUAL GENERAL MEETING 2016 INTERNATIONAL WINE MARKET REVIEW OTTO SCHÄTZEL DLR OPPENHEIM, GERMANY OVERVIEW I. INTERNATIONAL WINE MARKET ACREAGE GLOBAL WINE PRODUCTION GLOBAL WINE CONSUMPTION WINE MARKET II. FACTS ABOUT GWC WINE GROWING AREAS ADELAIDE SOUTH AUSTRALIA BILBAO RIOJA BORDEAUX BORDEAUX CAPE TOWN CAPE WINELANDS MAINZ RHEINHESSEN MENDOZA MENDOZA PORTO VINHO VERDE DOURO SAN FRANCISCO NAPA VALLEY VALPARAISO CASABLANCA VALLEY III. RESULTS AND ACTION POINTS 1
2 WORLD SURFACE UNDER VINES 2014: Total ha 2015: Total ha Since 2000 the world s total vineyard surface area is decreasing, mainly due to the reduction of European vineyards. Source: OIV WORLD ACREAGE UNDER VINE TOP 13 TOTAL ACREAGE 2015 : ha Spain China France Italy USA Argentina Portugal Chile Romania Australia South Africa Greece Germany ha Source: OIV 2
3 1000 ha 1000 ha Acreage (1 000 ha) Acreage (1 000 ha) DEVELOPMENT ACREAGE UNDER VINE IN EUROPE Spain France Italy Portugal Romania Greece Germany Source: OIV (selection) DEVELOPMENT ACREAGE UNDER VINE OUTSIDE EUROPE Argentina Chile Australia South Africa 200 USA 150 New Zealand Source: OIV (selection) 3
4 mhl WORLD SURFACE UNDER VINE Total world area under vines in 2015: ha Largest acreage: Spain, (China*), France, Italy *estimated: 90% fresh grapes Europe: 54% of world acreage Since 2000, area under vine has fallen considerably in Spain, France, Italy This is mainly influenced by the EU grubbing-up programme in 2011 Currently European acreage quite stable at ha Very strong increase of Chinese vineyards Slight increase in Argentina, Chile and New Zealand GLOBAL PRODUCTION / CONSUMPTION production consumption mhl overproduction ** Source: OIV 2016 / **forceast mhl = millions of hl 4
5 GLOBAL WINE PRODUCTION 2014: total 271 mhl 2015: total 274 mhl 2016 forecast: 260 mhl 2016 world wine production decreased by almost 15mhl compared with 2015 production. This global wine production is among one of the lowest over the last 20 year. Source: OIV mhl = millions of hl 2015: total 259 mhl GLOBAL WINE PRODUCTION 2015 Italy Fance Spain USA Argentina Chile Australia South Africa China hl 1000 hl Source: OIV Germany
6 1 000 hl CONSUMPTION EXAMPLES 2015: Global Consumption total: 239 mhl USA France Germany Italy China United Kingdom Argentina Spain Russian Federation 0 Australia 2015* 2014* Source: OIV PRODUCTION AND CONSUMPTION Global wine production in 2016: 259 million hl 2016 world wine production among the lowest in 20 years Global wine consumption 2016: 243,2 million hl Changes in consumption market shares demonstrate that growing markets are countries in North America and Asia Traditional wine consumer countries recorded a reduction in their share of the global market Worldwide production is higher than consumption After global economic crisis there has been no real recovery 6
7 EXPORT / IMPORT In 2015, the global market should reach (104.3 mhl) in terms of volume an increase of 1,8 % compared with 2014 In terms of value, there was a rise of 10,6 % / 2014 (28.3 bn ) Major exporting countries: Spain, Italy, France Market shares of EU countries are lost to suppliers from the Southern Hemisphere Major importing countries: Germany, United Kingdom, USA Germany is worldwide largest importer by quantity USA is worldwide largest importer by value. Second is United Kingdom. Source: OIV GWC WORLD MAP 7
8 GREAT WINE CAPITALS ACREAGE 2015 in ha Total 2014: ha Mendoza* Bordeaux Cape Winelands* Vinho Verde / Douro* Rioja South Australia Rheinhessen Nappa Valley Casablanca* * ha ha ha ha ha ha ha ha ha Napa: + 52 ha Rheinhessen: + 15 ha Rioja: ha Bordeaux: - 14 ha GREAT WINE CAPITALS COVERAGE % Rest of the world Countries within GWC GWC 34% 59% 8

9 GREAT WINE CAPITALS PRODUCTION 2014 Total: hl World production 2015: 274 mhl Cape Winelands Mendoza Bordeaux Rioja Rheinhessen Douro/ Vino Verde Nappa Valley Casablanca hl GWC WORLD MAP 9


10 S. AUSTRALIA ADELAIDE ADELAIDE - AREA 18 subregions: ADELAIDE Adelaide Hills Barossa Clare Valley McLaren Vale Coonawarra Southern Flinders Ranges Currency Creek Southern Fleurieu Eden Valley Adelaide Plains Padthaway Mt Benson Wrattonbully Robe Mt Gambier Langhorne Creek Kangaroo Island Riverland 10
11 SOUTH AUSTRALIA SURFACE & PRODUCTION Acreage: ha ha Total wine production: hl hl Ø Yield: 68 hl/ha 78 hl/ha WINE COMPANIES (including wine-growers, estate wineries) SOUTH AUSTRALIA 73 % RED 27 % WHITE TOTAL: ha RED: ha / WHITE: ha Grenache % Merlot % Cabernet Sauvignon % Pinot Noir % Other Red % Shiraz % Semillon ha 6% Sauvignon Blanc ha 12% Muscat Gordo Blanco ha 5% Other White ha 18% Riesling ha 13% Chardonnay ha 46% 11
12 SOUTH AUSTRALIA VISITORS Total: (Overnight stays) Leisure* (from total): Business (from total): Domestic (from total): Foreign (from total): *They also track those visiting friends and relatives (VFR) and this is included in the numbers. SOUTH AUSTRALIA Accommodation Hotels: Rooms/hotels: Ø Global Tourist spending (million ) Ø Employment (jobs)


13 SOUTH AUSTRALIA Visitors come from - TOP 5 1. United Kingdom 4. China 2. New Zealand 5. Germany 3. USA SPAIN RIOJA 13
 Source: Consejo Regulador DOCa Rioja, Statistics 2013")
14 RIOJA - AREA BILBAO 3 subregions: Rioja Alta Rioja Baja Rioja Alavesa RIOJA SURFACE & PRODUCTION Acreage DOCa (certified): ha ha Total wine production: hl hl Ø Yield: 40 hl/ha 46 hl/ha WINE COMPANIES (including wine-growers, estate wineries, cooperatives, wineries and grape growers) Source: Consejo Regulador DOCa Rioja, Statistics
15 RIOJA VARIETIES % RED 8% WHITE TOTAL: ha RED: ha / WHITE: ha Other Red ha 12% Other White ha 2% Tempranillo ha 80% Viura ha 6% Source: Consejo Regulador DOCa Rioja, Statistics 2015 RIOJA - SALES 2015 SALES BY CATEGORY TOTAL: l EXPORT: l Export by country DOMESTIC: l Others 30% United Kingdom 35% The Netherlands 3% Switzerland 6% United States 9% Germany 17% Source: Consejo Regulador DOCa Rioja, Statistics


16 RIOJA - SALES EXPORT Export to Great Britain increased from hl in 2013 to hl in Export in all other countries slightly decreased. Source: Consejo Regulador DOCa Rioja, Statistics 2015 FRANCE BORDEAUX 16

17 BORDEAUX - AREA 15 subregions: CITY OF BORDEAUX Médoc Haut Médoc Pessac Léognan Graves Cérons Barsac Sauternes Premières Côtes de Bordeaux Entre Deux-Mères Côtes de Castillon St. Émilion Pomerol Fronsac / Canon-Fronsac Côtes de Bourg Côtes de Blaye BORDEAUX SURFACE & PRODUCTION Acreage: ha ha Total wine production: hl hl Ø Yield: 47 hl/ha 49 hl/ha WINE COMPANIES (including wine-growers, estate wineries, cooperatives, wineries and grape growers) Source: CIVB / Dounanes FR 17
18 BORDEAUX VARIETIES % RED RED: ha 12% WHITE WHITE: ha TOTAL: ha Cabernet Sauvignon; ha; 22% Cabernet Franc; ha; 10% Other Red; ha; 2% Merlot; ha; 66% Sauvignon Blanc ha 45% Muscadelle 800 ha 6% Other White 266 ha 2% Semmilion ha 47% Source: CIVB BORDEAUX SALES TOTAL PRODUCTION: hl DOMESTIC: hl EXPORT: hl Export 42% Domestic 58% Source: CIVB 18
19 TOTAL Production: hl Export: hl Domestic: hl BORDEAUX - SALES 2015 EXPORT BY COUNTRY: Japan 9% Others 15% China 29% Source: CIVB USA 11% United Kingdom 11% Belgium 13% Germany 12% BORDEAUX VISITORS Total: Overnight stays: Leisure (from total): Business (from total): Domestic (from total): Foreign (from total):
20 BORDEAUX Accommodation Hotels: Bed/hotels: Visitors come from - TOP 5 in 2014 and Germany 4. Italy 2. Belgium 5. The Netherlands 3. Spain BORDEAUX 2014 / 2015 Ø Global Tourist spending (million ) Ø Employment (jobs) % : yrs old 26 % : yrs old 12%: yrs old 18%: yrs old Visitors typology low-income: 35% middle-class: 12% upper middle class : 23% upper-class: 30% 39%: couples 34%: family 24% : single 20


21 SOUTH AFRICA CAPE WINELANDS CAPE WINELANDS - AREA 6 subregions: Breede River Valley Cape South Coast Coastal Region Klein Karoo Olifants River Boberg CAPE TOWN Western Cape Cape Winelands? 21
22 CAPE WINELANDS SURFACE & PRODUCTION 2013 (total South Africa) Acreage: Total wine production: Ø Yield: ha hl 116 hl/ha WINE COMPANIES (including wine-growers, estate wineries, cooperatives, wineries and grape growers) Source: Sawis Statistics 2014 CAPE WINELANDS VARIETIES 2013 TOTAL: ha 45% RED: ha 55% WHITE: ha Source: Sawis Statistics 2014 Sauvignon Blanc ha 9% Chardonnay ha 8% Colombard ha 12% Chenin Blanc ha 18% Other White ha 8% Cabernet Sauvignon ha 12% Shiraz ha 10% Pinotage ha 7% Merlot ha 6% Other Red ha 10% 22
23 SOUTH AFRICA SALES 2014 DOMESTIC: EXPORT: hl hl Export 52% Domestic 48% Source: Sawis Statistics 2014 SOUTH AFRICA EXPORT 2014 EXPORT: hl BY COUNTRY: TOP 6 Others 32% United Kingdom 26% Netherlands 5% Sweden 6% France 6% Russia 6% Germany 19% Source: Sawis Statistics
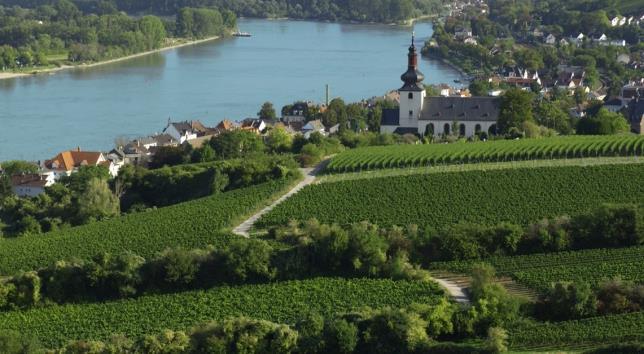


24 GERMANY RHEINHESSEN RHEINHESSEN AREA MAINZ 24
25 RHEINHESSEN SURFACE & PRODUCTION 2015 Acreage: ha Total wine production: hl Ø Yield: 97 hl/ha WINE COMPANIES (including wine-growers, estate wineries, cooperatives, wineries and grape growers) Source: Rheinhessenwein e.v. TOTAL: ha 30% RED: ha 70% WHITE: ha RHEINHESSEN VARIETIES 2015 Other White % Dornfelder % Spätburgunder % Other Red % Source: Stat. Landesamt RLP Silvaner % Müller-Thurgau % Riesling % 25
26 RHEINHESSEN EXPORT 2013 EXPORT: hl BY COUNTRY: TOP 5 Others 34% The Netherlands 25% Source: Rheinhessenwein e.v. France 6% United Kingdom 9% Russia 11% USA 15% RHEINHESSEN VISITORS Total: Overnight stays: Domestic: 78 % Foreign: 22 % Visitors come from - TOP 5 in USA 5. United Kingdom 2. The Netherlands 4. China 3. Switzerland 26
: 14.310 Development of visitors and overnight stays in Rheinhessen (in businesses with ten or more beds incl.")
27 RHEINHESSEN Accommodation Hotels: Beds: Private accommodation: Beds: Others: Beds: Ø Gross Revenue (million ): 911,7 Ø Employment (jobs): Development of visitors and overnight stays in Rheinhessen (in businesses with ten or more beds incl. Campsites) Overnight stays Visitors 27

28 RHEINHESSEN Tourism in Rheinhessen - development The development of the number of visitors in Rheinhessen constantly rising. The number of visitors with increased by 4,7 % compared to the preceding year and surpassed the national average. The number of overnight stays rose by 2,4 % to Compared to the last 10 years, Rheinhessen has gained 25,1 % in overnight stays and 36,1 % in visitors and is one of the most dynamic tourist regions in Rhineland-Palatinate and among other German wine-growing regions. (source: Statistical Office, statistical reports). Visitors and overnight stays over the course of the years


29 ARGENTINA MENDOZA MENDOZA AREA 4 main subregions: CITY OF MENDOZA Northeastern Central Southern Uco Valley 29
30 MENDOZA SURFACE & PRODUCTION 2014 Acreage: Total wine production: Ø Yield: ha hl 72 hl/ha WINE ESTATES (including winegrower, estate wineries, cooperatives, wineries and grape growers) Source: Instituto Nacional de Vitivinicultura (INV) TOTAL: ha 84 % RED/ROSÉ : ha 16 % WHITE: ha MENDOZA VARIETIES 2014 Pedro Giménez ha 6% Chardonnay ha 3% Criolla Grande ha 10% Torrontés Riojano ha 2% Cereza ha 10% Source: Instituto Nacional de Vitivinicultura (INV) Other White ha 6% Other Red/Rosé ha 24% Malbec ha 21% Bornada ha 10% Cabernet Sauvignon ha 8% 30


 PORTUGAL")
31 ARGENTINA EXPORT 2014 EXPORT: hl The Netherlands 6% Others 7% Brazil 8% United Kingdom 12% USA 53% Canada 14% Source: Instituto Nacional de Vitivinicultura (INV) PORTUGAL DOURO VINHO VERDE 31
32 VINHO VERDE AREA 9 subregions: VINHO VERDE Amarante Ave Balão Basto Cávado Ponte de Lima Moncão / Melagaco Paiva Sousa PORTO DOURO VINHO VERDE SURFACE & PRODUCTION 2014 Acreage: ha Total wine production: hl Ø Yield: 33 hl / ha WINE COMPANIES (including wine-growers, estate wineries, cooperatives, wineries and grape growers) 32
33 VINHO VERDE VARIETIES 2014 TOTAL: ha RED / ROSÉ: ha WHITE: ha Avesso 520 ha 2% Azal 890 ha 4% Other White ha 25% Vinhao ha 10% Espadeiro 172 ha 1% Borracal 108 ha 0% Padeiro 80 ha 0% Other Red/Rosé ha 18% Trajadura 993 ha 5% Alvarinho ha 9% Arinto/Pederna ha 10% Loureiro ha 16% VINHO VERDE- EXPORT % DOMESTIC: hl 32 % EXPORT: hl Others 30% USA 21% VINHO VERDE DOURO Switzerland 6% Brazil 6% Canada 6% France 11% Germany 22% 33
 Source: IVDP")
34 DOURO AREA 3 subregions: Baixo Corgo Cima Corgo Douro Superior VINHO VERDE PORTO DOURO DOURO SURFACE & PRODUCTION Acreage: ha ha Total wine production: hl Ø Yield: 31 hl/ha WINE COMPANIES (including wine-growers, estate wineries, cooperatives, wineries and grape growers) Source: IVDP 34
35 TOTAL: ha RED: ha WHITE: ha OTHERS: ha DOURO VARIETIES Rabigato % Malvasia Fina % Others % Touriga Franca % Tinta Roriz % Source: IVDP Codega % Marufo % Touriga Nacional % Tinta Barroca Tinta Amarela 12% % DOURO / PORTO - EXPORT 2014 DOMESTIC: hl EXPORT: hl VINHO VERDE Others 34% France 28% DOURO Belgium 12% United Kingdom 12% Netherlands 14% 35


36 CALIFORNIA NAPA VALLEY NAPA VALLEY AREA 16 subregions 76 km SAN FRANCISCO Atlas Peak Calistoga Chiles Valley Coombsville Diamond Mountain Howell Mountain Los Carneros Mt. Veeder Oak Knoll Oakville Valley Rutherford St. Helena Spring Mountain Stags Leap Yountville Wild Horse Valley 36
37 NAPA VALLEY SURFACE & PRODUCTION 2014 ACREAGE ha WINE COMPANIES 530 PRODUCTION hl (estimate) TOTAL: ha 77% RED: ha 23% WHITE: ha NAPA VALLEY VARIETIES 2015 Pinot Noir ha 6% Other Red ha 13% Chardonnay ha 15% Sauvignon Blanc ha 6% Other White 346 ha 2% Merlot ha 11% Source: Napa County 2013 Report Cabernet Sauvignon ha 47% 37
38 NAPA VALLEY VISITORS 2014 Total: 2.7 million Leisure: 2.5 million 93 % Business: % Domestic: 88% Foreign: 12% Visitors com from - TOP 5 5. Australia 1. Canada 2. China 4. Japan 3. United Kingdom NAPA VALLEY Accommodation 2014 Hotels: 55 Rooms/hotels: Bed & breakfast: 65 Rooms/b&b: 463 Total rooms: Ø Global Tourist spending (billion) $ 1.63 Ø Employment (jobs)
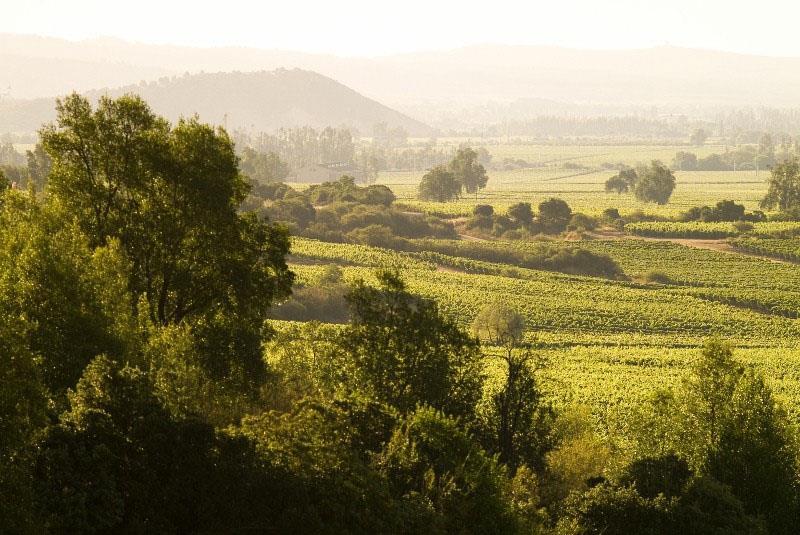
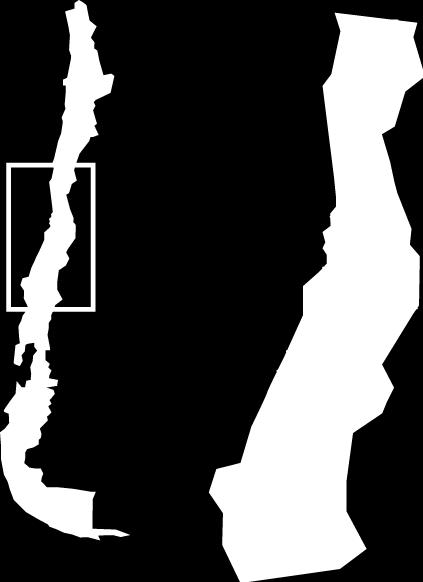

39 CHILE CASABLANCA VALLEY CASABLANCA VALLEY AREA VALPARAISO 39
40 CASABLANCA VALLEY SURFACE & PRODUCTION 2014 Acreage: ha Total wine production: hl Ø Yield: 66 hl/ha WINE COMPANIES 154 (including wine-growers, estate wineries, cooperatives, wineries and grape growers) CASABLANCA VALLEY VARIETIES 2014 TOTAL: ha 74 % RED: ha 26 % WHITE: ha Chardonnay ha 29% Other White 222 ha 4% Pinot Noir 994 ha 17% Merlot 311 ha 5% Syrah 186 ha 3% Sauvignon Blanc ha 41% Other Red 39 ha 1% 40
41 CASABLANCA VALLEY EXPORT 2014 DOMESTIC: hl EXPORT: hl Others 12% USA 20% China 12% Brazil 10% United Kingdom 20% Japan 14% Netherlands 12% GREAT WINE CAPITALS RESEARCH Thank you! 41
International wine market review
 MIDTERM MEETING 2017 INTERNATI L WINE MARKET REVIEW International wine market review OTTO SCHÄTZEL DLR OPPENHEIM, GERMANY Annual General Meeting November 2017 Valparaiso Casablanca Valley OVERVIEW I. INTERNATIONAL
STATE OF THE VITIVINICULTURE WORLD MARKET
 STATE OF THE VITIVINICULTURE WORLD MARKET April 2015 1 Table of contents 1. 2014 VITIVINICULTURAL PRODUCTION POTENTIAL 3 2. WINE PRODUCTION 5 3. WINE CONSUMPTION 7 4. INTERNATIONAL TRADE 9 Abbreviations:
2018 World Vitiviniculture Situation. OIV Statistical Report on World Vitiviniculture
 2018 World Vitiviniculture Situation OIV Statistical Report on World Vitiviniculture Introduction This report has been prepared by the Statistics department of the International Organisation of Vine and
World vitiviniculture situation
 World vitiviniculture situation Surface area Grape Wine Global grape production Production Consumption Trade 2016 FAO-OIV Focus: Table and Dried Grapes 2 Global area under vines Area under vines in the
World vitiviniculture situation
 World vitiviniculture situation Surface area Grape Wine Global grape production Table and dried grapes Production Consumption Trade 2017 OIV Focus: Vine varietal distribution in the world 2 Global area
STATE OF THE VITIVINICULTURE WORLD MARKET
 STATE OF THE VITIVINICULTURE WORLD MARKET April 2018 1 Table of contents 1. VITICULTURAL PRODUCTION POTENTIAL 3 2. WINE PRODUCTION 5 3. WINE CONSUMPTION 7 4. INTERNATIONAL TRADE 9 Abbreviations: kha: thousands
State of the Vitiviniculture World Market
 Punta del Este, November 19th, 2018 State of the Vitiviniculture World Market Jean-Marie Aurand Director General Topics Potential of viticultural production Production of grapes Production of wine Consumption
State summary OVERVIEW OF VINTAGE STATISTICS State and regional overview. Source of fruit. Projections of future supply and demand
 State summary OVERVIEW OF VINTAGE STATISTICS 2001 State and regional overview The total crush of South Australian winegrapes in 2001 was 678,821 tonnes. This compares with 482,157 tonnes in 2000 an increase
ANALYSIS ON THE STRUCTURE OF HONEY PRODUCTION AND TRADE IN THE WORLD
 ANALYSIS ON THE STRUCTURE OF HONEY PRODUCTION AND TRADE IN THE WORLD GU G., ZHANG Ch., HU F.* Department of Sericulture and Apiculture, College of Animal Science Zhejiang University, Hangzhou 310029, CHINA
Global Grape Report JUI CE P RODU C TS A S SOCI ATION FA L L BU S I N ESS M E E TING N OV E MBER 5,
 Global Grape Report JUICE PRODUCTS ASSOCIATION 2017 FALL BUSINESS MEETING NOVEMBER 5, 2017 DEDICATED BROKERS IN 8 COUNTRIES GLOBALLY BASED TO BUILD YOUR BUSINESS WORLDWIDE INTRODUCTION Ciatti Co 8 Regional
The state of the European GI wines sector: a comparative analysis of performance
 The state of the European GI wines sector: a comparative analysis of performance Special Report November 2017 1. Overview of a growing global wine market Wine is one of the most globalised products. The
Global Wine Report SAN JOAQUIN VALLEY WINE GROWERS ASSOCIATION NOVEMBER 29, 2017 DEDICATED BROKERS IN 8 COUNTRIES
 Global Wine Report SAN JOAQUIN VALLEY WINE GROWERS ASSOCIATION NOVEMBER 29, 2017 DEDICATED BROKERS IN 8 COUNTRIES GLOBALLY BASED TO BUILD YOUR BUSINESS WORLDWIDE 1 INTRODUCTION Ciatti Co à 8 Regional Offices
Wine Intelligence for Vinisud
 Wine Intelligence for Vinisud Economic observatory of Mediterranean wines in international markets 19 th February 2018 Wine Intelligence 2018 1 I. Objectives and methodology II. Focus on the market (production
National Vintage Report 2017
 Wine Australia for Australian Wine At a glance summary Crush grew by 5 per cent to 1.93 million tonnes The total estimated value of the Australian winegrape crush is $1.22 billion an increase of 13 per
PHILIPPINES. 1. Market Trends: Import Items Change in % Major Sources in %
 PHILIPPINES A. MARKET OF FRESH FRUITS & VEGETABLES 1. Market Trends: Import Items 2003 2007 Change in % Major Sources in % Value Quantity Value Quantity Value Quantity USD '000 Tons USD '000 Tons Grapes
GREAT WINE CAPITALS GLOBAL NETWORK MARKET SURVEY FINANCIAL STABILITY AND VIABILITY OF WINE TOURISM BUSINESS IN THE GWC
 GREAT WINE CAPITALS GLOBAL NETWORK MARKET SURVEY 2010-2011 FINANCIAL STABILITY AND VIABILITY OF WINE TOURISM BUSINESS IN THE GWC June 2011 2 / 6 INTRODUCTION This market survey has focused on how the economic
2016 World wine production estimated at 259 mhl, a fall of 5% compared with 2015
 Paris, 20 October 2016 GLOBAL ECONOMIC VITIVINICULTURE DATA 2016 World wine production estimated at 259 mhl, a fall of 5% compared with 2015 2016 Production among the lowest in 20 years, yet highly contrasting
GLOBAL ECONOMIC VITIVINICULTURE DATA
 Paris, 23 October 2014 GLOBAL ECONOMIC VITIVINICULTURE DATA 271 mhl of wine produced in 2014 With a reduction of 6% compared with the previous year, world wine production has returned to an average level
State of the Industry
 State of the Industry Sandy Hathaway WGCSA Jim Moularadellis Austwine Mark Rowley Wine Australia Shiraz Shiraz Crop down by 3,000t (2%) across the state Average prices up in BV, A/Hills, MV, Pad Prices
Italy. Italian Wine Overview 2017
 THIS REPORT CONTAINS ASSESSMENTS OF COMMODITY AND TRADE ISSUES MADE BY USDA STAFF AND NOT NECESSARIY STATEMENTS OF OFFICIA U.S. GOVERNMENT POICY Voluntary - Public Date: //7 GAIN Report Number: IT7 Italy
Australian wine sales update
 Australian wine sales update Mark Rowley, Senior Analyst Wine Sector Intelligence June 2015 Australian supply and demand Murray Valley s key varieties Summary Billion litres Global wine supply has tightened
Wine production: A global overview
 Wine production: A global overview Prepared by: Sally Easton DipWSET, MW for WSET Alumni A global overview One of the challenges of wine production is matching production to consumption in order to minimise
JAPANESE WINE MARKET. June Market Data Japan, June 2016, Wines of Germany, Japan
 JAPANESE WINE MARKET June 2016 1 JAPANESE WINE MARKET Japan is a growing market with 55.2 million wine drinkers and a total volume of 3,600,000hL of wine Growing wine culture Annual per capita consumption
W or ld Cocoa and CBE mar kets. Presentation to Global Shea 2013 By Richard Truscott, LMC International, Oxford, UK
 W or ld Cocoa and CBE mar kets Presentation to Global Shea 2013 By Richard Truscott, LMC International, Oxford, UK www.lmc.co.uk Outline The use of CBEs Chocolate and CBE demand trends Cocoa production
Riverland RIVERLAND VINTAGE OVERVIEW 1 SA UTILISATION AND PRICING SURVEY Vintage Report. Overview of vintage statistics
 Riverland RIVERLAND VINTAGE OVERVIEW Vintage Report If any year can be described as perfect, 2002 would have been it weatherwise. A good long cool period with no heat shocks for ripening led to large crops
World Sweet Cherry Review
 World Sweet Cherry Review 2017 Edition TABLE OF CONTENTS Foreword 2 Table of Contents 3 Tables 5 Charts 6 The High Variability Challenge 8 I. World Production of Sweet Cherries 14 Erratic Rise in World
World wine tendencies
 World wine tendencies VITICULTURALE SURFACE World wine trends Until the end of the 70th years world's vineyards has increased steadily over 10 million hectares Early 80s: crisis of overproduction 25% decrease
World Cocoa and CBE markets. Presentation to Global Shea 2014 By Owen Wagner, LMC International, Raleigh, NC
 World Cocoa and CBE markets Presentation to Global Shea 214 By Owen Wagner, LMC International, Raleigh, NC www.lmc.co.uk Outline Background to the chocolate and CBE markets Chocolate and CBE demand trends
CALIFORNIA WINE EXPORT PROGRAM. Wine Industry Financial Symposium Linsey Gallagher Vice President, International Marketing, Wine Institute
 CALIFORNIA WINE EXPORT PROGRAM Wine Industry Financial Symposium Linsey Gallagher Vice President, International Marketing, Wine Institute September 26, 2018 Napa, CA Road Trip Video https://www.youtube.com/watch?v=lmh5abhwczc
Riverland RIVERLAND VINTAGE OVERVIEW. Vintage Report. Overview of vintage statistics
 Riverland RIVERLAND VINTAGE OVERVIEW Vintage Report Overview of vintage statistics The 2005 growing season was almost perfect in the Riverland. Although there were rain events in both December and January,
World Yoghurt Market Report
 World Yoghurt Market Report 2000-2020 Price: 1,800 /$2,200 The report contains 330 pages of valuable information Analysis of the current market situation and future possibilities in all regions of the
WINE EXPORTS. February Nadine Uren. tel:
 WINE EXPORTS February 2012 Nadine Uren tel: +27 21 807 5707 e-mail: nadine@sawis.co.za OVERVIEW OF WINE EXPORTS HIGHLIGHTS Exports as a percentage of wine production decreased from 48.5% in 2010 to 43.2%
GLOBAL SUPPLY UPDATE GLENN PROCTOR FEBRUARY 7, 2018
 GLOBAL SUPPLY UPDATE GLENN PROCTOR FEBRUARY 7, 2018 21 DEDICATED BROKERS IN 8 COUNTRIES GLOBALLY BASED TO BUILD YOUR BUSINESS WORLDWIDE INTRODUCTION - CIATTI CO 8 REGIONAL OFFICES WORLDWIDE - WINE, GRAPES,
Riverland RIVERLAND VINTAGE OVERVIEW S A UTILISATION AND PRICING SURVEY Vintage report. Overview of vintage statistics
 Riverland RIVERLAND VINTAGE OVERVIEW Vintage report The season was largely dominated by the extreme heat that occurred after January. This heat stressed the vines to the extent that cropping levels for
United States Is World Leader in Tree Nut Production and Trade
 Special Article United States Is World Leader in Tree Nut and Trade by Doyle C. Johnson Abstract: Crops of all major U.S. tree nuts will be larger in 997. However, beginning stocks of most tree nuts are
Red wine consumption in the new world and the old world
 Red wine consumption in the new world and the old world World red wine market is expanding. In 2012, the total red wine trade was over 32 billion dollar,most current research on wine focus on the Old World:
Fresh Deciduous Fruit (Apples, Grapes, & Pears): World Markets and Trade
: World Markets and Trade") Million MT United States Department of Agriculture Foreign Agricultural Service December 21 Fresh Deciduous Fruit (Apples, Grapes, & Pears): World Markets and Trade 21/11 Forecast: World Apple Trade Declines;
Million MT United States Department of Agriculture Foreign Agricultural Service December 21 Fresh Deciduous Fruit (Apples, Grapes, & Pears): World Markets and Trade 21/11 Forecast: World Apple Trade Declines;
South Australia other Regional summary report 2009
 South Australia other Regional summary report 2009 South Australia (other) Vintage overview South Australia (other) includes the GI region of Southern Flinders Ranges, the Peninsulas zone, and the vineyards
SA WINE INDUSTRY 2017 STATISTICS NR 42
 SA INDUSTRY 2017 STATISTICS NR 42 South African Wine Industry Statistics is published annually during June and is available on request, free of charge, at SAWIS, P O Box 238, Paarl, 7620 or Main Road 312,
Overview of the Manganese Industry
 39th Annual Conference Istanbul, Turkey 2013 Overview of the Manganese Industry International Manganese Institute Alberto Saavedra Market Research Manager June, 2013 Introduction Global Production Supply,
Global Trade in Mangoes
 Global Trade in Mangoes October 2014 Jim Lang Managing Director TradeData International Pty Ltd jim.lang@tradedata.net www.tradedata.net COUNTRIES WITH MONTH IMPORT STATISTICS 1. The global market is just
AGRITECH WINE INDUSTRY KEY INFO IN POINTS
 AGRITECH WINE INDUSTRY KEY INFO IN 10 POINTS 1 FRANCE: 2 THE 3 HIGH-QUALITY 4 GLOBAL THE LAND OF WINE France produces more than 3,200 varieties of wine across 80 departments and 16 large vineyards (Vin
McLaren Vale MCLAREN VALE VINTAGE OVERVIEW S A UTILISATION AND PRICING SURVEY Vintage report. Overview of vintage statistics
 McLaren Vale MCLAREN VALE VINTAGE OVERVIEW Vintage report Heavy winter rainfall gave vines a strong start to the season. Rain ceased to fall midway through October and it remained dry until the bulk of
China s Export of Key Products of Pharmaceutical Raw Materials
 China s Export of Key Products of Pharmaceutical Raw Materials During the period of the 62nd API China& INTERPHEX CHINA, China Pharmaceutical Industry Association released its annual Report on Analysis
AMAZONIA (BRAZIL) NUTS MACADAMIAS HAZELNUTS PISTACHIOS WALNUTS PINE NUTS PECANS
 NUTS MACADAMIAS HAZELNUTS PISTACHIOS WALNUTS PINE NUTS PECANS") HAZELNUTS MACADAMIAS PECANS PINE NUTS INTRODUCTION WORLD PRODUCTION PRODUCTION AND CONSUMPTION TRENDS SUPPLY VALUE ALMONDS AMAZONIA (BRAZIL) NUTS CASHEWS PISTACHIOS WALNUTS PEANUTS DATES 05 06 09 13 14
HAZELNUTS MACADAMIAS PECANS PINE NUTS INTRODUCTION WORLD PRODUCTION PRODUCTION AND CONSUMPTION TRENDS SUPPLY VALUE ALMONDS AMAZONIA (BRAZIL) NUTS CASHEWS PISTACHIOS WALNUTS PEANUTS DATES 05 06 09 13 14
AMERICAN PECAN COUNCIL. Shipments and Inventory on Hand. For the One Month Ended November 30, 2018
 Shipments and Inventory on Hand Shipments: Total Shelled Meats 15,791,127 Inshell 3,035,663 Total Shipments (Inshell Basis) 34,617,917 Total Pecans in Inventory: Shelled Meats 43,994,659 Inshell 48,911,798
Monitoring EU Agri-Food Trade: Development until September 2018
 Monitoring EU Agri-Food Trade: Development until September 2018 September 2018: Slowdown in EU export performance; imports from Brazil and US still on the rise The monthly value of EU agri-food trade in
Hop Market Report 14th June 2017
 Hop Market Report 14th June 2017 Hop acreage grows by approx. 3.060 ha (+5,4%) to 59.200 ha worldwide ******** Normal growing conditions so far; balanced alpha supply and demand expected for brewing year
and the World Market for Wine The Central Valley is a Central Part of the Competitive World of Wine What is happening in the world of wine?
 The Central Valley Winegrape Industry and the World Market for Wine Daniel A. Sumner University it of California i Agricultural l Issues Center January 5, 211 The Central Valley is a Central Part of the
AMERICAN PECAN COUNCIL. Shipments and Inventory on Hand. For the One Month and Five Months Ended January 31, 2019
 Shipments and Inventory on Hand One Month Five Months Shipments: Shelled Meats Retail/Grocery/Export 11,247,569 65,205,488 Inter-handler Transfers Shipped 28,470 3,650,972 Inter-handler Transfers Received
Global sparkling wine market trends. June Peter Bailey. Manager - Market Insights. Wine Australia
 Global sparkling wine market trends June 2018 Peter Bailey Manager - Market Insights Wine Australia Presentation Outline 1. Who are the biggest sparkling wine producers? 2. Where are the biggest markets?
Wine Export Approval Report. Moving Annual Total (MAT) To March 2015
 To March 2015") Wine Export Approval Report Moving Annual Total () To 2015 Wine Australia would like to acknowledge the support of the following Australian Wine Export partners Partners Released quarterly Disclaimer:
Wine Export Approval Report Moving Annual Total () To 2015 Wine Australia would like to acknowledge the support of the following Australian Wine Export partners Partners Released quarterly Disclaimer:
Best Of Wine Tourism AWARDS 2018 CONTEST RULES. Turismo Oficial do Porto. Rua Clube dos Fenianos, PORTO PORTUGAL Tel:
 Best Of Wine Tourism AWARDS 2018 CONTEST RULES 2018 Turismo Oficial do Porto Rua Clube dos Fenianos, 25 4000-172 PORTO PORTUGAL Tel: +351 223 39 34 72 INTRODUCTION ARTICLES THE GREAT WINE CAPITALS NETWORK
WORLD WINE SUPPLY OUTLOOK MARCH 5, 2017 THE VINEGAR INSTITUTE 2017 ANNUAL MEETING
 WORLD WINE SUPPLY OUTLOOK MARCH 5, 2017 THE VINEGAR INSTITUTE 2017 ANNUAL MEETING DEDICATED BROKERS IN 8 COUNTRIES GLOBALLY BASED TO BUILD YOUR BUSINESS WORLDWIDE INTRODUCTION - CIATTI COMPANY - BROKER
The Italian Wine Sector
 The Italian Wine Sector 28 Feb 2017 The Italian wine sector is the world s largest wine producer and its second largest exporter by volume behind Spain. This paper gives an overview of wine production,
An insight into the viticulture sector
 An insight into the viticulture sector Business Analysis Pio De Gregorio Head Luca Schianchi Senior analyst Brescia, 12 June 2015 World production of wine Billion of liters 2007 2008 2009 2010 2011 2012
Export market trends and outlook
 Export market trends and outlook Much better! 28 th July 2017 Tim Hunt General Manager Food & Agribusiness Research Rabobank Food & Agribusiness Research Rabobank s unique global team of 90 analysts supporting
Rias Baixas W I N E S T A T S. I N F O. Base maps Google Maps
 Rias Baixas Rias Baixas is the largest of five Denominacións de Origen Protegida (DOPs) in Galicia, northwest Spain. Wines from this DOP generate an annual revenue of ca. 100 million - an important wealth
Fleurieu zone (other)
") Fleurieu zone (other) Incorporating Southern Fleurieu and Kangaroo Island wine regions, as well as the remainder of the Fleurieu zone outside all GI regions Regional summary report 2006 South Australian
Fleurieu zone (other) Incorporating Southern Fleurieu and Kangaroo Island wine regions, as well as the remainder of the Fleurieu zone outside all GI regions Regional summary report 2006 South Australian
OPPORTUNITIES IN THE EUROPEAN MARKET FOR SRI LANKAN FOOD & BEVERAGES
 OPPORTUNITIES IN THE EUROPEAN MARKET FOR SRI LANKAN FOOD & BEVERAGES Prepared by: Export Development Board (EDB), Sri Lanka November, 2012 CONTENTS 1. MARKET OVERVIEW... 3 2. TRENDS IN THE EUROPEAN MARKET
Wines of British Columbia Liberal Party of Canada s Pacific Caucus (July 19, 2016)
") Wines of British Columbia Liberal Party of Canada s Pacific Caucus (July 19, 2016) Wine Region Comparison Region Acres Spain 2,724,700 France 1,966,510 Italy 1,712,607 United States 943,750 Argentina 560,000
Wines of British Columbia Liberal Party of Canada s Pacific Caucus (July 19, 2016) Wine Region Comparison Region Acres Spain 2,724,700 France 1,966,510 Italy 1,712,607 United States 943,750 Argentina 560,000
Status of Wine-grape Vines as on 31 December 2017 Bonita Floris-Samuels tel:
 Status of Wine-grape Vines as on 31 December 217 Bonita Floris-Samuels tel: +27 21 87 5711 e-mail: floris@sawis.co.za Nadine Uren tel: +27 21 87 577 e-mail: nadine@sawis.co.za Statistics i.r.o. South African
LETTER FROM THE EXECUTIVE DIRECTOR
 E LETTER FROM THE EXECUTIVE DIRECTOR COFFEE MARKET REPORT December 2008 Price levels in December confirmed the downward trend recorded in the coffee market since September 2008. The monthly average of
Effect of new markets on the supply-demand balance
 Effect of new markets on the supply-demand balance Presentation to ICO Seminar Robert Simmons, LMC International, Oxford, UK www.lmc.co.uk Global coffee consumption has grown at by over 2% per annum over
Wine Economics Research Centre Wine Policy Brief No. 6
 Wine Economics Research Centre Wine Policy Brief No. 6 How much have exchange rate movements reduced competitiveness of Australian wines? Kym Anderson and Glyn Wittwer Wine Economics Research Centre School
World Cocoa Conference Nov 2012
 World Cocoa Conference 19-23 Nov 2012 Situation and prospects for cocoa supply & demand Laurent Pipitone Director of Economics & Statistics Division 1 Improving market information and transparency One
Paper and Pulp Foreign Trade
 1 FORESTRY PRODUCTS INDUSTRIAL OPERATIONS DIVISIONS 2 Sector Department 1 Paper and Pulp Foreign Trade During 1998, international trade in paper and pulp totaled some US$ 87.5 billion (Figure 1), corresponding
Coffee Market Outlook
 Coffee Market Outlook 15 th Asia International Coffee Conference Ho Chi Minh City, Vietnam 7-9 December 2009 Néstor Osorio Executive Director ICO composite indicator price Monthly: January 2000 to November
Bergman. Euro-National VINEYARD VALUES STARTING 2017 FOR NAPA AND SONOMA COUNTIES
 Bergman Euro-National S U M M E R 2 0 1 7 N E W S L E T T E R VINEYARD VALUES STARTING 2017 FOR NAPA AND SONOMA COUNTIES 2017 A VERY SPECIAL YEAR 2017 is an important year, as it marks 50 years of selling
Food Additive Produced by IAR Team Focus Technology Co., Ltd
 Food Additive 2012.03 Produced by IAR Team Focus Technology Co., Ltd Contents 1. 2009-2011 Chinese Citric Acid Export Data Analysis... 3 2009-2011 Major Importers of Chinese Citric Acid...4 2. 2009-2011
Riverland RIVERLAND VINTAGE OVERVIEW. Overview of vintage statistics. Vintage Report
 Riverland 88 RIVERLAND VINTAGE OVERVIEW Vintage Report The 2004 vintage ran very smoothly, apart from some difficulties encountered in February due to excessive heat lasting about seven days or so, with
MARKET NEWSLETTER No 127 May 2018
 Olive growing in Argentina At the invitation of the Argentine authorities, the 107th session of the Council of Members will be held in Buenos Aires (Argentina) from 18 to 21 June 2018. Argentina was the
Industry Advisory Panel Item 4c Trade of Stainless Steel Scrap
 Industry Advisory Panel Item 4c Trade of Stainless Steel Scrap Lisbon Tuesday 22 April 2008 Sven Tollin Chief Statistician 1 Stainless Steel Waste & Scrap Comparison calendar with Except Kazakhstan only
DG AGRI DASHBOARD: WINE. EU Prices. Production. EU Trade. Consumption. Last update: Place of Consumption. Stocks Jan 2015.
 EU Prices EU Trade Production Consumption DG AGRI DASHBOARD: WINE 1980 2002-03 2003-04 2004-05 1985 2005-06 2006-07 1990 2007-08 2008-09 2009-10 1995 2010-11 2011-12 2000 2012-13 2013-14 2014-15 2005 2015-16
BANKWEST CURTIN ECONOMICS CENTRE. WA WINE EXPORTS Building an Economic Future with China
 BANKWEST CURTIN ECONOMICS CENTRE WA WINE EXPORTS Building an Economic Future with China BCEC Research Report No. 1/16 June 2016 About the Centre The Bankwest Curtin Economics Centre is an independent economic
MARKET NEWSLETTER No 93 April 2015
 Focus on OLIVE OIL IMPORT TRENDS IN RUSSIA Russian imports of olive oil and olive pomace oil grew at a constant rate between 2/1 and 213/14 when they rose from 3 62 t to 34 814 t (Chart 1). The only exceptions
AMERICAN PECAN COUNCIL. Pecan Industry Position Report. For the Crop Year Ended August 31, 2018
 Pecan Industry Position Report INTER-HANDLER TRANSFERS OF PECANS Total Inshell Pounds Transferred: Improved 109,898,013 Native/Seedling 14,813,988 Substandard 16,809,311 Total 141,521,312 YEAR-END INVENTORY
Wine Export Approval Report
 Wine Export Approval Report Moving Annual Total (MAT) To June 2015 Contents Summary Report Bottled Report Bulk Report Notes and definitions p3 p19 p34 p43 2 Summary Report Commentary Historic Overview
THE IRISH WINE MARKET 2017
 THE IRISH WINE MARKET THE IRISH WINE MARKET It is a challenging time for Ireland s wine industry. In, wine consumption rose marginally compared to the previous year and the continued growth in the wider
OIV Revised Proposal for the Harmonized System 2017 Edition
 OIV Revised Proposal for the Harmonized System 2017 Edition TABLE OF CONTENTS 1. Preamble... 3 2. Proposal to amend subheading 2204.29 of the Harmonized System (HS)... 4 3. Bag-in-box containers: a growing
4/14/2018. Location. The Wines of Australia s Limestone Coast. The Wines of Australia s Limestone Coast. Location. Limestone. Vines.
 The Wines of Australia s Limestone Coast The Wines of Australia s Limestone Coast Location Limestone Vines Regions Location 1 2 City of Adelaide Clare Valley (270 miles) (200 miles) Barossa, Eden Valleys
Fresh Deciduous Fruit (Apples, Grapes, & Pears): World Markets and Trade
: World Markets and Trade") Fresh Deciduous Fruit (Apples, Grapes, & Pears): World Markets and Trade June 21 APPLES Record Production but Trade Estimate Revised Downward The world production estimate for 29/1 is virtually unchanged
Fresh Deciduous Fruit (Apples, Grapes, & Pears): World Markets and Trade June 21 APPLES Record Production but Trade Estimate Revised Downward The world production estimate for 29/1 is virtually unchanged
Status of Wine-grape Vines
 Status of Wine-grape Vines as on 31 December 216 Bonita Floris-Samuels tel: +27 21 87 5711 e-mail: floris@sawis.co.za Nadine Uren tel: +27 21 87 577 e-mail: nadine@sawis.co.za Statistics i.r.o. South African
Global Hot Dogs Market Insights, Forecast to 2025
 Report Information More information from: https://www.wiseguyreports.com/reports/3366552-global-hot-dogs-market-insights-forecast-to-2025 Global Hot Dogs Market Insights, Forecast to 2025 Report / Search
Germany is the largest importer of cheese and UK and Italy are the second- and third-largest importers.
 EXTRACTSFROMTHEREPORT 1.Introduction 1.1. Background The cheese market has been one of the most dynamic food segments in the last 20 year with steady growth in production, consumption and international
Introduction. Copyright - The IWSR 2009 Page 1
 Introduction The global wine and spirits market has been affected by the credit crunch and volumes for 2009 are expected to be down across many markets. A recovery will be seen in most categories and markets
Growth and Cycles in Australia s Wine Industry:
 Growth and Cycles in Australia s Wine Industry: A Statistical Compendium, 1843 to 213 Kym Anderson with the assistance of Nanda R. Aryal Wine Economics Research Centre School of Economics University of
LETTER FROM THE EXECUTIVE DIRECTOR
 E LETTER FROM THE EXECUTIVE DIRECTOR COFFEE MARKET REPORT August 2009 Although the monthly average of the ICO composite indicator price increased by 4% in August, from 112.90 US cents per lb in July to
Bearing Produced by IAR Team Focus Technology Co., Ltd.
 Bearing 2013.06 Produced by IAR Team Focus Technology Co., Ltd. Contents 1. Bearing Industry Exports of 2012... 3 1.1. China Bearing Industry Export Classification Tables of 2012... 3 1.2. China Ball or
Vintage Report At a glance. Total crush in Australia past 10 years
 Vintage Report 2016 t a glance rush up by 6 per cent to an estimated 1.81 million tonnes rush in warm irrigated regions down 0.6 per cent and cool/temperate regions up 26 per cent Red crush increased its
Carretera de Magallón s/n Fuendejalón (Zaragoza) Spain. Tel: Fax:
 Spain. Tel: Fax:") Carretera de Magallón s/n. 50529 Fuendejalón (Zaragoza) Spain. Tel: +34-976 86 21 53 Fax: +34-976 86 23 63 www.bodegasaragonesas.com D.O. Campo de Borja. The Empire of Garnacha Long winemaking tradition
Carretera de Magallón s/n. 50529 Fuendejalón (Zaragoza) Spain. Tel: +34-976 86 21 53 Fax: +34-976 86 23 63 www.bodegasaragonesas.com D.O. Campo de Borja. The Empire of Garnacha Long winemaking tradition
SINGAPORE. Summary Table: Import of Fresh fruits and Vegetables in Fresh fruit and Vegetables Market Value $000 Qty in Tons
 SINGAPORE A. MARKET FOR FRESH FRUIT AND VEGETABLES 1. Market Trend and Opportunities Summary Table: Import of Fresh fruits and Vegetables in Fresh fruit and Vegetables Market Products/ Other Info. Product
No shortage of challenges for both hemispheres. Case study of Australia. Outline. Value of exports, (US$m)
") The Southern Hemisphere and Global Wine Markets to 2030: Case study of Australia Kym Anderson Wine Economics Research Centre University of Adelaide Symposium on Outlook and Issues for the World Wine Market
The Southern Hemisphere and Global Wine Markets to 2030: Case study of Australia Kym Anderson Wine Economics Research Centre University of Adelaide Symposium on Outlook and Issues for the World Wine Market
A Trip around the World through Exports
 A Trip around the World through Exports Activity by Lesley Mace, senior economic and financial education specialist at the Federal Reserve Bank of Atlanta, Jacksonville Branch Concepts Comparative advantage
SA Winegrape Crush Survey Regional Summary Report 2017 South Australia - other
 SA Winegrape Crush Survey Regional Summary Report 2017 South Australia - other Vintage overview South Australia (other) includes the GI region of Southern Flinders Ranges, the Peninsulas zone, and the
World of sugar PAGE 54
 World of sugar More than 1 countries produce sugar, about 8% of which is made from sugar cane grown primarily in the tropical and sub-tropical zones of the southern hemisphere, and the balance from sugar
World Kiwifruit Review 2015 Edition TABLE OF CONTENTS
 World Kiwifruit Review 2015 Edition TABLE OF CONTENTS Foreword 2 Table of Contents 3 Charts 5 Tables 6 Emerging from the PSA Crisis 7 1. Production of Kiwifruit 13 Production Potential Still Rising 13
Monthly Economic Letter U.S. and Global Market Fundamentals
 Monthly Economic Letter U.S. and Global Market Fundamentals August 2012 www.cottoninc.com After trading within relatively narrow bands throughout July, New York futures moved higher in early August, with
P E C A N R E P O R T
 P E C A N R E P O R T Agricultural Marketing Service 16 Forest Parkway Specialty Crops Programs Building 1-218 Market News Division Forest Park, Georgia 30297 Phone (404) 361-1376 FAX (404) 363-2523 Pecan
Browse our full portfolio at sevenfifty.com/rivercitydistributing
 5.17.16 Alpha Omega Winery, Cabernet Sauvignon (2012) California, United States Cabernet Sauvignon Appellation Napa Valley Size 750 ml 6 SKU 100101 UPC 892283001344 Alpha Omega Winery, Napa Valley (2012)