Chemical, sensory and consumer profiling of a selection of South African Chenin blanc wines produced from bush vines
|
|
|
- Jesse Cobb
- 6 years ago
- Views:
Transcription

1 Chemical, sensory and consumer profiling of a selection of South African Chenin blanc wines produced from bush vines Evette Hanekom Thesis presented in partial fulfilment of the requirements for the degree of Master of Science in Food Science in the Faculty of Agrisciences at Stellenbosch University Supervisors M. Muller, Department of Food Science, Stellenbosch University Dr. H.H. Nieuwoudt, Institute for Wine Biotechnology, Stellenbosch University Dr. A.G.J. Tredoux, Institute for Wine Biotechnology, Stellenbosch University December 2012
2 DECLARATION By submitting this thesis electronically, I declare that the entirety of the work contained therein is my own, original work, that I am the sole author thereof (save to the extent explicitly otherwise stated), that reproduction and publication thereof by Stellenbosch University will not infringe any third party rights and that I have not previously in its entirety or in part submitted it for obtaining any qualification. Evette Hanekom Date: 26 November 2012 Copyright 2012 Stellenbosch University All rights reserved i
3 ABSTRACT Twenty five commercial Chenin blanc wines produced solely from bush vine vineyards and including three vintages, three styles and five production areas, were sourced for this study. Descriptive sensory analysis (DSA) and chemical analyses including GC-FID (gas chromatography fitted with a flame ionisation detector) and FTMIR (Fourier transform mid-infrared) spectroscopy were employed to establish the sensory and chemical characteristics, whereas consumer tests were conducted to determine consumer perception and liking of bush vine Chenin blanc wines. DSA (a profiling technique) was also compared to the sorting task (a classification technique) with a description assignment to evaluate the sorting task s ability to profile wines. According to the results of DSA, the wines separated into two groups. One group associated with sensory attributes which can be considered indicative of the Fresh and Fruity Chenin blanc style. The other group associated with sensory attributes which can be considered indicative of the Rich and Ripe style of Chenin blanc. No separation between the wooded and unwooded Rich and Ripe styles was apparent. According to the results of the chemical analyses, the wines also separated into two groups. This separation seemed to be caused by vintage and the chemical changes associated with ageing as the wines from the youngest vintage (2010) was strongly associated with high levels of esters and malic acid. The older wines were situated farthest away from these attributes indicating low concentrations. When comparing the results from the sorting task and DSA, it could be seen that similar wine style groupings formed, indicating that DSA can also be regarded as an effective tool when categorising wines. The differences in the positioning of some of the wines and attributes on the DSA multivariate plots and the sorting task plots could be attributed to the difference in panels used. The sorting task was conducted using an expert panel with persons illustrating significant technical knowledge of Chenin blanc wines. Experience, exposure and technical knowledge tend to establish a common language amongst wine experts which could have caused the expert panel to perceive some wines differently when comparing the results of the latter panel to that of the trained panel. DSA was found to remain the most effective method for establishing a comprehensive sensory profile. Consumer analyses showed that regular white wine drinkers prefer the unwooded styles (Fresh and Fruity and Rich and Ripe unwooded) of Chenin blanc more than the wooded style. It was also found that consumers with a higher level of objective wine knowledge tend to associate the terms bush vine and old bush vine with the Rich and Ripe style of Chenin blanc, whereas consumers with a lower level of objective wine knowledge associated old bush vine with the Fresh and Fruity style. Since all the wines used in the consumer analysis were produced from old bush vines, it is evident that consumer education on the impact of bush vine training system and vine age on wine quality is needed. Better understanding of these principles could lead to elevated product appraisals and consumer satisfaction. ii
4 UITTREKSEL Vyf en twintig kommersiële Chenin blanc wyne, uitsluitlik van bosstok wingerde geproduseer, is bekom vir hierdie studie. Die wyne het drie style, drie oesjare en vyf produksiestreke ingesluit. Beskrywende sensoriese analise (BSA) en chemiese analises, wat GC-FID (gas chromatografie gekoppel met vlamioniserende deteksie) en FTMIR (Fourier-transformering mid-infrarooi) spektroskopie insluit, is uitgevoer om onderskeidelik die sensoriese en chemiese eienskappe van die wyne te bepaal. Verbruikerstoetse is ook uitgevoer om verbruikerspersepsie en -voorkeure vir bosstok Chenin blanc wyne te bepaal. BSA ( n profilerings tegniek) was ook vergelyk met n sorterings taak ( n klassifikasie tegniek) met n beskrywings opdrag, primêr om die sorterings taak se vermoë om wyne te profileer te ondersoek. Volgens die resultate van BSA, het die wyne in twee groepe verdeel. Een groep het met die sensoriese eienskappe wat op n Vars-en-Vrugtige-styl dui, geassosieër. Die ander groep het met sensoriese eienskappe geassosieër wat met die Volrond-styl verband hou. Geen verdeling tussen die gehoute en ongehoute wyne binne die Volrond-styl was sigbaar nie. Volgens die resultate van die chemiese analises, het die wyne ook in twee groepe verdeel. Die verdeling blyk asof dit veroorsaak is deur oesjaar en die chemiese veranderinge wat met wynveroudering gepaard gaan. Wyne van die jongste oesjaar (2010) het n sterk verband met hoë vlakke van esters en appelsuur getoon. Die ouer wyne was verder weg van hierdie eienskappe geleë, wat op laer ester en appelsuur konsenstrasies dui. Wanneer die meerveranderlike resultate van die sorterings taak (met en sonder die aanduiding van sensoriese eienskappe) en dit van BSA vergelyk word, kon soortgelyke groeperings gesien word. Dit is n aanduiding dat BSA ook wyne effektief kan kategoriseer. Die verskil in posisionering van sommige wyne tussen die BSA en sorterings taak resultate, kan toegeskryf word aan die verskillende panele wat gebruik is om die tegnieke uit te voer. n Deskundige paneel (wynkenners) is gebruik om die sortingstaak uit te voer. Ervaring, blootstelling en tegniese kennis is geneig om te lei tot die vestiging van n gemeenskaplike taal onder wynkenners. Hierdie gemeenskaplike taal kan as rede aangevoer word vir die uiteenlopende analise van sommige wyne wanneer die resultate van die deskundige paneel met dié van die opgeleide paneel (in BSA gebruik) vergelyk word. Dit is gevind dat BSA, wanneer n omvattende sensoriese profiel bepaal moet word, die mees effektiefste metode bly. Verbruikerstoetse het getoon dat gereelde witwyn-verbruikers die ongehoute Chenin blanc style (Vars-en-Vrugtig en ongehoute Volrond) bo die gehoute styl verkies. Dit is ook bepaal dat verbruikers met n hoër vlak van objektiewe wynkennis neig om die terme bosstok en ou bosstok met die Volrond-styl van Chenin blanc te assosieer, terwyl verbruikers met n laer vlak van objektiewe wynkennis die term ou bosstok met die Vars-en-Vrugtige Chenin blanc styl assosieër. Aangesien al die wyne wat in die verbruikerstoetse ingesluit is van ou bosstok wingerde geproduseer is, is dit duidelik dat verbruikeropvoeding insake die effek van die gebruik van bosstokke en ou wingerdstokke op wynkwaliteit noodsaaklik is. n Beter begrip van hierdie beginsels sal lei tot verhoogde produkwaardasie, asook n toename in verbruikertevredenheid. iii
5 ACKNOWLEDGEMENTS It is with sincere gratitude that I acknowledge the following individuals and organisations for their support, guidance and devotion throughout this research project. Success was inevitable with them by my side. Nina Muller, Department of Food Science, Stellenbosch University (SU) for her enthusiasm, encouragement and guidance; Dr Hélène Nieuwoudt and Dr Andreas Tredoux, Institute for Wine Biotechnology, SU for their guidance, support and input regarding this project; Prof Tormod Næs, Nofima, Norway, for his input in the planning of this project and especially concerning the consumer study; Marieta van der Rijst and Martin Kidd, for their contribution regarding the statistical analysis of the data; The following wineries: Babylon s Peak Private Cellar, Wamakersvallei, Bosman Family Vineyards, Dornier Wines, Graham Beck Wines, Groenland wines, Groote Post Vineyards, Hazendal, Ken Forrester Wines, Kleine Zalze Wines, Koopmanskloof, KWV, Schalk Burger & Sons Winery, Mooiplaas, Nederburg and StellenRust for their support and cooperation throughout this research project; NRF for the bursary and project funding; Bonnie van Wyk, Erika Moelich and John Achilles, for all their help in the Sensory Research Laboratory, Department of Food Science, SU.; Nina Lawrence and Hugh Jumat, for all their patience, help and words of encouragement in the Chemical Analyses Laboratory, IWBT, SU.; iv
6 The Sensory Panel for their dedication and enthusiasm and their interest in the success of my studies and this project; The expert panel for their commitment and enthusiasm; For their personal support, encouragement and friendship, I would like to thank my colleagues Lindi van Antwerpen, Hanneke Botha, Nina Lawrence and Inneke Bester. For their love, prayers and encouragement, I would also like to acknowledge my beloved family and cherished friends. Above all, my Heavenly Father who blessed me with the strength, patience and determination to persevere and strive for more. All the glory, honour and power to Him. Everything is possible for him who believes. [Markus 9:24] v
7 TABLE OF CONTENTS DECLARATION... i ABSTRACT... ii UITTREKSEL... iii ACKNOWLEDGEMENTS... iv CHAPTER 1 Introduction... 1 CHAPTER 2 Literature review... 6 CHAPTER 3 Sensory and chemical profile of a selection of South African Chenin blanc wines produced from bush vines CHAPTER 4 Comparison of descriptive sensory analysis and sorting as test techniques using Chenin blanc wines CHAPTER 5 Effect of cues relating to wine trellising system and vine age on consumer liking of South African bush vine Chenin blanc wines CHAPTER 6 General discussion and conclusions ADDENDA Addendum A: Questionnaire used for obtaining information on the wines from their respective winemakers and/or viticulturists Addendum B: Information gathered on the wines using the questionnaire (see Addendum A), the internet, the wines labels and the Platter wine guide
8 Addendum C: Chenin blanc tasting wheel as compiled by the Chenin blanc Association of South Africa Addendum D: Lexicon and formulae of reference standards prepared for the training phase of descriptive sensory analysis Addendum E: Addendum F: Descriptive sensory analysis training questionnaire Limit of quantification (LOQ) for each compound analysed in the GC-FID analyses of major volatiles and monoterpene aroma compounds Addendum G: Specification sheets for the commercial wine yeast strains NT 116, LALVIN QA 23, 4F9 and Zymaflore VL1 and a guide to the characteristics and application of different yeast strains from Anchor wine yeast Addendum H: Addendum I: Sorting task questionnaire Consumer study questionnaire
9 Chapter 1 Introduction 1
10 CHAPTER 1: Introduction Chenin blanc is thought to have the potential of establishing South Africa (SA) as a first-class producer of outstanding white wines, despite the fact that in the past this cultivar was not considered to produce good quality South African wines (Clarke, 2007; Howe, 2011). This has, however, changed and Chenin blanc has since gained popularity for its good quality and excellent value which resulted in the recognition of South African Chenin blanc wines by local, as well as international wine experts (Peridot Communications, 2010; Splash PR & Media Consultants, 2009). SA is more than capable of producing Chenin blanc wines with the potential of being on par with other already established South African white wine cultivars, but also global premium cultivar wines such as the New Zealand Sauvignon blanc (Clarke, 2009) or the Argentinean Malbec (LaVilla, 2010). Chenin blanc has the potential of being endorsed by the global wine community as a signature wine, i.e. wine produced from a unique cultivar or a wine with distinctive characteristics. Perhaps South African Chenin blanc does not possess the distinctive characteristics which helped New Zealand establish their Marlborough Sauvignon blanc in the global market, but it does have other characteristics which can be considered as strengths. These characteristics include the versatility of styles, the cultivar s flexibility to adapt to the South African terroir, quality at all price points, the abundance of old vines and the experience of the South African winemakers in making significant Chenin blanc wines (C. Van Casteren, Chenin blanc Association [CBA] Conference, Stellenbosch, SA, 2011, personal communication). To make advances in the pursuit of putting South African Chenin blanc on the international wine map, many strategies can be followed. These strategies involve the management and restriction of vine vigour and placing the focus on factors known to result in the production of wines of improved quality, aging potential and complexity. Amongst others, these factors also include the utilisation of old vines, as well as vineyards trained to bush vines (Howe, 2011). In 2008, SAWIS (South African Wine Industry Information and Systems) reported that more than 40% of Chenin blanc vineyards were older than 20 years of age (SAWIS, 2008). Even though no exact age is specified for a vineyard to be considered old, vines start losing vigour and result in reduced yields after the age of 20 (Robinson, 1999; Skelton, 2007). Since the bush vine training system was mostly employed in earlier years (Robinson, 1999), it can be assumed the majority of these old vineyards consist of bush vines. A research project was launched in January 2010 in collaboration with relevant departments and institutes at Stellenbosch University, SA. The reason for this collaboration was to advance research on South African Chenin blanc using a market-driven approach. To fully understand wine quality with the aim of controlling and improving it, knowledge about both the chemical and sensory characteristics of wine is crucial (Francis & Newton, 2005). Research on South African Chenin blanc wines, especially those Chenin blanc wines with the potential of being signature wines, is extremely important. Not only is information about the intrinsic attributes of Chenin blanc wine vitally important, but knowledge about consumers is also necessary to ensure that a fitting message is conveyed when communicating with potential consumers on a product. To achieve this, consumer attitudes and opinions need to be understood (Mueller & Szolnoki, 2010), as well as how consumers perceive and apply both extrinsic (non-sensory) and intrinsic (sensory) product attributes 2
11 when choosing or purchasing wines (Lange et al., 1999, 2000; Mueller et al., 2010; Priilaid, 2006; Siegrist & Cousin, 2009). The global wine industry has transformed in such a way that the forces of market pull and technology push have become fundamental. This implies that wine quality cannot only be described in terms of sensory and chemical characteristics, but also needs to be described in terms of consumer satisfaction (Blair et al., 2005). The challenge for South African Chenin blanc will definitely be to deliver wines that meet all these expectations at a competitive price. Even though the versatility of the styles is regarded as an asset for Chenin blanc, it is evident that the versatility can also be considered a weakness as it can be confusing to the consumer (Brower, 2009). Brower (2009) suggested that communication via the back label could be employed more successfully, whereas Goode (2011) thought that consumer education on Chenin blanc styles should enjoy more attention. It could be argued that if a more defined set of terms existed for the many different styles of Chenin blanc, winemakers could start using a language that is better understood by the wine drinking consumer. This research project focuses on South African Chenin blanc white wines produced solely from bush vines and old bush vines. The main objective of this research project is to determine the chemical, sensory and consumer profile of South African Chenin blanc wines produced from bush vines. The specific aims are to establish a comprehensive chemical and sensory profile of a selection of Chenin blanc wines produced from bush vines using descriptive sensory analysis (DSA) and analytical chemical techniques. Apart from the DSA technique, another sensory method, the sorting task, will be used to categorise the wines according to their sensory similarities and to ascertain whether these two sensory methods are comparable for obtaining the sensory profile of this group of wines, but also to determine whether both methodologies can be used to categorise or segment wines into viable commercial entities. Consumer analysis will also be performed to establish how a selected group of consumers conceptually perceive Chenin blanc wines produced from bush vines and old bush vines. During this analysis, consumer liking will be determined in a blind tasting, followed by the evaluation of the influence of label cues, and specifically the concepts of bush vines and old bush vines, on consumer liking. A flow diagram depicting the research tasks are given in Fig. 1. 3
12 Chemical Analyses Sensory Analysis Consumer Analysis Establish a chemical profile Conventional descriptive sensory analysis Sorting task Blind and informed preference analysis Establish sensory profile using trained panellists Establish product profile with industry experts Establish consumer liking & perceptions Identify on bush vine Chenin blanc wines 1) Wine quality prediction factors; 2) Segmentation of wine quality; 3) Drivers of consumer liking; 4) Consumer attitudes Figure 1 Flow diagram depicting the tasks to be completed in order to establish the chemical, sensory and consumer profiles of bush vine Chenin blanc wines. 4
13 References Blair, R., Francis, M. Y. & Pretorius, I. (2005). Advances in wine science. Australia: Australian Wine Institute. Brower, J. (2009). Chenin are we confusing the consumer? WWW document. URL June Clarke, O. (2007). Chenin blanc. In: Oz Clarke s Grapes and Wines: The definitive guide to the world s great grapes and the wines they make. Pp London: Webster s International Publishers. Clarke, O. (2009). Chenin blanc. In: Oz Clarke s Grapes and Wines: The definitive guide to the world s great grapes and the wines they make. P London: Webster s International Publishers. Francis, I.L. & Newton, J.L. (2005). Determining wine aroma from compositional data. Australian Journal of Grape and Wine Research, 11, Goode, J. (2011). Chenin blanc. WWW document. URL June Howe, G. (2011). Talking to the Chenin Kings. WWW document. URL June Lange, C., Issanchou, S. & Combris, P. (2000). Expected versus experienced quality: Trade-off with price. Food Quality and Preference, 11, Lange, C., Rousseau, F. & Issanchou, S. (1999). Expectation, liking and purchase behaviour under economical constraint. Food Quality and Preference, 10, LaVilla, J. (2010). The wine, beer & spirits handbook: A guide to styles and services. New Jersey: John Wiley & Sons, Inc. Mueller, S. & Szolnoki, G. (2010). The relative influence of packaging, labelling, branding and sensory attributes on liking and purchase intent: Consumer differ in their responsiveness. Food Quality and Preference, 21, Mueller, S., Lockshin, L., Saltman, Y. & Blanford, J. (2010). Message on a bottle: The relative influence of wine back label information on wine choice. Food Quality and Preference, 21, Peridot Communications (2010). Chenin s Cinderalla story. WWW document. URL June Priilaid, D.A. (2006). Wine s placebo effect: How the extrinsic cues of visual assessments mask the intrinsic quality of South African red wine. International Journal of Wine Marketing, 18, Robinson, J. (1999). The Oxford companion to wine (2 nd ed.). Pp. 118, , , 747, New York: Oxford University Press Inc. Siegrist, M. & Cousin, M. E. (2009). Expectations influence sensory experience in a wine tasting. Appetite, 52, Skelton, S. (2007). Viticulture: An introduction to commercial grape growing for wine production. Pp. 68, 87. London: Lulu. South African Wine Industry Information and Systems (SAWIS) (2008). Statistics of Wine-grape Vines. WWW document. URL April Splash PR & Media Consultants (2009). South African Chenin is terrific value. WWW document. URL June
14 Chapter 2 Literature review 6
15 CHAPTER 2: Contents 1. Introduction Chenin blanc wines of the world France California, United States of America (USA) Australia and New Zealand Chenin blanc in South Africa Chenin blanc wine styles Bush vines Old vines Chenin blanc table wine characteristics Flavour Appearance Body Sensory techniques used to investigate wine quality Sorting and descriptive sensory analysis as techniques in quantifying sensory quality Sorting as method of analysis of sensory wine quality using multidimensional scaling (MDS), DISTATIS and correspondence analysis (CA) Descriptive sensory analysis as test technique to establish sensory quality of wines Comparison of sorting and descriptive sensory analysis in the analysis of wine quality Relationship between consumer liking of wines, wine-related cues and consumer opinions Conclusions References
16 1. Introduction Chenin blanc is currently the most planted grape variety in South Africa (SA) and covers approximately 18.2% of the total area planted with wine grapes in SA (South African Wine Industry Information and Systems [SAWIS], 2011). In 2008 alone, 277,827 tons of Chenin blanc grapes were used to produce table wine. This constitutes 19.5% of the total wine grapes crushed to produce wine in SA and only one other cultivar, Colombar, matches this quantity (SAWIS, 2009). The Chenin blanc grape variety is extremely versatile and is used to produce dry, medium-dry, semi-sweet, noble late harvest and sparkling wines (Marais, 2003; McCarthy & Ewing-Mulligan, 2006) ranging from good quality table wines to lower priced bulk wines (Gibson, 2010). Noble late harvest wines are Chenin blanc wines produced from noble rot infected grapes. The rot is caused by the Botrytis cinerea mould which dehydrates the berries leading to concentration of sugars and desirable changes in the aroma profile of the resulting wines (Clarke & Bakker, 2004). It is believed that Chenin blanc has the potential to affirm itself as South Africa s reference wine and establish SA as a world-class white wine producer (C. Van Casteren, CBA conference, Stellenbosch, South Africa, 2011, personal communication). However, this can only be achieved if more attention is placed on those factors influencing Chenin blanc quality. To ensure the production of good quality wines with enhanced flavour complexity and aging potential, vine vigour must firstly be controlled. Vine vigour refers to the growth rate or the rapid growth of any part of the vine (Winkler et al., 1974). Reduced vigour as a result of old vine age or training system has been proven to lead to the production of wines with improved quality (Goode, 2005; LaVilla, 2010; Reynolds & Vanden Heuvel, 2009). Vine training entails the physical manipulation of a vine s structure with the purpose to achieve vine health, best possible fruit quality and yield, as well as economic vineyard management (Jackson, 2008; Reynolds & Vanden Heuvel, 2009). Bush vine training is one such system that ensures low vine vigour and reportedly, improved wine quality. The term bush vine is used to describe a certain style of training without the use of a trellis system (Goode, 2005; Reynolds & Vanden Heuvel, 2009; Robinson, 1999). It is thus evident that Chenin blanc wines produced from bush vines and old vines (Howe, 2011) are the most likely to establish themselves as a world-class wine with the same star-status as New Zealand Sauvignon blanc and French white Burgundy (C. Van Casteren, CBA conference, Stellenbosch, South Africa, 2011, personal communication). The objective of this literature review is to investigate the current status of Chenin blanc wines in SA. Wine and vine characteristics influencing wine quality will also be discussed, as well as methods to investigate wine quality. This literature review will thus influence the type of South African Chenin blanc wines to be sourced and how these wines will be analysed in order to establish the chemical, sensory and consumer characteristics of South African Chenin blanc wines produced from bush vines. 8
17 2. Chenin blanc wines of the world The Chenin blanc cultivar reportedly originated in the Loire Valley, France, and has been cultivated there for over a thousand years (Clarke, 2007; Gibson, 2010; Jackson, 2008). Reportedly, the first mention of this cultivar was in the year 845 at the Glanfeuil Abbey on the banks of the Loire River (Clarke, 2007). The cultivar name apparently originated from the name of a small mountain situated in the Loire Valley, Mont Chenin (Gibson, 2010). Chenin blanc is also known in the Loire Valley as Pineau de la Loire (Clarke, 2009; Drapeau & Vanasse, 1998; Kerridge & Antcliff, 1999). According to the world-wide distribution of Chenin blanc, as depicted in Fig. 1, SA has the largest area planted to Chenin blanc vineyards in the world which far surpasses the quantity of vineyards in Chenin blanc s birthplace, France (Clarke, 2007; Gibson, 2010). Figure 1 Global distribution of Chenin blanc shown as area planted (in hectares ) as Chenin blanc vineyards (Clarke, 2007). Prominent stylistic differences exist among Chenin blanc wines from different parts of the world. This is mainly because Chenin blanc is significantly influenced by weather which also causes Chenin blanc to show stylistic differences caused by different climatic regions existing within a single country (Clarke, 2007). General information on the international Chenin blanc producing countries, i.e. France, United States of America, Australia and New Zealand, will be discussed in this section. A more detailed review of South African Chenin blanc follows in Section 3. 9
. In the Loire Valley (Fig.")
18 2.1. France In France, the birthplace of Chenin blanc, different appellations produce different styles of wine. French law requires that the Appellation of Origin should appear on the wine label, with the proviso that the wine meets the requirements of that esteemed class (Alig, 2010). In the Loire Valley (Fig. 2), the climate, which ranges significantly between temperate-maritime to cool-continental (Gibson, 2010), mainly determines whether a sweet, dry, or in-between style of Chenin blanc will be produced (Clarke, 2007). In the Anjou and Saumur regions, botrytis infection is an annual occurrence and sweet noble late harvest wines are abundant. These wines express typical botrytis flavours of peach, honey, marzipan and barley sugar (Clarke, 2007; May, 2004). Figure 2 Loire Valley wine regions (Anon., 2011b). Vouvray, Touraine and Montlouis (Fig. 2) are also considered famous Chenin blanc producing areas in France. Here, botrytis infection does not occur as regularly as in the Anjou and Saumur regions, but still a sweet style of Chenin blanc can be produced. Overripe and shrivelled berries, known as Passerillé grapes in French, are used to produce a sweet wine with greengage, minerals and apple flavours (Clarke, 2007). Good examples of dry style Chenin blanc is produced in the Savennières region (Fig. 2), whereas the warmth of the vintage determines whether the Vouvray region produces sweet or dry Chenin blanc (Gibson, 2010). The dry Chenin blanc wines from Savennières and Vouvray may need some time for the high acidity to settle during bottle aging to reveal the true character of the wine (Fisher, 2006). Sweet wines are the speciality of the districts of Coteaux du Layon, Bonnezeauz and Quarts de Chaume which are situated further south (DuBose & Spingarn, 2005). 10
19 The natural acidity of Chenin blanc makes it ideal for producing excellent sparkling wines (Hornsey, 2007; Kerridge & Antcliff, 1999; May, 2004). The Loire Valley produces sparkling wines from Chenin blanc labelled Crémant de Loire (Alig, 2010) and some semi-sparkling wines labelled Vouvray Mousseux (May, 2004). These sparkling wines are often thought of being less complex than true Champagne, but still offer an esteemed product (May, 2008) California, United States of America (USA) After World War II, wineries on the North Coast of California acquired vines from the University of California at Davis with the intention to produce premium table wines. Since then, the total area planted with Chenin blanc vines increased rapidly until the 1980 s, but has thereafter decreased considerably (Christensen, 2003; Sullivan, 1998). In the early 1970 s, Chenin blanc was the best-selling white wine in the USA (Zraly, 2005). Nowadays, most Chenin blanc plantings are situated in the hot Central Valley where it is cultivated to be used in low-priced blends (so-called jug wines ) or for brandy-making (Clarke, 2007; May, 2004). Generally, Chenin blanc is cultivated in California to yield 10 tons per acre, this is in contrast with a yield of 1 to 3 tons per acre which is normally associated with premium quality wines (Boehmer, 2009) Australia and New Zealand Very few large, established Chenin blanc vineyards exist in Australia. Here, Chenin blanc is characterised by soft fruit-salad flavours which have been described as being tutti-frutty (Clarke, 2007). In Australia, Chenin blanc was previously known by a number of names and for several years has been misguidedly known in Western Australia as Semillon and in South Australia as Sherry or Albillo. It was also found in the Victoria region that a large percentage of a vineyard that was thought to be Chardonnay was actually a Chenin blanc vineyard (Kerridge & Gackle, 2005). The majority of the Chenin blanc wines produced in New Zealand are used in low-cost blends, even though the New Zealand climate is very suitable for growing good quality Chenin blanc. There are, however, some Chenin blanc wines showing excellent balance and complexity. The reason for New Zealand not encouraging the production of more good quality Chenin blanc, is because Sauvignon blanc and Chardonnay already generate an excellent income (Clarke, 2007). 11
.")
20 3. Chenin blanc in South Africa Chenin blanc reportedly came to SA in 1652 when Jan van Riebeeck settled in the Cape of Good Hope (Clarke, 2007; Fallis, 2004; May, 2008). The high yields and good acidity of Chenin blanc in the hot South African climate made it especially popular with the settlers (Clarke, 2007). Currently, Chenin blanc is the most planted grape variety in SA which makes SA the country with the most Chenin blanc vineyards in the world (Clarke, 2007). The areas planted with Chenin blanc has, however, decreased considerably (SAWIS, 2009; SAWIS, 2011). Twenty-seven percent of SA s vineyards were planted with Chenin blanc in 1999, however, in 2011 Chenin blanc vineyards decreased to cover only 18.2% of SA s wine producing vineyards (SAWIS, 2009; SAWIS, 2011). Fig. 3 shows the distribution of white wine varieties regarding the surface planted with the respective cultivars for the period 2001 to It is clear that some cultivars have decreased, including Chenin blanc, while some, like Chardonnay and Sauvignon blanc increased considerably since 2001 (SAWIS, 2011). In 2008, statistics also showed that only 521 hectares of Chenin blanc were newly planted, while 1023 hectares were uprooted (SAWIS, 2008). In a recent study where South African Chenin blanc producers were interviewed, it was found that some producers believe that the low price of Chenin blanc will lead to more vineyards being uprooted (Loubser, 2008). On the other hand, other SA Chenin blanc producers are starting to plant and acquire more Chenin blanc vineyards, because they are of the opinion that the international wine market is flooded with popular grape varieties, like Cabernet Sauvignon and Chardonnay, and that an interest will soon arise for more unique grape varieties (Loubser, 2008). Figure 3 Distribution of area planted to white wine cultivars in SA. Each bar represents the hectares planted as the certain cultivar for one year for the period of 2001 to 2011 (SAWIS, 2011). 12
21 Chenin blanc grapes are used in SA to produce many styles of wine, including dry wines, sparkling wines and dessert wines (Marais, 2003). Historically, most of the Chenin blanc was distilled for making brandy or other spirits or used for making lower priced, fruitless, pale and bland wines for the export market (Clarke, 2007). This led to a very negative image of South African Chenin blanc wines (Clarke, 2007). This picture has, however, changed significantly in past years as South African Chenin blanc has become a popular topic in local and international news where it is lauded by wine experts and journalists in the challenging markets of the United Kingdom (UK) and USA (Peridot Communications, 2010). In recent years, South African Chenin blanc has caught the attention of the international market because it offers both quality and value. This characteristic is particularly valuable in times where consumers need to budget in a difficult economy (Splash PR & Media Consultants, 2009). In a popular publication, Chenin blanc was described as being SA s great white hope and it was suggested that focus should be placed on the two quality factors responsible for creating Chenin blanc wines with improved overall quality, flavour complexity and aging potential. The two quality factors mentioned are old vines and bush vines (Howe, 2011). International investors have also seen the potential of South African Chenin blanc produced from old bush vines and have started investing in South African brands, vineyards and wineries. One such an example is that of Charles Banks, an investor from California, USA, who has a history in wine investment and recently founded a small investment company focussing on wine estates. Banks sees the South African Chenin blanc industry as a viable business opportunity and believes that SA is capable of producing much better Chenin blanc at great value, which is the ideal prospect for an investor (McCoy, 2011). It is thus very important that the Chenin blanc wines of SA should be studied at a chemical, sensory and consumer level as to help the wine industry understand Chenin blanc wines better and to facilitate the successful marketing of South African Chenin blanc wines to local and international markets. Unfortunately, a limited number of scientific publications are available on the sensory quality and chemical characteristics of Chenin blanc table wines. The publications indicated in Table 1 analysed the sensory or chemical characteristics of Chenin blanc in some manner, but none have established the full sensory or chemical profile of South African Chenin blanc wines. It is also apparent that the majority of these publications have been published prior to It is evident that much more research in the field of South African Chenin blanc is needed, especially regarding its chemical and sensory nature and since old bush vine Chenin blanc wines have been identified as having the best possible chance of establishing South African Chenin blanc wines in the international market, it is of utmost importance that these wines be profiled as a unit separate to the full Chenin blanc wine class. Another field that needs much attention is the consumer aspects involved with the marketing and selling of Chenin blanc wines. Consumer perception, preference and their hedonic response to Chenin blanc wines are all valuable characteristics that needs to be investigated in order to successfully market Chenin blanc wines. In this section, the different Chenin blanc styles will be discussed, as well as how the factors bush vine and old vine age influence Chenin blanc wine quality. 13
22 Table 1 Published research done on Chenin blanc. Authors Journal Aim of research Chemical methods used Augustyn S. Afr. J. Enol. Determine the volatile aroma Gas-chromatography; & Rapp Vitic. components of Chenin blanc coupled gas (1982) grapes and monitor the chromatography-mass concentration changes during spectroscopy berry maturation Du S. Afr. J. Enol. Determine the importance of None Plessis & Vitic. sulphur compounds or Augustyn mercaptans on the guava aroma (1981) of Chenin blanc Ellis et al. S. Afr. J. Enol. Study the interactions between Standard wine and must (1985) Vitic. maturity indices and quality and composition analyses composition of Chenin blanc wines Jolly et al. S. Afr. J. Enol. Investigate the effect of different Standard wine and must (2003) Vitic. fermentation parameters on the composition analyse growth of yeasts and the effect thereof on Chenin blanc wines Rous & Am. J. Enol. Determine the phenolic extraction Wine analyses Alderson, Vitic. curves for barrel aged Chenin techniques described by 1983 blanc Amerine & Ough (1974); non-flavonoid phenol analysis technique described by Kramling & Singleton (1970) Van S. Afr. J. Enol. Investigate the volatiles causing Gas-chromatography Rooyen et Vitic. the guava-like flavour in Chenin with dual flame ionisation al. (1982) blanc wines detectors Volschenk S. Afr. J. Enol. Investigate the effect of three Standard wine & Hunter Vitic. trellising systems on the composition analyses (2001) composition and sensory quality of Chenin blanc wine Reynolds Am. J. Enol. Influence of 10 different yeast High-performance liquid et al. Vitic. strains on the sensory and chromatography (2001) chemical attributes of Chenin blanc wines Vaadia & Am. J. Enol. Effect of irrigation on the Standard wine Kasimatis Vitic. composition and sensory quality composition analyses (1961) of Chenin blanc wines Sensory methods used None Triangle and paired difference tests A sensory panel was used to assign scores to wines for overall quality and aroma quality Descriptive sensory analysis Triangle test and paired test Sensory panel was used to assign intensity score to guava-like flavour only Descriptive sensory analysis Paired comparison tests A sensory panel was used to assign quality scores to wines 14
23 3.1. Chenin blanc wine styles The Chenin blanc grape variety is extremely versatile in its ability to produce many different styles of wine (Marais, 2003; Robinson, 2004). In SA, six styles of Chenin blanc are currently recognised (Table 2) (Chenin blanc Association [CBA], n.d.). Not only is this evidence of the diversity of Chenin blanc wines in SA, but also proof of the versatility of the Chenin blanc cultivar. Table 2 Recognised styles of Chenin blanc wines of SA a. Style Specifications Fresh & Fruity Less than 9 g/l residual sugar Rich & Ripe unwooded Less than 9 g/l residual sugar Rich & Ripe wooded Less than 9 g/l residual sugar Rich & Ripe slightly sweet Between 9 and 30 g/l residual sugar Sweet More than 30 g/l residual sugar Sparkling Tank fermented or Cap Classique a Chenin blanc Association (CBA, n.d.) The Fresh and Fruity style of Chenin blanc was described by two winemakers interviewed by Loubser (2008) as being light and fresh and intended for drinking soon after bottling. These wines are reportedly produced from grapes which were harvested earlier and from inland, irrigated production areas. Loubser (2008) also reported that Fresh and Fruity style Chenin blanc wines are usually produced using cultured yeast strains and cold fermentation. Rich and Ripe style Chenin blanc was described as being harvested later than the grapes used for the production of Fresh and Fruity style Chenin blanc. These wines also benefit from the inclusion of some botrytis infected grapes. Skin contact, maturation on its lees, Malolactic fermentation (MLF) and oak contact can also be considered in the production of Rich and Ripe style Chenin blanc wines (Loubser, 2008). According to Brower (2009), the versatility of Chenin blanc can be confusing to the consumer, which causes consumers to be uncertain of what to expect when purchasing a bottle of Chenin blanc. It is thought that the back label could be used more effectively to communicate and inform (Brower, 2009) and that consumer education about the various styles of Chenin blanc is also extremely important (Goode, 2011a). It is thus necessary to learn how consumers respond to bush vine Chenin blanc wines and how education will influence their degree of liking Bush vines The term bush vine is used to describe a training system which trains a grape vine to a short trunk with numerous two-node bearing units without a trellis system (Goode, 2005; Reynolds & Vanden Heuvel, 2009; 15
. Figure 5 Chenin blanc bush vine vineyard in the Swartland, SA (Goode, 2011b).")
24 Robinson, 1999) as depicted in Fig. 4. This training system is also described as head or goblet training (Robinson, 1999). Figure 4 Illustration of the bush vine training system (Reynolds & Vanden Heuvel, 2009). Figure 5 Chenin blanc bush vine vineyard in the Swartland, SA (Goode, 2011b). Bush vine training was considered fashionable some time ago before intense pruning and trellising was implemented as farming practices. This is why the majority of bush vines can be found in older vineyards. Only by the 1960s did farmers start using tractors for chemical weed and pest control among other uses, which required that vineyard rows should be planted further apart (Robinson, 1999). The bush vine training system can typically be found in dry, warm climates and for low vigour vineyards (Goode, 2005). Such vineyards are characteristically found in the Swartland region (Fig. 5). According to a survey done in 2008, more than 40% of South African Chenin blanc vineyards are older than 20 years of age. Fig. 6 illustrates the age distribution for Chenin blanc vineyards in SA for the period from 1998 to 2008 (SAWIS, 2008). Since bush vine training was fashionable in earlier years (Robinson, 1999), it can be assumed that the majority of these older vineyards (Fig. 6) consist of bush vines. 16
, a number of")
25 Figure 6 Age distribution of Chenin blanc vineyards in SA. Each bar represents the percentage vineyards at the given age for one year for the period of 1998 to 2008 (SAWIS, 2008). In a research project on the effect of different trellising systems on the micro-climate, grape composition and wine quality of Chenin blanc by Van Zyl and Van Huyssteen (1980b), a number of characteristics of the bush vine training system were determined. It was found that the bush vines offered the least resistance to air flow and had the highest bunch temperatures when compared to the lengthened Perold and slanting trellis training systems. This is because the bush vine training system does not provide any protection from the wind or sun and bush vines are also more exposed to reflected heat from the soil surface (Van Zyl & Van Huyssteen, 1980b). The humidity was also found to be higher in bush vines than in any other trellising system evaluated and this increased the probability of botrytis rot infection (Matthee, 1970; Van Zyl & Van Huyssteen, 1980b; Winkler et al., 1975). It was also found that the bush vines yielded smaller berry size (Van Zyl & Van Huyssteen, 1980b) which promotes better wine quality (Marais et al., 2005). The bush vine grapes presented the highest ph levels and lower levels of total titratable acidity and total soluble solids (Van Zyl & Van Huyssteen, 1980a). When the sensory quality of the wines made from the different trellising system was evaluated, it was found that the wines made from the bush vine Chenin blanc grapes was considerably better than the other wines. No single sensory attribute could, however, be identified to explain this phenomenon (Van Zyl & Van Huyssteen, 1980b). 17
26 3.3. Old vines Vine age is commonly known to influence wine quality with older vines producing wines of better overall quality (Robinson, 1999; Skelton, 2007) and improved flavour intensity (Clarke, 2001). In France, this concept of older vines, vieilles vignes, is used as a marketing tool and included on wine labels with the anticipation that potential buyers are familiar with the high quality that is associated with old vine age (Robinson, 1999). The increase in wine quality can be explained in terms of the reduced vine vigour (Skelton, 2007) as reduced vigour results in improved exposure of the leaves and berries to sunlight (Robinson, 1999). The enhanced exposure to sunlight leads to improved photosynthesis which consequently influences fruit composition (Reynolds & Vanden Heuvel, 2009). This results in smaller berries with more concentrated aroma and flavour compounds and the potential of improved wine aroma and flavour (Clarke, 2001). Although consensus has not yet been reached regarding the age at which a vineyard can be classified as an old vineyard, it is known that the grapevine starts losing vigour at the age of 20 years (Robinson, 1999; Skelton, 2007). It is at this stage in a vineyard s life span that the producer needs to decide what he values most: increased wine quality or high yields (Clarke, 2001). Even though it is generally believed that vineyards should be uprooted at the age of 20 for economic reasons (Clarke, 2001; Robinson, 1999; SAWIS, 2008) the majority of Chenin blanc vineyards in SA are older than 20 (Fig. 6). In 2011, Anthonij Rupert Wines (Anon., 2011a) took inventory of the old vines of SA. The age of each vineyard and the winemaking region in which it is situated was used to generate a scatter-plot (Fig. 7) illustrating the number of old Chenin blanc vineyards per winemaking region and the average age of the Chenin blanc vineyards in that particular winemaking region. According to Fig. 7, the oldest known Chenin blanc vineyard is situated in the Piketberg region and is 101 years old, whereas, the most old vine Chenin blanc vineyards are situated in the Paarl and Swartland regions. The Paarl and Swartland regions collectively have 13 old vine Chenin blanc vineyards with an average vineyard age of 47 (Anon., 2011a). 18
27 Age of vineyard Number of vineyards Citrusdal Darling Lutzville Paarl & Swartland Piketberg Robertson Stellenbosch Figure 7 Scatter-plot illustrating the number of old Chenin blanc vineyards and the average age of those old Chenin blanc vineyards per winemaking region (Anon., 2011a). The CBA of SA is currently identifying old Chenin blanc vineyards with the purpose of raising consciousness about the potential of these vineyards to produce outstanding wines (CBA, n.d.). Since these vineyards have the potential to produce wines capable of establishing South African Chenin blanc wines as one of the world s greatest white wines (Howe, 2011), it is of utmost importance that these old vineyards be preserved (CBA, n.d.). 4. Chenin blanc table wine characteristics In this section, the factors influencing the sensory characteristics of Chenin blanc wine will be discussed. The sensory characteristics to be discussed will comprise of flavour (which includes taste and aroma), body and appearance Flavour Flavour can be described as the entirety of the sensations perceived by the mouth (Francis & Newton, 2005). It is known that flavour is multimodal and involves a wide range of stimuli, including taste, aroma and mouthfeel (Keast et al., 2004). Wine flavour is thus the result of both volatile and non-volatile compounds present in a wine (Francis & Newton, 2005). Since wine taste only consist of a few attributes namely sweet, sour and bitter, wine flavour is largely derived from the 600 to 800 volatile aroma compounds present in wine (Keast et al., 2004; Vilanova et al., 2010). Since the olfactory system is such a complex chemoreceptor 19
28 system, large variability in the qualitative response can be brought about by these aroma compounds (Ferreira et al., 2008). The taste sensations sweetness, sourness and bitterness, are caused by the non-volatile compounds. These compounds should be present at high concentrations (10-3 to 10 1 g/l) to have an impact on the taste of a food or beverage (Francis & Newton, 2005). Volatile compounds, however, can influence wine flavour at much lower concentrations ( g/l). These volatile compounds impact the human sensory system both orthonasally and retronasally (Francis & Newton, 2005). A key analysis technique in the investigation of the volatile and non-volatile composition of wine aroma is gas chromatography (Gil et al., 2006; Vilanova et al., 2010). Gas chromatography (GC) coupled with a flame ionisation detector (FID) allows the non-selective quantification of volatile compounds in complex samples and is known to be fairly accurate (Vilanova et al., 2010). One limitation for GC-FID is the need for reference standards in the identification and quantification of the different volatile compounds in wine (Gil et al., 2006). The volatile aroma compounds responsible for wine aroma can be grouped according to the origin or source of the concerned aroma compounds (Vilanova et al., 2010). The first group is varietal aroma which is specific to a grape cultivar. Varietal aroma is caused by a specific combination of odour-active compounds and is present in the grape berry in a volatile or non-volatile form (Fisher, 2007). Volatile aroma compounds can also be formed from yeast and bacterial metabolism during alcoholic and MLF and is known as fermentative aroma, which forms the second group. The third group of aroma compounds develop during storage and maturation. These aroma compounds can be extracted from wood or can originate from the chemical reactions taking place during storage and is known as post-fermentative aroma (Fisher, 2007; Francis & Newton, 2005; Vilanova et al., 2010). Neutral wine varieties, like Chenin blanc, do not possess impact odourants responsible for contributing to the distinct varietal aroma of the other grape varieties (Fisher, 2007). Impact odourants accountable for the varietal aroma of white wines include, sulphur compounds with a thiol function and methoxipyrazines for Sauvignon blanc (Darriet et al., 1995; Marais, 1994), C 13 -norisoprenoids for Weisser Riesling (Marais et al., 1992) and monoterpenes for Muscat varieties (Marais, 1983) and Gewürtztraminer (Guth, 1997). Neutral cultivar grapes, however, have a neutral flavour which causes these wines to have no distinct varietal flavour or aroma (Augustyn & Rapp, 1982; Clarke & Bakker, 2004; Fisher, 2007; Jackson, 2008). Since Chenin blanc is regarded a neutral variety, focus moves towards those aroma compounds formed during fermentation (Fisher, 2007). Aroma attributes used to describe Chenin blanc wines in literature are summarised in Table 3. 20
29 Table 3 Chenin blanc wine aroma attributes found in literature. Aroma attributes Authors, year of publication Floral; honey Alsop, 2010 Fruity Amerine & Joslyn, 1970 Lanolin Aspler, 1998 Pear; honey; melon Beckett, 1999 Fruity Blackburn & Levine, 2003 Fruity Christensen, 2003 Guava Clarke & Bakker, 2004 Floral; mineral Colman, 2008 Floral; lemon; melon Drapeau & Vanasse, 1998 Grassy; herbal; must; lanolin Fallis, 2004 Guava Fisher, 2007 Honey; nuts; peach; wet wool; mineral tones Grainger, 2009 Guava; camellia blossom Jackson, 2008 Floral; honey; peaches; apricots Kerridge & Gackle, 2005 Sweet; herbal or grassy; melon; pear; quince; green plum; wet wool; lanolin; honey; apricots LaVilla, 2010 Honey; melon May, 2008 Floral; honey McCarthy et al., 2009 Brioche; green apples; honey Ochterbeck, 2010 Honey; citrus; flowers Patterson, 2011 Fruity Salmi, 2006 Floral; green apple St. Pierre & Armstrong, 2003 During fermentation, sugars are metabolised by wine yeasts to yield an assortment of volatile compounds that add to the sensory profile of a wine. The volatile aroma compounds formed are influenced by the chemical and physical nature and the nutrient contents of the must, the strain of yeast used, as well as the fermentation environment (Ugliano & Henschke, 2009). The majority of these factors can be determined and controlled which leaves the decision of which wine style to make in the hands of the winemaker (LaVilla, 2010). Key compounds formed during fermentation include volatile fatty acids, esters, carbonyls and higher alcohols (Ugliano & Henschke, 2009). The significance of each compound group formed during fermentation will be discussed briefly. Volatile fatty acids Wine consists of a combination of fatty acids composed of short chain (C 2 -C 4 ), medium chain (C 6 -C 10 ), long chain (C 12 -C 18 ) and branched-chain fatty acids (Ugliano & Henschke, 2009). Increased fatty acid chain length leads to decreased volatility and a resultant decrease in aroma. The aroma of volatile fatty acids will also change from sour to rancid and cheese with increasing chain length (Francis & Newton, 2005). Acetic acid can be considered the most important volatile fatty acid present in a wine as it represents more than 90% of a wine s volatile acidity and plays a vital role in the sensory quality of a wine. Acetic acid concentration varies depending on wine type, but dry white wines characteristically have lower concentrations whereas sweet noble late harvest wines lean towards having some the highest acetic acid 21
30 concentrations. At threshold concentrations, acetic acid can impart warmth to the palate while higher concentrations will provide a sourness or sharpness to the palate. At very high concentrations, acetic acid is likely to give wine a vinegary aroma (Ugliano & Henschke, 2009). Other volatile fatty acids shown to have an impact on the aroma quality of white wines are hexanoic acid, octanoic acid and decanoic acid (Smyth et al., 2005). Esters Fermentation-derived esters are mainly responsible for the fruitiness of a wine (Ugliano & Henschke, 2009). Even in aged wines, where a large segment of the esters will be hydrolysed, some will still be present in concentrations exceeding its odour threshold and contributing to the fruity character of a wine (Escudero et al., 2007; Moio et al., 2004). The two main fermentation-derived ester groups contributing to wine fruitiness are acetate esters and ethyl fatty acid esters. Mixtures of esters, as found in wine, have a synergistic effect which determines the sensory characteristic contributed by those esters (Ugliano & Henschke, 2009). Nevertheless, it has been shown that acetate esters have a larger impact on the perceived aroma of a wine than the ethyl fatty acid esters (Van der Merwe & Van Wyk, 1981). Carbonyl compounds During sugar metabolism, yeasts produce an array of carbonyl compounds including ketones, keto acids and aldehydes. Quantitatively, acetaldehyde is the most significant saturated aldehyde present in wine (Ugliano & Henschke, 2009). In dry white wine, concentrations can range from 10 to 75 mg/l where it will impart a nutty or bruised apple quality (Schreier, 1979). High concentrations of acetaldehyde in dry wines are commonly linked to off-flavours caused by oxidation (Ugliano & Henschke, 2009). Other higher saturated aldehydes (C 3 -C 9 ) can add grassy, green, fruity, pungent or fatty flavours to a wine (Ebeler & Spaulding, 1998). The most important ketone formed by yeasts during fermentation is diacetyl. This compound is generally typified by a toasty, nutty or buttery aroma (Martineau et al., 1995). Even though this compound can be formed by yeasts during alcoholic fermentation, MLF is regarded as a more important source of diacetyl (Ugliano & Henschke, 2009). Higher alcohols Higher alcohols, or fusel alcohols, constitute the largest fraction of fermentationderived volatile compounds (Ugliano & Henschke, 2009). These higher alcohols can have a positive or negative effect on wine quality depending on the concentration present. At concentrations below 300 mg/l, higher alcohols will add to the complexity of a wine, whereas higher concentrations will be undesirable (Rapp & Versini, 1995). At high concentrations, higher alcohols all have unpleasant flavour and aroma characteristics (McKay et al., 2011) Appearance The appearance of a wine is affected by grape maturity at harvest, skin contact duration, wood contact and wine age. Depending on the duration of skin contact, white wines made from immature grapes are nearly colourless and grapes harvested at a higher maturity index will have an enhanced yellow tinge. Barrel fermentation and aging will also cause colour changes in a white wine. The golden hue of white wines tends to increase during aging (Jackson, 2009; Zraly, 2009). 22
31 Chenin blanc table wines tend to have a light to medium straw colour approaching yellow (Amerine & Joslyn, 1970). Sweet dessert wines made from Chenin blanc lean towards having a golden hue (LaVilla, 2010) Body The body of a wine can be defined as the viscosity or consistency of the liquid. This is experienced by tactile sense in the mouth and gives the perception that a wine has weight, volume or size (Harrington, 2008; McCarthy & Ewing-Mulligan, 2006). The perceived body of a wine can be ranked from thin to heavy, with thin having a watery consistency and heavy having a more robust or viscous body (Harrington, 2008). A wine can also be described as being light-bodied, medium-bodied or full-bodied (McCarthy & Ewing- Mulligan, 2006) which is the description usually found on wine back labels. The perception of body, especially in dry wines, is generally influenced by a wine s alcohol content (Jackson, 2009; McCarthy & Ewing-Mulligan, 2006). However, at sugar levels exceeding 0.5%, the perception of a wine s body can be affected by the sweetness. Other non-volatile compounds like glycerol, at high concentrations, and phenolics also influence the perception of a wine s body (Francis & Newton, 2005; Jackson, 2009). The body of a dry style Chenin blanc can range from light to medium (LaVilla, 2010; Patterson, 2011), some describing these fuller bodied wines as having an oily texture (Blackburn & Levine, 2003; McCarthy et al., 2009). 5. Sensory techniques used to investigate wine quality Research in the wine industry has thus far focussed on understanding the factors contributing to wine quality (Francis & Newton, 2005). Wine quality can be analysed in different ways (Jackson, 2008). It can also be interpreted as being objective or subjective. Objective wine quality includes the requirement of a wine to conform to technical specifications which is usually determined by analytical or chemical tests. Subjective wine quality relates to perceived quality as determined by a human assessor. The assessor can either be a wine expert, a trained panellist or simply a wine consumer (Cox, 2009). Some of the terms used to estimate wine quality include complexity, aging potential, consumer acceptability, stylistic purity and expression of cultivar (Jackson, 2008). In the past, the evaluation of wine quality frequently involved the assessment of wines for defects by a trained or an expert panel (Ebeler, 1999) as these are usually easier to recognise (Jackson, 2008). If a wine is found to be free of defects, the panel then evaluates the colour, aroma, mouthfeel, appearance, flavour and the overall balance of the sensory properties to give a general impression of wine quality (Ebeler, 1999; Harrington, 2008). 23
32 Today, the main purpose of research is to determine and identify the specific characteristics crucial to overall wine quality so that knowledge can facilitate the control and improvement of a product. By gathering both chemical and sensory data, sensory-instrumental correlations can be established and used by the industry to predict the sensory quality of a wine using only compositional data (Francis & Newton, 2005; Vilanova et al., 2010). Consumer preference data can also be incorporated into these prediction tools to show the sensory characteristics responsible for satisfying a consumer s needs and expectations (Francis & Newton, 2005) as drinking pleasure and human enjoyment will always remain an essential indicator of wine quality (Jackson, 2000). Information concerning both the chemical nature, especially aroma compounds (Jackson, 2008; Rocha et al., 2010), and the sensory characteristics of a wine, the correlation between the two, and how the wine is accepted by consumers must be well understood to achieve control over wine quality (Francis & Newton, 2005). Some of the sensory techniques used to investigate wine quality and the influence of consumer opinions on the liking of wines are described in the sections to follow Sorting and descriptive sensory analysis as techniques in quantifying sensory quality Sensory analysis has only recently gained popularity and showed incredible growth since the mid twentieth century. This was brought on by the increase in processed foods and alcoholic beverages (Lawless & Heymann, 2010). It is not only the food and beverage industry that have recognised the potential and importance of sensory analysis, but all consumer product companies including home care and personal care industries, have acknowledged that sensory analysis has an important function within their business. Even marketing research and brand management are utilising sensory information to their advantage (Stone & Sidel, 2004). Sensory analysis comprises of an extensive range of techniques to evoke, quantify, examine and interpret a human s response to a food product. This response will be provoked by how a human perceives the food product through their sensory system which includes touch, taste, smell, hearing and sight (Stone & Sidel, 2004). Some of these techniques will be discussed and compared below in an effort to evaluate their suitability for quantifying the sensory quality of wine Sorting as method of analysis of sensory wine quality using multidimensional scaling (MDS), DISTATIS and correspondence analysis (CA) Sorting can be defined as a discrimination test as it involves the grouping of samples or products according to differences and similarities. The number of groups formed to distinguish between samples is an individual decision made the assessor (Bijmolt & Wedel, 1995). This method is based on categorisation which is used routinely by humans and involves an ordinary cognitive process (Chollet et al., 2011). The sorting task has been employed in various areas of applied sensory science including flavour studies, category evaluation and competitive studies (Nestrud & Lawless, 24
33 2010). The advantages of the sorting task are that it is fast and easy to execute and it also does not cause fatigue or boredom (Bijmolt & Wedel, 1995; Tang & Heymann, 2002). This method is also very flexible (Popper & Heymann, 1996) and can be done using inexperienced assessors (Cadoret et al., 2009; Piombino et al., 2004) which saves time and money (Cartier et al., 2006). The sorting task is also very appropriate for analysing products for similarity when a large number of sensory stimuli need to be taken into account (Abdi et al., 2007). The sorting task can also be combined with a descriptive task where the assessors give a short description for each group formed. This will allow a perceptual map to be explained by the described attributes (Cadoret et al., 2009; Chollet et al., 2011; Popper & Heymann, 1996). The value of these perceptual maps has been researched by several authors (Chollet & Valentin, 2000; Hollins et al., 1993; Lawless, 1989; Lawless et al., 1995; Lim & Lawless, 2005). It is thought that this method offers a less prejudiced representation than when assessors are directed to rate specific attributes represented by particular words as the measure of similarity is chosen by the assessor himself (Lawless & Heymann, 2010). Some of the disadvantages of the sorting task are the inability of generating quantitative differences between products. It is also recommended that the sorting method is not suited for studies where the aim is to determine a precise and reliable description of complex products (Delarue & Sieffermann, 2004; Lelièvre et al., 2008). Another inconvenience is the number of products that can be accurately evaluated in a single session (Cartier et al., 2006). Cartier et al. (2006) recommended sample set size for sorting breakfast cereals to be no more than 15, whereas Chollet et al. (2011) found that the sorting task can be executed accurately using up to 20 beers. For wine, Campo et al. (2008) found that a panel sorted 23 wines in one session without any problem. The data collected can be analysed using a number of statistical techniques, but must first be converted to distance matrices. Some of these techniques are multidimensional scaling (MDS) (Schiffman et al., 1981); multiple correspondence analysis (MCA) (Cadoret et al., 2009; Takane, 1981, 1982), common component and specific weights analysis (Qannari et al., 2009), DISTATIS (Abdi et al., 2005; 2007), additive trees (Abdi, 1990) and correspondence analysis (CA) (McEwan & Schlich, 1991/1992; Sinesio et al., 2005). Only the multivariate methods MDS, DISTATIS and CA will discussed here. Multidimensional scaling analysis (MDS) is a statistical method that analytically place samples, which are represented by points (Lawless & Heymann, 2010; Schiffman et al., 1981) on a spatial map to show the similarity of the different samples (Chollet et al., 2011; Lawless & Heymann, 2010; Tang & Heymann, 2002). These perceptual maps can aid in the understanding of the underlying dimensions or qualities which cause samples to be similar or dissimilar (Nestrud & Lawless, 2010; Tang & Heymann, 2002). Similarity of samples is measured by calculating the frequency that those samples are sorted together (in the same group) in a sorting task (Lawless & Heymann, 2010; Nestrud & Lawless, 2010; Tang & Heymann, 2002). Samples which are similar and are sorted together often will be positioned close together on an MDS plot and samples which are seldom placed together in a sorting task will be placed far apart. This makes the MDS plot an overall similarity matrix which uses the total of the individual matrices generated by the respective assessors in a sorting task (Abdi et al., 2007; Chollet et al., 2011). Lawless et al. (1995) believe that this is a disadvantage as the sum of the individual data is used and much information on the individual 25
34 assessor is lost. This limitation can be overcome by using a statistical method like DISTATIS. DISTATIS is a statistical method that considers individual sorting data similarity matrices. This method combines MDS with STATIS and analyses individual data generated by a sorting task (Abdi et al., 2007; Cadoret et al., 2009; Santosa et al., 2010). STATIS is a multivariate statistical method based on RV coefficients and shows conformity between individual judges data (Næs et al., 2010; Schlich, 1996). The plots produced by DISTATIS analysis of sorting data can be interpreted using the same basic rules as for an MDS or a PCA plot where similarity is represented by the distance between two sample points on a spatial plot (Abdi et al., 2007; Chollet et al., 2011). Correspondence analysis (CA) functions as graphical tool to study the correspondence of categorical variables (Beh et al., 2011) as obtained in a sorting task with a descriptive step. This method evaluates the correspondence or association between row and column variables in a contingency table. The results obtained from a sorting task with a descriptive step can easily be transformed into a contingency table where the rows will represent the samples and the columns the attributes given to the samples by the assessors (McEwan & Schlich, 1991/1992). By employing the sorting task and analysing the resultant data using the statistical methods MDS and DISTATIS, underlying trends or groupings within the bush vine Chenin blanc wines of SA can be studied. CA will also elucidate the sensory characteristics responsible for the similarities or differences between the bush vine Chenin blanc wines contained within the sample set chosen for this study Descriptive sensory analysis as test technique to establish sensory quality of wines Descriptive sensory analysis (DSA) is a method that has proven to be the most useful and comprehensive of sensory evaluation methods and is used to describe both the quantitative and qualitative sensory attributes of a product (Lawless & Heymann, 2010; Vilanova et al., 2010). The intensity (quantitative) of each attribute (qualitative) is marked on a scale which allows the data to be statistically analysed (Delarue & Sieffermann, 2004; Lawless & Heymann, 2010). The results obtained from this method can also be correlated with other data sets such as instrumental data and consumer preference data (Lawless & Heymann, 2010). For DSA, 10 to 12 judges are needed (Lawless & Heymann, 2010). The reason for using a panel of judges is the fact that humans perceive sensory stimuli and discriminate among attributes differently. Using a panel of judges thus stabilises the description generated (Delarue & Sieffermann, 2004). These judges create a set of terms to be used when describing the samples (Lawless & Heymann, 2010). A set of reference standards or verbal definitions for different attributes can also be chosen to facilitate the training process. These reference standards will ensure that panellists comprehend and agree on the attributes used to describe a product. After consensus has been reached on how the samples differ in terms of the attributes identified during the earlier stages of training, sample evaluation can commence (Lawless & Heymann, 2010). During the analysis of the samples, standard sensory practices is usually followed which entails coding the samples, randomising the sample order, having the judges sit in separate booths, controlling the 26
35 room temperature and lighting and requiring expectoration and rinsing between samples. In the testing phase of DSA, the judges mark the intensities of the different attributes perceived in each sample on a line scale, anchored by descriptions or words chosen during training. The analysis procedure is usually repeated so the data can be used to check the consistency of the panel. The data can then be analysed using statistical methods including analysis of variance (ANOVA) and other multivariate methods like principle component analysis (PCA) (Lawless & Heymann, 2010). Even though extensive training normally precedes the analysis of a product, judges still tend to use different parts of the intensity scale. This is, however, inconsequential as the relative differences between samples are considered and not the absolute scale values indicated by individual judges (Lawless & Heymann, 2010). This method of sensory analysis is especially suited for complex food matrices like wine as the majority of the time spent on this type of analysis is on training the judges (Esti et al., 2010). This method can also be employed to establish the sensory profile of a product or group of samples (Stone et al., 1974). Although this method has been found to be extremely accurate and comprehensive, it does have some disadvantages. It can be time-consuming and expensive (Delarue & Sieffermann, 2004; Guàrdia et al., 2010; Piombino et al., 2004). Another limitation is the development of a consensual language to describe product attributes (Delarue & Sieffermann, 2004). This can be problematic because a single sensory stimulus can be observed very differently, both qualitative and quantitative, by different individuals (Lawless, 1999). This is because it is not only the human s sensory system which is concerned in observing sensory stimuli, but also perceptual and cognitive factors which influence how a person perceives a product s intrinsic attributes (Keast et al., 2004). DSA will be employed in this study to establish a comprehensive sensory profile for South African Chenin blanc wines produced from bush vines. The results from the DSA will also be correlated with consumer data to establish the drivers of liking associated with bush vine Chenin blanc wines Comparison of sorting and descriptive sensory analysis in the analysis of wine quality To date, many researchers have compared different sensory methodologies with conventional DSA to try and find an alternative which eliminates some of the limitations and disadvantages of DSA methods. These alternative methods include flash profiling, free choice profiling and the sorting task. In Table 3, the work of some researchers comparing conventional DSA to the sorting task is summarised. From this summary, it is evident that conventional DSA can be substituted by the sorting task for obtaining product maps and more specifically product classification. Nevertheless, for accurate and detailed product descriptions and profiling, conventional DSA still remains the best and most comprehensive method to use. By employing both a conventional descriptive technique and the sorting task to profile and classify the bush vine Chenin blanc wines in this study, the two methods can be compared. Not only will the sorting task s ability to profile wines be examined, but also the capacity of conventional DSA to classify wines. 27
36 Table 3 Comparison of conventional DSA to the sorting task. Author, year of publication Journal Objective Samples Methods Descriptive sensory Sorting task analysis (DSA) Statistical analysis Descriptive sensory Sorting task analysis (DSA) Conclusions Blancher et al., 2007 Food Quality and Preference Study the influence of different sensory methodologies on 3 strawberry flavoured, red coloured jellies on Vietnamese market; 17 Panellists: 14 (France) Training: 17 Panellists: 14 (France); 17 (Vietnam) ANOVA HAC a PCA b MDS c 4 product clusters were identical; DSA configurations were more similar to flash profiling than free profiling of products gels produced from hours Training: no sorting configurations. different gelling agents. Replications: 1 training Campo et al., 2008 Australian Journal of To define the sensory space of 23 commercial monovarietal young Panellists: 32 Training: 8 Panellists: 32 Training: 1 MDS c HCA d Citation frequency Both methods lead to similar results regarding grouping of Grape and Wine young monovarietal white Spanish wines white Spanish wines, different varieties, hours Replications: 2 session CA e HCA d wines. Research different regions. Cartier et al., 2006 Chollet et al., 2011 Food Quality and Preference Food Quality and Preference Investigate sorting task to replace quantitative DSA for obtaining a product map Investigate if sorting task with descriptive step results in less precise description of beers than conventional profile 13 commercial breakfast cereals. Panellists: 12 Training: 12 hours Replications: 1 15 beers Panellists: 9 Training: 17 hours; provided with list of descriptors Replications: 1 Panellists: 12 Training: previous experience; provided with list of descriptors Panellists: 9 Training: 17 hours ANOVA PCA b Κ-means clustering PCA b HCA d MDS c Κ-means clustering ANOVA e CA HCA d Product maps obtained were found to be very similar, only position of one sample differed. More attributes generated for product discrimination in DSA. Similar product maps were obtained. More precise and more easily interpretable results were obtained with conventional profile. a Hierarchical Ascending Classification; b Principle Component Analysis; c Multidimensional Scaling; d Hierarchical Cluster Analysis; e Correspondence Analysis; f Student-Newman-Keuls test 28
37 Author, year of publication Journal Objective Samples Methods Descriptive sensory Sorting task analysis (DSA) Statistical analysis Descriptive sensory Sorting task analysis (DSA) Conclusions Faye et al., Food Quality Compare free 26 rectangular, Panellists: 11 Panellists: 150 ANOVA MDS c Configurations obtained with the 2004 and Preference sorting task to DSA translucent plastic pieces for sorting; subset of 8 samples for DSA. Training: 5 hours Replications: 1 Training: 17 sessions Replications: 1 PCA b HCA d (to choose subset for DSA) two methods regarding product groupings and descriptions were very similar. Faye et al., Food Quality To evaluate free 8 leather samples Panellists: 11 Panellists: 207 ANOVA MDS c MDS positioning of samples is 2006 and Preference sorting as an alternative to DSA in external preference differing in origin, relief and treatment. Training: 5 hours Training: no training PCA b comparable to sensory map obtained by DSA. mapping Replications: 1 Replications: 1 Saint-Eve et Food Quality Compare 3 12 yogurts flavoured Panellists: 16 Panellists: 16 ANOVA MDS c Both sorting and conventional al., 2004 and Preference methodologies: sorting; free choice profiling; conventional profiling with a single or mixture of compounds. Training: not specified Replications: 2 Training: no training Replications: 2 SNK f PCA b ANOVA profiling provided corresponding information. a Hierarchical Ascending Classification; b Principle Component Analysis; c Multidimensional Scaling; d Hierarchical Cluster Analysis; e Correspondence Analysis; f Student-Newman-Keuls test 29
38 5.2. Relationship between consumer liking of wines, wine-related cues and consumer opinions Costell et al. (2010) summarised the main aspects defining consumer response as 1) connected to the sensory attributes of a food product; 2) the positive or negative response towards the product after consumption; 3) the cognitive element involving knowledge and attitude about a product and 4) the behavioural aspect implying how a consumer is to act in future regarding the preceding experience. For a product to be successful and competitive in the marketplace, both the extrinsic (non-sensory) and intrinsic (sensory) attributes need to be optimised and consumer attitudes or opinions need to be understood (Mueller & Szolnoki, 2010). Research has confirmed that extrinsic product cues affect how a product is perceived by a consumer (Deliza & MacFie, 1996). Extrinsic product attributes such as price, appearance, nutritional and health benefits along with the sensory attributes of a product (e.g. flavour, taste, texture) not only influence a consumer s degree of liking, but also play an important role in the formation of beliefs and attitudes (Darby & Karni, 1973). Beliefs and attitudes will in turn influence a consumer s behaviour when it comes to evaluating extrinsic and intrinsic product attributes (Van Kleef et al., 2005). Wine is one product where the extrinsic attributes strongly influence the perception of the intrinsic sensory characteristics. This was determined previously by a number of researchers including Lange et al. (1999, 2000), Mueller et al. (2010), Priilaid (2006) and Siegrist and Cousin (2009). When consumers are faced with wine purchasing decisions, a product s quality is usually evaluated by using extrinsic product attributes (Lange et al., 2002) such as awards, brand names, cellaring advice and production procedures (Charters & Pettigrew, 2003; Ling & Lockshin, 2003; Thomas, 2000). Extrinsic attributes are also used as quality cues to induce hedonic expectation or expected liking. Expected liking refers to how much pleasure the consumer expects to derive from the sensory experience. When the product is tasted, the expected liking and sensory attributes perceived by the consumer are combined to create an overall quality judgment. Extrinsic product attributes have proved to either increase or decrease the consumer preference and acceptance of products that showed a high degree of liking when evaluated in blind conditions (Lange et al., 2002). When the consumer s expected liking is met upon tasting the product, future product purchase and consumption is likely to occur (Sabbe et al., 2009). To evaluate the influence of extrinsic cues on the consumer liking of a product, the expectation disconfirmation framework can be used (Deliza & MacFie, 1996). This method uses a 3-stage product evaluation process. Firstly, consumers evaluate the intrinsic attributes blindly; thereafter sensory expectation is measured by giving the consumers extrinsic cues and measuring the acceptance of the extrinsic attributes only. Only then the combined acceptance of the intrinsic and extrinsic attributes is measured. The data resulting from this analysis will clearly show how the extrinsic or non-sensory attributes of a product influence the consumer liking. The expectation disconfirmation framework recognises that expected liking can be confirmed or disconfirmed when a product is tasted. When the actual sensory experience meets the consumer s expectations, the expectation will be confirmed. When the sensory experience disappoints (negative) or exceeds (positive) the consumer s expectations, disconfirmation will occur (Deliza & MacFie, 1996). 30
39 Since bush vine Chenin blanc wines and Chenin blanc wines produced from old vines has the potential of establishing SA on the international wine market, consumer attitudes and opinions about these two quality factors should be elucidated. To investigate consumers beliefs, attitudes or opinions, specific qualitative methodologies have proved to be most suited (Lawless & Heymann, 2010), however, the latter methodologies tend to be effective only in exploratory work (Costell et al., 2010). Quantitative methodologies for investigating consumer beliefs and opinions usually involve questionnaires where the consumer s response is captured numerically (Costell et al., 2010). This data can thus be subjected to statistical analysis and correlated with other data sets. It is thus clear that not only the consumer s hedonic response to a wine should be important to wine producers, but also the consumer s response to different extrinsic stimuli regarding wine labelling and marketing as this too will influence how a consumer perceives a wine, how they experience the wine upon consumption and whether or not the consumer is likely to repeat the purchase. To evaluate how the extrinsic stimuli regarding whether or not a Chenin blanc wine is produced from bush vine or old vine grapes influences consumer liking, the expectation disconfirmation framework can be used. With additional information such as socio-demographics, education and knowledge on white wines and Chenin blanc wines in particular gathered with a questionnaire, the blind and informed hedonic responses from the consumers can be statistically analysed and compared to try and reveal underlying beliefs and attitudes towards Chenin blanc wines and those wines produced from old and bush vine vineyards. 6. Conclusions When considering Chenin blanc table wines as a commodity with the potential of establishing SA as one of the better wine producing countries, many different facets must be taken into consideration. Much research is needed to shed some light on this matter, not only to understand quality aspects of Chenin blanc relating to the sensory and chemical nature of these wines, but also to recognise and comprehend consumer behaviour and the factors that drive their decisions when purchasing Chenin blanc wines and their hedonic response when consuming bush vine and old bush vine Chenin blanc wines. Currently, little is known about the chemical and sensory nature of South African Chenin blanc wines and to date, no research have focussed solely on characterising Chenin blanc wines produced from bush vine vineyards. The consumer response to bush vine Chenin blanc wines is also a field that has previously never been explored. 31
40 7. References Abdi, H. (1990). Additive-tree representations. Lecture notes in biomathematics, 84, (as cited by Chollet et al., 2011). Abdi, H., Valentin, D., Chollet, S. & Chrea, C. (2007). Analyzing assessors and products in sorting tasks: DISTATIS, theory and applications. Food Quality and Preference,18, Abdi, H., Valentin, D., O Toole, A.J. & Edelman, B. (2005). DISTATIS: The analysis of multiple distance matrices. In: Proceedings of the IEEE Computer Society: International Conference on Computer Vision and Pattern Recognition, San Diego, USA, Pp (as cited by Chollet et al., 2011). Alig, P. (2010). Wine regions of the Old World. In: The everything guide to wine. Pp , 154. U.S.A.: F+W Media, Inc. Alsop, J. (2010). Wine lover s devotional: 365 days of knowledge, advice, and lore for the ardent aficionado. P Massachusetts: Quarry books. Amerine, M.A. & Joslyn, M.A. (1970). California grapes and wines. In: Table wines: the technology of their production (volume 2). P California: University of California Press. Anonymous. (2011a). Inventory of old vines across South Africa. WWW document. URL 23 July Anonymous. (2011b). Loire Valley wines. WWW document. URL 23 July Aspler, T. (1998). Tony Aspler s wine lover s companion (3 rd ed.). P. 15. Ontario: McGraw-Hill Ryerson Limited. Augustyn, O.P.H. & Rapp, A. (1982). Aroma components of Vitis vinifera L. cv. Chenin blanc grapes and their changes during maturation. South African Journal of Enology and Viticulture, 3:2, Beckett, F. (1999). Wine uncorked. P USA: Willow Creek Press. Beh, E.J., Lombardo, R. & Simonetti, B. (2011). A European perception of food using two methods of correspondence analysis. Food Quality and Preference, 22, Bijmolt, T.H.A. & Wedel, M. (1995). The effects of alternative methods of collecting similarity data for Multidimentional Scaling. International Journal of Research in Marketing, 12, Blackburn, I. & Levine, A. (2003). The Learning Annex presents the pleasure of wine (Vol. 2). P. 33. New York: Wiley & Sons Publishing, Inc. Blancher, G., Chollet, S., Kesteloot, R., Nguyen Hoang, D., Cuvelier, G. & Sieffermann, J.M. (2007). French and Vietnamese: How do they describe texture characteristics of the same food? A case study with jellies. Food Quality and Preference, 18, Boehmer, A. (2009). Wine Basics. Pp Connecticut: Morris Book Publishing, LLC. Brower, J. (2009). Chenin are we confusing the consumer? WWW document. URL: June Cadoret, M., Lê, S. & Pagés, J. (2009). A factorial approach for sorting task data (FAST). Food Quality and Preference, 20, Campo, E., Do, B.V., Ferreira, V. & Valentin, D. (2008). Aroma properties of young Spanish monovarietal white wines: a study using sorting task, list of terms and frequency of citation. Australian Journal of Grape and Wine Research, 14,
41 Cartier, R., Rytz, A., Lecomte, A., Poblete, F., Krystlik, J., Belin, E. & Martin, N. (2006). Sorting procedure as an alternative to quantitative descriptive analysis to obtain a product sensory map. Food Quality and Preference, 17, Charters, S. & Pettigrew, S. (2003). I like it, but how do I know if it s any good? Quality and preference in wine consumption. Journal of Research for Consumers, 5, Chenin Blanc Association. (n.d.). WWW document. URL February Chollet, S. & Valentin, D. (2000). Le degré d expertise a-t-il une influence sur la perception olfactive? Quelques éléments de résponse dans le domeine du vin. L année psychologique, 100, (as cited by Cartier et al., 2006). Chollet, S., Leliévre, M., Abdi, H. & Valentin, D. (2011). Sort and beer: Everything you wanted to know about the sorting task but did not dare to ask. Food Quality and Preference, 22, Christensen, L.P. (2003). Chenin blanc. In: Wine grape varieties in California (edited by L.J. Bettiga). Pp California: Regents of the University of California. Clarke, O. (2001). In the vineyard. In: Oz Clarke s grapes and wines: The definitive guide to the world s great grapes and the wines they make. P.19. London: Websters International Publishers. Clarke, O. (2007). Chenin blanc. In: Oz Clarke s grapes and wines: The definitive guide to the world s great grapes and the wines they make. Pp London: Websters International Publishers. Clarke, O. (2009). Oz Clarke s pocket wine guide P New York: Sterling Publishing Co., Inc. Clarke, R.J. & Bakker, J. (2004). Wine flavour chemistry. Pp. 22, 140, 278. USA: Blackwell Publishing Ltd. Colman, T. (2008). A year of wine: perfect pairings, great buys, and what to sip for each season. New York: Simon Spotlight Entertainment. Costell, E., Tárrega, A. & Bayarri, S. (2010). Food acceptance: The role of consumer perception and attitudes. Chemosensory Perception, 3, Cox, D. (2009). Predicting consumption, wine involvement and perceived quality of Australian red wine. Journal of Wine Research, 20, Darby, M.R. & Karni, E. (1973). Free competition and the optimal amount of fraud. Journal of Law and Economics, 16, Darriet, P., Tominaga, T., Lavigne, V., Boidron, J.N. & Dbourbieu, D. (1995). Identification of a powerful aromatic component of Vitis Vinifera L. var. Sauvignon wines: 4-Mercapto-4-methylpentan-2-one. Flavour and Fragrance Journal, 10, Delarue, J. & Sieffermann, J.M. (2004). Sensory mapping using flash profile. Comparison with a conventional descriptive method for the evaluation of the flavour of fruit dairy products. Food Quality and Preference, 15, Deliza, R. & MacFie, H.J.H. (1996). The generation of sensory expectation by external cues and its effect on sensory perception and hedonic ratings: A review. Journal of Sensory Studies, 11, Drapeau, P. & Vanasse, A. (1998). The encyclopaedia of home winemaking: fermentation and winemaking methods. P Montreal: XYZ Publishing. Du Plessis, C.S. & Augustyn, O.P.H. (1981). Initial study on the guava aroma of Chenin blanc and Colombar wines. South African Journal of Enology and Viticulture, 2, DuBose, F. & Spingarn, E. (2005). The ultimate wine lover s guide P New York: Sterling Publishing Co., Inc. 33
42 Ebeler, S. (1999). Linking flavor chemistry to sensory analysis of wine. In: Flavor chemistry:thirty years of progress (edited by R. Teranishi, E.L. Wick & I. Hornstein). P. 35. New York: Kluwer Academic/Plenum Publishers. Ebeler, S.E. & Spaulding, R.S. (1998). Characterization and measurment of aldehydes in wine. In: Chemistry of wine flavor (edited by A.L. Waterhouse & S.E. Ebeler). Pp Washington, DC: American Chemical Society. Ellis, L.P., Van Rooyen, P.C. & Du Plessis, C.S. (1985). Interactions between grape maturity indices and the quality and composition of Chenin blanc and Colombar wines from different localities. South African Journal of Enology and Viticulture, 6, Escudero, A., Campo, E., Fariña, L., Cacho, J. & Ferreira, V. (2007). Analytical characterization of the aroma of five premium red wines: Insight into the role of odor families and the concept of fruitiness of wines. Journal of Agricultureal and Food Chemistry, 55, Esti, M., Gonzáles Airola, R.L., Moneta, E., Paperaio, M. & Sinesio, F. (2010). Qualitative data analysis for an exploratory sensory study of grechetto wine. Analytica Chimica Acta, 660, Fallis, C. (2004). Wine: Grape goddess guides to good living. P Nebraska: iuniverse, Inc. Faye, P., Brémaud, D., Daubin, M.D., Courcoux, P., Giboreua, A. & Nicod, H. (2004). Perceptive free sorting and verbalization tasks with naive subjects: an alternative to descriptive mappings. Food Quality and Preference, 15, Faye, P., Brémaud, D., Daubin, M.D., Courcoux, P., Giboreua, A. & Nicod, H. (2006). An alternative to external preference mapping based on consumer perceptive mapping. Food Quality and Preference, 17, Ferreira, V., Escudero, A., Campo, E. & Cacho, J. (2008). Understanding to role played by the odorants and their interactions on wine flavour. In: Proceedings of the Wine Active Compounds 2008 International Conference, Chaintré, Pp Fisher, J.R. (2006). Wine and Food 101: A comprehensive guide to wine and the art of matching wine with food. P. 90. Indiana: Authorhouse. Fisher, U. (2007). Wine Aroma. In: Flavours and fragrances: Chemistry, bioprocessing and sustainability (edited by R.G. Berger). Pp Berlin: Springer. Francis, I.L. & Newton, J.L. (2005) Determining wine aroma from compositional data. Australian Journal of Grape and Wine Research, 11, Gibson, M. (2010). The sommelier prep course: an introduction to the wines, beers, and spirits of the world. Pp. 56, 75; New Jersey: John Wiley & Sons, Inc. Gil, M., Cabellos, J.M., Arroyo, T. & Prodanov, M. (2006). Characterization of the volatile fraction of young wines from the Denomination of Origin Vinos de Madrid (Spain). Analytica Chimica Acta, 563, Goode, J. (2005). The science of wine: from vine to glass. P. 91. California: University of California Press. Goode, J. (2011a). Chenin blanc. WWW document. URL June Goode, J. (2011b). Having fun in the Swartland and Voor Paardeberg, Jamie Goode s wine blog. WWW document. URL July Grainger, K. (2009). Wine quality: Tasting and selection. Pp. 52,133. UK: John Wiley & Sons Ltd. Guàrdia, M.D., Aguiar, A.P.S., Claret, A., Arnau, J. & Guerrero, L. (2010). Sensory characterization of drycured ham using free-choice profiling. Food Quality and Preference, 21,
43 Guth, H. (1997). Identification of character impact odorants of different white wine varieties. Journal of Agricultural and Food Chemistry, 45, Harrington, R.J. (2008). Wine texture characteristics: Tannin, oak, and body. In: Food and Wine Pairing: A Sensory Experience. Pp. 22, 158. New Jersey: Wiley & Sons, Inc. Hollins, M., Faldowski, R. & Rao, S. (1993). Perceptive dimension of tactile surface texture: a multidimensional scaling analysis. Perception & Psychophysics, 54:6, Hornsey, I. (2007). The chemistry and biology of winemaking. Pp , 186. UK: The Royal Society of Chemistry. Howe, G. (2011). Talking to the Chenin Kings. WWW document. URL June Jackson, R.S. (2000). Wine science: Principles and applications (2 nd ed.). Pp. 270; 579. California: Academic Press. Jackson, R.S. (2008). Wine science: Principles and applications (3 rd ed.). Pp. 11, 42, 82-83, 117, 123, , 559. USA: Elsevier Inc. Jackson, R.S. (2009). Wine tasting: A professional handbook (2 nd ed.). Pp. 5, 153, 155, 470. Massachusetts: Elsevier Inc. Jolly, N.P., Augustyn, O.P.H. & Pretorius, I.S. (2003). The use of Candida pulcherrima in combination with Saccharomyces cerevisiae for the production of Chenin blanc wine. South African Journal of Enology and Viticulture, 24, Keast, R.S.J., Dalton, P.H. and Breslin, P.A.S. (2004). Flavor interactions at the sensory level. In: Flavor perception (edited by A.J. Taylor & D.D. Roberts). Pp Oxford: Blackwell Publishing Ltd. Kerridge, G & Antcliff, A.J. (1999). Wine grape varieties. P. 39. Victoria: CSIRO Publishing. Kerridge, G. & Gackle, A. (2005). Vines for wines: a wine lover s guide to the top grape varieties. P. 27. Austalia: CSIRO Publishing. Lange, C., Issanchou, S. & Combris, P. (2000). Expected versus experienced quality: Trade-off with price. Food Quality and Preference, 11, Lange, C., Martin, C., Chabanet, C., Combris, P. & Issanchou, S. (2002). Impact of the information provided to consumers on their willingness to pay for Champagne: a comparison with hedonic scores. Food Quality and Preference, 13, Lange, C., Rousseau, F. & Issanchou, S. (1999). Expectation, liking and purchase behaviour under economical constraint. Food Quality and Preference, 10, LaVilla, J. (2010). The wine, beer & spirits handbook: A guide to styles and services. Pp New Jersey: John Wiley & Sons, Inc. Lawless, H.T. (1989). Exploration of fragrances categories and ambiguous odors using multidimensional scaling and cluster analysis. Chemical Senses, 17, Lawless, H.T. (1999). Descriptive analysis of complex odors: reality, model or illusion? Food Quality and Preference, 10, Lawless, H.T. & Heymann, H. (2010). Sensory evaluation of food: principles and practices (2 nd ed.). Pp. 1, 2, 6-7, 227, , 387, 455, 458. New York: Springer Science + Business Media, LLC. Lawless, H.T., Sheng, N. & Knoops, S.S. (1995). Multidimensional scaling of sorting data applied to cheese perception. Food Quality and Preference, 6, Lelièvre, M., Chollet, S., Abdi, H. & Valentin, D. (2008). What is the validity of the sorting task for describing beers? As study using trained and untrained assessors. Food Quality and Preference, 19,
44 Lim, J. & Lawless, H.T. (2005). Qualitative differences of divalents salts: multidimensional scaling and cluster analysis. Chemical Senses, 30, Ling, B.H. & Lockshin, L. (2003). Components of wine prices for Australian wine: How winery reputation, wine quality, region, vintage, and winery size contribute to the price of varietal wines. Australasian Marketing Journal, 11, Loubser, F.H. (2008). Chenin blanc table wines in South Africa. Cape Wine Master dissertation. WWW document. URL June Marais, J. (1983). Terpenes in the aroma of grapes and wines: a review. South African Journal of Enology and Viticulture, 4:2, Marais, J. (1994). Sauvignon blanc cultivar aroma a review. South African Journal of Enology and Viticulture, 15, Marais, J. (2003). Overview of Chenin blanc research. Wynboer, December. WWW document. URL May Marais, J., Van Schalkwyk, D. & October, F. (2005). Effect of berry size, sunlight exposure and ripeness on Chenin blanc wine quality. Wynboer Tegnies, August. WWW document. URL August Marais, J., Van Wyk, C.J. & Rapp, A. (1992). Effect of sunlight and shade on norisoprenoid levels in maturing Weisser Riesling and Chenin blanc grapes and Weisser Riesling wines. South African Journal of Enology and Viticulture, 13, Martineau, B., Acree, T.E. & Henick-Kling, T. (1995). Effect of wine type on the detection threshold for diacetyl. Food Research International, 28, Matthee, F.N. (1970). The influence of water on diseases of fruit trees. Deciduous fruit grower, 20, May, D. (2004). The only wine book you ll ever need. Pp USA: F+W Media, Inc. May, D. (2008). Wine lover s journal: A bold, distinctive offering of subtle insights. Pp USA: F+W Publications, Inc. McCarthy, E, Ewing-Mulligan, M. & Egan, M. (2009). Wine all-in-one for dummies. Pp. 29, 249. Indiana: Wiley Publishing, Inc. McCarthy, E. & Ewing-Mulligan, M. (2006). Wine for dummies (4 th ed.). P. 29. Indiana: Wiley Publishing, Inc. McCoy, E. (2011). Betting on SA. In: Bloomberg Markets. WWW document]. URL June McEwan, J.A. & Schlich, P. (1991/1992). Correspondence analysis in sensory evaluation. Food Quality and Preference, 3, McKay, M., Buglass, A.J. & Gook Lee, C. (2011). Fermented beverages: beers, ciders, wines and related drinks. In: Handbook of alcoholic beverages: Technical, analytical and nutritional aspects (edited by A.J. Buglass). P. 86. New Jersey: John Wiley and Sons. Moio, L., Ugliano, M., Genovese, A., Cambuti, A., Pessina, R. & Piombino, P. (2004). Effect of antioxidant protection of must on volatile compounds and aroma shelf life of Falanghina (Vitis vinifera L.) wine. Journal of Agricultural and Food Chemistry, 52,
45 Mueller, S. & Szolnoki, G. (2010). The relative influence of packaging, labelling, branding and sensory attributes on liking and purchase intent: Consumer differ in their responsiveness. Food Quality and Preference, 21, Mueller, S., Lockshin, L., Saltman, Y. & Blanford, J. (2010). Message on a bottle: The relative influence of wine back label information on wine choice. Food Quality and Preference, 21, Næs, T., Brockhoff, P.B. & Tomic, O. (2010). Quality control of sensory profile data. In: Statistics For Sensory and Consumer Data. Pp , 44-45, 268. UK: John Wiley & Sons, Ltd. Nestrud, M.A. & Lawless, H. T. (2010). Perceptual Mapping of Apples and Cheeses Using Projective Mapping and Sorting. Journal of Sensory Studies, 25, Ochterbeck, C.C. (2010). Michelin Green guide wine regions of France. P UK: Michelin Apa Publications. Patterson, T. (2011). Home winemaking for dummies. P Ontario: John Wiley & Sons Canada, Ltd. Peridot Communications (2010). Chenin s Cinderalla story. WWW document]. URL June Piombino, P., Nicklaus, S., Le Fur, Y., Moio, L. & Le Quéré, J.L. (2004). Selection of products presenting given flavor characteristics. American Journal of Enology and Viticulture, 55, Popper, R. & Heymann, H. (1996). Analysing differences among products and panellists by multidimensional scaling. In: Multivariate Analysis of Data in Sensory Science (edited by T. Naes & E. Risvik). Pp Amsterdam: Elsevier Science B.V. Priilaid, D.A. (2006). Wine s placebo effect: How the extrinsic cues of visual assessments mask the intrinsic quality of South African red wine. International Journal of Wine Marketing, 18, Qannari, E.M., Cariou, V., Teillet, E. & Schlich, P. (2010). SORT-CC: A procedure for the statistical treatment of free sorting data. Food Quality and Preference, 21, Rapp, A. & Versini, G. (1995). Influence of nitrogen compounds in grapes on aroma compounds of wine. Developments in Food Science, 37, Reynolds, A.G. & Vanden Heuvel, J.E. (2009). Influence of grapevine training systems on vine growth and fruit composition: A review. American Journal for Enology and Viticulture, 60:3, Reynolds, A.G., Edwards, C.G., Cliff, M.A., Thorngate III, J.H. & Marr, J.C. (2001). Evaluation of yeast strains during fermentation of Riesling and Chenin blanc musts. American Journal of Enology and Viticulture., 52:4, Robinson, J. (1999). The Oxford Companion to Wine (2 nd ed.). Pp. 118, , , 747, New York: Oxford University Press Inc. Robinson, J. (2004). The best Chenins in the world? JancisRobinson.com. WWW document. URL August Rocha, S.M., Coutinho, O., Coelho, E., Barros, A.S. & Delgadillo, I. (2010). Relationship between the varietal volatile composition of the musts and white wine aroma quality. A four year feasibility study. Food Science and Technology, 43, Rous, C. & Alderson, B. (1983). Phenolic extraction curves for white wine aged in French and American oak barrels. American Journal of Enology and Viticulture, 34, Sabbe, S., Verbeke, W. & Van Damme, P. (2009). Confirmation/disconfirmation of consumers expectations about fresh and processed tropical fruit products. International Journal of Food Science and Technology, 44,
46 Saint-Eve, A., Kora, E.P. & Martin, N. (2004). Impact of the olfactory quality and chemical complexity of the flavouring agent on the texture of low fat stirred yogurts assessed by three different sensory methodologies. Food Quality and Preference, 15, Salmi, N. (2006). Frommer s San Francisco day by day. P USA: Frommer s. Santosa, M., Abdi, H. & Guinards, J. (2010). A modified sorting task to investigate consumer perceptions of extra virgin olive oils. Food Quality and Preference, 21, Schiffman, S.S., Reynolds, M.L. & Young, F.W. (1981). Introduction to Multidimensional Scaling. New York: Academic Press. Schlich, P. (1996). Defining and validating assessor compromises about product distances and attribute correlations. In: Multivariate analysis of data in sensory science (edited by T. Næs & E. Risvik). P Amsterdam: Elsevier Science B.V. Schreier, P. (1979). Flavour composition of wines: A Review. CRC Critical Reviews in Food Science and Nutrition, 4, Sinesio, F., Moneta, E., Peparaio, M. & Esti, M. (2005). Exploring sensory properties of Frascati Superiore CDO wine using Correspondence Analysis. In: Proceeding of VI Pangborn Sensory Science Symposium, p. 107, North Yorkshire, UK (as cited by Esti et al., 2010). Skelton, S. (2007). Viticulture: An introduction to commercial grape growing for wine production. Pp. 68, 87. London: Lulu. Smyth, H., Cozzolino, D., Herderich, M.J., Sefton, M.A. & Francis, I.L. (2005). Relating volatile composition to wine aroma: Identification of key aroma compounds in Australian white wines. In: Proceedings of the Twelfth Australian Wine Industry Technical Conference, Melbourne, Australia (edited by R.J. Blair, P.J. Williams, I.S. Pretorius). Pp Adelaide: Australian Wine Industry Technical Conference Inc. (as cited by Ugliano & Henschke, 2009). South African Wine Industry Information and Systems (2008). Statistics of wine-grape vines as on 30 November WWW document. URL April South African Wine Industry Information and Systems (2009). Statistics of wine-grape vines as on 30 November WWW document. URL January South African Wine Industry Information and Systems (2011). Statistics of wine-grape vines as on 31 December WWW document. URL July Splash PR & Media Consultants (2009). South African Chenin is terrific value. WWW document. URL June St. Pierre, B. & Armstrong, E.J. (2003). The wine deck: 50 ways to choose, serve & enjoy great Wines. California: Chronical Books. Stone, H. & Sidel, J.L. (2004). Introduction to sensory evaluation. In: Sensory evaluation practices (3 rd ed.). Pp. 1, 13. California: Elsevier Academic Press. Stone, H., Sidel, J.L., Oliver, S., Woolsey, A. & Singleton, R.C. (1974). Sensory evaluation by quantitative descriptive analysis. Food Technology, 11, Sullivan, C.L. (1998). A companion to California wine: An encyclopaedia of wine and winemaking from the mission period to the present. Pp California: Regents of the University of California. Takane, Y. (1981). MDSORT: A special purpose multidimensional scaling program for sorting data. Journal of Marketing Research, 18,
47 Takane, Y. (1982). IDSORT: An individual differences multidimensional scaling for sorting data. Behavior Research Methods and Instrumentation, 14, 546. Tang, C. & Heymann, H. (2002). Multidimensional sorting, similarity scaling and free-choice profiling of grape jellies. Journal of Sensory Studies, 17, Thomas, A. (2000). Elements influencing wine purchasing: A New Zealand view. International Journal of Wine Marketing, 12, Ugliano, M. & Henschke, P.A. (2009). Yeasts and wine Flavour. In: Wine Chemistry and Biochemistry (edited by M.V. Moreno-Arribas & M.C. Polo). Pp New York: Springer Science + Business Media, LLC. Vaadia, Y. & Kasimatis, A.N. (1961). Vineyard irrigation trials. American Journal of Enology and Viticulture, 12, Van der Merwe, C.A. & Van Wyk, C.J. (1981). The contribution of some fermentations products to the odor of dry white wines. American Journal of Enology & Viticulture, 32, Van Kleef, E., Van Trijp, H.C.M. & Luning, P. (2005). Consumer research in the early stages of new product development: a critical review of methods and techniques. Food Quality and Preference, 16, Van Rooyen, P.C., De Wet, P., Van Wyk, C.J. & Tromp, A. (1982). Chenin blanc wine volatiles and the intensity of a guava-like flavour. South African Journal of Enology and Viticulture, 3, 1-7. Van Zyl, J.L. & Van Huyssteen, L. (1980a). Comparative studies on wine grapes on different trellising systems: I. Consumptive water use. South African Journal of Enology and Viticulture, 1, Van Zyl, J.L. & Van Huyssteen, L. (1980b). Comparative studies on wine grapes on different trellising systems: II. Micro-climatic studies, grape composition and wine quality. South African Journal of Enology and Viticulture, 1, Vilanova, M., Genisheva, Z., Masa, A. & Oliveira, J.M. (2010). Correlation between volatile composition and sensory properties in Spanish Albariño wines. Microchemical Journal, 95, Volschenk, C.G. & Hunter, J.J. (2001). Effect of trellis conversion on the performance of chenin blanc/richter grapevines. South African Journal of Enology and Viticulture, 22:1, Winkler, A.J., Cook, J.A., Kliewer, W.M. & Lider, L.A. (1974). General viticulture. Berkeley: University of California Press. Winkler, A.J., Cook, J.A., Kliewer, W.M. & Lider, L.A. (1975). General viticulture (2 nd ed.). Los Angeles: University of California Press. Zraly, K. (2005). Windows on the world complete wine course. Pp. 6, 48. New York: Sterling Publishing Co., Inc. Zraly, K. (2009). Windows on the world complete wine course: 25 th anniversary edition. P. 9. New York: Sterling Publishing Co., Inc. 39
48 Chapter 3 Sensory and chemical profile of a selection of South African Chenin blanc wines produced from bush vines 40
49 CHAPTER 3: Contents 1. Introduction Materials and methods Wine samples Descriptive sensory analysis Panel Panel training Sensory testing Instrumental analyses of aroma compounds and general wine parameters Statistical analysis procedures Pre-processing of chemical data Pre-processing of sensory data Statistical analysis of chemical and sensory data Results and discussion Sensory profile of selected bush vine Chenin blanc wines Attribute selection Sensory attributes associated with bush vine Chenin blanc wines Chemical profile of selected bush vine Chenin blanc wines Variable selection Chemical attributes associated with bush vine Chenin blanc wines Conclusions References
50 1. Introduction Chenin blanc is a white wine grape variety that had its origins in the Loire Valley, France, but has also been cultivated in South Africa (SA) since the 1600 s (Alig, 2010). It is known to be a versatile grape, i.e. well suited for different terroirs. The Chenin blanc grape has a neutral sensory profile, which opens up the possibility for the winemaker to produce a number of white wine styles using different winemaking strategies (Loubser, 2008). In South Africa, Chenin blanc dry style table wines include three styles. These three styles are recognised by the Chenin Blanc Association (CBA) of SA as Fresh and Fruity, Rich and Ripe unwooded and Rich and Ripe wooded (Loubser, 2008, CBA, n.d.). In 2008 Loubser (2008) interviewed producers of top quality South African Chenin blanc wines with the intention of establishing the relative importance of an array of viticultural and oenological practices in producing quality Chenin blanc wines. This research indicated that production of top quality Chenin blanc table wines involves a complex interaction of intrinsic (i.e. terroir) and pre- and post-harvest factors (i.e. viticultural and oenological practices). The most important viticultural factors determining the quality of Chenin blanc wines were low yields, right level of ripeness at harvest and canopy management, whereas the most essential oenological aspect was regarded as extended lees contact (Loubser, 2008). Low yields in Chenin blanc production can be attributed to reduced vine vigour and reduced vigour is known to influence overall wine quality (Goode, 2005; LaVilla, 2010; Loubser, 2008; Reynolds & Vanden Heuvel, 2009). Both old vine age and bush vine training have proved to influence vine vigour and ultimately wine quality (LaVilla, 2010; Skelton, 2007; Van Zyl & Van Huyssteen, 1980; Volschenk & Hunter, 2001). Unfortunately, a limited number of scientific publications are available on the sensory and chemical quality of Chenin blanc table wines, especially those produced from bush vines. It would be beneficial to investigate the sensory and chemical profile of South African Chenin blanc wines, especially those produced from bush vines and old bush vines. The most comprehensive sensory analysis method for the quantitative and qualitative profiling of wine is descriptive sensory analysis (DSA) (Lawless & Heymann, 2010; Vilanova et al., 2010). During DSA, the intensity (quantitative) of each sensory attribute (qualitative) is determined which allows the sensory data to also be correlated with other data sets, such as data resulting from analytical chemistry techniques (Lawless & Heymann, 2010). Analytical chemistry techniques that can be used to investigate compounds influencing the sensory characteristics of wine include GC-FID (gas chromatography fitted with a flame ionisation detector) and FTMIR (Fourier transform mid-infrared) spectroscopy. GC-FID is an important technique in the investigation of the volatile composition of wine aroma (Gil et al., 2006; Vilanova et al., 2010) as it is able to quantify volatile compounds in complex samples (Vilanova et al., 2010). In view of the above the objective of this study was to characterise dry style Chenin blanc wines produced from bush vine and old bush vine vineyards using analytical chemical and sensory techniques. 42
51 2. Materials and methods The materials and methods used to characterise a selection of bush vine Chenin blanc wines from SA in terms of their sensory and chemical properties, are discussed in this section Wine samples A total of 25 wines were sourced from the South African market from December 2010 to March Platter s South African wine guide from 2010 to 2012 (Van Zyl, 2010; 2011; 2012) was used to identify possible Chenin blanc wines produced from bush vine vineyards. The respective wineries were then contacted and a questionnaire (Addendum A) was used to ascertain further information from the winemaker or viticulturist. All the information on the wines gathered for this study using the questionnaire and other published and electronic sources are given in Addendum B. Only wines produced solely from Chenin blanc grapes from bush vine vineyards and made to a dry style (residual sugar < 9 g/l) were included in this study. Different vineyard ages were also included in this study, even though specific vineyard ages were not considered a prerequisite for a wine to be included in the sample set. The wines included in this study are listed in Addendum B, in alphabetical order, but for further reference, all wines will be coded for anonymity. Wines were purchased in large enough volumes to conduct all envisaged sensory and chemical analyses and were stored at 4 o C from delivery to date of use. To ensure that none of the wines went wasted, wines were decanted into aliquots. Glass bottles were washed using a 70% ethanol-solution and dried prior to use. For each wine bottle opened, the sample bottles were filled to overflow to exclude air which could result in oxidation and changes in colour, aroma and flavour (Jacobson, 2006) Descriptive sensory analysis Descriptive sensory analysis (DSA) is one of the most refined tools in sensory science as it allows the analysis of a product s complete sensory profile in three steps: 1) panel training; 2) analysing panel performance and 3) sample analysis (Lawless & Heymann, 2010) Panel The panel for the DSA consisted of 10 members, all female and ranging in age from 24 to 70. These panellists were all experienced in DSA and have been involved in a number of sensory studies where they had to profile an extensive range of food products, including red and white wines. 43

52 Panel training The panel was trained for 12 h prior to the analysis phase using reference standards to generate a list of descriptors and to assign intensities to the respective attributes in each of the wines in the sample set. This was done to assist the panel to agree on and to understand the connotation of the respective sensory attributes and attribute intensities and to ensure that the panel performed consistently (Lawless & Heymann, 2010). The specific reference standards were chosen in collaboration with the sensory research manager of a leading South African wine producer (L. Louw, Distell, Stellenbosch, SA, 2011, personal communication), as well as using the tasting wheel (Addendum C) as compiled by the Chenin blanc Association (CBA) of SA and the tasting notes for each of the wines as available on the back label, in the Platter wine guide or on the winery s website (Addendum B). The reference standards used during the training phase of DSA were formulated using a range of flavour extracts, fresh produce or food products. Trial and error was used to determine the most appropriate concentration of references in a base wine or water as solution to illustrate specific aromas in wine. A light white wine with a neutral character, Drostdy-Hof Extra Light Dry White (Fig. 1), was used as base wine and served as a carrier for the aromas of the respective reference standards. The list of the reference standards and the formulae used for preparation are given in Addendum D. The fresh products were placed in petri dishes and all other reference standards were served in standard ISO wine tasting glasses covered with a small petri dish to concentrate the aroma in the headspace of the glass. Figure 1 Base wine used for the preparation of reference standards. Training sessions were held early in the morning and were never longer than two hours to prevent panel fatigue. During the first training session, much attention was given to the reference standards and as the panel grew more familiar and confident in identifying the respective aroma attributes, time spent on studying the reference standards was decreased up to the point where reference standards were only used when the judges felt the need to revisit them. 44

53 The descriptors used in the training sessions are given in Table 1, see Addendum E for the complete training questionnaire. In this questionnaire, different descriptors were used and a score, reflecting attribute intensity ranging from 0 to 100, was assigned to each descriptor for each individual sample. Thirty six (36) aroma, four (4) flavour, three (3) taste and one (1) mouthfeel attributes were analysed. Aroma attributes included both first and second tier aroma attributes. During training, 20 ml of each wine sample was served at room temperature (21 C) in standard ISO wine tasting glasses covered with a small petri dish to limit escaping aromas. All training sessions were held in a sensory laboratory which was light- and temperature-controlled (21 C) and the samples were coded (Lawless & Heymann, 2010). The panellists were also supplied with distilled water and Carr s table water crackers to refresh their palates while moving between different samples. During each training session, the panel was supplied with the control wine sample which stayed constant throughout the training and product analysis phase and was marked as Control. During the training phase, this wine was profiled along with the other wines, however, it was not analysed during the testing phase. The wine used as control was Simonsig Chenin blanc 2010 (Fig. 2). The control sample served as a fixed point which all other samples could be compared to, thereby allowing judges to calibrate their sensory perception at the start of each training and testing session. Figure 2 Simonsig Chenin blanc 2010 was used as control wine during panel training and sensory testing. 45
54 Table 1 Descriptors used for respective sensory attributes. Sensory attributes Intensity Aroma First tier TROPICAL 0 = None, 100 = Prominent tropical aroma Guava 0 = None, 100 = Prominent guava aroma Pineapple 0 = None, 100 = Prominent pineapple aroma Second tier Litchi 0 = None, 100 = Prominent litchi aroma Melon 0 = None, 100 = Prominent melon aroma Passionfruit 0 = None, 100 = Prominent passion fruit aroma Mango 0 = None, 100 = Prominent mango aroma First tier CITRUS 0 = None, 100 = Prominent citrus aroma Lemon 0 = None, 100 = Prominent lemon aroma Second tier Orange (Fruit/Peel) 0 = None, 100 = Prominent orange aroma Grapefruit 0 = None, 100 = Prominent grapefruit aroma First tier STONE FRUIT 0 = None, 100 = Prominent stone fruit aroma Second tier Peach 0 = None, 100 = Prominent peach aroma Apricot 0 = None, 100 = Prominent apricot aroma First tier RICH FRUIT 0 = None, 100 = Prominent rich fruit aroma Marmalade 0 = None, 100 = Prominent marmalade aroma Second tier Compote 0 = None, 100 = Prominent compote aroma Raisin 0 = None, 100 = Prominent raisin aroma First tier FLORAL 0 = None, 100 = Prominent floral aroma Second tier Orange blossom 0 = None, 100 = Prominent orange blossom aroma Honey blossom 0 = None, 100 = Prominent honey blossom aroma First tier SWEET ASSOCIATED 0 = None, 100 = Prominent sweet associated aroma Honey 0 = None, 100 = Prominent honey aroma Second tier Caramel 0 = None, 100 = Prominent caramel aroma Vanilla 0 = None, 100 = Prominent vanilla aroma First tier VEGETATIVE/GREEN 0 = None, 100 = Prominent vegetative/green aroma Second tier Asparagus 0 = None, 100 = Prominent as asparagus aroma First tier WOODY 0 = None, 100 = Prominent woody aroma Planky 0 = None, 100 = Prominent planky aroma Second tier High roast 0 = None, 100 = Prominent high roast aroma Coffee 0 = None, 100 = Prominent coffee aroma First tier NUTTY 0 = None, 100 = Prominent nutty aroma First tier SPICY 0 = None, 100 = Prominent spicy aroma Second tier Sweet spice 0 = None, 100 = Prominent sweet spice aroma Savoury spice 0 = None, 100 = Prominent savoury spice aroma First tier YEASTY 0 = None, 100 = Prominent yeasty aroma Flavour First tier FRESH FRUITY 0 = None,100 = Prominent fresh fruity flavour RIPE/COOKED FRUITY 0 = None,100 = Prominent ripe/cooked fruit flavour VEGETATIVE/GREEN 0 = None,100 = Prominent vegetative/green flavour WOOD 0 = None,100 = Prominent wood flavour Taste First tier SWEET 0 = None,100 = Prominent sweet taste ACIDIC 0 = None,100 = Prominent acidic taste BITTER 0 = None,100 = Prominent bitty taste Mouthfeel First tier ASTRINGENT 0 = None,100 = Prominent degree of astringency 46
55 Sensory testing The analysis of the wines took place in the same light- and temperature-controlled (21 C) sensory laboratory as the training sessions and was done over a period of three days. Panellists performed the analysis in individual booths and standard sensory practices were used throughout the process. Samples were coded with 3-digit codes and served in a complete randomised order (Lawless & Heymann, 2010). Each panellist received a tray with the coded wine samples served in standard ISO wine tasting glasses, each glass containing 30 ml of wine. The glasses were covered with a small petri dish to conserve the aroma in the headspace. Each day, three replicates were completed for the set of wines analysed. On days one and two of the testing phase, eight wines were tested per day. On day 3 of the testing phase, the remaining nine wines were analysed. Compusense Five (Version 5.2, Compusense Inc., Guelph, Ontario, Canada) was used for data collection. This software program was set up to allow panellists to mark the intensity of different attributes on an unstructured 100 mm line scale anchored by the descriptors generated during training Instrumental analyses of aroma compounds and general wine parameters GC-FID was used to quantify the volatile chemical compounds responsible for wine aroma. Chemicals and standards, wine simulant, extraction procedures and instrumental parameters used in the quantification of monoterpenes and major volatiles with GC-FID were in accordance with the methods described by Louw et al. (2009). The monoterpenes quantified with GC-FID were: limonene, fenchone, linalooloxide 1, linalooloxide 2, ± linalool, linalyl acetate, α-terpeneol, citronellol, nerol, geraniol, α-ionone, β-ionone, β- farnesol 1, β-farnesol 2 and β-farnesol 3. The major volatiles quantified with GC-FID were: ethyl acetate, methanol, ethyl butyrate, propanol, isobutanol, isoamyl acetate, butanol, isoamyl alcohol, ethyl hexanoate, hexyl acetate, ethyl lactate, hexanol, ethyl caprylate, acetic acid, propionic acid, iso-butyric acid, ethyl caprate, butyric acid, iso-valeric acid, diethyl succinate, valeric acid, 2-phenylethyl acetate, hexanoic acid, 2- phenylethanol, octanoic acid and decanoic acid. The Winescan FT 120 spectrometer (Foss Analytical, Denmark, 2001) and in-house PLS calibration models were used to quantify general wine parameters. The general wine parameters quantified were: ph, volatile acidity, titratable acidity, glucose, fructose, ethanol, glycerol, acetic acid, tartaric acid, succinic acid and malic acid. The instrumentation and analysis technique used, was in accordance with the methods described by Louw et al. (2009). The calibration models used were developed and described by Nieuwoudt et al. (2004) Statistical analysis procedures The statistical procedures employed for the pre-processing and analysis of the chemical and sensory data are discussed in this section. 47
56 Pre-processing of chemical data Before the data obtained from the GC-FID analyses could be statistically analysed, certain pre-processing steps needed to be followed. For all samples containing components with a concentration below that of its quantification limit, that particular component concentration was replaced with a value equal to its limit of quantification (LOQ). The LOQ is the lowest concentration of a compound at which it can be accurately measured (FDA, 2001) and can be defined as 10σ/s with σ being the standard deviation and s the calibration curve slope (ICH, 1996). The LOQ values of the different compounds quantified with GC-FID are given in Addendum F. After the compounds with a concentration lower than its LOQ value were replaced, the data were used to generate histograms showing the distribution for each individual compound. These histograms were used to evaluate possible outliers, however, before removing the outliers, the minimum and maximum concentration values obtained in the GC-FID analysis were first compared to the values found in literature. Since no prior research have established a comprehensive chemical profile of South African Chenin blanc wines, this dataset had to be compared to the chemical profiles of other white wine cultivars. An aroma database kept by the University of Stellenbosch and the ranges reported in a recently published thesis (Louw, 2007) was used to compare aroma compound concentration ranges. The ranges found in the database included various South African white wine cultivars, while the thesis included young Sauvignon blanc and Chardonnay wines. The data from the Winescan FT 120 spectrometer (Foss Analytical, Denmark, 2001) were also included in the dataset containing the chemical data from the GC-FID analyses Pre-processing of sensory data Data collected during DSA were subjected to certain pre-processing steps to prepare it for multivariate analyses. The first pre-processing step was to examine panel performance using PanelCheck Software (Version 1.3.2, To test the residuals for non-normality, the Shapiro-Wilk test was used (Shapiro & Wilk, 1965). Outliers were identified and removed in the case of significant non-normality (p 0.05) using Statistica software (Statistica 10, StatSoft Inc., Tulsa, Oklahoma, USA). The data were also subjected to STATIS using PanelCheck Software (Version 1.4.0, STATIS is a multivariate technique which is based on RV coefficients and can be used to show agreement between judges and to identify those judges showing the least conformity to the rest of the panel (Næs et al., 2010; Schlich, 1996). Regardless of how well the judges were calibrated during training, individual dissimilarity will always exist (Næs et al., 2010). To ensure that the data for this study were of the best possible quality, the most consistent assessors were selected and used in further statistical analyses. The highest weight in STATIS is given to the judge showing the best correlation to the rest of the panel (Næs et al., 2010). The judges showing the lowest degree of agreement when compared to the rest of the panel members were consequently removed from the dataset prior to further data analyses. 48
57 Statistical analysis of chemical and sensory data Analysis of variance (ANOVA) was performed on the sensory data using Statistica software (Statistica 10, StatSoft Inc., Tulsa, Oklahoma, USA). Student s t least significant difference (LSD) was calculated to see how different wines compare to each other at the 5% level of significance for the sensory attributes. Differences and similarities between wines were also depicted by drawing spider plots of the sensory attributes using Microsoft Excel (Microsoft Office Excel 2007). Principal Component Analysis (PCA) was conducted to illustrate the association between wines and between wines and their intrinsic sensory and chemical characteristics using Statistica software (Statistica 10, StatSoft Inc., Tulsa, Oklahoma, USA). LatentiX Software (Version 2.00, Latent 5, 2008) was also used to colour PCA bi-plots according to different factors. 3. Results and discussion The results obtained from the sensory and chemical methodologies are described and discussed in this section Sensory profile of selected bush vine Chenin blanc wines Descriptive sensory analysis (DSA) was used to determine the sensory profile of a selection of South African Chenin blanc wines produced solely from bush vine vineyards. The data were subjected to several different statistical methodologies to evaluate the panel s performance and to analyse the wines sensory characteristics. 49
58 Attribute selection It is of vital importance that only interpretable and statistically significant variables should be extracted from DSA data. By removing variables showing little significance or importance, the interpretation of PCA plots is simplified and of more significance (Westad et al., 2003). R-squared values give an indication of how well a variable fits a model and how well it explains the variance within the model (McEwan, 1996). The closer the R-squared value is to 1, the more variance is explained by that specific variable. A good rule of thumb to follow when selecting variables, is to choose those explaining more than 50% of the variance in a model (Westad et al., 2003). When the R-squared values corresponding to the first and second tier aroma attributes were calculated, it was found that the aroma attributes rich fruit, tropical, sweet-associated, honey, pineapple, woody, high roast, guava and marmalade, and the flavour attributes ripe/cooked fruit, fresh fruity and wood, explained more than 50% of the variance (R 2 > 0.5) in the PCA model. The two sensory attributes corresponding to the vegetative character did not contribute significantly to the sensory profile of this group of wines when both the first and second tier attributes were taken into account. It was, however, found that the two variables vegetative aroma and vegetative flavour were considered to have a noteworthy effect on the sensory profile of the wines when the R-squared values of only the first tier attributes were considered. According to Noble et al. (1987), first tier attributes are comprehensive and all-inclusive, whereas second tier attributes are more detailed and specific. A PCA bi-plot generated from the DSA data containing only the first tier sensory attributes will be easier to interpret and will show only the major discriminating characteristics, however, when a more detailed representation of the sensory profile is required, a PCA plot generated using both the first and second tier attributes could provide more insight into the total group of sensory characteristics and how they associate with the respective wines (Lawless & Heymann, 2010). For this reason, the variables explaining more than 50% of the variance in the PCA model were used to create two PCA bi-plots. One PCA plot contained both first and second tier sensory attributes (Fig. 3) and the second PCA plot only the first tier attributes (Fig. 9). Both plots will be discussed in the following division Sensory attributes associated with bush vine Chenin blanc wines Fig. 3 includes both first and second tier sensory attributes variables explaining more than 50% (R 2 > 0.5) of the variance within the PCA model. According to Fig. 3, these bush vine Chenin blanc wines can be profiled according to three sub-groups of sensory attributes. The first group includes the sensory attributes fresh fruity flavour and guava, tropical and pineapple aroma, the second group includes the sensory attributes woody and high roast aroma, as well as wood flavour and the third group includes the aroma attributes marmalade, sweet-associated, rich fruit, honey and raisin and the flavour attribute ripe/cooked fruit. The wines that associated with the aroma attributes guava, tropical and pineapple and a fresh fruity flavour are clustered on the left side of PC1 (Fig. 3, cluster A) and the wines associated with the wood, as well as ripe/cooked fruit flavour attributes and the aroma attributes woody, high roast, marmalade, sweetassociated, rich fruit, honey and raisin are clustered on the right side of PC1 (Fig. 3, cluster B). 50
59 The sensory attributes describing the wines in cluster A (Fig. 3), are similar to the Fresh and Fruity wine style, as advocated by the Chenin blanc Association of South Africa (CBA, n.d.). Similarly, the wines in cluster B can be described by sensory attributes associated with the Rich and Ripe style of Chenin blanc. There, however, appears to be no distinct separation between the wines in cluster B, even though the CBA distinguishes between two separate Rich and Ripe styles, i.e. wooded or unwooded. One would expect that the Rich and Ripe wooded wines would cluster together near the woody aroma and woody flavour sensory attributes on the PCA bi-plot (Fig. 3), but this seems not to be the case. Since there is no clear-cut separation between the Rich and Ripe wooded and Rich and Ripe unwooded wines contained within cluster B, it can be assumed that there are Rich and Ripe wooded wines with dominant woody notes and some where the rich fruity flavours dominate the sensory profile of these wines. It thus seems that the woody character only contributes to the complexity of the wine. To illustrate this, spider web plots (Fig. 4) were generated from the DSA data for the wines contained within cluster B on the PCA bi-plot (Fig. 3). Fig. 4a contains the wines positioned nearest to the woody attributes on the PCA bi-plot, whereas Fig. 4b contains the wines positioned nearest to the rich fruit attributes. It can be seen that irrespective of a wine s association with rich fruit or wooded attributes in the PCA bi-plot, the wines contained in cluster B of Fig. 3 are influenced by both woody and rich fruit attributes. According to Fig. 4a, all the wines contained in the woody quadrant possess the sensory attributes rich fruit aroma and ripe/cooked fruit flavour with intensity scores of at least 20 out of a 100 and the woody aroma ranging between approximately 25 and 50 out of a 100. According to Fig. 4b, the wines contained in the ripe fruit quadrant possess the sensory attributes woody aroma at intensity scores of no less than 10 out of a 100. The attribute wood flavour, however, seems to range from very low intensity scores (scores below 5), as can be seen for Wine 14, to quite high intensity scores (scores above 30) as for Wine 25. It is thus evident that the lack of distinct separation between the Rich and Ripe wooded and Rich and Ripe unwooded wines is the result of the fact that some of the wines on the right side of PC1 possess both strong woody and strong rich fruit characters. To evaluate the wines in cluster B (Fig. 3) in more detail, four LS Means plots were generated (Fig. 5) showing the significant differences between the aroma attributes rich fruit, sweet-associated, woody and also honey. Wines situated near the woody attributes in the PCA bi-plot (Fig. 3) are indicated in red and the wines situated near the rich fruit/sweet associated attributes are indicated in blue on the four LS Means plots. According to Fig. 5a, b and d, it seems that there are limited significant differences between the means of the wines coloured in red for the attributes rich fruit aroma, sweet-associated and honey aroma. A similar tendency is demonstrated for the wines coloured in blue for the mentioned attributes. This shows that these bush vine Chenin blanc wines produced to represent the styles Rich and Ripe wooded or Rich and Ripe unwooded, have reasonably similar intensities for the attributes rich fruit aroma, sweet-associated, and honey aroma. The latter is, however, not the case for the attribute wooded aroma. Although not significant in all instances, the wines coloured in red have higher intensities for the attribute woody aroma and the wines coloured in blue illustrate much lower intensities for woody aroma (Fig. 5c). From these results it can again be deduced that a varying intensity of wood, as well as rich fruit characteristics, and not the presence or absence of a woody characteristic, influence the positioning of the wines on the PCA bi-plot (Fig. 3). The presence of woody aroma is a result of wood contact either during barrel fermentation or barrel ageing (Gibson, 2010). Wood contact adds to the complexity of a white wine and complements other wine flavours 51
60 without overshadowing them; however, fresh and fruity attributes of a wine are usually dulled by the use of barrel fermentation or ageing (Gibson, 2010). F_WOOD A_WOODY A_High roast B 4 12 PC2(7.9) A_Guava F_FRESH FRUITY A_TROPICAL A_Pineapple F_RIPE/COOKED FRUIT A A_Marmalade A_SWEET ASSOCIATED 11 A_RICH FRUIT PC1(82.1) A_Raisin A_Honey scores loadings Figure 3 PCA bi-plot illustrating the interrelationship between wines and their sensory attributes generated from DSA data using first and second tier attributes explaining more than 50% of the variance. PC1 explains 82.1% and PC2 7.9% of the variance. The letters A and F in the sensory attribute labels refer to aroma and flavour, respectively. Sensory descriptors indicated in capital letters refer to first tier attributes, and those in lower case to second tier attributes. The wines are represented with a marker labelled with a code from 1 to 25. Two clusters seem to separate on PC1 with cluster A associating with fresh fruity and tropical sensory attributes and cluster B associating with woody, rich fruit and sweet associated sensory attributes. 52
61 a) F_WOOD A_TROPICAL 50 A_Guava F_VEGETATIVE F_RIPE/COOKED FRUIT A_Pineapple A_RICH FRUIT Wine 4 Wine 5 Wine 7 F_FRESH FRUITY 0 A_Marmalade Wine 12 Wine 17 Wine 22 A_High roast A_Raisin Wine 23 A_WOODY A_VEGETATIVE A_Honey A_SWEET ASSOCIATED b) F_WOOD A_TROPICAL 50 A_Guava F_VEGETATIVE A_Pineapple F_RIPE/COOKED FRUIT F_FRESH FRUITY A_RICH FRUIT A_Marmalade Wine 11 Wine 14 Wine 16 Wine 20 Wine 21 A_High roast A_Raisin Wine 25 A_WOODY A_VEGETATIVE A_Honey A_SWEET ASSOCIATED Figure 4 Spider web plots showing the latent sensory attributes influencing the position of the wines associated with the Rich and Ripe cluster of wines situated in the a) woody quadrant and b) the ripe fruit quadrant of the PCA bi-plot. The letters A and F in the sensory attribute labels refer to aroma and flavour, respectively. Sensory descriptors indicated in capital letters refer to first tier attributes, and those in lower case to second tier attributes. The wines are labelled with codes ranging from 1 to
62 a) 60 Samp-Desc; LS Means Current effect: F(24, 50)=31.027, p= Type III decomposition Vertical bars denote 0.95 confidence intervals A_RICH FRUIT lm kl jk efg def abcd m cde ijk lm abc cde def fgh klm lm m lm klm bcde a ghi hij ab a Wines b) A_SWEET ASSOCIATED Samp-Desc; LS Means Current effect: F(24, 50)=12.008, p= Type III decomposition Vertical bars denote 0.95 confidence intervals a bc ab bc bcd bcd bcd bcde bcd cdef defg defg efgh ghi fghi fghi fghi ijk hij hij ijk ijk k jk k Wines 54
63 c) Samp-Desc; LS Means Current effect: F(24, 50)=38.526, p= Type III decomposition Vertical bars denote 0.95 confidence intervals a A_WOODY k hij ijk cde bc ijk b jk k k hi ef cd gh hij k jk jk jk fg def jk b bc Wines d) 30 Samp-Desc; LS Means Current effect: F(24, 50)=10.368, p= Type III decomposition Vertical bars denote 0.95 confidence intervals A_Honey ijkl hijkl hijkl fghij efghi ab hijkl bcde ghijkl jkl kl abcd bcde cdef defg efghi l l jkl abc a ab efgh fghijk a Wines Figure 5 LS Means plots showing how wines contained in the woody quadrant (coloured red) and the rich fruit quadrant (coloured light blue) differ with regards to a) rich fruit aroma, b) sweet-associated aroma, c) woody aroma and d) honey aroma. Sensory descriptors indicated in capital letters refer to first tier attributes, and those in lower case to second tier attributes. The wines range from 1 to
64 The above-mentioned PCA results thus indicate that this group of 25 Chenin blanc wines produced from bush vines do not clearly segment in the three Chenin blanc wine styles, i.e. Fresh and Fruity, Rich and Ripe wooded and Rich and Ripe unwooded. Although these styles are accepted and acknowledged by CBA, no defining attributes have been established to assist winemakers to classify or characterise their wines. It could be argued that by assigning each Chenin blanc style with a list of descriptors, winemakers could feel restricted or constrained and that it would influence the uniqueness of their wines. The respective winemakers and/or viticulturists of the 25 bush vine Chenin blanc wines used in this study were asked to assign each of the wines with a style description using only Fresh and Fruity and Rich and Ripe as options (Addendum B). By colouring each of the wines in the PCA scores plot (Fig 6a) according to the winemakers style descriptions (Fresh and Fruity or Rich and Ripe), one can evaluate how the winemakers or viticulturists style definition associate with the actual sensory descriptors of the respective wines (Fig. 6b) as determined by DSA. The winemakers of the respective wines were also asked whether or not the wine received any wood contact (Addendum B). They were, however, not obliged to specify the details of the wood contact, i.e. origin and type of barrel, oak chips or staves, time spent in barrel, etc. Similarly, the individual wines in the PCA scores plot (Fig. 7a) were coloured according to whether or not the wines received any wood contact or not. The PCA plots were generated and coloured using LatentiX Software (Version 2.00, Latent 5, 2008). According to Fig. 6a, the majority of the wines positioned on the left side of the PCA bi-plot (cluster A, Fig. 3) were categorised by the winemakers as being Fresh and Fruity (indicated in blue). This signifies that the perception that the winemakers have of their own wine corresponds with the actual fresh, fruity attributes indicated on the left side of the PCA loadings plot (Fig. 6b). There is, however, one wine (Wine 11) that is positioned near the ripe fruit sensory attributes. Even though the winemaker regarded this wine as a Fresh and Fruity style of Chenin blanc, the DSA results show that Wine 11 was perceived as having more ripe/cooked fruit flavours and rich fruit aromas (Fig. 6). Interestingly, when considering the tasting notes on the back label of Wine 11, this wine was described as having rich tropical fruit flavours (Addendum B). One could argue that the winemaker s perception of a Fresh and Fruity style Chenin blanc wine style also includes flavours of rich tropical fruit, whereas the DSA resulted in this wine being grouped in the cluster containing the majority of the Rich and Ripe wines. Wines 2, 3, 6, 13 and 15 which, according to their winemakers, belong to the Rich and Ripe style, however, as determined by DSA (Fig. 6), were grouped together with all the Fresh and Fruity wines. Again, it could be speculated that the winemakers perception of a Rich and Ripe style Chenin blanc is much broader than that advocated by the CBA. It was discerned that all of the Rich and Ripe wines (Wines 2, 3, 6, 13 and 15) had an alcohol content of 14% and higher (Addendum B). All the other wines in this Fresh and Fruity group, except for Wine 8 which also has an alcohol content of 14%, possess alcohol levels of less than 14%. At the 2011 CBA Conference (CBA Conference 2011, Stellenbosch, SA), it was clear that winemakers regard a wine with an alcohol percentage of 14% or more as having a Rich and Ripe style. This was apparent during the tutored tasting, led by Jeff Grier from Villiera Wines (Stellenbosch, SA), where many remarks were evoked from the audience concerning the different styles of Chenin blanc and how alcohol content may be used to decide to which style a Chenin blanc wine belongs. It is known that alcohol influences the texture of a wine by increasing wine viscosity and decreasing the harshness of tannins 56
65 (Fontoin et al., 2008). Studies have shown that higher alcohol wines tend to have a longer lasting aftertaste and a greater variety of stronger aromas (Meillon et al., 2010), resulting in full-bodied wines with an improved overall aroma (Jones et al., 2008). It is therefore quite understandable why wines with higher alcohol levels might be regarded as having a Rich and Ripe style opposed to a Fresh and Fruity style of Chenin blanc. Another aspect with the potential of influencing a wine s mouthfeel and aroma, and thus its style, is wood contact (Harrington, 2008). According to the PCA scores plot (Fig. 7a) it can be seen that the majority of the wines that did receive wood contact are positioned in cluster B along with the majority of the Rich and Ripe style wines (Fig. 3). This is because wood contact is able to mask the intense fruity character (Ribéreau-Gayon et al., 2006) and this could be the reason for the wines to move away from the fresh, fruity attributes (left side of the PCA bi-plot, Fig. 3) towards the right side where rich flavours dominate. There are, however, three wines positioned in the fresh fruity side of the PCA bi-plot (Fig. 3) that were labelled by the winemakers as being wooded, i.e. Wines 6, 8 and 15. From a descriptive sensory point of view, the fresh, fruity aroma and flavours dominated in these wines and, as already mentioned, they form part of the Fresh and Fruity group (cluster A, Fig. 3). The position of Wines 6, 8 and 15 can thus be explained by the fact that the sensory impact of wood contact is overshadowed by other factors. Even though these wines received wood contact during some stage of winemaking, the fresh and fruity character of the wines was not compromised (Gibson, 2010). It was stated on the back label that Wine 15 was barrel fermented. It has been proven that wood contact after alcoholic fermentation results in wine with stronger wood aroma attributes than wines undergoing barrel fermentation (Chatonnet et al., 1992). Barrel fermentation, such as employed during the production of Wine 15, resulted in less pronounced wood characteristics in the final wine allowing the more fresh fruity characteristics to dominate. It was, however, established that both Wines 6 and 8 have had lees contact during the winemaking process (Addendum B). Lees contact after alcoholic fermentation influences the aroma characteristics imparted by wood. On-lees ageing of wooded white wines cause the wood character to become better integrated and less pronounced (Chatonnet et al., 1992). Many studies have shown that the sensory quality of a wine improves when there has been lees contact (Doco et al., 2003; Lubbers et al., 1994; Salmon et al., 2002). It was also noticed that two of the wooded wines, Wines 6 and 15, were from the 2010 vintage (Addendum B). A young wine, as opposed to a wine from an older vintage (vintages 2008 and 2009), tend to have more prominent fruity aromas and this profile can decrease as the wine matures (Chrisholm et al., 1995; Gibson, 2010; Moio et al., 2004). The change in fruity character can be attributed to the chemical changes taking place during the first few years of ageing as the result of hydrolysis, esterification, oxidation and redox reactions (Camara et al., 2006; Fisher, 2007). These changes will be discussed in more detail when the chemical profile of the bush vine Chenin blanc wines are examined. The sensory modification occurring in a wine during maturation and ageing is evident when the wines were coloured according to their vintage in the PCA scores plot (Fig. 8a). According to Fig. 8, wines from the youngest vintage (2010 vintage) are situated in close proximity to the sensory attributes logically associated with the Fresh and Fruity style of Chenin blanc. These sensory attributes are the aroma attributes guava, tropical and pineapple aroma and the flavour attribute fresh fruity. In the case of the older vintages, the sensory characteristics gradually move away from the sensory attributes associated with the 2010 vintage wines and more in the direction of the ripe fruit and woody sensory attributes. The 2008 vintage wines were furthest away from the fresh fruit attributes. Even though only four wines from the
66 vintage were included in this study, a very definite trend can be seen. The wines belonging to the 2009 vintage seem to lie in the centre of the plot showing that these wines associate with both the fresh fruity side, as well as the wooded/rich fruit side of the PCA plot (Fig. 8). The majority of the wines chosen for this study do, however, lie more to the right side of the PCA plot (Fig. 8) showing a stronger association between the 2009 wines and the wooded/rich fruit sensory attributes. The reason for the gradual move of these wines away from the fresh fruity sensory attributes in the direction of the rich fruit sensory attributes can be explained by the chemical change in volatile aroma compounds during wine ageing (Fisher, 2007; Gibson, 2010; Ribéreau-Gayon et al., 2006). The change in fresh fruit character in wine was described by Harrington (2008) as related to the sensory changes a fresh fruit will undergo when left to either age or dry. Even though the fruit s flavour, aroma and colour will be completely different to that of the fresh fruit, it can still be described as being pleasant. This gradual change in white wine aroma from fresh fruity characteristics to a wine with a strong dried fruit aroma was also noticed by Oliveira et al. (2008) where Alvarinho wines were aged and subjected to sensory analysis after a period of 8 and 20 months. Alvarinho wines, a white wine cultivar popular in Portugal, is known for producing quality monovarietal wines with fresh, floral and fruity flavours. After 8 months of ageing, these wines still possessed high floral, tropical fruit, tree fruit and citrus aromas. These fresh, floral and fruity aromas did, however, diminish after 20 months of ageing and gave way to dried fruit and vegetal aromas (Oliveira et al., 2008). When comparing the style classifications allocated to the wines in our study by the wines respective winemakers or viticulturists, it is clear that these styles do not always match up with the sensory characteristics indicated by DSA (Fig. 6). Even though the three dry Chenin blanc styles are acknowledged by the majority of the South African wine industry, no distinct sensory terms or specifications have been formulated for the three different styles. The absence of specifications for the different Chenin blanc styles might be the reason for the mismatched style perception when considering the sensory results of DSA and the styles assigned to the wines by the winemakers or viticulturists. Since no specific definitions are available to guide winemakers as to which style a Chenin blanc belongs to, winemakers are free to interpret the styles as they see fit. This, however, might prove to be problematic when it comes to consumer perception. Wine labels are often the only medium used to communicate with the consumer, since it is most economical (Rocchi & Stefani, 2005). If a consumer is unable to match the perceptions created by the winemaker on the wine label when they consume the wine, unfavourable consumer reactions may result (Deliza & MacFie, 1996). The effect of mismatched perceptions and sensory experiences will be discussed in Chapter 5 in more detail. A further aspect of interest in this group of bush vine Chenin blanc wines, is that some of the wines illustrated a degree of vegetative aroma and flavour (Fig. 9). This vegetative characteristic was, however, found to be quite pleasant and not at all negative. Fig. 9 is a PCA bi-plot generated using only the first tier attributes selected during a variable selection step to find the sensory variables explaining more than 50% (R 2 > 0.5) of the variance in the PCA model. All the first tier attributes indicated in Fig. 3 have again been selected to be included in the PCA bi-plot illustrated in Fig. 9; however, this PCA bi-plot also includes the sensory attributes vegetative flavour and vegetative aroma. Interestingly, the definite separation into two groups that is evident in Fig. 3 is not so apparent in Fig. 9, mainly as a result of the vegetative aroma and flavour coming into play. According to Fig. 9, the distribution of some wines, wines from both the Fresh and Fruity and the Rich and Ripe groups, moved away from their respective groups and in the direction of the 58
67 vegetative attributes. These wines are Wines 2, 10, 14, and 18. Many factors can influence the vegetative aroma and flavour in a wine and include both viticultural and oenological practices. No information on the vegetative aroma and flavour of Chenin blanc is currently available and is certainly a matter that needs to be studied in more detail. The wines with the most pronounced vegetative flavour and aroma were produced from grapes grown in Wellington (Wine 2), Darling (Wine 10) and Stellenbosch (Wines 14 and 18) (Addendum B). The Wellington winegrowing ward falls under the Paarl district which is considered a hot climate production area (Anon., 2011; Anon., 2012). The other two winegrowing areas, Darling and Stellenbosch, receive cooling sea breezes which can lower the temperatures of elevated vineyards (Anon., 2012). Cabernet Sauvignon have shown a tendency to develop vegetative aromas when cultivated in cool climates (Heymann & Noble, 1987). It might be that Wines 10, 14 and 18 may have developed vegetative sensory qualities because of the cooler climate in which they were cultivated. Another study on the vegetative character in Cabernet Sauvignon wine showed that wine produced from younger vines tend to possess increased intensities of this vegetal character. The ages of the vines used in the Cabernet Sauvignon study ranged from 5 to older than 25 years, however, it was never specified at which age the wine s vegetative characteristics decrease and gave way to fruity flavours and berry aromas (Heymann & Noble, 1987). In our study, Wines 2, 10 and 14 are all produced from vines older than 25 years in age (Addendum B). Wine 18, however, was produced using the grapes from vineyards ranging in age from 15 to 25 and younger (Addendum B). Since the vineyards used for producing Wine 18 were younger than the vines used for producing Wines 2, 10 and 14, there might be a possibility of vine age resulting in a detectable vegetative character. Skin contact has also been proved to increase the vegetative aroma in Verdejo white wines (Sánchez-Palomo et al., 2010). All the vegetative wines, except for Wine 2, received skin contact during the winemaking process (Addendum B). It might be that skin contact may have contributed to the development of vegetative aromas and flavours in Wines 10, 14 and 18. An increase in vegetative aroma has also been noticed in aged wines. After 3 years of bottle ageing, Vidal blanc wines developed prominent vegetative aromas (Chrisholm et al., 1995). When looking at the vintages of the five vegetative wines, it can be seen that Wines 10 and 18 are from the 2010 vintage. The other wines, Wines 2 and 14, are from older vintages (2009 vintage), which might explain the presence of a vegetative character (Addendum B). 59
68 a) PCA Scores [Model 1] Scores PC#2 (10.385%) Scores PC#1 (77.778%) b) PCA Loadings [Model 1] A_WOODY A_High F_WOOD roast Loadings PC#2 (10.385%) A_Guava F_FRESH FRUITY A_TROPICAL A_Pineapple F_RIPE/COOKED FRUIT A_Marmalade A_RICH FRUIT A_SWEET ASSOCIATED A_Honey A_Raisin Loadings PC#1 (77.778%) Figure 6 PCA a) scores and b) loadings plot coloured according to the styles assigned to the wines by their respective winemakers and viticulturists. The letters A and F in the sensory attribute labels on the loadings plot refer to aroma and flavour, respectively. Sensory descriptors indicated in capital letters refer to first tier attributes, and those in lower case to second tier attributes. The wines in the scores plot are represented with a marker labelled with a code from 1 to 25. Fresh and Fruity style wines are indicated in blue and Rich and Ripe style wines are indicated in purple. 60
69 a) PCA Scores [Model 1] Scores PC#2 (10.385%) Scores PC#1 (77.778%) b) PCA Loadings [Model 1] A_WOODY A_High F_WOOD roast Loadings PC#2 (10.385%) A_Guava F_FRESH FRUITY A_TROPICAL A_Pineapple F_RIPE/COOKED FRUIT A_Marmalade A_RICH FRUIT A_SWEET ASSOCIATED A_Honey A_Raisin Loadings PC#1 (77.778%) Figure 7 PCA a) scores and b) loadings plot coloured according to whether or not the wines received any wood contact during the winemaking process. The letters A and F in the sensory attribute labels on the loadings plot refer to aroma and flavour respectively. Sensory descriptors indicated in capital letters refer to first tier attributes, and those in lower case to second tier attributes. The wines in the scores plot are represented with a marker labelled with a code from 1 to 25. Wooded wines are indicated in purple and unwooded wines are indicated in blue. 61
70 a) PCA Scores [Model 1] Scores PC#2 (10.385%) Scores PC#1 (77.778%) b) PCA Loadings [Model 2] A_WOODY A_High F_WOOD roast Loadings PC#2 (10.385%) A_Guava F_FRESH FRUITY A_TROPICAL A_Pineapple F_RIPE/COOKED FRUIT A_Marmalade A_RICH FRUIT A_SWEET ASSOCIATED A_Honey A_Raisin Loadings PC#1 (77.778%) Figure 8 PCA a) scores and b) loadings plot coloured according to vintage. The letters A and F in the sensory attribute labels on the loadings plot refer to aroma and flavour respectively. Sensory descriptors indicated in capital letters refer to first tier attributes, and those in lower case to second tier attributes. The wines in the scores plot are represented with a marker labelled with a code from 1 to 25. Wines from the 2010 vintage are indicated in maroon, wines from the 2009 vintage are indicated in green and wines from the 2008 vintage are indicated in navy. 62
71 F_VEGETATIVE A_VEGETATIVE A_WOODY PC2(7.9) F_WOOD F_RIPE/COOKED FRUIT 3 25 F_FRESH FRUITY A_TROPICAL A_RICH FRUIT 24 PC1(82.3) A_SWEET ASSOCIATED scores loadings Figure 9 PCA bi-plot illustrating the interrelationship between wines and their sensory attributes generated from DSA data using only first tier attributes explaining more than 50% of the variance. PC1 explains 82.3% and PC2 7.9% of the variance between the different wines. The letters A and F in the sensory attribute labels refer to aroma and flavour respectively. The wines are represented with a marker labelled with a code from 1 to Chemical profile of selected bush vine Chenin blanc wines The chemical profile of a selection of South African Chenin blanc wines, produced exclusively from vineyards trained to bush vines, was determined using GC-FID and FTMIR spectroscopic methods. These analytical methods quantified the major volatile and monoterpene content of the wines, as well as the major wine quality parameters. The results from the GC-FID and FTMIR analyses are given in Tables 2 to 6. These tables include the concentration ranges of all the chemical compounds and parameters analysed for the 25 bush vine Chenin blanc wines included in this study. Also included in these tables are the average, standard deviation (SD) and odour threshold (OTH) for each compound. The average and SD values were calculated by replacing all the values below the limit of quantification (LOQ) with the actual LOQ value of that particular compound. In Tables 2 to 6, the compounds which were found to be present at levels below their LOQ are indicated as. The OTH values were taken from literature. The concentration ranges for the monoterpene compounds limonene, fenchone and citronellol, were not included in these tables as none of the wines contained levels above the LOQ. 63
72 Table 2 Ranges of general wine parameters as measured using FTMIR. Concentrations are given in g/l unless otherwise specified. Stellenbosch University Wines ph Ethanol (% v/v) Volatile acid Total acid Malic acid Tartaric acid Succinic acid Glucose Fructose Glycerol Range Average SD SD: Standard Deviation 64
73 Table 3 Concentration ranges for all the esters analysed using GC-FID. Concentrations are given in mg/l. Wines 2-Phenylethyl acetate Diethyl succinate Ethyl acetate Ethyl butyrate Ethyl caprate Ethyl caprylate Ethyl hexanoate Ethyl lactate Hexyl acetate Isoamyl acetate Range Average SD OTH 0.25 c a 7.5 c 0.02 c n/a n/a c b 1.50 a 0.03 c SD: Standard Deviation; OTH: Odour threshold (mg/l); n/a: not available; a Etiévant (1991); b Ferreira et al. (2002); c Guth (1997) 65
74 Table 4 Concentration ranges for all the alcohols analysed using GC-FID. Concentrations are given in mg/l. Wines 2-Phenyl ethanol Butanol Hexanol Isoamyl alcohol Isobutanol Methanol Propanol Range Average SD OTH b a 8.00 b b b n/a c SD: Standard Deviation; OTH: Odour threshold (mg/l); n/a: not available; a Etiévant (1991); b Guth (1997); c Peinado et al. (2004) 66
75 Table 5 Concentration ranges for all the acids analysed using GC-FID. Concentrations are given in mg/l. Wines Acetic acid Butyric acid Decanoic acid Hexanoic acid Isobutyric acid Isovaleric acid Octanoic acid Propionic acid Valeric acid Range Average SD OTH b b b 0.42 a 2.30 a a 0.50 a c n/a SD: Standard Deviation; OTH: Odour threshold (mg/l); n/a: not available; a Ferreira et al. (2000); b Guth (1997); c Lambrechts & Pretorius (2000) 67
76 Table 6 Concentration ranges for all the monoterpenes analysed using GC-FID. Concentrations are given in µg/l. Linalool oxide 1 Linalool oxide 2 ± Linalool Linalyl acetate ɑ -terpineol Nerol Geraniol α-ionone β-ionone β-farnesol 1 β-farnesol 2 β-farnesol Wines 68
77 Linalool oxide 1 Linalool oxide 2 ± Linalool Linalyl acetate ɑ-terpineol Nerol Geraniol ɑ-ionone β-ionone β-farnesol 1 β-farnesol 2 β-farnesol Average SD > c > c 15.00b n/a a c 30.00b n/a 0.09a n/a n/a n/a Wines Range OTH SD: Standard Deviation; OTH: Odour threshold (µg/l); n/a: not available; a Ferreira et al. (2000); b Guth (1997); c Ribéreau-Gayon et al. (1975) 69
78 Variable selection To simplify the interpretation of a PCA plot, variables showing little significance in the explanatory power of a PCA model can be removed. Again, the R-squared values were used to select only variables explaining more than 50% of the variance in a PCA model (Westad et al., 2003). After the variables with R-squared values exceeding 0.5 were selected, a PCA bi-plot was generated (Fig. 10). This PCA bi-plot (Fig. 10) contains the chemical variables ± linalool, octanoic acid, hexanoic acid, ethyl butyrate, 2-phenylethyl acetate, isoamyl acetate, hexyl acetate and malic acid. In a similar fashion, variable selection was repeated for a second and third time to supply the following PCA bi-plots: Fig. 11 was generated from the variables selected from the second variable selection step. This PCA bi-plot contains the chemical compounds succinic acid, diethyl succinate, 2-phenyl ethanol, isobutanol, isobutyric acid, volatile acidity, acetic acid and ethyl acetate. Fig. 12 was generated from the variables selected from the third variable selection step. This PCA bi-plot contains the chemical compounds total acid, β-ionone, ethanol, geraniol, ethyl hexanoate and linalyl acetate. Since such a large set of chemical parameters were analysed, much of the underlying information would have been lost if variable selection only occurred once. By repeating the variable selection procedure three times, the majority of the significant information could be extracted from the data Chemical attributes associated with bush vine Chenin blanc wines Fig. 10 shows the PCA bi-plot of the 25 wines and how they are distributed when explained by the variables selected during the first step of variable selection. According to Fig. 10, the majority of the wines (indicated as cluster A, Fig. 10) are situated on the right side of the PCA bi-plot. Here, wines are associated with the chemical attribute ± linalool. Wine 16 appears to be completely detached from the rest of the wines in cluster A. Wine 16 shows the highest extent of association with the chemical compounds hexanoic and octanoic acid. There is also a certain degree of grouping with some wines dissociating from cluster A and associating more with the chemical attributes ethyl butyrate, 2-phenylethyl acetate, isoamyl acetate and hexyl acetate. This second cluster (cluster B, Fig. 10) contains Wines 1, 3, 6, 13, 18 and 19. Malic acid is also present in this PCA bi-plot, and seems to be associated more with the wines in cluster B (Fig. 10). It is interesting to note that all of the wines included in cluster A were from the Fresh and Fruity style (as designated to the wines from the DSA results) and that cluster B contained both Rich and Ripe and Fresh and Fruity style wines. On PC1 of Fig. 10, the wines seemed to be separated by one monoterpene and a group of esters. The monoterpene on the right side of PC1 is ± linalool, and the esters on the left side of PC1 include ethyl butyrate, 2-phenylethyl acetate, isoamyl acetate and hexyl acetate. The monoterpene ± linalool, present as glycoconjugates in the grape berry, is freed during alcoholic fermentation (Bell & Henschke, 2005). This compound is known to impart floral aromas to a wine (Francis & Newton, 2005). 70
79 Octanoic Acid Hexanoic Acid A 16 PC2 (27%) 2-Phenylethyl Acetate Ethyl Butyrate Isoamyl Acetate Hexyl Acetate B Linalool MalicAcid PC1 (53%) Figure 10 PCA bi-plot generated using the chemical variables selected during the first variable selection step. Two groups seem to separate on PC1 with cluster A associating with two acids and a monoterpene and cluster B associating with Malic acid and a group of esters. PC2 of Fig. 10, on the other hand, is separated by malic acid at the bottom and hexanoic acid and octanoic acid on the top of the plot. Hexanoic acid and octanoic acid are volatile fatty acids which can impart a sweaty or cheesy aroma to wine (Francis & Newton, 2005), however, this undesirable aroma impact is only apparent at concentrations exceeding 20 mg/l (Ribéreau-Gayon et al., 2006). In these wines, the octanoic acid concentration ranges from 6.26 to mg/l and the hexanoic acid concentration from 4.46 to 7.01 mg/l, which are well below 20 mg/l. Even though these volatile fatty acids are present below the concentration at which it becomes unpleasant, they are present at levels above their odour threshold which is 0.42 mg/l for hexanoic acid and 0.50 mg/l for octanoic acid (Table 5). In small quantities, volatile fatty acids contribute to the aromatic equilibrium or balance of a wine, since these compounds counter the hydrolysis of their esters (Bertrand, 1981; Edwards et al., 1990; Flanzy, 2003). Wine 16 is the only wine that has a strong association with the two volatile fatty acids, octanoic acid and hexanoic acid. The reason for Wine 16 being so much removed from the rest of the wines and for having such high hexanoic acid and octanoic acid concentrations might be explained by the yeast strains used to ferment this particular wine. Wine 16 was fermented using Vin 7, Vin 13 and NT 116 and was the only wine in the sample set produced using the yeast strain NT 116 (Addendum B). All three yeast strains used for the production of Wine 16 are recommended for Chenin blanc wine production according to a producer s specification sheet (Addendum 71
80 G). Yeast strains used in wine production are known to influence the formation of volatile fatty acids (Ugliano & Henschke, 2009). Along with the yeast strain, fermentation conditions and must composition can also manipulate the volatile fatty acid contents of a wine (Ugliano & Henschke, 2009). Since Wine 16 is the only wine produced using the yeast strain NT 116 and the yeast strain is known to affect the volatile fatty acid content of a wine, the yeast strain NT 116 could possibly be the reason for Wine 16 having such high hexanoic acid and octanoic acid concentrations. Whether or not the hexanoic acid and octanoic acid production of NT 116 used in conjunction with other yeast strains are higher than with any other wine yeast or yeast strain combination, should be researched. Wines 1, 3, 6, 13, 18 and 19 are all grouped near the ester compounds and marked in Fig. 10 as cluster B. Esters are important contributors to wine aroma derived from fermentation and are responsible for fruity aroma attributes (Bell & Henschke, 2005). It is also known that the influence of esters on wine aroma is defined by the group rather than the individual esters (Francis & Newton, 2005; Van der Merwe & Van Wyk, 1981). The wines found in cluster B are all from the 2010 vintage which indicates that these wines were relatively young at the time they were subjected to chemical analyses. Both ethyl esters and acetate esters concentrations decrease during ageing as a result of hydrolysis, which leads to a loss of fruitiness (Chrisholm et al., 1995; Liberatore et al., 2010; Ramey & Ough, 1980). Even though malic acid, since it is a non-volatile acid, does not actively contribute to wine aroma, it still plays and important part in a wine s sensory quality. Wines with a low malic acid concentration are perceived as having a flat flavour and are also at risk of microbial spoilage (Jackson, 2008; Volschenk et al., 2006). Wines with the highest malic acid concentrations are Wines 1, 8, 9, 13, 19, 21, 22 and 24 (Table 2). Malic acid in also known to decrease with grape maturation (Bakker & Clarke, 2012). This is even more evident in warm regions where hotter weather conditions result in even more malic acid elimination from the grape during the ripening process (Volschenk et al., 2006). Grapes from hotter areas tend to have lower malic acid concentrations than those grown in coastal areas where the vineyards can experience the effects of the cooling sea air (Volschenk et al., 2006). Malic acid concentration can also be decreased by malolactic fermentation (MLF) where malic acid is converted to lactic acid (Bakker & Clarke, 2012). The wines showing the strongest association with malic acid in Fig. 10 do not seem to have particularly high levels of malic acid. The chemical analysis showed that the malic acid content of all the wines analysed ranged from 0.79 to 4.19 g/l (Table 2). South African young Sauvignon blanc and Chardonnay wines were reported to have malic acid levels ranging from 0.39 to 5.8 g/l (Louw, 2007). Another study reported malic acid levels for a vast selection of white wines produced in Slovenia to be as high as 6.07 g/l (Kordiš-Krapež et al., 2001). It is thus clear that the bush vine Chenin blanc wines included in this study all have malic acid levels which can be considered standard for white wines. Fig. 11 includes all of the 25 wines and the chemical attributes selected in the second variable selection step. The majority of the wines are distributed near the centre of the PCA bi-plot with some wines appearing to be more separated from this centre cluster than others. Wine 12, situated on the left side of the plot, shows the strongest association with the chemical attributes volatile acidity and acetic acid. The proximity of Wine 12 shows that this wine, because of its high volatile acidity and acetic acid concentration, is completely different to the other wines analysed in this study. Wines 6, 11, 18 and 25 are also removed 72
81 from the centre cluster. These wines associate more with the chemical attributes succinic acid, diethyl succinate and 2-phenyl ethanol. Succinic acid, which is the main organic acid produced by yeasts (Volschenk et al., 2006), can be seen on the right side of the PCA bi-plot (Fig. 11). Even though small amounts of succinic acid are present in wine grapes, the majority of the succinic acid is produced during fermentation (Belitz & Grosch, 1992; Bell & Henschke, 2005; Peynaud, 1999). The wine yeast Saccharomyces cerevisiae is known to produce varying levels of succinic acid, but other Saccharomyces strains such as S. bayanus and S. uvarum also tend to result in high levels of succinic acid production (Antonelli et al., 1999; Eglinton et al., 2000; Giudici et al., 1995; Radler, 1993). Other than yeast strain, fermentation conditions also influences the amount of succinic acid produced. These fermentation conditions include fermentation temperature, must composition and clarity, ph, acidity, SO 2 and biotin content (Coulter et al., 2004). According to the PCA bi-plot (Fig. 11), Wines 6, 11, 18 and 25 have the highest succinic acid concentrations, however, when the chemical data (Table 2) is examined, it is seen that Wine 20 also contains higher levels of succinic acid. Wine 20 was fermented using a combination of commercial yeasts (Addendum B). This combination includes the strain S. bayanus, available as Lalvin QA 23 (Addendum G), which is known for its elevated production of succinic acid. Wine 25 was produced using spontaneous fermentation. Spontaneous fermentation uses the natural yeasts and bacteria present in the vineyard or on cellar equipment to produce more complex wines with original flavours (Le Jeune et al., 2006). Since the yeast strains used for the production of Wine 25 were not controlled, it is possible that yeast strains such S. bayanus or S. uvarum, which is known for high succinic acid production, could have been present in the natural yeast blend. Two studies have isolated S. uvarum as part of the yeast and bacterial mix responsible for spontaneous fermentation (Demuyter et al., 2004; Le Jeune et al., 2006). Another study found S. bayanus to be the yeast strain most prevalent in the spontaneous fermentation of white wines from North Spain (Rementeria et al., 2003). 73
82 PC2(36%) Ethyl Acetate AceticAcid VolatileAcid SuccinicAcid 18 Isobutanol Isobutyric acid Diethyl Succinate 2-Phenyl Ethanol PC1(39%) Figure 11 PCA bi-plot generated using the chemical variables selected during the second variable selection step. The rest of the wines showing high succininc acid concentrations (Wines 6, 11 and 18) were all produced using commercial strains of S. cerevisiae which included VL 1, Vin 7 and 4F9 (Addendum B). Since S. cerevisiae is not recognised for producing such high levels of succinic acid, other fermentation conditions must have caused Wines 6, 11 and 18 to have succinic acid levels above the normal maximum of 2 g/l succininc acid (Ugliano & Henschke, 2009). Fermentation conditions were not determined in this project, therefore no conclusions can be made as to what might have caused the elevated succinic acid levels in Wines 6, 11 and 18. The chemical compounds diethyl succinate, 2-phenyl ethanol, isobutanol and isobutric acid are situated on the lower right side of the PCA bi-plot (Fig. 11). Isobutanol and 2-phenyl ethanol are higher alcohols. Higher alcohols are the most abundant volatile compounds formed during fermentation and can be present in varying concentrations. At concentrations below 300 mg/l, higher alcohols impart a pleasant complexity to a wine (Bell & Henschke, 2005; Rapp & Versini, 1991). Isobutanol is known to have an aroma described as fusel or alcohol and the aroma of the higher alcohol 2-phenyl ethanol can be described as rose or honey (Escudero et al., 2007; Gil et al., 2006; López et al., 2003; Mendes et al., 2012). None of the wines seem to have a very strong association with the higher alcohol isobutanol. When the GC-FID data are inspected (Table 4) in more detail, it can be seen that the isobutanol concentrations range from to mg/l. This is far below the concentration where higher alcohols become detrimental to wine quality. The other higher alcohol, 2-phenyl ethanol, is also present in concentrations far below 300 mg/l and ranges 74
83 from to mg/l in the wines analysed (Table 4). This compound is, however, present in levels higher than the compound s odour threshold which is mg/l (Table 4) and consequently could have an influence on the aroma of the wines, especially for Wines 18 and 25. Diethyl succinate, which also occurs on the lower part of the PCA bi-plot (Fig. 11), is produced by lactic acid bacteria during MLF (Gil et al., 2006). Diethyl succinate concentrations also increase during wine ageing (Alves et al., 2005; Gonzalez-Viñas et al., 1996; Pérez-Coello et al., 2003) and wines fermented in oak barrels tend to have diethyl succinate concentrations much higher than wines fermented in stainless steel tanks (González-Marco et al., 2008). The wines showing the highest diethyl succinate levels are Wines 6, 11, 18 and 25. Even though these wines have the highest diethyl succinate concentrations, the maximum concentration of diethyl succinate for the wines analysed is merely 1.61 mg/l (Table 3). Other researchers have indicated that diethyl succinate concentration means for young white wines could be 2.97 ± 3.51 mg/l (Gil et al., 2006) and ± 7.69 mg/l for Godello white wines (Gonzáles Álvarez et al., 2011). These levels are much higher than the levels found for the Chenin blanc wines analysed in this study. In another South African study on young wines, Louw (2007) found wines to contain diethyl succinate levels ranging between not detected to 1.50 mg/l. Isobutyric acid, also situated at the lower part of the PCA bi-plot (Fig. 11), is a volatile fatty acid which is believed to be an important contributor to a wine s fermentation aroma (Bell & Henschke, 2005; Francis & Newton, 2005). Even though isobutyric acid is not considered a contributor to wine quality, this compound, along with the other volatile fatty acids present in wine, has shown to influence and benefit aroma complexity (Shinohara, 1985). It has also been found that isobutyric acid concentrations are higher in wines fermented and aged in barrels than wines fermented in stainless steel tanks (Liberatore et al., 2010). None of the wines seem to show a very strong association with the chemical attribute isobutyric acid on the PCA bi-plot (Fig. 11). When the GC-FID data are inspected a bit closer, it can be seen that the Chenin blanc wines analysed in this study have isobutyric acid concentrations ranging from 0.97 to 2.38 mg/l (Table 5). Since the odour threshold for isobutyric acid is mg/l (Table 5) and all of the wines contain this compound in levels well below its odour threshold. This volatile fatty acid does not seem to have any significant effect on the wines aroma profiles. According to the GC-FID data (Table 5), Wines 7, 17 and 18 seem to have the highest isobutyric acid concentrations. Wines 7 and 17 were subjected to some form of wood contact during the winemaking process (Addendum B), which can serve as a reason for these two wines to possess some of the highest isobutyric acid concentrations. Wine 18, however, was not subjected to any wood contact. The reason for Wine 18 having such a high isobutyric acid level cannot be explained by the information gathered in this study and thus needs further investigation. According to Fig. 11, the variables volatile acidity and acetic acid are highly associated. The strong association between these two variables is because acetic acid constitutes more than 90% of a wine s volatile acidity. Acetic acid is produced during fermentation, but spoilage bacteria activity can also increase acetic acid levels extensively. Wines with acetic acid concentrations exceeding 2-3 g/l can be considered spoiled (Jacobson, 2006). Since the wines analysed in this study showed acetic acid concentrations ranging from and mg/l (Table 5), any suspicion of spoilage can be eliminated. Wine 12 seems to have the strongest association with the chemical attributes acetic acid and volatile acidity. According to the information on the back label of Wine 12, this wine was produced using some botrytis-infected grapes. Wine 75
84 12 was also the sweetest wine in the sample set analysed and contains glucose and fructose levels much higher than any of the other wines (Table 2). It is known that sweeter wines produced from botrytis-infected grapes have some of the highest acetic acid concentrations without the detrimental effect of acetic acid on the sensory quality of a wine (Jacobson, 2006; Ugliano & Henschke, 2009). Other than Wine 12, Wines 7, 17 and 23 also show a strong association with the variables acetic acid and volatile acidity. These wines are all from either the 2008 or 2009 vintage and all of these wines were subjected to some form of wood contact (Addendum B). Due to the effects of oxidation during barrel ageing and the hydrolysis of esters, acetic acid concentrations can increase significantly (Chrisholm et al., 1995). High acetic acid concentrations are expected to be accompanied by high ethyl acetate levels, since these two compounds are produced by the same acetic acid bacteria (Jackson, 2008; Jacobson, 2006). Ethyl acetate is also the most common ester found in wine even though it is produced only in small amounts during fermentation. It is during barrel ageing that ethyl acetate levels increase considerably (Ribéreau- Gayon et al., 2006). Ethyl acetate is known to have an unpleasant pungent or vinegary aroma at concentrations exceeding 150 mg/l and is often considered to be detrimental to wine quality (Clarke & Bakker, 2004; Jacobson, 2006; Peynaud & Blouin, 1996; Rapp & Mandery, 1986). At lower concentrations, ethyl acetate have been described by pleasant aroma descriptors including pineapple, fruity and apple which makes a positive contribution to white wine quality (Amerine & Roessler, 1976; Francis & Newton, 2005; Gil et al., 2006; Sánchez-Palomo et al., 2010; Swiegers et al., 2005; Xi et al., 2011). The wines analysed in this study contain ethyl acetate at levels ranging from to mg/l (Table 3). Even though the maximum concentration of ethyl acetate exceeds the level where this compound becomes unpleasant, no such observations were made during the sensory analysis of these wines. The results of the third variable selection step were used to generate a PCA bi-plot (Fig. 12) showing the influence of the chemical compounds total acid, β-ionone, ethanol, linalyl acetate, ethyl hexanoate and geraniol on the distribution of the 25 bush vine Chenin blanc wines analysed in this study. 76
85 TotalAcid B-Ionone PC2 (30%) Ethanol Linalyl Acetate Geraniol Ethyl Hexanoate PC1 (36%) Figure 12 PCA bi-plot generated using the chemical variables selected during the third variable selection step. According to this PCA bi-plot (Fig. 12), the most defined separation between the wines can be seen on PC1. The majority of the wines in this PCA bi-plot (Fig. 12) are grouped near the variable ethanol indicating that these wines contained high levels of ethanol. Only four wines, Wines 10, 16, 17 and 21 seemed to be separated from the group showing a strong association with ethanol. The ethanol concentration for all the wines analysed ranged from to %v/v. Although Wines 10, 16, 17 and 21 have some of the lowest alcohol levels in the group of wines analysed, the reason for them being situated on the left side of the PCA bi-plot is because they also possess β-ionone, geraniol and linalyl acetate at levels much higher than that of the wines grouped near the attribute ethanol. β-ionone, geraniol and linalyl acetate are all monoterpenes. β-ionone concentrations range from levels below its LOQ to µg/l (Table 6). This compound has a very low odour threshold of 0.09 µg/l (Table 6), which indicates that this compound could have an effect on the sensory quality of the wines. β-ionone has been described to possess the aroma of violets, seaweed, flowers or raspberry (Fang & Qian, 2006; Francis & Newton, 2005; Gómez-Míguez et al., 2007). Geraniol could possibly impart a rose aroma on these wines (Francis & Newton, 2005), since this compound has an odour threshold of 30 µg/l. This compound is present in these wines at levels much higher than the latter threshold value and range from to µg/l (Table 6). Linalyl acetate levels range from to µg/l (Table 6). Unfortunately the odour threshold for this monoterpene has not yet been established. 77
86 Ehyl hexanoate, an ester, is also situated at the lower part of the PCA biplot (Fig. 12). However, no wines seemed to be strongly associated with this chemical compound. According to Table 3, the wines analysed showed ethyl hexanoate levels ranging from 1.14 to 1.54 mg/l and that the odour threshold of this compound is mg/l. This implies that the ester, ethyl hexanoate, with its fruity aroma characteristic (Vilanova et al., 2010) does have an impact on the aroma of the 25 wines, even though the level of ethyl hexanoate does not differ that much between wines. 4. Conclusions The aim of this study was to characterise the chemical and sensory profile of Chenin blanc wines produced solely from bush vine vineyards using analytical chemical and sensory techniques. In particular, the purpose of the sensory characterisation was to ascertain the scope and intensities of aroma and flavour attributes associated with Chenin blanc produced from bush vines, but also to establish to what degree bush vine Chenin blanc wines can be grouped or segmented according to their major aroma and flavour attributes. Conversely, the purpose of chemical analyses was also to establish chemical profile of this group of Chenin blanc wines. In both the sensory and chemical PCA plots, illustrating the effects of the attributes explaining the most variance on the positioning of the 25 bush vine Chenin blanc wines, two reasonably distinct groups of wines could be observed. According to the PCA bi-plot obtained from the DSA results, one group of wines associated with the sensory attributes relating to the Fresh and Fruity style of Chenin blanc and the other group with the sensory attributes relating to the Rich and Ripe style of Chenin blanc (Loubser, 2008). The results of this study, using only 25 bush vine Chenin blanc wines, therefore indicated that no distinction could be made between the Rich and Ripe wooded and Rich and Ripe unwooded styles. Both the Rich and Ripe wooded and Rich and Ripe unwooded wines possess the sensory attributes associated with rich fruit, sweet associated and woody characters. It is thus not the absence or presence of a woody aroma or flavour, but the intensity of these characteristics that determine how these wines are distributed within the Rich and Ripe Chenin blanc group of wines. The intensity of woody notes in a wine can be determined by many factors which include wine ageing on lees (Gibson, 2010) and type and duration of wood contact during the winemaking process (Chatonnet et al., 1992). The sensory attributes associated with the Fresh and Fruity wine style were the primary (1 st tier) aroma attributes fresh, fruity and tropical and the secondary (2 nd tier) aroma attributes guava and pineapple. Some of the so-called Fresh and Fruity wines also illustrated a slight vegetative/herbaceous character which was not perceived as impacting the wine quality negatively. The 1 st tier aroma attributes associating with the Rich and Ripe wine styles were rich fruit, sweet associated, ripe/cooked fruit and woody. The main 2 nd tier aroma attributes of the Rich and Ripe wine style were marmalade, raisin, honey, and high roast. The intensities of all of the mentioned aroma attributes were indicated as being moderately to reasonably strong, i.e. as perceived during the formal DSA. 78
87 According to the PCA bi-plot containing the chemical attributes explaining the most variance within the PCA model (Fig. 10), this group of Chenin blanc wines also separated into two groupings. One group of wines were strongly associated with ethyl and acetate esters contributing to a fruity aroma profile and malic acid contributing to the fresh flavours. The rest of the wines were associated with a monoterpene and decreased levels of malic acid and esters, which indicate that these wines have either undergone MLF, were harvested at higher maturation levels or have experienced some degree of ageing. The separation between the wines according to the chemical attributes seemed to be driven by vintage and the extent of ageing a wine has experienced (Chrisholm et al., 1995; Liberatore et al., 2010; Ramey & Ough, 1980). When considering the style classifications of the wines as given by the wines respective winemakers and viticulturists, it can be seen that the styles given to the different wines do not always match up with the sensory descriptors given to the wines during DSA. Some wines described as belonging to the Rich and Ripe style by the winemaker/viticulturist were positioned near the fresh fruity and tropical sensory attributes on the PCA bi-plot generated from the DSA data. The mismatch between the positioning of the wines according to the results of DSA and the style classification given to the wines by their winemakers/viticulturists can be because the defining characteristics of the three Chenin blanc styles recognised by the South African CBA is open to interpretation. This can prove to be problematic when it comes to consumer perceptions since a mismatch can easily be created between the expectation created by a wine label s sensory description and the actual sensory profile experienced during consumption. Defined and distinct style differences will not only facilitate better control over how consumers perceive a Chenin blanc wine, but also help to establish South African Chenin blanc as a world class wine with a versatile but distinct character. It is, nonetheless, vitally important that the local consumer market be convinced of Chenin blanc s worth before the international market can be encouraged to recognise South African Chenin blanc wines as a noteworthy entity. 79
88 5. References Abdi, H. & Valentin, D. (2007). The STATIS method. In: Encyclopaedia of measurement and statistics (edited by N. Salkind). California, USA: Sage. Alig, P. (2010). The everything guide to wine. P. 80. U.S.A.: F+W Media, Inc. Alves, R.F., Nascimento, A.M.D. & Noqueira, J.M.F. (2005). Characterization of the aroma profile of Madeira wine by sorptive extraction techniques. Analytica Chimica Acta, 546, Amerine, M.A. & Roessler, E.B. (1976). Wines: their sensory evaluation. San Francisco, CA: W.H. Freeman and Co. Anonymous. (2012). Wine regions of South Africa. WWW document. URL March Anonymous. (2011). Wine of origin production areas. WWW document. March Antonelli, A., Castellari, L., Zambonelli, C. & Carnacini, A. (1999). Yeast influence on volatile composition of wines. Journal of Agriculture and Food Chemistry, 47, Bakker, J. & Clarke, R.J. (2012). Wine flavour chemistry (2 nd ed.). Chichester, UK: John Wiley & Sons. Belitz, H.D. & Grosch, W. (1992). Química de los alimentos. Zaragoza, España: Acribia (as cited by Mato et al., 2007). Bell, S. & Henschke, P.A. (2005). Implications of nitrogen nutrition for grapes, fermentation and wine. Australian Journal of Grape and Wine Research, 11, Bertrand, A. (1981). Formation of volatiles during alcoholic fermentation: Impact on wine quality. In: Société Française de Microbiologie Symposium, Reims, pp (as cited by Gil et al., 2006). Camara, J.S., Alves, M.A. & Marques, J.C. (2006). Evolution of oak-related volatile compounds in a Spanish red wine during 2 years bottled, after aging in barrels made of Spanish, French and American oak wood. Analytica Chimica Acta, 563, Chatonnet, P., Dubourdie, D., Boidron, J. & Pons, M. (1992). The origin of ethylphenols in wines. Journal of the Science of Food and Agriculture, 60, Chenin Blanc Association. (n.d.). WWW document. URL September Chrisholm, M.G., Guiher, L.A. & Zaczkiewicz, S.M. (1995). Aroma characteristics of aged Vidal blanc wine. American Journal of Enology and Viticulture, 46, Clarke, R.J. & Bakker, J. (2004). Wine flavour Chemistry. Oxford, UK: Blackwell Publishing. Coulter, A.D., Godden, P.W. & Pretorius, I.S. (2004). Succinic acid how it is formed, what is its effect on titratable acidity, and what factors influence its concentration in wine? Australian and New Zealand Wine Industry Journal, 19, Deliza, R. & MacFie, H.J.H. (1996). The generation of sensory expectation by external cues and its effect on sensory perception and hedonic ratings: A review. Journal of Sensory Studies, 11, Demuyter, C., Lollier, M., Legras, J. & Le Jeune, C. (2004). Predominance of Saccharomyces uvarum during spontaneous alcoholic fermentation, for three consecutive years, in an Alsatian winery. Journal of Applied Microbiology, 97, Doco, T., Vuchot, P., Cheynier, V. & Moutounet, M. (2003). Structural modification of arabinogalactanproteins during ageing of red wines on lees. American Journal of Enology Viticulture, 54,
89 Duval, V. & Karlsson, M.O. (2002). Impact of omission or replacement of data below the limit of quantification on parameter estimates in a two-compartment model. Pharmaceutical Research, 19, Edwards, C.G., Beelman, R.B., Bartley, C. and McConnel, A.L. (1990). Production of decanoic acid and other volatile compounds and the growth of yeast and malolactic bacteria during vinification. American Journal of Enology and Viticulture, 41, Eglinton, J.M., McWilliam, S.J., Fogarty, M.W., Francis, I.L., Kwiatkowski, M.J., Høj, P.B. & Henschke, P.A. (2000). The effect of Saccharomyces bayanus-mediated fermentation on the chemical composition and aroma profile of Chardonnay wine. Australian Journal of Grape and Wine Research, 6, Escudero, A., Campo, E., Fariña, L., Cacho, J & Ferreira, V. (2007). Analytical characterization of the aroma of five premium red wines. Insights into the role of odor families and the concept of fruitiness of wines. Journal of Agricultural and Food Chemistry, 55, Etiévant, P.X. (1991). Wine. In: Volatile compounds in foods and beverages (edited by H. Maarse). New York: Dekker. Fang, Y. & Qian, M.C. (2006). Quantification of selected aroma-active compounds in Pinot Noir wines from different grape maturities. Journal of Agricultural and Food Chemistry, 54, FDA. (2001). Guidance for industry bioanalytical method validation. (as cited by Duval & Karlsson, 2002). Ferreira, V., Lopez, R. & Cacho, J.F. (2000). Quantitative determination of the odorants of young red wines from different grape varieties. Journal of the Science of Food and Agriculture, 80, Ferreira, V., Ortín, N., Escudero, A., López, R. & Cacho, J.F. (2002). Chemical characterization of the aroma of Grenache rose wines: Aroma extract dilution analysis, quantitative determination, and sensory reconstitution studies. Journal of Agricultural and Food Chemistry, 50, Fisher, U. (2007). Wine Aroma. In: Flavours and fragrances: Chemistry, bioprocessing and sustainability (edited by R.G. Berger). P Berlin: Springer. Flanzy, C. (2003). Enología: Fundamentos científicos y tecnológicos (2 nd ed.). Madrid: Ediciones Mundi- Prensa (as cited by González Álvarez et al., 2011). Fontoin, H., Saucier, C., Teissedre, P.L. & Glories, Y. (2008). Effect of ph, ethanol and acidity on astringency and bitterness of grape seed tannin oligomers in model wine solution. Food Quality and Preference, 19, Francis, I.L. & Newton, J.L. (2005). Determining wine aroma from compositional data. Australian Journal of Grape and Wine Research, 11, Gibson, M. (2010). The sommelier prep course: an introduction to the wines, beers, and spirits of the world. Pp New Jersey: John Wiley & Sons. Gil, M., Cabellos, J.M., Arroyo, T. & Prodanov, M. (2006). Characterization of the volatile fraction of young wines from the Denomination of Origin Vinos de Madrid (Spain). Analytica Chimica Acta, 563, Giudici, P., Zambonelli, C., Passarelli, P. & Casterllari, L. (1995). Improvement of wine composition with cryotolerant Saccharomyces strains. American Journal of Enology and Viticulture, 46, Gómez-Míguez, M.J., Cacho, J.F., Ferreira, V., Vicario, I.M. & Heredia, F.J. (2007). Volatile components of Zalema white wines. Food Chemistry, 100,
90 Gonzáles Álvarez, M., Gonzáles-Barreiro, C., Cancho-Grande, B. & Simal-Gándara, J. (2011). Relationship between Godello white wine sensory properties and its aromatic fingerprinting obtained by GC-MS. Food Chemistry, 129, González-Marco, A., Jiménez-Moreno, N. & Ancín-Azpilicueta, C. (2008). Concentration of volatile compounds in Chardonnay wine fermented in stainless steel tanks and oak barrels. Food Chemistry, 108, Gonzalez-Viñas, M.A., Perez-Coello, M.S., Salvador, M.D., Cabezudo, M.D. & Martin-Alvarez, P.J. (1996). Changes in gas-chromatographic volatiles of young Airen wines during bottle storage. Food Chemistry, 56, Goode, J. (2005). The science of wine: from vine to glass. Pp. 87, 91. California: University of California Press. Guth, H. (1997). Quantitation and sensory studies of character impact odorants of different white wine varieties. Journal of Agricultural and Food Chemistry, 45, Harrington, R.J. (2008). Food and Wine Pairing: A Sensory Experience. Pp New Jersey: Wiley & Sons, Inc. Heymann, H. & Noble, A.C. (1987). Descriptive analysis of commercial Cabernet Sauvignon wines from California USA. American Journal of Enology and Viticulture, 38, ICH. (1996) Guideline: Validation of analytical procedure: Methodology. WWW document. URL (as cited by Duval & Karlsson, 2002). Jackson, R.S. (2008). Wine science: Principles and applications (3 rd ed.). Pp. 280, 707. California: Academic Press. Jacobson, J.L. (2006). Introduction to wine laboratory practices and procedures. Pp. 142, 167. New York: Springer Science+Business Media, Inc. Jones, P.R., Gawel, R., Francis, I.L. & Waters, E.J. (2008). The influence of interactions between major white wine components on the aroma, flavour and texture of model white wine. Food Quality and Preference, 19, Kordiš-Krapež, M., Abram, V., Kač, M. & Ferjančič, S. (2001). Determination of organic acids in white wine by RP-HPLC. Food Technology and Biotechnology, 39, Lambrechts, G.M. & Pretorius, I.S. (2000). Yeast and its importance to wine aroma a review. South African Journal of Enology and Viticulture, 21, LaVilla, J. (2010). Chenin blanc. In: The wine, beer & spirits handbook: A guide to styles and services. Pp New Jersey: John Wiley & Sons, Inc. Lawless, H.T. & Heymann, H. (2010). Sensory evaluation of food: Principles and practices (2 nd ed.). Pp , 434. New York: Springer Science + Business Media, LLC. Le Jeune, C., Erny, C., Demuyter, C. & Lollier, M. (2006). Evolution of the population of Saccharomyces cerevisiae from grape to wine in a spontaneous fermentation. Food Microbiology, 23, Liberatore, M.T., Pati, S., Del Nobile, M.A. & La Notte, E. (2010). Aroma quality improvement of Chardonnay white wine by fermentation and ageing in barrique on lees. Food Research International, 43, López, R., Ortín, N., Pérez-Trujillo, J.P., Cacho, J. & Ferreira, V. (2003). Impact odorants of different young white wines from the Canary Islands. Journal of Agricultural and Food Chemistry, 51,
91 Loubser, F.H. (2008). Chenin blanc table wines in South Africa. Cape Wine Master dissertation. WWW document. URL June Louw, L. (2007). Chemical characterisation of South African young wines. MSc Thesis, Department of Viticulture and Oenology, University of Stellenbosch, South Africa. Louw, L., Roux, K., Tredoux, A., Tomic, O., Næs, T., Nieuwoudt, H.H. & Van Rensburg, P. (2009). Characterisation of selected South African young cultivar wines using FTMIR spectroscopy, gas chromatography, and multivariate data analysis. Journal of Agricultural and Food Chemistry, 57, Lubbers, S., Charpentier, C. Feuillat, M. & Voilley, A. (1994). Influence of yeast walls on the behaviour of aroma compounds in a model wine. American Journal of Enology Viticulture, 45, Mato, I., Suárez-Luque, S. & Huidobro, J.F. (2007). Simple determination of main organic acids in grape juice and wine by using capillary zone electrophoresis with direct UV detection. Food Chemistry, 102, McEwan, J.A.. (1996). Preference mapping for product optimization. In: Multivariate analysis of data in sensory science (edited by T. Næs & E. Risvik). P. 78. Amsterdam: Elsevier Science B.V. Meillon, S., Viala, D., Medel, M., Urbano, C., Guillot, G. & Schlich, P. (2010). Impact of partial alcohol reduction in Syrah wine on perceived complexity and temporality of sensations and link with preference. Food Quality and Preference, 21, Mendes, B., Gonçalves, J. & Câmara, J.S. (2012). Effectiveness of high-throughput miniaturized sorbentand solid phase microextraction techniques combined with gas chromatography-mass spectrometry analysis for a rapid screening of volatile and semi-volatile composition of wines a comparative study. Talanta, 88, Moio, L., Ugliano, M., Genovese, A., Gambuti, A., Pessina, R. & Piombino, P. (2004). Effect of antioxidant protection of must on volatile compounds and aroma shelf life of Falanghina (Vitis vinifera L.) wine. Journal of Agricultural and Food Chemistry, 52, Næs, T., Brockhoff, P.B. & Tomic, O. (2010). Quality control of sensory profile data. In: Statistics For Sensory and Consumer Data. Pp , 44-45, 268. UK: John Wiley & Sons, Ltd. Nieuwoudt, H.H., Prior, B, Pretorius, I.S., Manley, M. & F. Bauer. (2004). Principal component analysis applied to Fourier transform infrared spectroscopy for the design of calibration sets for glycerol prediction models in wine and for the detection and classification of outlier samples. Journal of Agricultural and Food Chemistry, 52, Noble, A.C., Arnold, R.A., Buechsenstein, J., Leach, E.J., Schmidt, J.O. & Stern, P.M. (1987). Modification of a standardized system of wine aroma terminology. American Journal of Enology and Viticulture, 38, Oliveira, J.M., Oliveira, P., Baumes, R.L. & Maia, O. (2008). Changes in aromatic characteristics of Loureiro and Alvarinho wines during maturation. Journal of Food Composition and Analysis, 21, Peinado, R.A., Moreno, J., Bueno, J.E., Moreno, J.A. and Mauricio, J.C. (2004). Comparative study of aromatic compounds in two young white wines subjected to pre-fermentative cryomaceration. Food Chemistry, 84,
92 Pérez-Coello, M.S., González-Viñas, M.A., García-Romero, E., Díaz-Maroto, M.C. & Cabezudo, M.D. (2003). Influence of storage temperature on the volatile compounds of young white wines. Food Control, 14, Peynaud, E. (1999). Enología práctica. In: Conocimiento y elaboración del vino. Madrid, España: Mundi- Prensa (as cited by Mato et al., 2007). Peynaud, E. & Blouin, J. (1996). The taste of wine: the art and science of wine appreciation. P New York: John Wiley & Sons, Inc. Radler, F. (1993). Yeast: Metabolism of organic acids. In: Wine microbiology and biotechnology (edited by G.H. Fleet). Chur, Switzerland: Harwood Academic Publishers. Ramey, D.D. & Ough, C.S. (1980). Volatile ester hydrolysis or formation during storage of model solutions and wines. Journal of Agricultural and Food Chemistry, 28, Rapp, A. & Mandery, H. (1986). Wine aroma. Experientia, 42, Rapp, A. & Versini, G. (1991). Influence of nitrogen compounds in grapes on aroma compounds in wine. In: Proceedings of the International Symposium on Nitrogen in Grapes and Wine, Seattle, USA. Pp (as cited by Bell & Henschke, 2005). Rementeria, A., Rodriquez, J.A., Cadaval, A., Amenabar, R., Muguruza, J.R., Hernando, F.L. & Sevilla, M.J. (2003). Yeast associated with spontaneous fermentations of white wines from the Txakoli de Bizkaia region (Basque Country, North Spain). International Journal of Food Microbiology, 86, Reynolds, A.G. & Vanden Heuvel, J.E. (2009). Influence of grapevine training systems on vine growth and fruit composition: A review. American Journal for Enology and Viticulture, 60:3, Ribéreau-Gayon, P., Boidron, J.N. & Terrier, A. (1975). Aroma of Muscat grape varieties. Journal of Agricultural and Food Chemistry, 23, Ribéreau-Gayon, R., Dubourdieu, D., Donèche, B. & Lonvaud, A. (2006). Handbook of enology: The microbiology of wine and vinifications (Volume 1, 2 nd ed.). Chichester, England: John Wiley & Sons Ltd. Rocchi, B. & Stefani, G. (2005). Consumers perception of wine packaging: A case study. International Journal of Wine Marketing, 18, Salmon, J.M., Fornairon-Bonnefond, C. & Mazauric, J.P. (2002). Interactions between wine lees and polyphenols: Influence of oxygen consumption capacity during simulation of wine ageing. Journal of Food Science, 67, Sánchez-Palomo, E., García-Carpintero, E.G., Alonso-Villegas, R. & González-Viñas, M.A. (2010). Characterization of aroma compounds of Verdejo white wines from the La Mancha region by odour activity values. Flavour and Fragrance Journal, 25, Schlich, P. (1996). Defining and validating assessor compromises about product distances and attribute correlations. In: Multivariate analysis of data in sensory science (edited by T. Næs & E. Risvik). P Amsterdam: Elsevier Science B.V. Shapiro, S. S., & Wilk, M.B. (1965). An analysis of variance test for normality (complete samples). Biometrika, 52, Shinohara, T. (1985). Gas chromatographic analysis of volatile fatty acids in wines. Agricultural and Biological Chemistry, 49,
93 Skelton, S. (2007). Viticulture: An introduction to commercial grape growing for wine production. Pp London: Lulu. Swiegers, J.H., Bartowsky, E.J., Henschke, P.A. & Pretorius, I.S. (2005). Yeast and bacterial modulation of wine aroma and flavour. Australian Journal of Grape and Wine Research, 11, Ugliano, M. & Henschke, P.A. (2009). Yeast and wine flavour. In: Wine chemistry and biochemistry (edited by M.V. Moreno-Arribas & M.C. Polo). Pp. 327, New York: Springer Science+Business Media. Van der Merwe, C.A. & Van Wyk, C.J. (1981). The contribution of some fermentation products to the odor of dry white wines. American Journal of Enology and Viticulture, 32, Van Zyl, J.L. & Van Huyssteen, L. (1980). Comparative studies on wine grapes on different trellising systems: II. Micro-climatic studies, grape composition and wine quality. South African Journal of Enology and Viticulture, 1, Van Zyl, P. (2010). Platter s South African wines 2010: the guide to cellars, vineyards, winemakers, restaurants and accommodation. Hermanus, SA: The John Platter SA Wine Guide (Pty) Ltd. Van Zyl, P. (2011). Platter s South African wines 2011: the guide to cellars, vineyards, winemakers, restaurants and accommodation. Hermanus, SA: The John Platter SA Wine Guide (Pty) Ltd. Van Zyl, P. (2012). Platter s South African wines 2012: the guide to cellars, vineyards, winemakers, restaurants and accommodation. Hermanus, SA: The John Platter SA Wine Guide (Pty) Ltd. Vilanova, M., Genisheva, Z., Masa, A. & Oliveira, J.M. (2010). Correlation between volatile composition and sensory properties in Spanish Albariño wines. Microchemical Journal, 95, Volschenk, C.G. & Hunter, J.J. (2001). Effect of trellis conversion on the performance of Chenin blanc/99 Richter grapevines. South African Journal of Enology and Viticulture, 22, Volschenk, H., Van Vuuren, H.J.J. & Viljoen-Bloom, M. (2006). Malic acid in wine: origin, function and metabolism during vinification. South African Journal of Enology and Viticulture, 27, Westad, F., Hersleth, M., Lea, P. & Martens, H. (2003). Variable selection in PCA in sensory descriptive and consumer data. Food Quality and Preference, 14, Xi, Z., Tao, Y., Zhang, L. & Li, H. (2011). Impact of cover crops in vineyard on the aroma compounds of Vitis vinifera L. cv Cabernet Sauvignon wine. Food Chemistry, 127,
94 Chapter 4 Comparison of descriptive sensory analysis and sorting as test techniques using Chenin blanc wines 86
95 CHAPTER 4: Contents 1. Introduction Materials and methods Sample set of wines Descriptive sensory analysis Panel for descriptive sensory analysis Training and testing procedures Statistical procedures Sorting task Panel for sorting task Testing procedures Statistical procedures Results and discussion Application of descriptive sensory analysis for the categorisation of bush vine Chenin blanc wines Application of sorting for the sensorial profiling of bush vine Chenin blanc wines Evaluation of MDS and DISTATIS plots created from the sorting data Evaluation of the CA plot produced from the sorting task with a descriptive step Comparison of sorting and descriptive sensory analysis as techniques in the determination of the sensory profile and classification of bush vine Chenin blanc wines Conclusions References
96 1. Introduction Descriptive sensory analysis (DSA) is a test technique used to determine the sensory attributes of a product, both qualitatively and quantitatively, in order to obtain a comprehensive and detailed sensory profile of a single product, to compare a range of products based on their sensory differences and similarities or to segment or group products according to their similarities. This methodology has proved to be an invaluable tool in the wine industry as part of research and development, as well as in marketing (Chollet et al., 2011). It has also been used extensively in wine research to determine the full sensory profile of wine samples, and furthermore to correlate specific sensory attributes with chemical attributes to ultimately determine the chemical drivers of sensory quality (Biasoto et al., 2012; Gómez García-Carpintero et al., 2012; Preys et al., 2006). DSA is a consensus method which involves intensive training of an analyst panel using reference standards to ensure that the full panel of judges agree on the meaning of every sensory attribute analysed, mainly to ensure that the panel can perform consistently and reliably during product analysis (Campo et al., 2010; Lawless & Heymann, 2010; Popper & Heymann, 1996). Usually, a range of sensory attributes are chosen, primarily to address the research question to be answered, but also to include those sensory attributes that are, to a larger extent, present in all samples. With DSA data obtained from analysing wine samples, a number of univariate and multivariate statistical methodologies have been used to ascertain whether significant differences exist between different wine treatments in terms of specific attributes, and whether specific wines and attributes associate in a multivariate plot. Principal component analysis (PCA), one of the cornerstone methodologies of multivariate analysis, is a projection method that helps one visualise all the information contained in a data table. PCA helps one find out in what respect one sample is different from another, which variables contribute most to this difference, and whether those variables contribute in the same way (i.e. are correlated) or independently from each other. Techniques such as Discriminant Analysis (DA) can also be used to detect sample patterns or specific groupings in the data set (Lawless & Heymann, 2010). Since DSA requires a panel of judges to undergo extensive training, which can make it expensive in both time and cost, most industries simply cannot afford to make use of this type of technique as often as is required (Kemp et al., 2009; Meilgaard et al., 1999; Stone & Sidel, 1993). Another constraint is that panel training is usually determined by the objectives of the study which will stipulate how training is to be conducted, i.e. which training aids or reference standards will be utilised, in what format should the products be analysed and what range of descriptors should be used (Chollet et al., 2011). This could imply that different panels should be trained to assess different categories of products (Bitnes et al., 2007) or that lengthy periods of time should be available for the training of a panel to describe and analyse a range of products (Chollet et al., 2011). Another limitation of DSA is the fact that it is based on the psychophysical model (Lawless, 1999). This model assumes that a set of independent descriptors can be used to analyse and report odour perception. It has been, however, suggested by Lawless (1999) that this model might not be sufficient in the analysis of complex odour mixtures, as humans do not have unlimited capacity to judge intensities of individual odour notes in complex mixtures using a long list of descriptors. Sensory scientists should be sensitive to situations where the choice of method may be driving results or influencing interpretations. To avoid this and the other limitations associated with DSA, some researchers have 88
97 considered similarity-based techniques, including a sorting task paired with a description assignment (Blancher et al., 2007; Cartier et al., 2006; Lawless et al., 1995; Lim & Lawless, 2005; Popper & Heymann, 1996; Saint-Eve et al., 2004; Tang & Heymann, 2002). Sorting as test technique is an easy method for accumulating similarity data. This task is both simple and quick to execute (Chollet et al., 2011), the panel needs no formal training prior to performing a sorting task (Campo et al., 2008) and is based on an innate cognitive process which humans use daily (Chollet et al., 2011). This method requires that a panel of judges sort or categorise a set of 10 to 20 products into groups containing similar products (Chollet et al., 2011; Lawless & Heymann, 2010). It is generally believed that items placed in a certain category do not represent that group equally, but rather contains items that share more characteristics with that specific group than with any other group (Ballester et al., 2008). After a panel has sorted products into distinct groups, the sorting task can be brought to an end or it can be followed by a descriptive task. In the descriptive task, the judges are instructed to assign descriptors to each group formed during the sorting task. It has been found that results stabilise with about 20 participants. The data obtained during the sorting task can be analysed using several statistical techniques. These techniques include multidimensional scaling (MDS), DISTATIS and correspondence analysis (CA) (Chollet et al., 2011). MDS is a multivariate statistical technique that analyses similarity data (Abdi et al., 2007; Popper & Heymann, 1996). The frequency that a pair of products is sorted together in the same group is calculated to create a similarity matrix which is then analysed through MDS to generate a perceptual plot. Products are indicated as points on the MDS plot with the distance between two points representing the similarity of the products. Products that have been sorted together most often will lie in close proximity to each other on an MDS plot (Abdi et al., 2007). The results of this method is much simpler to interpret as it shows only the most prominent or relevant differences between samples. When using other statistical analysis methods, such as PCA, data on several sensory attributes must be collected. This could result in redundant information being used to distinguish between products (Popper & Heymann, 1996). MDS does, however, have one limitation. Individual sorting data from each judge is pooled to generate the similarity matrix, which results in the loss of differences between individual judges (Lawless et al., 1995). To avoid losing this information, DISTATIS can be used as multivariate statistical analysis method (Abdi et al., 2007). DISTATIS takes into account the results from each individual panellist involved in the sorting task by using distance matrices. Distance matrices are obtained by transforming the sorting data. This method generates two different plots that can be interpreted using the same rules as when interpreting PCA or MDS plots. The one plot shows similarity between products and the other similarity between judges (Abdi et al., 2007). CA is another graphical tool that can be used to evaluate the similarity between products. This method is highly informative and flexible and uses categorical variables as input (Beh et al., 2011). When CA is conducted using sensory data, the relationship between row and column variables is evaluated. The rows represents the products and columns the attributes used to describe the products (McEwan & Schlich, 1991/1992). This type of data can be obtained in a sorting task with a description assignment (Cadoret et al., 2009). The perceptual plots generated through CA thus show the overall correlation structure between products and the sensory attributes associated with them (Beh et al., 2011). 89
98 Even though several authors (Delarue & Sieffermann, 2004; Lelièvre et al., 2008; Perrin et al., 2008; Saint-Eve et al., 2004) have indicated that conventional DSA is the better option when comprehensive information about the sensory attributes of a product is needed, the sorting method can be used to rapidly position a product amongst others on a perceptual plot showing sensory similarities and differences (Campo et al., 2010). Multidimensional plots obtained when only sensory attributes are used to make groupings during sorting, can be seen as sensory plots which can be compared to the perceptual plots obtained by DSA (Faye et al., 2004). By comparing the two perceptual plots, the two methods can be evaluated. Since sorting is considered a group-derived method of association, it can be regarded as a relatively good alternative to DSA, especially when the aim is to determine groupings of similarity. In view of this, the objective of this study was to determine to what extent conventional DSA can be substituted by sorting for the profiling and classification of South African Chenin blanc wines produced from bush vines. 2. Materials and methods Two different methodologies, conventional descriptive sensory analysis (DSA) (Lawless & Heymann, 2010) and the sorting task (Chollet et al., 2011) were used to sensorially profile and categorise a group of South African Chenin blanc wines produced from bush vines. The materials and method used for DSA were discussed in full detail in Chapter 3 and will only be discussed briefly in this chapter. A comprehensive discussion of the sorting task will follow Sample set of wines One of the disadvantages of the sorting task is the limitation on the number of samples that can be analysed in one single session. Even though literature suggests that approximately 20 products can be sorted in one session (Campo et al., 2008), it was decided that 15 wines would be a more manageable sample size for this technique. The DSA multivariate plots (Chapter 3) were inspected to select a sample set of 15 wines illustrating a large degree of variance. The PCA bi-plot in Fig. 1 indicates that the wines differentiate mainly according to the two main Chenin blanc styles, namely Fresh and Fruity and Rich and Ripe, as recognised by the Chenin blanc Association (CBA) of South Africa (SA) (CBA, n.d.). The selection of wines chosen to be included is indicated with a red marker on the PCA bi-plot (Fig. 1). As no distinct separation between the Rich and Ripe wooded and unwooded wines were visible on the right side of the PCA bi-plot (Fig. 1), nine wines showing good variation were chosen from the group of wines marked as cluster B (Fig. 1) to represent the Rich and Ripe style as a whole. Six wines from the group of wines marked as cluster A (Fig. 1) were chosen to represent the Fresh and Fruity wines. 90
99 B 4 F_WOOD A_WOODY A_High roast 12 PC2(7.9) A_Guava F_FRESH FRUITY A_TROPICAL A A_Pineapple F_RIPE/COOKED FRUIT A_Marmalade A_SWEET ASSOCIATED 11 A_RICH FRUIT PC1(82.1) A_Raisin A_Honey scores loadings Figure 1 PCA bi-plot of the DSA results showing style differences with the wines selected for the sorting task indicated in red. The letters A and F refer to aroma and flavour, respectively. The two clusters separating on PC1 seem to be caused by the sensory differences associated with the two major styles of Chenin blanc, namely Fresh and Fruity (cluster A) and Rich and Ripe (cluster B) Descriptive sensory analysis The wine samples, panel and the training and testing procedures used in this study during the conventional DSA of the South African Chenin blanc wines produced from bush vine vineyards will be discussed in this section Panel for descriptive sensory analysis As indicated in Chapter 3, the DSA panel consisted of 10 members, all with previous experience in this sensory analysis of wine, as well as DSA. See Chapter 3 for details. 91
100 Training and testing procedures See Chapter 3 for the detailed discussion of the training and testing procedures used in this study. The training process encompassed 12 h in total where reference standards were used to ensure that the panel reached agreement on descriptors and attribute intensities. Throughout the training process, each judge received a tray with 20 ml of each sample served at room temperature (21 o C) in standard ISO wine tasting glasses. The glasses were covered with a small petri dish and standard sensory training practices (Lawless & Heymann, 2010) were employed. The first and second tier aroma attributes analysed during DSA are given in Table 1. A 1 st tier attribute is usually a generic sensory term (e.g., Tropical) and consists of a group of adjectives or more specific sensory terms such as Mango, Guava, etc. The latter terms usually constitute the 2 nd tier attributes. The wine analysis phase took place over a period of three days in which three replications of each treatment were completed. Standard sensory practices were used and judges analysed the wines while seated in individual tasting booths (Lawless & Heymann, 2010). For analysis, 30 ml of the different samples were served at room temperature in standard ISO wine tasting glasses with each glass covered with a small petri dish to conserve the aroma in the headspace. Compusense Five (Version 5.2, Compusense Inc., Guelph, Ontario, Canada) was used to capture the data. During both the training and the testing phases of the DSA, each judge was served with a control wine sample. This control sample was used as a fixed point to which all the other samples could be compared to (see Chapter 3). 92
101 Table 1 Aroma descriptors used for respective sensory attributes during DSA. Aroma attributes Intensity First tier TROPICAL 0 = None, 100 = Prominent tropical aroma Guava 0 = None, 100 = Prominent guava aroma Pineapple 0 = None, 100 = Prominent pineapple aroma Second tier Litchi 0 = None, 100 = Prominent litchi aroma Melon 0 = None, 100 = Prominent melon aroma Passionfruit 0 = None, 100 = Prominent passionfruit aroma Mango 0 = None, 100 = Prominent mango aroma First tier CITRUS 0 = None, 100 = Prominent citrus aroma Lemon 0 = None, 100 = Prominent lemon aroma Second tier Orange (Fruit/Peel) 0 = None, 100 = Prominent orange aroma Grapefruit 0 = None, 100 = Prominent grapefruit aroma First tier STONE FRUIT 0 = None, 100 = Prominent stone fruit aroma Second tier Peach 0 = None, 100 = Prominent peach aroma Apricot 0 = None, 100 = Prominent apricot aroma First tier RICH FRUIT 0 = None, 100 = Prominent rich fruit aroma Marmalade 0 = None, 100 = Prominent marmalade aroma Second tier Compote 0 = None, 100 = Prominent compote aroma Raisin 0 = None, 100 = Prominent raisin aroma First tier FLORAL 0 = None, 100 = Prominent floral aroma Second tier Orange blossom 0 = None, 100 = Prominent orange blossom aroma Honey blossom 0 = None, 100 = Prominent honey blossom aroma First tier SWEET ASSOCIATED 0 = None, 100 = Prominent sweet associated aroma Honey 0 = None, 100 = Prominent honey aroma Second tier Caramel 0 = None, 100 = Prominent caramel aroma Vanilla 0 = None, 100 = Prominent vanilla aroma First tier VEGETATIVE/GREEN 0 = None, 100 = Prominent vegetative/green aroma Second tier Asparagus 0 = None, 100 = Prominent as asparagus aroma First tier WOODY 0 = None, 100 = Prominent woody aroma Planky 0 = None, 100 = Prominent planky aroma Second tier High roast 0 = None, 100 = Prominent high roast aroma Coffee 0 = None, 100 = Prominent coffee aroma First tier NUTTY 0 = None, 100 = Prominent nutty aroma First tier SPICY 0 = None, 100 = Prominent spicy aroma Second tier Sweet spice 0 = None, 100 = Prominent sweet spice aroma Savoury spice 0 = None, 100 = Prominent savoury spice aroma First tier YEASTY 0 = None, 100 = Prominent yeasty aroma 93
102 Statistical procedures After the panel performance was tested using PanelCheck Software (Version 1.3.2, data were also subjected to test-retest analysis of variance (ANOVA) using SAS software (Version 9.2; SAS Institute Inc, Cary, USA) to test for panel reliability. Judge*Replication and Judge*Sample interactions were used as measures of the panel precision and homogeneity, respectively. The Shapiro-Wilk test was used to test for non-normality of the residuals (Shapiro & Wilk, 1965). In the event of significant nonnormality (p 0.05) outliers were identified and residuals larger than 3 were removed. Principle component analysis (PCA) was then conducted using XLStat (Version 7.5.2, Addinsoft, New York, USA) to visualise and elucidate the relationships between the samples and attributes. Another statistical methodology used to analyse the DSA data was discriminant analysis (DA). This method was employed with the objective of examining how well the wines could be classified or grouped (Næs et al., 2010) Sorting task The details of the sorting task will be discussed in this section Panel for sorting task The panel used in the sorting task consisted of 10 judges. These judges were all regarded as wine experts as they were wine industry professionals from Stellenbosch and surrounding areas (Paarl, Wellington, etc.) and wine researchers from the IWBT (Institute of Wine Biotechnology, Stellenbosch University, SA). The panellists ranged in both age and experience with the years of experience in the wine industry ranging between 4 to 32 years. Literature has shown that wine experts or wine professionals perform better than naïve judges in the grouping of wines into sets (Solomon, 1990), as well as describing these sets of wines (Lawless, 1984). The inherent classification ability that wine experts possess is the result of experience gained through repeated exposure. This allows them to perceive subtle variations in wines (Hughson & Boakes, 2002; Solomon, 1997). Repeated exposures also tend to result in conceptual alignment (O Mahony, 1991) amongst professionals which in turn results in the use of a common language (Parr et al., 2007) Testing procedures The entire sorting task consisted of three sessions and took less than 1 h to complete. The questionnaire used is given in Addendum H. Wines were served at room temperature (21 o C) in standard ISO wine tasting glasses covered with small petri dishes. Each judge received 30 ml of each sample. The wines were coded with three-digit random codes and served in a randomised order. 94
103 The first segment of the questionnaire was a scoring task to determine the quality of the wines. The panellists were asked to assign a quality score, based on aroma only, to each of the samples using a 20- point scale. This scale was similar to that used in formal wine competitions and shows (Parr et al., 2006). The second segment of the questionnaire was a sorting task. The panel was asked to sort the 15 wines according to aroma similarity, smelling the wines as many times and in any order they preferred. They were instructed to segment or categorise the wines into as many groups, each group containing as many wines as they see fit. The third and final part of the questionnaire consisted of a descriptive task where the expert panel had to describe each grouping of wines with four to five perceived aroma descriptors. These aroma descriptors should have been significant in their grouping choices Statistical procedures Three different statistical methods were employed to process the data generated in the sorting tasks: multidimensional scaling (MDS), DISTATIS and correspondence analysis (CA). All analyses were conducted using Statistica 10 software (StatSoft, Inc.). Before the sorting data could be analysed using the above-mentioned methodologies, certain preprocessing steps were necessary. These pre-processing steps included the transformation of the individual judges sorting data into co-occurrence matrices, then into distance matrices and finally into cross-product matrices. The latter were conducted following the methods described by Abdi et al. (2007). For the CA analysis, the attributes assigned to the different groups by the judging panel was condensed into broader categories to reduce the number of categorical variables. The Chenin blanc aroma wheel of the South African CBA was used for this purpose (Addendum C). 3. Results and discussion 3.1. Application of descriptive sensory analysis for the categorisation of bush vine Chenin blanc wines When PCA is conducted on DSA data, a perceptual plot is generated which illustrates the relationship between products and sensory attributes (Lawless & Heymann, 2010). This plot can also be used to evaluate the association amongst products and resultant categorisation of samples. The data obtained from the DSA of the 15 wines included in the sorting task were subjected to PCA to create a bi-plot illustrating product positions and their association with sensory attributes. To make this plot comparable to the plots created from sorting data, the PCA bi-plot was modified to contain the same information as the MDS, 95
104 DISTATIS and CA plots. Therefore, only aroma attributes were considered for this PCA bi-plot since aroma was the only sensory stimuli used to perform the sorting task. The PCA bi-plot is given in Fig. 2. When evaluating Fig. 2, it is evident that the wines separate into two groups on principal component 1 (F1 as indicated in Fig. 2, with F1 explaining 52.37% of the variance). The one group of wines, marked as cluster A, contains Wines 3, 8, 13, 15 and 24. These wines associate with the aroma attributes stone fruit, floral, pineapple, guava and tropical. One wine that is situated in the lower, left side of F1, Wine 10, seems to associate more strongly with the aroma attributes vegetative and green pepper and appears to be slightly different from the wines contained in cluster A. The second group of wines, marked as cluster B, contain Wines 4, 5, 11, 16, 20, 21, 22, 23 and 25. These wines associate more with the aroma attributes spicy, sweet associated, honey, compote, raisin, rich fruit, and marmalade, high roast, woody and planky. The wines included in cluster A could be considered to belong to the Fresh and Fruity style (as recognised by the South African CBA [CBA, n.d.]). Wine 10 can also be regarded as part of cluster A associating strongly with the vegetative and green pepper aroma attributes, but also with the fruity attributes on the left side of F1. According to Table 2, containing the ANOVA results from the DSA, Wine 10 does not differ significantly from most of the other wines in cluster A (Fig. 2) for the aroma attributes tropical, guava, pineapple and vegetative and can thus also be considered as belonging to the Fresh and Fruity style. The wines in cluster B can be considered to belong to the Rich and Ripe style of Chenin blanc wines. No definite discrimination can be made between two Rich and Ripe styles (Rich and Ripe wooded & Rich and Ripe unwooded), since the woody, sweet associated, spicy and rich fruit aroma attributes are positioned in close proximity. It does, however, seem as if the woody aroma attributes are situated in the lower right quadrant of the PCA bi-plot (Fig. 2) and the majority of the rich fruit, spicy and sweet associated aroma attributes are situated in the upper right quadrant. When the aroma intensity scores from the wines contained in the cluster B are plotted on a spider-web plot (Fig. 3), it can be seen that all the wines contained in cluster B (Fig. 2) possess rich fruit, woody and sweet associated aromas, and this influences their position on the perceptual PCA bi-plot. This tendency is also illustrated in Table 2, with some of the group B wines illustrating varying, but significantly higher percentages of the latter three aroma attributes. This could be why no definite discrimination could be made between the two styles contained in the Rich and Ripe style of Chenin blanc and only one group was formed to include both wooded and unwooded Chenin blanc wines. It therefore seems that according to this group of wines, the Rich and Ripe wooded and unwooded styles share quite a few qualities which can make discrimination between the two styles very complex. The same conclusion was made in Chapter 3 when all 25 bush vine Chenin blanc wines were analysed using DSA. When the results from the winemakers questionnaires are considered (Addendum B), it is indicated that the wines that received wood contact during the winemaking process are Wines 4, 5, 8, 15, 21, 22, 23 and 25. All of these wines, with the exception of Wines 8 and 15, are positioned in cluster B (Fig. 2). Interestingly, Wines 8 and 15 are positioned with the Fresh and Fruity group (cluster A, Fig. 2). The spider web plot has shown that all the wines in the Rich and Ripe side of the PCA bi-plot (Fig. 2) possess a woody aroma characteristic, albeit varying in intensity. Since the percentage, duration or type of wood contact, all contributing factors in the resulting sensory profile of a wooded wine (Ortega-Heras et al., 96
105 2010), was never established, it can be assumed that a Chenin blanc wine receiving any wood contact during the winemaking process does not necessarily have to be classified as a Rich and Ripe wooded style of Chenin blanc. It might be that the wood contact that Wines 8 and 15 received was of such nature that the fresh and fruity characteristics of the wine were never compromised. Although it is not the purpose of this paper to ascertain whether the sensory attributes illustrated in Fig. 2 are in accordance with the style classification of South African Chenin blanc wines, it is clear that a mismatch exists between the winemakers style classification and the sensory characteristics identified during DSA. This mismatch can be illustrated by colouring the wines on the PCA bi-plot according to the styles assigned to the wines by their respective winemakers (Fig. 4a) and according to whether or not a wine received wood contact during the winemaking process (Fig. 4b). The same mismatch can be seen when the DSA intensity data is used to categorise or segment the wines according to dissimilar attributes. Agglomerative hierarchical clustering (AHC) was firstly applied using Ward s method (XLStat, Addinsoft, France). This method calculates the dissimilarity between the N objects. This analysis segmented or categorised the wines into three clusters. The cluster information was added as category variables to the DSA dataset, where after Discriminant Analysis (DA) was performed. Figure 5 contains the DA plots showing the discrimination between the three styles of Chenin blanc as assigned to the wines by their respective winemakers (Fig. 5b), as well as clustering of the wines into groups 1, 2 and 3 according to the DSA aroma profiles (Fig. 5a). Cluster 1 (Fig. 5a) contains Wines 3, 8, 10, 13, 15 and 24, these six wines were also were grouped on the left side of F1 (Fig. 2) and are illustrative of Chenin blanc wines with a high degree of fruitiness. Cluster 2 (Fig. 5a) contains four wines (Wines 4, 5, 23 & 25). These wines were all situated on the far right side of Fig. 2, thus illustrating high intensities of aroma attributes rich fruit, sweet associated and woody. Wines 11, 16, 20, 21 and 22 all form part of cluster 3. In Fig. 2, the latter wines are situated midway between the fruity wines (cluster 1) and the wines with high intensities of rich fruit, sweet associated and woody notes (cluster 2). The categorisation of wines illustrated in Fig 5a indicates that DSA data can be used to categorised wines according to aroma attributes (cluster 1), but also according to the respective intensities within the wine style of Rich and Ripe (clusters 2 & 3). The DSA data were also used to cluster the wines according to the Chenin blanc style designations as indicated by the winemakers, i.e. Fresh and Fruity, Rich and Ripe Unwooded and Rich and Ripe Wooded. There is no complete similarity between the clusters of Fig. 5a and 5b. This might be caused by the mismatch between the style assigned to the wine by its winemaker and the sensory characteristics as determined for that wine during DSA. As an example, Wine 11 was classified by the winemaker as a Chenin blanc wine with a Fresh and Fruity style (Fig. 4a), however, according to the PCA bi-plot this wine associated strongly with the attributes sweet associated and rich fruit (Fig. 2; Table 2), and much less with Tropical fruit (Fig. 2; Table 2). These results indicate that DSA data can be used to segment or classify wines, however, it is important to keep in mind that the segmentation or classification works best if the underlying DSA sensory attribute structure depicted in the PCA plot is used. 97
106 Table 2 AVOVA results for the 15 bush vine Chenin blanc wine samples analysed by means of DSA. LSD = Least significant difference. Samples with a different superscript in the same row differ significantly at the 5% level of significance. Aroma attributes (A) A_TROPICAL A_Guava A_Pineapple A_Honeyblossom A_STONEFRUIT Wines b g def a a ef a a c cd f cd fg a fg cd e e b b e a bc e e e ed e b e bc e e b c e sb b e d ed ed e a e ab ab ab a ab ab ab a ab ab ab b b ab ab bc ab c ab c c ab bc c c c c c a ab LSD (p=0.05) A_RICHFRUIT A_Marmalade A_Compote A_Raisin A_FLORAL ef bc cd f g bc g g ed bcd ab f b f a def cde cd efg g de gf fg bc fg a def b fg ab cd bcd ab cd d cd d d cd ab bcd bcd a bc a def 3.052b cde bc cdef f a ef ef bc bc b bcd bc cdef a abc cd abcd abc abcd bcd abcd a d d ab d d d ab A_SWEET ASSOCIATED fg b bcd cdef h bc gh efg efgh b ab fg bc bcde a A_Honey ef de de de g bc fg de cd ab ab ef ab cde a A_VEGETATIVE A_Green pepper A_WOODY A_Planky A_High roast A_SPICY cd d d ab a d ab d bc d bc ab cd d d bcde e bcd ab a de bcd de abc bcde bcd ab bcde bcde e fgh a c fgh gh ef h fg d fg de c b fgh b d ab ab cd d bc d cd cd cd bc a a d bc fgh a c gh gh fg h ef cd efg de cd b fgh b cde cd b de e cde de bc e de cde de a cde a
107 6 Biplot (axes F1 and F2: %) 4 A Wine 15 A_STONEFRUIT A_FLORAL Wine 24 A_Honeyblossom B Wine 25 F2 (17.48 %) Wine 13 A_Pineapple Wine 3 A_TROPICAL A_Guava Wine 8 A_SWEETASSOCIATED Wine 11 A_Raisin A_SPICY A_Honey Wine21 A_RICHFRUIT A_Compote A_Marmalade Wine 5 Wine 20 A_Highroast Wine 4 A_WOODY A_Planky -4 Wine 10 A_VEGETATIVE A_GreenPepper Wine 16 Wine 23-6 Wine F1 (52.37 %) Figure 2 PCA bi-plot generated from the DSA data using only aroma attributes and the 15 wines included in the sorting task. A_RICHFRUIT A_SPICY 40 A_Marmalade 30 Wine 4 A_Highroast A_Compote Wine 5 Wine 11 Wine 16 Wine 20 A_Planky A_Raisin Wine 21 Wine 22 Wine 23 A_WOODY A_SWEETASSOCIATED Wine 25 A_Honey Figure 3 Spider web plot of the wines associated with the woody, spicy, sweet associated and rich fruit aroma attributes. 99
108 a) b) Biplot (axes F1 and F2: %) 6 6 Biplot (axes F1 and F2: %) Wine 15 A_Honeyblossom Wine 15 A_Honeyblossom 4 A_STONEFRUIT A_FLORAL Wine 24 Wine 25 4 A_STONEFRUIT A_FLORAL Wine 24 Wine 25 F2 (17.48 %) Wine 13 Wine 8 A_Pineapple Wine 3 A_TROPICAL A_Guava Wine 20 A_SWEETASSOCIATE D Wine 11 A_Raisin A_SPICY A_Honey Wine21 A_Marmalade A_RICHFRUIT A_Compote A_Highroast A_WOODY Wine 5 Wine 4 F2 (17.48 %) Wine 13 Wine 8 A_Pineapple Wine 3 A_TROPICAL A_Guava Wine 20 A_SWEETASSOCIAT ED Wine 11 A_Raisin A_SPICY A_Honey Wine21 A_RICHFRUIT A_Compote A_Marmalade A_Highroast A_WOODY Wine 5 Wine 4 A_Planky A_Planky -4 Wine 10 A_VEGETATIVE A_GreenPepper Wine 16 Wine 23-4 Wine 10 A_VEGETATIVE A_GreenPepper Wine 16 Wine 23-6 Wine 22-6 Wine F1 (52.37 %) F1 (52.37 %) Figure 4 PCA bi-plots generated from DSA data using only the aroma attributes. a) Wines are coloured according to the styles allocated to them by their respective winemakers. Fresh and Fruity style wines are indicated in green and Rich and Ripe style wines are indicated in red. b) Wines are coloured according to whether or not they received wood contact. Unwooded wines are indicated in blue and wooded wines are indicated in orange. 100
109 A) Observations (axes F1 and F2: %) 10 B 13 Observations (axes F1 and F2: %) F2 (0.01 %) Centroids F&F R&RW F2 (0.03 %) R&RUW F&F R&RUW R&RW Centroids -10 F1 (99.99 %) -10 F1 (99.97 %) Figure 5 Discriminant analysis (DA) plots showing how the 15 Chenin blanc wines segment when using the following classification variables a) Clusters 1, 2 and 3 as indicated by Ward s clustering; b) Wine style classification (F&F = Fresh and Fruity; R&RUW = Rich and Ripe Unwooded; R&RW = Rich and Ripe Wooded) as indicated by the respective winemakers. 101
110 3.2. Application of sorting for the sensorial profiling of bush vine Chenin blanc wines During the sorting task, the panel of winemakers sorted the 15 wines into a minimum of three and maximum of 6 groups. Thereafter they were instructed to assign aroma attributes to each group in a descriptive step. It was decided to use experts for the sorting task as it was previously found that experts or industrial professionals are more competent in discriminating between products (Solomon, 1990; Lawless, 1984). This is because experts usually have repeated exposure to specific products, resulting in them having analogous concept formation (O Mahony, 1991) and the ability to verbalise product differences and similarities (Parr et al., 2007). The statistical analysis techniques of MDS, DISTATIS and CA were used to analyse the sorting data Evaluation of MDS and DISTATIS plots created from the sorting data By subjecting sorting data to DISTATIS, two different plots were generated, one plot showing the similarity between judges and the other the similarity between products (Abdi et al., 2007). From the judges DISTATIS plot (Fig. 6), it can be seen that one judge, Judge 4, sorted the wines very differently when compared to the rest of the expert panel. To ensure that this person s data did not influence the rest of the panel s results, Judge 4 was removed from the data set before further MDS and DISTATIS were conducted. The MDS plot, showing the grouping of the wines for the pooled data, excluding Judge 4, is shown in Fig. 7a. When the MDS plot (Fig. 7a) is considered, no definite groupings or tight clustering can be observed. Only one distinct separation can be seen on PC 1 where the wines are divided into 2 groups. Fig. 7b contains the PCA bi-plot generated from the DSA data of the same 15 wines. When the wines are marked in corresponding colours, it can be seen that a similar type of separation can be seen in the MDS plot (Fig. 7a), as well as the PCA bi-plot (Fig. 7b). The position or grouping of only one wine, Wine 3, seems to disagree between the two plots. This result indicates that both methodologies, sorting and DSA, can be used for broad-based clustering. Fig. 8a contains the DISTATIS plot, a method where similarity between the individual judges distance matrices are analysed. According to Fig. 8a, two very distinct clusters and one more scattered cluster exist. To compare the groupings found in the DISTATIS plot (Fig. 8a; generated from sorting data) with that of the PCA bi-plot (Fig. 8b; generated from the DSA data), the wines in the PCA bi-plot (Fig. 8b) were marked in colours corresponding to that illustrated in the DISTATIS plot (Fig. 8a). One of the clusters in the DISTATIS plot (Fig. 8a), circled in blue, contains the same wines (Wines 8, 10, 13, 15 and 24) as that associated with the fresh fruit, floral and vegetative aroma attributes in the PCA bi-plot (Fig. 8b). The latter cluster of five wines was also similarly grouped in the MDS plot (blue group, Fig. 7a). The other distinct cluster in Fig. 8a (circled in red) contains four wines; Wines 4, 5, 23 and 25. In the PCA bi-plot (Fig. 8b) these four wines associate with high levels of woody, spicy, sweet associated and rich fruit aroma attributes. Note that the AHC of the DSA data also resulted in a cluster containing these four wines (Fig. 5a, cluster 2). This result again illustrates that DSA, followed by Ward s clustering, and the technique of sorting using DISTATIS can result in similar groupings. The third cluster on the DISTATIS plot (Fig. 8a) containing the groups of dispersed samples (circled in yellow), include Wines 3, 11, 16, 20, 21 and 22. Except for Wine 3, 102
111 the latter group of wines are positioned in the centre of the PCA bi-plot (Fig. 8b), right in between the blue and the red wines, illustrating moderate levels of woody, spicy, rich fruit and sweet associated aroma attributes. Again, except for Wine 3, the classification illustrated in Fig. 5a (Wines 11, 16, 20, 21 & 22) is rather similar to that depicted in Fig. 8a and Fig. 8b. It thus seems that Wine 3 is classified differently when comparing sorting and DSA data. In the PCA bi-plots (Fig. 7b & 8b), as well as cluster 1 of Fig. 5a, Wine 3 forms part of the fresh fruit, floral and vegetative aroma grouping. However, in the MDS (Fig. 7a) and DISTATIS plots (Fig. 8a), Wine 3 could broadly be classified as having Rich and Ripe type qualities (i.e. associating with the attributes rich fruit, sweet associated and woody). The reason for Wine 3 being sorted differently in the two methods can be evaluated in further detail by creating a spider web plot (Fig. 9) of the six wines grouped together in the PCA bi-plot, i.e. near the attributes stone fruit, floral, pineapple, guava, tropical, vegetative and green pepper aroma. According to Fig. 9 and Table 2, it is clear that Wine 3 scored slightly differently when compared to the rest of the wines grouped together in the PCA bi-plot (Wines 8, 10, 13, 15 and 24; Fig. 7b & 8b). Wine 3 scored significantly lower for the attribute tropical aroma in DSA. Wine 3 also differed significantly from Wines 10, 13 and 15 for rich fruit aroma and Wines 10 and 24 for sweet associated aroma at the 5% level of significance. It thus seems that the relatively low intensity of the tropical aroma and the moderately high intensity of rich fruit that resulted in Wine 3 being grouped away from the tropical wines by the sorting panel as illustrated in the MDS plot (Fig. 7a). Many researchers (Blancher et al., 2007; Campo et al., 2008; Cartier et al., 2006; Faye et al., 2004, 2006; Saint-Eve et al., 2004) have compared the spatial plots obtained by sorting and DSA and found that comparable plots can be obtained by these two methods. It was also found that reasonably similar clusters formed for both these methods, even though the clusters formed in the DSA were better correlated to the plots obtained by flash profiling than the sorting task (Blancher et al., 2007) and that the position of one or two samples differed between the perceptual plots (Cartier et al., 2006). Three of the aforementioned studies used the exact same panel to perform the sorting task and DSA (Campo et al., 2008; Cartier et al., 2006; Saint-Eve et al., 2004), while the other studies used a trained panel, with experience, to perform the DSA and a naïve panel to execute the sorting task (Blancher et al., 2007; Faye et al., 2004, 2006). As already indicated, we decided to use a trained DSA panel with vast experience in the methodology of DSA, and an expert panel of winemakers/wine researchers to perform the sorting task. Our results show that both panels were competent in the classification of the 15 wines. It is, however, important to keep in mind that the PCA and DA plots from DSA were created from quantitative data in the form of intensity scores (Lawless & Heymann, 2010) and MDS and DISTATIS plots from sorting data where distance matrices containing 1 s and 0 s were used to indicate whether or not two products are contained in the same group (Abdi et al., 2007). Even though the input data for the different statistical methodologies are very different, the spatial plots obtained by DA and PCA (using intensity scores), as well as MDS and DISTATIS (using categorical data) were reasonably comparable for this group of 15 wines. Both methods can thus be regarded as efficient methods for the evaluation of the similarity which exists between wines and thus also the grouping or categorisation of wines. 103
112 0.6 Judge Judge Judge 2 Judge 7 Judge 3 PC2(11.3%) Judge 10 Judge 8 Judge Judge Judge PC1(38.1%) Figure 6 DISTATIS plot showing the similarity between the judges used in the sorting task. 104
113 a) b) Scatterplot 2D Final Configuration, dimension 1 vs. dimension Dimension F2 (17.48 %) Wine 13 Wine 10 Wine 8 Biplot (axes F1 and F2: %) Wine 15 A_STONEFRUIT A_FLORAL Wine 24 A_Pineapple Wine 3 A_TROPICAL A_Guava A_VEGETATIVE A_GreenPepper A_Honeyblossom Wine 11 A_Raisin A_SPICY A_Honey Wine21 A_RICHFRUIT A_Compote Wine 5 A_Marmalade Wine 20 Wine 4 A_Highroast A_WOODY Wine 16 A_SWEETASSOCIATE D A_Planky Wine 23 Wine Wine Dimension F1 (52.37 %) Figure 7 a) MDS plot of the sorting task data and b) PCA bi-plot of the DSA data showing the similarity between the 15 wines analysed. The wines are marked in corresponding colours on both plots. 105
114 PC2(14.3%) a) 0.4 b) F2 (17.48 %) Biplot (axes F1 and F2: %) Wine 15 A_Honeyblossom A_STONEFRUIT Wine 25 A_FLORAL Wine 24 A_Pineapple Wine 3 A_TROPICAL Wine 8 A_Guava Wine 13 A_VEGETATIVE Wine 10 A_GreenPepper A_SWEETASSOCIATED Wine 11 A_Raisin A_SPICY A_Honey Wine21 A_RICHFRUIT A_Compote Wine 5 A_Marmalade Wine 20 Wine 4 A_Highroast A_WOODY A_Planky Wine 16 Wine 23 Wine PC1(23.9%) F1 (52.37 %) Figure 8 a) DISTATIS plot of the sorting task data and b) PCA bi-plot of the DSA data showing the similarity between the 15 wines analysed. The wines are marked in corresponding colours on both plots. 106
115 A_Highroast A_Planky A_WOODY A_SPICY A_TROPICAL A_Guava A_Pineapple A_STONEFRUIT A_RICHFRUIT Wine 3 Wine 8 Wine 10 Wine 13 Wine 15 A_GreenPepper A_Marmalade Wine 24 A_VEGETATIVE A_Compote A_Honey A_Raisin A_SWEETASSOCIATED A_Honeyblossom A_FLORAL Figure 9 Spider web plot showing how Wine 3 differs from the other wines that are grouped together on the PCA bi-plot (Fig. 7b) Evaluation of the CA plot produced from the sorting task with a descriptive step After completion of the sorting task, the panel had to assign to each group of wines a set of aroma descriptors most significant in their grouping choice. Aroma descriptors given to the wine groups ranged from two to ten descriptors and included many different terms. To reduce the number of terms used as input in the correspondence analysis (CA) plot, aroma attributes given to the groups were condensed into broader groups or categories. This was done by using the Chenin blanc aroma wheel (Addendum C), compiled by the South African CBA, and the descriptors generated during DSA (Table 1). Both these classifications consist of broader terms (1 st tier) and specific terms (2 nd tier). The 80 different aroma descriptors originally obtained from the expert panel were reduced by assigning firstly 2 nd tier and then 1 st tier attribute terms to the respective descriptors. A final list of 12 descriptors was available as input for the CA (Table 3), however, only 9 of the 12 first tier descriptors generated from the sorting task data were finally used in the CA as these descriptors had the largest influence on explaining the difference between the wines. The nine descriptors were mineral, earthy, spicy, bottle age, rich fruit, floral, woody, sweet associated and fresh fruit. The resulting plot from the CA of the sorting task with a descriptive step data is shown in Fig. 10. Fig. 10 shows the relationship between the products evaluated in the sorting task and the descriptors assigned to the different groups by the individual judges. A CA plot can be interpreted employing the same 107
116 basic principles as when interpreting a PCA bi-plot (Beh et al., 2011), with highly correlated products and sensory attributes laying in close proximity to each other (Lawless & Heymann, 2010). In the CA plot (Fig. 10), it can be seen that a definite separation exists between the aroma attributes associated with the different dry styles of Chenin blanc. The separation between the Fresh and Fruity and the Rich and Ripe styles can be seen on PC 1 with the fresh fruit, floral and mineral aroma attributes lying on the right side of the plot and the aroma attributes earthy, spicy, bottle age character, rich fruit, woody and sweet associated lying on the left side of the CA plot. The latter set of attributes on the left side of the CA plot indicates that no definitive discrimination can be made between the wooded and unwooded styles included in the Rich and Ripe Chenin blanc style. When conducting sorting with a descriptive step, it is important to consider the importance of the respective attributes in the CA plot. To illustrate the latter, standardised deviates, as calculated using Statistica software (Statistica 10, StatSoft Inc.), were plotted to show how the wines differed from the average value generated for a specific attribute (Fig.11). When considering the association of different aroma attributes in Fig. 10, it can be seen that a woody aroma is well-correlated with sweet associated aroma. This is also indicated in Fig. 11, specifically in Wines 4, 5 and 23. The same can be said for the aroma attributes bottle age and rich fruit (Fig. 10) as illustrated in Wine 16 (Fig. 11). Wine 25 is positioned in between several aroma attributes, and is thus associated with the aroma characteristics woody, sweet associated, earthy and spicy (Fig. 10 & 11). Wines 3 and 11 are positioned between the attributes spicy, earthy and mineral (Fig. 10 & 11). Wines 21 and 22 are positioned closer to the sweet associated aroma attribute and woody aroma attribute respectively, whilst the position of Wine 20 seems to be influenced by both the sweet associated and fresh fruit aroma attributes (Fig. 10 & 11). Wines 8, 13, 15 and 24 are associated with the fresh fruit and floral aroma attributes, with Wines 8 and 13 being more closely correlated to the fresh fruity aroma attribute and Wines 15 and 24 with floral aroma (Fig. 10 & 11). Although Wine 10 is positioned in the Fresh and Fruity side of PC 1, it also associates significantly with the attribute mineral. 108
117 Table 3 Aroma descriptor categories used in the CA. Descriptors given by panellists 2 nd tier attributes from CBA aroma wheel Bottle Age Bottle Age Bottle Age Buttery Creamy Diacetyl Dry Grass Dusty Earthy Hessian Oats Whiskey Yeast Floral Flowery Honey Blossom Jasmine Light Perfume White Blossoms Citrus Grapefruit Lime Naartjie Orange Orange Peel Less Ripe No Obvious Wood Fresh Fruit Fruity Ester Compounds Fig Apple Apricot Peach Pear Quince Granadilla Guava Litchi Mango Melon Passion Fruit Pineapple Tropical Flinty Mineral Paraffin Buttery Buttery Buttery Earthy Earthy Earthy Earthy Earthy Earthy Earthy Floral Floral Floral Floral Floral Floral Citrus Citrus Citrus Citrus Citrus Citrus Fresh Fresh Fresh Fruit Fresh Fruit Fruity Fruity Stone Fruit Stone Fruit Stone Fruit Stone Fruit Stone Fruit Tropical Tropical Tropical Tropical Tropical Tropical Tropical Tropical Mineral Mineral Negative 1 st tier attributes to be compared to DSA attributes Buttery Earthy Floral Fresh Fruit Mineral SO 2 Reductive Negative Reductive Negative 109
118 Descriptors given by panellists Dried Fruit Leesy Rich Rich and Ripe Ripe Baked Apple Baked Quince Fruitcake Marmalade Prune Raisins Ripe Fruit Cinnamon Cloves Spicy White Pepper Botrytis Noble Late Honey Muscat Caramel Sweet Vanilla Asparagus Cut Grass Green Green Pepper Pyrazine Vegetative Coffee Oak Toasty Wooded 2 nd tier attributes from CBA aroma wheel Dried Fruit Rich Rich Rich Rich Rich Fruit Rich Fruit Rich Fruit Rich Fruit Rich Fruit Rich Fruit Rich Fruit Spicy Spicy Spicy Spicy Botrytis Botrytis Honey Muscat Sweet-Associated Sweet-Associated Sweet Associated Vegetative Vegetative Vegetative Vegetative Vegetative Vegetative Woody Woody Woody Woody 1 st tier attributes to be compared to DSA attributes Rich Fruit Spicy Sweet Associated Vegetative Woody 110
119 Dimension 2; Eigenvalue: (13.55% of Inertia) 2D Plot of Row and Column Coordinates; Dimension: 1 x 2 Input Table (Rows x Columns): 9 x 15 Standardization: Row and column profiles Mineral Earthy 11 3 Spicy 10 BottleAge 16 RichFruit Floral Woody FreshFruit SweetAssociated Dimension 1; Eigenvalue: (62.49% of Inertia) Figure 10 Plot generated from CA using data obtained in the sorting task with a descriptive step. 111
120 4 FreshFruit BottleAge Woody SweetAssociated Floral Mineral RichFruit Earthy Spicy 3 2 Standardized deviates Wines Figure 11 Histogram showing the difference in standardised deviates from the average aroma for the different wines as determined during the descriptive phase of the sorting task. 112
121 3.3. Comparison of sorting and descriptive sensory analysis as techniques in the determination of the sensory profile and classification of bush vine Chenin blanc wines To evaluate the efficacy of the sorting task with a descriptive step as general profiling technique the results of the sorting task will be compared to those obtained through DSA. The CA plot (Fig. 12a) shows the relationship between the wines and the aroma attributes assigned to the different groups by individual judges during the sorting task. The plot shown in Fig. 12b was generated by subjecting the data acquired during DSA to PCA. It can be seen that both plots segregate into two groups on PC 1 of the CA plot (Fig. 12a) and on PC1 of the PCA bi-plot (Fig. 12b). The group marked in green on the PCA bi-plot (Fig. 12b) shows the wines which associate with the aroma attributes that can be related to the Fresh and Fruity style, i.e. the aroma attributes stone fruit, floral, tropical, pineapple, guava, vegetative and green pepper aroma. These wines were then marked in corresponding colours on the CA plot (Fig. 12a) and the majority of wines seem to be associated with the aroma attributes fresh fruit, floral and to a lesser extent with mineral. The second group of wines, on both the PCA and the CA plots, is marked in red and contains the wines associated with aroma attributes related to the Rich and Ripe style of Chenin blanc. Even though the Rich and Ripe style can be divided into two separate styles (wooded & unwooded), no distinct separation can again be seen in either the PCA or CA plots. In the PCA plot (Fig. 12b) the Rich and Ripe wines associated with the aroma attributes woody, high roast, planky, spicy, sweet associated, honey, honey blossom, rich fruit, compote, raisin and marmalade, whereas in the CA plot (Fig. 12a) the wines marked in red associated with woody, sweet associated, rich fruit, spicy, earthy and bottle age. It can be seen from the groupings found in the CA and PCA plots (Fig. 12) that three wines do not have the same spatial positioning and association with the respective wine styles, i.e. Wines 3, 11 and 20. According to Fig. 12a, Wine 3 seems to be associated more strongly with attributes on the left side of the CA plot, Wine 11 is situated midway between the left and right side of the CA plot, whereas Wine 20 seems to be positioned in the direction of the attributes associated with the Fresh and Fruity wine style. In order to understand why these wines are not positioned in a similar fashion in these two plots, the attribute results of the DSA and the sorting task should be evaluated more closely, i.e. the intensity scores given to the different wines during the testing phase of DSA (Table 2), as well as the standardised deviates for the aroma attributes indicated during the sorting task (Fig. 11). In the PCA bi-plot (Fig. 12b), Wine 3 is associated with tropical, guava, pineapple, floral and stone fruit aroma attributes which can be associated with the Fresh and Fruity style of Chenin blanc. Table 2, illustrating the DSA mean attribute values, show that tropical aroma received the highest intensity score and thus represents the most influential aroma attribute in the positioning of Wine 3 on the PCA bi-plot (Fig. 12b). In the histogram representing the sorting data (Fig. 11), it is shown that the position of Wine 3 was determined mainly by the aroma attribute mineral. The negative standardised deviation value for the attribute fresh fruit shows that the winemaker panel did not regard this wine as having any correlation with fresh fruit aroma and thus the Fresh and Fruity style. It is clear that the respective positions of Wine 3 in the PCA and CA plots are the result of the differences in the two methodologies (Lawless & Heymann, 2010). 113
122 When considering the position of Wine 11, the PCA bi-plot (Fig. 12b) placed this wine in close proximity to the aroma attributes rich fruit, spicy, sweet associated, honey, raisin and compote, but the CA plot (Fig. 12a) placed the wine in close proximity to earthy, spicy and mineral aroma attributes. Similarly Wine 20 was viewed by the DSA panel as having low levels of fresh fruity attributes and illustrating a strong rich fruit and sweet associated aroma (Table 2). In contrast Wine 20 and 24 was viewed similarly by the sorting panel, both these wines were classified as having a moderate degree of fresh, fruity character (Fig. 11). When evaluating the descriptive results (Table 2 & Fig. 11) of both methodologies, it can be seen that the sensory profile of these two wines differ significantly when comparing the two methods. The reason for this could be because different panels was used to perform the two methods and that the two panels, because of their difference in experience level, product class knowledge and exposure, described the aroma attributes of this sample differently. The two methods also differ considerably. DSA requires that each wine is profiled separately and that intensity scores are given for the different sensory attributes associated with each wine (Lawless & Heymann, 2010). The descriptive phase of the sorting task, however, requires that the respective groups of products formed during the sorting task should each be awarded a set of sensory descriptors that are applicable to each wine contained within that group (Beh et al., 2011). When evaluating the positioning of another wine, Wine 16, in the PCA bi-plot (Fig. 12b), it can be seen that it is positioned right in between the wooded aroma attributes and the vegetative and green pepper aroma attributes. In the CA plot (Fig. 12a), however, Wine 16 is positioned in close proximity to the aroma attributes bottle age and rich fruit. When Table 2 and Fig. 11 are compared, it is seen that the aroma attribute rich fruit obtained the highest intensity score for DSA and the aroma attribute bottle age obtained the highest positive deviation value for the sorting task. Since the trained panel did not evaluate any of the wines for bottle age character and the aroma attributes bottle age and rich fruit lies so close together on the CA plot (Fig. 12a), it can be assumed that bottle age character and rich fruit aroma are possibly closely related. Other aroma attributes including, tropical fruit, fresh fruit, sweet associated and woody do not compare well for Wine 16 in the respective data sets. 114

123 a) Variables (axes F1 and F2: %) b) Biplot (axes F1 and F2: %) A_STONEFRUIT 4 Wine 15 A_STONEFRUIT A_FLORAL Wine 24 A_Honeyblossom Wine 25 F2 (15.09 %) A_Pineapple A_Guava A_TROPICAL A_FLORAL A_SWEETASSOCIATED A_SPICY A_Honey A_Compote A_Raisin A_RICHFRUIT A_Marmalade A_WOODY A_Planky A_Highroast F2 (17.48 %) Wine 13 Wine 10 A_Pineapple Wine 3 A_TROPICAL A_Guava Wine 8 A_VEGETATIVE A_GreenPepper A_SWEETASSOCIA Wine 11 TED A_Raisin A_SPICY A_Honey Wine21 A_RICHFRUIT A_Compote Wine 5 A_Marmalade Wine 20 A_Highroast Wine 4 A_WOODY A_Planky Wine 16 Wine A_VEGETATIVE A_GreenPepper -6 Wine F1 (56.68 %) F1 (52.37 %) Figure 12 a) CA plot obtained from the sorting task with a descriptive step data and b) PCA bi-plot obtained from DSA. Wines are coloured in corresponding colours in both plots. 115
124 When examining the positioning of Wine 22, it can be seen that in the PCA bi-plot (Fig. 12b) it is positioned in close proximity to the aroma attribute woody. In the CA plot (Fig. 12a), Wine 22 is placed in a group with Wine 21 and thus associates with the aroma attribute sweet associated. Wine 22 s association with the aroma attribute sweet associated is, however, not reflected in the histogram (Fig. 11) where the influence of the various aromas in the positioning of the wines on the CA plot is illustrated. When looking at the DSA results in Table 2, it can be seen that Wine 22 received the highest intensity scores for woody, followed by rich fruit and then tropical aroma. The histogram representing the sorting task (Fig. 11) shows that the highest positively deviating aroma attribute is woody, followed by bottle age, sweet associated and then floral. The influence of the floral attribute, which occurs on the opposite side of the CA plot (Fig. 12a), might be the causative factor as to why Wine 22 seems to be positioned with Wine 21. It is clear that the two panels evaluated certain aromas differently. To determine how these two panels aroma perception differed, Table 2 and Fig. 11 can again be used to compare the scoring of different aroma attributes. The first aroma attribute to be compared is the attribute tropical from DSA and fresh fruit from the sorting task. As the trained panel did not evaluate fresh fruit as an aroma attribute during DSA, but defined this area of the sensory profile using tropical, pineapple, guava and other fresh fruit aromas, the tropical aroma attribute in Table 2, representing the DSA results, will be compared to the fresh fruit aroma attribute on the sorting task histogram (Fig. 11). The aroma attributes that seem to show a relationship between the two methods are summarised in Table 4. In Table 2 illustrating the DSA means, Wines 3, 8, 10, 13, 15 and 24 scored the highest for tropical aroma. In the sorting histogram (Fig. 11), Wines 8, 10, 13, 15 and 24 scored the highest for the aroma attribute fresh fruit. This shows that only one wine, Wine 3, does not correspond when comparing DSA and sorting as methodologies. The next aroma attribute to be evaluated is woody. In the DSA results table (Table 2), Wines 4, 5, 22, 23 and 25 obtained the highest intensity scores for the aroma attribute woody. In the sorting histogram (Fig. 11), the exact same wines showed the highest positive deviates for the aroma attribute woody. This indicates that the two panels showed good agreement for the perception of a woody aroma. The same cannot be said for the aroma attributes rich fruit and sweet associated. The aroma attribute rich fruit in DSA can be compared to both rich fruit and bottle age in the sorting task results in the CA plot (Fig. 12a). As these two aroma attributes are positioned close together in the CA plot, they can be considered as being related. For rich fruit, only two wines (Wines 20 & 21) resulted in similar results when comparing these two methodologies, however, for sweet associated five wines (Wines 4, 5, 20, 21 & 23) corresponded. When looking at the samples scoring high for sweet associated aroma (Fig. 11 & Table 2), all of the wines showing highly positive deviations for the sweet associated aroma in the sorting histogram (Fig. 11) also scored high intensity scores in the DSA results table (Table 2). This tendency of high sweet associated scores in both methodologies is not the case with Wines 11, 16, 24 and 25. The latter four wines scored reasonably high for sweet associated within DSA (Table 2), but the descriptive step of the sorting task resulted in negative standardized deviates for this attribute (Figure 11). This again illustrates that the basis of the two methodologies are different, DSA results in intensity scores for each attribute with each sample, whereas sorting is a classification method where groups of samples are labelled with a descriptor (Cadoret et al., 2009; Chollet et al., 2011). 116
125 Table 4 Aroma attributes that seem to correspond between the two methods of DSA and the sorting task. First tier DSA aroma attributes evaluated Tropical Stonefruit Second tier DSA aroma attributes evaluated Guava Pineapple Marmalade Sorting task aroma attributes Fresh fruit Fresh fruit Rich fruit Compote Rich fruit & Bottle age Raisin Floral Honeyblossom Floral Sweet associated Honey Sweet associated Vegetative Green pepper No descriptors given during sorting task Planky Woody High roast Woody Spicy Spicy The aroma attributes such as mineral and earthy also play a role in the positioning of the wines on the CA plot (Fig. 11a), however, these two aroma attributes were not evaluated during DSA. This again confirms that perception and concept formation can differ between trained judges and an expert panel. According to Sáenz-Navajas et al. (2012), attributes such as minerality are often used by professionals to describe palate or retronasal aroma sensations. Even though the expert panel, consisting of winemakers/wine researchers, was required to evaluate the wines based on aroma only, it could be argued that the expert panel also saw the necessity to evaluate the wines retronasally in the case of minerality. In previous studies it was found that the sorting task is an effective alternative to conventional DSA in determining the sensory profile of a set of products. The good correlation in the latter studies could probably be ascribed to the fact that the same panel was used to perform the sorting task, as well as DSA (Campo et al., 2008; Cartier et al., 2006; Saint-Eve et al., 2004). In the other studies showing good correlation between the results obtained for sorting and DSA, naïve respondents were used to perform the sorting task with the description step (Blancher et al., 2007; Faye et al., 2004, 2006). It could be argued that a trained panel, albeit knowledgeable in sensory analysis, might not necessarily have had sufficient exposure to or experience of a certain product class and may tend to use everyday language when analysing products (Lawless & Heymann, 2010). When experts need to convey sensory experiences, they often use scientific or work-related terminology (Parr et al., 2007; O Mahony, 1991). It can therefore be deduced that differences in experience, exposure and thus language, as well as the difference in the methods used to evaluate the wines might be the reason for the incompatibilities that exist between the sensory terms and concepts generated by the trained panel in DSA and the expert panel in the sorting task. 117
126 4. Conclusions The aim of this study was to determine whether sorting (primarily a classification technique) and DSA (primarily a profiling technique) are comparable when the aim is to categorise a group of wines, but also to profile wines according to their aroma attributes. Fifteen (15) Chenin blanc wines were sorted using an expert panel consisting of 10 winemakers/wine researchers. After the wines were sorted into groups illustrating similar aroma attributes, the expert panel were instructed to describe each grouping of samples with three to five sensory attributes. The sorting task data, which can be defined as categorical data, were analysed using appropriate methodologies, including MDS, DISTATIS and CA. The exact same wines were analysed using a trained panel of judges and the test technique of DSA. In DSA, the respective aroma attributes were quantified for each wine and intensity scores were indicated for each attribute in the respective samples. The intensity scores, i.e. interval data, were analysed using PCA and DA. In this study both the sorting and DSA data resulted firstly in plots indicating groupings of wines that were reasonably similar. Therefore both sorting, using an expert panel (i.e. person illustrating significant knowledge of wines), and DSA, using a trained sensory panel, resulted in plots categorising Chenin blanc wines produced from bush vines as either belonging to the Fresh and Fruity style or the Rich and Ripe style. The advantage of sorting as technique, as well as the utilisation of an expert panel, is that it is quick and easy to use, whereas the training of a DSA panel and the resultant testing phase can be viewed as being reasonably time consuming and in many cases expensive to administer. There were, however, differences between the resulting plots of these two techniques. The differences in the positioning of some of the wines on the PCA bi-plots (resulting from DSA) and the MDS/DISTATIS plots (generated from the sorting task data) could be attributed to the fact that PCA bi-plots were created using interval data, whereas the MDS/ DISTATIS plots resulting from the sorting task were created using categorical data. Sorting task data differ from quantitative data in the sense that sorting data are created from distance matrices containing 1 s and 0 s. Sorting data thus only indicate whether or not two products are grouped together. In contrast, DSA data are classified as continuous interval scale data and the resultant PCA plots using the correlation matrix can be used to effectively visualise and elucidate the relationships between the samples and their attributes. In the second instance, the sorting task resulted in CA plots illustrating the association of wines and sensory terms describing the aroma of the respective wine groupings. Similar PCA bi-plots were constructed using the DSA data; however, in this instance one could ascertain whether there were significant associations between the respective sensory attributes. This characteristic of PCA bi-plots resulting from DSA data can be regarded as a major advantage in sensory research. It should be noted that although CA and PCA bi-plots can be viewed as reasonably similar, however, there were significant differences between the outputs of these two methodologies, mainly because the panels differed. The trained panel used for the DSA were experienced in the particular sensory method, but not as familiar with the product being evaluated, i.e. from a technical point of view. The panel used for conducting the sorting task was made up of wine experts or wine professionals. It is known that repeated experiences of a particular product class, as in the 118
127 case of wine professionals, result in the establishment of a common language, as well as sensory concept alignment. Since the trained panel and the expert panel differed significantly regarding experience, exposure and usage of wine language when completing the task, the two panels used a number of contrasting terms to describe wine quality in DSA and the sorting task. Even though it was established that the sorting task with a descriptive step does not deliver results comparable to those obtained by DSA and that DSA is regarded as an effective sensory technique for establishing the complete sensory profile of a set of products, it was shown that the groupings illustrated in the PCA bi-plots generated from the DSA data and that of the MDS/DISTATIS plots were very similar. This confirms that DSA and sorting are both effective methods when the aim is to study broad-based similarities and differences between products. 119
128 5. References Abdi, H., Valentin, D., Chollet, S. & Chrea, C. (2007). Analyzing assessors and products in sorting tasks: DISTATIS, theory and applications. Food Quality and Preference, 18, Ballester, J., Patris, B., Symoneaux, R. & Valentin, D. (2008). Conceptual vs. Perceptual wine spaces: Does expertise matter? Food Quality and Preference, 19, Beh, E.J., Lombardo, R. & Simonetti, B. (2011). A European perception of food using two methods of corresponding analysis. Food Quality and Preference, 22, Biasoto, A.C.T., Catharino, R.R., Sanvido, G.B., Eberlin, M. N. & Da Silva, M.A.A.P. (2012). Flavour characterization of red wines by descriptive sensory analysis and ESI mass spectrometry. Food Quality and Preference, 21: Bitnes, J., Rødbotten, M., Lea, P., Ueland, Ø. & Martens, M. (2007). Effect of product knowledge on profiling performance comparing various sensory laboratories. Journal of Sensory Studies, 22, Blancher, G., Chollet, S., Kesteloot, R., Hoang, D.N., Cuvelier, G. & Sieffermann, J.M. (2007). French and Vietnamese: How do they describe texture characteristics of the same food? A case study with jellies. Food Quality and Preference, 13, Cadoret, M., Lê, S. & Pagés, J. (2009). A factorial approach for sorting task data (FAST). Food Quality and Preference, 20, Campo, E., Ballester, J., Langlois, J., Dacremont, C & Valentin, D. (2010). Comparison of conventional DSA and a citation frequency-based descriptive method for odor profiling: An application to Burgundy Pinot noir wines. Food Quality and Preference, 21, Campo, E., Do, B.V., Ferreira, V. & Valentin, D. (2008). Aroma properties of young Spanish monovarietal white wines: a study using sorting task, list of terms and frequency of citation. Australian Journal of Grape and Wine Research, 14, Cartier, R., Rytz, A., Lecomte, A., Poblete, F., Krystlik, J., Belin, E. & Martin, N. (2006). Sorting procedure as an alternative to quantitative DSA to obtain a product sensory plot. Food Quality and Preference, 17, Chenin Blanc Association. (n.d.). WWW document. URL September Chollet, S., Leliévre, M., Abdi, H. & Valentin, D. (2011). Sort and beer: Everything you wanted to know about the sorting task but did not dare to ask. Food Quality and Preference, 22, Delarue, J. & Sieffermann, J.M. (2004). Sensory mapping using Flash profile. Comparison with a conventional descriptive method for the evaluation of the flavour of fruit dairy products. Food Quality and Preference, 15, Faye, P., Brémaud, D., Baubin, M.D., Courcoux, P., Giboreua, A. & Nicod, H. (2004). Perceptive free sorting and verbalization tasks with naive subjects: an alternative to descriptive mapping. Food Quality and Preference, 15, Faye, P., Brémaud, D., Daubin, M.D., Courcoux, P., Giboreua, A. & Nicod, H. (2006). An alternative to external preference mapping based on consumer perceptive plotting. Food Quality and Preference, 17,
129 Gómez García-Carpintero, E., Gómez Gallego, M.A., Sánchez-Palomo, E. & González Viñas. M.A. (2012). Impact of alternative technique to ageing using oak chips in alcoholic or in malolactic fermentation on volatile and sensory composition of red wines. Food Chemistry, 134: Hughson, A.L. & Boakes, R. (2002). The knowing nose: The role of knowledge in wine expertise. Food Quality and Preference, 13, Kemp, S.E., Hollowood, T. & Hort, J. (2009). Sensory evaluation: A Practical Handbook. Oxford: Wiley- Blackwell. Lawless, H.T. (1984). Flavor description of white wine by expert and non-expert wine consumers. Journal of Food Science, 49, Lawless, H.T. (1999). DSA of complex odors: Reality, model or illusion? Food Quality and Preference, 10, Lawless, H.T. & Heymann, H. (2010). Sensory evaluation of food: Principles and practices (2 nd ed.). Pp , 231, 234, , 455, New York: Springer. Lawless, H.T., Sheng, N. & Knoops, S. (1995). Multidimensional-scaling of sorting data applied to cheese perception. Food Quality and Preference, 6, Lelièvre, M., Chollet, S., Abdi, H. & Valentin, D. (2008). What is the validity of the sorting task for describing beers? A study using trained and untrained assessors. Food Quality and Preference, 19, Lim, J. & Lawless, H.T. (2005). Qualitative differences of divalent salts: Multidimensional scaling and cluster analysis. Chemical Senses, 30, McEwan, J.A. & Schlich, P. (1991/1992). Correspondence analysis in sensory evaluation. Food Quality and Preference, 3, Meilgaard, M., Civille, G.V. & Carr, B.T. (1999). Sensory evaluation techniques (3 rd ed.). Boca Raton: CRC Press. Næs, T., Brockhoff, P. & Tomic, O. (2010). Discriminant analysis. In: Statistics for sensory and consumer science. P.15. West Sussex, United Kingdom: John Wiley & Sons Ltd. O Mahony, M. (1991). DSA and concept alignment. In: Sensory science theory and applications in foods (edited by H.T. Lawless & B.P. Klein). New York: Marcel Dekker Inc. Ortega-Heras, M., Pérez-Magariño, S., Cano-Mozo, E. & Gonzáles-San José, M.L. (2010). Differences in the phenolic composition and sensory profile between red wines aged in oak barrels and wines aged with oak chips. LWT Food Science and Technology, 43, Parr, W.V., Green, J.A. & White, K.G. (2006). Wine judging, context and New Zealand Sauvignon Blanc. Revue Européenne de Psychologie Appliquée, 56, Parr, W.V., Green, J.A., White, K.G. & Sherlock, R.R. (2007). The distinctive flavour of New Zealand Sauvignon blanc: Sensory characterization by wine professionals. Food Quality and Preference, 18, Perrin, L., Symoneaux, R., Maitre, I., Asselin, C., Jourjon, F. & Pages, J. (2008). Comparison of three sensory Napping procedure: Case of methods for use with the ten wine from Loire valley. Food Quality and Preference, 19, Popper, R. & Heymann, H. (1996). Analyzing differences among products and panellists by multidimensional scaling. In: Multivariate analysis of data in Sensory Science (edited by T. Næs & E. Risvik). Pp Amsterdam: Elsevier Science B.V. 121
130 Preys, S., Mazerolles, G., Courcoux, P., Samsona, A., Fischer, U., & Hanafib, M., Bertrand, D. & Cheynier, V. (2006). Relationship between polyphenolic composition and some sensory properties in red wines using multiway analyses. Analytica Chemica Acta, 563: Sáenz-Navajas, M., Campo, E., Avizcuri, J.M., Valentin, D., Fernández-Surbano, P. & Ferreira, V. (2012). Contribution of non-volatile and aroma fractions to in-mouth sensory properties of red wines: Wine reconstitution strategies and sensory sorting task. Analytica Chimica Acta, 732, Saint-Eve, A., Kora, E.P. & Martin, N. (2004). Impact of the olfactory quality and chemical complexity of the flavouring agent on the texture of low fat stirred yogurts assessed by three different sensory methodologies. Food Quality and Preference, 15, Shapiro, S. S., & Wilk, M.B. (1965). An analysis of variance test for normality (complete samples). Biometrika, 52, Solomon, G. (1997). Conceptual change and wine expertise. The Journal of the Learning Sciences, 6, Solomon, G.E.A. (1990). Psychology of novice and expert wine talk. American Journal of Psychology, 130, Stone, H. & Sidel, J. (1993). Sensory Evaluation Practices. San Diego: Academic Press, Inc. Tang, C. & Heymann, H. (2002). Multidimensional sorting, similarity scaling and free-choice profiling of grape jellies. Journal of Sensory Studies, 17,
131 Chapter 5 Effect of cues relating to wine trellising system and vine age on consumer liking of South African bush vine Chenin blanc wines 123
132 CHAPTER 5: Contents 1. Introduction Materials and methods Consumers Wine selection Questionnaire Presentation of samples and testing procedure Statistical analysis procedures Results and discussion Socio-demographic information of consumers Consumer opinions on Chenin blanc wine and other wine-related aspects Consumer liking of six Chenin blanc wines produced from bush vines Consumer liking of wines when tasted blind Sensory drivers for consumer liking Effect of wine-related cues on consumer liking of six Chenin blanc wines produced from bush vines Conclusions References
133 1. Introduction A consumer s hedonic response to a food product can be influenced by many factors. These factors include consumer characteristics (age, gender, level of education, salary, etc.), intrinsic food qualities (texture, aroma, flavour, etc.) and other extrinsic product factors such as price, convenience, religious practices, et cetera. Apart from these factors, consumer attitude, perception and opinion can also influence a consumer s hedonic response (Costell et al., 2010). This is because the consumption of food and drink not only involves the senses of touch, taste, smell and sight, but is also an emotional and cognitive experience (Ferrarini et al., 2010). When faced with a purchasing decision, consumers must consider and judge a wide range of products in a relatively short time period (Britton, 1992) using packaging and label information to justify their choice (Lockshin et al., 2006). At point of purchase, these extrinsic product cues are usually the main drivers of purchase intent (Mueller et al., 2010b). The availability of product information can influence the value a consumer attaches to a product as this information is utilised by the consumer as a quality indication to infer expected liking. Expected liking is formed when only extrinsic cues are taken into consideration without experiencing any of the intrinsic or sensory characteristics of a product (Lange et al., 2002). When the product is tasted or experienced, the perceived sensory characteristics and the expectation created before tasting are weighed up to shape a general product appraisal (Lange et al., 2002) and this can influence the consumer s sensory experience (Deliza & MacFie, 1996). According to the expectation disconfirmation framework, expected liking can be confirmed or disconfirmed (either positively or negatively) when the product is actually tasted. Whether or not the actual sensory experience satisfies (confirms), disappoints (negative disconfirmation) or exceeds (positive disconfirmation) a consumer s expectation, it will influence the overall pleasure experienced. Four psychological-based theories are used to explain how expectation disconfirmation affects product degree of liking: assimilation, contrast, assimilation-contrast and generalised negativity (Cardello & Sawyer, 1992; Tuorila et al., 1994; Deliza & MacFie, 1996). The Assimilation model predicts that disconfirmation, irrespective of whether the disconfirmation is positive or negative, will be taken in by the consumer causing the response to move in the direction of the expected liking (e.g. a consumer s real liking will not differ much from their expected liking, despite the disconfirmation experienced when the product is tasted). The Contrast model proposes the opposite of the Assimilation model and predicts that disconfirmation will lead to a response in the opposite direction of the expected liking (e.g. a product will be liked less if the expected liking is disconfirmed). The Assimilation-contrast model, a combination of the Assimilation and the Contrast model, is based on the presence of disconfirmation limits (Costell et al., 2010). It predicts that when a product differs slightly from the expectation created, the Assimilation model will be followed. When the difference between expected and real liking is very different, the Contrast model will be followed (Cardello, 1994). The Generalised negativity model expects that any disconfirmation will lead to a decrease in consumer liking (Costell et al., 2010). To ensure that consumers experience confirmation of the expected liking upon the tasting of the product, it is crucial to perform consumer research. Consumer research is not only essential to determine whether the product satisfies consumer needs, but also to understand consumer 125
134 beliefs and to determine how extrinsic product cues are perceived. This knowledge about the consumer is important as all these aspects will influence how consumers evaluate both extrinsic and intrinsic product attributes (Van Kleef et al., 2005). To guarantee success in the marketplace, it is imperative that both the intrinsic (sensory) and extrinsic (non-sensory) attributes be optimised (Mueller & Szolnoki, 2010). When evaluating a wine before it is purchased, the information found on the wine s front and back label is typically used to aid the consumer in their choice (Charters & Pettigrew, 2003; Ling & Lockshin, 2003; Thomas, 2000). Since wine labels are the most economic form of direct communication between the wine producers and the consumer (Rocchi & Stefani, 2005), it is extremely important to use it to convey a message that will add to the value of the product and infer an expectation that will be met when the product is tasted. This is of importance as confirmed expectations will likely lead to a consumer repeating the purchase (Deliza & MacFie, 1996). Even though all extrinsic product attributes, including bottle shape, colour, type of closure and label design are considered during the purchasing process, Mueller et al. (2009) found that label information were considered more important than the visual attributes (e.g. bottle shape and colour) by wine consumers. Shaw et al. (1999) studied the influence of back label information on the consumer and how it adds to the perception of value and quality of wine. They found that flavour descriptions on the label enhanced the consumers perception of quality, but also that production statements (winemaking processes) were highly valued by wine consumers. The terms bush vine and old bush vine can be considered production statements when placed on a wine label as these terms describe conditions or treatments in the vineyard influencing the end product. As research has shown that the bush vine training system and older vineyards tend to produce better quality Chenin blanc wines (see Chapter 2), it could be speculated that indicating this on wine labels could have a positive effect on the quality evaluation of wine during the purchasing process which in turn could positively influence the hedonic response to the product when it is consumed. It is evident that both consumer education and knowledge play a crucial role in this regard, as it could be speculated that a consumer with no knowledge concerning bush vines and old bush vines will not be influenced by statements such as this on a wine label. As the influence of statements pertaining to bush vines and old bush vines on wine labels have previously not been investigated, the objective of this study was to investigate the influence of the terms Bush vine and Old bush vine as extrinsic product cues on the consumer liking of Chenin blanc wines using a group of regular Chenin blanc consumers with differing levels of wine knowledge. 126
135 2. Materials and methods The materials used and methodologies employed to determine whether specific viticulture terms relating to trellising system and vine age influence the consumer s hedonic response to South African Chenin blanc wines produced from bush vines, will be discussed in this section Consumers Seventy (70) consumers were sourced from the Stellenbosch area, South Africa (SA) via wine clubs, the wine industry and Stellenbosch University. This group of consumers consisted of males and females, ranging from the age of 18 to 60 and with varying levels of wine knowledge, consumption frequencies and purchasing objectives. During the consumer analysis, a questionnaire (Addendum I) was used to source demographic information, as well as general information regarding consumption and purchasing behaviour Wine selection Six wines from the 25 commercial Chenin blanc samples originally sourced for sensory and chemical analysis (Chapter 3) were chosen for consumer testing. The original sample set of 25 wines was coded from 1 to 25. The wines retained these codes throughout the project. As the objective of this consumer analysis was to test the influence of extrinsic product cues, other factors influencing liking such as wine style and wine quality was minimised. In Chapter 3, the sensory profile of the full set of wines was determined using descriptive sensory analysis (DSA). Wines showing good variance on the PCA bi-plots (Chapter 3) were chosen to be further analysed by a group of winemakers for overall wine quality (Chapter 4). The overall quality was scored using a 20-point scale (Addendum H) typically used in formal wine shows and competitions (Parr et al., 2006). These quality scores were analysed statistically with Statistica software (Statistica 10, StatSoft Inc., Tulsa, Oklahoma, USA) using ANOVA and it was found that the respective wine samples did not differ significantly (p > 0.05) from each other with regard to overall quality (Fig. 1). This indicated that all the wines were of equal quality regardless of the difference in quality scores. 127
136 17.5 Wine; LS Means Current effect: F(14, 112)=1.2202, p= Type III decomposition Vertical bars denote 0.95 confidence intervals Score Wine Figure 1 LS means plot of the quality scores (out of 20) assigned by an expert panel during the evaluation of 15 wines in a sorting task. To ensure that the effect of the extrinsic product cue on liking was the only effect evaluated, it was important to choose a sub-set of wines belonging to the same Chenin blanc wine style. Unfortunately, this was not possible as a number of the wines used in the previous analyses were sold out at the time of product sourcing for the consumer analysis. The six wines selected for the consumer analysis were thus chosen purely on availability. The sample set therefore included three wines from the Fresh and Fruity style (Wines 8, 10 and 13) and three wines from the Rich and Ripe style (Wines 16, 20 and 25). The wines from the Rich and Ripe style contained two unwooded and one wooded sample Questionnaire The questionnaire (Addendum I) used for the consumer test consisted of four components. The first component sourced the general demographic information, i.e. gender, age, current employment, whether or not the consumers associate actively with the wine industry, how the consumers perceive or rate their own wine knowledge (so-called subjective wine knowledge), as well as purchase intent and consumption frequency of Chenin blanc wines. Most of the answers in this section were categorised for simplified data analysis. 128
137 The second component was the blind tasting of the six wines using the nine-point hedonic scale (Lawless & Heymann, 2010). This scale consists of nine descriptors to help the consumer to describe his/her feeling towards the product evaluated. The descriptors are 9 = Like extremely; 8 = Like very much; 7 = Like moderately; 6 = Like slightly; 5 = Neither like nor dislike; 4 = Dislike slightly; 3 = Dislike moderately; 2 = Dislike very much and 1 = Dislike extremely. At this point of the consumer analysis, the consumers were informed that they will be tasting Chenin blanc wines. The third component of the questionnaire was designed to ascertain the general consumer opinions and perceptions on wines. To determine the latter, general questions regarding wine, white wine and more specifically Chenin blanc were asked. Here the consumer had to use a 9-point scale anchored with either Dislike extremely and Like extremely or Not important and Extremely important. Questions in this section of the questionnaire included how much the consumers liked 1) certain types of wine, 2) certain white wine cultivars, 3) specific styles of Chenin blanc and how important they deemed specific general aspects (e.g. type of closure, price, etc.) when purchasing Chenin blanc. The fourth and final component was the informed tasting of the above-mentioned six wines. In this section, the consumers were presented with wines labelled with the three extrinsic cues: Chenin blanc, Bush vine and Old bush vine. These cues were used to give the consumer additional information on the trellising system, as well the age of the vineyard, however, the Chenin blanc cue was not supposed to reflect any information on the trellising system or age of the vine Presentation of samples and testing procedure The wines were served at room temperature (21 o C) in standard ISO wine tasting glasses covered with small petri dishes to preserve the aroma. The sample size was 30 ml to ensure that the consumer had two to three generous sips to form a hedonic response. The consumers were also given distilled water (21 o C) and were instructed to refresh their palate between samples. During the blind tasting (second component), the respondents were informed that they will be tasting six Chenin blanc wines. The samples were served in randomised order and labelled with random three-digit codes. During the informed tasting (third component), the wines were presented in pairs. Each pair consisted of one wine from the Fresh and Fruity and one from the Rich and Ripe style. The respective wine duos were paired with certain cues, i.e. Chenin blanc, Bush vine, Old bush vine. The order of the wines within each pair was randomised per consumer. In both the blind and the informed tasting, the consumers were asked to indicate their degree of liking on a 9-point hedonic scale Statistical analysis procedures Statistica software (Statistica 10, StatSoft Inc., Oklahoma, USA) was used for all statistical analyses. The Shapiro-Wilk test was used to test for non-normality of the residuals (Shapiro & Wilk, 1965). Residuals 129
138 exceeding 3 were identified as outliers and removed where non-normality was significant (p 0.05). Thereafter ANOVA was performed. The least significant difference (LSD) test was done to calculate differences between treatment means at the 5% level of significance (Lawless & Heymann, 2010). Partial Least Squares (PLS) was used for external preference mapping and was done by regressing consumer preference scores onto the DSA product plot (Martens & Martens, 2001; Meullenet et al., 2002). Preference mapping is a technique that can be used to generate perceptual plots showing hedonic data on a multidimensional plot and how it relates to the products evaluated (MacFie & Thomson, 1988). Spearman rank correlation coefficients were also calculated to quantify the strength of the relationship between two variables (Oliver, 2004). 3. Results and discussion 3.1. Socio-demographic information of consumers The 66 consumers socio-demographic information included gender, age, type of employment, whether or not they are associated with the wine industry, their general wine knowledge and how frequently they consume Chenin blanc wine. The resulting data were converted to percentages and the distribution illustrated in Fig. 2 to 4. According to Fig. 2, it is clear that the majority of the consumers interested in participating in the consumer study on Chenin blanc were female (70%) and quite young (67% were 39 years of age and younger). Thirty six percent (36%) of the respondents were professionals with 59% of the total group being associated with the wine industry in some way or another (Fig. 3). It is also clear that the majority of the consumers who participated in this study had above-average wine knowledge (44%) and consumed Chenin blanc quite frequently. Seventy-seven percent (77%) of the consumer group indicated that they consume Chenin blanc more than 2 to 3 times per month (Fig. 4). According to literature, persons who consume wine more than 2-3 times per month can be considered regular wine drinkers (Marin et al., 2007; Meillon et al., 2010; Mueller et al., 2010a; Mueller & Szolnoki, 2010; Verdú Jover et al., 2004). 130
139 Female Gender 30 Male Age Figure 2 Distribution (in percentage) of consumers sourced for the consumer testing of bush vine Chenin blanc wines: Gender and age. Employment Associated with wine industry Student 24 Assistant 5 Administrative 36 Professional 3 Retired 5 Other Yes 41 No Figure 3 Distribution (in percentage) of consumers sourced for the consumer testing of bush vine Chenin blanc wines: Type of employment and whether or not consumers are associated with the wine industry. Wine knowledge Chenin blanc consumption Total novice 14 Slight knowledge 36 Moderate knowledge 44 Above average 5 Connoisseur 2 Master of wine More than 3 times per week times per week times per month 21 Approx. 4-6 times a year 2 Never Figure 4 Distribution (in percentage) of consumers sourced for the consumer testing of bush vine Chenin blanc wines: Wine knowledge and how frequently they consume Chenin blanc. 131
140 3.2. Consumer opinions on Chenin blanc wine and other wine-related aspects As part of the consumer study, consumer opinions or attitudes regarding wine in general and in particular Chenin blanc was determined. Conceptual questions were used, therefore no actual wine tasting was used to determine consumer opinions. The results can be used to help explain certain trends present in the hedonic data and can aid the researcher to better understand the wine consumer. The consumers were asked to indicate how much they like certain types of wine. The wine types included were: Dry white wine, Semi-sweet white wine, Rosé wine and Red wine. From Fig. 5 it is evident that dry white wine and red wine are preferred by this group of consumers. The liking for these two types of wine does not differ significantly from each other (p > 0.05), but is significantly higher (p 0.05) than the expected liking for rosé and semi-sweet white wine. The wine type that was liked the least and fell into the nine-point hedonic scale category of Dislike slightly, which indicates that these consumers do not consider this wine style acceptable, was semi-sweet white wine. Rosé wines are often thought of as being a sweeter style of wine, which might implicate sweetness as the causative factor for the rosé, as well as the semi-sweet white wine obtaining considerably lower hedonic scores than red and dry white wine. Previous studies have found that younger consumers prefer sweeter wines (Amerine & Ough, 1967). Another outcome would have been expected for this particular question as a large portion (38%) of the respondents included in this study were younger than 30. It is undoubtedly the level of knowledge, education and experience which, irrespective of age, causes these wine consumers to prefer drier styles of wine. The consumers were also asked to indicate their degree of liking for specific white wine cultivars on the nine-point hedonic scale. The white wine cultivars used in this question were Sauvignon blanc, Chenin blanc, Chardonnay, Viognier and Semillon. White wine blends were also included in this question. This list of wine cultivars were chosen in collaboration with an industry role player (I. Smith, Chenin blanc Association, Stellenbosch, SA, 2011, personal communication). The results in Fig. 6 indicate that the expected liking for Sauvignon blanc and Chenin blanc is equally (p > 0.05) high and significantly more (p 0.05) than that of Chardonnay, Viognier, Semillon and the white blends. Of these wines, Semillon is liked the least, but not significantly less (p 0.05) than Chardonnay. Semillon only accounts for 1% of SA s vineyards, including both red and white varieties (South African Wine Industry Information and Systems [SAWIS], 2011), and is mainly used in white blends and rarely sold as a mono-varietal (LaVilla, 2010). Unfamiliarity of the cultivar might be the reason for the low mean score obtained in this particular question. Fig. 6 also indicates that Viognier and white blends are liked equally (p > 0.05) by this group of consumers and that the expected liking for Chardonnay does not differ significantly (p > 0.05) from that of Viognier, white blends and Semillon. 132
141 level; LS Means Current effect: F(3, 123)=52.208, p= Type III decomposition Vertical bars denote 0.95 confidence intervals a a Expected liking c b Dry white wine Semi-sweet white wine Types of wine Rosé wine Red wine Figure 5 Degree of liking for different wine types as indicated by the consumer. Data points with different alphabetical letters differ significantly from each other (p 0.05) a level; LS Means Current effect: F(5, 205)=12.866, p= Type III decomposition Vertical bars denote 0.95 confidence intervals a Expected liking bc b c b Sauvignon blanc Chardonnay Chenin blanc Viognier Semillon White blends White wine cultivars Figure 6 Degree of liking for different white wine cultivars as indicated by the consumer. Data points with different alphabetical letters differ significantly from each other (p 0.05). 133
142 The overall or average degree of liking for Sauvignon blanc and Chenin blanc can be described as somewhere between Like moderately and Like very much. The average degree of liking for Chardonnay and Semillon can be described as lying somewhere between Neither like nor dislike and Like slightly. Since all of the wines were scored on the positive side of the hedonic scale (scale values of 5 to 9) by this consumer group, it can be concluded that this group of white wine cultivars are conceptually regarded as acceptable. When asked how the consumers like certain styles of Chenin blanc, the consumers indicated that they like the Fresh and Fruity style considerably more than the Rich and Ripe Unwooded and Rich and Ripe Wooded styles (Fig. 7). The consumers indicated that they expected to like Fresh and Fruity style Chenin blanc the most, followed by Chenin blanc wines made to a Rich and Ripe Unwooded style with the Rich and Ripe Wooded style Chenin blanc in the last position. Even though all three styles differed significantly from each other (p 0.05) in terms of expected liking, all of them were considered to be acceptable from a hedonic point of view, i.e. none of the consumers scored any of the wines in the Dislike region of the hedonic scale (scores < 5). The consumers were also asked to indicate how much they liked certain production types of Chenin blanc wines. The types of Chenin blanc included were: Trellised vine, Bush vine, Young bush vine and Old bush vine. This question was asked to evaluate expected liking for Chenin blanc wines differing in vineyard attributes, i.e. vine age and training system. Fig. 8 shows that consumers believe that they will like Chenin blanc wines produced from trellised vines, bush vines and old bush vines more than those produced from young bush vines. The degree of liking scores for trellised, bush vine and old bush vine do not differ significantly from each other (p > 0.05), however, consumers believe that they will like Chenin blanc wines produced from young bush vines significantly (p 0.05) less. Even though the expected liking scores for wine produced from different types of vine systems are statistically different, all mean scores fall within the positive range of the 9-point hedonic scale indicating that all vine systems are viewed in a positive manner. This tendency could be explained by the association that old vines and bush vines can result in better quality wines (Van Zyl & Van Huyssteen, 1980a; b). One can assume that the majority of consumers used in this analysis are familiar with the correlation between bush vine or old vine wines and good quality wines, especially since 59% of the consumers were associated with the wine industry. The results in Fig. 9 indicate the importance of certain aspects when Chenin blanc wines are purchased. Consumers indicated that price, vintage and winery or brand was considered most important when purchasing Chenin blanc wines. Consumers also indicated that they do consider information on whether a Chenin blanc wine is produced from old vines or bush vines as important, however, information on the vine age and trellising system was considered significantly less important than vintage, winery and price (p 0.05). Similar results on the importance of winery reputation (which is represented by the winery name or brand on a wine label), vintage and price in a wine purchasing decision have been indicated by other researchers (Combris et al., 1997; 2000; Landon & Smith, 1997; Oczkowski, 2001). For Northern Ireland, European and Australian consumers, price was found to be the most important aspect when wine purchasing decisions were to be made (Chrea et al., 2011; Jenster & Jenster, 1993; Koewn & Casey, 1995; Lockshin et al., 2006). This is because wine price is believed to be dependent on reputation and quality 134
143 (Oczkowski, 2001). Furthermore, price is an important quality cue when a limited number of other cues are available (Cox & Rich, 1967; Dodds & Monroe, 1985; Monroe & Krishnan, 1985; Zeithaml, 1988). Interestingly, the least important aspect was type of bottle closure. Basson (2012) found similar results with red wines and South African consumers. In contrast, research has shown that consumers from the USA prefer natural cork and that screw cap closures had a negative effect on purchase intent. In Australia, however, this aspect was considered less important, mainly because Australian consumers have become accustomed to purchasing premium white wines with screw cap closures (Bleibaum et al., 2005) level; LS Means Current effect: F(2, 82)=18.856, p= Type III decomposition Vertical bars denote 0.95 confidence intervals a 8.0 Expected liking b c F&F R&R UW R&R W Chenin blanc styles Figure 7 Expected degree of liking for different Chenin blanc styles based on the CBA style classification: Fresh and Fruity (F&F), Rich and Ripe Unwooded (R&R UW) and Rich and Ripe Wooded (R&R W). Data points with different alphabetical letters differ significantly from each other (p 0.05). 135
144 8.4 level; LS Means Current effect: F(3, 81)=5.4640, p= Type III decomposition Vertical bars denote 0.95 confidence intervals 8.2 a a a Expected liking Trellised Bush vine Young bush vine Old bush vine Types of Chenin blanc wine b Figure 8 Expected degree of liking for different types of Chenin blanc wines based on training system and vine age. Data points with different alphabetical letters differ significantly from each other (p 0.05) level; LS Means Current effect: F(8, 328)=7.2541, p= Type III decomposition Vertical bars denote 0.95 confidence intervals a 7.5 a a General aspects of CB bc b c b bc bc Price Label Awards Vintage Closure Winery/Brand Bush Vines Origin Old Vines Figure 9 Importance of specific extrinsic aspects when considering Chenin blanc wines. Data points with different alphabetical letters differ significantly from each other (p 0.05). 136
145 3.3. Consumer liking of six Chenin blanc wines produced from bush vines In this section, the consumer liking of six Chenin blanc wines produced from bush vines, as determined in a blind tasting, will be discussed. These results will also be correlated with the results obtained in DSA (Chapter 3) to determine possible drivers of consumer liking. Another topic that will be dealt with in this section is the influence of extrinsic cues related to training system and vine age on the liking of the six Chenin blanc wines. To do this, the results from the blind and informed tasting will be compared Consumer liking of wines when tasted blind From Fig. 10 it is evident that Wines 8, 10, 13 and 20 are equally liked by this group of consumers (p > 0.05). Although the overall liking for the latter four wines differ significantly (p 0.05) from that of Wines 16 and 25, these two wines can still be considered to be reasonably acceptable, as they do not cross over to the Dislike part (scores < 5) of the nine-point hedonic scale. It is also clear that the four Fresh & Fruity style wines and one Rich and Ripe unwooded wine were scored equally high for degree of liking, whereas the other two Rich and Ripe style wines were significantly less preferred. This outcome was expected as this group of consumers also indicated a similar pattern of expected liking, i.e. when probed on how much they like the different Chenin blanc wine styles (Fig. 7). One could speculate that the wines overall quality had an impact on the consumer liking. As indicated in Section 2.2, overall quality scores were assigned to each wine by a group of winemakers (Fig. 1). These quality scores were then correlated to the consumer liking results obtained in a blind tasting and a Spearman rank correlation coefficient was calculated. The results in Fig. 11 shows that poor correlation (r = 0.26; p = 0.62) exists between the wine quality scores and consumer liking. These results indicate that wine quality, as perceived by wine experts, does not always associate with consumer liking. It can be hypothesised that above-average knowledge of wines could influence a consumer s degree of liking. Fig. 12 shows that the group of consumers, who regard themselves as having above-average wine knowledge (so-called subjective wine knowledge), gave a higher overall hedonic score for this set of wines (p 0.05). Consumers with a higher level of knowledge most probably have the ability to appreciate the diversity of different wine types (Charters, 2006). However, when considering the association that consumers have with the wine industry, the overall liking scores for this set of wines were not influenced by the degree in which consumers actively liaise with industry on work-related matters (p > 0.05). 137
146 7.2 Product; LS Means Current effect: F(5, 325)=5.6193, p= Type III decomposition Vertical bars denote 0.95 confidence intervals a a a a 6.6 Consumer liking b F&F R&R UW b F&F F&F R&R W R&R UW Wines Figure 10 Overall consumer liking of six Chenin blanc wines served blind. The Fresh and Fruity style wines are marked with F&F, the unwooded Rich and Ripe style wines are marked with R&R UW and the wooded Rich and Ripe styles wines are marked with R&R W. Data points with different alphabetical letters differ significantly from each other (p 0.05). 6.8 Descriptive Statistics (Spreadsheet9) in consumer liking 3v*6c quality score:liking: r = , p = Spearman r = 0.26 p= Consumer liking Quality score Figure 11 Scatterplot showing the correlation between expert quality scores (out of 20) on the x-axis and consumer liking on the y-axis determined for six Chenin blanc wines tasted blind. 138
147 7.2 Knowledge2; LS Means Current effect: F(1, 64)=10.980, p= Type III decomposition Vertical bars denote 0.95 confidence intervals Consumer liking moderate & lower Knowledge above average & higher Figure 12 Influence of level of subjective wine knowledge on consumer liking of six bush vine Chenin blanc wines. 6.7 Wine Industry; LS Means Current effect: F(1, 64)=.00358, p= Type III decomposition Vertical bars denote 0.95 confidence intervals Consumer liking No Yes Associated with the wine Industry Figure 13 Influence of association with the wine industry on consumer liking of six bush vine Chenin blanc wines. 139
148 Sensory drivers for consumer liking An external preference plot (Fig 14) was created using the method of PLS and regressing the sensory data obtained by DSA (Chapter 3) onto the consumer preference data obtained in the blind tasting of the six Chenin blanc wines. In a PLS plot, attributes closely related to overall consumer liking can be regarded or considered as drivers of liking. According to Fig. 14 it seems as if the overall consumer liking is primarily driven by sensory attributes on the right side of the plot, i.e. tropical aroma and fresh fruit flavour. Attributes on the left side of the plot, i.e. attributes corresponding to the Rich and Ripe style of Chenin blanc such as sweet associated aroma, rich fruit aroma, ripe/cooked fruit flavour, wood flavour, woody aroma and an astringent mouthfeel, are less positively correlated with overall consumer liking. This does not mean that consumers do not like Chenin blanc wines associating with the attributes on the left side of the PLS plot, it only shows that the majority of the consumers used in this study prefer the Chenin blanc wines with a more Fresh and Fruity style. On the contrary, when viewing Fig. 14, it is clear that quite a number of consumers do indeed associate hedonically with wines that are high in Rich and Ripe sensory attributes. 0.8 T_SWEET 0.6 DIMENSION 2(X=18%, Y=16%) A_SWEET ASSOCIATED A_RICH FRUIT C63 F_RIPE/COOKED FRUIT C47 C9 C49 C4 C60 F_WOOD C5 C55 C66 C37 M_ASTRINGENCY C30 A_WOODY C35 C12 C45 C54 C48 C53 C19 C24 C42 C40 C38 C14 C56 C39 C28 C50 C68 C6 C36 C20 C10 C32 C64 C1 C21 C27 C33 C51 C18 C25 C22 C15 C29 C59 C23 C31 C67 C43 C62 C13 C16 C3 C46 C17 C58 C41 C70 C8 C11 C65 C52 C57 Consum er Liking A_TROPICAL F_FRESH FRUITY C26 C34 C2 A_VEGETATIVE T_ACIDITY F_VEGETATIVE DIMENSION 1(X=32%, Y=67%) Figure 14 External preference mapping of DSA and consumer liking data of six bush vine Chenin blanc wines using PLS. Consumers are indicated in green, overall consumer liking is indicated in red and sensory attributes are indicated in blue. The letters A, F, T and M in the sensory attribute labels refer to aroma, flavour, taste and mouthfeel respectively. The data from DSA were used as dataset X and the consumer analysis data were used as dataset Y. 140
149 The blind tasting results (Fig. 10), as well as the conceptual liking results (Fig. 7), confirm that the majority of this group of consumers prefer Chenin blanc wines with a Fresh and Fruity style. However, as indicated in Fig. 14, there is a smaller group of consumers that like the Chenin blanc wines with a Rich and Ripe character and attributes such as woody, ripe fruit and moderate astringency (Basson, 2012) Effect of wine-related cues on consumer liking of six Chenin blanc wines produced from bush vines The influence of extrinsic cues on consumer liking can be observed when the hedonic results from the blind tasting are compared to the hedonic results obtained in the fourth and final section of the consumer analysis, i.e. where the wine samples were served accompanied by the respective cues (e.g. Chenin blanc, Bush vine, Old bush vine ). The individual cues were paired with defined sets of wines, therefore two wines were labelled with the cue Chenin blanc, a further two wines with the cue Bush vine and the last two wines with the cue Old bush vine. According to Fig. 15, the overall degree of liking of wines tasted with and without a cue differ significantly (p = ) and shows that the change in degree of liking when the wines are tasted with a certain cue, irrespective of what the specific cue is, is significantly higher (p 0.05) than when the same wines are tasted in blind conditions. Fig. 15 thus illustrates that the inclusion of a cue can have a significant influence on the overall consumer liking. However, when the influence of individual cues ( Chenin blanc, Bush vine, Old bush vine ) on the consumer liking of the total group of consumers is considered (Fig. 16), no significant trend can be seen (p > 0.05). Although the overall trend is not significant, Wine 25, marked with the cue Old bush vine, is the only wine showing an increase in consumer liking when tasted with the cue. On the other hand, when the role of cues within sub-groups of consumers was analysed, some interesting trends were observed. In Fig. 17a and 17b the consumers were divided according to their active liaison with the wine industry. According to Fig. 17b, consumers who are associated with the wine industry in one way or another tend to be influenced (p 0.05) by cues such as bush vine, however, in many instances this is not the case (p > 0.05) with consumers who are not directly associated with the wine industry (Fig. 17a). For the wines served with the cue Chenin blanc (Wines 8 and 16) it can be seen that the degree of liking did not change significantly between the blind (without cue) and informed tastings (with cue) for both groups of consumers (Fig. 17a & Fig. 17b). For the wines served with the cue Bush vine (Wines 10 and 20) and Old bush vine (Wine 25) it can be seen that both these two cues had no effect (p > 0.05) on the group of consumers not associated with the wine industry (Fig. 17a). They clearly have no perception of these terms and the potential affect that it could have on wine quality. For the group of consumers that do associate with the wine industry the degree of liking for Wine 10 and Wine 13 did not change significantly (p > 0.05) when served with the cue Bush vine and Old bush vine, 141
150 respectively (Fig. 17b). However, for Wine 20 and Wine 25 the respective cues, Bush vine and Old bush vine, had a significant effect (p 0.05) on the liking scores, i.e. the liking scores increased substantially when the respective wines were tasted with additional cues. It seems that this group of consumers are well aware of the fact that bush vines, particularly old bush vines, may result in wines of superior sensory quality, especially if the wines fall within the Rich and Ripe wine style (Loubser, 2008). Clearly this prior knowledge resulted in increased liking scores (Fig. 17b). Whether or not a wine s degree of liking changes significantly when it is served with a cue, could be explained by the so-called expectation disconfirmation framework (Deliza & MacFie, 1996). According to the presumption of expectation disconfirmation, the hedonic response to a product can be influenced by whether or not the expected liking, as caused by extrinsic product attributes (e.g. written cues), is met or not when the product is actually experienced (Lange et al., 2002). It can be argued that Wines 20 and 25, the Rich and Ripe style Chenin blanc wines served with the cues Bush vine and Old Bush vine respectively, obtained significantly higher scores for liking in the informed tasting, mainly because this wine confirmed the persons from industry s belief of what is to be expected from a bush vine Chenin blanc wine. Wine 10 was also served with the cue Bush vine, but did not receive a significantly higher liking score from the group of consumers associated with the wine industry. Wine 10 can be considered as belonging to the Fresh and Fruity style. Persons associated with the wine industry might have argued that the expected liking of this Fresh and Fruity style Chenin blanc was not met when presented with the cue Bush vine, or they may consider the Fresh and Fruity wine style, as opposed to the Rich and Ripe wine style, to be influenced in a lesser manner by a cue such as Bush vine. It thus seems expectation can be created by a statement such as Old bush vine, this in turn influences consumer liking which is usually shaped by past experiences and exposure (Yeomans et al., 2008). Possibly, this is why the cue Old bush vine had dissimilar effects on consumer groups with different levels of objective wine knowledge. Knowledge used by consumers can be described as being either objective or subjective (Dodd et al., 2005). Subjective knowledge is based on the consumer s opinion of how much they know (Brucks, 1985) and is usually described as self-confidence (Dodd et al., 2005). In contrast, objective knowledge is the actual knowledge that an individual has accumulated over time. Previously acquired knowledge is considered as one of the most powerful approaches used by consumers to make purchasing choices (Brucks, 1985). Highly involved consumers tend to rely more on intrinsic wine attributes, as well as winemaking practices while consumers with a lesser product involvement is likely to consult other extrinsic product cues when evaluating product information (Dodd et al., 2005) to form a perception of quality, as well as expected liking. Subjective knowledge was also determined during the consumer analysis by asking the consumer to rate their wine knowledge as: Total novice, Slight knowledge, Moderate knowledge, Above average, Connoisseur and Master of wine. The results are depicted in Fig. 18 and shows the influence of subjective wine knowledge when the samples are served with and without extrinsic cues. No significant interaction (p > 0.05) could be seen between these consumers with differing levels of subjective knowledge, consumer liking and the cues Chenin blanc, Bush vine and Old bush vine. The influence of extrinsic cues on consumer 142
151 liking for both groups of consumers (i.e. with a low and higher level of wine knowledge) is thus not significant. It is thus clear that objective, rather than subjective wine knowledge determines how these extrinsic cues manipulate the hedonic response of a consumer. It can be assumed that persons associated with the wine industry have a higher probability of knowing how these cues relate to wine quality. No other significant interactions (i.e. gender, age, Chenin blanc consumption frequency) were established for this group of consumers. One could furthermore assume that cues such as Bush vines and Old bush vines could possibly result in increased sales, however, it is important to realise that this may not be the case with consumers who are not aware of the potential quality effect of bush vines and old bush vines. This tendency suggests the potential for marketing endeavours and therefore also possible increases in wine sales. Consumer liking Cue; LS Means Current effect: F(1, 65)=20.594, p= Type III decomposition Vertical bars denote 0.95 confidence intervals Blind (no cue) Marked (with cue) Figure 15 Overall change in consumer liking when wines are tasted with additional information (extrinsic cues) as opposed to a blind tasting. 143
152 Degree of liking CHENIN BLANC Consumer Liking*Cue; LS Means Current effect: F(5, 325)=.95039, p= Type III decomposition Vertical bars denote 0.95 confidence intervals BUSH VINE CHENIN BLANC OLD BUSH VINE OLD BUSH VINE BUSH VINE Wines Figure 16 Change in consumer liking from tasting wines in blind conditions to tasting wines with additional cues ( Chenin blanc, Bush vine, Old bush vine ). The results from the blind tasting (no cue) is illustrated by the blue line and the results from the informed tasting (with cue) is illustrated by the red line. 144
153 8.0 Consumer Li ki ng*cue*wi ne Industry; LS Means Current effect: F(5, 320)=3.6338, p= Vertical bars denote 0.95 confidence intervals Degree of liking bcefgh bcefgh CHENIN BLANC R&R UW Wines: 16 abe abefgh CHENIN BLANC F&F 8 ab ab abe abefgh efghi fghi BUSH VINE R&R UW OLD BUSH VINE BUSH VINE F&F R&R W ab fghi OLD BUSH VINE F&F 13 i Wines: 16 ghi CHENIN BLANC R&R UW bdefgh 8 ab 20 ac befgh CHENIN BLANC BUSH VINE F&F R&R UW 25 hi ac OLD BUSH VINE R&R W abef bcefg BUSH VINE F&F a acd OLD BUSH VINE F&F (a) Association with wine industry : No (b) Association with wine industry : Yes Figure 17 Line plots showing the interaction between cues ( Chenin blanc, Bush vine, Old bush vine ) and consumer liking for a) respondents not associated with the wine industry and b) respondents associated with the wine industry. The Fresh and Fruity style wines marked with the label F&F, the unwooded Rich and Ripe style wines marked with R&R UW and the wooded Rich and Ripe styles wines marked with R&R W. The results from the blind tasting (no cue) is illustrated by the blue line and the results from the informed tasting (with cue) is illustrated by the red line. Data points with different alphabetical letters differ significantly from each other (p 0.05). 145
154 8.5 Consumer Liking*Cue*Knowledge2; LS Means Current effect: F(5, 320)=.46848, p= Type III decomposition Vertical bars denote 0.95 confidence intervals Degree of liking CHENIN BLANC F&F BUSH VINE R&R UW BUSH VINE F&F OLD BUSH VINE F&F CHENIN BLANC CHENIN BLANC R&R UW Wi nes: 16 F&F 8 BUSH VINE R&R UW 20 OLD BUSH VINE BUSH VINE F&F R&R W OLD BUSH VINE F&F 13 CHENIN BLANC R&R UW Wi nes: OLD BUSH VINE R&R W (a) Knowledge: moderate & lower (b) Knowledge: abov e av erage & higher Figure 18 Line plots showing the interaction between cues ( Chenin blanc, Bush vine, Old bush vine ) and consumer liking for a) respondents with a moderate and lower wine knowledge and b) respondents with an above average and higher wine knowledge. The Fresh and Fruity style wines marked with the label F&F, the unwooded Rich and Ripe style wines marked with R&R UW and the wooded Rich and Ripe styles wines marked with R&R W. The results from the blind tasting (no cue) is illustrated by the blue line and the results from the informed tasting (with cue) is illustrated by the red line. 146
155 4. Conclusions The objective of this study was to investigate the influence of the terms Bush vine and Old bush vine as extrinsic product cues on the consumer liking of Chenin blanc wines using a group of regular Chenin blanc consumers with differing levels of wine knowledge. The results from the blind tasting indicated that this group of consumers had a preference for the wines with a Fresh and Fruity or Rich and Ripe unwooded style. The latter tendency was confirmed by external preference mapping results which showed that overall consumer liking was primarily driven by the tropical aroma and fresh fruit flavour, descriptors that mainly associate with the Fresh and Fruity style of Chenin blanc. In the questions enquiring about the expected liking of specific styles of Chenin blanc, the consumers indicated that the Fresh and Fruity style was liked the most, followed by the Rich and Ripe style, with the Wooded style wines being preferred the least. To determine the influence of the extrinsic cues of Chenin blanc, Bush vine and Old bush vine on consumer liking, the wines had to be evaluated in a blind, as well as an informed tasting session. When results from the two tastings were compared, a change in the degree of liking was observed: the overall liking of the wines tasted during the informed tasting was significantly higher than that of the wines tasted during the blind tasting. The latter is true irrespective of the cue given to the consumer. A statistical interaction was noticed between the influence of the extrinsic product cue on consumer liking and whether or not a consumer was associated with the wine industry. Even though association with the wine industry had no effect on consumer liking when the wines were tasted blindly, it was found that the consumers associated with the wine industry were prone to change their hedonic scoring when the wines were tasted with the extrinsic cues. Consumer liking did not change significantly from the blind to marked tasting for the wines marked with the cue Chenin blanc. Interestingly, this is true for both groups of consumers. This was to be expected as the consumers were informed that all the wines included in the tastings would be Chenin blanc wines. The wines marked with the cue Bush vine, showed no difference in degree of liking for the group of consumers not associated with the wine industry, but a significant increase could be seen for one of the Rich and Ripe style wines for the consumer group associated with the wine industry. For the wines marked with the cue Old bush vine a different trend was seen for the two groups of consumers. Consumer liking for the consumers not associated with the wine industry increased significantly for the Fresh and Fruity style wine, however, for consumers associated with the wine industry, the Rich and Ripe style Chenin blanc wine s hedonic rating increased considerably. The above-mentioned trend could be explained by expectation disconfirmation where the expected liking provoked by the extrinsic cue was not matched by the actual sensory experience. The response to the cue differed dramatically between the two groups of consumers; therefore it could be argued that the difference in objective knowledge between the group of consumers associated and not associated with the wine industry might have been the cause for this tendency 147
156 From this research, it can be seen that consumer education on aspects such as bush vines and old vines will definitely be advantageous to the wine industry. The general consumer should be educated on the effect of the bush vine training system or old vine age on the quality of Chenin blanc wines, furthermore label statements or cues can also be used to inform consumers on what they should expect when purchasing a Chenin blanc wine. A confirmed expectation has been shown to lead to consumer satisfaction and possible repurchase (Grunert, 2002), which is the primary objective for any industry. 148
157 5. References Amerine, M.A. & Ough, C.S. (1967). Sweetness preference in rosé wines. American Journal of Enology and Viticulture, 18, Basson, S. (2012). Consumer acceptance of a selection of South African red wines: Intrinsic, extrinsic and socio-demographic influences. MSc Thesis, Department of Food Science, Stellenbosch University, South Africa. Bleibaum, R.N., Lattery, K.A. & Francis, I.L. (2005). Conjoint research for consumer perception of wine closure options and their impact on purchase interest in the United States and Australia. Presented at 6 th Pangborn Sensory Science Symposium, Harrogate, UK. (as cited by Lockshin et al., 2006). Britton, P. (1992). Packaging: graphic examples of consumer seduction. Beverage Industry, 8, 21. Brucks, M. (1985). The effects of product class knowledge on information search behaviour. Journal of Consumer Research, 12, Cardello, A.V. (1994). Consumer expectations and their role in food acceptance. In: Measurement of food preferences (edited by H.J.H. MacFie & D.M.H. Thomson). Pp London: Blackie Academic and Professional. Cardello, A.V.A. & Sawyer, F.M. (1992). Effects of disconfirmed consumer expectations on food acceptability. Journal of Sensory Studies, 7, Charters, S. (2006). Wine and Society: The Cultural and Social Context of a Drink. London: Butterworth- Heinemann. Charters, S. & Pettigrew, S. (2003). I like it, But how do I know if it s any good? Quality and preference in wine consumption. Journal of Research for Consumers, 5, Chrea, C., Melo, L., Evans, G., Forde, C., Delahunty, C. & Cox, D.N. (2011). An investigation using three approaches to understand the influence of extrinsic product cues on consumer behaviour: an example of Australian wines. Journal of Sensory Studies, 26, Combris, P., Lecocq, S. & Visser, M. (1997). Estimation of a hedonic price equation for Bordeaux wine: Does quality matter? Economic Journal, 107, Combris, P., Lecocq, S. & Visser, M. (2000). Estimation of hedonic price equation for Burgundy wine. Applied Economics, 32, Costell, E., Tárrega, A. & Bayarri, S. (2010). Food acceptance: the role of consumer perception and attitudes. Chemical Perception, 3, Cox, D.E. & Rich, S.U. (1967). Perceived risk and consumer decision making. In: Risk taking and information handling in consumer behaviour (edited by D.F. Cox). Boston, MA: Division of Research, Harvard University (as cited by Lockshin et al., 2006). Deliza, R. & MacFie, H.J.H. (1996). The generation of sensory expectation by external cues and its effect on sensory perception and hedonic ratings: A review. Journal of Sensory Studies, 11, Dodd, T.H., Laverie, D.A., Wilcox, J.F. & Duhan, D.F. (2005). Differential effects of experience, subjective knowledge, and objective knowledge on sources of information used in consumer wine purchasing. Journal of Hospitality & Tourism Research, 29,
158 Dodds, W. & Monroe, K.B. (1985). The effect of brand choice information on subjective product evaluations. In: Advances in consumer research (edited by E.C. Hirschman & m.r. Holbrook). Pp Provo, UT: Association for Consumer Research. Ferrarini, R., Carbognin, C., Casarotti, E.M., Nicolis, E., Nencini, A. & Meneghini, A.M. (2010). The emotional response to wine consumption. Food Quality and Preference, 21, Grunert, K.G. (2002). Current issues in understanding of consumer food choice. Trends in Food Science and Technology, 13, Jenster, P. & Jenster, L. (1993). The European wine industry. International Journal of Wine Marketing, 5, Koewn, C. & Casey, M. (1995). Purchasing behaviour in the Northern Ireland wine market. British Food Journal, 97, Landon, S. & Smith, C.E. (1997). The use of quality and reputation indicators by consumers: The case of Bordeaux wine. Journal of Consumer Policy, 20, Lange, C., Martin, C., Chabanet, C., Combris, P. & Issanchou, S. (2002). Impact of the information provided to consumers on their willingness to pay for Champagne: a comparison with hedonic scores. Food Quality and Preference, 13, LaVilla, J. (2010). The wine, beer & spirits handbook: A guide to styles and services. Pp New Jersey: John Wiley & Sons, Inc. Lawless, H.T. & Heymann, H. (2010). Sensory evaluation of food: principles and practices (2 nd ed.). Pp. 326, , 445, New York: Springer Science + Business Media, LLC. Ling, B.H. & Lockshin, L. (2003). Components of wine prices for Australian wine: How winery reputation, wine quality, region, vintage, and winery size contribute to the price of varietal wines. Australasian Marketing Journal, 11, Lockshin, L., Jarvis, W., d Hauteville, F. & Perrouty, J.P. (2006). Using simulations from discrete choice experiments to measure consumer sensitivity to brand, region, price and awards in wine choice. Food Quality and Preference, 17, Loubser, F.H. (2008). Chenin blanc table wines in South Africa. Cape Wine Master dissertation. WWW document. URL June MacFie, H.J.H. & Thomson, D.M.H. (1988). Preference mapping and multidimensional scaling. In: Sensory analysis of foods (edited by J.R. Piggott). Pp New York: Elsevier Applied Sciences. Marin, A.B., Jorgensen, E.M., Kennedy, J.A. & Ferrier, J. (2007). Effects of bottle closure type on consumer perceptions of wine quality. American Journal of Enology and Viticulture, 58, Martens, H. & Martens, M. (2001). Multivariate Analysis of Quality: An introduction. Chichester, UK: Wiley. Meillon, S., Dugas, V., Urbano, C. & Schlich, P. (2010). Preference and acceptability of partially dealcoholized white and red wines by consumers and professionals. American Journal of Enology and Viticulture, 61, Meullenet, J.F., Xiong, R., Monsoor, M.A., Bellman-Homer, T., Dias, P., Zivanovic, S., Fromm, H. & Liu, Z. (2002). Preference mapping of commercial toasted white corn tortillas. Journal of Food Science, 67, Mueller, S. & Szolnoki, G. (2010). The relative influence of packaging, labelling, branding and sensory attributes on liking and purchase intent: Consumer differ in their responsiveness. Food Quality and Preference, 21,
159 Mueller, S., Lockshin, L. & Louviere, J. (2009). What you see may not be what you get: Asking consumers what matters may not reflect what they choose. Marketing Letters, 21, Mueller, S., Lockshin, L., Saltman, Y. & Blanford, J. (2010a). Message on a bottle: The relative influence of wine back label information on wine choice. Food Quality and Preference, 21, Mueller, S., Osidacz, P., Francis, I.L. & Lockshin, L. (2010b). Combining discrete choice and informed sensory testing in a two-stage process: Can it predict wine market share? Food Quality and Preference, 21, Oczkowski, E. (2001). Hedonic wine price functions and measurement error. The Economic Record, 77, Oliver, T. (2004). Consumer psychology of tourism, hospitality and leisure (edited by G.I. Crouch). P UK: CABI Publishing. Parr, W.V., Green, J.A. & White, K.G. (2006). Wine judging, context and New Zealand Sauvignon Blanc. Revue européenne de psychologie appliquée, 56, Rocchi, B. & Stefani, G. (2005). Consumers perception of wine packaging: A case study. International Journal of Wine Marketing, 18, Shapiro, S. S., & Wilk, M.B. (1965). An analysis of variance test for normality (complete samples). Biometrika, 52, Shaw, M., Keeghan, P. & Hall, J. (1999). Consumers judge wine by its label, study shows. Australian and New Zealand Wine Industry Journal, 14, (as cited by Mueller et al., 2010a). South African Wine Industry Information and Systems (2011). Statistics of Wine-grape Vines as on 31 December WWW document. URL July 2012 Thomas, A. (2000). Elements influencing wine purchasing: A New Zealand view. International Journal of Wine Marketing, 12, Tuorila, H., Cardello, A.V. & Lesher, L.L. (1994). Antecedents and consequences of expectations related to fat-free and regular-fat foods. Appetite, 23, Van Kleef, E., Van Trijp, H.C.M. & Luning, P. (2005). Consumer research in the early stages of new product development: a critical review of methods and techniques. Food Quality and Preference, 16, Van Zyl, J.L. & Van Huyssteen, L. (1980a). Comparative studies on wine grapes on different trellising systems: I. Consumptive water use. South African Journal of Enology and Viticulture, 1, Van Zyl, J.L. & Van Huyssteen, L. (1980b). Comparative studies on wine grapes on different trellising systems: II. Micro-climatic studies, grape composition and wine quality. South African Journal of Enology and Viticulture, 1, Verdú Jover, A.J., Montes, F.J.L. & Del Mar Fuentes Fuentes, M. (2004). Measuring perceptions of quality in food products: the case of red wine. Food Quality and Preference, 15, Yeomans, M.R., Chambers, L., Blumenthal, H. & Blake, A. (2008). The role of expectancy in sensory and hedonic evaluation: The case of smoked salmon ice-cream. Food Quality and Preference, 19, Zeithaml, V.A. (1988). Consumer perceptions of price, quality and value: A means-end model and synthesis of evidence. Journal of Marketing, 52,
160 Chapter 6 General discussion and conclusions 152
161 CHAPTER 6: General discussion and conclusions South Africa (SA) is currently lacking a signature wine, i.e. a wine with the potential of establishing SA in the top ranks along with other premium wine producing countries. The qualities of South African Chenin blanc which strengthens this cultivar s probability of becoming SA s signature wine, include its ability to produce a range of styles, the potential of producing quality wines at all price points, the cultivar s capacity to adapt to the South African terroir, the experience of the South African winemakers in making noteworthy Chenin blanc wines and finally, the abundance of old vines (C. Van Casteren, CBA Conference, Stellenbosch, SA, 2011, personal communication). According to South African Wine Industry Information and Systems (SAWIS), more than 40% of the Chenin blanc plantings in SA are older than 20 years of age, according to a survey conducted in 2008 (SAWIS, 2008). Since bush vine training was mostly used in earlier years (Skelton, 2007), it can be speculated that the majority of these old Chenin blanc vineyards consist of bush vines. Both old vines and the bush vine training system are known to have significant influences on wine quality as these two factors limit vine vigour which can lead to the production of smaller berries and possibly also resulting in wines with improved flavour intensity (Clarke, 2001; Reynolds & Vanden Heuvel, 2009; Skelton, 2007; Van Zyl & Van Huyssteen, 1980). To date, no research has focussed on bush vine Chenin blanc wines and the characteristics thereof. Research on the chemical and sensory nature of bush vine Chenin blanc wines, as well as research on Chenin blanc wine consumers, will greatly benefit the South African wine industry, since a better understanding of a wine will facilitate improved control over production and marketing ventures and might even convince wine producers to conserve their old bush vine Chenin blanc vineyards. The main objective of this research project was to determine the chemical, sensory and consumer characteristics of South African Chenin blanc wines produced solely from bush vines. The Chenin blanc wines included in this study were produced from 100% bush vine vineyards and were produced to a dry style. Three dry styles of Chenin blanc are currently recognised by the Chenin blanc Association (CBA) of SA (CBA, n.d), i.e. Fresh and Fruity, Rich and Ripe unwooded and Rich and Ripe wooded. The wines chosen for this study included three vintages from five production areas of the latter three wine styles. Twenty two (22) out of the 25 wines sourced were produced from vineyards older than 25 years of age. The aims of the study were to ascertain a comprehensive chemical and sensory profile of the wines using descriptive sensory analysis (DSA) and analytical chemical techniques which included FTMIR (Fourier transform mid-infrared) spectroscopy and GC-FID (gas chromatography coupled with a flame ionisation detector). A second sensory method, a sorting task together with a description assignment, was employed to categorise the wines according to their sensory similarities. With the results of the sorting task, it was also established whether or not the sorting task can be regarded as a suitable technique for the sensory profiling of wines and whether DSA and sorting can be regarded as equally effective categorising methodologies. Consumer analysis was also performed to determine how a selected group of consumers conceptually perceive bush vine and old bush vine Chenin blanc wines. Consumer liking in blind conditions and the influence of label cues such as bush vines and old bush vines on consumer liking were also established. 153
162 The results of the DSA profiling technique showed that the 25 bush vine Chenin blanc wines separated into two groups. The sensory attributes associated with the two separate groups suggest that the categorisation of the wines according to their sensory characteristics is based upon style differences. The sensory attributes of the one wine cluster were associated with the Fresh and Fruity style of Chenin blanc, whereas the other cluster of wines associated more with sensory attributes related to the Rich and Ripe style of Chenin blanc. Even though the Rich and Ripe style can be divided into wooded and unwooded wines (CBA, n.d.), no clear-cut distinction was apparent when considering the DSA results of the wines that were indicated as being Rich and Ripe. The reason for this could be the many factors that influence the sensory characteristics imparted by wood contact (Ortega-Heras et al., 2010). It was also interesting that some of the wines that did receive some form of wood contact during production, associated uncharacteristically with Fresh and Fruity type sensory attributes. It was also established that vintage had a significant effect on the distribution of the wines on the DSA PCA-biplot. Wines from the youngest vintage, 2010, was situated in close proximity to the fresh, fruity and tropical attributes and wines from the oldest vintage, 2008, were positioned near the woody, sweet associated and rich fruit attributes. The 2009 wines were distributed midway between the two groups signifying that a gradual move from fresh, fruity characteristics to rich, sweet associated and woody characteristics is apparent as wines mature. This was also evident in the PCA bi-plot generated from the chemical data which showed that the separation of the wines was driven by vintage. Chemical changes that accompany wine ageing resulted in the 25 bush vine Chenin blanc wines to be distributed from the youngest vintage (2010) to oldest vintage (2008) with the youngest wines strongly associated with the chemical attributes malic acid and ethyl and acetate esters signifying high levels of these compounds. In other recent studies where the aim was to profile South African Chenin blanc wines, it was also found, depending on the selection of wines and methodologies of analysis used, that the wines separated into groupings. In a study focussing primarily on the sensory profiling of 12 award-winning Chenin blanc wines (Bester, 2011), the separation was based on the differences between the wooded (Rich and Ripe wooded) and unwooded (Fresh and Fruity and Rich and Ripe unwooded) styles. In a study aiming primarily on the chemical profiling of 48 Chenin blanc wines (Lawrence, 2012) a clear distinction between all three Chenin blanc styles were evident when subjecting data derived from GC-FID and GC-MS (gas chromatography mass spectrometry) methodologies to various advanced chemometric techniques (Lawrence, 2012). The reasons for these differences in separation or groupings of wines in our study, as well as that found by Bester (2011) and Lawrence (2012) could be attributed to the difference in methodologies applied, as well as the spectrum of wines used in the respective studies. Both Bester (2011) and Lawrence (2012) used wines produced from trellised and bush vine vineyards or wines produced using only a percentage of bush vine grapes. Furthermore, Lawrence (2012) used newly developed, more advanced GC-FID and GC-MS methodologies to analyse the wines. It could be argued that if a larger sample set, containing samples that better represent the diversity found in South African Chenin blanc wines, or a sample set containing both bush vine and trellised vine wines, was used in our study, different outcomes could have resulted. Furthermore, a different outcome could also be expected if the sample set of bush vine Chenin blanc wines in our study were subjected to the improved chemical methodologies developed and validated by Lawrence (2012). 154
163 In the sorting task with a description assignment, it was found that DSA still remains the better technique for profiling wines according to their sensory characteristics, even though results relatively similar to that of DSA was obtained in the sorting task. It was also found that even though DSA is basically regarded as a profiling method, it has the ability to categorise wines according to their sensory similarities and differences. The reasons why the results of the sorting task with a description assignment and DSA were not similar when profiling the bush vine Chenin blanc wines, could be ascribed to differences in the judging panels used for the two methods, as well the principles on which the two methods are based. For DSA, a panel of judges were trained to accurately identify and score specific sensory attributes in the wines tested. For the sorting task an expert panel, consisting of winemakers and wine researchers, was used to sort the wines according to the instructions of the sorting method. Note that this panel used their acquired knowledge and experience for the latter task, therefore no training was given. The implication of this is that the expert panel s experience and technical knowledge on Chenin blanc, empowered them to accurately assess and describe the wines, however, in a slightly different manner when compared to the results of the trained DSA panel. A number of studies have compared the results of DSA and the sorting technique. Good correlation between the sensory profiles obtained from DSA and from the sorting task with a descriptive assignment was found for different food products when a panel of naïve respondents were used to perform the sorting task (Blancher et al., 2007; Faye et al., 2004, 2006) or when the same panel was used to perform both DSA and the sorting task (Campo et al., 2008; Cartier et al., 2006; Saint-Eve et al., 2004). However, when novice consumers were used to sort and describe Chenin blanc wines, it was found that they were less constant in their use of descriptors, and that they used significantly more attributes to describe the groups of wines in the sorting task (Bester, 2011). The sorting task does have the advantage over DSA in that no training is required (Campo et al., 2008), especially if experts are used. The sorting task is quick and easy to execute (Chollet et al., 2011), thus eliminating the inconvenience of time consuming and often expensive panel training associated with DSA (Chollet et al., 2011). However, since the sorting task accumulates similarity data in the form of distance matrices containing 1 s and 0 s (Abdi et al., 2007), the data obtained in the sorting task cannot be used for statistical correlation with any other datasets. DSA generates both qualitative and quantitative data in the form of intensity scores for different sensory attributes, thus allowing the data obtained to be correlated with instrumental data (Lawless & Heymann, 2010). DSA thus remains the most comprehensive technique for determining the full sensory profile of a set of wines with the added ability of categorising wines with a similar efficiency as the sorting task. When evaluating the sorting task results, as well as the results from DSA of this study, a mismatch was apparent between the wine styles assigned to the specific wines by their respective winemakers or viticulturists and the wine style indications resulting from the DSA and sorting techniques. This mismatch can be attributed to the lack of definition for the three different Chenin blanc styles and could prove to negatively influence a consumer s response to a wine. When the expectation created by the description given on a wine back label is not confirmed by the sensory experience during consumption, the hedonic response could be affected negatively (Deliza & MacFie, 1996). Sixty six regular white wine drinking consumers participated in the consumer study where degree of liking and the consumer perception of bush vine and old bush vine Chenin blanc wines were determined. When asked to indicate how they expect to like the three different dry styles of Chenin blanc, the consumers indicated that they expect to like the two 155
164 unwooded Chenin blanc wine styles (Fresh and Fruity and Rich and Ripe unwooded) significantly more than the Rich and Ripe wooded style. This was confirmed in the blind tasting where the Fresh and Fruity and Rich and Ripe unwooded wines received significantly higher hedonic scores. To evaluate consumer perception of Chenin blanc wines produced from bush vines and old bush vines, the wines included in the consumer study were marked with a cue ( Bush vine or Old bush vine ) and the hedonic scores from the blind tasting (no cues) were compared to that of the informed tasting (with cues). The inclusion of a cue regarding vineyard characteristics proved to have a positive effect on consumer liking. An increase in consumers hedonic score when wines were presented along with an intrinsic cue was also observed by Bester (2011) when wines were served with a cue revealing its style. Different effects were, however, observed in our study when the results from sub-groups within the consumer group were evaluated. It was found that objective wine knowledge influenced the effect that the Bush vine and Old bush vine cues had on consumer liking, illustrating that level of wine knowledge significantly influences consumer perception. Furthermore, for the consumer group associated with the wine industry, thus having a higher level of wine knowledge than those consumers not associated with the wine industry, both the Bush vine and the Old bush vine cue resulted in a significant increase in consumer liking for the Rich and Ripe style wines. For the consumer group not associated with the wine industry, the Bush vine cue had no significant influence on consumer liking, but the Old bush vine cue resulted in slightly elevated liking scores for the Fresh and Fruity style wine. Interestingly, all the wines presented in the consumer study were produced from old bush vines. It is thus evident that consumer education on the impact of bush vines and old bush vines on wine quality could only benefit the Chenin blanc wine industry, since such knowledge will result in higher quality appraisal at point-of-purchase. When consumers expectations, as created by the external cues on the wine s label, are confirmed, consumer satisfaction and possible repurchase (Grunert, 2002) can be achieved. Even though the outcome of our consumer study seems to hold promise for South African Chenin blanc producers, consumer studies using larger groups of consumers and repeating the analysis in other localities are advised. 156
165 References Abdi, H., Valentin, D., Chollet, S. & Chrea, C. (2007). Analyzing assessors and products in sorting tasks: DISTATIS, theory and applications. Food Quality and Preference, 18, Bester, I. (2011). Classifying South African Chenin blanc wine styles. MSc Thesis, Institute for Wine Biotechnology, Department of Viticulture and Oenology, Stellenbosch University, South Africa. Blancher, G., Chollet, S., Kesteloot, R., Hoang, D.N., Cuvelier, G. & Sieffermann, J.M. (2007). French and Vietnamese: How do they describe texture characteristics of the same food? A case study with jellies. Food Quality and Preference, 13, Campo, E., Do, B.V., Ferreira, V. & Valentin, D. (2008). Aroma properties of young Spanish monovarietal white wines: a study using sorting task, list of terms and frequency of citation. Australian Journal of Grape and Wine Research, 14, Cartier, R., Rytz, A., Lecomte, A., Poblete, F., Krystlik, J., Belin, E. & Martin, N. (2006). Sorting procedure as an alternative to quantitative DSA to obtain a product sensory plot. Food Quality and Preference, 17, Chenin Blanc Association. (n.d.). WWW document. URL February Chollet, S., Leliévre, M., Abdi, H. & Valentin, D. (2011). Sort and beer: Everything you wanted to know about the sorting task but did not dare to ask. Food Quality and Preference, 22, Clarke, O. (2001). In the vineyard. In: Oz Clarke s grapes and wines: The definitive guide to the world s great grapes and the wines they make. P.19. London: Websters International Publishers. Deliza, R. & MacFie, H.J.H. (1996). The generation of sensory expectation by external cues and its effect on sensory perception and hedonic ratings: A review. Journal of Sensory Studies, 11, Faye, P., Brémaud, D., Baubin, M.D., Courcoux, P., Giboreua, A. & Nicod, H. (2004). Perceptive free sorting and verbalization tasks with naive subjects: an alternative to descriptive plotpings. Food Quality and Preference, 15, Faye, P., Brémaud, D., Daubin, M.D., Courcoux, P., Giboreua, A. & Nicod, H. (2006). An alternative to external preference plotping based on consumer perceptive plotping. Food Quality and Preference, 17, Grunert, K.G. (2002). Current issues in understanding of consumer food choice. Trends in Food Science and Technology, 13, Lawerence, N. (2012). Volatile metabolic profiling of SA Chenin blanc fresh and fruity and rich and ripe wine styles: Development of analytical methods for flavour compounds (aroma and flavour) and application of chemometrics for resolution of complex analytical measurements. MSc Thesis, Institute for Wine Biotechnology, Department of Viticulture and Oenology, Stellenbosch University, South Africa. Lawless, H.T. & Heymann, H. (2010). Sensory evaluation of food: principles and practices (2 nd ed.). P New York: Springer Science + Business Media, LLC. Ortega-Heras, M., Pérez-Magariño, S., Cano-Mozo, E. & Gonzáles-San José, M.L. (2010). Differences in the phenolic composition and sensory profile between red wines aged in oak barrels and wines aged with oak chips. LWT Food Science and Technology, 43,
166 Reynolds, A.G. & Vanden Heuvel, J.E. (2009). Influence of grapevine training systems on vine growth and fruit composition: A review. American Journal for Enology and Viticulture, 60:3, Saint-Eve, A., Kora, E.P. & Martin, N. (2004). Impact of the olfactory quality and chemical complexity of the flavouring agent on the texture of low fat stirred yogurts assessed by three different sensory methodologies. Food Quality and Preference, 15, Skelton, S. (2007). Viticulture: An introduction to commercial grape growing for wine production. Pp. 68, 87. London: Lulu. South African Wine Industry Information and Systems (2008). Statistics of wine-grape vines as on 30 November WWW document. URL April Van Zyl, J.L. & Van Huyssteen, L. (1980). Comparative studies on wine grapes on different trellising systems: II. Micro-climatic studies, grape composition and wine quality. South African Journal of Enology and Viticulture, 1,
167 Addendum A Questionnaire used for obtaining information on the wines from their respective winemakers and/or viticulturists 159
168 Name of wine: Vintage: Winery: Contact details: Name of Winemaker/viticulturist: Mobile: Depending on the question, mark the applicable answer with an X or respond in sentence format. Should you regard any information as confidential and therefore wish not to disclose it, please indicate on the questionnaire that you regard the specific information as confidential. Questions on Vineyard Q.1) Is the above-mentioned wine produced from a single vineyard? Yes No Not sure COMMENTS: Q.2) What is/are the ages of the above-mentioned vineyards? COMMENTS: 20 and younger Between 21 and and older Not sure Q.3) Are the above-mentioned vines trellised or bush vines? Trellised Bush Not sure COMMENTS: Q.4) If the above-mentioned wine is produced from both trellised and bush vines, please specify the percentage bush vines used. % Bush vines Not sure N/A COMMENTS: Q.5) In what region is/are these vineyard/s situated, eg. Hermanus, Stellenbosch, etc.? COMMENTS: Q.6) Are these vineyards/the above-mentioned wine certified as organic or biodynamic? Organic Bio-dynamic No COMMENTS: Q.7) Are these vineyards irrigated or dryland? COMMENTS: Irrigated Dryland Q.8) If only a portion of the vineyards is irrigated, please specify the approximate percentage present in the above-mentioned wine. COMMENTS: % irrigated N/A 160
169 Questions on Winemaking Q.9) At what ripening level ( o Brix/ o Balling) do you harvest? COMMENTS: Q.10) What method of juice extraction was used for the abovementioned wine? COMMENTS: Q.11) What type of yeast did you use for the production of the above-mentioned wine? COMMENTS: Q.12) Did this wine have any skin contact? COMMENTS: Yes No Q.13) Did this wine receive any extended lees contact? COMMENTS: Yes No Q.14) Is the above-mentioned wine wooded? COMMENTS: Yes No Questions on the Wine Q.15) If you should describe the style of the above-mentioned wine, would it be Fresh & Fruity or would it be Rich & Ripe? COMMENTS: F&F R&R Q.16) Approximate price of the above-mentioned wine (Cellar door price)? R 161
170 Addendum B Wine samples used in this study and information gathered on the wines using a questionnaire (see Addendum A), the internet, the wines labels and the Platter wine guide 162
171 Wines sourced for determining the chemical and sensory profile of South African Chenin blanc wines produced from bush vines. Winery Wine name Vintage Babylon's Peak Private Cellar Babylon s Peak Chenin Blanc 2010 Bosman Family Vineyards Bosman Family Vineyards Old Bush Vines Chenin Blanc 2008 Bosman Family Vineyards Bosman Family Vineyards Optenhorst Chenin Blanc 2009 Dornier Wines Dornier Chenin Blanc 2010 Graham Beck Wines Graham Beck Bowed Head Chenin Blanc 2009 Graham Beck Wines Graham Beck The Game Reserve Chenin Blanc 2009 Groenland Wyne Groenland Chenin Blanc 2010 Groote Post Vineyards Groote Post Chenin Blanc 2010 Hazendal Hazendal Bush vine Chenin Blanc 2009 Ken Forrester Wines Ken Forrester The FMC 2009 Kleine Zalze Wines Kleine Zalze Cellar Selection Chenin Blanc Bush Vines 2010 Kleine Zalze Wines Kleine Zalze Vineyard Selection Barrel Fermented Chenin Blanc 2009 Kleine Zalze Wines Kleine Zalze Vineyard Selection Barrel Fermented Chenin Blanc 2010 Koopmanskloof Koopmanskloof Chenin Blanc 2009 KWV KWV The Mentors Chenin Blanc 2008 Laibach Laibach Chenin Blanc 2010 Mooiplaas Mooiplaas Chenin blanc Bush vine 2010 Nederburg Nederburg Chenin Blanc Reserve 2008 Nederburg Nederburg Chenin Blanc Reserve 2009 Schalk Burger & Sons Winery Meerkat Chenin Blanc 2010 Schalk Burger & Sons Winery Welbedacht Bush Vine Chenin Blanc 2008 StellenRust StellenRust 45 Barrel Fermented Chenin Blanc 2009 StellenRust StellenRust Chenin Blanc (20% wooded) 2010 Wamakersvallei Bain's Way Bush Vine Chenin Blanc 2009 Wamakersvallei Bain's Way Bush Vine Chenin Blanc
172 Information gathered from the wines respective winemakers or viticulturists using a questionnaire (given in Addendum A). Wine Vintage Single vineyard Vineyard age Organic Region Ripeness Juice Irrigation % irrigated ( Brix) extraction Yeast Skin contact Lees contact Wooded Style No >25 Swartland/Paardeberg No Irrigated Supplementary 22 Free run & Vin7 No Yes No F&F R Bag Press Yes >25 Wellington No Dryland n/a Bag Press Alchemy 2 No Yes No R&R R Yes >25 Wellington No Dryland n/a Bag Press Alchemy 2 No Yes No R&R R Yes >25 Wellington/Paarl No Dryland n/a 23.2 Closed Vin2000 & No Yes Yes R&R R pneumatic press 20% Natural Yes >25 Wellington/Paarl No Dryland n/a 23.2 Closed Vin2000 & No Yes Yes R&R R pneumatic press 20% Natural Yes >25 Swartland No Dryland n/a Settle & DSM 4F9 No Yes Yes R&R R Filter No >25 Paarl No Dryland n/a Press CY3079, Vin7 Yes Yes Yes R&R R No >25 Paarl No Dryland n/a Press CY3079, Vin7 Yes Yes Yes F&F R No >25 Stellenbosch No Dryland n/a 23.5 Free run, Vin7 Yes Yes No F&F R press Yes >25 Darling No Dryland n/a 23 Free run & Vin7 Yes Yes No F&F R % Press No >25 Stellenbosch No Dryland n/a Enzyme Vin 7 Yes No No F&F R treatment, press Yes >25 Stellenbosch Organic Dryland n/a Bag Press Natvind - No Yes Yes R&R R spontaneous No >25 Stellenbosch No Dryland n/a Press CY3079, Vin7 Yes Yes No R&R R Price 164
173 Wine Vintage Single vineyard Vineyard age Organic Region Ripenes Juice Irrigation % irrigated s (brix) extraction Yeast Skin contact Lees contact Wooded Style Yes >25 Stellenbosch No Dryland n/a Press CY3079 Yes Yes Yes R&R R Yes >25 Stellenbosch No Dryland n/a Press CY3079 Yes Yes Yes R&R R No >25 Stellenbosch No Dryland n/a 23 Bag Press Vin7, Vin13, No Yes No R&R R NT Yes >25 Malmesbury No Dryland n/a 25.6 Free run Vin 2000, HPS Yes Yes Yes R&R R Yes Bottelary No Dryland n/a Bag Press VL1 Yes Yes No F&F R No >25 Wellington Biodynamic Dryland n/a 23 Press Vin7, Vin13 No No No F&F R No 38 Stellenbosch No Dryland n/a 25.5 Pneumatic Vin7, QA23 Yes Yes No R&R R press No <20 Darling/Stellenbosch No Dryland n/a Free run, 0.2 CY 3079, VL2 Yes Yes Yes R&R R bars pressing No <20 Darling/Stellenbosch No Dryland n/a Free run, 0.2 CY 3079, VL2 Yes Yes Yes R&R R bars pressing Yes >25 Stellenbosch No Irrigated 100% 24.5 Free run, Wild yeast Yes Yes Yes Both R press No >25 Stellenbosch No Irrigated 100% 25 Free run, Wild yeast Yes Yes No F&F R press Yes >25 Wellington No Dryland n/a Basket Press Natural yeast Yes Yes Yes Both R Price 165
174 Information gathered from the wines respective front and back labels and the star rating given to each wine in the Platter wine guide. Wine Vintage Large print Small print Back label % alc. Region Platter stars Babylon s Peak 2010 Dryland - Bushvines Low yield dryland bushvines 13.50% Swartland Chenin Blanc Bain's Way Bush Vine 2009 Bush Vine To keep the bush vine legacy alive 14.00% Wellington Chenin Blanc Bain's Way Bush Vine 2010 Bush Vine To keep the bush vine legacy alive 14.00% Wellington Chenin Blanc Bosman Family 2008 Old bush vines Old bush vine 13.50% Wellington Vineyards Old Bush Vines Chenin Blanc Bosman Family % Wellington Vineyards Optenhorst Chenin Blanc Dornier Chenin Blanc 2010 Bush vine Old, low-yielding bush vines % Swartland Graham Beck Bowed Head Chenin Blanc Graham Beck The Game Reserve Chenin Blanc Groenland Chenin Blanc Groote Post Chenin Blanc Hazendal Bush vine Chenin Blanc Ken Forrester The FMC Kleine Zalze Cellar Selection Chenin Blanc Bush Vines 2009 Old bush vines, low yielding 14.00% Paarl 2009 Low yielding bushvines 14.00% Coastal Region 2010 Old bush vines, planted % Stellenbosch % Coastal Region 2009 Bushvine 30 year old bushvines 14.00% Stellenbosch 2009 Hand picked, low yielding, old bush vines 14.00% Stellenbosch 2010 Bush vines Bush vines 14.00% Stellenbosch 166
175 Wine Vintage Large print on front label Small print on front label Back label % alc. Region Platter stars Kleine Zalze Vineyard % Stellenbosch Selection Barrel Fermented Chenin Blanc Kleine Zalze Vineyard % Stellenbosch Selection Barrel Fermented Chenin Blanc Koopmanskloof % Stellenbosch Chenin Blanc KWV The Mentors % Coastal Region Chenin Blanc Laibach Chenin Blanc 2010 Bushvine, unirrigated low yielding % Coastal Region Meerkat Chenin Blanc % Wellington Mooiplaas Chenin blanc Bush vine Nederburg Chenin Blanc Reserve Nederburg Chenin Blanc Reserve StellenRust 45 Barrel Fermented Chenin Blanc StellenRust Chenin Blanc (20% wooded) Welbedacht Bush Vine Chenin Blanc 2010 Bush vines Bush vines 13.50% Stellenbosch 2008 Bush vines Bush vine 12.50% Coastal Region 2009 Bush vine Bush vine 14.00% Coastal Region % Stellenbosch % Stellenbosch 2008 Bush Vine Old bush vines 13.50% Wellington 167
176 Tasting notes from the internet, the wines back labels and the Platter wine guide. Wines Vintage Tasting notes Babylon s Peak Chenin Blanc 2010 Guava Tropical Melon Peach Lime Spice Granadilla Litchi Passionfruit Bain's Way Bush Vine Chenin Blanc 2009 Guava Melon Spice Tropical Bain's Way Bush Vine Chenin Blanc 2010 Guava Peach Spice Tropical Honeysuckle Melon Bosman Family Vineyards Old Bush Vines Chenin Blanc 2008 Golden Delicious Apple Quince Oak Honey Almond Bosman Family Vineyards Optenhorst Chenin Blanc 2009 Apricot Oatmeal Honey Almond Oak Dornier Chenin Blanc 2010 Peach Pear Melon Thatch Apricot Graham Beck Bowed Head Chenin Blanc 2009 Pineapple Melon Peach Honeysuckle Botrytis Dried apricots 168
177 Wine name Vintage Tasting notes Graham Beck The Game Reserve Chenin Blanc 2009 Pineapple Melon Peach Honey Honeysuckle Spice Groenland Chenin Blanc 2010 Tropical Guava Apple Pear Melon Marzipan Groote Post Chenin Blanc 2010 Peardrop Apple Guava Hazendal Bush vine Chenin Blanc 2009 Tropical Quince Apple Citrus Ken Forrester The FMC 2009 Botrytis Honey Citrus Dried apricots Vanilla Kleine Zalze Cellar Selection Chenin Blanc Bush Vines 2010 Botrytis Peach Guava Pineapple Peach Kleine Zalze Vineyard Selection Barrel Fermented Chenin Blanc 2009 Oak Tropical Honeysuckle Botrytis Peach 169
178 Wine name Vintage Tasting notes Kleine Zalze Vineyard Selection Barrel Fermented Chenin Blanc 2010 Tropical Peach Litchi Botrytis Oak Koopmanskloof Chenin Blanc 2009 Tropical Guava Pineapple Lime Peardrop Apple KWV The Mentors Chenin Blanc 2008 Apricot Peach Honeysuckle Pear Butterscotch Almond Orange peel Nuts Apple Laibach Chenin Blanc 2010 Fruity Tropical Citrus Herb Pineapple Peach Meerkat Chenin Blanc 2010 Passionfruit Apple Melon Grass Citrus Gooseberry Apricot Honey Litchi Quince Mooiplaas Chenin blanc Bush vine 2010 Tropical Botrytis Beeswax Dried peach Nederburg Chenin Blanc Reserve 2008 Peach Apricot Citrus Ripe fruit Spice Vanilla toast Honey Straw Nederburg Chenin Blanc Reserve 2009 Peach Apricot Citrus Ripe fruit Spice Vanilla toast Thatch Apple 170
179 Wine name Vintage Tasting notes StellenRust 45 Barrel Fermented Chenin Blanc 2009 Tropical Thatch Vanilla Pear Butterscotch Quince Almond Lime Oak Botrytis Honeycomb Peardrop Caramel StellenRust Chenin Blanc (20% wooded) 2010 Tropical Grapefruit Pear Golden Delicious Apple Botrytis Vanilla Peardrop Welbedacht Bush Vine Chenin Blanc 2008 Honey Citrus Almond Floral Thatch Passionfruit Kiwi Guava Melon Grass Caramel Apricot Toffee Litchi Peardrop Coconut Oak 171
180 Addendum C Chenin blanc tasting wheel as compiled by the Chenin blanc Association of South Africa 172
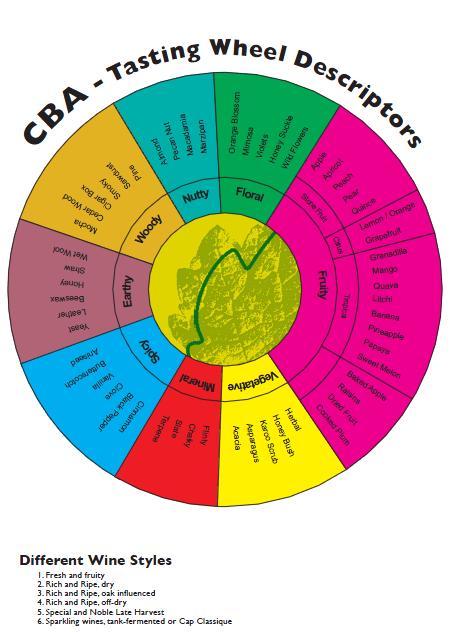
181 173
182 Addendum D Lexicon and formulae of reference standards prepared for the training phase of descriptive sensory analysis 174
183 First tier attributes Citrus Second tier attribute Flavour extract / fresh product used Dissolved / placed in Quantity per 200 ml Citrus Grapefruit (Sensient a C1859 b ) Base wine 30 µl Grapefruit Fresh ruby grapefruit Water 70 g Lemon Fresh lemon Water 50 g Orange 1 Orange Sweet Nr 1 (IFF a b ) Base wine 100 µl Orange 2 Fresh orange (without skin) Petri dish n/a Floral Honey blossom Honey (Firmenich a C5 b ) Base wine 50 µl Nutty Nutty Pecan (Firmenich a S b ) Base wine 25 µl Rich fruit Spicy Sweet associated Tropical fruit Compote Safari a dried fruit salad (only peach, apricot, apple, pear) Cooked with 5 ml water in microwave for 30 s on high 30 g Marmalade 1 All Gold a Seville orange marmalade Base wine 30 ml Marmalade 2 All Gold a Seville orange marmalade Petri dish n/a Spicy (savoury spice) Robertson a Pimento Allspice Base wine 5 ml Spicy (sweet spice) Robertson a Mixed spice Base wine 5 ml Caramel Butterscotch (Sensient a b ) Base wine 33 µl Honey Woolworths a Blue gum honey Base wine 30 ml Guava 1 Mango (Firmenich a A b ) Base wine 30 µl Guava 2 Fresh guava Petri dish n/a Litchi Litchi (Firmenich a A b ) Base wine 25 µl Mango Mango (Sensient a b ) Base wine 50 µl Melon 1 Melon (Sensient a b ) Base wine 100 µl Melon 2 Fresh melon Petri dish n/a Passionfruit Passionfruit D1556 Liq flav (IFF a b ) Base wine 100 µl Pineapple Fresh pineapple Petri dish n/a Pineapple/Guava Guava (Firmenich a A b ) Base wine 33 µl Vegetative Asparagus Gold Crest Asparagus spears in brine Petri dish n/a Woody Yellow stone fruit Medium roast French oak with medium toast ( o C for 3 h) 1 Base wine 3 g Planky French oak with no toast Base wine 4 g Woody French oak with light toast ( o C for 3 h) 1 Base wine 3 g Apricot Apricot (Cargill a F b ) Base wine 30 µl Peach Peach (Sensient a F9371 b ) Base wine 33 µl 175
184 Addendum E Descriptive sensory analysis training questionnaire 176
185 Evette Chenin blanc Training 7 & 8 AROMA&PALATE Date: Judge: Control Attribute Sample 1 Sample 2 Sample 3 Sample 4 Sample 5 Sample 6 Sample 7 Sample 8 Simonsig 10 AROMA Last session Last session Last session Last session Last session Last session Last session Last session Last session TROPICAL Guava Pineapple Litchi Passionfruit Mango CITRUS? 0 Lemon Orange (fruit/peel)? 0 Grapefruit STONE FRUIT Peach Apricot RICH FRUIT Marmalade Compote Raisin FLORAL Orange blossom Honey blossom SWEET ASS Honey Caramel Vanilla VEGETATIVE 20 0 Asparagus WOODY Planky High Roast Coffee NUTTY SPICY Sweet spice Savoury spice Yeasty 177
186 Attribute Control Simonsig 10 Sample 1 Sample 2 Sample 3 Sample 4 Sample 5 Sample 6 Sample 7 Sample 8 PALATE Last session Last session Last session Last session Last session Last session Last session Last session Last session Fresh Fruity Ripe/Cooked Fruit Vegetative Wood Sweet Acidity Bitter 0 0 Astringent
187 Addendum F Limit of quantification (LOQ) for each compound analysed in the GC-FID analyses of major volatile and monoterpene aroma compounds 179
188 Major Volatiles Monoterpenes Compound LOQ (mg/l) Compound LOQ (µg/l) Ethyl Acetate Limonene 10 Methanol Fenchone 10 Ethyl Butyrate Linalooloxide 1 5 Propanol Linalooloxide 2 5 Isobutanol ± Linalool 10 Isoamyl Acetate Linalyl Acetate 10 Butanol α- Terpeneol 10 Isoamyl Alcohol Citronellol 10 Ethyl Hexanoate Nerol 10 Hexyl Acetate Geraniol 10 Ethyl Lactate α- Ionone 10 Hexanol β- Ionone 10 Ethyl Caprylate β- Farnesol 1 10 Acetic Acid β- Farnesol 2 10 Propionic Acid β- Farnesol 3 10 Iso-Butyric Acid Ethyl Caprate Butyric Acid Iso-Valeric Acid Diethyl Succinate Valeric Acid Phenylethyl Acetate Hexanoic Acid Phenylethanol Octanoic Acid Decanoic Acid
189 Addendum G Specification sheets for the commercial wine yeast strains NT 116, LALVIN QA 23, 4F9 and Zymaflore VL1 and a guide to the characteristics and application of different yeast strains from Anchor wine yeast 181
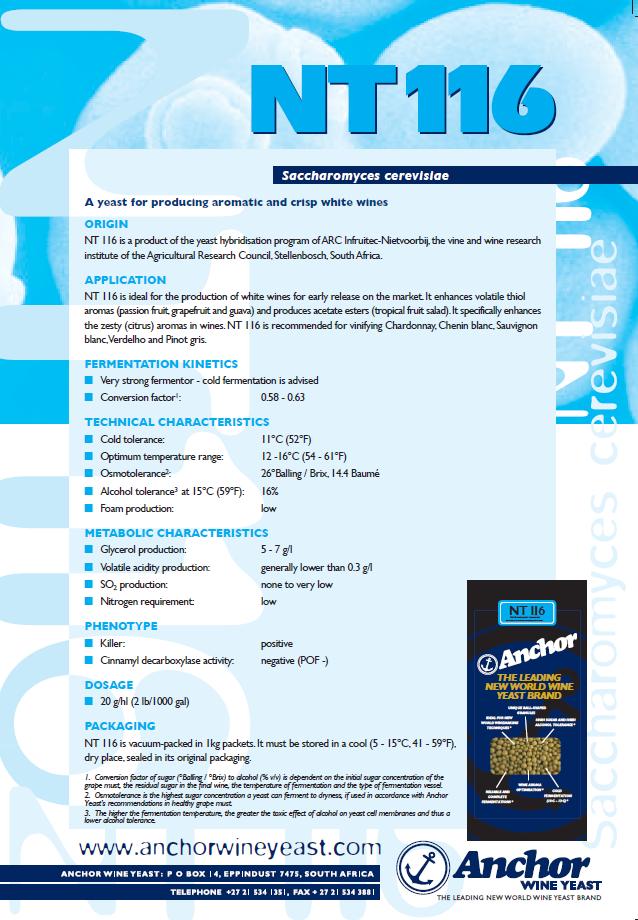
190 182
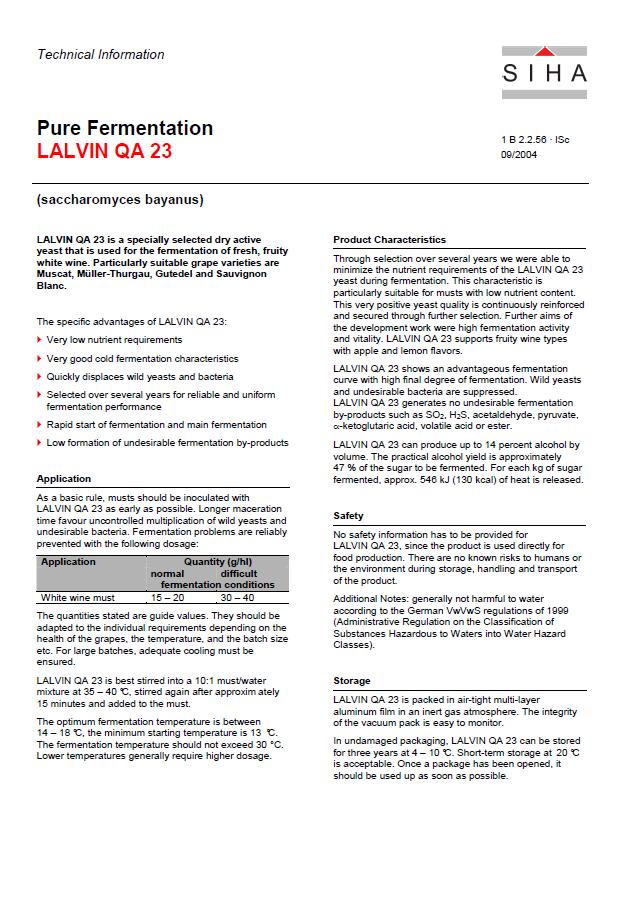
191 183
192 184
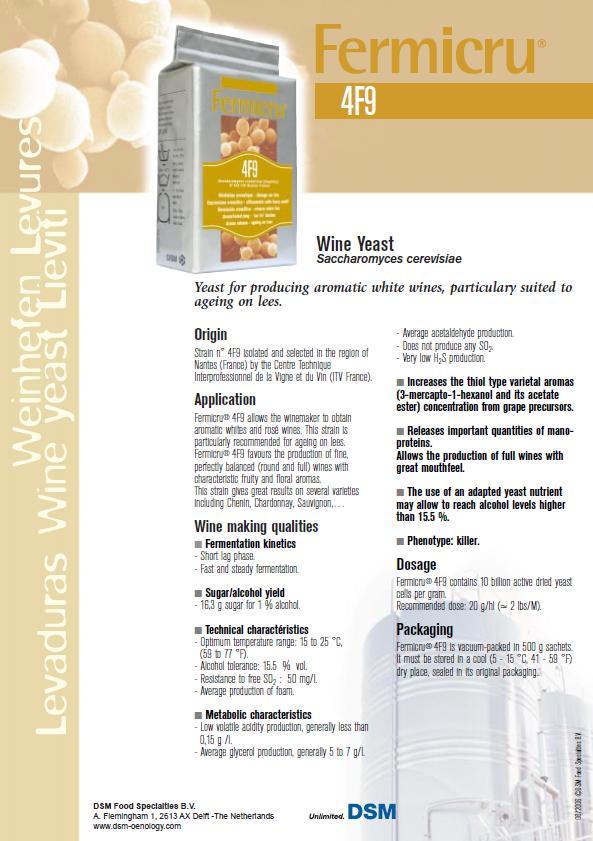
193 185
194 186
195 187
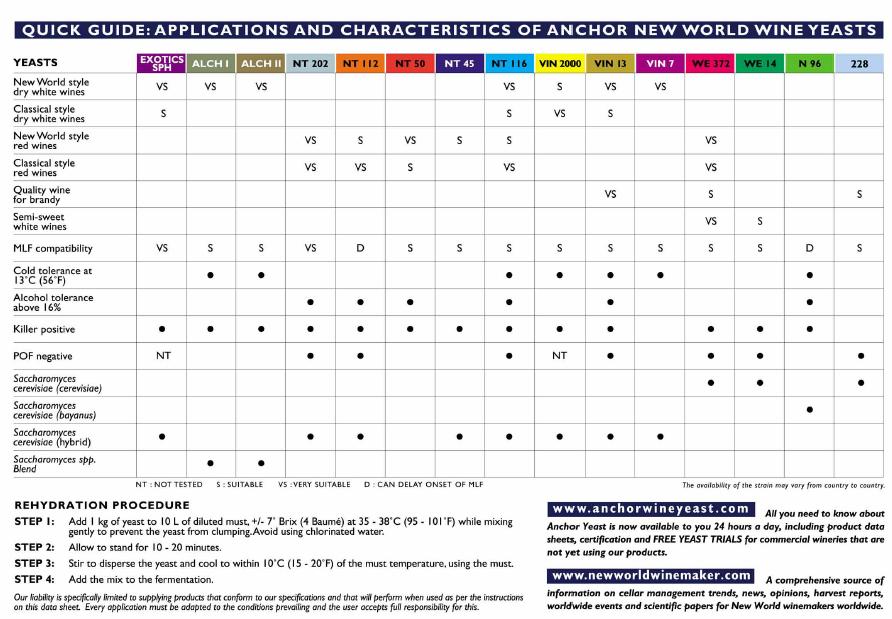
196 188
Generation w-y-ne Consumer insights & Chenin blanc wine style preferences
 Generation w-y-ne Consumer insights & Chenin blanc wine style preferences Inneke Bester MSc Wine Biotechnology Institute for Wine Biotechnology STELLENBOSCH UNIVERSITY Chenin blanc Conference, Stellenbosch,
Valeria Panzeri Renée Crous(MSc) Dr Hélène Nieuwoudt
 Dr Hélène Nieuwoudt") Sensory Characterisation of oldvine Chenin blanc wine A Scientific Perspective on thein-mouth sensations in old-vine Chenin blanc wines and sensory profiling of this category Valeria Panzeri Renée Crous(MSc)
Sensory Characterisation of oldvine Chenin blanc wine A Scientific Perspective on thein-mouth sensations in old-vine Chenin blanc wines and sensory profiling of this category Valeria Panzeri Renée Crous(MSc)
World of Wine: From Grape to Glass
 World of Wine: From Grape to Glass Course Details No Prerequisites Required Course Dates Start Date: th 18 August 2016 0:00 AM UTC End Date: st 31 December 2018 0:00 AM UTC Time Commitment Between 2 to
Spotlight on Sauvignon Blanc
 Spotlight on Sauvignon Blanc Sauvignon Blanc is one of the most widely planted and consumed cultivars both in South Africa and globally so much so that May 17 has been declared International Sauvignon
INVESTIGATIONS INTO THE RELATIONSHIPS OF STRESS AND LEAF HEALTH OF THE GRAPEVINE (VITIS VINIFERA L.) ON GRAPE AND WINE QUALITIES
 ON GRAPE AND WINE QUALITIES") INVESTIGATIONS INTO THE RELATIONSHIPS OF STRESS AND LEAF HEALTH OF THE GRAPEVINE (VITIS VINIFERA L.) ON GRAPE AND WINE QUALITIES by Reuben Wells BAgrSc (Hons) Submitted in fulfilment of the requirements
INVESTIGATIONS INTO THE RELATIONSHIPS OF STRESS AND LEAF HEALTH OF THE GRAPEVINE (VITIS VINIFERA L.) ON GRAPE AND WINE QUALITIES by Reuben Wells BAgrSc (Hons) Submitted in fulfilment of the requirements
World of Wine: From Grape to Glass Syllabus
 World of Wine: From Grape to Glass Syllabus COURSE OVERVIEW Have you always wanted to know more about how grapes are grown and wine is made? Perhaps you like a specific wine, but can t pinpoint the reason
5. Supporting documents to be provided by the applicant IMPORTANT DISCLAIMER
 Guidance notes on the classification of a flavouring substance with modifying properties and a flavour enhancer 27.5.2014 Contents 1. Purpose 2. Flavouring substances with modifying properties 3. Flavour
Academic Year 2014/2015 Assessment Report. Bachelor of Science in Viticulture, Department of Viticulture and Enology
 Academic Year 2014/2015 Assessment Report Bachelor of Science in Viticulture, Department of Viticulture and Enology Due to changes in faculty assignments, there was no SOAP coordinator for the Department
Wine Clusters Equal Export Success
 University of Wollongong Research Online Faculty of Commerce - Papers (Archive) Faculty of Business 2004 Wine Clusters Equal Export Success D. K. Aylward University of Wollongong, daylward@uow.edu.au Publication
JCAST. Department of Viticulture and Enology, B.S. in Viticulture
 JCAST Department of Viticulture and Enology, B.S. in Viticulture Student Outcomes Assessment Plan (SOAP) I. Mission Statement The mission of the Department of Viticulture and Enology at California State
Session 4: Managing seasonal production challenges. Relationships between harvest time and wine composition in Cabernet Sauvignon.
 Session 4: Managing seasonal production challenges Relationships between harvest time and wine composition in Cabernet Sauvignon Keren Bindon Cristian Varela, Helen Holt, Patricia Williamson, Leigh Francis,
OIV Revised Proposal for the Harmonized System 2017 Edition
 OIV Revised Proposal for the Harmonized System 2017 Edition TABLE OF CONTENTS 1. Preamble... 3 2. Proposal to amend subheading 2204.29 of the Harmonized System (HS)... 4 3. Bag-in-box containers: a growing
AN ENOLOGY EXTENSION SERVICE QUARTERLY PUBLICATION
 The Effects of Pre-Fermentative Addition of Oenological Tannins on Wine Components and Sensorial Qualities of Red Wine FBZDF Wine. What Where Why How 2017 2. October, November, December What the authors
Effects of Capture and Return on Chardonnay (Vitis vinifera L.) Fermentation Volatiles. Emily Hodson
 Fermentation Volatiles. Emily Hodson") Effects of Capture and Return on Chardonnay (Vitis vinifera L.) Fermentation Volatiles. Emily Hodson Thesis submitted to the faculty of the Virginia Polytechnic Institute and State University in partial
Effects of Capture and Return on Chardonnay (Vitis vinifera L.) Fermentation Volatiles. Emily Hodson Thesis submitted to the faculty of the Virginia Polytechnic Institute and State University in partial
Growing Cabernet Sauvignon at Wynns Coonawarra Estate
 Growing Cabernet Sauvignon at Wynns Coonawarra Estate The influence of vintage, clones and site Ben Harris Vineyard Manager Wynns Coonawarra Estate Coonawarra Red and White Winegrape Varieties Red (90%)
Timing of Treatment O 2 Dosage Typical Duration During Fermentation mg/l Total Daily. Between AF - MLF 1 3 mg/l/day 4 10 Days
 Micro-Oxygenation Principles Micro-oxygenation is a technique that involves the addition of controlled amounts of oxygen into wines. The goal is to simulate the effects of barrel-ageing in a controlled
Module 6. Yield and Fruit Size. Presenter: Stephan Verreynne
 Presenter: Stephan Verreynne definition Yield Yield refers to the amount of fruit produced, and can be expressed in terms of: Tree yield kg per tree kg/tree Orchard yield tons per hectare t/ha Export yield
Increasing Toast Character in French Oak Profiles
 RESEARCH Increasing Toast Character in French Oak Profiles Beaulieu Vineyard 2006 Chardonnay Domenica Totty, Beaulieu Vineyard David Llodrá, World Cooperage Dr. James Swan, Consultant www.worldcooperage.com
Supply & Demand for Lake County Wine Grapes. Christian Miller Lake County MOMENTUM April 13, 2015
 Supply & Demand for Lake County Wine Grapes Christian Miller Lake County MOMENTUM April 13, 2015 About Full Glass Research Provider of economic, market & industry research to food & drink companies and
Shaping the Future: Production and Market Challenges
 Call for Papers Dear Sir/Madam At the invitation of the Ministry of Stockbreeding, Agriculture, and Fisheries of the Oriental Republic of Uruguay, the 41th World Congress of Vine and Wine and the 16 th
Sunflower seed COMMODITY PROFILE
 Contents 1. Description of the industry............................ 1 2. Marketing structure................................. 3 3. Strategic challenges................................ 6 4. Other information..................................
Varietal Specific Barrel Profiles
 RESEARCH Varietal Specific Barrel Profiles Beaulieu Vineyard and Sea Smoke Cellars 2006 Pinot Noir Domenica Totty, Beaulieu Vineyard Kris Curran, Sea Smoke Cellars Don Shroerder, Sea Smoke Cellars David
VQA Ontario. Quality Assurance Processes - Tasting
 VQA Ontario Quality Assurance Processes - Tasting Sensory evaluation (or tasting) is a cornerstone of the wine evaluation process that VQA Ontario uses to determine if a wine meets the required standard
IMSI Annual Business Meeting Amherst, Massachusetts October 26, 2008
 Consumer Research to Support a Standardized Grading System for Pure Maple Syrup Presented to: IMSI Annual Business Meeting Amherst, Massachusetts October 26, 2008 Objectives The objectives for the study
GREAT WINE CAPITALS GLOBAL NETWORK MARKET SURVEY FINANCIAL STABILITY AND VIABILITY OF WINE TOURISM BUSINESS IN THE GWC
 GREAT WINE CAPITALS GLOBAL NETWORK MARKET SURVEY 2010-2011 FINANCIAL STABILITY AND VIABILITY OF WINE TOURISM BUSINESS IN THE GWC June 2011 2 / 6 INTRODUCTION This market survey has focused on how the economic
Chardonnay Winemaking insights in Margaret River. Glenn Goodall
 Chardonnay Winemaking insights in Margaret River Glenn Goodall Chardonnay in Margaret River The History The Terroir Clonal selection dominance of Gingin. Chardonnay and the Regional paradox?... Chardonnay
is pleased to introduce the 2017 Scholarship Recipients
 is pleased to introduce the 2017 Scholarship Recipients Congratulations to Elizabeth Burzynski Katherine East Jaclyn Fiola Jerry Lin Sydney Morgan Maria Smith Jake Uretsky Elizabeth Burzynski Cornell University
1. Continuing the development and validation of mobile sensors. 3. Identifying and establishing variable rate management field trials
 Project Overview The overall goal of this project is to deliver the tools, techniques, and information for spatial data driven variable rate management in commercial vineyards. Identified 2016 Needs: 1.
(A report prepared for Milk SA)
") South African Milk Processors Organisation The voluntary organisation of milk processors for the promotion of the development of the secondary dairy industry to the benefit of the dairy industry, the consumer
South African Milk Processors Organisation The voluntary organisation of milk processors for the promotion of the development of the secondary dairy industry to the benefit of the dairy industry, the consumer
Do the French have superior palates but no better sense of value? An experimental study
 Do the French have superior palates but no better sense of value? An experimental study Geoffrey Lewis (corresponding author) Professorial Fellow, Melbourne Business School 200 Leicester Street, Carlton,
Emerging Local Food Systems in the Caribbean and Southern USA July 6, 2014
 Consumers attitudes toward consumption of two different types of juice beverages based on country of origin (local vs. imported) Presented at Emerging Local Food Systems in the Caribbean and Southern USA
Hops II Interfacing with the Hop Industry Role of a Hops Supplier. Tim Kostelecky John I. Haas, Inc ASBC Meeting June 6, 2017
 Hops II Interfacing with the Hop Industry Role of a Hops Supplier Tim Kostelecky John I. Haas, Inc. 2017 ASBC Meeting June 6, 2017 Overview of a Hops Supplier Hops from own farm Products, Services for
The Roles of Social Media and Expert Reviews in the Market for High-End Goods: An Example Using Bordeaux and California Wines
 The Roles of Social Media and Expert Reviews in the Market for High-End Goods: An Example Using Bordeaux and California Wines Alex Albright, Stanford/Harvard University Peter Pedroni, Williams College
This document is a preview generated by EVS
 TECHNICAL REPORT ISO/TR 12591 First edition 2013-12-15 White tea Definition Thé blanc Définition Reference number ISO 2013 COPYRIGHT PROTECTED DOCUMENT ISO 2013 All rights reserved. Unless otherwise specified,
VITICULTURE AND ENOLOGY
 VITICULTURE AND ENOLOGY Class L-25: Agricultural and Forest Science and Technology http://www.enol.unimi.it/ DIRECTOR OF THE BACHELOR S PROGRAMME Prof. Attilio Scienza Department of Crop Production Tree
RESOLUTION OIV-ECO
 RESOLUTION OIV-ECO 563-2016 TRAINING PROGRAMS FOR OENOLOGISTS THE GENERAL ASSEMBLY, based on the work of the FORMAT Expert Group, CONSIDERING the resolution OIV-ECO 492-2013 providing the definition of
DETERMINANTS OF DINER RESPONSE TO ORIENTAL CUISINE IN SPECIALITY RESTAURANTS AND SELECTED CLASSIFIED HOTELS IN NAIROBI COUNTY, KENYA
 DETERMINANTS OF DINER RESPONSE TO ORIENTAL CUISINE IN SPECIALITY RESTAURANTS AND SELECTED CLASSIFIED HOTELS IN NAIROBI COUNTY, KENYA NYAKIRA NORAH EILEEN (B.ED ARTS) T 129/12132/2009 A RESEACH PROPOSAL
HMGT 2402 Wine & Beverage Management. Prof. Karen Goodlad Spring 2017 White Wines of France
 HMGT 2402 Wine & Beverage Management Prof. Karen Goodlad Spring 2017 White Wines of France Quiz Lecture Objectives: Match appellations with the regions where they re located and their principal grapes
The changing face of the U.S. consumer: How shifting demographics are re-shaping the U.S. consumer market for wine
 The changing face of the U.S. consumer: How shifting demographics are re-shaping the U.S. consumer market for wine Prepared by: Wine Opinions LLC for WSET It is well understood that wine consumption in
2016 China Dry Bean Historical production And Estimated planting intentions Analysis
 2016 China Dry Bean Historical production And Estimated planting intentions Analysis Performed by Fairman International Business Consulting 1 of 10 P a g e I. EXECUTIVE SUMMARY A. Overall Bean Planting
Influence of climate and variety on the effectiveness of cold maceration. Richard Fennessy Research officer
 Influence of climate and variety on the effectiveness of cold maceration Richard Fennessy Research officer What is pre-fermentative cold maceration ( cold soak ) and what are the benefits? Introduction
FOH WINE AND BEER KNOWLEDGE LESSON WEEK TWO
 FOH WINE AND BEER KNOWLEDGE LESSON WEEK TWO This week, we're going to go over some wine basics and skip the beer. Most of the information here is from Kevin Zraly s Windows on the World Complete Wine Course.
Roaster/Production Operative. Coffee for The People by The Coffee People. Our Values: The Role:
 Are you an enthusiastic professional with a passion for ensuring the highest quality and service for your teams? At Java Republic we are currently expanding, so we are looking for an Roaster/Production
Wine Purchase Intentions: A Push-Pull Study of External Drivers, Internal Drivers, and Personal Involvement
 Wine Purchase Intentions: A Push-Pull Study of External Drivers, Internal Drivers, and Personal Involvement Dennis Reynolds, Ph.D. Ivar Haglund Distinguished Professor School of Hospitality Business Management
BVM PROSPECTUS. DAMIAN ADAMS Ph E MIKE CROAD Ph E
 BVM PROSPECTUS Berakah Vineyard Management is a market leader in all aspects of vineyard operations, from vineyard establishment through to cost-leading vineyard management and wine company relationship
HSC Geography. Year 2016 Mark Pages 30 Published Feb 7, Geography Notes. By Annabelle (97.35 ATAR)
") HSC Geography Year 2016 Mark 93.00 Pages 30 Published Feb 7, 2017 Geography Notes By Annabelle (97.35 ATAR) Powered by TCPDF (www.tcpdf.org) Your notes author, Annabelle. Annabelle achieved an ATAR of
HSC Geography Year 2016 Mark 93.00 Pages 30 Published Feb 7, 2017 Geography Notes By Annabelle (97.35 ATAR) Powered by TCPDF (www.tcpdf.org) Your notes author, Annabelle. Annabelle achieved an ATAR of
ICC September 2018 Original: English. Emerging coffee markets: South and East Asia
 ICC 122-6 7 September 2018 Original: English E International Coffee Council 122 st Session 17 21 September 2018 London, UK Emerging coffee markets: South and East Asia Background 1. In accordance with
North America Ethyl Acetate Industry Outlook to Market Size, Company Share, Price Trends, Capacity Forecasts of All Active and Planned Plants
 North America Ethyl Acetate Industry Outlook to 2016 - Market Size, Company Share, Price Trends, Capacity Forecasts of All Active and Planned Plants Reference Code: GDCH0416RDB Publication Date: October
Development and evaluation of a mobile application as an e-learning tool for technical wine assessment
 Development and evaluation of a mobile application as an e-learning tool for technical wine assessment Kerry Wilkinson, Paul Grbin, Nick Falkner, Amanda Able, Leigh Schmidtke, Sonja Needs, Ursula Kennedy,
QUALITY, PRICING AND THE PERFORMANCE OF THE WHEAT INDUSTRY IN SOUTH AFRICA
 QUALITY, PRICING AND THE PERFORMANCE OF THE WHEAT INDUSTRY IN SOUTH AFRICA 21 September 2015 Dr Johnny van der Merwe Lecturer / Agricultural economics (Prof HD van Schalkwyk and Dr PC Cloete) So what motivated
GUIDELINES TO DETERMINE THE EFFECT OF FUNGICIDAL AGRICULTURAL REMEDIES ON FERMENTATION PROCESSES AND WINE QUALITY
 GUIDELINES TO DETERMINE THE EFFECT OF FUNGICIDAL AGRICULTURAL REMEDIES ON FERMENTATION PROCESSES AND WINE QUALITY Issued by the Registrar: Act No. 36 of 1947, Private Bag X343, Pretoria 0001, Republic
KOREA MARKET REPORT: FRUIT AND VEGETABLES
 KOREA MARKET REPORT: FRUIT AND VEGETABLES 주한뉴질랜드대사관 NEW ZEALAND EMBASSY SEOUL DECEMBER 2016 Page 2 of 6 Note for readers This report has been produced by MFAT and NZTE staff of the New Zealand Embassy
Wine Futures: Pricing and Allocation as Levers against Quality Uncertainty
 Padua 2017 Abstract Submission I want to submit an abstract for: Conference Presentation Corresponding Author Burak Kazaz E-Mail bkazaz@syr.edu Affiliation Syracuse University, Whitman School of Management
LAST PART: LITTLE ROOM FOR CORRECTIONS IN THE CELLAR
 ROUSSEAU, OCHRATOIN A in WINES LITTLE ROOM FOR CORRECTIONS IN THE CELLAR, PAGE 1 OCHRATOIN A IN WINES: CURRENT KNOWLEDGE LAST PART: LITTLE ROOM FOR CORRECTIONS IN THE CELLAR Jacques Rousseau ICV Viticultural
Relationship between Mineral Nutrition and Postharvest Fruit Disorders of 'Fuerte' Avocados
 Proc. of Second World Avocado Congress 1992 pp. 395-402 Relationship between Mineral Nutrition and Postharvest Fruit Disorders of 'Fuerte' Avocados S.F. du Plessis and T.J. Koen Citrus and Subtropical
Final Report. TITLE: Developing Methods for Use of Own-rooted Vitis vinifera Vines in Michigan Vineyards
 Final Report TITLE: Developing Methods for Use of Own-rooted Vitis vinifera Vines in Michigan Vineyards PRINCIPAL INVESTIGATOR: Thomas J. Zabadal OBJECTIVES: (1) To determine the ability to culture varieties
Global Perspectives Grant Program
 UW College of Agriculture and Natural Resources Global Perspectives Grant Program Project Report Instructions 1. COVER PAGE Award Period (e.g. Spring 2012): Summer 2015 Principle Investigator(s)_Sadanand
STATE OF THE VITIVINICULTURE WORLD MARKET
 STATE OF THE VITIVINICULTURE WORLD MARKET April 2018 1 Table of contents 1. VITICULTURAL PRODUCTION POTENTIAL 3 2. WINE PRODUCTION 5 3. WINE CONSUMPTION 7 4. INTERNATIONAL TRADE 9 Abbreviations: kha: thousands
Wine-Tasting by Numbers: Using Binary Logistic Regression to Reveal the Preferences of Experts
 Wine-Tasting by Numbers: Using Binary Logistic Regression to Reveal the Preferences of Experts When you need to understand situations that seem to defy data analysis, you may be able to use techniques
E-business and terroir-linked products in Italy: a case study on Romagna wine producers
 E-business and terroir-linked products in Italy: a case study on Romagna wine producers Maurizio Canavari a, Alessandro Farneti a, Marco Lucchi a, Martyn Warren b a Dipartimento di Economia e Ingegneria
Communications Protocol for the Wine Industry
 Communications Protocol for the Wine Industry 2017 Why this protocol Local and international media have a keen interest in the transformation and development of the South African wine industry. This protocol
STATE OF THE VITIVINICULTURE WORLD MARKET
 STATE OF THE VITIVINICULTURE WORLD MARKET April 2015 1 Table of contents 1. 2014 VITIVINICULTURAL PRODUCTION POTENTIAL 3 2. WINE PRODUCTION 5 3. WINE CONSUMPTION 7 4. INTERNATIONAL TRADE 9 Abbreviations:
RESEARCH UPDATE from Texas Wine Marketing Research Institute by Natalia Kolyesnikova, PhD Tim Dodd, PhD THANK YOU SPONSORS
 RESEARCH UPDATE from by Natalia Kolyesnikova, PhD Tim Dodd, PhD THANK YOU SPONSORS STUDY 1 Identifying the Characteristics & Behavior of Consumer Segments in Texas Introduction Some wine industries depend
Work Sample (Minimum) for 10-K Integration Assignment MAN and for suppliers of raw materials and services that the Company relies on.
 for 10-K Integration Assignment MAN and for suppliers of raw materials and services that the Company relies on.") Work Sample (Minimum) for 10-K Integration Assignment MAN 4720 Employee Name: Your name goes here Company: Starbucks Date of Your Report: Date of 10-K: PESTEL 1. Political: Pg. 5 The Company supports the
Work Sample (Minimum) for 10-K Integration Assignment MAN 4720 Employee Name: Your name goes here Company: Starbucks Date of Your Report: Date of 10-K: PESTEL 1. Political: Pg. 5 The Company supports the
Development and characterization of wheat breads with chestnut flour. Marta Gonzaga. Raquel Guiné Miguel Baptista Luísa Beirão-da-Costa Paula Correia
 Development and characterization of wheat breads with chestnut flour Marta Gonzaga Raquel Guiné Miguel Baptista Luísa Beirão-da-Costa Paula Correia 1 Introduction Bread is one of the oldest functional
Fleurieu zone (other)
") Fleurieu zone (other) Incorporating Southern Fleurieu and Kangaroo Island wine regions, as well as the remainder of the Fleurieu zone outside all GI regions Regional summary report 2006 South Australian
Fleurieu zone (other) Incorporating Southern Fleurieu and Kangaroo Island wine regions, as well as the remainder of the Fleurieu zone outside all GI regions Regional summary report 2006 South Australian
Washington Wine Commission: Wine industry grows its research commitment
 PROGRESS EDITION MARCH 22, 2016 10:33 PM Washington Wine Commission: Wine industry grows its research commitment HIGHLIGHTS New WSU Wine Science Center a significant step up for industry Development of
Lamb and Mutton Quality Audit
 Lamb and Mutton Quality Audit rmrdsaonline.co.za/lamb-and-mutton-quality-audit/ By admin 10/08/2018 South African Retail Lamb and Mutton Quality Audit Industry Sector: Cattle and Small Stock Research focus
Development of a Master Class Curriculum on Wines of Nova Scotia
 Request for Proposals for Development of a Master Class Curriculum on Wines of Nova Scotia RFP Number: 18-001 Issued By: Canadian Association of Professional Sommeliers Atlantic Chapter (CAPS-AC) Representative:
Coonawarra Wine Region. Regional summary report WINEGRAPE UTILISATION AND PRICING SURVEY 2007
 Coonawarra Wine Region Regional summary report 2007 WINEGRAPE UTILISATION AND PRICING SURVEY 2007 45 46 Coonawarra Vintage overview Vintage report A low yielding vintage, with warm ripening conditions,
PRIEST RANCH WINES ESTATE FARMED WINES OF UNCOMMON QUALITY AND CHARACTER
 PRIEST RANCH WINES ESTATE FARMED WINES OF UNCOMMON QUALITY AND CHARACTER Priest Ranch embodies the essence of Napa Valley, from the trailblazing mindset of its establishing pioneers to today s spirit of
The aim of the thesis is to determine the economic efficiency of production factors utilization in S.C. AGROINDUSTRIALA BUCIUM S.A.
 The aim of the thesis is to determine the economic efficiency of production factors utilization in S.C. AGROINDUSTRIALA BUCIUM S.A. The research objectives are: to study the history and importance of grape
The Purpose of Certificates of Analysis
 207/SOM2/SCSC/WRF/020 The Purpose of Certificates of Analysis Submitted by: FIVS 7 th Wine Regulatory Forum -2 May 207 The Purpose of Certificates of Analysis Greg Hodson, Ph.D. President, FIVS Wine Institute
2017 FINANCIAL REVIEW
 2017 FINANCIAL REVIEW In addition to activity, strategy, goals, and challenges, survey respondents also provided financial information from 2014, 2015, and 2016. Select results are provided below: 2016
QUALITY DESCRIPTOR / REPRESENTATIONS GUIDELINES FOR THE
 QUALITY DESCRIPTOR / REPRESENTATIONS GUIDELINES FOR THE AUSTRALIAN FRUIT JUICE INDUSTRY Adopted 30 September 2005 Reviewed 12 January 2007 CODE OF PRACTICE QUALITY DESCRIPTOR/REPRESENTATIONS GUIDELINES
TOASTING TECHNIQUES: Old World and New World RESEARCH. Joel Aiken and Bob Masyczek, Beaulieu Vineyard Maurizio Angeletti, Antinori Winery
 RESEARCH TOASTING TECHNIQUES: Old World and New World Joel Aiken and Bob Masyczek, Beaulieu Vineyard Maurizio Angeletti, Antinori Winery www.worldcooperage.com 1 INTRODUCTION In the traditional art of
Crisis Communications Protocol for the Wine Industry
 Crisis Communications Protocol for the Wine Industry 2017 Why this protocol Local and international media have a keen interest in the transformation and development of the South African wine industry.
FINAL REPORT TO AUSTRALIAN GRAPE AND WINE AUTHORITY. Project Number: AGT1524. Principal Investigator: Ana Hranilovic
 Collaboration with Bordeaux researchers to explore genotypic and phenotypic diversity of Lachancea thermotolerans - a promising non- Saccharomyces for winemaking FINAL REPORT TO AUSTRALIAN GRAPE AND WINE
BODEGAS TOBIA, S.L. Paraje Senda Rutia, s/n Cuzcurrita de Rio Tirón. La Rioja
 @.com Our Mission Tobía is name of an old grape varietal and it is also the name of our wine. We are part of Rioja, the land with wine name. We want to express to the world our land deep-rooted feelings,
Effect of Planting Date and Maturity Group on Soybean Yield in the Texas South Plains in 2001
 Effect of Planting Date and Maturity Group on Soybean Yield in the Texas South Plains in 2001 Calvin Trostle, Extension Agronomy, Lubbock, (806) 746-6101, c-trostle@tamu.edu Brent Bean, Extension Agronomy,
Starbucks / Dunkin Donuts research. Presented by Alex Hockley and Molly Fox. Wednesday, June 13, 2012
 F& H Starbucks / Dunkin Donuts research Presented by Alex Hockley and Molly Fox Executive Summary: These days there are a significant amount of coffee establishments located in Center City, Philadelphia.
HERZLIA MIDDLE SCHOOL
 NAME TEACHER S COMMENT TEACHER CLASS PARENT S COMMENT MARK PERCENTAGE PARENT S SIGNATURE HERZLIA MIDDLE SCHOOL GRADE 7 ECONOMIC & MANAGEMENT SCIENCES 27 AUGUST 2015 TIME: 50 minutes MARKS: 70 o This paper
Rotting Grapes to Perfection: Winemaking. James Osborne PhD, Dept Food Science Oregon State University
 Rotting Grapes to Perfection: Winemaking James Osborne PhD, Dept Food Science Oregon State University Who I am and how I got here Grew up in Auckland, New Zealand, on a Dairy farm How I got here Soil
Cost of Establishment and Operation Cold-Hardy Grapes in the Thousand Islands Region
 Cost of Establishment and Operation Cold-Hardy Grapes in the Thousand Islands Region Miguel I. Gómez, Dayea Oh and Sogol Kananizadeh Dyson School of Applier Economics and Management, Cornell University
The Importance of Dose Rate and Contact Time in the Use of Oak Alternatives
 W H I T E PA P E R The Importance of Dose Rate and Contact Time in the Use of Oak Alternatives David Llodrá, Research & Development Director, Oak Solutions Group www.oaksolutionsgroup.com Copyright 216
Rod McDonald Wines farm around 70 hectares of vineyards in the Hawke s Bay and Te Awanga Estate is home to its cellar door.
 HAWKES BAY, NEW ZEALAND Rod McDonald Wines is the passion of winemaker Rod McDonald and a family owned wine business. Everything Rod and his team does are based on their love for making wine and reflects
Monitoring Ripening for Harvest and Winemaking Decisions
 Joseph A. Fiola, Ph.D. Specialist in Viticulture and Small Fruit Western MD Research & Education Center 18330 Keedysville Road Keedysville, MD 21756-1104 301-432-2767 ext. 344; Fax 301-432-4089 jfiola@umd.edu
Reading Essentials and Study Guide
 Lesson 1 Absolute and Comparative Advantage ESSENTIAL QUESTION How does trade benefit all participating parties? Reading HELPDESK Academic Vocabulary volume amount; quantity enables made possible Content
State of the Vitiviniculture World Market
 Punta del Este, November 19th, 2018 State of the Vitiviniculture World Market Jean-Marie Aurand Director General Topics Potential of viticultural production Production of grapes Production of wine Consumption
Co-inoculation and wine
 Co-inoculation and wine Chr. Hansen Fermentation Management Services & Products A definition of co-inoculation Co-inoculation is the term used in winemaking when yeasts (used to manage alcoholic fermentations
DEVELOPMENT OF A RAPID METHOD FOR THE ASSESSMENT OF PHENOLIC MATURITY IN BURGUNDY PINOT NOIR
 PINOT NOIR, PAGE 1 DEVELOPMENT OF A RAPID METHOD FOR THE ASSESSMENT OF PHENOLIC MATURITY IN BURGUNDY PINOT NOIR Eric GRANDJEAN, Centre Œnologique de Bourgogne (COEB)* Christine MONAMY, Bureau Interprofessionnel
Sensory Quality Measurements
 Sensory Quality Measurements Evaluating Fruit Flavor Quality Appearance Taste, Aroma Texture/mouthfeel Florence Zakharov Department of Plant Sciences fnegre@ucdavis.edu Instrumental evaluation / Sensory
Wine Australia Wine.com Data Report. July 21, 2017
 Wine Australia Wine.com Data Report July 21, 2017 INTRODUCTION Wine Opinions is a wine market research company focusing on the attitudes, behaviors, and taste preferences of U.S. wine drinkers. Wine Opinions
JCAST. Department of Viticulture and Enology, B.S. in Enology
 JCAST Department of Viticulture and Enology, B.S. in Enology Student Outcomes Assessment Plan (SOAP) I. Mission Statement The mission of the Department of Viticulture and Enology at California State University,
Subject: Industry Standard for a HACCP Plan, HACCP Competency Requirements and HACCP Implementation
 Amendment 0: January 2000 Page: 1 V I S C New Zealand Subject: Industry Standard for a HACCP Plan, HACCP Competency Requirements and HACCP Implementation Reference Nos: VISC 1 Date issued: 27 January 2000
POSITION DESCRIPTION
 POSITION DESCRIPTION Position Title: Cellar Hand Incumbent: Date: Location: Marlborough Reports to: Senior Cellar Supervisor SECTION 1 POSITION SUMMARY To assist the winemaking and cellar teams in the
WACS culinary certification scheme
 WACS culinary certification scheme About this document This document provides an overview of the requirements that applicants need to meet in order to achieve the WACS Certified Chef de Cuisine professional
The Art of Winemaking: The Cellar
 The Art of Winemaking: The Cellar Having discussed the importance of terroir, vineyard management and harvesting in our series on The Art of Winemaking, we now turn to the cellar. While the basic principles
The China Wine Barometer (CWB): a look into the future
: a look into the future") The China Wine Barometer (CWB): a look into the future INTERIM REPORT to GRAPE AND WINE RESEARCH & DEVELOPMENT CORPORATION Project Number: USA-1202 Investigators: Dr. Armando Maria Corsi, Dr. Justin Cohen,
The China Wine Barometer (CWB): a look into the future INTERIM REPORT to GRAPE AND WINE RESEARCH & DEVELOPMENT CORPORATION Project Number: USA-1202 Investigators: Dr. Armando Maria Corsi, Dr. Justin Cohen,
COMPARISON OF THREE METHODOLOGIES TO IDENTIFY DRIVERS OF LIKING OF MILK DESSERTS
 COMPARISON OF THREE METHODOLOGIES TO IDENTIFY DRIVERS OF LIKING OF MILK DESSERTS Gastón Ares, Cecilia Barreiro, Ana Giménez, Adriana Gámbaro Sensory Evaluation Food Science and Technology Department School