OKANAGAN VALLEY WINE CONSUMER RESEARCH STUDY 2008 RESULTS
|
|
|
- Sheryl Cox
- 5 years ago
- Views:
Transcription
1 RESEARCH AND PLANNING OKANAGAN VALLEY WINE CONSUMER RESEARCH STUDY 2008 RESULTS Summer 2009 Research and Planning Tourism British Columbia 3 rd Floor, 1803 Douglas St. Victoria, BC V8W 9W5 Web: Research@tourismbc.com Phone:
2 Acknowledgements The 2008 Okanagan Valley Wine Consumer Research Study was a comprehensive survey of travellers to seven wineries located in two sub-regions in the Okanagan Valley between August and October The Okanagan Valley Wine Consumer Research Study was a partnership between Tourism British Columbia, the Thompson Okanagan Tourism Association and the seven participating wineries from the Okanagan Valley: Mission Hill Family Estates Tinhorn Creek Vineyards Cedar Creek Estate Winery Burrowing Owl Estate Winery Elephant Island Nk Mip Cellars Soaring Eagle Estate Winery Tourism British Columbia would like to gratefully acknowledge the wineries that assisted with the project by providing access for on-site visitor interviews as well as providing other assistance throughout the project. This report was partially written by the Kim Nuernberger of Agency Research Consultants on contract with. i
3 Executive Summary In 2008, Tourism British Columbia, Thompson Okanagan Tourism Association (TOTA) and seven participating wineries in the Okanagan Valley collaborated to conduct research with visitors to the Okanagan wineries. The primary objectives of this study were to support marketing initiatives and product development of the Okanagan Valley s wine tourism product, specifically: 1. To examine travel motivations and trip planning behaviours of wine travellers; 2. To profile travellers who visit the Okanagan Valley s wineries in terms of traveller and trip characteristics in order to support product development and marketing initiatives. A multi-location, two-stage survey design was used to investigate the study objectives. Travellers were interviewed at one of seven winery locations in the North and South Okanagan Valley. On-site interviews collected information from travellers during their trip and a mailback questionnaire collected information from travellers after their trip. The purpose of the mailback questionnaire was to gather information about trip motivation, planning, experiences and activities, and to understand travellers perceptions of the East Kootenay region and British Columbia upon trip completion. Between August 1 st and October 14 th, 2008, a total of 3,191 people were approached at one of seven participating Okanagan Valley wineries. Of those, 2,471 agreed to complete the interview. However, 347 of these individuals were local residents, 84 had participated in the survey on a previous occasion, and 53 started the survey, but did not complete. All of these instances were removed from the final tally resulting in 1,977 useable surveys. Nearly seventy percent of respondents agreed to complete the follow-up survey and 46% of these did so, resulting in 536 useable surveys for analysis. Fifty percent of independent, leisure travellers were from BC, whereas a quarter were from Alberta (26%) and fewer from elsewhere in (13%), the US (5%) or from other international countries (5%). The majority of wine travellers in the Okanagan Valley were between the ages of 35 to 64 years with the most frequently stated age category being 45 to 54 years of age (27%). Three quarters (74%) of wine travellers had at least a college or technical diploma, with the most frequently stated education category being a university degree (38%). Half (52%) of the respondents had annual household incomes of at least $100,000 and another quarter (25%) had incomes between $65,000 and $99,999. Slightly over three quarters (79%) of respondents indicated that this was not their first time winetouring. ii
4 The majority of travellers interviewed at Okanagan Valley wineries were travelling for leisure purposes (72%), a quarter were travelling to visit friends and family (27%), while fewer for other purposes (1%). High interest wine travellers were more likely to be travelling for leisure purposes (81%) as opposed to visiting family and friends (19.1%). They were also more likely to stay at Resort/Hotel/Motel/B&Bs (58.1%) as compared to low interest wine travellers. A majority (94%) of travellers used a car/truck/motorcycle as their primary mode of transportation, whereas fewer travelled in a recreational vehicle (4%) or a bus (<0.5%). Half (50%) of wine travellers were staying in traditional fixed roof accommodations (Hotel/Motel/Resort/B&Bs) and a quarter with family and friends (25%). Less than a fifth (16%) were staying at a campground/rv park. Fewer were staying at non-traditional types of accommodation such as second homes/rental homes/timeshares (8%). The primary destination of the majority of wine travellers (76%) was the Okanagan Valley. One in ten wine travellers (11%) was touring with no particular destination whereas the remainder had primary destinations elsewhere in (2.9%), or other international destinations (0.9%). Overall, the average travel party size was 2.8 people and 14% of wine travellers were travelling with children. Those parties with children had an average of 4.6 people travelling in their group. Parties travelling without children had an average travel party size of 2.6 people. The average time away from home on the trip was 9.7 days (median = 7.0 days) and travellers intended to spend 8.0 of those days (median = 6.0) in British Columbia and an average of 5.7 days (median = 4.0 days) in the Okanagan Valley. Advice from family and friends (60%), past experience visiting wineries in the Okanagan Valley (55%) and tourism/travel/visitor guides or books (49%) were among the top information sources used before travel. Also important information sources used prior to leaving home included maps (48%), prior experience at winery (44%) and a local or regional tourism website (44%). Maps (53%), tourism/travel/visitor guides or books (53%), and advice received from friends and relatives (44%) were the top information sources used during travel. Also important, but less frequently used, information sources during trip included Visitor Centres (41%), past experience visiting wineries in the Okanagan Valley (35%), winery business brochures (34%) and prior experience visiting particular winery (34%). The majority (55%) of travellers indicated that wine touring played at least some importance in planning their trip (known as high interest wine travellers). Over a quarter (27%) indicated it was the primary reason with an additional 27% rating it an important reason. While the specific winery intercepted at played at less important role in trip planning, over a third (39%) of travellers indicated that the specific winery played at least some importance in trip planning. iii
5 The majority of travellers (77%) spent three weeks or more planning their trip. Over a third of travellers (37%) indicated that the primary motivation of their trip was to spend quality time with family/friends. High interest wine travellers were less likely to be motivated by spending quality time with their friends/family (29%) and more likely because they have a passion for wine (14%) as compared to low interest wine travellers (3%). Cost/budget considerations aside, almost half (48%) indicated that the primary consideration in planning their trip was the destination (Selected destination first and then thought about trip activities) versus less than a quarter of travellers whose primary consideration was to visit wineries (Selected wine touring first and then thought about destination, 23%). High interest travellers where considerably more likely to consider visiting wineries as the primary trip consideration compared to low interest travellers (34% & 5%, respectively). Travellers who did not indicate that wine touring was the primary reason for their trip were asked to identify the leisure activity that was the primary reason. Over a quarter indicated that there was no specific leisure activity while a fifth indicated a nature-based activity (boating, hiking, camping etc) and nearly 15% mentioned participating in lake activities. When asked about reasons for visiting specific wineries, over a third (37%) of respondents indicated that recommendations (from friends, local businesses and/or other sources) were a key reason for visiting. A fifth of respondents (22%) indicated being attracted to visit by either passing by the winery or road signage, while a tenth were familiar with the name/product (11%) Travellers were also asked about other leisure activities they intended to participate in while their trip (intercept survey) and actual activities they did participate in (follow up survey). During the trip, respondents indicated that they were likely to participate in fine dining (66%), visit a farmer s market (64%), visit a museum/historical site (34%) and/or go hiking (33%). After their trip, respondents indicated that they had actually visited a farmer s market (68%), drove a wine trail (64%), participated in fine dining (59.2%, and experience local or regional cuisine (53%). Respondents also indicated shopping for local arts/crafts (54%), participating in swimming/beach activities (43%), dining (70%), swimming (53%) and shopping for local arts and crafts (53%) as popular trip activities. On average, wine travellers intended to visit a total of 9 wineries during their trip averaging 3.5 wineries on the actual interview day. High interest wine travellers were more likely to visit more wineries in total (11.7) and also more wineries in the Okanagan Valley (9.4) and per day (4.3). Over two thirds (69%) of wine travellers were first time visitors to the winery where they were intercepted but over half (55%) had tasted the specific winery s product prior to visiting. While at the winery, the majority of wine travellers indicated they wine tasted (85%) and purchased wine (71%). Less took a self/guided tour (23%) or purchased other merchandise (24%). Over three quarters (79%) were very satisfied with their overall wine touring experience in the Okanagan Valley. Less than a tenth (8%) of respondents indicated that they were somewhat or very dissatisfied. Reasons provided by these respondents were related to a service or amenities that was lacking, poor accommodation, expensive wine or lack of information. Those highly iv
6 satisfied gave reasons of high level of service, high quality of wine/food and relaxed atmosphere as some of the contributors to their satisfaction. In terms of likelihood of taking a return trip to wineries in other regions of British Columbia, less than half (38%) indicated that they were either very likely (20%) or likely (18%) to take such a trip in the next two years. Respondents were also asked about their likelihood of taking another leisure trip to visit wineries in the Okanagan valley and similarly, over a third indicated that they would be either very likely (29%) or likely (8%) in the next two year. High interest wine travellers, however, were very likely to take another trip to the Okanagan to visit wineries (79%, Very likely). Travellers were asked to identify what unique characteristics of the Okanagan Valley that make it different from other wine destinations. Half (54%) indicated that the Okanagan Valley s beautiful scenery/unique geography make it different from other destinations, while a third (35%) cited its sunny, dry weather. Travellers at the Okanagan Valley wineries spent an average of $ per party per day. High interest wine travellers reported considerably higher per diem expenditures then low interest wine travellers ($ & $243.62, respectively). There were also notable differences in expenditures when broken down by origin of the travellers, primary accommodation type, travel party size and age. v
7 Table of Contents TABLE OF CONTENTS... 6 INTRODUCTION... 7 METHODS... 8 DATA COLLECTION - INTERVIEW... 8 DATA COLLECTION AND MAILBACK DATA ANALYSIS ALL VISITORS ORIGIN RESULTS TRAVELLER CHARACTERISTICS ALL PARTICIPANTS TRAVELLER CHARACTERISTICS - EXPLORING WINE TRAVELLERS BY EXPERIENCE AND INTEREST TRIP CHARACTERISTICS TRIP PLANNING WINE TOURING Planning the wine touring trip Characteristics of wine touring trip Characteristics of wine Touring Destination Satisfaction with wine Touring & Overall Trip Likelihood of future leisure travel Competitiveness of Okanagan Valley wine & destination TRIP EXPENDITURES SUMMARY LIMITATIONS APPENDICES APPENDIX A INTERVIEW SCHEDULE AND INTERVIEWS COMPLETED APPENDIX B QUESTIONNAIRES APPENDIX C TOUR GROUP & BUSINESS TRAVELLER PROFILES TRAVELLER CHARACTERISTICS - TOUR GROUP PARTICIPANTS TRAVELLER CHARACTERISTICS BUSINESS TRAVELLERS APPENDIX D RESPONSE BIAS TESTING APPENDIX E OPEN-ENDED COMMENTS FROM SURVEY PARTICIPANTS
8 Introduction In 2000, the Okanagan Cultural Corridor Project (OCCP) was initiated in the Thompson Okanagan tourism region. The project was designed to increase cultural tourism in the Okanagan Valley by packaging and marketing the Valley s cultural attractions. In the summer of 2002, onsite interviews with travellers to the Okanagan Corridor were conducted in an effort to support a marketing development plan for the Okanagan Cultural Corridor project. Interviews were conducted at various sites around the Okanagan Valley including tourists sites (beaches, downtowns, picnic areas etc), various Visitor Centres in the corridor as well as a selection of wineries. The purpose of the Okanagan Cultural Corridor Research project was: 1. To determine the incidence and characteristics of tourists that can be defined as cultural travelers using an activity based definition. 2. To provide overall demographic and trip characteristic profiles of travelers to the Okanagan as well as an examination of responses based on survey group. As a result of the 2000 research project, a report titled A Profile of Visitors to British Columbia s Okanagan Valley: A Focus on Cultural Travellers 1 was produced, providing not only a profile of cultural travellers to the region during the summer of 2000, but also a profile of visitors intercepted at the local area s participating wineries. In recent years, Tourism British Columbia and industry partners have realized the growth potential of a number of developing tourism sectors, including British Columbia s wine/culinary tourism product. In an effort to facilitate ongoing strategically positioned development of wine tourism products and markets, it was determined that updated consumer research was needed. In order to capitalize on the learnings from the wine traveller profile developed from the 2002 partnership study, a similar but expanded wine consumer research plan was created for implementation in the summer season of The primary objectives of this study were to support marketing initiatives and product development of the Okanagan Valley s wine tourism product, specifically: 1. To examine travel motivations and trip planning behaviours of wine travellers; 2. To profile travellers who visit the Okanagan Valley s wineries in terms of traveller and trip characteristics in order to support product development and marketing initiatives. 1 Full report is from Tourism BC available at: JAN_13_2004.pdf 7
9 Methods A multi-location, two-stage survey design was used to achieve the study objectives. Travellers were initially interviewed at one of seven wineries in the Okanagan Valley. On-site interviews collected information from travellers during their trip. Those interviewed were randomly asked to complete either an online survey or a follow-up, mailback questionnaire that collected information from travellers after their trip. The purpose of the follow-up survey was to gather additional information about trip characteristics, planning, experiences and activities, to compare mid-trip and post trip expenditure information, and to understand travellers perceptions of the Okanagan region, winery visitation, and British Columbia upon trip completion. Data Collection - Interview Two interviewers collected data between August 1 st and October 14 th, On-site interviews were conducted at one of seven Okanagan wineries throughout the duration of the study period. For the most part, the interviewers schedule consisted of a systematic sample of four continuous days of interviewing followed by two days off, alternating on a daily basis between the seven participating wineries in the Okanagan Valley (Appendix A). Potential respondents were randomly selected at each location, as they exited the winery and were asked if they were willing to participate in an eight-minute interview. All respondents were given a Super, Natural British Columbia refrigerator magnet for their time. Respondents were then asked if they had previously completed a Tourism BC administered survey on their current trip. If so, they were eliminated from the interview in an effort not to duplicate responses. Respondents then progressed through a series of further screening questions in which respondents who were residents of the Okanagan Valley region 2 were screened out of the survey in an effort to focus on travellers to the area. Interviews with business travellers, tour group participants and day trippers were ended after a few profiling questions. At all sites, only independent, non-resident, overnight leisure travellers were recruited for the followup survey. The interviewers recorded responses on handheld computers (Palm Pilots) using Techneos Data Entryware software. During the interview, questions were asked about (see intercept questionnaires in Appendix B): traveller demographics, primary trip purpose, primary destination, other communities visited, primary mode of transportation, trip duration, length of stay in the Okanagan Valley and in British Columbia, primary accommodation, 2 Defined as the area south of Enderby and north of Osoyoos, including all communities and all communities in the area of Lake Okanagan. 8
10 daily expenditures, primary trip motivations, travel experience at Okanagan Valley wineries, travel intentions regarding the Okanagan Valley, reasons for decision to visit Okanagan Valley wineries, detailed travel expenditures. With the exception of local residents, tour group participants, and business travellers, all respondents were asked to participate in the follow-up questionnaire and either or mailing addresses were collected from those who agreed to participate. A copy of British Columbia Magazine (sent only to those participating in the mailback survey) and a chance to win a digital camera were used as incentives to achieve a high participation rate in the mailback questionnaire. Between August 1 and October 14, 2008, a total of 3,191 people were approached at one of the seven participating Okanagan wineries. Of those, 2,471 agreed to complete the interview. However, 347 were excluded from participation as they were residents of the local area, 84 had completed the survey at a different location and were not invited to participate a second time, and 53 participants did not complete the entire survey. These individuals and partial survey responses were screened from the final data set. Overall, 20% of those who agreed to participate were screened as a result. (Table 1 provides complete details). Table 1. Travellers screened from participation. Winery location 3 Travellers Approached Agreed to Interview Local Resident 1 Screened Previous participant Incomplete Surveys Screened from Participation Total Percent 2 North Okanagan 1,633 1, % South Okanagan 1,558 1, % Grand Total 3,191 2, % 1. The Local Area is defined as the Okanagan Valley, which includes the area south of Enderby and north of Osoyoos and all communities in the area of Lake Okanagan. 2. The percentage represents the number of surveys eliminated as a result of screening questions as a percentage of the total number who agreed to participate. 3. North Okanagan wineries include: Mission Hill, Cedar Creek, Elephant Island and Soaring Eagle. South Okanagan wineries include: Tinhorn Creek, Burrowing Owl & Nk Mip. Among those intercepted, 136 business travellers and 84 tour group participants completed an abbreviated survey. The majority (1,757 participants) were independent leisure travellers who completed the full version of the survey. There were an additional four business travellers and six independent leisure travellers who indicated that they would be away from home for 365 days or more. These visitors were deemed to be temporary residents and therefore not travellers and removed from further analysis. Overall, 80% of the surveys from those who agreed to participate were useable. (Table 2 provides complete details). 9
11 Table 2. Travellers completing useable surveys. Winery location Travellers Approached Agreed to Interview Okanagan Valley Wine Consumer Research Study - Summer 2008 Organized Tour Group Survey Groups Business Travellers Independent Leisure Travellers Useable Surveys Total Percent 1 North Okanagan 1,633 1, % South Okanagan 1,558 1, , % Grand Total 3,191 2, ,757 1, % 1. The percentage represents the number of surveys eliminated as a result of screening questions as a percentage of the total number who agreed to participate. Data Collection and Mailback Participants were randomly asked if they were interested in participating in a follow-up study via either or mailback. Those consenting to participate via mailback were sent the survey with a business reply envelope and a British Columbia Magazine in October 2008 after the intercept field season closed. The first mailing was followed by a second mailing of a reminder postcard and a third mailing of just a questionnaire and a business reply envelope. Responses were accepted until January 22 nd, Those who consented to participate in the follow-up survey via were sent an invitation to participate in the survey in October 2008 and were sent subsequently three reminders. The survey initially closed on November 30 th, 2008; however, it was re-opened for one week in early January 2009 in an extra attempt to increase response rates. Two different versions of the follow-up questionnaire were produced; one for visitors agreeing to participate in the mailback survey and one for those agreeing to participate in the , online survey. While the follow-up survey was deployed using 2 mediums (paper and online) the content and questions were identical. These questionnaires collected a variety of information including (see mailback questionnaire in Appendix B): trip duration, length of stay in British Columbia, length of stay in the Okanagan Valley, primary destination, destination decision-making, travel route and overnight stay information, trip activities, trip planning, travel services purchases prior to and during trip, primary accommodation, trip expenditures, satisfaction with experience at Okanagan Valley wineries, satisfaction with trip to British Columbia, the likelihood of returning to the Okanagan Valley and British Columbia, and, travel party demographics. Overall, 816 respondents to the intercept survey were asked to participate in the mailback survey and 536 consented (66%). A total of 919 were asked to participate in the same follow-up survey via and 634 agreed to do so (69%). Among these travellers, 247 completed surveys via mailback (46%) 10

12 and 289 completed the same survey via (also 46%). This resulted in 536 useable follow-up surveys for analysis. Table 3. Mailback and survey response from independent leisure travellers intercepted Travellers Asked to Participate in Follow-up 1 Agreed to Complete Mailback Incomplete Addresses No Response Useable Mailback Surveys Mailback (65.7%) (46.1%) (69.0%) (45.6%) Grand Total 1,735 1,170 (67.4%) (45.8%) 1. This does not include business travellers (n=136) or those participating in an organized tour group (n=84). Also excluded are 347 local residents of the Okanagan region who were screened from the original intercept survey and the six independent leisure travellers who reported that they would be away from home for 365 days or more who were removed from the analysis. Data Analysis Descriptive statistics were used to analyze and summarize results of the report. Don t know/no response answers have been excluded from the analyses for all questions. The intercept survey included a shortened version for travellers who stated their primary purpose was work or business activities or who were participants of an organized tour. Business travellers and tour group participants were not invited to participate in the follow-up survey. For most sections, the report presents results for all leisure travellers and depicts any possible differences by traveller origin and for low and high interest wine travellers. The exceptions to this are results for tour group participants and business travellers. These results have been presented in separate sections for these subgroups. In an effort to provide practical and actionable information to meet stakeholders operational or marketing needs, this report will focus on practical differences rather than statistically significant differences. The rationale for this approach is that very small and unimportant differences can be found to be statistically significant under certain circumstances. As such, this report typically only takes note of differences of 10 percentage points (ppts) or more. In the report s tables depicting traveller subgroup and traveller origin, differences that are 10 ppts or more higher than all independent leisure travellers are highlighted in blue, while differences that are 10 ppts or more lower are shown in red (Figure 1). 11
13 Demonstration Table: Traveller origin. Basis for comparison. Origin All Visitors Independent Travellers British Columbia 42% 54% US 20% 14% Overseas 29% 18% US: 20% of all visitors were from the US. This is a difference of 6 ppts from independent travellers, but is not of practical significance. Overseas: 29% of all visitors were from Overseas. This is 11 ppts higher than the proportion of Independent travellers from Overseas. British Columbia: 42% of all visitors were from British Columbia. This is 12 ppts lower than the proportion of Independent Travellers from British Columbia. Figure 1. Interpreting the tables. Data is fictitious and for illustrative purposes only. The study design produced 2 sets of data (the interview responses and the follow-up questionnaire responses). At all locations, the respondents and the responses could vary between the interview and mailback questionnaires because travellers could drop out of the study by not agreeing to complete the mailback questionnaire or by not completing the mailback questionnaire even if they had agreed to complete it (which could cause non-response bias). Both instances could cause the mailback questionnaire results to be unrepresentative of travellers interviewed on-site. Similarly, the responses to similar questions in the interview and mailback questionnaires could vary due to real differences in traveller behaviour (for example, a traveller may have intended to visit ten different wineries when they were interviewed during their trip but reported that they actually only visited 4 wineries on the mailback questionnaire completed after their trip). Response biases were assessed to ensure validity of the final results by way of examining practical differences among the aforementioned data sets. Results of these assessments (Appendix C) and several other factors indicated that the interview information is the best source of data when the same or similar questions were asked on both the interview and mailback questionnaire. Thus, mailback questionnaire responses were used only when the question was not asked in the interview and when sample sizes permitted. All results presented in the remainder of this report are from the interview unless otherwise noted. 12
14 Results Traveller Characteristics All participants Overall, over half (59%) of all winery visitors intercepted were from British Columbia (including those from the local area). The majority of British Columbia residents hailed from the Metro Vancouver / Fraser Valley area (54%) while an additional 25% of residents were from the Okanagan Valley. Exploring specific origin of British Columbia residents by travel group revealed that those from Metro Vancouver /Fraser Valley represented nearly three quarters (74%) of independent travellers, 63% of tour group participants, and 66% of business travellers. Residents of Alberta represented 21% of those intercepted at the wineries, with over half (54%) of all Albertans hailing from Calgary and area. Those from Edmonton and area represented 26% of all Alberta residents. The proportion of Alberta residents from each of these areas was similar among independent leisure travellers. Two-fifths (43%) of all those Canadian provinces other than BC and Alberta were from Ontario, with an additional thirds (34%) from Saskatchewan and Manitoba. Again, these proportions were similar among all independent leisure travellers from other Canadian provinces. In total, residents of the United States made up 4% of those who were intercepted for the survey. The largest group of residents from the United States was from Washington (44%). Residents of Washington comprised 38% of all independent leisure travellers from the US; however, they represented 69% of all business travellers from the US. Residents of California represented the next largest group with 16% of all survey participants from the US; however, 27% of US visitors were from states other than Washington or California. Those from other International origins comprised an additional 4% of the total sample with residents of European nations representing 71% of all other International winery visitors intercepted, and those from Asia-Pacific countries representing 20%. Over half of all European independent leisure travellers were from the United Kingdom, with an additional fifth (19%) from Germany and 8% each from France and the Netherlands. Among those from countries in the Asia Pacific region, nearly half (47%) were from Australia with virtually all independent leisure travellers from other International countries from Africa and the Middle East (Table 4). 13
15 Table 4: Origin of all survey participants by traveller group Independent All Visitors Travellers Origin Okanagan Valley Wine Consumer Research Study - Summer 2008 Tour Group Participants Business Travellers Number % Number % Number % Number % British Columbia (all) 1, % % % % Okanagan Valley % Metro Van/Fraser Valley % % % % Vancouver Island % % % % Other British Columbia % % 5 6.0% % Alberta (all) % % % 5 3.7% Calgary (and area) % % % 2 1.5% Edmonton (and area) % % 5 6.0% 2 1.5% Other Alberta % % 7 8.3% 1 0.7% Other (all) % % % % Saskatchewan & Manitoba % % 4 4.8% 3 2.2% Ontario % % 4 4.8% 8 5.9% Quebec % % 1 1.2% 8 5.9% Other Canadian Province % % 2 2.4% 0 0.0% US (all) % % 3 3.6% % Washington % % 2 2.4% % California % % 0 0.0% 2 1.5% Other % % 1 1.2% 3 2.2% Other International % % 4 4.8% 4 2.9% Europe % % 2 2.4% 1 0.7% Asia-Pacific % % 1 1.2% 2 1.5% Other International % 5 0.3% 1 1.2% 0 0.0% Unknown International % 2 0.1% 0 0.0% 1 0.7% Total 2, % 1, % % % 1. Residents of the Okanagan Valley were identified as part of the interview and then screened from further participation. 2. Small sample size (i.e. 20 or fewer respondents) requires that results should be interpreted with caution. Among independent leisure travellers interviewed at the wineries, over half were age 45 or over with the largest group (27%) in between the ages of 45 to 54. Although the largest group of visitors from British Columbia were also in the 45 to 54 year age range (27%), BC residents were more likely to be in the 35 to 44 year age range (21%) compared to visitors from other origins. Those from Alberta were very similar in age to visitors from all other origins, whereas those from other Canadian provinces and those from outside of were more likely to be over 55 and less likely under 44. Two-fifths (41%) of visitors from other Canadian provinces were over the age 55, compared to 32% of visitors from other origins. Similarly, nearly a fifth (18%) of those from outside were over the age 65, while this age category comprised 8% of visitors overall (Table 5). Generally, it was seen that the further away the market of origin, the older the visitor. 14
16 Over half (54%) of all independent leisure travellers held at least one university degree. This percent was very similar among visitors from British Columbia and Alberta (51% and 54%, respectively). Among those who lived in other Canadian provinces or who were visitors from other countries this number increases to 58% and 62%, respectively. The largest percent (27%) of all independent leisure travellers reported household incomes between $100,000 and $149,000. Half of travellers (52%) reported household incomes over $100,000. The percent reporting incomes over $150,000 was lower among residents of British Columbia and higher among residents of Alberta and outside of. The gender split among visitors was relatively even with slightly more women (55%) than men (45%). There were no practical differences observed among visitors from British Columbia and those from other Canadian provinces. There were, however, more male travellers among those visiting from Alberta and outside of (50% and 57%, respectively). The follow-up survey asked participants to indicate whether there were any children under 18 living in the household. The majority of respondents (81%) indicated that there were no children living in the household. Table 5: Demographic profile of independent leisure travellers by origin Leisure Other Outside BC Alberta Travellers n % n % n % n % n % Age Under 24 Years % % % % 6 3.6% Years % % % % % Years % % % % % Years % % % % % Years % % % % % 65 Years or Older % % % % % Education Less Than High School % 5 0.6% 6 1.4% 2 0.9% 0 0.0% High School % % % % % Some Technical, College or University % % % % % College or Technical Diploma % % % % % University Degree % % % % % Masters/PHD Degree % % % % % Other % 8 0.9% 1 0.2% 0 0.0% 0 0.0% 15
17 Table 6: Demographic profile of independent leisure travellers by origin (con t) Leisure Outside BC Alberta Other Travellers n % n % n % n % n % Annual household income Less than $25, % % % 7 4.3% 7 5.9% $25,000 to $49, % % % 8 4.9% % $50,000 to $64, % % % % % $65,000 to $99, % % % % % $100,000 to $149, % % % % % $150,000 plus % % % % % Gender Male % % % % % Female % % % % % Household composition 2 Children % % % % % No children % % % % % 1. Small sample size (i.e. under 20 respondents) requires that results should be interpreted with caution. 2. This question was asked on the follow-up survey only. Traveller Characteristics - Exploring wine travellers by experience and interest Travellers from all groups were asked to indicate whether or not this was the first time they had gone wine touring. Overall, the majority (78%) indicated they had been wine touring in the past but almost a quarter (22%) indicated this was their first time. There were no practical differences observed between all visitors interviewed and both independent leisure travellers and business travellers; however, differences were seen between all visitors and tour group participants. Those who were travelling as part of a tour group were more than twice as likely to be taking their first wine tour (46%) compared to all visitors. Table 7: Responses to the question, Is this the first time you have gone wine touring? by traveller group Independent Tour Group Business All Visitors Travellers Participants Travellers Number % Number % Number % Number % First time touring % % % % Repeat wine touring 1, % 1, % % % Total 1, % 1, % % % Independent leisure travellers were asked about the level of importance that wine touring played in motivating their trip. Those who indicated that wine touring was either the primary or an important reason for the trip were classified as high interest wine travellers, while those for whom wine touring played either some role or was not important at all in planning were classified low interest wine travellers. Overall, just over half (55%) of all independent leisure travellers were found to be high interest wine travellers, while the remainder (45%) were found to be low interest travellers for whom wine touring did not play a prominent role in trip planning. 16
18 Comparing the level of wine interest of independent leisure travellers by origin showed only one practical difference; travellers from outside were less likely to show high interest an indication that wine touring was not an influencing factor on trip planning for this group. Among all other origin groups, however, the importance of wine touring as a factor influencing trip planning was distributed similarly to the overall proportions seen among independent leisure travellers. 100% Origin of Independent Leisure Travellers Importance of wine touring in trip planning 80% 60% 40% 20% 0% 49% 54% 27% 24% 13% 13% 11% 9% Low interest (n=789) High interest (n=962) Figure 2. Percentage of independent leisure travellers by origin showing importance of wine touring for trip planning (low and high interest) Exploring the demographic profile of high and low interest wine travellers revealed no practical differences. High interest wine travellers were less likely to be included in both the highest age category (over 65 years) and the lowest age category (under 24 years). They were, however, more likely to be between 55 and 64 years of age with over one quarter (26%) in this age group while a fifth (20%) of low interest wine travellers were in this same age category. Although a university degree was the most common level of educational attainment for both groups, high interest wine travellers were more likely to have a graduate level of education (18% compared to 14% of low interest wine travellers). Those with a lower level of interest in wine travelling were more likely to report incomplete or completed high school (12% for these two categories combined compared to 9% among high interest wine travellers). Low interest wine travellers were also more likely to report a college or technical level diploma (23% compared to 19% of high interest wine travellers). There were only small differences in terms of annual household income with those with low interest more likely to report incomes under $25,000. Even so, this group only comprised 5% of low interest and 2% of high interest wine travellers. No differences were observed in terms of the gender distribution of these two groups. 17
19 Examining previous experience with wine touring in terms of the importance that wine touring played for trip planning, it is perhaps not surprising to find that those with a high interest in wine travel were less likely to report that this was their first time on a wine tour (18% compared to 24%). Table 8: Demographic profile of leisure travellers by importance of wine touring for trip planning Leisure Travellers Low Interest High Interest Age n=1,711 n=766 n=945 Under 24 Years 4% 5.1% 2.5% Years 19% 17.2% 20.1% Years 19% 19.8% 17.5% Years 27% 27.5% 26.7% Years 24% 20.4% 26.1% 65 Years or Older 8% 9.9% 7.1% Education n=1,699 n=760 n=939 Less Than High School 0.8% 1.3% 0.3% High School 9.7% 11.1% 8.5% Some Technical, College or University 14.3% 14.5% 14.2% College or Technical Diploma 20.7% 23.0% 18.8% University Degree 38.0% 35.9% 39.7% Masters/PHD Degree 16.0% 13.8% 17.8% Other 0.5% 0.4% 0.6% Annual household income n=1,328 n=592 n=736 Less than $25, % 5.4% 2.2% $25,000 to $49, % 6.9% 6.8% $50,000 to $64, % 13.9% 11.7% $65,000 to $99, % 22.0% 26.9% $100,000 to $149, % 26.2% 28.1% $150,000 plus 24.9% 25.7% 24.3% Gender n=1,742 n=784 n=958 Male 44.9% 46.3% 43.7% Female 55.1% 53.7% 56.3% 18
20 Table 9: Demographic profile of leisure travellers (con t) Okanagan Valley Wine Consumer Research Study - Summer 2008 Leisure Travellers Low Interest High Interest Household composition n=523 n=209 n=314 Children 19.5% 23.9% 16.6% No children 80.5% 76.1% 83.4% Experience wine touring n=1,741 n=784 n=957 First time touring 20.6% 24.2% 17.7% Repeat wine touring 79.4% 75.8% 82.3% For the follow-up survey, travellers were asked to indicate how many overnight leisure trips they had taken in the past two years that included a visit to a winery (to any destination). On average participants reported taking just under two winery trips (1.9 trips). The average number of winery trips was highest for visitors from outside of (2.4 trips) followed by visitors from British Columbia (2.3 trips). Those from other Canadian provinces reported taking the least frequent wine trips with an average of 1.0 trip. Nearly a third (31%) of all visitors reported that they did not make any other trips in the last two years that included a visit to a winery. This number was lower among British Columbians (21%) and considerably higher among those from Canadian provinces other than BC and Alberta (48%) and those from outside (41%). Table 10: Number of trips taken in past two years that included a visit to a winery by origin Leisure Travellers (n=514) BC (n=278) Alberta (n=133) Other (n=71) Outside (n=32) None 30.5% 21.2% 38.3% 47.9% 40.6% One 16.7% 15.5% 18.0% 25.4% 3.1% Two 25.1% 30.9% 20.3% 11.3% 25.0% Three or more 27.6% 32.4% 23.3% 15.5% 31.3% Average number of trips
21 Interestingly, looking at the average number of leisure trips taken in the past two years that included a visit to a winery by high and low interest wine travellers 3 revealed virtually no difference. Both high and low interest travellers reported taking an average of 1.9 trips. However, exploring the distribution of the total number of trips reveals the pattern that one would expect. For over a third (36%) of low interest wine travellers the trip on which they were originally interviewed represented the only trip they had taken that included a visit to a winery in the past two years. This was the case for considerably less (21%) of those who indicated that wine touring was important to trip planning. 100% Number of trips taken that included visiting wineries Importance of wine touring in trip planning 80% 60% 40% 20% 36% 21% 18% 16% 28% 29% 21% 25% 0% Low interest (n=205) High interest (n=309) Figure 3. Total number of overnight, leisure trips taken (to BC and other destinations) that included visiting wineries in the past two years showing importance of wine touring for trip planning (low and high interest) Trip Characteristics Among independent leisure travellers who were interviewed at one of the wineries, the majority (72%) indicated the primary purpose of the trip was for leisure. Virtually all of the remaining participants (27%) were travelling to visit friends or family. There were practical differences observed in that travellers from other Canadian provinces and outside of were more likely to be visiting friends and family (47% and 44%, respectively) and less likely to be travelling for leisure (53% and 55%, respectively). 3 High interest wine travellers are those visitors who indicated that wine touring was the Primary or Important Reason for their trip. Low interest wine travellers are those indicated that wine touring Played Some Role or was Not at all Important in planning their trip. 20
22 Virtually all travellers (94%) made use of a personal or rented vehicle (a car, truck or motorcycle) as their primary mode of transportation. This was true for all origin groups. Those from other Canadian provinces and outside of were slightly more likely to indicate that they were travelling by RV (8% and 5%, respectively). Half (50%) of all overnight travellers indicated that they were staying primarily in resort, hotel, motel and/or B&B properties. There were no practical differences observed by origin among those using these types of accommodation. Visitors from outside of were slightly less likely to indicate that they were staying in a campground or RV park (12%), whereas those from other Canadian provinces and those from outside of were more likely to indicate that they were staying with friends or relatives (32% and 33%, respectively). This is to be expected given that travellers from these origins were more likely to be travelling to visit friends and family. Travellers from Alberta were more likely to report that they were staying in a second home, timeshare, or rented home (12%). Table 11: Primary trip purpose, mode of transportation, and accommodations of independent leisure travellers by origin All Visitors BC Alberta Other Outside Primary Trip Purpose n=1,757 n=903 n=448 n=234 n=172 Leisure 72.2% 79.3% 74.8% 53.0% 54.7% Visiting Friends & Family 27.0% 20.3% 23.9% 46.6% 43.6% Other % 0.4% 1.3% 0.4% 1.7% Mode of Transportation n=1,754 n=902 n=448 n=233 n=171 Car/Truck/MC 94.4% 95.3% 96.0% 90.1% 91.2% RV 3.9% 2.9% 3.6% 7.7% 5.3% Bus 1 0.3% 0.1% 0.0% 0.4% 2.3% Bicycle 1 0.9% 1.6% 0.2% 0.4% 0.0% Other % 0.1% 0.2% 1.3% 1.2% Primary Accommodations 4 n=1,743 n=891 n=448 n=233 n=171 Resort/Hotel/Motel/B&B 49.8% 53.1% 45.5% 46.4% 48.5% Campground/RV 15.5% 16.0% 16.5% 14.2% 12.3% Friends or Relatives 24.9% 21.7% 24.3% 32.2% 33.3% Second/rental homes/ Timeshares 8.2% 7.6% 11.8% 6.4% 4.1% Other 5 1.5% 1.6% 1.8% 0.9% 1.8% 1. Small sample size (i.e. under 20 respondents) requires that results should be interpreted with caution. 2. Other trip purpose responses included sporting event (n=7), to investigate real estate or move (n=4), learning English (n=1), homestay (n=1), and festival (n=1). 3. Other modes of transportation responses included air (n=3), train (n=3), and walking (n=1). 4. Daytrip travellers who were not using accommodation were removed from this analysis (n=10). 5. Other primary accommodations responses included cabin (n=15), hostel (n=6), car (n=2), boat (n=1), housesitting (n=1), self-contained unit (n=1), and everything (n=1). There were practical differences observed between those for whom wine was of primary or high importance for trip planning compared to those for whom wine touring was not as important. Those 21
23 with a high interest in wine touring were much more likely to indicate that the primary purpose of their trip was leisure (81% compared to 62% of those reporting a low interest in wine touring). Conversely, over a third (36%) of low interest wine travellers indicated their primary purpose for travelling was to visit friends and family, while this was the case for less than one fifth (19%) of high interest wine travellers. Virtually all independent leisure travellers intercepted for this study used a personal vehicle (car, truck or motorcycle) as their primary mode of transportation and this did not differ between high and low interest wine travellers. Since considerably more low interest wine travellers indicated that they were travelling for the primary purpose of visiting with friends and family it is not surprising to find that there were considerably more travellers within this group who found accommodation with friends or relatives (33% of low interest compared to 18% of high interest wine travellers). Those who indicated that wine touring was of high importance while planning their trip were much more likely to indicate that they would be staying in resorts, hotels, motels, and bed and breakfasts. In total, over half (58%) of high interest wine travellers chose these types of accommodation, compared to 40% of low interest wine travellers. Table 12: Primary trip purpose, mode of transportation, and accommodations of independent leisure travellers by importance of wine touring for trip planning Leisure Travellers Low Interest High Interest Primary Trip Purpose n=1,757 n=788 n=962 Leisure 72.2% 62.3% 80.5% Visiting Friends & Family 27.0% 36.4% 19.1% Other 1 0.8% 1.3% 0.4% Mode of Transportation n=1,754 n=787 n=962 Car/Truck/MC 94.4% 94.7% 94.2% RV 3.9% 4.2% 3.7% Bus 1 0.3% 0.3% 0.4% Bicycle 1 0.9% 0.5% 1.2% Other 1 0.4% 0.4% 0.4% Primary Accommodations n=1,743 n=788 n=951 Resort/Hotel/Motel/B&B 49.8% 39.8% 58.1% Campground/RV 15.5% 16.2% 15.0% Friends or Relatives 24.9% 33.5% 17.7% Second or rental homes/timeshares 8.2% 9.3% 7.3% Other 1.5% 1.1% 1.9% 1. Small sample size (i.e. under 20 respondents) requires that results should be interpreted with caution. Overall, just over one in ten (11%) of all independent leisure travellers were travelling through the Okanagan region on a touring trip with no particular destination. Those from British Columbia 22
24 reported touring at a slightly lower frequency (9%), especially compared to those from other Canadian provinces (16%). Of those who were not touring, the vast majority (86%) selected a destination in British Columbia, in particular in the Okanagan Valley (75%). Travellers from British Columbia were more likely to indicate a destination in the Okanagan Valley (84%), whereas those from Canadian provinces other than BC and Alberta and from outside were considerably less likely to indicate that their primary destination was in the Okanagan (55% and 50%, respectively). Visitors from these origins were more likely to indicate that they were destined for the Vancouver, Coast and Mountains region (20% & 21% of Other and Outside, respectively). Table 13: Primary destination of independent leisure travellers by origin All Visitors (n=1,751) BC (n=901) Alberta (n=446) Other (n=233) Outside (n=171) None - touring 11.4% 8.9% 13.0% 15.5% 15.2% (all) 87.9% 90.6% 86.5% 83.3% 84.2% British Columbia (all) 86.0% 88.8% 86.5% 80.3% 77.8% Okanagan Valley 74.6% 83.6% 76.5% 54.9% 49.7% Other Thompson Okanagan 1.6% 1.7% 1.6% 2.1% 0.6% Vancouver, Coast & Mtns. 5.9% 0.3% 3.8% 20.2% 21.1% Vancouver Island 1.3% 0.0% 3.1% 1.7% 2.3% Kootenay Rockies 2.1% 2.4% 1.6% 0.9% 3.5% Northern BC 1 0.2% 0.2% 0.0% 0.4% 0.6% Cariboo-Chilcotin Coast 1 0.3% 0.6% 0.0% 0.0% 0.0% Alberta 1.7% 1.4% 0.0% 2.6% 5.8% Other Destinations 1,2 0.9% 0.8% 0.4% 1.7% 1.2% 1. Small sample size (i.e. under 20 respondents) requires that results should be interpreted with caution. 2. Other destinations include: Other, US and International locations Those with a high interest in wine touring were slightly more likely to indicate that they were touring with no specific destination (13% compared to 10% of low interest wine travellers). Among those who indicated a primary destination for their trip, however, there were only small differences observed between low and high interest wine travellers and none of these differences were determined to be of practical significance. 23
25 Table 14: Primary destination of independent leisure travellers by importance of wine touring for trip planning Leisure Travellers (n=1,746) Low Interest (n=787) High Interest (n=959) None - touring 11.4% 9.5% 13.0% (all) 87.9% 89.7% 86.4% British Columbia (all) 86.0% 87.8% 84.6% Okanagan Valley 74.6% 75.6% 74.0% Other Thompson Okanagan 1.6% 1.8% 1.5% Vancouver, Coast & Mtns 5.9% 5.7% 5.8% Vancouver Island 1.3% 1.7% 0.9% Kootenay Rockies 2.1% 2.3% 2.0% Northern BC 1 0.2% 0.5% 0.0% Cariboo-Chilcotin Coast 1 0.3% 0.3% 0.3% Alberta 1.7% 1.7% 1.6% Other Destinations 1 0.9% 1.1% 0.8% 1. Small sample size (i.e. under 20 respondents) requires that results should be interpreted with caution. 2. Other destinations include: Other, US and International locations. The vast majority of independent travellers interviewed at the wineries indicated that they would be spending some time in the region with less than one percent indicating that they were only passing through. This was true for travellers from all origins. On average, travellers indicated they would be spending 6 days in the region, 8 days overall in British Columbia and just under 10 days in total away from home. Medians have also been reported to depict the midpoint of total number of days reported by independent leisure travellers. The median number of days in the Okanagan Valley for all independent leisure travellers was 4, with 6 days spent in British Columbia, and 7 days away from home in total. There were some practical differences observed by origin. Generally, those who had travelled further distances were more likely to report both an increase in the number of days they would be spending in British Columbia and the number of days they would be away from their homes. This increased to an average of 13 days in the province and 19 days away from home for visitors from outside of (median of 11 and 14 days, respectively). Table 15: Trip duration for independent leisure travellers by origin Leisure Travellers (n=1,755) BC (n=903) Alberta (n=448) Other (n=233) Outside (n=171) Avg. Median Avg. Median Avg. Median Avg. Median Avg. Median Days in Okanagan Valley Days in British Columbia Total days away from home No time in region - Passing through 0.6% 0.7% 0.7% 0.4% 0.0% 24
26 Independent leisure travellers who indicated that visiting wineries was an important element in planning their trip also reported shorter trips compared to those for whom wine touring was not as important. Those with a high interest spent an average of 9 days away from home (median 6 days), whereas those with a low interest in wine touring reported an average of 11 days away from home (median 7 days). This pattern remained consistent for the total days spent in British Columbia and the total days spent in the Okanagan Valley. Trip duration Importance of wine touring in trip planning Figure 4. Days in Okanagan Valley Days in British Columbia Total days away from home Low Interest - Average Low Interest - Median High Interest - Average High Interest - Median Average and median days spent in region, days in British Columbia and total days away from home showing importance of wine touring for trip planning (low and high interest) During the survey at the wineries, travellers were asked to indicate the total number of persons travelling with them on this trip, including both the number of children under 18 and the number of adults over 18. On average, visitors indicated that they were travelling with just under 2 other people (2.8 persons including the survey participant). Less than one fifth of travellers (14%) indicated that they were travelling with children. Among those travelling without children the average party size was 2.6, whereas among those travelling with children the average party size was 4.6. There were very few practical differences in terms of average travel party size by origin, however, the proportion of travellers who indicated they were travelling with children was higher for those from BC and Alberta compared to those from other Canadian provinces and those who resided outside of. Travellers from Alberta were most likely to be travelling with children (15%), whereas those from outside of were least likely (9%). The median number of travellers in a travel party across all groups was
27 Table 16: Travel party size for independent travellers by origin Okanagan Valley Wine Consumer Research Study - Summer 2008 Leisure Travellers (n=1,754) BC (n=902) Alberta (n=448) Other (n=233) Outside (n=171) Average party size (all) Average party size - without children Average party size - with children Proportion with children 13.8% 14.8% 15.4% 9.8% 9.3% There were no practical differences observed in terms of average party size between low and high interest wine travellers with one notable exception. Those with a low interest in wine touring were considerably more likely to be travelling with children. Over one fifth (21%) of low interest wine travellers indicated they were travelling with at least one child under 18, whereas among high interest wine travellers 9% indicated the same. Table 17: Travel party size for independent travellers by importance of wine touring in trip planning Leisure Travellers (n=1,754) High Interest (n=962) Low Interest (n=788) Average party size (all) Average party size - without children Average party size - with children Proportion with children 13.8% 9.0% 21.0% On the follow-up survey, participants were asked to indicate who they were travelling with. Overall, 82% indicated that their travel party included their spouse or partner and this varied only slightly by origin. Nearly one fifth (19%) indicated that they were traveling with either their son or daughter. There were, however, some practical differences observed by origin. Travellers from Alberta and outside were less likely to be travelling with their children (14% and 13%, respectively), whereas those from Canadian provinces other than BC and Alberta were more likely (32%). Followup survey participants were slightly more likely to indicate that they were travelling with other family members 4 (21%), although this was lower among residents of British Columbia (17%) and other Canadian provinces (16%). Nearly a third of travellers from Alberta (30%) and one quarter of those from outside (25%) indicated that another family member was a part of their travel party. A total of 29% indicated they were travelling with friends and this was highest among those from other Canadian provinces (32%). 4 Other family members included all cases where the participant indicated they were travelling with at least one person related to them in the following ways: mother, father, cousin, son-in-law-daughter-in-law, mother-in-law, father-in-law, grandson, granddaughter, brother, sister, sister-in-law, brother-in-law, niece, nephew, uncle, aunt, or relative not specified. 26
28 Table 18: Relationship of travelling companions by origin Okanagan Valley Wine Consumer Research Study - Summer 2008 All Visitors (n=239) BC (n=136) Alberta (n=64) Other (n=31) Outside (n=8) Spouse or partner 81.6% 80.9% 81.3% 80.6% 100.0% Children 19.2% 19.1% 14.1% 32.3% 12.5% Other family 20.5% 16.9% 29.7% 16.1% 25.0% Friends/Tenants 28.5% 30.9% 25.0% 32.3% 0.0% Exploring the relationships among travel party members for high and low interest wine travellers revealed that those for whom wine touring was an important component of planning for this trip were slightly less likely to report travelling with their spouse than those for whom wine touring was of lesser importance. More considerable differences were seen in among those travelling with children (24% of low interest and 16% of high interest wine travellers, Figure 8) and those travelling with friends (24% of low interest and 32% of high interest). However, none of these differences were found to be practically significant. 100% 80% Relationship of travelling companions Importance of wine touring in trip planning 84% 80% 60% 40% 20% 24% 20% 21% 16% 24% 32% 0% Spouse or partner Children Other family Friends/Tenants Low Interest (n=101) High Interest (n=138) Figure 5. Relationship of travelling companions to survey participant showing importance of wine touring for trip planning (low and high interest) Trip Planning A total of 64% of those participating in the follow-up survey indicated they did not consider a destination other than the one selected for this trip. Among those who did consider another destination, over half (57%) indicated that this alternate destination was in the Okanagan Valley. The next most popular other destinations cited were in the United States (20%) and the Vancouver, Coast and Mountains region (16%). A further 12% of survey participants who were considering other destinations indicated a location in the Thompson Okanagan that was outside of the Okanagan Valley area. There were, however, considerable practical differences observed by origin. Travellers from British Columbia were more likely to indicate they were considering another destination either in the Okanagan Valley (64%) or in another part of the Thompson Okanagan region (14%). As the origin of 27
29 travellers moved further away from the province, the likelihood they would consider another destination in the Okanagan decreased to a low of 18% among those from outside of. Travellers from Alberta were more likely to select a destination in the Vancouver, Coast and Mountains region (21%), whereas those from other Canadian provinces were more likely to state a destination in Alberta or the US (24%, each). Over half (55%) of all those from outside indicated a destination on Vancouver Island and an additional 46% indicated a location in Alberta. Table 19: Other destinations considered by origin Leisure Travellers (n=189) BC (n=110) Alberta (n=39) 1 Other (n=29) 1 Outside (n=11) 1 Okanagan Valley 56.6% 63.6% 56.4% 44.8% 18.2% Other Thompson Okanagan 11.6% 13.6% 12.8% 3.4% 9.1% Kootenay Rockies 11.1% 10.9% 10.3% 13.8% 9.1% Vancouver, Coast and Mountains 16.4% 12.7% 20.5% 20.7% 27.3% Vancouver Island 11.1% 6.4% 5.1% 20.7% 54.5% Cariboo Chilcotin Coast 1 1.6% 2.7% 0.0% 0.0% 0.0% Northern BC 1 2.1% 2.7% 0.0% 0.0% 9.1% Alberta 11.1% 3.6% 12.8% 24.1% 45.5% Other 1 3.2% 0.0% 5.1% 6.9% 18.2% US 19.6% 18.2% 20.5% 24.1% 18.2% Other International 1 1.1% 0.0% 0.0% 0.0% 18.2% Other - not specified 1 4.2% 5.5% 0.0% 3.4% 9.1% 1. Small sample size requires that results should be interpreted with caution. There were very few differences observed in terms of alternate destinations or routes considered by low interest and high interest wine travellers. In general, those who indicated that wine touring was of high importance in trip planning were slightly more likely to choose a destination in the Okanagan Valley and less likely to indicate that they also considered travelling to another destination in British Columbia. However, these differences were not determined to be of practical significance. 28
30 Other destination considered Importance of wine touring in trip planning 100% 80% 60% 40% 20% 0% 53% 59% 46% 41% 11% 11% 3% 3% 24% 17% 1% 8% 1% 2% Low Interest (n=74) High Interest (n=115) Figure 6. Other destination or route considered when planning trip showing importance of wine touring for trip planning (low and high interest) Nearly a third (31%) of participants in the follow-up survey reported that they started planning their trip nine to twelve weeks in advance, with an additional 30% planning between three and eight weeks in advance and 17% planning thirteen or more weeks in advance. Although the largest group of travellers from British Columbia also started planning between nine and twelve weeks. BC residents typically had shorter planning horizons. Overall, 27% of this group planned their trips two weeks or less before the day of departure. Those from other origins tended to have longer planning horizons. Table 20: Trip planning horizons by origin Leisure Travellers (n=446) BC (n=252) Alberta (n=115) Other (n=54) Outside (n=25) Day of visit 1 0.9% 1.6% 0.0% 0.0% 0.0% 1-6 days 6.7% 7.5% 5.2% 1.9% 16.0% 1-2 weeks 14.3% 18.3% 7.8% 11.1% 12.0% 3-8 weeks 30.0% 26.2% 38.3% 37.0% 16.0% 9-12 weeks 31.4% 31.7% 31.3% 27.8% 36.0% 13 weeks+ 16.6% 14.7% 17.4% 22.2% 20.0% 1. Small sample size (i.e. under 20 respondents) requires that results should be interpreted with caution. Generally, those with a high interest in wine touring tended to have longer trip planning horizons than those with a low interest. Just over one quarter (27%) of low interest wine travellers had travel planning horizons of two weeks or less, while the same was true for less than a fifth (17%) of high interest wine travellers. 29
31 Trip planning horizons Importance of wine touring in trip planning 50% 40% 30% 32% 33% 27% 29% 20% 10% 0% 1% 1% 10% 4% 17% 13% 16% 17% Low Interest (n=184) High Interest (n=262) Figure 7. Trip planning horizons showing importance of wine touring for trip planning (low and high interest) When asked what was their first consideration when planning their trip (aside from cost and budgetary considerations), nearly half of all participants (48%) indicated that they selected a destination first and then decided to include wineries as part of their trip. The percentage who stated that this was their rationale for trip planning was highest among those from other Canadian provinces (56%). Just over one fifth of participants (23%) stated that they started by deciding on a trip that included wineries and subsequently selected the Okanagan as their destination. Among British Columbia residents, however, this number increased to almost a third (31%). A total of 14% of participants indicated that someone else planned the trip and, hence, they had a lesser role in selecting the destination. This was highest among participants from Alberta where 22% indicated that someone else had planned the trip. Table 21: Primary consideration (not including cost) of trip planning by origin Leisure Travellers (n=526) BC (n=288) Alberta (n=133) Other (n=71) Outside (n=34) Selected destination first 47.5% 47.2% 44.4% 56.3% 44.1% Decided to visit wineries first 22.8% 30.6% 14.3% 8.5% 20.6% Someone else planned the trip 14.4% 10.4% 21.8% 18.3% 11.8% Considered something else first 15.2% 11.7% 19.6% 16.8% 23.4% 1. Small sample size (i.e. under 20 respondents) requires that results should be interpreted with caution. 30
32 Although both high and low interest wine travellers indicated most often that they thought about a destination for their trip first and then decided to visit wineries, those with a high interest in wine touring were much more likely to state that they started planning by deciding to visit wineries and then selected a primary destination for their trip. Over half of all low interest wine travellers (55%) indicated that the destination was the first element of the trip that they selected, compared to 42% of high interest wine travellers. Over a third (34%) of high interest wine travellers, however, decided to plan a trip to visit wineries and subsequently chose a destination in the Okanagan. This compared to only 6% of low interest wine travellers who indicated the same trip planning priorities. Low interest wine travellers were also more likely to indicate that someone else planned their trip (19% compared to 11% of high interest wine travellers). Selected destination first Decided to visit wineries first Someone else planned the trip Considered something else first Primary consideration of trip planning Importance of wine touring in trip planning 6% 8% 5% 11% 19% 34% 42% 55% 0% 10% 20% 30% 40% 50% 60% Low Interest (n=213) High Interest (n=313) Figure 8. Primary consideration in trip planning (not including cost) showing importance of wine touring for trip planning (low and high interest). Only those responses which received 5% or more of the total have been shown in the figure. Over a third (37%) of all independent leisure travellers indicated that the primary motivation for taking this trip was to spend quality time with family and/or friends. The percent of travellers who indicated this was their primary motivation was higher among those from other Canadian provinces (49%) and outside (47%). A desire to rest, relax, and recuperate was cited by 29% of leisure travellers. Conversely, this reason was offered less often among those from other Canadian provinces (14%) and those from outside (12%). Less than one fifth (17%) of travellers indicated that the primary motivation for this trip was related to the wine and winery experience. 5 This was slightly higher among British Columbia residents where 20% of travellers from this origin stated that wine and the winery experience was a primary motivating factor. 5 Representing the sum of those who stated one of the following: Because I have a passion for wine, To experience the wine I buy from stores/restaurants at its own winery, to learn more about the wine making process, and general write-in comments about wine and wine touring. 31
33 Table 22: Primary motivation for travel by origin Okanagan Valley Wine Consumer Research Study - Summer 2008 Leisure Travellers (n=530) BC (n=289) Alberta (n=136) Other (n=71) Outside (n=34) To spend quality time with family/friends 36.6% 31.5% 38.2% 49.3% 47.1% To rest, relax and recuperate 29.1% 30.8% 37.5% 14.1% 11.8% Because I have a passion for wine 9.6% 12.1% 8.1% 1.4% 11.8% To experience the wine I buy from stores/restaurants at its own winery 5.5% 7.3% 2.9% 5.6% 0.0% To do something I always wanted to do 4.5% 5.2% 1.5% 8.5% 2.9% To be closer/experience the natural environment 4.5% 4.2% 2.2% 8.5% 8.8% To experience adventure & excitement 1 2.3% 1.7% 2.9% 1.4% 5.9% To learn more about wine making process 1 1.3% 0.7% 1.5% 4.2% 0.0% To experience different culture/ ways of life 1 0.9% 0.7% 0.0% 0.0% 8.8% To experience intimacy and romance 1 0.6% 1.0% 0.0% 0.0% 0.0% To visit a popular, trendy place 1 0.4% 0.0% 0.7% 1.4% 0.0% To enjoy the group experience 1 0.4% 0.7% 0.0% 0.0% 0.0% To go somewhere/see sights I've never seen before 1 0.4% 0.0% 0.0% 2.8% 0.0% Other 1 4.0% 4.1% 4.4% 2.8% 2.0% 1. Small sample size (i.e. under 20 respondents) requires that results should be interpreted with caution. There were considerable differences in primary motivation expressed between low and high interest wine travellers. Nearly half (48%) of low interest wine travellers indicated that the primary motivation for this trip was to spend quality time with family and friends, compared to less than a third (29%) of high interest wine travellers. This is consistent with previous findings which show that low interest wine travellers were more likely to travel for the purposes of visiting friends and family and more likely to find primary accommodation in the homes of friends and relatives. Conversely, and perhaps not surprisingly, 14% of high interest wine travellers indicated that their primary motivation was because they have a passion for wine, compared to only 3% of low interest wine travellers. Combined, all motivating factors that concerned wine and the winery experience were the primary motivating factor for 25% of all high interest wine travellers and only 5% of low interest wine travellers. 32
34 Primary motivation for trip Importance of wine touring in trip planning To spend quality time with family and/or friends To rest, relax and recuperate Because I have a passion for wine To experience the wine I buy from stores/restaurants To be closer to/experiene the natural environment To do something I always wanted to do 3% 2% 8% 1% 7% 4% 5% 14% 29% 31% 28% 48% 0% 10% 20% 30% 40% 50% 60% Low Interest (n=216) High Interest (n=314) Figure 9. Primary motivation for taking trip showing importance of wine touring for trip planning (low and high interest). Only those responses which received 5% or more of the total have been shown in the figure. The follow-up survey asked independent leisure travellers to identify which sources of information they had used before their trip to assist with planning. Individual participants mentioned using up to 17 different sources of information with an average of 4.8 sources cited per participant (median 5 sources). A total of 60% of survey participants mentioned that they relied upon information from friends and relatives, while 55% had prior experience visiting Okanagan Valley wineries from which to draw on. Tourism guides and books were also popular with nearly half (49%) citing these as a source of information, as were maps (48%). Combined, Internet sites were the most frequently cited source of information with two thirds (66%) of all leisure travellers relying on at least one of these sources. This included local and regional tourism websites (36%), winery websites (33%), and (18%). Nearly one quarter (24%) relied upon information gathered from advertisement sources, including magazines (21%), newspapers (8%), and TV (3%). There were very few practical differences observed by origin of the traveller. Those from Canadian provinces other than British Columbia and Alberta were less likely to be able to draw on past experience both at Okanagan Valley wineries in general and at the specific winery at which they were originally interviewed. Travellers from outside were also less likely to use other specific winery sources, such as brochures and websites. Interestingly, nearly a third (31%) of travellers from other Canadian provinces made use of Travellers from British Columbia and Alberta cited a median of five sources of information, whereas those from other Canadian provinces and outside of cited four. 33
35 Table 23: Information sources used before trip by origin Okanagan Valley Wine Consumer Research Study - Summer 2008 Leisure Travellers (n=516) BC (n=281) Alberta (n=133) Other (n=70) Outside (n=32) Advice from friends/relatives 60.1% 54.4% 66.2% 70.0% 62.5% Past experience visiting wineries in the Okanagan Valley 54.8% 64.8% 54.1% 30.0% 25.0% Tourism/travel/visitor guides or books 49.0% 47.3% 50.4% 55.7% 43.8% Maps 47.9% 47.7% 46.6% 48.6% 53.1% Have visited the winery before 44.2% 53.7% 41.4% 21.4% 21.9% A local or regional tourism website 35.9% 34.9% 37.6% 34.3% 40.6% A winery website 32.8% 37.0% 29.3% 28.6% 18.8% Visitor centres 27.5% 26.0% 30.1% 28.6% 28.1% Other Internet site 23.4% 23.1% 25.6% 18.6% 28.1% Winery business brochures 21.1% 23.5% 21.1% 18.6% 6.3% Advertising in magazines 20.5% 23.8% 14.3% 17.1% 25.0% % 17.8% 13.5% 31.4% 9.4% Wine/culinary related website 14.7% 16.0% 12.8% 14.3% 12.5% Traveller review site 11.6% 11.4% 8.3% 18.6% 12.5% A restaurant rating/review site 7.9% 8.5% 8.3% 4.3% 9.4% Advertising in newspapers 7.8% 6.8% 9.8% 8.6% 6.3% Tourism specific business referrals 6.6% 6.0% 9.0% 5.7% 3.1% HelloBC 1 3.5% 3.2% 3.0% 7.1% 0.0% Advertising on TV 1 2.7% 3.2% 1.5% 2.9% 3.1% Tour operators/travel agents 1 2.7% 1.8% 3.8% 4.3% 3.1% Travel/consumer shows 1 2.7% 1.4% 4.5% 4.3% 3.1% Other source of information 1 3.7% 3.2% 6.0% 2.9% 0.0% Average/median number of sources used 4.8/ / / / / Small sample size (i.e. under 20 respondents) requires that results should be interpreted with caution. There were a number of differences between the information sources used by low interest and high interest wine travellers. Notably, high interest wine travellers were more likely to seek information from friends and relatives compared to low interest travellers (64% and 54%, respectively). High interest wine travellers were also more likely to cite previous experience both in the Okanagan Valley (58% compared to 50%) and at the specific winery (47% compared to 39%) as a source of information. High interest wine travellers were also considerably more likely to seek information on both general and specific websites. Local or regional tourism websites were cited by 40% of high interest travellers compared to 29% of low interest wine travellers, winery websites were cited by 40% of high interest compared to 22% of low interest travellers, and wine and culinary related websites were cited by 21% of high interest compared to only 5% of low interest wine travellers. Conversely, low interest wine travellers were slightly more likely to seek information at visitor centres (31% compared to 25% of high interest travellers) and through advertisements in newspapers (11% compared to 6% of low interest wine travellers). Overall, nearly three quarters (73%) of high interest wine travellers turned to 34
36 the Internet in some form for information to plan their trips, while just over half (54%) of low interest wine travellers did the same. High interest wine travellers also used slightly more sources of information (average 5.2) compared to low interest wine travellers (average 4.2). Information sources used before trip for planning Importance of wine touring in trip planning Advice from friends/relatives Past experience visiting wineries in the Okanagan Valley Tourism/travel/visitor guides or books Maps Have visited the winery before A local or regional tourism website A winery website Visitor centres Other Internet site Winery business brochures Advertising in magazines Wine/culinary related website Traveller review site A restaurant rating/review site Advertising in newspapers Tourism specific business referrals 29% 22% 31% 25% 21% 25% 20% 22% 19% 21% 15% 20% 5% 21% 10% 13% 6% 9% 11% 6% 7% 6% 39% 40% 40% 54% 64% 50% 58% 49% 49% 47% 48% 47% Low Interest (n=204) 0% 20% 40% 60% 80% High Interest (n=312) Figure 10. Information sources used before trip for planning showing importance of wine touring for trip planning (low and high interest). Only those responses which received 5% or more of the total have been shown in the figure. The follow-up survey asked travellers to indicate which three information sources they used for trip planning they felt were most useful. Nearly half (42%) of all leisure travellers state that advice from friends and relatives was useful. This was fairly consistent across visitor origins with the exception of those travelling from other Canadian provinces. Overall, 59% of travellers from provinces other than British Columbia and Alberta stated that this was a useful source while just over a third (37%) of BC residents found family/friends advice to be most useful. Over a third of participants indicated that drawing from past experience visiting wineries in the Okanagan Valley was a useful source for trip planning. This ranged from a high of 44% among British 35
37 Columbians to a low of 13% among those from outside of. Travel and visitor guides and books (32%), maps (27%), previous visits to the winery (21%) and local or regional tourism websites (21%) were all found to be useful by over a third of all independent leisure travellers. Those from outside were more likely to state that maps (40%) and local or regional tourism websites (33%) were useful sources of information for trip planning. Table 24: Information sources found most useful by origin Leisure Travellers (n=464) BC (n=253) Alberta (n=116) Other (n=65) Outside (n=30) Advice from friends/relatives 42.0% 36.8% 44.0% 58.5% 43.3% Past experience visiting wineries in the Okanagan Valley 35.6% 43.5% 32.8% 20.0% 13.3% Tourism/travel/visitor guides or books 31.9% 27.7% 35.3% 41.5% 33.3% Maps 26.5% 24.5% 28.4% 24.6% 40.0% Have visited the winery before 20.9% 28.5% 13.8% 7.7% 13.3% A local or regional tourism website 20.5% 21.3% 15.5% 20.0% 33.3% Visitor centres 18.8% 16.6% 25.0% 15.4% 20.0% A winery website 15.5% 20.2% 10.3% 7.7% 13.3% Other Internet site 11.4% 11.9% 10.3% 9.2% 16.7% Winery business brochures 10.8% 11.9% 11.2% 9.2% 3.3% 9.9% 9.9% 7.8% 16.9% 3.3% Advertising in magazines 8.4% 9.1% 6.9% 6.2% 13.3% Wine/culinary related website 5.8% 7.5% 1.7% 7.7% 3.3% Traveller review site 1 3.9% 3.6% 4.3% 4.6% 3.3% Tourism specific business referrals 1 3.7% 4.3% 3.4% 1.5% 3.3% Advertising in newspapers 1 3.0% 1.6% 4.3% 6.2% 3.3% A restaurant rating/review site 1 2.2% 2.8% 0.0% 1.5% 6.7% Advertising on TV 1 1.3% 0.8% 1.7% 3.1% 0.0% HelloBC 1 1.1% 0.8% 1.7% 1.5% 0.0% Tour operators/travel agents 1 0.9% 0.4% 1.7% 0.0% 3.3% Travel/consumer shows 1 0.9% 0.8% 1.7% 0.0% 0.0% Other source of information 1 2.6% 2.4% 5.2% 0.0% 0.0% 1. Small sample size (i.e. under 20 respondents) requires that results should be interpreted with caution. The information sources rated as most useful for trip planning were very similar for low and high interest wine travellers, with a few exceptions. While nearly a third (31%) of low interest wine travellers selected maps as a most useful source, the same was true for less than one quarter (24%) of high interest wine travellers. Conversely, 24% of high interest travellers rated local or regional tourism websites among the sources they found most useful, while only 16% of low interest wine travellers mentioned this as a useful source of information. Much larger differences, however, were seen in the number of high and low interest wine travellers who rated wine specific websites as useful sources of information. One fifth (20%) of high interest wine travellers indicated that the information on a winery website was most useful for trip planning, while only 8% of low interest wine travellers mentioned this as a top source. Similarly, 8% of high interest and only 2% of low interest wine travellers included wine and culinary related websites among their top information sources in terms of their value for trip planning. 36
38 Past experience visiting wineries in the Okanagan Valley Information sources most useful for trip planning Importance of wine touring in trip planning Advice from friends/relatives Tourism/travel/visitor guides or books Maps Have visited the winery before A local or regional tourism website Visitor centres A winery website Other Internet site Winery business brochures Advertising in magazines Wine/culinary related website 2% 8% 10% 12% 14% 9% 10% 10% 9% 8% 8% 16% 24% 21% 21% 21% 17% 20% 24% 34% 34% 31% 31% 40% 43% 37% 0% 10% 20% 30% 40% 50% 60% Figure 11. Low Interest (n=179) High Interest (n=285) Top three information sources selected as most useful for trip planning showing importance of wine touring for trip planning (low and high interest). Only those responses which received 5% or more of the total have been shown in the figure. Maps were the most frequently mentioned information sources used by independent leisure travellers during their trip (53%). The number of travellers from outside of using maps during travel jumped to over two thirds (69%), whereas among BC residents, just under half (49%) made use of the same information source. More than half of all independent leisure travellers (53%) mentioned referring to travel guides or books, while 44% referenced advice from friends and relatives. Visitor centres were also an important source of information for travellers (41%). As above, those who lived in Canadian provinces other than British Columbia and Alberta and those from outside were less likely to indicate that they relied on information from past visits to the Okanagan Valley and previous visits to the winery. 37
39 Table 25: Information sources used during trip by origin Okanagan Valley Wine Consumer Research Study - Summer 2008 Leisure Travellers (n=467) BC (n=251) Alberta (n=119) Other (n=65) Outside (n=32) Maps 53.1% 49.4% 57.1% 52.3% 68.8% Tourism/travel/visitor guides or books 52.5% 49.4% 58.8% 55.4% 46.9% Advice from friends/relatives 44.3% 37.8% 52.9% 50.8% 50.0% Visitor Centres 40.5% 39.4% 41.2% 46.2% 34.4% Past experience visiting wineries in the Okanagan Valley 35.1% 39.0% 36.1% 23.1% 25.0% Winery business brochures 34.0% 35.5% 31.1% 35.4% 31.3% Have visited the winery before 29.8% 34.3% 28.6% 18.5% 21.9% Advertising in magazines 16.7% 16.3% 19.3% 13.8% 15.6% Tourism specific business referrals 13.5% 13.5% 12.6% 13.8% 15.6% A winery website 10.3% 10.4% 7.6% 15.4% 9.4% A local or regional tourism website 9.2% 7.2% 13.4% 9.2% 9.4% Advertising in newspapers 6.2% 5.2% 7.6% 6.2% 9.4% Other Internet site 5.1% 4.8% 6.7% 3.1% 6.3% Wine/culinary related website 4.9% 5.2% 3.4% 6.2% 6.3% 4.7% 5.6% 2.5% 7.7% 0.0% A restaurant rating/review site 4.7% 4.4% 6.7% 3.1% 3.1% Tour operators/travel agents 1 3.6% 2.0% 5.0% 4.6% 9.4% HelloBC 1 2.1% 2.4% 2.5% 0.0% 3.1% Traveller review site 1 1.5% 0.4% 3.4% 1.5% 3.1% Travel / consumer shows 1 1.5% 1.2% 2.5% 1.5% 0.0% Advertising on TV 1 1.1% 0.0% 1.7% 1.5% 6.3% Other source of information 4.3% 5.2% 2.5% 6.2% 0.0% 1. Small sample size (i.e. under 20 respondents) requires that results should be interpreted with caution. With respect to the information sources used during travel high and low interest wine travellers were very similar. High interest wine travellers were, however, more likely to indicate that they used a map while travelling (57% compared to 47% for low interest travellers). High interest wine travellers were also slightly more likely to rely upon winery brochures, previous visits to the winery, and referrals made by tourism businesses (including hotels, restaurants, etc.). Low interest wine travellers were slightly more likely to seek information from friends and relatives while travelling. 38
40 Maps Tourism/travel/visitor guides or books Advice from friends/relatives Visitor Centres Past experience visiting wineries in the Winery business brochures Have visited the winery before Advertising in magazines Tourism specific business referrals A winery website A local or regional tourism website Advertising in newspapers Other Internet site Wine/culinary related website A restaurant rating/review site Information sources used during trip Importance of wine touring in trip planning 9% 11% 10% 10% 9% 6% 6% 3% 6% 3% 6% 4% 5% 3% 6% 17% 16% 16% 26% 29% 34% 36% 32% 38% 47% 47% 43% 40% 41% 52% 53% 57% 0% 10% 20% 30% 40% 50% 60% Low Interest (n=188) High Interest (n=279) Figure 12. Information sources used during trip showing importance of wine touring for trip planning (low and high interest). Only those responses which received 5% or more of the total have been shown in the figure. Wine Touring Planning the wine touring trip Exploring the detailed information on the importance of wine touring in trip planning reveals that wine touring was a primary reason for trip planning for just over one quarter (27%) of all independent leisure travellers and an important reason for a further 28%. Combined these two groups have been classified as high interest wine travellers. For the remainder of leisure travellers, wine touring either played some role in trip planning (30%) or was not important at all (15%). Combined these two groups are referred to in this report as low interest wine travellers. No practical differences were observed by origin for those indicating different levels of importance in wine touring to trip planning. 39
41 Table 26: Detailed information on importance of wine touring in trip planning by origin Leisure Travellers (n=1,750) BC (n=901) Alberta (n=447) Other (n=232) Outside (n=170) Primary reason 27.0% 30.7% 22.4% 24.1% 23.5% Important reason 27.9% 26.7% 29.8% 31.5% 24.7% Played some role in planning 30.4% 28.7% 33.6% 30.6% 30.6% Not important at all 14.6% 13.8% 14.3% 13.8% 21.2% When asked specifically about the importance of the visiting the winery (where they were intercepted) in planning their trip to the Okanagan, the largest group of independent leisure travellers (28%) indicated that the winery was somewhat important. However, the second largest group (23%) mentioned that the winery was not important at all in trip planning. The percent that indicated that the winery was not important at all increased as the origin of the survey participant moved further away from British Columbia. For example, 19% of travellers from British Columbia indicated that they specific winery was not important at all, whereas 34% of those from outside indicated the same. This was the only practical difference observed by origin. Table 27: Importance of specific winery in trip planning by origin Leisure Travellers (n=1,744) BC (n=899) Alberta (n=445) Other (n=230) Outside (n=170) Very important 20.5% 22.9% 19.6% 18.7% 12.9% Important 18.4% 17.9% 20.0% 17.4% 18.2% Somewhat important 27.9% 30.8% 26.5% 23.0% 22.9% Not important 10.1% 9.7% 10.1% 10.4% 12.4% Not at all important 23.0% 18.7% 23.8% 30.4% 33.5% Examining the importance of the specific winery at which travellers were intercepted by high and low interest wine travellers revealed that the individual winery was a considerable influencing factor for trip planning for nearly half (49%) of high interest wine travellers. The same was true for less than a third (27%) of low interest wine travellers. Conversely, 43% of low interest wine travellers indicated that the specific winery was not important, while only one quarter (25%) of high interest wine travellers indicated that the winery they were visiting was not an important consideration for trip planning. 40
42 Importance of specific winery in trip planning Importance of wine touring in trip planning Low Interest (n=786) 27% 30% 43% High Interest (n=958) 49% 26% 25% 0% 20% 40% 60% 80% 100% Important Somewhat important Not important Figure 13. Importance of specific winery in planning trip to the Okanagan Valley showing importance of wine touring for trip planning (low and high interest). Among all independent leisure travellers, just under half (45%) planned to stop at the winery at which they were intercepted prior to departure from home. The percentage who stated this was the case was highest among British Columbia residents at 51% and decreases to a low of 23% among residents from outside. Independent leisure travellers who indicated that wine touring was an important component of trip planning were considerably more likely to indicate that they had planned to visit the winery at which they were intercepted prior to departing from home. Over half (54%) of high interest wine travellers had planned a visit to the specific winery, compared to just over a third (35%) of low interest travellers who had made similar plans. Plan to visit winery prior to trip departure Importance of wine touring in trip planning Low Interest (n=783) 35% 65% High Interest (n=959) 54% 46% 0% 20% 40% 60% 80% 100% Yes No Figure 14. Plan to visit specific winery prior to departure from home showing importance of wine touring for trip planning (low and high interest). 41
43 The follow-up survey asked leisure travellers to identify the importance of visiting a food or cuisine business (not including wineries) as a factor motivating their trip to the Okanagan Valley. Over half (55%) of all participants indicated that this was not a factor at all, while a third (33%) indicated that this played some role. There were no practical differences observed by origin although those from Canadian provinces other than British Columbia and Alberta and those from outside of were slightly more likely to state that food and cuisine played some role. Table 28: Importance of visiting a food/cuisine business in motivating trip by origin Leisure Travellers (n=518) BC (n=282) Alberta (n=130) Other (n=72) 1 Outside (n=34) 1 Primary reason 1.9% 2.5% 0.8% 1.4% 2.9% Important reason 10.2% 11.0% 8.5% 9.7% 11.8% Played some role in planning 33.2% 33.3% 30.0% 36.1% 38.2% Not important at all 54.6% 53.2% 60.8% 52.8% 47.1% 1. Small sample sizes. Interpret with caution. Although nearly half (47%) of high interest wine travellers stated that visiting a food or cuisine business was not a motivating factor for their trip to the Okanagan, this percentage was considerably lower than was found among low interest wine travellers who stated food and cuisine was not a factor (65%). Overall, 16% of high interest wine travellers and 7% of low interest wine travellers stated that food and cuisine was either a primary or an important motivating factor for their trip to the Okanagan Valley. Importance of food/cuisine in trip motivation Importance of wine touring in trip planning Low Interest (n=212) 6% 28% 65% High Interest (n=306) 13% 37% 47% 0% 20% 40% 60% 80% 100% Primary reason Played some role in planning Important reason Not important at all Figure 15. Importance of visiting a food/cuisine business (not including wineries) in motivating trip to the Okanagan Valley showing importance of wine touring for trip planning (low and high interest). The follow-up survey also asked participants to identify if they had dined at a fine dining or gourmet establishment on their trip (either while in the Okanagan Valley or outside of the region). Nearly twothirds of respondents (61%) indicated that they had dined at one of these establishments during their trip. These individuals were further asked to indicate whether they decided to visit these 42
44 establishments before or during their trip. The results showed that well over half (60%) of fine dining/gourmet patrons had made their dining decisions during their trip (rather than before leaving home). A further third (33%) of participants made decisions both while they were travelling and before their trip. Those from other Canadian provinces and those residing outside were more likely to indicate that these decisions were made while travelling (70% and 65%, respectively). Table 29: Timing of decision regarding dining at a fine dining or gourmet establishment by origin 1, 2 Leisure Travellers (n=321) BC (n=173) Alberta (n=82) Other (n=43) Outside (n=23) Only before the trip 7.8% 9.8% 6.1% 4.7% 4.3% Only during the trip 59.5% 57.2% 57.3% 69.8% 65.2% Both before and during the trip 32.7% 32.9% 36.6% 25.6% 30.4% 1. Only individuals who stated they participated in dining at a fine dining or gourmet establishment in the Okanagan Valley or at another location during their trip have been included. 2. Multi-responses were allowed, hence, totals do not equal 100%. Differences were observed in the timing of the decision to visit a fine dining or gourmet establishment of high interest wine travellers compared low interest wine travellers. Those who stated that wine touring was of little or no importance in planning their trip were more likely to decide to visit a fine dining or gourmet establishment during their trip (70% vs. 54% of high interest wine travellers). Conversely, high interest wine travellers were more likely to state both that they made decisions to visit these establishments before leaving on their trip or both before and during the trip (10% and 37%, compared to 4% and 26% for low interest wine travellers). 80% 60% Timing of decision to visit a fine-dining/gourmet establishment Importance of wine touring in trip planning 70% 54% 40% 26% 37% 20% 0% 4% 10% Only before the trip Only during the trip Both before and during the trip Low Interest (n=116) High Interest (n=205) Figure 16. Timing of decision regarding dining at a fine dining or gourmet establishment showing importance of wine touring for trip planning (low and high interest). Only individuals who stated they participated in dining at a fine dining or gourmet establishment in the Okanagan Valley or at another location during their trip have been included. Independent leisure travellers who indicated that wine touring was not the primary reason for taking this trip were asked to identify the other leisure activity that was the primary reason for planning this 43
45 trip. Nearly a third (28%) indicated that there was no specific leisure activity and that they were travelling primarily for the purposes of relaxing, for a getaway or simply to enjoy the sun. Of those who indicated a primary motivating activity, over one fifth (21%) mentioned a nature-based activity (including boating, hiking, camping, cycling, fishing, rock climbing, horseback riding, and wildlife viewing) and an additional 14% mentioned a lake-based activity such as: visiting the beach, swimming or participating in other water-based activities, such as waterskiing, tubing, and riding personal watercrafts. Golf was also a popular activity with 9% of all independent leisure travellers citing this as their primary leisure activity. No practical differences were observed in primary leisure activity by origin. Travellers from outside, however, were more likely to indicate a nature based activity (29%), especially compared to travellers from British Columbia and Alberta (21%, each). Among the specific nature-based activities cited the largest difference was seen in hiking with 11% more residents from outside of participating in hiking compared to those from Alberta (13% and 2%, respectively). Lake activities were cited most often by residents of Alberta (17%) a full 11% above those from outside of (6%). Golf was also selected more frequently among both residents of British Columbia and Alberta compared to those from other provinces and outside of, whereas the reverse was true among those who selected touring and sightseeing as their primary leisure activity. Table 30: Other primary leisure activities by origin Leisure Travellers (n=1,252) BC (n=612) Alberta (n=339) Other (n=173) Outside (n=128) No specific leisure activity % 27.8% 30.7% 28.9% 22.7% All nature-based activities 21.4% 20.9% 20.6% 19.1% 28.9% Boating 7.7% 7.2% 11.2% 3.5% 7.0% Hiking 4.2% 3.4% 2.4% 4.6% 12.5% Camping 3.6% 3.1% 3.8% 6.4% 1.6% Cycling 3.1% 3.8% 2.1% 1.7% 4.7% Fishing 1 0.6% 0.8% 0.3% 1.2% 0.0% Other nature-based activities 2.1% 2.6% 0.9% 1.7% 3.1% Lake activities 14.3% 16.5% 17.1% 7.5% 5.5% Golf 9.3% 10.3% 10.3% 6.9% 5.5% Friends/Family activities 8.4% 8.2% 6.2% 11.0% 11.7% Touring & sightseeing 6.3% 4.4% 3.8% 13.3% 12.5% Sporting event 3.9% 4.2% 4.1% 2.3% 3.9% Dining 1 1.4% 1.8% 1.2% 1.7% 0.0% Agriculture (Orchards & Fruit) 1 1.0% 1.0% 0.6% 1.2% 2.3% Festival or event 1 1.0% 1.8% 0.6% 0.0% 0.0% Cultural activities 1 1.0% 0.8% 0.6% 1.2% 2.3% Other 2 3.7% 2.3% 4.1% 6.9% 4.7% 1. Small sample size (i.e. under 20 respondents) requires that results should be interpreted with caution. 2. Other includes real estate (n=12), shopping (n=6), spa (n=4), cruise (n=4), casino (n=4), go karts (n=3), playing bridge (n=2) 11 other responses. 3. No specific leisure activity includes both those who stated no specific activity & travellers who mentioned general activities including relaxing, for a getaway and to enjoy the sun (n=59). 44
46 During the intercept interview, independent leisure travellers were asked to identify the primary factor that prompted them to visit the specific winery where they were interviewed. Over a third of travellers (37%) indicated that they were visiting the winery based on a recommendation from others. These included those who received recommendations from friends, family and local residents (23%), local businesses (7%), and recommendations from others people (7%). Road signage and passing by prompted visits from one fifth (22%) of leisure travellers, while 12% indicated they were either familiar with the winery product or name and stopped by to investigate further. There were some practical differences observed by origin whereby those from other Canadian provinces were more likely to state that they were prompted to visit the winery as a result of recommendations (51%), in particular the recommendations they received from friends, family members or local residents (34%). This was also true of residents from outside of with nearly half (47%) of this group indicating they were prompted to visit by a recommendation. Additionally, the percentage who stated that they were passing by the establishment or took note of road signage that drew them in was highest among residents of British Columbia (27%) and gradually decreased to a low of 11% among residents from outside of. Table 31: Reason prompting visit to winery by origin Leisure Travellers (n=949) BC (n=440) Alberta (n=232) Other (n=149) Outside (n=128) Recommendation (all) 36.8% 30.0% 34.9% 51.0% 46.9% Friend, family or resident 22.9% 17.3% 23.3% 34.2% 28.1% Local business 6.5% 6.4% 5.2% 6.7% 9.4% Not specified 7.4% 6.4% 6.5% 10.1% 9.4% Passing by or road signage 21.8% 26.6% 22.8% 15.4% 10.9% Familiar with product or name 11.9% 11.8% 15.1% 8.1% 10.9% Exploring (i.e. touring/previous interest) 5.7% 6.6% 5.2% 6.7% 2.3% Convenient / Was in the area 4.3% 5.0% 5.2% 2.0% 3.1% Information at cultural or visitor centre 4.0% 2.5% 3.0% 4.7% 10.2% Advertisement or promotional activity 3.9% 3.6% 3.9% 3.4% 5.5% Travel guide or map 3.3% 2.7% 2.6% 4.0% 5.5% To visit amenities (i.e. restaurant, spa, shop, etc) 2.3% 3.4% 1.7% 2.0% 0.0% Previous visit 2.1% 3.2% 1.3% 1.3% 0.8% Setting (i.e. scenery or architecture) 1 1.7% 1.8% 2.2% 0.0% 2.3% Other 2.2% 2.7% 2.2% 1.3% 1.6% 1. Small sample size (i.e. under 20 respondents) requires that results should be interpreted with caution. There were very few differences observed in the reasons provided for visiting the winery by high and low interest wine travellers. Those classified as low interest wine travellers were, however, more likely to indicate that they were visiting the winery as a result of a recommendation received from friends, family or local residents (26% compared to 19% for high interest wine travellers). 45
47 Reason prompting visit to winery Importance of wine touring in trip planning Recommendation (all) Recommend - Friend, family or resident Recommend - Local business 6% 8% 19% 26% 38% 36% Recommend - Not specified Passing by/road signage 6% 9% 21% 22% Familiar with product/name 12% 12% Exploring 5% 7% 0% 10% 20% 30% 40% 50% Low Interest (n=507) High Interest (n=442) Figure 17. Reason prompting visit to winery showing importance of wine touring in trip planning (low and high interest). Characteristics of wine touring trip During the interview at the winery, independent leisure travellers were asked to indicate which from a selection of leisure activities they either had already or planned to participate in during their trip. Of this list, two-thirds of respondents (66%) planned to go fine dining and nearly as many (64%) mentioned that they had either visited or planned to visit a farmer s market during their trip. Visits to museums of historical sites and hiking were cited by a third (34% and 33%, respectively). Golfing, cycling and visiting a spa were less likely to be participated in on their leisure trip (20%, 16%, and 11%, respectively). The only practical difference observed in leisure activities was for hiking. Residents from outside of were considerably more likely to have mentioned that they either had participated or planned to go hiking during their trip. Nearly half (45%) of these travellers indicated that hiking would be an activity on their trip, compared to less than a third of British Columbia residents (29%). Similar patterns were also seen in the origin of visitors to museums and historical sites. While the trips of 44% of those from outside and other Canadian provinces included these activities, only 28% of British Columbia residents and 36% of those from Alberta planned to or had participated. 46
48 Table 32: Other activities planned or participated in by origin Okanagan Valley Wine Consumer Research Study - Summer 2008 Leisure Travellers (n=1,748) BC (n=900) Alberta (n=447) Other (n=231) Outside (n=170) Fine dining 66.4% 63.4% 71.1% 69.3% 65.9% Visit a farmer's market 63.6% 63.2% 67.1% 62.8% 57.1% Visit a museum or historical site 33.8% 28.3% 36.0% 43.7% 43.5% Hiking 33.2% 29.0% 33.1% 41.1% 44.7% Golf 20.3% 19.1% 25.1% 17.7% 17.6% Cycling 16.4% 17.7% 13.2% 15.6% 19.4% Visit a spa 11.3% 11.6% 12.1% 9.5% 10.6% High interest and low interest wine travellers were very similar in terms of the other activities they had either included or planned to include as part of their trip with one noteworthy exception. Among those travellers for whom wine touring was an important component of trip planning, fine dining was included significantly more often (72% compared to 59% for low interest wine travellers). Visit a farmer's market Visit a museum or historical site Other activities planned or participated in Importance of wine touring in trip planning Fine Dining Hiking Golf Cycling Visit a spa 22% 19% 18% 15% 11% 12% 35% 33% 36% 31% 59% 66% 62% 72% 0% 20% 40% 60% 80% Low Interest (n=787) High Interest (n=961) Figure 18. Other activities planned or participated in showing importance of wine touring in trip planning (low and high interest). Participants in the follow-up survey were asked to identify, from a list of possible wine and culinary activities, which activities either they or a member of their travel party participated in while in the Okanagan Valley. Over two thirds (68%) of all independent leisure travellers indicated that a visit to a farmers market or fruit stand was incorporated in their itinerary while in the Okanagan Valley. This was followed by 64% who stated that they drove a wine trail and 59% who participated in fine dining or a gourmet restaurant. Over half of all leisure travellers (53%) also mentioned they experienced 47
49 local or regional cuisine while in the Okanagan Valley. There were few practical differences observed by origin of the participant. Visitors from outside of were, however, considerably less likely to visit a farmers market or fruit stand. This activity was included as part of the itinerary of just over a third (36%) of visitors from outside, compared to three quarters of visitors from Alberta and other Canadian provinces excluding British Columbia (76% and 74%, respectively). Residents from outside of were also considerably less likely to visit a specialty food producer (26%), especially compared to residents of Alberta among whom nearly half (45%) participated in this activity. Table 33: Participation in wine and culinary activities while in the Okanagan by origin 1 Leisure Travellers (n=505) BC (n=280) Alberta (n=124) Other (n=70) Outside (n=31) Visited farmers' markets or fruit stands 68.1% 66.8% 75.8% 74.3% 35.5% Drove a wine trail 64.4% 60.7% 72.6% 67.1% 58.1% Fine dining/gourmet restaurant 59.2% 59.6% 61.3% 50.0% 67.7% Experienced local or regional cuisine 53.1% 50.4% 57.3% 57.1% 51.6% Visited a farm(s) or Orchard(s) 40.2% 35.0% 46.8% 50.0% 38.7% Visited a specialty food producer(s) 37.8% 35.4% 45.2% 40.0% 25.8% Special event at a winery 12.1% 10.7% 14.5% 15.7% 6.5% Food or drink festival, fair or exhibition 11.9% 12.9% 10.5% 12.9% 6.5% Wine tasting school or course 8.7% 6.1% 15.3% 8.6% 6.5% Stayed at an Inn/Resort with a gourmet restaurant 8.7% 6.4% 15.3% 7.1% 6.5% Cooking school or course 0.8% 1.1% 0.8% 0.0% 0.0% 1. Included are all independent leisure travellers who indicated participation in at least one wine and/or culinary activity listed while in the Okanagan Valley. Individuals who did not select a minimum of one activity have been removed from this analysis. There were more practical differences observed between high and low interest wine travellers in terms of the wine and culinary activities participated in while travelling in the Okanagan Valley. While the percentage of high and low interest wine travellers who visited a farmers market or fruit stand was virtually identical (68% of high interest and 69% of low interest), considerably more high interest travellers drove a wine trail (68%), dined at a fine dining or a gourmet restaurant (65%), or experienced local or regional cuisine (57%) compared to low interest wine travellers (58%, 50%, and 46%, respectively). Indeed, high interest wine travellers were more likely to have participated in each of the wine and culinary activities presented (with the exception of taking part in a cooking school or course, in which only a very small number of respondents participated) compared to low interest wine travellers. 48
50 Participation in wine and culinary activities while in the Okanagan Valley Importance of wine touring in trip planning Visited farmers' markets or fruit stands Drove a wine trail Fine-dining/gourmet restaurant Experienced local or regional cuisine Visited a farm(s) or Orchard(s) Visited a specialty food producer(s) Special event at a winery Food or drink festival, fair or exhibition Stayed at an Inn/Resort because of gourmet restaurant Wine tasting school or course Cooking school or course 1% 1% 8% 15% 9% 14% 6% 10% 8% 9% 34% 34% 50% 46% 44% 40% 69% 68% 58% 68% 65% 57% 0% 20% 40% 60% 80% Low Interest (n=196) High Interest (n=309) Figure 19. Participation in wine and culinary activities by respondent or member of travel party while in the Okanagan Valley showing importance of wine touring in trip planning (low and high interest). Among independent leisure travellers, nearly two thirds (64%) mentioned that they had stopped at a farmers market or fruit stand outside of the Okanagan Valley. This is only slightly lower than the percentage who reported participating in this activity while in the Okanagan Valley. Over half (51%) also mentioned that they participated in fine dining or dined at a gourmet restaurant, while just under half (47%) experienced local or regional cuisine. Again these numbers were slightly lower than those seen above where participants were asked to identify wine and culinary activities in which they participated while in the Okanagan Valley. A much larger difference was seen in the percentage of travellers who drove a wine trail outside of the Okanagan Valley. A total of 45% participated in this activity outside of the Okanagan, while 64% participated while in the Okanagan Valley. Travellers from outside of were less likely to indicate that they had visited a farmers market or fruit stand outside of the Okanagan Valley (52%), especially compared to residents of Alberta where 69% of travellers from this origin participated. Those from outside were also less likely to have experienced local or regional cuisine (36%) and to have driven a wine trail (27%). Visitors from Canadian provinces other than British Columbia and Alberta were more likely to have experienced local or regional cuisine (60%) while travelling outside of the Okanagan Valley. While there were slightly lower levels of participation in wine/culinary related activities while outside of 49
51 the Okanagan Valley, it is noteworthy that there was still a sizeable proportion of travellers engaging in wine/culinary activities outside of the valley while on other parts of their trip. Table 34: Participation in wine and culinary activities while on trip outside the Okanagan by origin 1 Leisure Travellers (n=368) BC (n=196) Alberta (n=86) Other (n=53) Outside (n=33) Visited farmers' markets or fruit stands 63.6% 63.8% 68.6% 62.3% 51.5% Fine dining/gourmet restaurant 50.5% 49.5% 48.8% 54.7% 54.5% Experienced local or regional cuisine 47.3% 42.3% 54.7% 60.4% 36.4% Drove a wine trail 45.4% 49.5% 45.3% 41.5% 27.3% Visited a farm(s) or Orchard(s) 34.5% 33.2% 37.2% 37.7% 30.3% Visited a specialty food producer(s) 33.7% 32.7% 40.7% 26.4% 33.3% Food or drink festival, fair or exhibition 9.5% 8.2% 10.5% 9.4% 15.2% Stayed at an Inn/Resort with gourmet restaurant 7.6% 6.1% 12.8% 5.7% 6.1% Special event at a winery 6.3% 5.1% 9.3% 9.4% 0.0% Wine tasting school or course 6.0% 4.1% 9.3% 9.4% 3.0% Cooking school or course 2 1.1% 1.0% 1.2% 1.9% 0.0% 1. Included are all independent leisure travellers who indicated participation in at least one wine and/or culinary activity listed while in the Okanagan Valley. Individuals who did not select a minimum of one activity have been removed from this analysis. 2. Small sample size (i.e. under 20 respondents) requires that results should be interpreted with caution. Generally, there were far fewer differences between high and low interest wine travellers in terms of the wine and culinary activities participated in while travelling outside of the Okanagan Valley. While high interest wine travellers were more likely to take part in each wine and culinary activity listed (with the exception of visiting farmers markets and fruit stands), none of these differences were found to be practically significant. The largest difference was seen in terms of those who visited a farm or orchard outside of the Okanagan Valley. This activity was included on the itineraries of 38% of high interest wine travellers, compared to only 29% of low interest travellers. 50
52 Participation in wine and culinary activities while outside the Okanagan Valley Importance of wine touring in trip planning Visited farmers' markets or fruit stands Fine-dining/gourmet restaurant Experienced local or regional cuisine Drove a wine trail Visited a farm(s) or Orchard(s) Visited a specialty food producer(s) Food or drink festival, fair or exhibition Stayed at an Inn/Resort because of gourmet restaurant Special event at a winery Wine tasting school or course Cooking school or course 9% 10% 6% 9% 3% 8% 6% 6% 1% 1% 48% 53% 45% 49% 43% 47% 29% 38% 32% 35% 67% 61% 0% 20% 40% 60% 80% Low Interest (n=151) High Interest (n=217) Figure 20. Participation in wine and culinary activities by respondent or member of travel party while outside the Okanagan Valley showing importance of wine touring in trip planning (low and high interest). On the follow-up survey independent leisure travellers were asked to provide detail about the actual activities they participated in while travelling in the Okanagan Valley. Of the activities listed, the activity selected most often was shopping for local arts and crafts. This activity was mentioned by over half (54%) of all independent leisure travellers. Participating in swimming and beach activities and visiting parks were also frequently selected activities with 43% and 42% of travellers indicating these activities were included on their trip, respectively. There were several practical differences observed when the responses are examined according to the origin of the traveller. Participants from other Canadian provinces were more likely to include shopping for local arts and crafts as part of their trip with two thirds (66%) selecting this activity. This group of participants were also less likely to indicate that their trip involved participation in swimming and beach activities. Less than a third of residents from other Canadian provinces mentioned these activities compared to nearly half (48%) of residents from British Columbia. Travellers from Alberta were most likely to indicate they had participated in golfing with over a third (34%) mentioning this activity compared to 17% of those from outside of. Residents of other countries were, however, nearly twice as likely to include wildlife viewing when travelling with 31% participating compared to 18% of all independent leisure travellers and 16% of those from British Columbia. 51
53 Table 35: Participation in trip activities while in the Okanagan Valley by origin Okanagan Valley Wine Consumer Research Study - Summer 2008 Leisure Travellers (n=465) BC (n=255) Alberta (n=117) Other (n=64) Outside (n=29) Shopping for local arts and crafts 54.4% 51.4% 53.8% 65.6% 58.6% Participating in swimming/beach activities 43.4% 48.2% 41.9% 29.7% 37.9% Visiting parks % 43.9% 34.2% 43.8% 48.3% Visiting museum, heritage or historic site 29.9% 29.8% 23.9% 31.3% 51.7% Participating in hiking 26.7% 23.9% 31.6% 31.3% 20.7% Participating in golfing 22.4% 18.4% 34.2% 18.8% 17.2% Visiting First Nations attraction or event 21.3% 22.4% 18.8% 23.4% 17.2% Participating in wildlife viewing 17.6% 16.1% 17.9% 17.2% 31.0% Participating in boating/sailing 13.3% 12.2% 15.4% 14.1% 13.8% Visiting casino 12.0% 12.2% 13.7% 9.4% 10.3% Visiting family attraction % 12.9% 16.2% 6.3% 0.0% Attending a festival, fair or exhibition 11.6% 11.4% 12.0% 12.5% 13.8% Participating in cycling 11.4% 14.5% 10.3% 4.7% 3.4% Attending or participating in a sporting event 3 8.8% 7.5% 12.0% 9.4% 6.9% Visiting spa 7.7% 8.2% 9.4% 4.7% 3.4% Participating in mountain biking 7.3% 8.2% 6.0% 3.1% 13.8% Participating in kayaking/canoeing 4 3.9% 5.1% 3.4% 1.6% 0.0% Participating in fishing 4 3.2% 3.5% 2.6% 1.6% 6.9% Participating in rock climbing 4 0.9% 1.2% 0.9% 0.0% 0.0% Other activities participated 6 8.2% 9.0% 7.7% 4.7% 10.3% 1. Includes municipal, provincial or national parks, or natural areas outside parks and camping. 2. Includes activities such as mini golf, zoos, and waterslides. 3. Does not include golf. 4. Small sample size (i.e. under 20 respondents) requires that results should be interpreted with caution. 5. Other activities included shopping (n=6), sightseeing (n=6), visiting friends or family (n=4), real estate (n=3), horseback riding (n=2), hot springs (n=2), movie (n=2), pet related (n=2), sporting activity (n=2), trail no specific activity (n=2), & 7 unique responses. Overall, travellers for whom wine touring was of low importance and those for whom wine touring was an important factor in trip planning were similar in terms of the other general activities they participated in while travelling. Those classified as low interest wine travellers, however, were more likely to include activities that centred upon lakes and beaches on their trip. While over half (51%) of low interest wine travellers participated in swimming and beach activities, only 39% of high interest wine travellers stated they participated in these same activities. Similarly, 18% of low interest wine travellers participated in sailing or boating compared to only 10% of high interest travellers. High interest wine travellers were only slightly more likely to participate in shopping for local arts and crafts, visiting parks, hiking, and spas. None of these differences, however, were determined to be 52
54 significant for practical purposes. Participation in trip activities while in the Okanagan Valley Importance of wine touring in trip planning Shopping for local arts and crafts Participating in swimming/beach activities Visiting parks Visiting museum, heritage or historic site Participating in hiking Participating in golfing Visiting First Nations attraction or event Participating in wildlife viewing Participating in boating/sailing Visiting family attraction Visiting casino Attending a festival, fair or exhibition Participating in cycling Attending or participating in a sporting event Other activities participated Visiting spa Participating in mountain biking 29% 30% 24% 29% 26% 20% 20% 22% 20% 16% 18% 10% 15% 10% 11% 13% 15% 10% 13% 10% 11% 8% 9% 8% 6% 9% 9% 6% 39% 40% 43% 51% 52% 56% 0% 10% 20% 30% 40% 50% 60% Low Interest (n=188) High Interest (n=277) Figure 21. Activities participated in by respondent and/or members of travel party while in the Okanagan Valley showing importance of wine touring in trip planning (low and high interest). Only those responses which received 5% or more of the total have been shown in the figure. Participants in the follow-up survey were asked to specify which of these same activities they included on their trip in an area outside of the Okanagan Valley. There were only minor variations seen in the frequency and activities participated in by independent leisure travellers in other areas. Shopping was once again cited as the most frequent activity with over half (55%) indicating they had shopped for local arts and crafts during their trip. Visiting parks was also selected by over half (54%) of all leisure travellers which represented a 12% increase compared to the percentage of travellers who cited they took part in this activity in the Okanagan Valley. Conversely, the percent of travellers who indicated they participated in swimming and beach activities in another region during their trip decreased to 37% compared to 43%who participated in this activity in the Okanagan Valley. There were a number of practical differences observed, in particular among travellers from Canadian provinces other than British Columbia and Alberta and Outside. Travellers from both of these origins were considerably more likely to indicate they had visited a park outside of the Okanagan Valley during their trip. A total of 82% of residents of other countries and 73% of residents from other 53
55 Canadian provinces visited parks in other regions, compared to 44% of Alberta residents and 48% of those from British Columbia. Only one quarter (25%) of those from outside participated in swimming and beach activities compared to 42% from British Columbia. Travellers from other Canadian provinces and outside were also more likely to visit a museum, heritage or historic site outside of the Okanagan Valley with this activity drawing nearly two thirds (61%) of those from outside and half (45%) of travellers from Alberta. Table 36: Participation in trip activities outside of the Okanagan Valley by origin Leisure Travellers (n=353) BC (n=178) Alberta (n=91) Other (n=56) Outside (n=28) Shopping for local arts and crafts 55.0% 50.0% 56.0% 64.3% 64.3% Visiting parks % 47.8% 44.0% 73.2% 82.1% Participating in swimming/beach activities 36.8% 42.1% 33.0% 32.1% 25.0% Visiting museum, heritage or historic site 33.1% 26.4% 30.8% 44.6% 60.7% Participating in hiking 28.9% 22.5% 31.9% 41.1% 35.7% Participating in wildlife viewing 27.2% 21.3% 25.3% 33.9% 57.1% Participating in golfing 15.9% 12.9% 26.4% 12.5% 7.1% Visiting First Nations attraction or event 15.6% 16.3% 11.0% 17.9% 21.4% Attending a festival, fair or exhibition 14.4% 11.2% 13.2% 19.6% 28.6% Visiting family attraction % 11.2% 18.7% 5.4% 10.7% Visiting casino 11.9% 11.2% 14.3% 10.7% 10.7% Participating in cycling 10.5% 10.1% 11.0% 10.7% 10.7% Participating in boating/sailing 9.1% 6.7% 12.1% 8.9% 14.3% Visiting spa 7.9% 3.9% 8.8% 17.9% 10.7% Participating in kayaking/canoeing 7.1% 7.9% 5.5% 5.4% 10.7% Attending or participating in a sporting event 3,4 5.4% 6.2% 5.5% 5.4% 0.0% Participating in mountain biking 4 5.1% 6.2% 3.3% 5.4% 3.6% Participating in fishing 4 4.0% 3.4% 4.4% 1.8% 10.7% Participating in rock climbing 4 0.8% 0.6% 0.0% 3.6% 0.0% Other activities participated in the region 5 7.9% 8.4% 6.6% 7.1% 10.7% 1. Includes municipal, provincial or national parks, or natural areas outside parks and camping. 2. Includes activities such as mini golf, zoos, and waterslides. 3. Does not include golf. 4. Small sample size (i.e. under 20 respondents) requires that results should be interpreted with caution. 5. Other activities included hot springs (n=5), sightseeing (n=5), skiing (n=3), visiting friends or family (n=3), horseback riding (n=2), shopping (n=2), not specified (n=2), and 5 additional unique responses. In terms of the activities participated in by high and low interest wine travellers while outside of the Okanagan, there were a few notable differences. High interest wine travellers were more likely to shop for local arts and crafts (59% compared to 50% of low interest travellers), visit parks (57% compared to 49%), and make a visit to a museum or site of historic importance (38% compared to 27% of low interest wine travellers). 54
56 Participation in trip activities outside of the Okanagan Valley Importance of wine touring in trip planning Shopping for local arts and crafts Visiting parks Participating in swimming/beach activities Visiting museum, heritage or historic site Participating in hiking Participating in wildlife viewing Participating in golfing Visiting First Nations attraction or event Attending a festival, fair or exhibition Visiting family attraction Visiting casino Participating in cycling Participating in boating/sailing Other activities participated Visiting spa Participating in kayaking/canoeing Attending or participating in a sporting event Participating in mountain biking 19% 14% 12% 18% 15% 14% 14% 11% 11% 12% 10% 11% 9% 9% 9% 7% 5% 10% 4% 9% 8% 3% 4% 6% 27% 26% 31% 29% 26% 35% 38% 38% 50% 49% 57% 59% Low Interest (n=150) 0% 10% 20% 30% 40% 50% 60% High Interest (n=203) Figure 22. Activities participated in by respondent and/or members of travel party while outside of the Okanagan Valley showing importance of wine touring in trip planning (low and high interest). Only those responses which received 5% or more of the total have been shown in the figure. Independent leisure travellers were asked to identify how many wineries they visited or planned to visit on the day they were interviewed, in the Okanagan Valley, and in total on their trip. Overall, travellers reported an average of 3.5 wineries for the day, 7.1 wineries in the Okanagan Valley, and 8.8 wineries on the trip. When asked about the number of wineries independent leisure travellers planned to visit on the day they were interviewed, the largest group (41%) indicated that there were between three and five wineries on their itineraries for the day. Nearly one quarter indicated that the winery they were interviewed at would be the only one, however 17% planned on visiting between six and ten while an additional 16% were planning to stop at two. When asked about the number of wineries they had visited or planned to visit in the Okanagan Valley, over one quarter (28%) mentioned three to five while the same amount (28%) mentioned between six and ten. In terms of their entire trips, the number of wineries visited or planned to visit did not change significantly from the number reported for the Okanagan Valley with nearly a third (30%) indicating between six and 10 and 26% stating that they visited or planned to visit between three and five. 55
57 Table 36: Number of wineries and/or wine tasting rooms visited or planned to visit on current day, in Okanagan Valley and total for the trip Today (n=1,742) In Okanagan Valley (n=1,733) On Trip (n=1,735) One 24.0% 13.4% 8.6% Two 16.3% 11.9% 7.7% 3 to % 27.5% 25.8% 6 to % 27.5% 29.8% 11 to % 10.6% 14.4% 16 to % 5.4% 7.6% 21 to % 1.6% 2.2% More than % 2.2% 3.9% Looking at the number of wineries visited or planned by origin showed that those from British Columbia reported the highest average number of wineries visited for the day (3.8). The median number of wineries visited both in the Okanagan Valley (6.0) and on the trip in total (7.0) was notably higher compared to all leisure travellers. Visitors from outside reported the lowest number of wineries visited across all questions. Table 37: Average and median number of wineries and/or wine tasting rooms visited or planned to visit on current day, in Okanagan Valley and total for the trip by origin Leisure Travellers (n=1,742) 1 BC (n=896) Alberta (n=447) Other (n=230) Outside (n=169) Avg. Median Avg. Median Avg. Median Avg. Median Avg. Median Today Okanagan Valley On trip The number of respondents (n) is based on total valid responses to the question regarding total wineries visited on current day. Considerable differences were observed in the number of wineries visited by high and low interest wine travellers. High interest wine travellers reported that they visited more wineries per day (average of 4.3 compared to 2.7 for low interest travellers), in the Okanagan (average 9.4 compared to 4.3 for low interest), and on the trip in total (11.7 compared to 5.3 for low interest wine travellers). 56
58 Number of wineries visited Importance of wine touring in trip planning Today Okanagan Valley On trip Figure 23. Low interest average Low interest median High interest average High interest median Average and median number of wineries visited by independent leisure travellers on the day of the interview, in the Okanagan Valley and on trip in total showing importance of wine touring in trip planning (low and high interest). All independent leisure travellers were asked if this was their first visit to the specific winery at which they were interviewed. For two thirds (69%) this was their first visit. This number was slightly lower for residents of British Columbia and Alberta (63% and 66%, respectively), however, it was markedly higher among residents of other Canadian provinces and those from outside of (83% and 89%, respectively). Travellers were also asked to indicate whether they had ever tasted the wines produced at this winery before. Just over half of all leisure travellers (55%) indicated they had tasted the wines; however, there were variations by origin. Residents of British Columbia were most likely to state that they had previously tasted the wine (63%), whereas those from Canadian provinces other than British Columbia and Alberta and those from outside of were considerably less likely to have previously tasted the wine (43% and 32%, respectively). Table 38: Experience with specific wine/winery by origin Leisure Travellers (n=1,741) 1 BC (n=897) Alberta (n=447) Other (n=229) Outside (n=168) First time at winery 68.9% 62.7% 66.4% 83.4% 88.7% Tasted wine before 55.3% 62.5% 55.9% 43.0% 31.5% 1. The number of valid responses reported in this table (n) was based on the number of responses to the question, Is this your first time visiting <specific winery>? For the question, Have you ever tasted the wines produced here before? valid percentages are based on the following sample sizes - all leisure travellers n=1,739; BC n=896; Alberta n=447; other n=228; and outside n=
59 High interest wine travellers were less likely to report that this was their first time visiting the winery (65% compared to 73% of low interest travellers); however this difference was not determined to be of practical significance. Interestingly, when asked if they had ever tasted the wines produced at the winery before the results were very similar for high interest and low interest wine travellers. High interest travellers were only slightly more likely to have tasted the wine at 59% compared to 51% of low interest travellers. 80% 60% Experience with specific wine/winery Importance of wine touring in trip planning 73.4% 65.2% 51.3% 58.5% 40% 20% 0% First time at winery Low Interest (n=782) Tasted wine before High Interest (n=959) Figure 24. Responses to the questions, Is this your first time visiting the winery? and Have you ever tasted the wines produced here before? showing importance of wine touring in trip planning (low and high interest). Among all independent leisure travellers the vast majority (85%) participated in a wine tasting and nearly three quarters (71%) purchased wine. The percentages participating in other activities in the winery were considerably lower with less than one quarter participating in either a self or guided tour of the facilities (23%) or purchasing other merchandise (24%). Only 14% indicated that they ate at the restaurant on site. There were very few differences by origin. Those from outside were not only considerably less likely to purchase the wine (54%), but they were also slightly less likely to purchase any other merchandise (20%). The purchase of other merchandise was highest among travellers from other Canadian provinces (32%). 58
60 Table 39: Other activities participated in at the winery by origin Okanagan Valley Wine Consumer Research Study - Summer 2008 Leisure Travellers (n=1,743) BC (n=898) Alberta (n=447) Other (n=229) Outside (n=169) Taste wine 84.9% 85.2% 84.3% 86.9% 82.2% Buy wine 71.3% 73.3% 74.7% 69.4% 54.4% Take a self/guided tour 22.6% 19.6% 25.3% 27.1% 25.4% Buy other merchandise 23.8% 20.9% 27.1% 31.9% 19.5% Eat at a restaurant 14.4% 14.1% 14.1% 15.3% 15.4% Once again, interestingly, there were no practical differences observed in terms of the different activities included in the visits of high and low interest wine travellers. Although high interest wine travellers were more likely to taste wine, purchase wine, purchase other merchandise and eat at the winery restaurants, the percentage who did so was only slightly higher than among those for whom wine touring was of limited or no importance to their trip. For example, although nearly three quarters (74%) of high interest wine travellers purchased wine, nearly as many (68%) low interest wine travellers also made wine purchases. Other activities participated in at the winery Importance of wine touring in trip planning Taste wine Buy wine Take a self/guided tour Buy other merchandise Eat at a restaurant 23% 23% 22% 26% 12% 16% 81% 88% 68% 74% 0% 20% 40% 60% 80% 100% Low Interest (n=785) High Interest (n=958) Figure 25. Which of the activities listed did you include in your visit to the winery showing importance of wine touring in trip planning (low and high interest). Participants in the follow-up survey were asked to indicate their level of interest in attending a number of different activities that could take place at a winery in the Okanagan Valley. The activities mentioned included the outdoor screening of a movie, a live concert, a food and wine pairing seminar, and a food and wine pairing dinner. Additionally, participants were able to write in an additional activity that they would be interested in attending. Overall, the highest percentage of leisure travellers mentioned they were either very or somewhat interested in a food or wine pairing dinner. This item was appealing to 85% of all leisure travellers who responded. Over three quarters 59
61 were also interested in a live concert (80%) and a food and wine pairing seminar (77%). The lowest level of interest was for an outdoor movie screening, which was of interest to just under half (48%) of all leisure travellers. Other events mentioned by survey participants included courses and seminars in wine, culinary arts, and other areas (n=12), other arts and cultural activities including art shows, theatre, music and other activities (n=11), other outdoor activities including golf, hiking, cycling and other activities (n=10), touring activities (n=6), and other (n=3). There were only small differences in levels of interest in these activities by origin. Travellers from outside indicated the lowest levels of interest in live concert events (67% compared to 83% of travellers from British Columbia) and food and wine pairing seminars (65% compared to 83% of residents from other Canadian provinces). Table 40: Percentage of travellers who indicated they were either very or somewhat interested in attending the following activities at a winery in the Okanagan Valley by origin Leisure Travellers (n=493) 1 BC (n=273) Alberta (n=121) Other (n=69) Outside (n=33) Outdoor screening of a movie 47.9% 50.6% 44.9% 46.4% 38.5% Live concert 79.6% 82.5% 78.5% 76.7% 66.7% Food & wine pairing seminar 77.1% 76.0% 79.3% 83.1% 64.5% Food & wine pairing dinner 85.2% 85.3% 87.4% 84.1% 78.1% 1. Sample sizes shown are based on the highest number of valid response reported across all items presented. Individual sample sizes for each item reported vary slightly. High and low interest wine travellers were virtually identical in terms of their interest in attending other activities at wineries in the Okanagan Valley. High interest wine travellers did, however, show a higher level of interest compared to low interest travellers in each of the activities listed. The greatest difference was seen in the level of interest for food and wine pairing seminars. A total of 80% of high interest wine travellers were either very or somewhat interested in this activity, compared to 72% of low interest travellers. 60
62 Interest in other activities at Okanagan Valley wineries Importance of wine touring in trip plannng Outdoor screening of a movie 47% 48% Live concert Food & wine pairing seminar Food & wine pairing dinner 79% 80% 72% 80% 81% 88% Low Interest (n=197) 0% 20% 40% 60% 80% 100% High Interest (n=296) Figure 26. Percentage of travellers who indicated they were either very or somewhat interested in attending each activity at a winery in the Okanagan Valley showing importance of wine touring in trip planning (low and high interest). Over three quarters (79%) of all independent leisure travellers indicated that they had participated in wine touring prior to this trip. Of those repeat wine tourists, they were asked what other wine destinations they had visited before. Among leisure travellers who stated that they had participated in wine touring in the past, the nearly half (44%) indicated they had previously visited a winery in somewhere in. Of those who stated they had previously visited a winery in, over three quarters (78%) specifically mentioned a wine region in British Columbia. Within British Columbia, over half (58% or 20% of the total sample of repeat wine touring participants) mentioned a winery in the Vancouver Island and Gulf Island region with 45% (15% of all repeat wine touring participants) having visited a winery in the Fraser Valley. A third had visited a winery in the US, with the vast majority (85% or 28% of all repeat wine touring participants) having visited a winery in California. Nearly a third (29%) also mentioned that they had visited a winery outside of either or the United States. There were marked practical differences in the percentage of repeat wine touring participants who mentioned visiting wineries in different regions by markets of origin. BC resident repeat, wine touring participants were considerably more likely to have visited a winery in the province, especially compared to those from other Canadian provinces and outside of (49% compared to 13% and 11%, respectively). This difference carries into the differences observed in terms of the wine regions visited throughout. A third (33%) of visitors from other Canadian provinces had visited a winery in Ontario compared to only 14% from British Columbia and 5% from outside of. Repeat wine touring participants from Alberta and those from other Canadian provinces were also considerably less likely to have visited a winery in the United States, whereas those from outside were more likely to have visited an international wine region, in particular, in another part of Europe. 61
63 Table 41: Other winery regions visited by repeat wine touring participants by origin Leisure Travellers (n=1,536) BC (n=846) Alberta (n=341) Other (n=182) Outside (n=167) British Columbia 34.1% 48.7% 20.5% 12.6% 11.4% Other Thompson Okanagan 2.1% 2.2% 2.9% 1.1% 1.2% Vancouver Island 19.9% 28.1% 12.3% 8.2% 6.0% Fraser Valley 15.2% 24.2% 4.4% 4.4% 3.6% Other BC 3.2% 4.0% 3.2% 1.1% 1.2% 43.6% 53.9% 33.1% 41.2% 15.0% British Columbia 34.1% 48.7% 20.5% 12.6% 11.4% Ontario 15.9% 13.9% 17.0% 33.0% 4.8% Other 3.1% 2.0% 5.9% 5.5% 0.0% United States 32.6% 38.5% 20.5% 21.4% 39.5% California 27.7% 33.7% 17.9% 17.0% 28.7% Oregon 4.6% 5.7% 1.2% 2.7% 7.8% Washington 6.5% 7.3% 1.8% 2.7% 16.2% Other US 4.9% 3.5% 2.6% 7.1% 13.8% International 29.4% 30.6% 21.1% 28.0% 41.9% Italy 9.6% 8.6% 6.2% 14.8% 15.6% France 15.0% 15.1% 9.4% 18.7% 22.2% Other Europe 12.2% 12.1% 7.0% 13.2% 22.8% Australia / New Zealand 9.1% 9.1% 7.0% 5.5% 17.4% Other International 4.5% 4.7% 2.9% 0.5% 10.8% Also, as previously discussion, 76% of low interest wine travellers and 82% of high interest wine travellers indicated that they were repeat wine touring travellers. There was a practically significant difference between high interest and low interest wine travellers in terms of the percentage of repeat wine touring participants who stated they had previously visited a winery in all regions with the exception of international wine regions. Over a third (38%) of high interest wine travellers compared to just over one quarter (27%) of low interest travellers had participated in a wine tour within the province in the past. The largest differences were seen among those who had visited wineries on Vancouver Island and the Gulf Islands (21% of high interest compared to 16% of low interest wine travellers) and those who had travelled to a winery in the Fraser Valley (19% of high interest compared to 11% of low interest wine travellers). These differences remained consistent among those who stated they had visited a wine region in all of (including British Columbia) with half (50%) high interest and a third (33%) of low interest wine travellers mentioning a wine region in. Within, 19% of high interest and 12% of low interest wine travellers indicated they had visited a wine region in Ontario. Nearly one quarter (24%) of low interest wine travellers and well over a third (37%) of high interest wine travellers stated that they had previously visited a winery in the United States. Those who 62
64 visited a winery in California made up the bulk of visitors with 20% of low interest and 31% of high interest travellers stating they had visited this state to participate in wine touring. The differences in the percentage of low interest compared to high interest wine travellers who visited international wine regions was not as pronounced. A third (33%) of high interest and one quarter (25%) of low interest wine travellers mentioned wineries in other countries with those who had visited wineries in France (18% high interest, 12% low interest), Italy (11% high interest, 8% low interest), other Europe (13% high interest, 12% low interest), and Australia/New Zealand (10% high interest and 8% low interest) representing the vast majority of all global wine regions visited. Wine regions visited by repeat wine touring participants Importance of wine touring in trip planning 60% 50% 50% 40% 30% 27% 38% 33% 37% 24% 25% 33% 20% 10% 0% British Columbia United States International Low Interest (n=593) High Interest (n=788) Figure 27. All wine regions visited by repeat wine touring participants showing importance of wine touring in trip planning (low and high interest). On the follow-up survey, leisure travellers were asked to indicate how many bottles of wine they had purchased and brought home with them from the Okanagan Valley and the percent of the total trip expenditures that were related to wine purchases that were not consumed during the trip. On average, travellers indicated they purchased 21 bottles. It should be noted that nearly one tenth (9%) indicated they purchased 50 or more bottles (over 4 cases), which has an influence on this reported average. Among all leisure travellers the median number of bottles purchased was 10 with the largest group (40%) indicating that they purchased nine or fewer bottles and nearly one quarter (23%) purchasing between 10 and 19 bottles. Leisure travellers indicated that on average wine purchases accounted for 20% of their total trip expenditures (median of 15%). There were some practical differences in the volume of wine purchased by origin with those from Canadian provinces and outside more likely to purchase fewer bottles. It is expected that this is related to logistical challenges and restrictions on transporting alcohol while travelling. Well over half of both those from other Canadian provinces and those from outside (60% and 62%, respectively) reported purchasing between one and nine bottles. Among British Columbia and 63
65 Alberta residents approximately a third (36% and 33%, respectively) purchased between one and nine bottles. The opposite was seen at the upper end of the scale with only 4% of residents from other Canadian provinces and 6% of those from outside purchasing 30 or more bottles. Among British Columbia and Alberta residents, approximately one quarter (22% and 27%, respectively) purchased and brought home 30 or more bottles of wine. Given the findings above, it is not surprising to find practical differences in the percent of total trip expenditures allocated to wine purchases by origin. Travellers from British Columbia reported that, on average, wine purchased accounted for nearly one quarter (23%, median 20%) of their total trip expenditures. Travellers from other Canadian provinces and those from outside reported that wine purchased accounted for a lower percentage of their total trip expenditures. On average, residents of other Canadian provinces and those from outside reported that wine purchases represented 12% of their total trip expenditures (median of 10% and 5%, respectively). Table 42: Bottles of wine purchased in the Okanagan Valley and taken home by origin Leisure Travellers (n=530) BC (n=289) Alberta (n=135) Other (n=72) Outside (n=34) None 5.3% 4.5% 6.7% 4.2% 8.8% 1 to % 35.6% 33.3% 59.7% 61.8% 10 to % 26.3% 19.3% 18.1% 20.6% 20 to % 11.4% 14.1% 13.9% 2.9% 30 or more 19.8% 22.1% 26.7% 4.2% 5.9% Average bottles purchased Median bottles purchased Average percent spent on wine 20.2% 23.3% 19.9% 12.3% 11.8% Median percent of total expenditures spent on wine 15.0% 20.0% 15.0% 10.0% 5.0% There were considerable practical differences observed in terms of the number of bottles of wine purchased and taken home by high interest compared to low interest wine travellers. As expected, those for whom wine touring played an important role in trip planning were much more likely to purchase more bottles of wine. While 11% of low interest travellers did not purchase any bottles of wine, only 1% of high interest travellers reported the same. Well over half (55%) of low interest wine travellers purchased between one and nine bottles, while 30% of high interest wine travellers indicated the same number of purchases. Conversely, nearly a third (30%) of high interest wine travellers purchased 30 or more bottles to take home with them following their trip. The same could be said for only 5% of low interest wine travellers. Among high interest wine travellers the average number of bottles purchased was 27 (median of 16), whereas among low interest wine travellers the average was 11 (median of 6). High interest wine travellers reported that an average of 24%of their trip expenditures were spent on wine purchases (median of 20%), while for low interest travellers the average percent of total expenditures on wine was only 14% (median of 10%). 64
66 80% 60% Bottles of wine purchased in Okanagan Valley Importance of wine touring in trip planning 55% 40% 20% 0% 30% 22% 24% 30% 15% 11% 1% 7% 5% None 1 to 9 10 to to or more Low Interest (n=216) High Interest (n=314) Figure 28. Bottles of wine purchased in Okanagan Valley and taken home showing importance of wine touring in trip planning (low and high interest). Characteristics of Wine Touring Destination The follow-up survey asked independent leisure travellers to identify up to three unique characteristics that make the Okanagan Valley different from other wine vacation destinations. More than half (54%) of travellers who provided unique characteristics found that the Okanagan Valley was unique as a result of its beautiful scenery or unique geography. Over a third (38%) mentioned the climate in terms of the sunny dry weather typical of the Okanagan Valley summer, while 28% mentioned that the Okanagan was accessible by it being either close to family, friends or home or the location meant that it was enroute in their travels. Exploring the characteristics provided by those from different origins revealed that those who had travelled from further away (Canadian provinces other than British Columbia and Alberta and those from outside ) were more likely to mention the scenery and geography and less likely to indicate that the region was easily accessible from home, friends and family. Those from outside were also more likely to mention the quality and selection of wine available (33% compared to 20% of all leisure travellers). 65
67 Table 43: Characteristics of the Okanagan Valley as a wine destination by origin Okanagan Valley Wine Consumer Research Study - Summer 2008 Leisure Travellers (n=447) BC (n=249) Alberta (n=110) Other (n=58) Outside (n=30) Beautiful scenery / unique geography 53.5% 51.4% 45.5% 69.0% 70.0% Climate 38.3% 37.3% 40.9% 39.7% 33.3% Accessible / Close to family, friends or home 27.7% 30.1% 33.6% 15.5% 10.0% Wine - Quality / selection 19.9% 18.9% 18.2% 20.7% 33.3% Atmosphere / people 19.2% 19.3% 20.9% 15.5% 20.0% Wineries - Quality / selection 17.7% 18.9% 17.3% 15.5% 13.3% Other activities % 16.5% 19.1% 15.5% 20.0% Proximity of wineries / convenient 16.1% 18.5% 17.3% 6.9% 10.0% Local (BC or ) 2 7.2% 6.4% 10.0% 8.6% 0.0% Other wine/agriculture activities 3 6.7% 6.4% 7.3% 8.6% 3.3% Dining and cuisine 6.5% 7.2% 4.5% 3.4% 13.3% Value 5.6% 5.6% 7.3% 5.2% 0.0% Uncrowded/not over developed/small producers 5.1% 5.6% 3.6% 5.2% 6.7% Other 4 8.9% 10.4% 5.5% 8.6% 10.0% 1. Other activities includes a variety of activities not directly related to either wine or agriculture, including golf, swimming, cycling, hiking, casinos, aboriginal activities, arts and crafts, horseback riding, shopping, etc. 2. Local (BC or ) refers to those whose comments identified that they felt the Okanagan Valley was unique because it was in British Columbia or and did not require travellers to travel far, cross borders or travel to locations with different languages, currency or regulations. 3. Other wine/agricultural activities includes a variety of activities directly related to either wine touring or agricultural offerings of the Okanagan Valley such as orchards, farms, markets, tasting tours, festivals and wine routes. 4. Other includes cultural aspects of the trip (n=15), general comments about wine or wineries (n=13), accommodation (n=7) and additional individual responses (n=16). For the most part, low and high interest wine travellers were very similar in terms of the characteristics they listed to describe the Okanagan Valley as a unique wine vacation destination. Those who indicated that wine was of lower importance in trip planning were more likely to mention the scenery and unique geography of the region (59% compared to 50% of high interest wine travellers). Perhaps not surprisingly, however, those who indicated that wine played a more important role in trip planning were more likely to indicate that the wine quality or selection was a characteristic defining the Okanagan Valley as a wine vacation destination (25% compared to 11% of low interest wine travellers). High interest wine travellers were also more likely to mention the proximity of the wineries to one another and the convenience in being able to visit several wineries by travelling only a short distance (20% compared to 10% of low interest wine travellers) and to indicate the atmosphere was a unique characteristic of the Okanagan Valley (22% compared to 15% of low interest travellers). These comments included those who indicated that the people they met while travelling were friendly and helpful, and those who appreciated the casual, peaceful, laidback atmosphere of the region. The percentage of high and low interest wine travellers who specifically mentioned either the 66
68 quality or selection of wineries in the Okanagan Valley was nearly even with 19% of high interest and 16% of low interest wine travellers citing this. Characteristics of the Okanagan Valley as a wine destination Importance of wine touring in trip planning Beautiful scenery / unique geography Climate Accessible / Close to family, friends or home Wine - Quality / selection Atmosphere / people Wineries - Quality / selection Other activities Proximity of wineries / convenient Local (BC or ) Other wine/agriculture activities Dining and cuisine Value Uncrowded / not over developed / small producers Other 29% 27% 11% 25% 15% 22% 16% 19% 16% 18% 10% 20% 8% 7% 9% 5% 5% 8% 4% 7% 4% 6% 10% 8% 37% 39% 50% 59% 0% 20% 40% 60% Low Interest (n=170) High Interest (n=277) Figure 29. Unique Characteristics of the Okanagan Valley as a wine vacation destination showing importance of wine touring in trip planning (low and high interest). When asked about the unique characteristics of British Columbia as a wine vacation destination, participants in the follow-up survey responded very similarly to unique characteristics of the Okanagan Valley. Beautiful scenery and the unique geography of the province were indicated most often (55%) and nearly a third (32%) mentioned that the province was accessible or close to family, friends or home. Considerably fewer participants (18%) mentioned the climate or provincial weather as a unique attribute. Travellers from Canadian provinces other than British Columbia and Alberta were most likely to mention the scenery or unique geography of the province (67% compared to 55% of all leisure travellers), while these travellers and those from outside were less likely to indicate the province was easily accessible or convenient for them (17% of other Canadian residents and 12% of those from outside ). Travellers from Alberta were most likely to indicate the province was accessible to them; nearly half (45%) mentioned this characteristic. The atmosphere or friendliness of British Columbia was mentioned by only 4% of those from other Canadian provinces, whereas among those from outside of this reached a high of 28%. Nearly a third (30%) of those from other 67
69 Canadian provinces mentioned the other activities (other than wine and agricultural activities) available for them to participate in as a unique characteristic of the province. Table 44: Characteristics of British Columbia as a wine destination by origin Leisure Travellers (n=366) BC (n=209) Alberta (n=86) Other (n=46) Outside (n=25) Beautiful scenery / unique geography 54.9% 53.1% 52.3% 67.4% 56.0% Accessible / Close to family, friends or home 31.7% 31.6% 45.3% 17.4% 12.0% Climate 18.3% 14.8% 24.4% 21.7% 20.0% Wine - Quality / selection 18.0% 16.3% 15.1% 26.1% 28.0% Atmosphere / people 16.1% 18.7% 12.8% 4.3% 28.0% Other activities 16.1% 12.4% 15.1% 30.4% 24.0% Local (BC or ) 13.1% 14.4% 15.1% 10.9% 0.0% Wineries - Quality / selection 9.0% 9.1% 7.0% 13.0% 8.0% Value 8.5% 12.0% 5.8% 2.2% 0.0% Uncrowded/not over developed/small producers 6.8% 8.6% 3.5% 2.2% 12.0% Variety / New or unique 6.3% 7.2% 5.8% 4.3% 4.0% Dining and cuisine 1 4.4% 5.7% 1.2% 2.2% 8.0% Proximity of wineries / convenient 1 4.1% 4.3% 4.7% 2.2% 4.0% Other wine/agriculture activities 1 1.9% 1.4% 2.3% 4.3% 0.0% Other % 16.7% 11.6% 6.5% 28.0% 1. Small sample size (i.e. under 20 respondents) requires that results should be interpreted with caution. 2. Other includes general comments about wine or wineries (n=12), cultural aspects of the trip (n=9), accommodation (n=8) and additional individual responses (n=32). High and low interest wine travellers provided very similar responses when asked about the unique characteristics of British Columbia as a wine vacation destination. The only category on which there was any appreciable difference was among those who commented about the quality and selection of wines available. Understandably, those who indicated that wine touring was of higher importance in trip planning were more likely to mention wine quality and selection compared to those for whom wine touring was of lower importance (23% compared to 10% of low interest wine travellers). This was similar to that seen above. 68
70 Characteristics of British Columbia as a wine destination Importance of wine touring in trip planning Beautiful scenery / unique geography Accessible / Close to family, friends or home Climate Wine - Quality / selection Other activities Atmosphere / people Local (BC or ) Wineries - Quality / selection Value Uncrowded / not over developed / small producers Variety / New or unique Dining and cuisine Proximity of wineries / convenient Other wine/agriculture activities Other 17% 19% 10% 23% 18% 15% 18% 15% 14% 13% 10% 8% 6% 10% 7% 7% 7% 6% 3% 5% 2% 5% 1% 2% 14% 16% 31% 32% 54% 55% 0% 20% 40% 60% Low Interest (n=136) High Interest (n=230) Figure 30. Unique Characteristics of British Columbia as a wine vacation destination showing importance of wine touring in trip planning (low and high interest). Satisfaction with Wine Touring & Overall Trip In an effort to better understand the components of planning, purchasing and taking an Okanagan Valley wine trip that are the highest of importance to visitors, respondents were asked to rank the satisfaction and importance for various trip factors on a scale of 1 to 5 (with 1 being Very Satisfied/Important and 5 being Not at all Satisfied/Important). The results of importance vs. satisfaction ratings are summarized in scatter graph format. Respondents who stated no opinion or did not provide a response were removed from the average calculations. The factor listed as most important while planning, purchasing and while on their wine trip was understanding the Wineries offering guided tours (mean=4.64). Importantly, this element also received the second highest rating in terms of travellers satisfaction (mean=4.41), indicating that wine travellers feel that it is important to able to visit a destination that offered guided tours of wineries and the Okanagan Valley is excelling in this area. The second most important component was the level of customer service at the winery (mean=4.5). This factor received the highest satisfaction rating of 69
71 the seventeen components asked, indicating that the level of customer service offered at Okanagan Valley wineries is meeting and possibly exceeding visitors expectations. Most of the 17 factors were found to be Somewhat Important such as: Wineries offering food & beverage services and Wineries offering retail services, however, five aspects received somewhat not important mean scores (<3.0). The component that received the lowest importance rating was Offering packages with my trip including accommodation, transportation and/or other activities (mean=2.35). This accessibility factor also received the lowest satisfaction rating (mean = 3.00) indicating that while it was the lowest rated component in terms of visitor satisfaction, it was not of high important to the visitor. All seventeen factors received scores of at least somewhat satisfied (mean >3.0) Importance & Satisfaction with planning and experiencing trip Low Satisfaction High J Aspect: K A. Printed Winery Brochure B. Detailed info in Brochure C. Detailed winery info websites D. Understand best time of year to visit E. Understand how to prepare/bring F. Different wine tours/wineries available G. Different varietals available at wineries H. Winery's "wines in stock" list I. What other people thought of past trips Low Q I E A Importance B H D C G F N P O Aspect: J. Ability to purchase/book tours online K. Packages includ. accom, transp. and/or other L. Staffs' level of wine knowledge M. Level of customer service at winery N. Wineries offering guided tours O. Wineries offering food/beverage service P. Wineriesoffering retail services Q. Wineries offering accommodation L M High Figure 31. Destinations of future wine vacation destinations outside British Columbia showing importance of wine touring in trip planning (low and high interest). There were some noteworthy practical differences observed between high and low interest wine travellers in terms of the factors that were important to them while trip planning, purchasing or while traveling. Having a printed brochure from the individual wineries was more important for high interest wine travellers with half (50%) indicating this was either very or somewhat important to them (compared to 40% of low interest travellers). In their search for information for travel planning, high interest wine travellers also were much more likely to provide a high importance ranking to finding detailed information online about BC wineries. This was rated as either very or somewhat important by nearly three quarters (73%) of high interest wine travellers compared to just over half (52%) of those for whom wine touring was less important in trip planning. 70
72 High interest wine travellers also placed greater importance on understanding the best time of year to travel (68% compared to 48% of low interest wine travellers), understanding the different kinds of tours and wineries available to visit (76% compared to 60% of low interest travellers), understanding the different varietals available (69% compared to 57%), understanding a wineries wines-in-stock list (64% compared to 41%), and wineries offering food and beverage services (78% compared to 67%). Additionally, even though the differences on all other factors were not of practical significance, high interest wine travellers rated each item of more importance compared to those for whom wine touring was of lesser importance. This would appear to indicate that those with a high interest in wine touring place a greater importance generally on the ability to access information for trip planning, purchasing and while travelling, in particular as it pertains to specific details about wines and wineries. Importance of various factors in trip planning and purchase decisions Importance of wine touring in trip planning Having a printed brochure from individual wineries Finding detailed information in printed brochures Finding detailed information online about wineries Understanding the best time of year to go Understanding how I should prepare/what to bring Understanding different tours/wineries to visit Understanding different varietals available Understanding a winery's "wines-in-stock" list Understanding what other people thought of past trips Ability to purchase/book tours online Offering packages with my trip Staffs' level of wine knowledge Level of customer service at the winery Wineries offering guided tours Wineries offering food & beverage services Wineries offering retail services Wineries offering accommodations 40% 50% 56% 61% 52% 73% 48% 68% 28% 37% 60% 76% 57% 69% 41% 64% 35% 38% 23% 27% 18% 20% 63% 64% 67% 78% 69% 75% 24% 26% 89% 96% 93% 98% 0% 20% 40% 60% 80% 100% Low Interest (n=195) High Interest (n=303) Figure 32. Percentage of leisure travellers who reported either very or somewhat important for each of the factors listed in terms of trip planning, trip purchasing, and while traveling showing importance of wine touring in trip planning (low and high interest). 71
73 There were only a few practical differences observed in terms of level of satisfaction of high and low interest wine travellers. High interest wine travellers reported higher levels of satisfaction on having a printed brochure from individual wineries (63% very or somewhat satisfied compared to 50% of low interest wine travellers). High interest wine travellers were also more likely to report higher levels of satisfaction with finding information online about BC wineries (67% compared to 51% of low interest wine travellers), understanding different tours and wineries to visit (67% compared to 56%), and wineries offering food and beverage services (70% of high interest compared to 58% of low interest wine travellers who indicated they were satisfied). Satisfaction with trip planning and purchase decisions Importance of wine touring in trip planning Having a printed brochure from individual wineries Finding detailed information in printed brochures Finding information online about BC wineries Understanding the best time of year to go Understanding how I should prepare/what to bring Understanding different tours/wineries to visit Understanding different varietals available Understanding a winery's "wines-in-stock" list Understanding what other people thought of past trips Ability to purchase/book tours online Offering packages with my trip Staffs' level of wine knowledge Level of customer service at the winery Wineries offering guided tours Wineries offering food & beverage services Wineries offering retail services Wineries offering accommodations 30% 36% 35% 39% 19% 27% 15% 21% 21% 26% 50% 63% 61% 61% 51% 67% 51% 61% 56% 67% 63% 68% 48% 57% 51% 49% 58% 70% 69% 75% 90% 94% 91% 92% 0% 20% 40% 60% 80% 100% Low Interest (n=159) High Interest (n=263) Figure 33. Percentage of leisure travellers who reported either very or somewhat satisfied with each of the factors listed in terms of trip planning, trip purchasing, and while traveling showing importance of wine touring in trip planning (low and high interest). Well over three quarters (79%) of all leisure travellers indicated that they were very satisfied with their wine touring experience in the Okanagan Valley. An additional 13% of participants in the follow-up survey mentioned that they were somewhat satisfied, which results in a total of 92% of all 72
74 participants indicating that they were satisfied with their experience. There were no practical differences observed in terms of the level of satisfaction by travellers from different origins. When respondents were asked to explain the satisfaction rating they provided for their wine touring experience in the Okanagan Valley the vast majority of comments were positive. Nearly one half (46%) of the responses provided were related to a high level of service or the amenities (including accommodation). An additional 34% were related to high quality wine and food, while 26% were related to the relaxed atmosphere or friendliness of the people. One fifth (20%) of the responses included a negative comment or felt that there was a service or amenity that was lacking. These included comments regarding the lack of a complete tour of the wine processing facilities, no children s programs provided, poor accommodation, expensive wine, and a lack of information available (See Appendix C for full commentary). 100% Level of satisfaction with wine touring experience in the Okanagan Valley Visitor origin 80% 60% 40% 20% 0% Very dissatisfied Somewhat dissatisfied Neither satisfied or dissatisfied Somewhat satisfied Very satisfied BC Alberta Other Outside Figure 34. Level of satisfaction with wine touring experience in Okanagan Valley showing origin. 73
75 Reasons for level of satisfaction with wine touring experience Importance of wine touring in trip planning Good service / amenities High quality Atmosphere (friendly, peaceful, etc) Negative - something needed Educational / informative Scenery / wildlife Climate Variety Accessible 7% 7% 13% 19% 16% 20% 26% 34% 46% 0% 20% 40% 60% Figure 35. Explanations provided for level of satisfaction rating for wine touring experience in Okanagan Valley. A total of 70 responses were received for this question. Multiple responses were permitted. Only categories receiving 5% or more of the total responses are shown. While both high interest and low interest wine travellers both showed high levels of satisfaction with their wine touring experience in the Okanagan Valley, high interest wine travellers were more likely to indicate that they were very satisfied (84% compared to 72% of low interest travellers). Conversely, low interest wine travellers were more likely to state that they were somewhat satisfied (18% compared to 9% of high interest wine travellers). 100% 80% Level of satisfaction with wine touring experience in the Okanagan Valley Importance of wine touring in trip planning 72% 84% 60% 40% 20% 0% 3% 5% 4% 2% 3% 0% Very dissatisfied Somewhat dissatisfied Neither satisfied or dissatisfied 18% 9% Somewhat satisfied Very satisfied Low Interest (n=205) High Interest (n=312) Figure 36. Responses to the question, Overall, how satisfied or dissatisfied were you with your wine touring experience in the Okanagan Valley? showing importance of wine touring in trip planning (low and high interest). 74
76 When asked to indicate the level of satisfaction with their total trip in British Columbia, the vast majority (89%) of all leisure travellers indicated they were very satisfied, while nearly all of the remainder (7%) mentioned that they were somewhat satisfied. Overall, 96% of all leisure travellers indicated they were satisfied with their trip (Table 56). A total of 62 participants provided comments to explain the level of satisfaction they gave for their total trip in British Columbia. Nearly a third (31%) of those who provided comments simply mentioned that they loved BC. This was followed by 29%who commented that the atmosphere was relaxed and the people friendly, and 24% who commented on the scenery and wildlife in the province. A total of 13% provided negative comments that included poor accommodation, limited amenities, costly, and poor weather conditions. There were no practical differences in level of satisfaction for the trip in British Columbia by traveller origin. The highest levels of satisfaction were from travellers from outside of (94%). Table 45. Level of Satisfaction with Total Trip to British Columbia by visitor origin. Leisure Travellers (n=514) BC (n=279) Alberta (n=133) Other (n=69) Outside (n=33) Very dissatisfied 2.7% 2.9% 3.8% 0.0% 3.0% Somewhat dissatisfied 0.8% 0.7% 1.5% 0.0% 0.0% Neither satisfied or dissatisfied 1.0% 1.4% 0.0% 1.4% 0.0% Somewhat satisfied 6.8% 6.1% 8.3% 8.7% 3.0% Very satisfied 88.7% 88.9% 86.5% 89.9% 93.9% Reasons for level of satisfaction with total trip in BC Importance of wine touring in trip planning Love BC Atmosphere (friendly, peaceful, etc) Scenery / Wildlife Climate Negative - something needed Good service / amenities Accessible Other activities 6% 5% 8% 13% 16% 24% 31% 29% 0% 20% 40% 60% Figure 37. Explanations provided for level of satisfaction rating for total trip in British Columbia. A total of 62 responses were received for this question. Multiple responses were permitted. Only categories receiving 5% or more of the total responses are shown. 75
77 Comparing low and high interest wine travellers in terms of the level of satisfaction with the total trip in British Columbia revealed virtually no difference. Level of satisfaction with the total trip in British Columbia Importance of wine touring in trip planning 100% 80% 88% 89% 60% 40% 20% 0% 2% 3% 1% 1% 1% 1% Very dissatisfied Somewhat dissatisfied Neither satisfied or dissatisfied 7% 7% Somewhat satisfied Very satisfied Low Interest (n=202) High Interest (n=312) Figure 38. Responses to the question, Overall, how satisfied or dissatisfied were you with your total trip in British Columbia? showing importance of wine touring in trip planning (low and high interest). Likelihood of Future Leisure Travel Over half of all leisure travellers (51%) indicated that they would be likely to take a return trip to Okanagan Valley wineries in the next two years, with the bulk of this group stating that this return trip was very likely (40% of all leisure travellers). Less than a third (29%) indicated that they were not at all likely to return. Practical differences were observed in the likelihood of return to wineries in the Okanagan Valley, particularly among those from Canadian provinces other than British Columbia and Alberta and those from outside. Travellers from other and outside were considerably more likely to indicate they were somewhat likely to return (23% and 29%, respectively). Interestingly, fewer travellers from these origins stated that they would be not at all likely to return (16% of those from other Canadian provinces and 12% of those from outside. British Columbia residents were virtually evenly divided with 43% stating they were very likely to return and 35% stating they were not at all likely to return. 76
78 Likelihood of another wine touring leisure trip in the Okanagan Valley in the next 2 years 0% 20% 40% 60% 80% 100% Leisure Travellers 40.3% 10.4% 11.7% 8.4% 29.2% BC 43.4% 7.7% 6.3% 7.7% 35.0% Alberta 38.6% 11.4% 12.9% 9.1% 28.0% Other 34.8% 15.9% 23.2% 10.1% 15.9% Outside 32.4% 17.6% 29.4% 8.8% 11.8% Very Likely Likely Somewhat likely Not likely Not at all likely Figure 39. Likelihood of taking another leisure trip that involves visiting wineries in the Okanagan Valley in the next two years showing markets of visitor origin. There were considerable differences in the likelihood of a return trip to visit the wineries of the Okanagan Valley by high and low interest wine travellers. Those for whom wine travel was an important component in trip planning were far more likely to indicate that they were very likely to return (79% compared to 37% of low interest travellers). Among all other likelihood categories, however, there were no appreciable differences observed. Likelihood of return trip to wineries in the Okanagan Valley Importance of wine touring in trip planning 100% 80% 79% 60% 40% 37% 30% 29% 20% 12% 14% 9% 10% 8% 9% 0% Very Likely Likely Somewhat likely Not likely Not at all likely Figure 40. Low Interest (n=213) High Interest (n=308) Likelihood of taking another leisure trip that involves visiting wineries in the Okanagan Valley in the next two years showing importance of wine touring in trip planning (low and high interest). 77
79 Leisure travellers were far less likely to indicate that they would be likely to take another trip in the next two years that involved visiting wineries in other regions of British Columbia compared to the Okanagan Valley. Overall, just over a third (38%) indicated that such a trip would be likely, with just 20% of all travellers indicating that a trip to a winery in another British Columbia region would be very likely. A third (33%) stated that this future trip would be either not likely or not at all likely. There were no practical differences observed by traveller origin. Table 46: Likelihood of taking another leisure trip in the next two years that includes visiting wineries in other regions in British Columbia by origin Leisure Travellers (n=460) BC (n=246) Alberta (n=118) Other (n=64) Outside (n=32) Very Likely 20.4% 21.1% 16.1% 21.9% 28.1% Likely 17.8% 15.9% 19.5% 21.9% 18.8% Somewhat likely 28.9% 31.7% 28.0% 21.9% 25.0% Not likely 17.6% 13.4% 23.7% 21.9% 18.8% Not at all likely 15.2% 17.9% 12.7% 12.5% 9.4% High and low interest wine travellers were virtually identical in terms of the likelihood of taking a trip in the next two years that included a visit to a winery in another region of British Columbia. 100% Likelihood of return trip to wineries in other regions in British Columbia Importance of wine touring in trip planning 80% 60% 40% 20% 22% 18% 20% 16% 30% 28% 17% 18% 15% 15% 0% Very Likely Likely Somewhat likely Not likely Not at all likely Low Interest (n=192) High Interest (n=268) Figure 41. Likelihood of taking another leisure trip that involves visiting wineries in other regions of British Columbia in the next two years showing importance of wine touring in trip planning (low and high interest). 78
80 The follow-up survey asked leisure travellers to identify other destinations, both within and outside of British Columbia, they would consider for future wine vacations. Just over half (54%) indicated that they would select a destination in the Okanagan again. This was followed fairly closely by 52% who indicated that they would select a destination in the Vancouver Island region (including the Gulf Islands). There was some variation in terms of the British Columbia destination listed by those from other Canadian provinces and those from outside compared to travellers from British Columbia and Alberta. Those from outside were most likely to indicate another destination in the Okanagan Valley (87%) followed by those from Alberta (73%). Travellers from Alberta were considerably less likely (59%), but those from British Columbia were least likely (46%). Travellers from British Columbia were more likely to indicate a destination on Vancouver Island (58%) than another destination in the Okanagan Valley. Table 47: BC destinations considered for future wine vacations by origin Leisure Travellers (n=289) BC (n=179) Alberta (n=65) Other (n=30) Outside (n=15) Okanagan Valley 53.6% 45.8% 58.5% 73.3% 86.7% Other Thompson Okanagan 1 1.7% 1.7% 1.5% 0.0% 6.7% Vancouver Island and the Gulf Islands 52.2% 58.1% 47.7% 33.3% 40.0% Lower Mainland (including Fraser Valley) 19.0% 21.2% 13.8% 16.7% 20.0% Other British Columbia 1 6.2% 7.3% 4.6% 6.7% 0.0% 1. Small sample size (i.e. under 20 respondents) requires that results should be interpreted with caution. High and low interest wine travellers were virtually identical in terms of the British Columbia destinations for future wine vacations listed. There was also a relatively even split between those who selected destinations in the Okanagan Valley and those who mentioned possible future travel to a destination on Vancouver Island or in the Gulf Islands. 79
81 BC destinations considered for future wine vacations Importance of wine touring in trip planning 80% 60% 54% 53% 51% 53% 40% 20% 0% 2% 2% 19% 19% 3% 8% Okanagan Valley Other Thompson Okanagan Vancouver Island and the Gulf Islands Lower Mainland (including Fraser Valley) Other British Columbia Figure 42. Low Interest (n=109) High Interest (n=180) Destinations of future wine vacation destinations within British Columbia showing importance of wine touring in trip planning (low and high interest). Among leisure travellers who indicated on the follow-up survey a destination outside of BC that they would consider for future wine vacations, destinations in the United States were listed most often. Over two thirds (68%) of leisure travellers mentioned a destination in the United States with 50% of travellers considering a possible future wine vacation to California. International destinations were mentioned by over half (58%) with a third (33%) considering a possible future wine vacation in France. Nearly one quarter (23%) mentioned a possible trip to Italy, and, a quarter (26%) mentioned that they would consider a future wine vacation to another location in. Of which the vast majority of these comprised of possible future trips to Ontario (23%). Travellers from Alberta and other Canadian provinces were most likely to indicate that they would consider a trip to a destination outside of BC but within. Over half (54%) of those from other Canadian provinces mentioned they would consider another destination in. Travellers from British Columbia were more likely to indicate a possible future trip to the United States. Over three quarters (76%) of British Columbia leisure travellers mentioned the United States, in particular California (67%), while less than half of travellers from other Canadian provinces (44%) and outside (47%) indicated a possible trip to the US. Travellers from other Canadian provinces were considerably more likely to mention an international destination for a future wine vacation. Nearly three quarters (71%) mentioned they would consider international destinations compared to only 55% of leisure travellers from British Columbia. 80
82 Table 48: Destinations outside British Columbia considered for future wine vacations by origin Leisure Travellers (n=364) BC (n=213) Alberta (n=84) Other (n=48) Outside (n=19) 25.5% 16.0% 35.7% 54.2% 15.8% Ontario 22.5% 14.6% 31.0% 47.9% 10.5% Other 1 5.2% 1.9% 10.7% 8.3% 10.5% US 67.9% 75.6% 66.7% 43.8% 47.4% California 60.4% 66.7% 63.1% 43.8% 21.1% Oregon 12.6% 13.6% 14.3% 6.3% 10.5% Washington 14.3% 18.3% 9.5% 4.2% 15.8% Other US 1 1.6% 1.4% 2.4% 0.0% 5.3% International 57.7% 54.5% 58.3% 70.8% 57.9% Italy 22.8% 20.2% 25.0% 35.4% 10.5% France 33.0% 35.2% 21.4% 41.7% 36.8% Other Europe 14.8% 14.6% 14.3% 12.5% 26.3% Australia / New Zealand 14.0% 15.0% 13.1% 10.4% 15.8% Other International 8.8% 6.6% 11.9% 10.4% 15.8% 1. Small sample size (i.e. under 20 respondents) requires that results should be interpreted with caution. Both high and low interest wine travellers provided similar responses when asked about wine vacation destinations outside of British Columbia. High interest wine travellers were, however, slightly more likely to have reported a wine destination outside of British Columbia for each possible destination category. The difference was greatest among those who mentioned possible future wine vacations to the United States (70% for high interest wine travellers, compared to 64% for low interest travellers). 80% 60% Destinations outside British Columbia considered for future wine vacations Importance of wine touring in trip planning 64% 70% 57% 58% 40% 20% 23% 27% 0% US International Low Interest (n=132) High Interest (n=232) Figure 43. Destinations of future wine vacation destinations outside British Columbia showing importance of wine touring in trip planning (low and high interest). 81
83 Competitiveness of Okanagan Valley Wine & Destination On the follow-up survey leisure travellers were asked to indicate how they felt that a VQA bottle of wine from the Okanagan Valley compared to a similar bottle from different wine regions in terms of quality, price and overall value. Participants could indicate that: a. The Okanagan Valley wine was better, b. The wine from the other region was better, or c. There was no difference between the two. In terms of quality, nearly three quarters of participants (74%) indicated that the Okanagan Valley wine was better when compared with a similar bottle from another BC wine region. Slightly fewer (69%) indicated that the Okanagan Valley wine was better when compared with a wine from Ontario. Okanagan Valley wines, however, ranked the lowest in terms of quality when compared with wines from Europe and Australia (only 23% each rated the Okanagan wine superior compared to wines from these regions). Okanagan Valley wines were ranked comparably lower in terms of price. Just over a third of leisure travellers indicated that Okanagan Valley wines were better in terms of price when compared to wines from other BC regions (37%), Ontario (34%), and Europe (34%). On the lower end of the scale, only 18% indicated that Okanagan Valley wines were better than comparable wine from Chile in terms of price. When wines from the Okanagan Valley were compared to the other wine producing regions in terms of overall value, the Okanagan Valley wines fared better. Approximately two thirds of leisure travellers ranked the Okanagan Valley wine superior on overall value when compared to wines from other BC wine regions (67%) and Ontario (65%). Just over one quarter of travellers (27%) felt that Okanagan wines were superior to wines from Australia in terms of overall value, while a third (34%) believed Okanagan wines were better in terms of overall value when compared to wines from Europe. For the most part, there were few practical differences observed by origin of participant. Residents of other Canadian provinces were less likely to rank Okanagan Valley wines superior to wines from Ontario in terms of quality, while they were more likely to rate the quality wines from the Okanagan as superior to wines from Chile. Residents of Alberta were more likely to indicate that Okanagan Valley wines were better in terms of price and overall value compared to wines from Europe. 82
84 Table 49: Percentage of travellers who rated the Okanagan Valley wine better in terms of quality, price and overall value compared to select other wine regions by origin Leisure Travellers (n=353) 1 BC (n=206) Alberta (n=79) Other (n=46) Outside (n=22) Quality Other BC regions 73.9% 75.7% 70.9% 69.6% 77.3% Ontario 68.6% 71.4% 67.6% 56.8% 76.9% California 34.6% 33.9% 34.7% 39.0% 31.6% Europe 23.3% 20.6% 29.7% 25.6% 22.7% Australia 23.0% 24.3% 19.1% 20.0% 30.0% Chile 42.6% 44.0% 33.8% 54.1% 36.8% South Africa 45.3% 48.4% 39.3% 52.6% 22.2% Price Other BC regions 36.7% 35.4% 40.3% 41.5% 23.5% Ontario 34.4% 33.3% 39.7% 30.2% 33.3% California 28.6% 24.9% 36.6% 30.0% 31.6% Europe 33.8% 31.6% 45.3% 25.6% 31.6% Australia 19.9% 18.7% 25.4% 20.0% 11.1% Chile 18.3% 19.9% 19.4% 15.4% 5.9% South Africa 22.8% 20.3% 28.3% 28.9% 13.3% Overall value Other BC regions 67.1% 68.6% 63.2% 68.2% 64.7% Ontario 64.7% 67.5% 65.1% 55.8% 58.3% California 42.0% 39.7% 50.7% 43.9% 27.8% Europe 33.9% 32.3% 46.6% 20.0% 38.9% Australia 27.1% 31.0% 22.6% 19.5% 23.5% Chile 36.2% 37.5% 36.2% 31.6% 33.3% South Africa 42.5% 43.4% 46.0% 42.1% 21.4% 1. Sample sizes shown are based on the highest number of valid response reported across all items presented. Individual sample sizes for each item reported vary slightly. Exploring the percentage of high and low interest wine travellers who indicated that the VQA wines of the Okanagan Valley were superior to those from other wine regions revealed a few practical differences. High interest wine travellers were more likely to state that Okanagan wines were of superior quality compared to other BC regions (79% of high interest wine travellers compared to 65% of low interest travellers), Europe (28% compared to 15%), and Chile (48% compared to 32% among low interest wine travellers). Interestingly, high interest wine travellers were more likely to rank the Okanagan wine superior in quality than low interest wine travellers for each of the wine regions specified. 83
85 Percentage ranking quality of Okanagan Valley wine better Importance of wine touring in trip planning 100% 80% 60% 40% 20% 65% 79% 71% 63% 36% 33% 15% 28% 22% 24% 32% 48% 47% 43% 0% Other BC regions Ontario California Europe Australia Chile South Africa Figure 44. Low Interest (n=127) High Interest (n=226) Percentage of travellers who ranked Okanagan Valley VQA wine better in terms of quality than comparable wine in each region showing importance of wine touring in trip planning (low and high interest). High and low interest wine travellers were more similar in terms of the percent ranking Okanagan Valley wines superior in terms of price. There were no practical differences observed by importance of wine touring. However, low interest wine travellers were more likely than high interest wine travellers to rank Okanagan Valley wines as superior in terms of price across all regions, with the exception of wines from Chile and South Africa. When compared against these two regions, high interest wine travellers were only marginally more likely to rank Okanagan Valley wines superior. 60% Percentage ranking price of Okanagan Valley wine better Importance of wine touring in trip planning 40% 20% 38% 36% 38% 33% 30% 28% 40% 31% 25% 17% 18% 18% 21% 24% 0% Other BC regions Ontario California Europe Australia Chile South Africa Low Interest (n=127) High Interest (n=226) Figure 45. Percentage of travellers who ranked Okanagan Valley VQA wine better in terms of price than comparable wine in each region showing importance of wine touring in trip planning (low and high interest). 84
86 When asked to indicate whether Okanagan Valley VQA wines were superior to comparable wines from other regions, high and low interest wine travellers provided similar responses, with the exception of wines from other BC regions. Nearly three quarters (72%) of high interest wine travellers indicated that Okanagan Valley wines were superior to wines from other British Columbia regions in terms of overall value (compared to 58% of low interest wine travellers). Although the differences between high and low interest wine travellers were not practically significant for wines from other regions, high interest wine travellers were marginally less likely to indicate that Okanagan Valley wines were superior in overall value compared to wines from Ontario, California and Europe. High interest wine travellers were marginally more likely to indicate that Okanagan Valley wines were superior in terms of overall value compared to wines from Australia, Chile, and South Africa. Other than on wines from other British Columbia regions, the largest margin of difference between high and low interest wine travellers was seen on wines from South Africa. Nearly half (46%) of high interest wine travellers believed Okanagan Valley wines were superior, compared to just over a third (36%) of low interest wine travellers. 80% 60% 40% Percentage ranking overall quality of Okanagan Valley wine better Importance of wine touring in trip planning 58% 72% 66% 64% 44% 41% 35% 33% 26% 28% 38% 32% 36% 46% 20% 0% Other BC regions Ontario California Europe Australia Chile South Africa Low Interest (n=127) High Interest (n=226) Figure 46. Percentage of travellers who ranked Okanagan Valley VQA wine better in terms of overall value than comparable wine in each region showing importance of wine touring in trip planning (low and high interest). 85
87 Trip Expenditures During the intercept interview travellers were asked to specify their total expenditures 6. On average, independent leisure travellers reported daily spending in the amount of $ There was very little difference in terms of average daily expenditures by origin, with the exception of travellers from outside of. These travellers reported average daily expenditures of $ This could be related to the fact that these travellers were more likely to be travelling for the purposes of visiting friends and family and less likely to be travelling for leisure. Leisure travellers who were staying at a fixed roof accommodation, including resorts, hotels, motels, and bed and breakfasts had the highest average daily expenditures at $ This was followed by those who were staying in second or rental homes or timeshares who reported average daily expenditures of $ Those staying in campgrounds or RV parks reported the lowest daily expenditures at $ Even within the same accommodation type, travellers from outside reported lower average daily expenditures than travellers from other origins, with the exception of those who were staying in second or rental homes or timeshares. Travellers from outside who were staying in second or rental homes or timeshares reported average daily expenditures over $100 more than all leisure travellers using this form of accommodation ($ compared to $359.52). Travellers from Canadian provinces other than British Columbia and Alberta who were staying either in campgrounds or RV parks or in second or rental homes or timeshares also reported higher average daily expenditures compared to all leisure travellers. Not surprisingly, average daily expenditures increased with travel party size. Those travelling alone spent the least at $ compared to those travelling in large groups of seven or more who spent an average of $ per day. This pattern remained consistent across all groups with the exception of those travelling from Alberta. Travel parties from Alberta with seven or more people spent less than travel parties with between three and six people ($ compared to $343.94). Sample sizes in this particular group are low, however, and results should be interpreted with caution. Persons travelling alone from other Canadian provinces reported higher daily expenditures ($202.83), especially compared to those from outside ($118.13). There was no clear pattern in average daily expenditures by age. Travellers between 45 and 54 years of age reported the highest daily expenditures at $348.20, while those age 65 or over spent the lowest at $ There were some practical differences in spending by origin within age groups. Travellers from British Columbia under 24 years of age spent more than their counterparts from other origins ($ compared to $ for all leisure travellers in this age group). Again, however, small sample sizes for this age group by origin warrant caution in interpreting this finding. 6 Day travellers (n=9) specified their travel party s total expenditures on the current day, while overnight travellers (n=1,595) specified their travel party s total expenditures on the previous day of travel. A total of 93 overnight travellers indicated they began their trip on the current day, while 53 could not supply information for daily expenditures. These participants have been removed from the analysis. 86
88 Table 50: Average daily expenditures for independent leisure travellers by origin and traveller characteristics $CDN Daily Expenditures 1 Leisure Travellers (n=1,503) BC (n=766) Alberta (n=391) Other (n=200) Outside (n=146) Overall $ $ $ $ $ Primary accommodations 2 Resort/Hotel/Motel/B&B $ $ $ $ $ Campground/RV $ $ $ $ $ Friends or Relatives $ $ $ $ $ Second or rental homes/timeshares $ $ $ $ $ Other $ $ $ $ $77.50 Travel party size 3 1 person $ $ $ $ $ people $ $ $ $ $ people $ $ $ $ $ or more people $ $ $ $ Age 4 Under 24 Years $ $ $ $ $ Years $ $ $ $ $ Years $ $ $ $ $ Years $ $ $ $ $ Years $ $ $ $ $ Years or Older $ $ $ $ $ The top and bottom 2% of responses were trimmed to ensure an accurate mean daily expenditure. Practical differences of + or 10% of dollar value between respondents from specific origins as compared to all leisure travellers have been colourcoded. 2. Valid sample sizes for primary accommodations: Resort/Hotel/Motel/B&B n=738; Campground/RV n=245; Friends or Relatives n=368; Second or rental homes/timeshares n=121; Other n= Valid sample sizes for travel party size: 1 person n=67; 2 people n=865; 3-6 people n=538; 7 or more people n= Valid sample size for age: Under 24 years n=57; years n=284; years n=280; years n=398; years n=324; 65 years or over n=127. Looking at high interest compared to low interest wine travellers revealed that high interest wine travellers reported considerably higher spending. On average, high interest wine travellers reported spending $356.71, whereas those for whom wine touring was less important in trip planning reported average daily expenditures of $ a difference of $ per day. 87
89 Average daily expenditures Importance of wine touring in trip planning $ $ $ $ $ $ $0.00 Low Interest (n=686) High Interest (n=816) Figure 47. Average daily expenditures showing importance of wine touring in trip planning (low and high interest). 88
90 Summary 1. Travellers who were interviewed at wineries in the Okanagan Valley: Were likely to be from British Columbia (51%), Were most likely to be over the age of 45 (59%), Were likely to have attained at least a university degree (54%) or at least a college diploma (75%), Were most likely to be travelling without children (74%), Were predominately living in adult only households (81%) and not travelling with children (86%), Were from high income households (52% earning $100,000 + per year), Were not new to the wine touring experience (79% been wine touring before, averaging 2 wine touring trips in the past two years), Were most likely to rate themselves as either very satisfied (79%) or somewhat satisfied (13%) with their wine touring experience in the Okanagan Valley, and Were most likely to rate themselves as either very satisfied (89%) or somewhat satisfied (7%) with their overall trip to British Columbia. Trip characteristics of travellers at the Okanagan Valley wineries showed that: The primary trip purpose was leisure (72%), followed by visiting family/friends (27%), Cars/trucks/motorcycles were the primary mode of transportation for most travellers (94%), Resort/Hotel/Motel/B&Bs were the primary accommodation type (50%)% followed by Friends or Relatives (25%), Over a half of the travellers (55%) stated wine touring was the primary reason (27%) or an important reason (28%) for their trip, The top three other wine and culinary activities (besides visiting a winery) during the trip were farmer s market/fruit stand (68%), driving a wine trail (64%) and fine dining/visiting a gourmet restaurant (59%), The three most frequent activities in other non wine/culinary related activities were shopping for local arts and crafts (55%), visiting parks (54%), and swimming/beach activities (37%), Nearly two-thirds (61%) of travellers started planning their trip between 3 12 weeks of departure, Most travellers choose the destination first and then the trip activities (i.e wine touring) when starting to plan their trip (47.5%), High interest wine travellers were more likely to consider visiting wineries first as a trip motivator and then select the destination when planning their trip (34%), Advice from family and friends (60%), past experience visiting wineries in the Okanagan Valley (55%) and tourism/travel/visitor guides or books (49%) were among the top information sources used before travel, Maps (53%), Tourism/travel/visitor guides or books (53%), and advice received from friends and relatives (44%) were the top information sources used during travel, The Okanagan Valley was the primary destination of the majority of travellers (76%), and travellers, on average, were spending 5.7 days (median = 4.0 days) in the valley. 89
91 The average time away from home on the trip was 9.7 days (median = 7.0 days) and travellers intended to spend 8.0 of those days (median = 6.0) in British Columbia. 2. The profile of travellers can be applied: To ensure that the current information provided to wineries reflects the needs of wine travellers. For business planning of new and existing tourism businesses in the Okanagan Valley and Thompson Okanagan Tourism region. The data presented in this report provides details of the type of clients new tourism businesses in the region can expect particularly demographic characteristics, interests and trip planning behaviours of current and future clients who could be attracted through continued tourism marketing initiatives. The information collected about the mood, positive images and competitive advantage attributes provide clear evidence the beautiful, unique scenery set in a pleasant climate coupled with the ease of accessibility (proximity to family/friends) and good quality wine selection are key attributes that consumers have identified as competitive advantages and unique features of the Okanagan Valley as a tourism destination. These key attributes can be used for future tourism development and marketing activities in the region. Overnight leisure travellers also indicated that they were likely to consider the Okanagan Valley again for a future wine touring vacation. However, they also almost equally likely to consider the Vancouver Island and Gulf Island wine region as well as wine regions in the US (California) and overseas (France/Italy) as potential destinations for a future wine vacation. It is useful to understand the appeal and offerings of these destinations in order for the Okanagan Valley to continue to distinguish themselves and enhance its attractiveness as a tourism destination offering a high quality, wine touring product. 90
92 Limitations 1. These results are representative of travellers who were interviewed at selected wineries in the Okanagan Valley between August 1 st and October 12 th, The results do not represent a profile of wine travellers to the Okanagan Valley for the whole year. While the sample of wineries included in this study was aimed to be diverse in operating size, geographic location and product offerings, it is acknowledged that these results may not be representative of the entire wine travel market in the Okanagan Valley. Applying these results to the remaining months in the year could over-estimate certain wine travel markets because the study was completed during the peak wine tourism season. In addition, trip and traveller characteristics of travellers at other times of the year could differ from those interviewed during the study period. 2. Some of the statistics contained within this report were produced with small sample sizes; consequently some of the results should be treated with caution. 3. Results presented here do not represent the full range of analysis that can be completed with the data collected. For example, a profile of travellers visiting friends and family versus those that were travelling for leisure could be developed. Please contact Alison Aspinall, Research and Planning Tourism British Columbia (Alison.Aspinall@tourismbc.com) for more information on obtaining custom reports using this data. 91
93 Appendices Appendix A - Interview Schedule and Interviews Completed Appendix B - Questionnaires Appendix C Tour Group & Business Traveller Profiles Appendix D Response Bias Testing Appendix E Open-Ended Comments from Survey Participants 92
94 Appendix A Interview Schedule and Interviews Completed 93
95 Okanagan Valley Consumer Wine Research - Summer 2008 Table A1. The day and number of travellers approached, the number who agreed to the interview, the number who participated previously, the number of residents, the number of refusals, the number travelling in a tour group and the number of independent tourists interviewed at each of the seven wineries during the study period. Mission Hill Travellers Agree to Approached Interview Refusals Previous Participant Screened Incomplete Independent Residents surveys leisure 1 Survey participants Tour Group Business1 Aug Aug Aug Aug Aug Aug Aug Sep Sep Sep Sep Sep Sep Oct Oct Total Elephant Island Aug Aug Aug Aug Aug Aug Sep Sep Sep Sep Sep Sep Oct Oct Oct Total Residents and Tour Group participants are included in the final sample of tourists who responded to the intercept interview. 94
96 Okanagan Valley Consumer Wine Research - Summer 2008 Table A1. Continued. Soaring Eagle Travellers Agree to Approached Interview Refusals Previous Participant Screened Incomplete Independent Residents surveys leisure 1 Survey participants Tour Group Business1 Aug Aug Aug Aug Aug Aug Aug Sep Sep Sep Sep Sep Sep Sep Sep Oct Oct Oct Total Cedar Creek Aug Aug Aug Aug Aug Aug Aug Aug Sep Sep Sep Sep Sep Sep Sep Oct Oct Total
97 Okanagan Valley Consumer Wine Research - Summer 2008 Table A1. Continued. Burrowing Owl Travellers Agree to Approached Interview Refusals Previous Participant Screened Incomplete Independent Residents surveys leisure 1 Survey participants Tour Group Business1 Aug Aug Aug Aug Aug Aug Sep Sep Sep Sep Sep Sep Oct Oct Total Nk Mip Aug Aug Aug Aug Aug Aug Sep Sep Sep Sep Sep Sep Oct Oct Oct Total
98 Table A1. Continued. Tinhorn Creek Travellers Agree to Approached Interview Refusals Previous Participant Screened Incomplete Independent Residents surveys leisure 1 Survey participants Tour Group Business1 Aug Aug Aug Aug Aug Sep Sep Sep Sep Sep Oct Oct Oct Total Overall 3,191 2, , Included above are 10 surveys conducted with travellers who travelled for 365 days or more (indendent leisure travellers n=6 and business travellers n=4). These participants were deemed to be local residents and their responses removed from the analysis above. 97
99 Appendix B Questionnaires 98
100 Appendix B Interview Questions 99
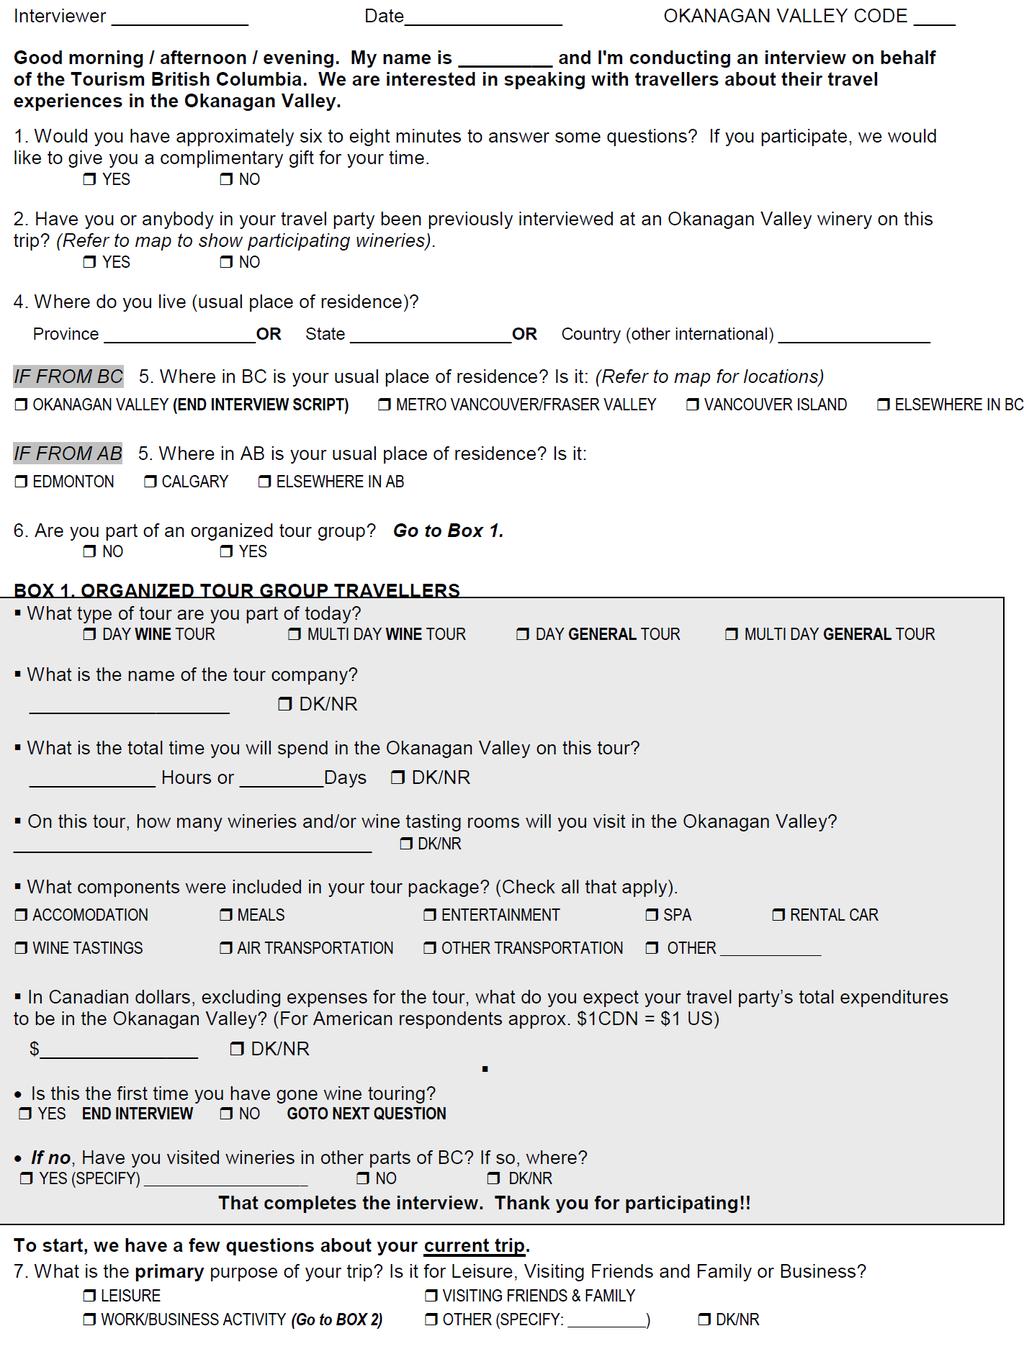
101 100
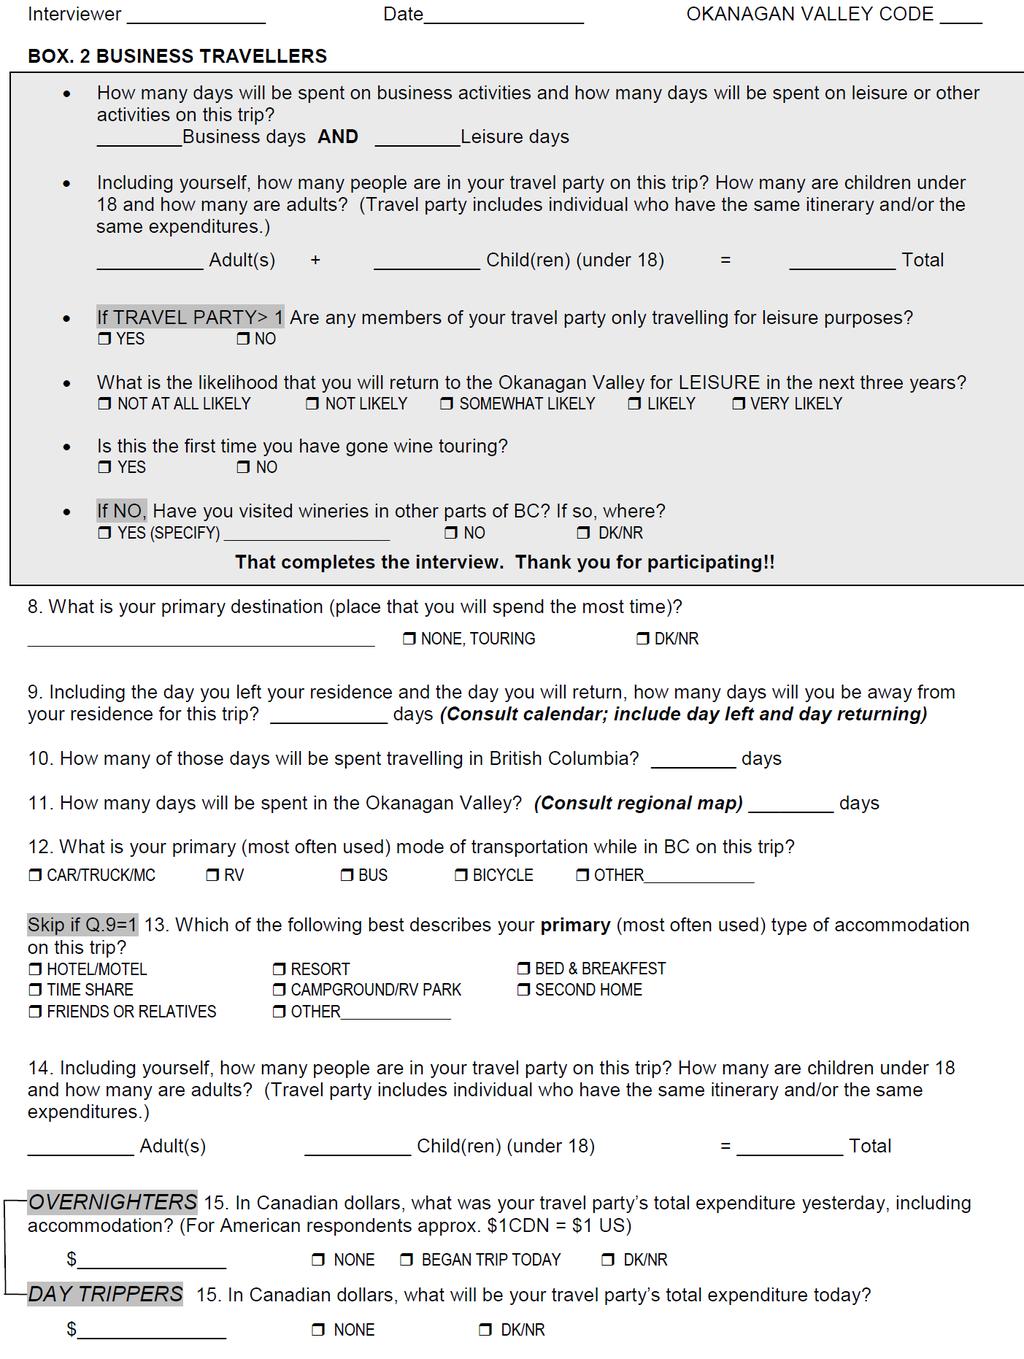
102 101
103 102
104 103
105 Appendix B Follow-up Questionnaire 104
106 105
107 106
108 107
109 108
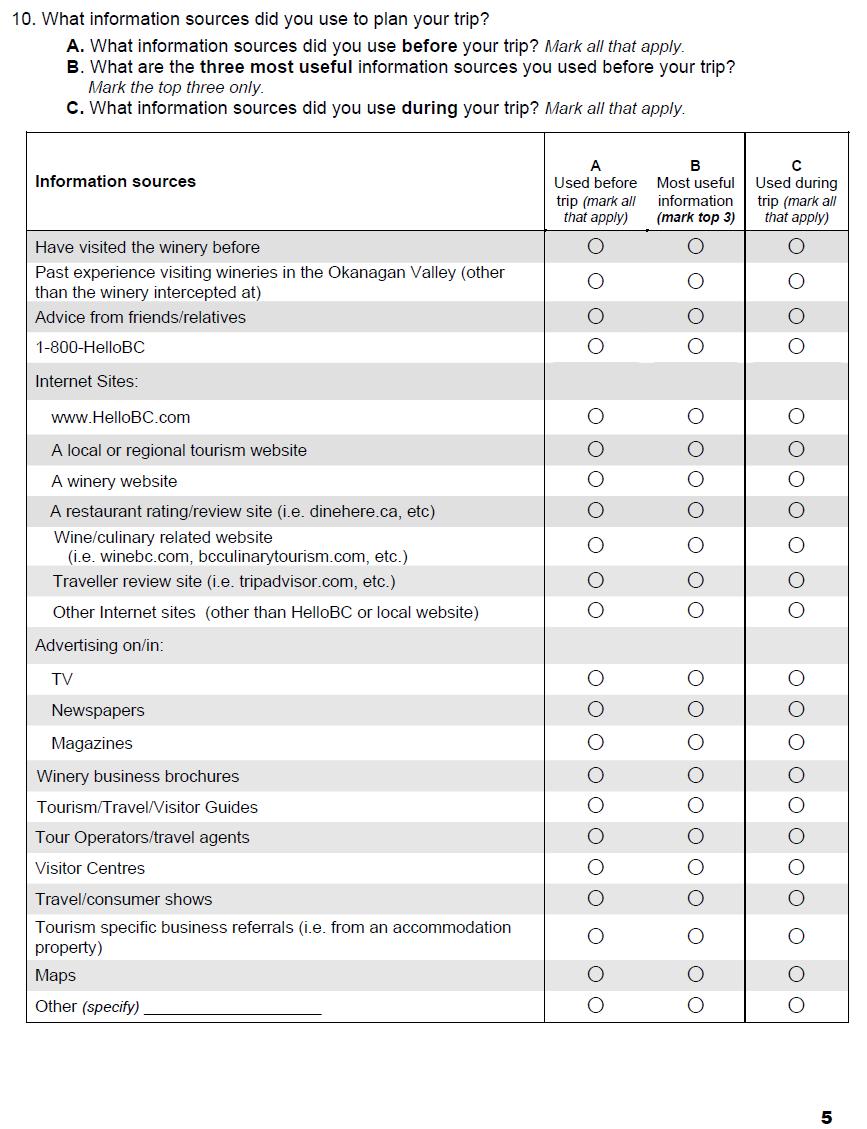
110 109
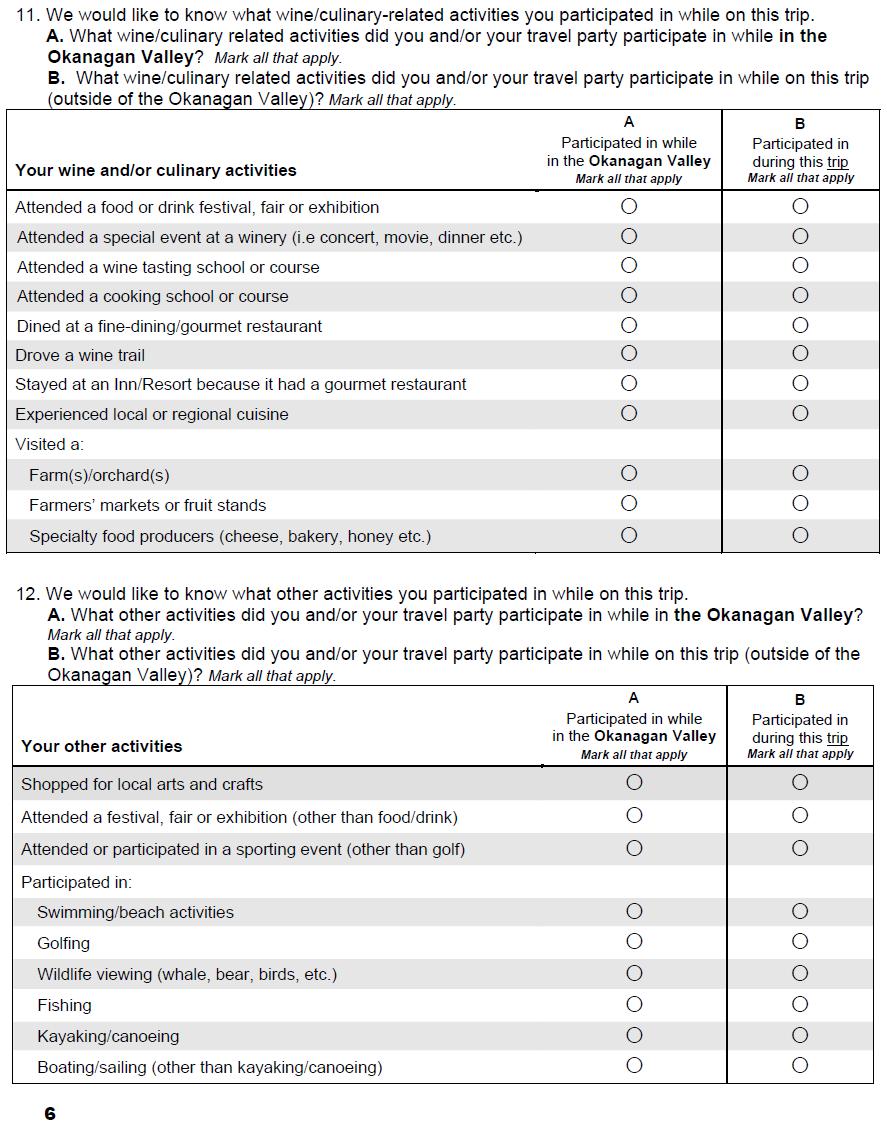
111 110
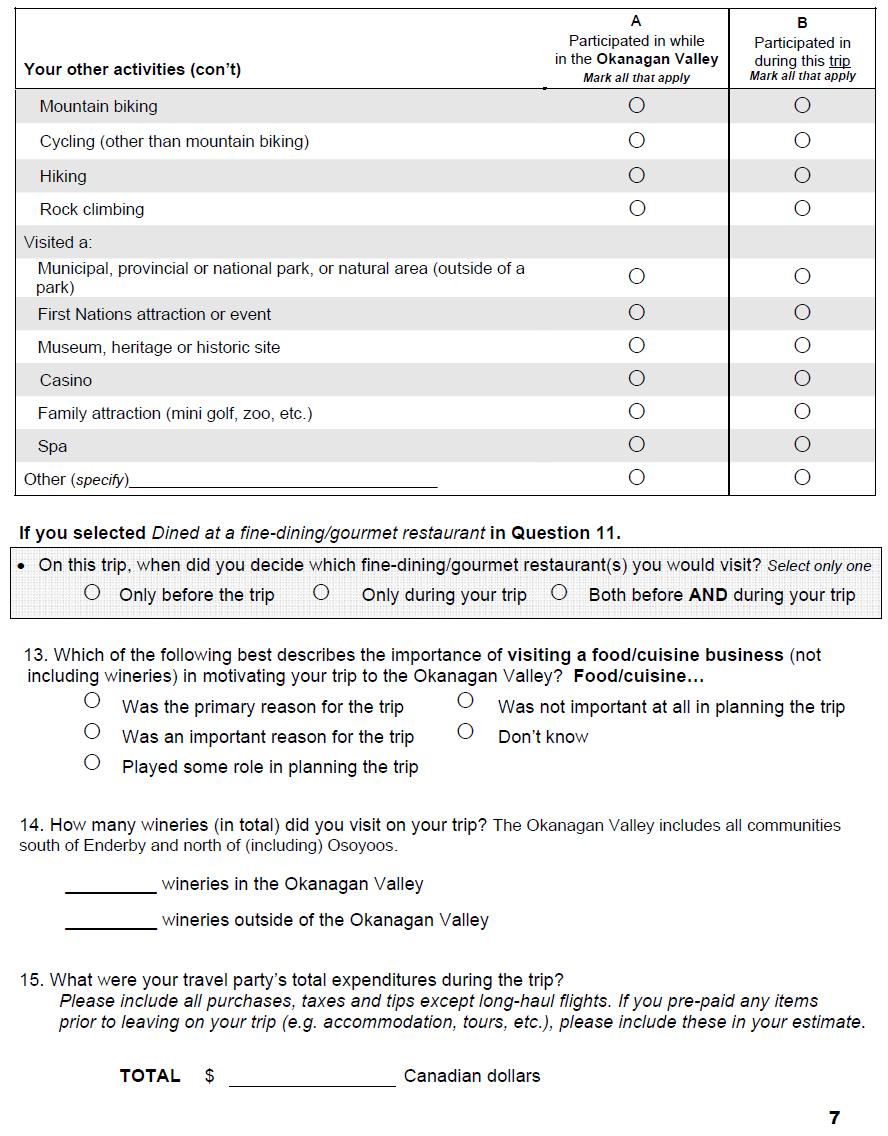
112 111

113 112
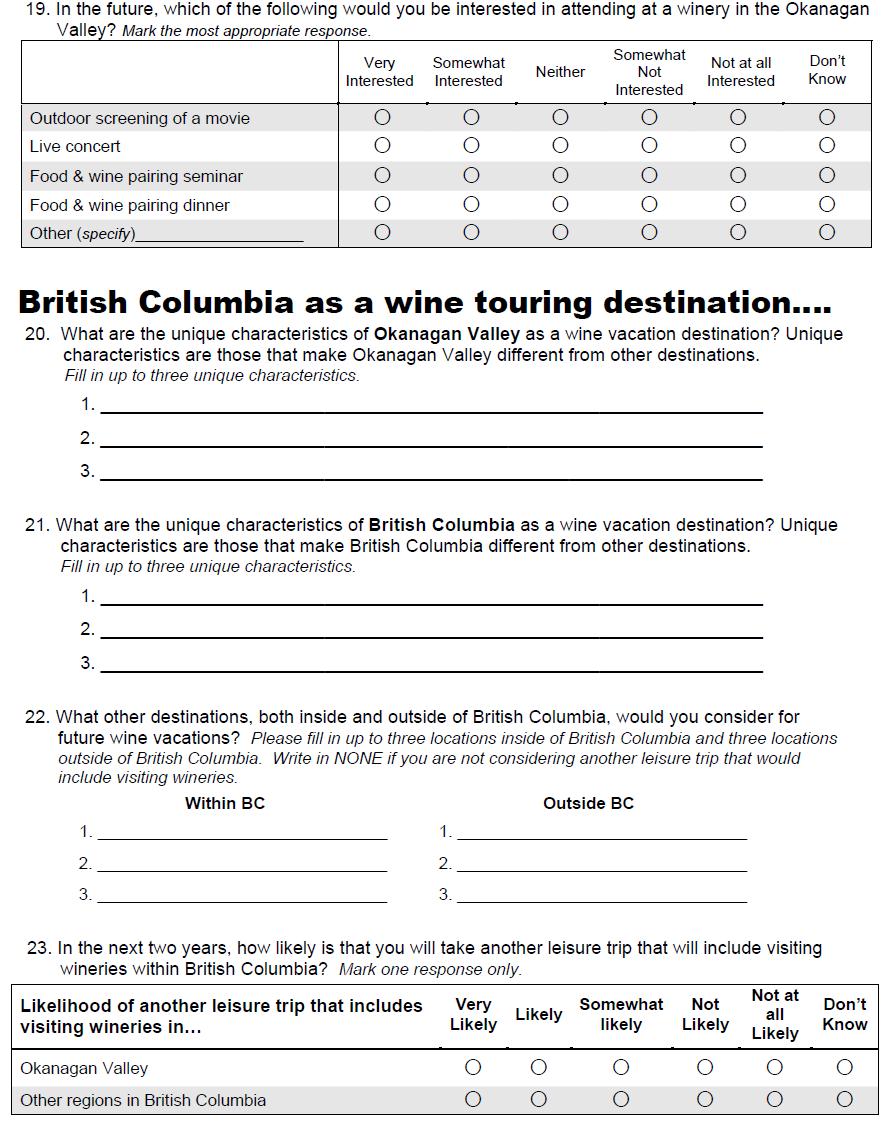
114 113
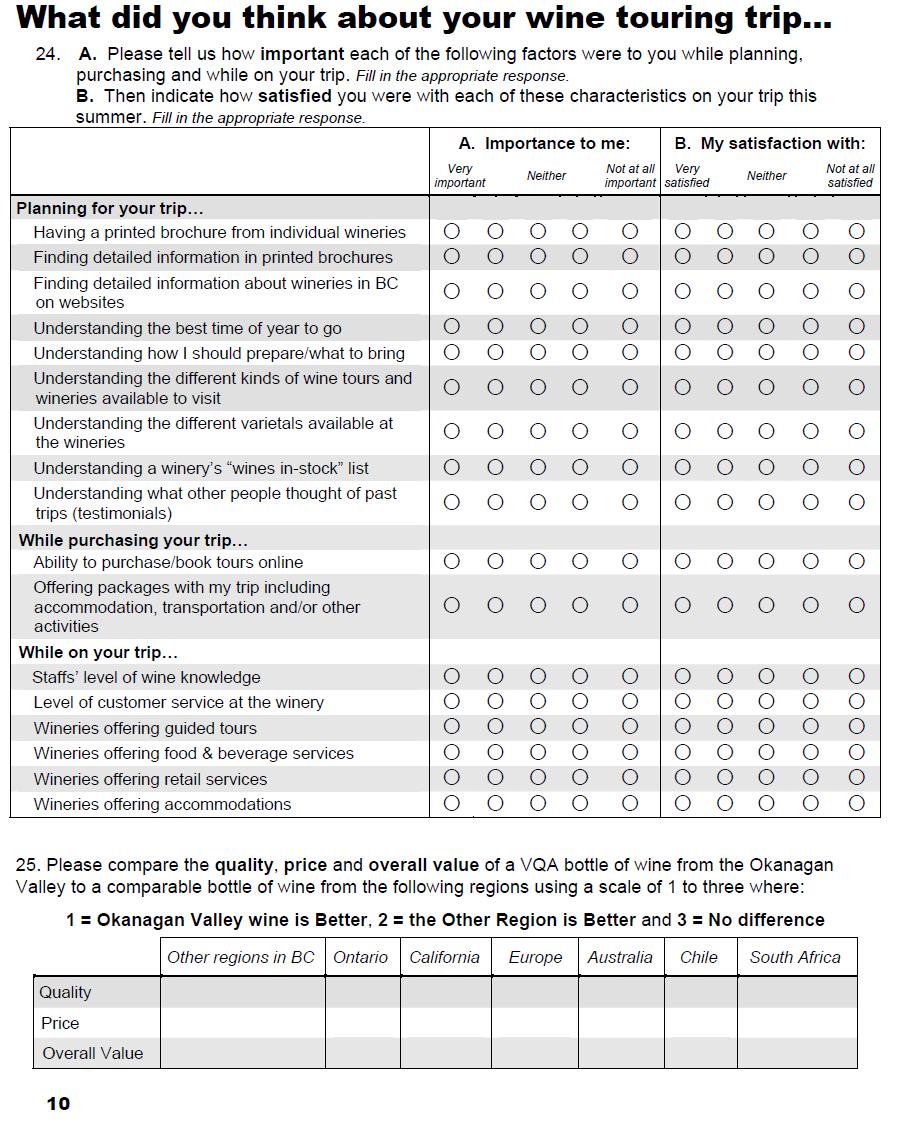
115 114
OKANAGAN VALLEY WINE CONSUMER RESEARCH STUDY 2008 RESULTS
 RESEARCH AND PLANNING OKANAGAN VALLEY WINE CONSUMER RESEARCH STUDY 2008 RESULTS Summer 2009 Research and Planning Tourism British Columbia 3 rd Floor, 1803 Douglas St. Victoria, BC V8W 9W5 Web: www.tourismbc.com/research
BC WINE INDUSTRY BENCHMARKING
 WINE INDUSTRY BENCHMARKING August, 2016 Okanagan Valley EXECUTIVE SUMMARY Overall, more than half of and AB residents consider an appealing destination for wine touring. More residents have experienced
THE ECONOMIC IMPACT OF BEER TOURISM IN KENT COUNTY, MICHIGAN
 THE ECONOMIC IMPACT OF BEER TOURISM IN KENT COUNTY, MICHIGAN Dan Giedeman, Ph.D., Paul Isely, Ph.D., and Gerry Simons, Ph.D. 10/8/2015 THE ECONOMIC IMPACT OF BEER TOURISM IN KENT COUNTY, MICHIGAN EXECUTIVE
TOURIST SPECIAL INTEREST WINE TOURISM NEW ZEALAND FEBRUARY 2014
 Tourists NEW ZEALAND FEBRUARY 214 INTRODUCING WINE TOURISM This report provides an overview of tourists that visit wineries as an activity during their visit to New Zealand. The report includes trends
A Presentation of the Primary Research on Visitation to Wine Festivals and Wineries in British Columbia
 A Presentation of the Primary Research on Visitation to Wine Festivals and Wineries in British Columbia Dr. Blair Baldwin J.D./M.B.A./B.A. Honours The Okanagan School of Business at Okanagan College, Kelowna,
Summary Report Survey on Community Perceptions of Wine Businesses
 Summary Report Survey on Community Perceptions of Wine Businesses Updated August 10, 2018 Conducted by Professors David McCuan and Richard Hertz for the Wine Business Institute School of Business and Economics
Chicken Usage Summary
 http://www.nationalchickencouncil.org Chicken Usage Summary July 2014 Presentation prepared for: National Chicken Council Prepared by: PKS Research Partners Funding provided by: Background PKS Research
Texas Wine Marketing Research Institute College of Human Sciences Texas Tech University CONSUMER ATTITUDES TO TEXAS WINES
 Texas Wine Marketing Research Institute College of Human Sciences Texas Tech University CONSUMER ATTITUDES TO TEXAS WINES Nelson Barber, M.S. D. Christopher Taylor, M.A.M. Natalia Kolyesnikova, Ph.D. Tim
DETERMINANTS OF DINER RESPONSE TO ORIENTAL CUISINE IN SPECIALITY RESTAURANTS AND SELECTED CLASSIFIED HOTELS IN NAIROBI COUNTY, KENYA
 DETERMINANTS OF DINER RESPONSE TO ORIENTAL CUISINE IN SPECIALITY RESTAURANTS AND SELECTED CLASSIFIED HOTELS IN NAIROBI COUNTY, KENYA NYAKIRA NORAH EILEEN (B.ED ARTS) T 129/12132/2009 A RESEACH PROPOSAL
1) What proportion of the districts has written policies regarding vending or a la carte foods?
 What proportion of the districts has written policies regarding vending or a la carte foods?") Rhode Island School Nutrition Environment Evaluation: Vending and a La Carte Food Policies Rhode Island Department of Education ETR Associates - Education Training Research Executive Summary Since 2001,
Rhode Island School Nutrition Environment Evaluation: Vending and a La Carte Food Policies Rhode Island Department of Education ETR Associates - Education Training Research Executive Summary Since 2001,
2016 STATUS SUMMARY VINEYARDS AND WINERIES OF MINNESOTA
 IN PARTNERSHIP WITH THE NORTHERN GRAPES PROJECT, AN USDA SPECIALITY CROPS RESEARCH INITIATIVE PROGRAM, NIFA 2016 STATUS SUMMARY VINEYARDS AND WINERIES OF MINNESOTA Brigid Tuck and William Gartner INTRODUCTION
Technical Memorandum: Economic Impact of the Tutankhamun and the Golden Age of the Pharoahs Exhibition
 Technical Memorandum: Economic Impact of the Tutankhamun and the Golden Age of the Pharoahs Exhibition Prepared for: The Franklin Institute Science Museum Prepared by: Urban Partners November 2007 Economic
RESEARCH UPDATE from Texas Wine Marketing Research Institute by Natalia Kolyesnikova, PhD Tim Dodd, PhD THANK YOU SPONSORS
 RESEARCH UPDATE from by Natalia Kolyesnikova, PhD Tim Dodd, PhD THANK YOU SPONSORS STUDY 1 Identifying the Characteristics & Behavior of Consumer Segments in Texas Introduction Some wine industries depend
Partnership Opportunities for Private Liquor Retail Stores in BC
 Partnership Opportunities for Private Liquor Retail Stores in BC 2 What is the BC Ale Trail? The BC Ale Trail is a marketing campaign showcasing British Columbia as a global destination for tourists and
Characteristics of Wine Consumers in the Mid-Atlantic States: A Statistical Analysis
 Characteristics of Wine Consumers in the Mid-Atlantic States: A Statistical Analysis Kathy Kelley, Professor, Penn State Abigail Miller, Former Graduate Student, Penn State Denise Gardner, Enology Extension
The following slides collate the insights relating to food and drink only.
 1 2 The following slides collate the insights relating to food and drink only. To see the full results and to put this extract into context please click on this link: Scotland Visitor Survey Objectives
The University of Georgia
 The University of Georgia Center for Agribusiness and Economic Development College of Agricultural and Environmental Sciences A Survey of Pecan Sheller s Interest in Storage Technology Prepared by: Kent
Bt Corn IRM Compliance in Canada
 Bt Corn IRM Compliance in Canada Canadian Corn Pest Coalition Report Author: Greg Dunlop (BSc. Agr, MBA, CMRP), ifusion Research Ltd. 15 CONTENTS CONTENTS... 2 EXECUTIVE SUMMARY... 4 BT CORN MARKET OVERVIEW...
Missouri Specialty Crop Survey
 Missouri Specialty Crop Survey Summary of Findings May 2018 Conducted by the Assessment Resource Center College of Education University of Missouri 2800 Maguire Blvd Columbia Missouri 65201 (573) 882-4694
Results from the First North Carolina Wine Industry Tracker Survey
 Results from the First North Carolina Wine Industry Tracker Survey - 2009 Dr. Michael R. Evans Director and Professor of Hospitality and Tourism Management and Dr. James E. Stoddard Professor of Marketing
Company Coverage. Country Coverage. Global Coverage. Regional Coverage
 Global Food Service Market: Analysis By Type (Full Service Restaurants, Cafe and Bars, QSRs, Fast Casual Restaurants, Others), By Full Service Restaurant (Fine Dining, Casual Dining), By Region, By Country
2015 ONTARIO GRAPE + WINE INDUSTRY
 2015 ONTARIO GRAPE + WINE INDUSTRY 1 Estate Winery Visitors 2015 ONTARIO GRAPE+WINE INDUSTRY Introduction Methodology Quantitative research study in-person intercept interviews in selected Niagara wineries
Final Report. The Lunchtime Occasion in Republic of Ireland and Great Britain
 Final Report The Lunchtime Occasion in Republic of Ireland and Great Britain November 2013 Contents Introduction & Research Objectives... 1 Research Method... 2 Segment Profiles... 3 Executive Summary...
Food and beverage services statistics - NACE Rev. 2
 Food and beverage services statistics - NACE Rev. 2 Statistics Explained Data extracted in October 2015. Most recent data: Further Eurostat information, Main tables and Database. This article presents
Oregon 2013 Regional Visitor Report Willamette Valley
 Oregon 201 Regional Visitor Report Willamette Valley Introduction Longwoods International began tracking American travelers in 1985, and has conducted large-scale syndicated visitor research quarterly
The Vietnam urban food consumption and expenditure study
 The Centre for Global Food and Resources The Vietnam urban food consumption and expenditure study Factsheet 4: Where do consumers shop? Wet markets still dominate! The food retail landscape in urban Vietnam
WINTERLICIOUS / SUMMERLICIOUS
 Appendix 1 WINTERLICIOUS / SUMMERLICIOUS PRIX-FIXE PROMOTION NEW CRITERIA AND PROCESS FOR PARTICIPATION PILOT PROJECT for 2009 Introduction: Winterlicious and Summerlicious were initiated in 2003 to promote
North America Ethyl Acetate Industry Outlook to Market Size, Company Share, Price Trends, Capacity Forecasts of All Active and Planned Plants
 North America Ethyl Acetate Industry Outlook to 2016 - Market Size, Company Share, Price Trends, Capacity Forecasts of All Active and Planned Plants Reference Code: GDCH0416RDB Publication Date: October
A Comparison of X, Y, and Boomer Generation Wine Consumers in California
 A Comparison of,, and Boomer Generation Wine Consumers in California Marianne McGarry Wolf, Scott Carpenter, and Eivis Qenani-Petrela This research shows that the wine market in the California is segmented
Proposal for the Approval of a New Subdivision of the. Okanagan Valley Geographical Indication NARAMATA BENCH SUB-GI.
 Proposal for the Approval of a New Subdivision of the Okanagan Valley Geographical Indication NARAMATA BENCH SUB-GI 23 April 2018 Prepared by the Sub-GI Committee, Naramata Bench Introduction This document
The Macao Tourist Satisfaction Index (MTSI)
") Macao Tourist Satisfaction Index Report 2016 The Macao Tourist Satisfaction Index (MTSI) 3 rd Quarter Report 2016 Conducted by The IFT Tourism Research Centre (ITRC) Institute for Tourism Studies, Macao
Macao Tourist Satisfaction Index Report 2016 The Macao Tourist Satisfaction Index (MTSI) 3 rd Quarter Report 2016 Conducted by The IFT Tourism Research Centre (ITRC) Institute for Tourism Studies, Macao
RESULTS OF THE MARKETING SURVEY ON DRINKING BEER
 Uri Dahahn Business and Economic Consultants RESULTS OF THE MARKETING SURVEY ON DRINKING BEER Uri Dahan Business and Economic Consultants Smith - Consulting & Reserch ltd Tel. 972-77-7032332, Fax. 972-2-6790162,
Clinical Support Services Dining Services Satisfaction Survey Fall 2013
 Clinical Support Services Dining Services Satisfaction Survey Fall 2013 Institutional Research November 2013 Final Report Prepared by Institutional Research MD Anderson Cancer Center The University of
Napa County Planning Commission Board Agenda Letter
 Agenda Date: 7/1/2015 Agenda Placement: 10A Continued From: May 20, 2015 Napa County Planning Commission Board Agenda Letter TO: FROM: Napa County Planning Commission John McDowell for David Morrison -
Oregon Wine Board Consumer Study. December 18, 2015
 Oregon Wine Board Consumer Study December 18, 2015 OBJECTIVES & METHODOLOGY RESEARCH TARGET: Survey wine consumers who currently drink Oregon wine and potential consumers of Oregon wines. Focus on high
Visit Napa Valley 2012 Napa Valley Visitor Profile REPORT OF FINDINGS
 Visit Napa Valley 2012 Napa Valley Visitor Profile REPORT OF FINDINGS Project Overview Methodology This report presents the findings of a year-long visitor profile study conducted by Destination Analysts
Yielding Returns for Greater Profitability for your Wine Country Business
 Yielding Returns for Greater Profitability for your Wine Country Business An Experience Economy Approach to Enhancing Wine Tourism Donna Quadri-Felitti, Ph.D., New York University Recommendations based
Background & Literature Review The Research Main Results Conclusions & Managerial Implications
 Agenda Background & Literature Review The Research Main Results Conclusions & Managerial Implications Background & Literature Review WINE & TERRITORY Many different brands Fragmented market, resulting
New from Packaged Facts!
 New from Packaged Facts! FOODSERVICE MARKET INSIGHTS A fresh perspective on the foodservice marketplace Essential Insights on Consumer customerservice@packagedfacts.com (800) 298-5294 (240) 747-3095 (Intl.)
Wine Australia Wine.com Data Report. July 21, 2017
 Wine Australia Wine.com Data Report July 21, 2017 INTRODUCTION Wine Opinions is a wine market research company focusing on the attitudes, behaviors, and taste preferences of U.S. wine drinkers. Wine Opinions
The Pillars Of Wine Tourism Performance
 Executive Summary For Mendoza Great Wine Capitals Global Network Market Survey The Pillars Of Wine Tourism Performance 2013 Bilbao Rioja Bordeaux Cape Town Christchurch Sousth Island Firenze Mainz Rheinhessen
An update from the Competitiveness and Market Analysis Section, Alberta Agriculture and Forestry.
 An update from the Competitiveness and Market Analysis Section, Alberta Agriculture and Forestry. The articles in this series includes information on what consumers are buying and why they are buying it.
Sportzfun.com. Source: Joseph Pine and James Gilmore, The Experience Economy, Harvard Business School Press.
 National Extension Tourism Conference Park City, Utah Center for Agribusiness and Economic Development June 15 th, 2009 or Agribusin siness and Econ onomic Deve Center fo velopment What does Agritourism
Figure 1: Percentage of Pennsylvania Wine Trail 2011 Pennsylvania Wine Industry Needs Assessment Survey
 Industry Needs Assessment Demographic of Participants As part of my initiative to get a quick snap shot of the Pennsylvania wine industry needs, an assessment survey was made public on July 1, 2011. This
Food Service Opportunity at Toronto City Hall. Government Management Committee. P:\2016\Internal Services\RE\Gm16012re (AFS #22969)
") GM11.7 STAFF REPORT ACTION REQUIRED Food Service Opportunity at Toronto City Hall Date: March 16, 2016 To: From: Wards: Reference Number: Government Management Committee Chief Corporate Officer Ward 27
GM11.7 STAFF REPORT ACTION REQUIRED Food Service Opportunity at Toronto City Hall Date: March 16, 2016 To: From: Wards: Reference Number: Government Management Committee Chief Corporate Officer Ward 27
YAKIMA VALLEY TOURISM ANNUAL REPORT
 YAKIMA VALLEY TOURISM ANNUAL REPORT 17 20 LEADERSHIP MESSAGE On behalf of the Board of Directors and staff of Yakima Valley Tourism, we are proud to present our 2017 Annual Report. Tourism means economic
II. The National School Lunch Program
 II. The National School Lunch Program The National School Lunch Program (NSLP) is the largest child nutrition program in the United States. Participation in this program allows schools to receive both
Trends. in retail. Issue 8 Winter The Evolution of on-demand Food and Beverage Delivery Options. Content
 Trends in retail Issue 8 Winter 2016 Content 1. The Evolution of On-Demand Food and Beverage Delivery Options Alberta Food and Beverage Sector Opportunities and Challenges 2. Data Highlights The Evolution
Analysis of Texas Winery Visitor Spending and GOTEXAN Efforts to Promote Winery Tourism 1
 Analysis of Texas Winery Visitor Spending and GOTEXAN Efforts to Promote Winery Tourism 1 Selected Paper prepared for presentation at the Southern Agricultural Economics Association Annual Meeting, Corpus
Report Brochure P O R T R A I T S U K REPORT PRICE: GBP 2,500 or 5 Report Credits* UK Portraits 2014
 Report Brochure P O R T R A I T S U K 2 0 1 4 REPORT PRICE: GBP 2,500 or 5 Report Credits* Wine Intelligence 2013 1 Contents 1 MANAGEMENT SUMMARY >> An introduction to UK Portraits, including segment size,
More information from: https://www.wiseguyreports.com/reports/ global-online-food-delivery-and-takeaway-marketanalysis-by-order-type
 Report Information More information from: https://www.wiseguyreports.com/reports/1079744-global-online-food-delivery-and-takeaway-marketanalysis-by-order-type Global Online Food Delivery and Takeaway Market
UNIV OF ALABAMA AT BIRMINGHAM US10066
 Consumer Satisfaction Survey Spring 2014 UNIV OF ALABAMA AT BIRMINGHAM US10066 Objectives and Method What are the Benefits of participating in the Survey? - Sodexo uses the survey to improve residential
RESTAURANT OUTLOOK SURVEY
 Reference Period: Fourth Quarter 2016 RESTAURANT OUTLOOK SURVEY Prepared by Chris Elliott, Senior Economist January 23, 2017 Q2-2011 Restaurant Outlook Survey Fourth Quarter 2016 1 Highlights The share
The Economic Impact of the Craft Brewing Industry in Maine. School of Economics Staff Paper SOE 630- February Andrew Crawley*^ and Sarah Welsh
 The Economic Impact of the Craft Brewing Industry in Maine School of Economics Staff Paper SOE 630- February 2017 Andrew Crawley*^ and Sarah Welsh School of Economics, University of Maine Executive Summary
Chef Craig Schmantowsky
 Chef Craig Schmantowsky Outline Culinary Tourism Europe and Central America U.S. and Local Conclusion Dessert Demonstration What is Culinary tourism? Culinary Tourism is not new Focuses on the search for
Produce Education Program 2015 Evaluation Report Comparison of Key Findings
 California Association of Food Banks Produce Education Program 2015 Evaluation Report Comparison of Key Findings Data Collection The CAFB FY 15 evaluation plan called for the collection of 200 surveys
ISES INDUSTRY FORUM CSISG 2015 Q3 RESULTS. F&B and TOURISM INSTITUTE OF SERVICE EXCELLENCE SINGAPORE MANAGEMENT UNIVERSITY
 ISES INDUSTRY FORUM CSISG 2015 Q3 RESULTS F&B and TOURISM INSTITUTE OF SERVICE EXCELLENCE SINGAPORE MANAGEMENT UNIVERSITY 1 CSISG 2015 Q3 CSISG 2015 Q3 Quick Facts & Sampling Results Overview Results and
Update : Consumer Attitudes
 Blah blah blah blah blah Consumers developed 40 words/attributes to describe commercially available EVOOs. Sensory differences were independent of country of origin. Update : Consumer Attitudes There was
BS_EN_2016. Business Survey Welcome!
 Business Survey 2016 Welcome! Thank you for taking a moment to read the following instructions: - Please fill in each field. The " * " at the beginning of the questions mean "required field". - Do not
2. The proposal has been sent to the Virtual Screening Committee (VSC) for evaluation and will be examined by the Executive Board in September 2008.
 for evaluation and will be examined by the Executive Board in September 2008.") WP Board 1052/08 International Coffee Organization Organización Internacional del Café Organização Internacional do Café Organisation Internationale du Café 20 August 2008 English only Projects/Common
WP Board 1052/08 International Coffee Organization Organización Internacional del Café Organização Internacional do Café Organisation Internationale du Café 20 August 2008 English only Projects/Common
Specialty Coffee Market Research 2013
 Specialty Coffee Market Research 03 The research was divided into a first stage, consisting of interviews (37 companies), and a second stage, consisting of a survey using the Internet (0 companies/individuals).
WP Board 1035/07. 3 August 2007 Original: English. Projects/Common Fund
 WP Board 1035/07 International Coffee Organization Organización Internacional del Café Organização Internacional do Café Organisation Internationale du Café 3 August 2007 Original: English Projects/Common
LEAN PRODUCTION FOR WINERIES PROGRAM
 LEAN PRODUCTION FOR WINERIES PROGRAM 2015-16 An Initiative of the Office of Green Industries SA Industry Program and the South Australian Wine Industry Association, in association with Wine Australia South
Chair and members of the Board of Health. Jessica Morris, Manager, Environmental Health. Christopher Beveridge, Director, Health Protection
 HEALTHY MENU CHOICES ACT TO: Chair and members of the Board of Health MEETING DATE: December 6, 2017 REPORT NO: Pages: 6 PREPARED BY: APPROVED BY: SUBMITTED BY: Jessica Morris, Manager, Environmental Health
NO TO ARTIFICIAL, YES TO FLAVOR: A LOOK AT CLEAN BALANCERS
 NO TO ARTIFICIAL, YES TO FLAVOR: A LOOK AT CLEAN BALANCERS 2018 TREND INSIGHT REPORT Out of four personas options, 46% of consumers self-identify as Clean Balancers. We re exploring this group in-depth
DISTILLERY REPORT. Prepared for Colorado Distillers Guild
 DISTILLERY REPORT Prepared for Colorado Distillers Guild Consumer Insights and Business Innovation Center (CiBiC) Daniels College of Business, University of Denver Intern Researcher: Federica Bologna Faculty
Danish Consumer Preferences for Wine and the Impact of Involvement
 Danish Consumer Preferences for Wine and the Impact of Involvement Polymeros Chrysochou MAPP Centre, Department of Management, Aarhus University, Denmark (email: polyc@asb.dk) Jacob Brunbjerg Jørgensen
Informing Wineries Tourism Decisions: Studies of Tasting Room Visitors and Wine Tourism Collaboration
 Informing Wineries Tourism Decisions: Studies of Tasting Room Visitors and Wine Tourism Collaboration Dan McCole, Don Holecek and Anna Popp Department of Community Sustainability Michigan State University
Wine Purchase Intentions: A Push-Pull Study of External Drivers, Internal Drivers, and Personal Involvement
 Wine Purchase Intentions: A Push-Pull Study of External Drivers, Internal Drivers, and Personal Involvement Dennis Reynolds, Ph.D. Ivar Haglund Distinguished Professor School of Hospitality Business Management
Time for a beer? When and where Europeans enjoy a beer A report by SABMiller
 Time for a beer? When and where Europeans enjoy a beer A report by SABMiller Introduction A European walks into a bar Beer is big business in Europe with volumes increasing by more than % in recent years.
Sample. TO: Prof. Hussain FROM: GROUP (Names of group members) DATE: October 09, 2003 RE: Final Project Proposal for Group Project
 DATE: October 09, 2003 RE: Final Project Proposal for Group Project") Sample TO: Prof. Hussain FROM: GROUP (Names of group members) DATE: October 09, 2003 RE: Final Project Proposal for Group Project INTRODUCTION Our group has chosen Chilean Wine exports for our research
Sample TO: Prof. Hussain FROM: GROUP (Names of group members) DATE: October 09, 2003 RE: Final Project Proposal for Group Project INTRODUCTION Our group has chosen Chilean Wine exports for our research
Washington Vineyard Acreage Report: 2011
 Washington Vineyard Acreage Report: 2011 COMPILED BY USDA/NATIONAL AGRICULTURAL STATISTICS SERVICE WASHINGTON FIELD OFFICE DAVID KNOPF, DIRECTOR DENNIS KOONG, DEPUTY DIRECTOR P. O. BOX 609 OLYMPIA, WASHINGTON
EXECUTIVE SUMMARY OVERALL, WE FOUND THAT:
 THE ECONOMIC IMPACT OF CRAFT BREWERIES IN LOS ANGELES LA s craft brewing industry generates short-term economic impacts through large capital investments, equipment purchases, and the construction of new
OF THE VARIOUS DECIDUOUS and
 (9) PLAXICO, JAMES S. 1955. PROBLEMS OF FACTOR-PRODUCT AGGRE- GATION IN COBB-DOUGLAS VALUE PRODUCTIVITY ANALYSIS. JOUR. FARM ECON. 37: 644-675, ILLUS. (10) SCHICKELE, RAINER. 1941. EFFECT OF TENURE SYSTEMS
A Study on Consumer Attitude Towards Café Coffee Day. Gonsalves Samuel and Dias Franklyn. Abstract
 Reflections Journal of Management (RJOM) Volume 5, January 2016 Available online at: http://reflections.rustomjee.com/index.php/reflections/issue/view/3/showtoc A Study on Consumer Attitude Towards Café
Report Brochure. Mexico Generations Re p o r t. REPORT PRICE GBP 2,000 AUD 3,800 USD 2,800 EUR 2,600 4 Report Credits
 Report Brochure Mexico Generations 2 0 1 6 Re p o r t REPORT PRICE GBP 2,000 AUD 3,800 USD 2,800 EUR 2,600 4 Report Credits Wine Intelligence 2016 1 Report price Report price: GBP 2,000 AUD 3,800 USD 2,800
Attachments: Memo from Lisa Applebee, ACHD Project Manager PowerPoint Slides for October 27, 2009 Work Session
 Date: October 22, 2009 To: From: Re: Mayor and City Council Karen Gallagher Transportation Planner Fairview Avenue Concept Design and Access Management Plan Update and Public Outreach Plan Requested Action:
SAS - JMP Elite Sales Circle 2018
 RFP Details RFP Name SAS - JMP Elite Sales Circle 2018 Response Due Date Decision Date RFP Type RFP Code Description Decision Factors Billing Information Concessions / Contractual Requirements Wed, 08-Feb-2017
GREAT WINE CAPITALS GLOBAL NETWORK MARKET SURVEY FINANCIAL STABILITY AND VIABILITY OF WINE TOURISM BUSINESS IN THE GWC
 GREAT WINE CAPITALS GLOBAL NETWORK MARKET SURVEY 2010-2011 FINANCIAL STABILITY AND VIABILITY OF WINE TOURISM BUSINESS IN THE GWC June 2011 2 / 6 INTRODUCTION This market survey has focused on how the economic
Title: Western New York Sweet Corn Pheromone Trap Network Survey
 Title: Western New York Sweet Corn Pheromone Trap Network Survey Project leader(s): Marion Zuefle Cooperator(s): Abstract: The New York sweet corn pheromone trap network (SCPTN) is an affiliation of extension
SPARKLING WINE IN THE CANADIAN MARKET
 SPARKLING WINE IN THE CANADIAN MARKET July 2018 Report February 2018 1 Wine Intelligence 2018 Sparkling Wine Report overview The Sparkling Wine report includes: Report with the latest information regarding
Menu Labeling Evaluation
 Menu Labeling Evaluation Recommendations for restaurants Drexel University, School of Public Health Introduction Americans currently purchase over one-third of their calories dining out. Recent rising
The Grocer: Food-to-go Research on behalf of The Grocer October 2018
 The Grocer: Food-to-go Research on behalf of The Grocer October 2018 Lucia Juliano Head of CPG & Retail Research +44 (0) 161 242 1371 ljuliano@harrisinteractive.co.uk 1 Almost two-thirds of people buy
The Market for Northeastern Grown Hops 1
 The Market for Northeastern Grown Hops 1 A century and half ago, Madison and Otsego counties in New York led the Western Hemisphere in hops production. Good growing conditions and proximity to large urban
Running Head: MESSAGE ON A BOTTLE: THE WINE LABEL S INFLUENCE p. 1. Message on a bottle: the wine label s influence. Stephanie Marchant
 Running Head: MESSAGE ON A BOTTLE: THE WINE LABEL S INFLUENCE p. 1 Message on a bottle: the wine label s influence Stephanie Marchant West Virginia University Running Head: MESSAGE ON A BOTTLE: THE WINE
Dietary Diversity in Urban and Rural China: An Endogenous Variety Approach
 Dietary Diversity in Urban and Rural China: An Endogenous Variety Approach Jing Liu September 6, 2011 Road Map What is endogenous variety? Why is it? A structural framework illustrating this idea An application
De La Salle University Dasmariñas
 A COMPARATIVE STUDY OF THE LEVEL OF CUSTOMER SATISFACTION OF J.CO DONUTS IN SM DASMARIÑAS & KRISPY KREME THE DISTRICT IMUS An Undergraduate Thesis Presented to The Faculty of Hospitality Management De
Get Schools Cooking Application
 Get Schools Cooking Application Application Instructions Get Schools Cooking (GSC) provides a broad range of support to participating districts, offering peer to peer relationships, training opportunities,
Customer Survey Summary of Results March 2015
 Customer Survey Summary of Results March 2015 Overview In February and March 2015, we conducted a survey of customers in three corporate- owned Bruges Waffles & Frites locations: Downtown Salt Lake City,
STUDY REGARDING THE RATIONALE OF COFFEE CONSUMPTION ACCORDING TO GENDER AND AGE GROUPS
 STUDY REGARDING THE RATIONALE OF COFFEE CONSUMPTION ACCORDING TO GENDER AND AGE GROUPS CRISTINA SANDU * University of Bucharest - Faculty of Psychology and Educational Sciences, Romania Abstract This research
TOOLS AND TECHNIQUES FOR MEASURING THE OBESOGENIC ENVIRONMENT
 Brussels - November 19 th 2015 Symposium on Obesogenic environments TOOLS AND TECHNIQUES FOR MEASURING THE OBESOGENIC ENVIRONMENT Workpackage 3 Obesogenic environment(s) Obesity ENVIRONMENT Physical/built
18 May Primary Production Select Committee Parliament Buildings Wellington
 18 May 2017 Primary Production Select Committee Parliament Buildings Wellington select.committees@parliament.govt.nz PO Box 10232, The Terrace, Wellington 6143 Level 4, Co-operative Bank Building 20 Balance
NEWS RELEASE. B.C. winery is served Buy Local funding
 For Immediate Release 2017AGRI0041-000845 March 27, 2017 NEWS RELEASE B.C. winery is served Buy Local funding OLIVER From soil to sunshine to scenic vineyards, wineries throughout B.C. are giving British
Predictors of Repeat Winery Visitation in North Carolina
 University of Massachusetts Amherst ScholarWorks@UMass Amherst Tourism Travel and Research Association: Advancing Tourism Research Globally 2013 ttra International Conference Predictors of Repeat Winery
A Web Survey Analysis of the Subjective Well-being of Spanish Workers
 A Web Survey Analysis of the Subjective Well-being of Spanish Workers Martin Guzi Masaryk University Pablo de Pedraza Universidad de Salamanca APPLIED ECONOMICS MEETING 2014 Frey and Stutzer (2010) state
Foodservice EUROPE. 10 countries analyzed: AUSTRIA BELGIUM FRANCE GERMANY ITALY NETHERLANDS PORTUGAL SPAIN SWITZERLAND UK
 Foodservice EUROPE MARKET INSIGHTS & CHALLENGES 2015 2016 2017 2020 Innovative European Foodservice Experts 18, avenue Marcel Anthonioz BP 28 01220 Divonne-les-Bains - France 10 countries analyzed: AUSTRIA
Local Food Action Plan Columbus City and Franklin County, Ohio Consumer Survey Summary. Overview
 Local Food Action Plan Columbus City and Franklin y, Ohio Consumer Survey Summary Overview An online survey was developed by the Local Food Action Plan Team, consisting of Columbus Public Health, Local
ASSESSING THE HEALTHFULNESS OF FOOD PURCHASES AMONG LOW-INCOME AREA SHOPPERS IN THE NORTHEAST
 ASSESSING THE HEALTHFULNESS OF FOOD PURCHASES AMONG LOW-INCOME AREA SHOPPERS IN THE NORTHEAST ALESSANDRO BONANNO 1,2 *LAUREN CHENARIDES 2 RYAN LEE 3 1 Wageningen University, Netherlands 2 Penn State University
Commercial Representation in China Service description
 Commercial Representation in China Service description Selling wine in China Enter the largest market in the world The Chinese market is one of the largest in the world in import of wine, and continues
THE ECONOMIC IMPACT OF MODEL WINERIES IN TEXAS. Industry Report
 THE ECONOMIC IMPACT OF MODEL WINERIES IN TEXAS Industry Report by Pati Mamardashvili, PhD International School of Economics at Tbilisi State University, Tbilisi, Georgia Tim Dodd, PhD Texas Tech University,