segregation and educational opportunity
|
|
|
- Wesley Booker
- 5 years ago
- Views:
Transcription
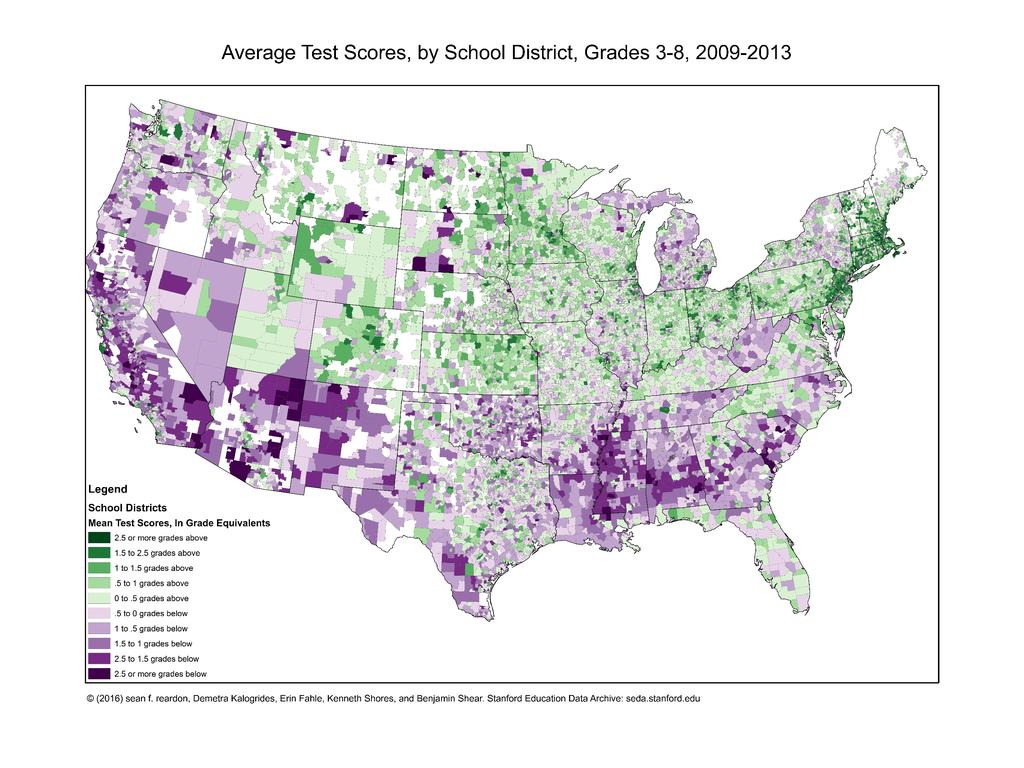
1 segregation and educational opportunity new evidence from population data sean f. reardon stanford university october, 2017
2 Data ( Average district-level standardized test scores (on state accountability tests) 11,280 geographic school districts (including local charter schools) and 384 metropolitan areas Grades 3-8 Math & ELA (today I m reporting average of Math and ELA) (10 cohorts of students entering K in ) By race/ethnicity and economic disadvantage Based on ~300,000,000 test scores Scores are placed on common scale across states, years, and grades Demographic data Family characteristics (of families with children in public schools) From American Community Survey (ACS)
3
4 Academic Achievement and Socioeconomic Status US School Districts, Partial Associations of Achievement Gaps, Gap Changes, and Local Characteristics White-Black Gaps White-Hispanic Gaps Levels Slopes Levels Slopes Bivariate Correlations Racial Socioeconomic Disparities White-Minority Income Gap 0.415*** 0.073*** 0.413*** White-Minority Education Gap 0.558*** 0.139*** 0.423*** Segregation Minority-White School Poverty Difference *** *** *** ** Multivariate Regression Coefficients Racial Socioeconomic Disparities White-Minority Income Gap ** White-Minority Education Gap 0.169*** *** Segregation Minority-White School Poverty *** Difference 0.904*** 0.708*** * Sample Size <----- Poor/Disadvantaged Affluent/Advantaged -----> Note: ***p<=.001; **p<=.01; *p<=.05; models include measures of socioeconomic characteristics, racial composition, and school resources Average Achievement (Grade Levels)
5 Academic Achievement and Socioeconomic Status, by Poverty Status Non-Poor Students Poor Students <----- Poor/Disadvantaged Affluent/Advantaged -----> Average Achievement (Grade Levels) US School Districts,
6 Academic Achievement and Socioeconomic Status, by Race/Ethnicity US School Districts with at least 20 students/grade of a given race/ethnicity, White Students Hispanic Students Black Students <----- Poor/Disadvantaged Affluent/Advantaged -----> Race-Specific District Socioeconomic Status Average Achievement (Grade Levels)
7 Does segregation matter? This is another way of asking whether neighborhoods and schools affect children s opportunities If so, how?


8 Housing Policy, Discrimination, Preference, Historical Legacy,
9 Which dimension(s) of segregation are related to achievement gaps? Residential vs School Segregation Are schools or neighborhoods the more important context? Between-School/Neighborhood vs Between-District Do processes operate at local or larger scale? Exposure vs Uneveness Does the composition of minority students contexts matter per se, or the difference in minority and white students contexts? Racial vs Socioeconomic Contexts Which is better proxy for the key processes of segregation?
10 Bivariate Correlations Between White-Black Achievement Gap and Various Dimensions of Segregation, 311 Metropolitan Areas, School Segregation Residential Segregation Between-School Between-District Between-School Between-District Black Students' Exposure to: Black Neighbors/Classmates *** *** *** *** Poor Neighbors/Classmates *** ** *** Difference Between Black and White Students' Exposure to: Black Neighbors/Classmates *** *** *** *** Poor Neighbors/Classmates *** *** *** *** Note: each cell is the bivariate correlation between the pooled white-black achievement gap and a measure of segregation. * p<.05; ** p<.01; *** p<.001.
11 Bivariate Correlations Between White-Black Achievement Gap and Various Dimensions of Segregation, 311 Metropolitan Areas, School Segregation Residential Segregation Between-School Between-District Between-School Between-District Black Students' Exposure to: Black Neighbors/Classmates *** *** *** *** Poor Neighbors/Classmates *** ** *** Difference Between Black and White Students' Exposure to: Black Neighbors/Classmates *** *** *** *** Poor Neighbors/Classmates *** *** *** *** Note: each cell is the bivariate correlation between the pooled white-black achievement gap and a measure of segregation. * p<.05; ** p<.01; *** p<.001.
12 Bivariate Correlations Between White-Hispanic Achievement Gap and Various Dimensions of Segregation, 318 Metropolitan Areas, School Segregation Residential Segregation Between-School Between-District Between-School Between-District Hispanic Students' Exposure to: Hispanic Neighbors/Classmates *** *** *** *** Poor Neighbors/Classmates * * Difference Between Hispanic and White Students' Exposure to: Hispanic Neighbors/Classmates *** *** *** *** Poor Neighbors/Classmates *** *** *** *** Note: each cell is the bivariate correlation between the pooled white-hispanic achievement gap and a measure of segregation. * p<.05; ** p<.01; *** p<.001.
13 Bivariate Correlations Between White-Hispanic Achievement Gap and Various Dimensions of Segregation, 318 Metropolitan Areas, School Segregation Residential Segregation Between-School Between-District Between-School Between-District Hispanic Students' Exposure to: Hispanic Neighbors/Classmates *** *** *** *** Poor Neighbors/Classmates * * Difference Between Hispanic and White Students' Exposure to: Hispanic Neighbors/Classmates *** *** *** *** Poor Neighbors/Classmates *** *** *** *** Note: each cell is the bivariate correlation between the pooled white-hispanic achievement gap and a measure of segregation. * p<.05; ** p<.01; *** p<.001.
14 Average Proportion of Poor Students in Black and White Students' Schools US Metropolitan Areas, Average Proportion of Poor Students in Hispanic and White Students' Schools US Metropolitan Areas, Average Proportion of Poor Students in Black Students' Schools Average Proportion of Poor Students in Hispanic Students' Schools Average Proportion of Poor Students in White Students' Schools Average Proportion of Poor Students in White Students' Schools 0.0
15 Exposure to School Poverty, by Race, Averaged Across Metropolitan Areas Black Hispanic White 0% Year 60% 50% 40% 30% 20% 10% Percent Poor in Average Student's School
16 Racial Differences in Exposure to School Poverty, Averaged Across Metropolitan Areas Black-White Difference Hispanic-White Difference % 2015 Year 20% 15% 10% 5% Difference in Average School Poverty Rate
17 Association Between White-Black Achievement Gap and Segregation (Racial Difference in Exposure to School Poverty) US Metropolitan Areas, Metropolitan Area Achievement Gap Difference in Exposure to School Poverty
18 Association Between White-Hispanic Achievement Gap and Segregation (Racial Difference in Exposure to School Poverty) US Metropolitan Areas, Metropolitan Area Achievement Gap Difference in Exposure to School Poverty
19 Coefficient Estimates from Multivariate Regression Models of the Association Between White-Black Achievement Gap and Segregation, 311 Metropolitan Areas, Difference Between Black and White Students' Exposure to: District enrollment proportion black (0.295) District residents proportion black (0.314) District enrollment proportion poor *** (0.160) District residents proportion poor (0.562) School enrollment proportion black Neighborhood residents proportion black School enrollment proportion poor Neighborhood residents proportion poor Adjusted R-squared Model 1 Model 2 Model 3 Model 4 Model 5 All models include controls for racial disparities in family socioeconomic status, metropolitan area racial and socioeconomic composition, metropolitan area fragmentation, and average per pupil spending. * p<.05; ** p<.01; *** p<
20 Coefficient Estimates from Multivariate Regression Models of the Association Between White-Black Achievement Gap and Segregation, 311 Metropolitan Areas, Difference Between Black and White Students' Exposure to: District enrollment proportion black (0.295) District residents proportion black (0.314) District enrollment proportion poor *** (0.160) District residents proportion poor (0.562) School enrollment proportion black Neighborhood residents proportion black School enrollment proportion poor Neighborhood residents proportion poor Adjusted R-squared Model 1 Model 2 Model 3 Model 4 Model 5 All models include controls for racial disparities in family socioeconomic status, metropolitan area racial and socioeconomic composition, metropolitan area fragmentation, and average per pupil spending. * p<.05; ** p<.01; *** p<
21 Coefficient Estimates from Multivariate Regression Models of the Association Between White-Black Achievement Gap and Segregation, 311 Metropolitan Areas, Difference Between Black and White Students' Exposure to: District enrollment proportion black (0.295) District residents proportion black (0.314) District enrollment proportion poor *** (0.160) District residents proportion poor (0.562) School enrollment proportion black (0.161) Neighborhood residents proportion black (0.159) School enrollment proportion poor *** (0.132) Neighborhood residents proportion poor (0.283) Adjusted R-squared Model 1 Model 2 Model 3 Model 4 Model 5 All models include controls for racial disparities in family socioeconomic status, metropolitan area racial and socioeconomic composition, metropolitan area fragmentation, and average per pupil spending. * p<.05; ** p<.01; *** p<.001.
22 Coefficient Estimates from Multivariate Regression Models of the Association Between White-Black Achievement Gap and Segregation, 311 Metropolitan Areas, Model 1 Model 2 Model 3 Model 4 Model 5 Difference Between Black and White Students' Exposure to: District enrollment proportion black (0.295) (0.321) District residents proportion black (0.314) (0.319) District enrollment proportion poor *** * (0.160) (0.230) District residents proportion poor (0.562) (0.580) School enrollment proportion black (0.161) (0.224) Neighborhood residents proportion black (0.159) (0.167) School enrollment proportion poor *** (0.132) (0.213) Neighborhood residents proportion poor (0.283) (0.300) Adjusted R-squared All models include controls for racial disparities in family socioeconomic status, metropolitan area racial and socioeconomic composition, metropolitan area fragmentation, and average per pupil spending. * p<.05; ** p<.01; *** p<.001.
23 Coefficient Estimates from Multivariate Regression Models of the Association Between White-Black Achievement Gap and Segregation, 311 Metropolitan Areas, Model 1 Model 2 Model 3 Model 4 Model 5 Difference Between Black and White Students' Exposure to: District enrollment proportion black (0.295) (0.321) District residents proportion black (0.314) (0.319) District enrollment proportion poor *** * (0.160) (0.230) (0.148) District residents proportion poor (0.562) (0.580) School enrollment proportion black (0.161) (0.224) Neighborhood residents proportion black (0.159) (0.167) School enrollment proportion poor *** *** (0.132) (0.213) (0.145) Neighborhood residents proportion poor (0.283) (0.300) Adjusted R-squared All models include controls for racial disparities in family socioeconomic status, metropolitan area racial and socioeconomic composition, metropolitan area fragmentation, and average per pupil spending. * p<.05; ** p<.01; *** p<.001.
24 Coefficient Estimates from Multivariate Regression Models of the Association Between White-Black Achievement Gap and Segregation, 311 Metropolitan Areas, Model 1 Model 2 Model 3 Model 4 Model 5 Difference Between Black and White Students' Exposure to: District enrollment proportion black (0.295) (0.321) District residents proportion black (0.314) (0.319) District enrollment proportion poor *** * (0.160) (0.230) (0.148) District residents proportion poor (0.562) (0.580) School enrollment proportion black (0.161) (0.224) Neighborhood residents proportion black (0.159) (0.167) School enrollment proportion poor *** *** *** (0.132) (0.213) (0.145) (0.079) Neighborhood residents proportion poor (0.283) (0.300) Adjusted R-squared All models include controls for racial disparities in family socioeconomic status, metropolitan area racial and socioeconomic composition, metropolitan area fragmentation, and average per pupil spending. * p<.05; ** p<.01; *** p<.001.
25 Coefficient Estimates from Multivariate Regression Models of the Association Between White-Hispanic Achievement Gap and Segregation, 318 Metropolitan Areas, Model 1 Model 2 Model 3 Model 4 Model 5 Difference Between Hispanic and White Students' Exposure to: District enrollment proportion Hispanic (0.236) (0.307) District residents proportion Hispanic (0.332) (0.323) District enrollment proportion poor * (0.189) (0.250) (0.163) District residents proportion poor (0.734) (0.776) School enrollment proportion Hispanic (0.227) (0.288) Neighborhood residents proportion Hispanic (0.284) (0.285) School enrollment proportion poor *** ** *** *** (0.151) (0.219) (0.162) (0.091) Neighborhood residents proportion poor (0.332) (0.366) Adjusted R-squared All models include controls for racial disparities in family socioeconomic status, metropolitan area racial and socioeconomic composition, metropolitan area fragmentation, and average per pupil spending. * p<.05; ** p<.01; *** p<.001.
26 Coefficient Estimates from Multivariate Regression Models of the Association Between White-Hispanic Achievement Gap and Segregation, 318 Metropolitan Areas, Model 1 Model 2 Model 3 Model 4 Model 5 Difference Between Hispanic and White Students' Exposure to: District enrollment proportion Hispanic (0.236) (0.307) District residents proportion Hispanic (0.332) (0.323) District enrollment proportion poor * (0.189) (0.250) (0.163) District residents proportion poor (0.734) (0.776) School enrollment proportion Hispanic (0.227) (0.288) Neighborhood residents proportion Hispanic (0.284) (0.285) School enrollment proportion poor *** ** *** *** (0.151) (0.219) (0.162) (0.091) Neighborhood residents proportion poor (0.332) (0.366) Adjusted R-squared All models include controls for racial disparities in family socioeconomic status, metropolitan area racial and socioeconomic composition, metropolitan area fragmentation, and average per pupil spending. * p<.05; ** p<.01; *** p<.001.
27 White-Black Achievement Gap, by White-Black SES Gap All US School Districts with at least 100 Black & 100 White Students/Grade, White-Black Difference in SES White-Black Gap (Grade levels)
28 White-Black Achievement Gap, by White-Black Segregation All US School Districts with at least 100 Black & 100 White Students/Grade, White-Black Difference in Exposure to Poverty White-Black Gap (Grade levels)
29 White-Black Achievement Growth Rate Gap, by White-Black Segregation All US School Districts with at least 100 Black & 100 White Students/Grade, White-Black Difference in Exposure to Poverty White-Black Growth Gap (Grade levels/year)
30 Poor-Nonpoor Achievement Gap, by FRPL Segregation All US School Districts with at least 200 Students/Grade, Poor-Nonpoor Difference in Exposure to Poverty Nonpoor-Poor Gap (Grade levels)
31 Poor-Nonpoor Achievement Growth Rate Gap, by FRPL Segregation All US School Districts with at least 200 Students/Grade, Poor-Nonpoor Difference in Exposure to Poverty Nonpoor-Poor Growth Gap (Grade levels/year)
32 Partial Associations of Achievement Gaps, Gap Changes, and Local Characteristics White-Black Gaps White-Hispanic Gaps Levels Slopes Levels Slopes Bivariate Correlations Racial Socioeconomic Disparities White-Minority Income Gap *** *** *** White-Minority Education Gap *** *** *** Segregation Minority-White School Poverty Difference *** *** *** ** Multivariate Regression Coefficients Racial Socioeconomic Disparities White-Minority Income Gap ** White-Minority Education Gap *** *** Segregation Minority-White School Poverty Difference *** *** *** * Sample Size Note: ***p<=.001; **p<=.01; *p<=.05; models include measures of socioeconomic characteristics, racial composition, and school resources
33 School poverty and academic performance The racial/ethnic difference in exposure to school poverty is consistently the measure of segregation most strongly correlated with achievement gaps This is true in bivariate models and multivariate models And is true of changes in achievement gaps as well Coefficients are large: they imply that segregation is independently associated with 15-20% of racial achievement gaps Imply that school poverty is associated with achievement: a 20% difference in the proportion of poor classmates is associated with a SD difference in achievement (in ~6 th grade) SD difference in annual achievement growth (during 3-8 th grades)
34 School poverty and academic performance BUT these analyses do not identify segregation mechanisms They indicate that school poverty is the best proxy for, or is most proximal to, the operative mechanisms of segregation Other forms of segregation (residential, racial, between-district) may operate through differential exposure to school poverty These results do not imply peer effects (though they might): Highpoverty schools may be lower-quality for many reasons: hard to attract most skilled teachers; less parental social/political capital, lower peer achievement may affect curriculum/instruction, etc.)
35 Stanford Education Data Archive (SEDA) Available at These data exist thanks to the following people: Ross Santy, Michael Hawes, Marilyn Seastrom (US Dept. of Education) Andrew Ho (Harvard University) Demetra Kalogrides, Kenneth Shores, Ben Shear, Erin Fahle (Stanford University) Funding support from Institute of Education Sciences Spencer Foundation William T. Grant Foundation Bill and Melinda Gates Foundation Overdeck Family Foundation
36
An Intersectional Analysis of the Female Postsecondary Advantage: Gender, Race and College Selectivity*
 An Intersectional Analysis of the Female Postsecondary Advantage: Gender, Race and College Selectivity* G o k h a n S a v a s P h D C a n d i d a t e S y r a c u s e U n i v e r s i t y D e p a r t m e
Looking Long: Demographic Change, Economic Crisis, and the Prospects for Reducing Poverty. La Conyuntura vs. the Long-run
 Looking Long: Demographic Change, Economic Crisis, and the Prospects for Reducing Poverty Manuel Pastor June 2009 La Conyuntura vs. the Long-run We tend to think about short-term pressures and politics......
Community differences in availability of prepared, readyto-eat foods in U.S. food stores
 Community differences in availability of prepared, readyto-eat foods in U.S. food stores Shannon N. Zenk, Lisa M. Powell, Leah Rimkus, Zeynep Isgor, Dianne Barker, & Frank Chaloupka Presenter Disclosures
Access to Affordable and Nutritious Food: Measuring and Understanding Food Deserts and Their Consequences
 Access to Affordable and Nutritious Food: Measuring and Understanding Food Deserts and Their Consequences Shelly Ver Ploeg Economic Research Service, USDA Workshop on Farm and Food Policy and Obesity UC-Davis
Child-Directed Marketing at Fast- Food Restaurants: Who is marketing to whom?
 Child-Directed Marketing at Fast- Food Restaurants: Who is marketing to whom? Punam Ohri-Vachaspati, PhD, RD School of Nutrition and Health Promotion, Arizona State University Co-Authors: Zeynep Isgor,
The age of reproduction The effect of university tuition fees on enrolment in Quebec and Ontario,
 The age of reproduction The effect of university tuition fees on enrolment in Quebec and Ontario, 1946 2011 Benoît Laplante, Centre UCS de l INRS Pierre Doray, CIRST-UQAM Nicolas Bastien, CIRST-UQAM Research
PARENTAL SCHOOL CHOICE AND ECONOMIC GROWTH IN NORTH CAROLINA
 PARENTAL SCHOOL CHOICE AND ECONOMIC GROWTH IN NORTH CAROLINA DR. NATHAN GRAY ASSISTANT PROFESSOR BUSINESS AND PUBLIC POLICY YOUNG HARRIS COLLEGE YOUNG HARRIS, GEORGIA Common claims. What is missing? What
Healthy Food Access Policy JOHN WEIDMAN THE FOOD TRUST
 Healthy Food Access Policy JOHN WEIDMAN THE FOOD TRUST Making the Case Making the Case for Healthy Food Access The Grocery Gap: Who Has Access to Healthy Food and Why It Matters Authors: The Food Trust
Demographic, Seasonal, and Housing Characteristics Associated with Residential Energy Consumption in Texas, 2010
 Demographic, Seasonal, and Housing Characteristics Associated with Residential Energy Consumption in Texas, 2010 Lila Valencia, Carlos Valenzuela, Jeff Jordan, Steve White, Lloyd Potter Institute for Demographic
November 9, Myde Boles, Ph.D. Program Design and Evaluation Services Multnomah County Health Department and Oregon Public Health Division
 November 9, 2010 Myde Boles, Ph.D. Program Design and Evaluation Services Multnomah County Health Department and Oregon Public Health Division Presenter Disclosures Myde Boles No Relationships to Disclose
RESEARCH UPDATE from Texas Wine Marketing Research Institute by Natalia Kolyesnikova, PhD Tim Dodd, PhD THANK YOU SPONSORS
 RESEARCH UPDATE from by Natalia Kolyesnikova, PhD Tim Dodd, PhD THANK YOU SPONSORS STUDY 1 Identifying the Characteristics & Behavior of Consumer Segments in Texas Introduction Some wine industries depend
Monroe Community College Graduation and Transfer out Rates
 Monroe Community College Graduation and Transfer out Rates FRESHMAN-COHORT GRADUATION AND TRANSFER OUT RATES All Students Student-Athletes 2013 Graduation Rate 23% 44% Four-Class Average Graduation Rate
COLLEGE EMPLOYEE SATISFACTION SURVEY RESULTS Gallaudet University - Fall Comparison to 4-year, Private not-for-profit Institutions
 - Fall 2017 - to 4-year, Private not-for-profit Institutions Section 1: Campus Culture and Policies RATE IMPORTANCE (1 = "Not important at all" / 5 = "Very important") AND SATISFACTION (1 = IMP Sign SAT
Characteristics of U.S. Veal Consumers
 Characteristics of U.S. Veal Consumers by Jason Henderson and Ken Foster Staff Paper -2 April 2 Dept. of Agricultural Economics Purdue University Purdue University is committed to the policy that all persons
Debt and Debt Management among Older Adults
 Debt and Debt Management among Older Adults Annamaria Lusardi and Olivia S. Mitchell Consumption and Finance Conference Julis-Rabinowitz Center for Public Policy and Finance February 20, 2014 Research
Religion, Housing Discrimination, and Residential Attainment in Philadelphia: Are Muslims Disadvantaged?
 Religion, Housing Discrimination, and Residential Attainment in Philadelphia: Are Muslims Disadvantaged? Samantha Friedman Associate Professor of Sociology Department of Sociology University at Albany,
Western Washington University
 Western Washington University FRESHMAN-COHORT GRADUATION RATES All Students Student-Athletes # 2010-11 Graduation Rate 69% 83% Four-Class Average 70% 71% Student-Athlete Academic Success Rate 90% 1. Graduation-Rates
2014 High School Graduates Christian Academy of Madison
 Going (within a year of high school graduation) High School Graduates Enrolling in Breakdown High School Diploma Type # of HS Graduates # Enrolled in % Enrolled in Honors *** *** *** Core 40 *** *** ***
West Virginia Wesleyan College
 West Virginia Wesleyan College FRESHMAN-COHORT GRADUATION RATES All Students Student-Athletes # 2010-11 Graduation Rate 50% 64% Four-Class Average 55% 61% Student-Athlete Academic Success Rate 70% 1. Graduation-Rates
Iola Roberts Elementary School
 State Board of Education School Report Card 2006-2007 Iola Roberts Elementary School State Board of Education Members Gov. Bob Riley, Board President Randy McKinney, President Pro Tem, District 1 Betty
Comparative Analysis of Fresh and Dried Fish Consumption in Ondo State, Nigeria
 Comparative Analysis of Fresh and Dried Fish Consumption in Ondo State, Nigeria Mafimisebi, T.E. (Ph.D) Department of Agricultural Business Management School of Agriculture & Natural Resources Mulungushi
*p <.05. **p <.01. ***p <.001.
 Table 1 Weighted Descriptive Statistics and Zero-Order Correlations with Fatherhood Timing (N = 1114) Variables Mean SD Min Max Correlation Interaction time 280.70 225.47 0 1095 0.05 Interaction time with
United Way of Northern Shenandoah Valley Community Needs Update:
 United Way of Northern Shenandoah Valley Community Needs Update: 2014 2017 A report of conditions, trends and human service priorities impacting the critical needs of the people of the Northern Shenandoah
George Mason University
 George Mason University FRESHMAN-COHORT GRADUATION RATES All Students Student-Athletes # 2009-10 Graduation Rate 69% 78% Four-Class Average 67% 70% Student-Athlete Graduation Success Rate 86% 1. Graduation-Rates
Availability of Healthy Snacks in Stores Near Low-Income Urban, High-Income Urban, and Rural Elementary/Middle Schools
 Nancy Findholt, PhD, RN Associate Professor, OHSU Hayley Pickus, BA Portland State University Availability of Healthy Snacks in Stores Near Low-Income Urban, High-Income Urban, and Rural Elementary/Middle
Problem. Background & Significance 6/29/ _3_88B 1 CHD KNOWLEDGE & RISK FACTORS AMONG FILIPINO-AMERICANS CONNECTED TO PRIMARY CARE SERVICES
 CHD KNOWLEDGE & RISK FACTORS AMONG FILIPINO-AMERICANS CONNECTED TO PRIMARY CARE SERVICES Background & Significance Who are the Filipino- Americans? Alona D. Angosta, PhD, APN, FNP, NP-C Assistant Professor
Measuring economic value of whale conservation
 Measuring economic value of whale conservation Comparison between Australia and Japan Miho Wakamatsu, Kong Joo Shin, and Shunsuke Managi Urban Institute and Dept. of Urban & Env. Engineering, School of
Southern New Hampshire University
 Southern New Hampshire University FRESHMAN-COHORT GRADUATION RATES All Students Student-Athletes # 2009-10 Graduation Rate 60% 59% Four-Class Average 55% 62% Student-Athlete Academic Success Rate 79% 1.
Auburn University at Montgomery
 Auburn University at Montgomery FRESHMAN-COHORT GRADUATION RATES All Students Student-Athletes # 2011-12 Graduation Rate 28% 58% Four-Class Average 24% 34% Student-Athlete Academic Success Rate 56% 1.
Power and Priorities: Gender, Caste, and Household Bargaining in India
 Power and Priorities: Gender, Caste, and Household Bargaining in India Nancy Luke Associate Professor Department of Sociology and Population Studies and Training Center Brown University Nancy_Luke@brown.edu
Senior poverty in Canada, : A decomposition analysis of income and poverty rates
 Senior poverty in Canada, 1973-2006: A decomposition analysis of income and poverty rates Tammy Schirle Department of Economics Wilfrid Laurier University October 2010 Preliminary and Incomplete - Please
Dietary Diversity in Urban and Rural China: An Endogenous Variety Approach
 Dietary Diversity in Urban and Rural China: An Endogenous Variety Approach Jing Liu September 6, 2011 Road Map What is endogenous variety? Why is it? A structural framework illustrating this idea An application
Grandview Elementary School
 State Board of Education School Report Card for 2003-2004 Grandview Elementary School State Board of Education Members Gov. Bob Riley, Board President Sandra Ray, President Pro Tem and Presiding Officer,
Gender and Firm-size: Evidence from Africa
 World Bank From the SelectedWorks of Mohammad Amin March, 2010 Gender and Firm-size: Evidence from Africa Mohammad Amin Available at: https://works.bepress.com/mohammad_amin/20/ Gender and Firm size: Evidence
Attalla City. Superintendent Mr. Danny L. Golden
 State Board of Education School Report Card 2006-2007 Attalla City State Board of Education Members Gov. Bob Riley, Board President Randy McKinney, President Pro Tem, District 1 Betty Peters, District
Opelika City. Superintendent Dr. Mark D. Neighbors
 State Board of Education School Report Card 2006-2007 Opelika City State Board of Education Members Gov. Bob Riley, Board President Randy McKinney, President Pro Tem, District 1 Betty Peters, District
A Comparison of X, Y, and Boomer Generation Wine Consumers in California
 A Comparison of,, and Boomer Generation Wine Consumers in California Marianne McGarry Wolf, Scott Carpenter, and Eivis Qenani-Petrela This research shows that the wine market in the California is segmented
The Food Environment in Elementary Schools. Lindsey Turner, Ph.D.
 The Food Environment in Elementary Schools Lindsey Turner, Ph.D. Presenter Disclosures Lindsey Turner The following personal financial relationships with commercial interests relevant to this presentation
This is a repository copy of Poverty and Participation in Twenty-First Century Multicultural Britain.
 This is a repository copy of Poverty and Participation in Twenty-First Century Multicultural Britain. White Rose Research Online URL for this paper: http://eprints.whiterose.ac.uk/105597/ Version: Supplemental
Get Schools Cooking Application
 Get Schools Cooking Application Application Instructions Get Schools Cooking (GSC) provides a broad range of support to participating districts, offering peer to peer relationships, training opportunities,
Volume 30, Issue 1. Gender and firm-size: Evidence from Africa
 Volume 30, Issue 1 Gender and firm-size: Evidence from Africa Mohammad Amin World Bank Abstract A number of studies show that relative to male owned businesses, female owned businesses are smaller in size.
ASSESSING THE HEALTHFULNESS OF FOOD PURCHASES AMONG LOW-INCOME AREA SHOPPERS IN THE NORTHEAST
 ASSESSING THE HEALTHFULNESS OF FOOD PURCHASES AMONG LOW-INCOME AREA SHOPPERS IN THE NORTHEAST ALESSANDRO BONANNO 1,2 *LAUREN CHENARIDES 2 RYAN LEE 3 1 Wageningen University, Netherlands 2 Penn State University
DATA AND ASSUMPTIONS (TAX CALCULATOR REVISION, MARCH 2017)
") DATA AND ASSUMPTIONS (TAX CALCULATOR REVISION, MARCH 2017) Taxes on sugary drinks can generate considerable revenue for states, cities, and the nation. The revised Revenue Calculator for Sugary Drink Taxes
DATA AND ASSUMPTIONS (TAX CALCULATOR REVISION, MARCH 2017) Taxes on sugary drinks can generate considerable revenue for states, cities, and the nation. The revised Revenue Calculator for Sugary Drink Taxes
Principal Mr. James K. Pharr. Superintendent Mr. Bill Moss
 State Board of Education School Report Card 2006-2007 Vina High School State Board of Education Members Gov. Bob Riley, Board President Randy McKinney, President Pro Tem, District 1 Betty Peters, District
Principal Mr. L E. Franks. Superintendent Mrs. Kathi L. Wallace
 State Board of Education School Report Card 2006-2007 Luverne High School State Board of Education Members Gov. Bob Riley, Board President Randy McKinney, President Pro Tem, District 1 Betty Peters, District
Food Policy, Economics and Obesity Prevention
 Food Policy, Economics and Obesity Prevention Lisa M. Powell, Ph.D. Institute for Health Policy and Research University of Illinois at Chicago National Cancer Institute Eighth Annual Cancer Prevention
Running Head: A HILLSBOROUGH COUNTY MULTILEVEL ANALYSIS 1
 Running Head: A HILLSBOROUGH COUNTY MULTILEVEL ANALYSIS 1 A Hillsborough County Multilevel Analysis of Food Disparities among Race and Socioeconomic Groups Beulah Dinah Joseph and Ivonne M. DelValle Thesis
Food and Physical Activity Deserts in Cincinnati: Myths and Realties
 Food and Physical Activity Deserts in Cincinnati: Myths and Realties Dr. Chris Auffrey Mr. Sagar Shah School of Planning University of Cincinnati Data! Fostering Health Information in Kentucky and Ohio
1) What proportion of the districts has written policies regarding vending or a la carte foods?
 What proportion of the districts has written policies regarding vending or a la carte foods?") Rhode Island School Nutrition Environment Evaluation: Vending and a La Carte Food Policies Rhode Island Department of Education ETR Associates - Education Training Research Executive Summary Since 2001,
Rhode Island School Nutrition Environment Evaluation: Vending and a La Carte Food Policies Rhode Island Department of Education ETR Associates - Education Training Research Executive Summary Since 2001,
Transportation demand management in a deprived territory: A case study in the North of France
 Transportation demand management in a deprived territory: A case study in the North of France Hakim Hammadou and Aurélie Mahieux mobil. TUM 2014 May 20th, 2014 Outline 1) Aim of the study 2) Methodology
MOVING TO AN EIGHT PERIOD DAY AT RHS. Frank Howlett Sean Siet
 MOVING TO AN EIGHT PERIOD DAY AT RHS Frank Howlett Sean Siet NON-APPLICABLE Affect on safety and welfare APPLICABLE Percentage of children impacted Direct costs compared to alternatives Student achievement
2. The proposal has been sent to the Virtual Screening Committee (VSC) for evaluation and will be examined by the Executive Board in September 2008.
 for evaluation and will be examined by the Executive Board in September 2008.") WP Board 1052/08 International Coffee Organization Organización Internacional del Café Organização Internacional do Café Organisation Internationale du Café 20 August 2008 English only Projects/Common
WP Board 1052/08 International Coffee Organization Organización Internacional del Café Organização Internacional do Café Organisation Internationale du Café 20 August 2008 English only Projects/Common
New Orleans One Year After Katrina: Obtaining a Representative Sample and Conducting a House-to-House Survey
 New Orleans One Year After Katrina: Obtaining a Representative Sample and Conducting a House-to-House Survey Mollyann Brodie, PhD Vice President, Public Opinion & Media Research, Kaiser Family Foundation
Greenwood Elementary School
 State Board of Education School Report Card 2006-2007 Greenwood Elementary School State Board of Education Members Gov. Bob Riley, Board President Randy McKinney, President Pro Tem, District 1 Betty Peters,
Chapter 3. Labor Productivity and Comparative Advantage: The Ricardian Model
 hapter 3 Labor Productivity and omparative Advantage: The Ricardian Model Preview Opportunity costs and comparative advantage Production possibilities Relative supply, relative demand & relative prices
OF THE VARIOUS DECIDUOUS and
 (9) PLAXICO, JAMES S. 1955. PROBLEMS OF FACTOR-PRODUCT AGGRE- GATION IN COBB-DOUGLAS VALUE PRODUCTIVITY ANALYSIS. JOUR. FARM ECON. 37: 644-675, ILLUS. (10) SCHICKELE, RAINER. 1941. EFFECT OF TENURE SYSTEMS
Fairtrade Buying Behaviour: We Know What They Think, But Do We Know What They Do?
 Fairtrade Buying Behaviour: We Know What They Think, But Do We Know What They Do? Dr. Fred A. Yamoah Prof. Andrew Fearne Dr. Rachel Duffy Dr. Dan Petrovici Background/Context The UK is a major market for
What are the Driving Forces for Arts and Culture Related Activities in Japan?
 What are the Driving Forces for Arts and Culture Related Activities in Japan? Masahiro ARIMA Graduate School of Applied Informatics, University of Hyogo Abstract Purpose of this paper is to grasp the demand
Multiple Imputation for Missing Data in KLoSA
 Multiple Imputation for Missing Data in KLoSA Juwon Song Korea University and UCLA Contents 1. Missing Data and Missing Data Mechanisms 2. Imputation 3. Missing Data and Multiple Imputation in Baseline
ARE THERE SKILLS PAYOFFS IN LOW AND MIDDLE-INCOME COUNTRIES?
 ARE THERE SKILLS PAYOFFS IN LOW AND MIDDLE-INCOME COUNTRIES? Namrata Tognatta SKILLS GSG SEMINARS WEEK Earnings Returns to Schooling and Skills December 7, 2015 Outline Motivation and Research Questions
School food environments and adolescent health
 School food environments and adolescent health Dr Colette Kelly Director Health Promotion Research Centre National University of Ireland Galway Symposium: Obesity across childhood and adolescence EHPS,
Missouri State University
 BCSSE 2008-NSSE 2009 Combined Report Cross-Sectional and Longitudinal Results August 2009 BCSSE 2008-NSSE 2009 Combined Report Interpreting the Cross-Sectional Results The cross-sectional results are based
Chapter 3. Labor Productivity and Comparative Advantage: The Ricardian Model
 Chapter 3 Labor Productivity and Comparative Advantage: The Ricardian Model Preview Opportunity costs and comparative advantage A one-factor Ricardian model Production possibilities Gains from trade Wages
Preview. Chapter 3. Labor Productivity and Comparative Advantage: The Ricardian Model
 Chapter 3 Labor Productivity and Comparative Advantage: The Ricardian Model Preview Opportunity costs and comparative advantage A one-factor Ricardian model Production possibilities Gains from trade Wages
Release #2461 Release Date: Thursday, February 20, 2014
 THE FIELD POLL THE INDEPENDENT AND NON-PARTISAN SURVEY OF PUBLIC OPINION ESTABLISHED IN 1947 AS THE CALIFORNIA POLL BY MERVIN FIELD Field Research Corporation 601 California Street, Suite 900 San Francisco,
Chapter 3. Labor Productivity and Comparative Advantage: The Ricardian Model. Pearson Education Limited All rights reserved.
 Chapter 3 Labor Productivity and Comparative Advantage: The Ricardian Model 1-1 Preview Opportunity costs and comparative advantage A one-factor Ricardian model Production possibilities Gains from trade
HERZLIA MIDDLE SCHOOL
 NAME TEACHER S COMMENT TEACHER CLASS PARENT S COMMENT MARK PERCENTAGE PARENT S SIGNATURE HERZLIA MIDDLE SCHOOL GRADE 7 ECONOMIC & MANAGEMENT SCIENCES 27 AUGUST 2015 TIME: 50 minutes MARKS: 70 o This paper
Availability of Healthy Food in Corner Stores in Hartford, CT
 Availability of Healthy Food in Corner Stores in Hartford, CT Katie S. Martin, PhD University of Connecticut Center for Public Health & Health Policy Lack of Access to Healthy Food Healthy, affordable
Online Appendix. for. Female Leadership and Gender Equity: Evidence from Plant Closure
 Online Appendix for Female Leadership and Gender Equity: Evidence from Plant Closure Geoffrey Tate and Liu Yang In this appendix, we provide additional robustness checks to supplement the evidence in the
Is Fair Trade Fair? ARKANSAS C3 TEACHERS HUB. 9-12th Grade Economics Inquiry. Supporting Questions
 9-12th Grade Economics Inquiry Is Fair Trade Fair? Public Domain Image Supporting Questions 1. What is fair trade? 2. If fair trade is so unique, what is free trade? 3. What are the costs and benefits
Flexible Working Arrangements, Collaboration, ICT and Innovation
 Flexible Working Arrangements, Collaboration, ICT and Innovation A Panel Data Analysis Cristian Rotaru and Franklin Soriano Analytical Services Unit Economic Measurement Group (EMG) Workshop, Sydney 28-29
Principal Ms. Frances Shipp. Superintendent Dr. Judy Stiefel
 State Board of Education School Report Card 2006-2007 Weaver High School State Board of Education Members Gov. Bob Riley, Board President Randy McKinney, President Pro Tem, District 1 Betty Peters, District
Calhoun County. Superintendent Dr. Judy Stiefel
 State Board of Education School Report Card 2006-2007 Calhoun County State Board of Education Members Gov. Bob Riley, Board President Randy McKinney, President Pro Tem, District 1 Betty Peters, District
Caffeine and Theobromine Intakes of Children: Results From CSFII , 1998
 Research Briefs Caffeine and Theobromine Intakes of Children: Results From CSFII 994-96, 998 Jaspreet K.C. Ahuja USDA, Agricultural Research Service Betty P. Perloff USDA, Agricultural Research Service
Anaphylaxis Management in the School Setting
 Anaphylaxis Management in the School Setting Keeping Children Safe Anita Wheeler, RN, MSN School Health Coordinator/Nurse Consultant anita.wheeler@dshs.state.tx.us 1 Learning Objectives The learner will
Perspective of the Labor Market for security guards in Israel in time of terror attacks
 Perspective of the Labor Market for security guards in Israel in time of terror attacks 2000-2004 By Alona Shemesh Central Bureau of Statistics, Israel March 2013, Brussels Number of terror attacks Number
The premium for organic wines
 Enometrics XV Collioure May 29-31, 2008 Estimating a hedonic price equation from the producer side Points of interest: - assessing whether there is a premium for organic wines, and which one - estimating
PIZZA HUT & WINGSTREET
 PIZZA HUT & WINGSTREET NNN Investment 2001 West Highway 52 Rochester, Minnesota 55901 7486 La Jolla Boulevard, Suite 173 La Jolla, California 92037 EXECUTIVE SUMMARY PROPERTY Pizza Hut & WingStreet Restaurant
Labor Supply of Married Couples in the Formal and Informal Sectors in Thailand
 Southeast Asian Journal of Economics 2(2), December 2014: 77-102 Labor Supply of Married Couples in the Formal and Informal Sectors in Thailand Chairat Aemkulwat 1 Faculty of Economics, Chulalongkorn University
Investigating China s Stalled Revolution : Husband and Wife Involvement in Housework in the PRC. Juhua Yang Susan E. Short
 Investigating China s Stalled Revolution : Husband and Wife Involvement in Housework in the PRC Juhua Yang Susan E. Short Department of Sociology Brown University Box 1916 Providence, RI 02912 Contact:
The multivariate piecewise linear growth model for ZHeight and zbmi can be expressed as:
 Bi-directional relationships between body mass index and height from three to seven years of age: an analysis of children in the United Kingdom Millennium Cohort Study Supplementary material The multivariate
Associations of Neighborhood Characteristics With the Location and Type of Food Stores
 RESEARCH AND PRACTICE Associations of Neighborhood Characteristics With the Location and Type of Food Stores Latetia V. Moore, MSPH, and Ana V. Diez Roux, MD, PhD Recent evidence from epidemiological studies
American Hispanics Access to Healthy Foods. Ben Golan
 American Hispanics Access to Healthy Foods Ben Golan Abstract The Food, Conservation and Energy Act of 2008 called for a request for the Economic Research Service to do a study on the prevalence of food
Credit Supply and Monetary Policy: Identifying the Bank Balance-Sheet Channel with Loan Applications. Web Appendix
 Credit Supply and Monetary Policy: Identifying the Bank Balance-Sheet Channel with Loan Applications By GABRIEL JIMÉNEZ, STEVEN ONGENA, JOSÉ-LUIS PEYDRÓ, AND JESÚS SAURINA Web Appendix APPENDIX A -- NUMBER
Family Background, School Choice, and Students Academic Performance: Evidence from Sri Lanka
 Family Background, School Choice, and Students Academic Performance: Evidence from Sri Lanka Harsha Aturupane Tomokazu Nomura Mari Shojo March 2018 Discussion Paper No.1811 GRADUATE SCHOOL OF ECONOMICS
EAT TOGETHER EAT BETTER BEAN MEASURING ACTIVITY
 EAT TOGETHER BEAN MEASURING ACTIVITY EAT BETTER TARGET AUDIENCE Grades 3 & 4 ESTIMATED TIME NUTRITION EDUCATION LEARNING OBJECTIVE CURRICULUM INTEGRATION 50 minutes (may also do in two lessons by teaching
Does Zoning for Healthy Food Access Increase the Availability of Healthy Food Outlets? Jamie F. Chriqui, PhD, MHS
 Does Zoning for Healthy Food Access Increase the Availability of Healthy Food Outlets? Jamie F. Chriqui, PhD, MHS The Obesity Society Annual Meeting Atlanta, Georgia November 14, 2013 Acknowledgments Co-Authors:
The Problem. Enhancing Community Food Safety Awareness: Street Vendors. Community Awareness: Street Vending
 Enhancing Community Food Safety Awareness: Street Vendors Presented by: Terrance Powell, REHS Hector Dela Cruz, REHS, M.S. Los Angeles County Environmental Health Community Awareness: Street Vending Results
Suicide Mortality Risk in the United States by Sex and Age Groups
 Portland State University PDXScholar Sociology Faculty Publications and Presentations Sociology 2012 Suicide Mortality Risk in the United States by Sex and Age Groups Hyeyoung Woo Portland State University,
Preview. Introduction (cont.) Introduction. Comparative Advantage and Opportunity Cost (cont.) Comparative Advantage and Opportunity Cost
 Introduction. Comparative Advantage and Opportunity Cost (cont.) Comparative Advantage and Opportunity Cost") Chapter 3 Labor Productivity and Comparative Advantage: The Ricardian Model Preview Opportunity costs and comparative advantage A one-factor Ricardian model Production possibilities Gains from trade Wages
Chapter 3 Labor Productivity and Comparative Advantage: The Ricardian Model Preview Opportunity costs and comparative advantage A one-factor Ricardian model Production possibilities Gains from trade Wages
AJAE Appendix: Testing Household-Specific Explanations for the Inverse Productivity Relationship
 AJAE Appendix: Testing Household-Specific Explanations for the Inverse Productivity Relationship Juliano Assunção Department of Economics PUC-Rio Luis H. B. Braido Graduate School of Economics Getulio
Preview. Introduction. Chapter 3. Labor Productivity and Comparative Advantage: The Ricardian Model
 Chapter 3 Labor Productivity and Comparative Advantage: The Ricardian Model. Preview Opportunity costs and comparative advantage A one-factor Ricardian model Production possibilities Gains from trade Wages
APPENDIX TABLE OF CONTENTS DOCUMENT TITLE
 PPENDIX TBLE OF CONTENTS PPENDIX LETTER B C PGE NUMBER DOCUMENT TITLE Measurements of Interim Progress Educator Equity in Rates Tables Educator Equity Extension Plan and in
Lecture 13. We continue our discussion of the economic causes of conflict, but now we work with detailed data on a single conflict.
 EC3320 2016-2017 Michael Spagat Lecture 13. We continue our discussion of the economic causes of conflict, but now we work with detailed data on a single conflict. The units of analysis for Collier-Hoefller-Fearon-Laitin
Childhood Obesity Opportunity Spaces: Where are there opportunities to impact the local food environment? THEME 2: HEALTHY HEADSPACE
 Childhood Obesity Opportunity Spaces: Where are there opportunities to impact the local food environment? THEME 2: HEALTHY HEADSPACE 5 opportunity platforms for interventions 2. Healthy Headspace The big
Supply & Demand for Lake County Wine Grapes. Christian Miller Lake County MOMENTUM April 13, 2015
 Supply & Demand for Lake County Wine Grapes Christian Miller Lake County MOMENTUM April 13, 2015 About Full Glass Research Provider of economic, market & industry research to food & drink companies and
Technical Memorandum: Economic Impact of the Tutankhamun and the Golden Age of the Pharoahs Exhibition
 Technical Memorandum: Economic Impact of the Tutankhamun and the Golden Age of the Pharoahs Exhibition Prepared for: The Franklin Institute Science Museum Prepared by: Urban Partners November 2007 Economic
Classification Bias in Commercial Business Lists for Retail Food Outlets in the U.S
 Classification Bias in Commercial Business Lists for Retail Food Outlets in the U.S American Public Health Association Denver, CO, U.S.A., vember 8, 2010 Euna Han, PhD University of Illinois at Chicago
Aging, Social Capital, and Health Care Utilization in the Province of Ontario, Canada
 Aging, Social Capital, and Health Care Utilization in the Province of Ontario, Canada Audrey Laporte, Ph.D.* Eric Nauenberg, Ph.D.* Leilei Shen, Ph.D.** *Dept. of Health Policy, Management and Evaluation,
Alternative Measures of Homeownership Gaps Across Segregated Neighborhoods
 Institute for International Economic Policy Working Paper Series Elliott School of International Affairs The George Washington University Alternative Measures of Homeownership Gaps Across Segregated Neighborhoods