Lincoln University Digital Thesis
|
|
|
- Britton Small
- 5 years ago
- Views:
Transcription

1 Lincoln University Digital Thesis Copyright Statement The digital copy of this thesis is protected by the Copyright Act 1994 (New Zealand). This thesis may be consulted by you, provided you comply with the provisions of the Act and the following conditions of use: you will use the copy only for the purposes of research or private study you will recognise the author's right to be identified as the author of the thesis and due acknowledgement will be made to the author where appropriate you will obtain the author's permission before publishing any material from the thesis.
2 Composition of Volatiles of Pinot Noir Wine as Affected by Differing Levels of DAP Supplementation A thesis submitted in partial fulfilment of the requirements for the Degree of Master of Applied Science at Lincoln University by Susan Joanne Blackmore Lincoln University 2014
3 Abstract of a thesis submitted in partial fulfilment of the requirements for the Degree of Master of Applied Science. Abstract Composition of Volatiles of Pinot Noir Wine as Affected by Differing Levels of DAP Supplementation by Susan Joanne Blackmore Cental Otago Pinot noir grapes from 2009 vintage were fermented as 18 kg microvinifications, using Saccaromyces cerevisiae var. bayanus yeast EC118. The two treatments employed were nitrogen addition to supplement yeast requirements and aging artificially to assess whether any changes caused by the DAP additions were impacted by long-term storage. The resulting three levels of nitrogen were: Control 450 mg/l YAN, 600 mg/l YAN and 700 mg/l YAN. Half the wines were subjected to a short-term artificial ageing (6 weeks at 30 C) and then aged at 8 C for 8.5 months. The remainder were naturally aged for 10 months at 8 C. The chemical composition of the treatment wines was investigated. Standard wine composition parameters were determined (e.g. alcohol, titratable acidity, residual sugar). HS-SPME-GC-MS methods were used to measure specific volatile fatty acids, esters and sulphides. A sensory panel of wine professionals was used to determine if there were sensory differences between the wine treatments. Statistical analysis on the chemical data using MANOVA, principal component analysis, and canonical variate analysis showed the following results: a) esters concentrations tended to decrease with nitrogen addition with the exception of ethyl octanoate, ethyl decanoate, hexyl acetate and ethyl 2 methyl butanoate. Conversely, artificially aging the wines significantly increased the concentration of four esters and decreased hexyl acetate; b) fatty acid concentrations decreased with nitrogen addition with the exception of decanoic acid, which significantly increased. Artificial aging of the wines caused a significant increase in decanoic acid concentration; c) dimethyl sulphide (DMS) decreased across the DAP amendments, however DMS and methanethiol both increased with artificial aging. ii
4 Multidimensional scaling analysis of the sensory data showed the participants could differentiate that the wines had age related differences. Any sensory effects from variations in DAP addition were not able to be perceived either because the variation was to subtle or overwhelmed by the more obvious differences caused by the artificial aging. The aged wines were described as more mature, reduced, jammy with less floral, fruity on the nose. Significant increases in the fatty acid decanoic acid with aging seems to be partially responsible for the maturity characteristics. PLSR results correlated it to the spicy characteristics. Ethyl octanoate and 2 methyl ethyl butanoate were related to maturity and ethyl decanoate and ethyl isobutyrate to jammy. Keywords: Diammonium phosphate, Pinot noir, aroma, New Zealand, ester, fatty acid, sulphide, sensory, dimethyl sulphide, artificial aging, descriptor rating, sorting task, HS-SPME-GC-MS-SIDA, (HS-COC) GC-SCD. iii
5 Acknowledgements I would like to particularly thank my supervisors Dr. Roland Harrison, Dr. Wendy Parr and Dr. James Morton, for their immense guidance, support and encouragement to get this work completed. The statistical assistance of Dr. Richard Sedcole and Dr. James Green was invaluable and provided the direction and way forward to combining the sensory and chemical data. I am particularly grateful for the patience and time dedicated by Dr. Green at a distance and over his holidays. Finally thanks to my family and particularly my partner Stuart, for the patience and support over an extended period. iv
6 Table of Contents Abstract...ii Acknowledgements... iv Table of Contents... v List of Tables... viii List of Figures... ix Chapter 1 Introduction... 1 Chapter 2 Literature Review Wine Quality Wine Aroma and Taste The Contribution of Fermentation to Aroma Esters Volatile Fatty Acids Sulphide Compounds Yeast Available Nitrogen and Mechanisms of Nitrogen Uptake by Yeast Previous Research on the Influence of Nutrition on Red Wine Composition Analytical Tools for the Analysis of Wine Volatiles Research Linking Sensory Perception to Chemical Composition Sensory Analysis Red Wine Aroma Aim of the Study Chapter 3 Winemaking Protocol Introduction Methods Grape Selection Grape Processing Diammonium Phosphate Addition Treatment Microvin Fermentation Wine Aging Treatment...43 Chapter 4 Chemical Analysis Introduction Methods and Materials Chemical Analysis of Juice and Wine Ester Chromatographic Analysis Fatty Acid Chromatographic Analysis Sulphide Chromatographic Analysis Results and Discussion v
7 4.3.1 Standard Chemical Parameters of the Experimental Wines Impact of DAP Addition and Artificial Aging on Concentrations of Esters...51 Effect of DAP Addition on Ester Concentrations...56 Effect of Aging on Ester Concentrations Impact of DAP Addition and Artificial Aging on Concentrations of Fatty Acids...62 Effect of DAP Addition on Fatty Acid Concentration...66 Effect of aging on Fatty Acid Concentrations Impact of DAP Addition and Artificial Aging on Concentrations of Sulphides...69 Effect of DAP addition on Sulphide Concentrations...73 Effect of aging on Sulphide Concentrations...74 Chapter 5 Sensory Analysis Introduction Materials and Methods Participants Experimental wines Sensory Procedures Session Descriptive task: Participant-generated wine description...79 Free sorting task Session Descriptive evaluation rating task...80 Free sorting task Sensory Data Analysis Descriptive rating task: Participant-generated descriptors Data Analysis: Non-directed Sorting Data Analysis: Descriptive Rating Task Sensory Results and Discussion Sorting Task Results Qualitative Data: Participant-generated Descriptors to SortedC Sorting Task: Multidimensional Scaling Results Descriptor Rating Task Results Descriptor Rating Task: Principal Components Analysis Results Chapter 6 Relationship between Sensory and Volatile Aroma Introduction Data Analysis: Comparison Between Sensory and Volatile Aroma Compounds Results: Relationship between Sensory and Volatile Aroma Compounds Discussion: Interrelationship of Chemical and Sensory Results Sensory Implications of Chemical Data Changes in Standard Chemical Parameters Changes in Ester Concentrations and Sensory Results with DAP Amendment Changes in Ester Concentrations and Sensory Results with Aging Changes in Fatty Acid Concentrations and Sensory Results with DAP Amendment Changes in Fatty Acid Concentrations and Sensory Results with Aging Changes in Sulphide Concentrations and Sensory Results with DAP Amendment Changes in Sulphide Concentrations and Sensory Results with Aging Conclusions vi
8 Chapter 7 Future Research Qualifications Appendix A. Sensory Evaluation of Pinot noir Wines in August References vii
9 List of Tables Table 2.1 Acetate Esters Table 2.2 Ethyl Fatty Acid Esters Table 2.3 Branched Chain and Ethyl Cinammic Esters...18 Table 2.4 Fatty Acids...21 Table 2.5 Sulphur Compounds...25 Table 2.6 Ranges of concentration found for aroma compounds previously in Pinot noir...38 Table 4.1 Chemical composition of the experimental Pinot noir juice (Harvested )...49 Table 4.2 Chemical composition of the experimental wines post bottling...49 Table 4.3 Pinot noir Ethyl Fatty Acid Ester concentrations (µg/l) for three treatments of DAP addition and two levels of aging...52 Table 4.4 Pinot noir Ester concentrations (µg/l) for three treatments of DAP addition and two levels of aging...53 Table 4.5 Canonical variate correlations between the latent root vectors and various esters...56 Table 4.6 Pinot noir Fatty Acid concentrations (µg/l) for three treatments of DAP addition and two levels of aging...63 Table 4.7 Correlation matrix for Principle Component Analysis of fatty acid data Table 4.8 Canonical variate correlations matrix values for fatty acids Table 4.9 Determination of low molecular weight sulphur compounds using GC-SCD sulphide Table 4.10 analysis (AWRI 2009) Pinot noir Sulphide concentrations (µg/l) for three treatments of DAP addition and two levels of aging...71 Table 4.11 Canonical variate correlations between the latent root vectors and the sulphide compounds Table 5.1. Descriptive rating task Session 1 results Table 5.2 Descriptors employed in Session 2 Descriptive Rating task Table 5.3 Free Sorting Task Session 1 Category Descriptors...87 Table 5.4 Free Sorting Task Session 2 Category Descriptors...88 Table 5.5 Free Sorting Task - Wine similarity matrices Session Table 5.6 Free Sorting Task - Wine similarity matrices Session Table 5.7 Descriptor Rating Task ANOVA Results DAP Treatment...94 Table 5.8 Descriptor Rating Task ANOVA Results...95 viii
10 List of Figures Figure 2.1 A conceptual model of the quality perception process... 5 Figure 2.2 The quality dimensions for high involvement consumers Figure 2.3 The quality dimensions for low involvement consumers Figure 2.4 Formation of aroma active substances by yeast Figure 2.5 The biosynthetic and degradation pathway for esters...14 Figure 2.6 Fatty acid metabolism Figure 2.7 Central pathways for nitrogen metabolism in a yeast cell...28 Figure 4.1 Canonical variate analysis representation of the mean separation for the ester data Figure 4.2 Canonical variate analysis representation of the mean separation for the fatty acid data Figure 4.3 Canonical variate analysis representation of the mean separation for the sulphide Figure 5.1 data The set-up for each tasting station in the Marlborough Wine Research Centre Sensory room Figure 5.2 MDS and HCA analysis for non-directed sorting task Session Figure 5.3 MDS and HCA analysis for non-directed sorting task Session Figure 5.4 MDS and HCA analysis for pooled Session 1 and 2 Non-directed sorting tasks...92 Figure 5.5 Descriptor rating task PCA Session 2. PCA of the variables that had significant age effects in the ANOVA Figure 6.1 Partial Least Squares Regression (PLSR) of the volatile compounds concentrations (X Figure 6.2 Figure 6.3 loading weights)...99 Partial Least Squares Regression (PLSR) of the volatile compounds concentrations to predict sensory characteristics (Loadings weights, for X (chemical) and Y (sensory)) Partial Least Squares Regression (PLSR) of the volatile compounds concentrations to predict sensory characteristics. The naturally (green) and artificially aged (red) wines are projected on to the shared space ix
11 Chapter 1 Introduction Winemakers strive to improve the quality of their final product as a matter of professional pride but also to maintain and to increase the market share and unit price of the wines they make. The aroma and flavour of a wine is vital to wine quality and therefore understanding the relationship between wine chemical composition and perceived flavour and aroma is of interest to winemakers. As the chemical compounds responsible for sensory subtleties (both positive and negative) are identified it is feasible that the levels of these compounds can be manipulated in the vineyard and or the winery. The primary purpose of this work was to study the influence of one aspect of winemaking on the final aroma of the wine and to endeavour to detect any changes chemically and using sensory evaluation. The variable studied was one readily manipulated by winemakers - that of the addition of inorganic nitrogen to the must to provide a nutrient source for yeast. Pinot noir wines have complex and varied sensory qualities and little research had been done on the compounds that contribute to the perceived aroma of New Zealand Pinot noir, particularly when this study was started in One of the reasons Pinot noir was chosen for the study is that its importance in the New Zealand wine industry export portfolio has increased markedly in the last ten years and it is now the most planted red varietal. In fact Pinot noir overtook Chardonnay in 2011 as the second most produced variety after Sauvignon blanc. The 2013 vintage tonnage for Pinot noir was 31,775 and though this was well behind Sauvignon blanc at 228,781, the other closest red was Merlot at 10,076 tonnes (Winegrowers 2013). The aim of this study was to assess whether Pinot noir aroma was significantly impacted by changes in nitrogen addition during wine fermentation and then by subsequent aging. Previous research has shown that the many variables surrounding yeast fermentation and later wine storage influence wine chemistry and sensory characteristics. The yeast nutrition requirements supplied from the juice or as additives, affect the flavour and aroma compounds formed and their relative concentration (Dubourdieu et al. 2006, Swiegers et al. 2009, Ugliano and Henschke 2008).The total nitrogen available for use by yeast is measured as yeast available nitrogen (YAN) and is determined by adding the concentrations of ammonium and primary amino acid in the must (Butzke 1998). Viticulturalists can influence harvest YAN by additions of nitrogen in the vineyard at key times but total nitrogen and amino acid content, as well as ratios of amino acids in musts have been shown to vary widely at harvest (Bell and Henschke 2005). Early studies in California reported ranges of 60 to 2400 mg N/L, with 50 90% in the form of free amino acids 1
12 and the remainder present as ammonium ions, peptides, proteins and nitrate as well as trace amounts of vitamins, nucleotides and amines (Ough and Amerine 1988). Later research showed that proline was the predominant free amino acid followed by arginine and then alanine but the amounts and ratios were cultivar dependent (Huang and Ough 1991). The yeast available nitrogen is the result of a range of interconnecting variables succinctly summarised in the review by Bell and Henschke (2005) as site (climate and soil), season, cultural practices, cultivar and rootstock, trellis system, canopy management and temperature, and form, timing and rate of nitrogen application. Once in the winery, winemakers can analyse the YAN of the must to ascertain whether an addition of nitrogen (often diammonium phosphate i.e. DAP) is desirable to aid the yeast to complete fermentation and do so without the excessive formation of by-products that can be perceived as faults. Optimal fermentation requirements range from 330 to 530 mg/l YAN depending on yeast strain and sugar content ( Brix) of the must (Jiranek et al. 1995b). It is generally agreed, however, that satisfactory fermentation can still proceed (although at sub-optimal rates) at about 140 mg YAN (Agenbach 1977). Ferments with less than optimal YAN may therefore contain insufficient assimilable nitrogen, leading to low yeast biomass (Agenbach 1977, Salmon 1989), lower sugar uptake (Varela et al. 2004), sluggish or stuck fermentations (Ingledew et al. 1987) and sulphide formation (Jiranek et al. 1995a, Vos and Gray 1979). Thus, it seems that the final quality of a wine may be manipulated by addition of YAN to modulate the concentration of sulphides and other volatile compounds. There is a spectrum of winemaker opinion about the amount of supplementary nitrogen needed to enable a successful red fermentation and quality wine production. At the extreme low end of nitrogen supplementation, in order to comply with specific industry body organic protocols (e.g. USDA National Organic Program) additions of ammonium phosphates are not allowed (United States Department of Agriculture 2002). Some Pinot noir winemakers have a philosophy of not adding any supplementary nitrogen during ferment and are not concerned if sulphides are formed as they consider this contributes to house style (Bicknell 2003). Concentrations of sulphides produced during the ferment have anecdotally been suggested by wine producers as a contributing factor to the elusive wine parameter complexity as well as other components of Pinot noir aroma namely esters and fatty acids. Commonly practice in New Zealand is that producers test juice YAN, compare the analysis to guidelines e.g. Pacific Rim Oenology Catalogue (Van de Water 2013) and make an addition of diammonium phosphate two or three periods during the ferment to avoid a potential sluggish ferment or the production of sulphides. However not all producers have access to YAN analysis on the incoming juice and make prophylactic 2
13 insurance additions of DAP without knowledge of the must s initial YAN. Therefore there is potential for the ferment to have nitrogen concentrations above the optimal range suggested in the literature (Jiranek et al. 1995b). Little research work has been carried out on nitrogen supplementation during red winemaking and the effects of DAP supplementation on red wine aroma composition is only beginning to be studied. This study aimed to assess the chemical and sensory impact on Pinot noir wines if different amounts of nitrogen were added during fermentation. The project design involved producing microvin wines in triplicate using three different levels of supplementary DAP (control, additions of 150 mg/l and 250 mg/l DAP). Half the wines were chemically analysed at the age they could potentially be released for sale in a commercial situation (10 months) and the other half were artificially aged to mimic approximately three year old wines before being analysed. The aim of the aging being to see whether the potential impacts of the nitrogen treatments on wine chemistry changed over time. HS- SPME-GC-MS methods were used to analyse the concentrations of specific esters, fatty acids and sulphides in the wines. This was to assess whether there were significant differences in the concentrations of these chemical compounds between the treatments. To assess whether there were any perceived sensory differences between the treatments, the same wines samples were presented to a sensory panel of wine professionals in Marlborough. The tasks undertaken by the panel were designed to see if the wine professional could differentiate between the nitrogen treatments and also the aging levels. The panellists was also asked to generate descriptors for the wines and statistical comparisons between the chemical results and the sensory allowed these descriptors to be linked to potentially related chemicals. Overall, this study investigates the addition of different concentrations YAN during fermentation under controlled conditions. Chemical and sensory analysis methods are used to identify any significant effects. 3
14 Chapter 2 Literature Review 2.1 Wine Quality Quality is defined by the Oxford English Dictionary in various ways but the most relevant for this thesis is excellence, superiority (Simpson and Weiner 2009). The use of both words is very relevant to the difficulties of defining a quality product. Excellence is a discrete characteristic an object is either excellent or not. While the concept of superiority is relative, can be a comparison based on many variables and requires evaluation (Charters and Pettigrew 2005). Hence the quality of any product, including wine, is not easy to quantify or even define. Garvin (1984) gave five definitions for quality including transcendent (quality cannot be defined), product- based (quality of the ingredients), userbased (the capacity to satisfy wants), manufacturer-based (conforming to design) and value-based (the degree of excellence at an acceptable cost). This is rather broad and so it is valuable to narrow the concept definition initially. The view that quality can either be construed as objective (related to technical specifications) or subjective (how the consumer perceived quality) (Cox 2009) is a useful start point. A subjective view of wine quality is that it is intangible until the wine is tasted and appreciated by a consumer. Food literature provides guidance with the use of the term perceived quality coined by researchers to stress that quality judgements are not arrived at in a vacuum but are dependent on the perceptions, goals and needs of the consumers involved (Garvin 1984). This terminology is very appropriate when considering wine, as the consumer (be it expert or the general public) is vital to both quality analysis and ultimately the purpose of producing wine - marketing the product. Initial definitions of perceived quality were related to the fitness for use of the product considering the needs of the consumer (Juran and Godfrey 1974). Later researchers expanded this definition by suggesting that perceived quality is based on perceptions with respect to attributes of the product. An early example is Olson and Jacoby (1972) who proposed that quality perception has two stages in which consumers first choose surrogate indicators of product quality, (i.e. expected quality cues) from an array of product-related attributes, and then combine their evaluations of these individual cues into an overall judgment of product (experienced quality). They suggested there were two types of attributes (or variables), intrinsic and extrinsic. The intrinsic quality cues being the physical characteristics of the product and the extrinsic being outside the product like brand names, labelling, advertising and price (Olson and Jacoby 1972, Verdú Jover et al. 2004). These two types of variables gave rise to different lines of research into perceptions of quality, with some researchers basing perceptions of quality on extrinsic or intrinsic attributes only (Johnson and Bruwer 2007, Masson et 4
15 al. 2008) which can focus on the effects of that attribute but presents only part of the picture. However Steenkamp (1990) stressed the importance of both intrinsic and extrinsic attributes, explaining them as cues and attributes. The cues being informational stimuli that give the consumers clues as to quality prior to consumption (e.g. label, price). Attributes represent what the product is perceived as doing or providing for the consumer and are not observable before consumption (Juran and Godfrey 1974, Steenkamp 1990). The diagram below illustrates this model showing the differentiation between cue and attribute. (Figure removed subject to copyright) Figure 2.1 A conceptual model of the quality perception process. Reproduced from Steenkamp (1990) The view proposed by researchers like Steenkamp (1990) is that quality evaluation is a onedimensional judgement. This seems simplistic as it does not take into account different types consumers and simplifies the attributes involved. In contrast Verdú Jover et al (2004) suggest the perception of wine quality is a multi-dimensional abstract construct which seems to integrate more of the complex interactions of different consumers with the product than the one dimensional models. Their findings suggested seven dimensions of wine quality: origin, sensitivity (i.e. the balance, flavour and bouquet of the drink), vintage, image, ageing ability, acuteness (i.e. presentation and complexity and intensity of bouquet) (Verdú Jover et al. 2004). Five of the dimensions are affected by extrinsic attributes and only two (sensitivity and acuteness) are intrinsic to the wine. The emphasis on extrinsic factors like origin and ageing ability seems to show a European slant of wine quality perception and later models have expanded on this. 5
16 Charters and Pettigrew (2007) further built on the multidimensional model. They discussed dimensions as being intrinsic or extrinsic. Intrinsic dimensions being related only to what is experienced when the wine is consumed and extrinsic dimensions relating to external quality issues beyond the physical and organoleptic properties of the wine (e.g. the quality of the initial grapes, production and marketing issues). Intrinsic dimensions are the larger category and were perceived by the consumers to have more overall importance than the extrinsic. Charters and Pettigrew (2007) also introduced the distinction between catalytic and terminal dimensions. Catalytic dimensions of wine quality act as the name suggest as catalysts that stimulate the process of consumer engagement and resulting pleasure. Catalytic dimensions are aspects of the consumer engagement process that relate most directly to wine tasting and appreciation (e.g. gustatory sensations like length, complexity) (Charters and Pettigrew 2007). Terminal dimensions are end states in themselves (e.g. the intrinsic dimension of pleasure and enjoyment). Pleasure and enjoyment are the main motivational factors to drink wine and fundamental to the experience of quality for most wine consumers (Charters and Pettigrew 2007). Of the other intrinsic dimensions of quality the gustatory sub dimension - taste (in its various forms) was seen as most related to the nature of wine quality by consumers of all levels. Charters and Pettigrew (2007) construed that the foremost determinant of wine quality seems to be that it tastes good. Charters and Pettigrew (2007) also attempt to clarify the differentiation between the quality perceptions of expert tasters (high involvement) and consumers who are less experienced (lowinvolvement). These consumers with different knowledge and commitment to learning about wine are also seen to have somewhat different ways of defining wine quality. Consumers with greater involvement may be more willing to accept objective quality notions about the wines and include cognitive dimensions like potential to age and a paradigmatic dimension that visualises the perfect wine (varietal purity and refection of origin) which the consumer is mentally comparing to. While all levels of consumers value pleasure or enjoyment as a dimension of wine, each group had dimensions that were not shared, with the more involved group valuing complexity and distinctness highly while for the less involved consumer valued appearance and consistency (Charters and Pettigrew 2006, Charters and Pettigrew 2007). Figures 2.2 and 2.3 contrast the wine quality dimensions for low and high involvement consumers. 6
17 (Figure removed subject to copyright) Figure 2.2 The quality dimensions for high involvement consumers. Reproduced from Charters and Pettigrew (2007). (Figure removed subject to copyright) Figure 2.3 The quality dimensions for low involvement consumers. Reproduced from Charters and Pettigrew (2007). This model presented by Charters and Pettigrew (2007) helps explain the complexity of wine quality. It seems logical that pleasure and enjoyment is the most important for all consumers but it also includes the more abstract dimensions of quality perceived by involved wine consumers, who Charters and Pettigrew (2007) suggest have much in common with the view of wine experts. 7
18 2.2 Wine Aroma and Taste Aroma compounds play a definitive role in our perception of wine quality. The interaction of aromatic substances with the sensory organs in the nose and mouth can determine consumer acceptance or rejection of a food, beverage or even an environment (Dalton 2000). Aroma compounds can be perceived by humans at very low concentrations as our sense organs are extremely sensitive. Aroma thresholds (i.e. the concentration of an odorous compound at which it is noticeable to the human nose) vary between 10-4 and g/l (Rapp and Mandery 1986). These volatile compounds are detected both ortho- and retro-nasally, that is when smelling the glass and while tasting the wine (Francis and Newton 2005). The total concentration of aroma compounds in wine is approximately g/l (Rapp 1998) and individual concentrations of these compounds may vary from nanograms to milligrams per litre (Barbe et al. 2008). The fusel alcohols (i.e. straight and branched chain with more than two carbon atoms) are responsible for half of this content; the remainder is made up of aroma compounds (Rapp 1998). The final aroma of a wine is complex not only because of the number of compounds involved but also because it is formed by interactions involving numerous biological, biochemical and technological variables (Barbe et al. 2008). It is important to differentiate between flavour and aroma. The flavour or taste of a wine is the result of interaction of chemical constituents with the sense of taste, smell and touch of an individual (Noble 1996). Our sense of taste is inextricably linked to perception of aroma due to human anatomy (Noble 1996), therefore taste is a composite of the volatile compounds responsible for wine odour and the non-volatiles that affect mouth-feel and cause taste sensations like sweet, sour, bitter, salty and umami (Francis and Newton 2005). Compounds that are limited to causing flavour sensation to the palate are sugars, organic acids, polymeric phenols and mineral substances. They need to be at relatively high concentrations (10-3 to 10 1 g/l) to influence taste and mouth-feel (Breslin 2001). Aroma, on the other hand, can be experienced singularly and is the interaction of wine volatile odorous compounds with the olfactory membranes (Lambrechts and Pretorius 2000). The sources for the volatile compounds found in wine are: primary grape aromas derived from the grape (monoterpenes, C 13 norisoprenoids, methoxypyrazines and sulphur compounds with a thiol function), most of which are glycosidically-bound and have little aroma until transformed by yeast interaction (Berger and Fischer 2007, Ugliano and Henschke 2008); 8
19 fermentation bouquet formed by catabolic and anabolic pathways during alcoholic or malolactic ferment (esters, volatile fatty acids, fatty acid esters, volatile sulphur compounds and higher alcohols) (Moreno-Arribas et al. 2009b) maturation bouquet from the storage process (oak wood extraction and chemical reactions during aging) (Francis and Newton 2005, Rapp et al. 1995) For example ester hydrolysis reducing the concentration of acetate esters over time. A summary of recent research studies on wine aroma (Francis and Newton 2005) divided the aromaactive compounds found in wine into twelve categories: ethyl esters, acetates, cinnamic esters, acids, alcohols, C6 alcohols, monoterpenes, phenols, lactones, norisoprenoids, sulphur compounds and a small miscellaneous group. Many of these compounds are found in a range of varietals but the relative concentrations are affected by grape variety. The final amount of these aroma compounds in the wine is also impacted by the preferment winery treatments used, yeast and bacteria metabolism and post ferment treatments and storage (Berger and Fischer 2007, Francis and Newton 2005, Hernández-Orte et al. 2008, Rapp et al. 1995, Tominaga et al. 1998b) These compounds are present in the grape juice as aroma active free volatiles or as non-volatile precursors. The two main precursor types that have been identified to date are the glycosides and cysteine conjugates (Voirin et al. 1990, Williams et al. 1995). Generally, volatile compounds from the precursors are released or formed during the winemaking process by endogenous and exogenous glycosidases (Palomo et al. 2005), by the action of wine yeasts during ferment (Hernández-Orte et al. 2008, Tominaga et al. 1998b), lactic bacteria during malolactic ferment (D'Incecco et al. 2004), or by acid hydrolysis (López et al. 2004). Researchers have also considered the relevant impact of individual aromas and combinations of these molecular compounds. Of the hundreds of these volatile compounds that are present in wine, only a subset are sensory detectable. A review by Ferreira and Cacho in (Moreno-Arribas et al. 2009a) suggest that aroma compounds fulfil different roles in forming the subtleties of aroma. The review divided compounds into: Impact compounds or highly active compounds that can singularly dominate the aroma of a wine with their aroma (e.g. linalool in Muscat), Impact groups which have similar chemical structures and odour characteristics which impact the wine aroma as a group (e.g. ƴ- lactones), subtle compounds or families which fail to dominate the aroma with their nuance but still contribute to a secondary generic aroma nuance (e.g. fruity), and compounds that integrate to form the base of a wine aroma as either aroma enhancers (e.g. dimethyl sulphide) or aroma depressor 9
20 (e.g. 4-ethylphenol). Even though each of the base aromas are in concentrations above their odour thresholds they are not perceived individually but instead are integrated to form part of the whole complex wine aroma. Other variables can impact the volatility and the perception of all aroma compounds. The basic wine chemical composition (e.g. alcohol concentration) can both mask the odour impact of certain compounds present in concentrations above their detection thresholds and favour the detection of other molecules present in concentrations below their detection thresholds (Molina et al. 2009). Current findings therefore suggest it is the balance and amounts of aroma compounds present in the wine that confer wine aroma quality (Ferreira et al. 2009) as well as the capacity of some compounds to act individually as aroma enhancers and aroma depressors (Moreno-Arribas et al. 2009a). This has implications for researchers as the compounds responsible for complex wine aromas are difficult to pinpoint and clearly assess. 2.3 The Contribution of Fermentation to Aroma Yeast fermentation is only one of the variables influencing aroma but volatile aroma-active metabolites produced by yeast are said to provide the backbone of the aroma and flavour profiles of both red and white wine (Ferreira et al. 2000, Siebert et al. 2005). Anything that influences the ferment like temperature, retained solids plus nutrient and sugar concentrations will all influence the flavour and aroma compounds produced. The products of yeast fermentation and the impact of nitrogen supplementation on those yeast are important for this study. The main groups of compounds that form the fermentation bouquet are the volatile fatty acids, higher alcohols, esters and aldehydes (Rapp et al. 1995). When present in excess concentrations some of these ferment products are regarded as undesirable, such as acetic acid, ethyl acetate, diacetyl and the most negative aroma components - reduced sulphur compounds like hydrogen sulphide and thiols which are formed from inorganic sulphur and sulphur amino acids (Lambrechts and Pretorius 2000). The flavours and aromas formed during fermentation are not only derived from the conversion of directly fermentable substances but also from compounds that penetrate the yeast cell membrane from the juice and participate in biochemical reactions that produce volatile byproducts. These compounds include long-chain fatty acids, organic nitrogen containing substances and sulphur containing substances (Boulton et al. 1995). The formation of these compounds is interrelated (Figure 2.4), for example higher alcohols may be produced from branched chain amino acids or conversion of a sugar substrate (Äyräpää 1971) and these combine with organic acids for the formation of fruit esters (Lambrechts and Pretorius 2000). Nitrogen compounds are the source of 10
21 additional carboxylic acids, aldehydes and higher alcohols as well being important for regulation of cell metabolism. Yeast also produce enzymes which hydrolyse non-volatile glycosidic and cysteine conjugates to contribute varietal attributes to the final wine (Lambrechts and Pretorius 2000). (Figure removed subject to copyright) Figure 2.4 Formation of aroma active substances by yeast. Reproduced from Swiegers et al.(2005) Only specific yeast and bacterial species can grow and thrive in grape must due to the relatively low ph and high sugar content. The addition of sulphur dioxide, decreasing availability of oxygen and increasing concentrations of alcohol also selectively limit the species that can survive at different stages of the winemaking process (Swiegers et al. 2005). Two species of Saccharomyces, S. cerevisiae and S. bayanus are the major yeast species involved in wine fermentation but there are other genera and species that contribute flavour and aroma compounds to the wine. Taxonomists have changed the designations of wine yeast in recent years and it is important to clarify the current terms used for strain designation. Recently S. uvarum was renamed as S. bayanus and the previous species S. bayanus was categorised as a race of S. cerevisiae. The correct terminology for Saccharomyces cerevisiae therefore is either S. cerevisiae var. cerevisiae or S. cerevisiae var. bayanus (Pometto et al. 2005). Wild yeast found in the vineyard (e.g. low alcohol tolerant species like Kloeckera apiculata, Candida sp., Kluyveromyces sp. and Pichia sp.) as well as yeast indigenous to individual wineries and equipment (e.g. the more alcohol tolerant Saccharomyces and Brettanomyces species) can all 11
22 contribute to the final aroma and flavour components (Lambrechts and Pretorius 2000). The influence these yeast species have is dependent on a wide range of variables that influence the conditions within the grape must. These include the method of harvest (hand or machine), transportation variables (time, temperature, addition of sulphur dioxide) and the condition of the grapes once they reach the winery and begin fermentation (hygiene, temperature, disease component, SO 2 addition, aeration, enzyme use, clarification methods). All of these variables interact to affect the microbial content of the grape must and therefore the chemical and sensory changes that accompany fermentation (Lambrechts and Pretorius 2000). Once fermentation is underway other variables besides the flora population come in to play that further influence the products of fermentation. These include the temperature of the ferment, presence of residual SO 2 or vineyard sprays, exposure to air, the YAN status of the must and any nutrient additions Esters The role of ester production in yeast metabolism is unclear but one theory is that esters and their precursor fatty acids are metabolic wastes with a potential toxic effect on the cell (Peddie 1990) so they need to be excreted by the yeast. Certainly it has been shown that fatty acids with a chain length of C 8 to C 14 are toxic to the yeast and exhibit strong antimicrobial activity (Bardi et al. 1998). Ester synthesis is linked to the lipid and acetyl CoA (coenzyme A) metabolism and another reason for their formation could be to reduce the acetyl charge, as it is essential for the yeast cell to maintain a balance between acetyl CoA and CoA SH (Thurston et al. 1982). The esters may be synthesised to redress any imbalance in the CoA SH:acetyl CoA ratio caused by the cessation of the lipid synthesis pathway through fermentation (Thurston et al. 1981). Esters derived from fermentation are largely responsible for the fruity aromas of wine and therefore play an important role in the sensory composition of young red and white wines. Significant amounts of esters are hydrolysed during aging at wine ph but the concentration of the major esters has been found to be above threshold levels even in two year old wines (Escudero et al. 2007). This suggests esters have a sensory impact in aged wines as well (Moreno-Arribas et al. 2009a). Some researchers down-play the direct relationship between fruity notes and esters in wines as pinpointing the esters which are responsible for precise aroma attributes in a wine is not a straightforward exercise as the aroma of wines are complex and made up of interacting components (Escudero et al. 2007). The main fermentation derived esters thought to be associated with wine fruitiness are acetate esters (ethyl, isobutyl, isoamyl, hexyl and 2- phenylethyl acetates), and ethyl fatty acids (ethyl C 3 ethyl C 12) (Moreno-Arribas et al. 2009b). The combinations of esters within the wine matrix have 12
23 been shown to interact and impact the final aroma collectively. For example research by Van der Merwe & Vasn Wyk (1981) investigated the contribution of esters to wine aroma by adding various esters back to a dealcholised wines. Their research suggested that more complex combination of esters improve the quality of the wine odour to a greater extent than less complex combinations or individual esters. They also suggested that ethyl esters of straight chain fatty acids with an even number of carbon atoms (e.g. ethyl hexanoate, ethyl octanoate, ethyl decanoate) and fusel alcohol acetates (e.g. 2-methylbutyl, isoamyl acetate, 2-phenylethyl acetate) are important contributors to young wine aroma by supplying floral fruity aromas (Van der Merwe and Van Wyk 1981). They also found that if the individual esters were all present above threshold levels, the removal or increase in concentration of one was not apparent in the odour as the remaining compounds made-up for it especially if they had similar odours and additive effects. This suggest esters can work as a group synergistically with the total aroma influence being greater than the sum of the individual ester impacts. Some esters are not pleasant in high concentrations, for example wine with concentrations of ethyl acetate higher than 100 mg/l can have an unpleasant pungent odour (Diaz-Maroto et al. 2005, Dubois 1994). Ethyl acetate has also been found to suppress the perception of other esters (Piggott and Findlay 1984) in (Francis and Newton 2005). The importance of individual yeast esters to the aroma profile of a wine seems to vary depending on the wine variety (Smyth 2005) but research seems to suggest that the acetate esters are more important that ethyl fatty acids esters for perceived wine aroma (Van der Merwe and Van Wyk 1981). Recent research also highlighted that branched chain esters (like ethyl 2-methylbutanoate) are the most powerful odorants amongst esters but that they occur at lower concentrations in wine than either acetate or ethyl fatty acids esters so their overall effect on aroma is less that might be expected. These branched-chain esters have strawberry-like aromas and are thought to contribute to red fruit notes in some red wines (Moreno-Arribas et al. 2009b, Piombino et al. 2004). Acetate ester formation involves an enzyme-catalysed intracellular reaction between a higher alcohol and an activated acyl-coa molecule. Alcohol acetyltransferase enzymes promote ester synthesis and esterase enzymes promote their hydrolysis. The final concentrations of esters is the result of the balance of the enzymes involved. The enzymes involved in forming acetate esters in S. cerevisiae are Atf1p and Atf2p (Lambrechts and Pretorius 2000). See figure 2.5 (Moreno-Arribas et al. 2009b). 13
24 (Figure removed subject to copyright) Figure 2.5 The biosynthetic and degradation pathway for esters. Reproduced from Moreno-Arribas et al. (2009b). The formation pathways for ethyl fatty acids and branched chain esters are less well understood. Ethyl propanoate and ethyl butanoate are thought to be generated from propanoic and butanoic acid respectively (Eden et al. 2001). However the majority of ethyl fatty acids esters are generated from esterification of activated fatty acids (acyl-coa). Recently the enzymes Eht1p and Eeb1p have been identified in the production of medium chain fatty acid esters (Saerens et al. 2006). From the structure of branched-chain esters, researchers have speculated that they are formed through the esterification of branched-chain acids during amino acid metabolism (Moreno-Arribas et al. 2009b). Ester production varies greatly between different yeast species (Swiegers et al. 2009). Ethyl acetate is produced in greatest amount by non-saccharomyces species. Different strains of S. cerevisiae vary in the overall concentration of esters produced as well as the ratios of acetates and ethyl esters (Soles et al. 1982). Other factors that influence ester production in wine are must composition and fermentation procedure. Variations in juice/must media include carbon source and concentration, nitrogen supply, ph of the medium, micronutrient availability, and unsaturated fatty acid/sterol levels. Important fermentation procedure factors include fermentation temperature, carbon dioxide and oxygen concentration, and as previously discussed, the yeast strain selection. Chemical changes during the aging and storage of wines can dramatically affect the aroma and quality of a wine. Storage temperature has a large influence on the speed of the changes to wine quality but even at ideal storage temperatures the make-up of the wine alters over time. For example acetate levels have been shown to remain constant during storage of wines at 0 C, decrease during storage at 10 C, and decrease still further during storage at 30 C (Marais 1979). Generally straight-chain fatty acids and the fusel alcohol acetates tend to decrease during wine aging causing a loss of fruit freshness. Branched chain fatty acid ethyl esters are more or less stable or can increase during wine aging. Research suggest this mechanism depends on the acid-ester equilibrium (Diaz- Maroto et al. 2005) 14
25 The nitrogen status has been shown to affect the accumulation of esters during fermentation. Further detail about this will be outlined in a later section on the influence of nutrition on wine composition (refer to section 2.5) Tables show the formulae, organoleptic characters, threshold values and concentrations found in wine of important esters. 15
26
27 Table 2.2 Ethyl Fatty Acid Esters. Compound Formula Organoleptic character¹ Threshold (µg/l) Concentration in Wine (mg/l) Ethyl Propanoate Ethyl propionate Ethyl Butanoate Fruity 2100 *** (Pineau et al. 2009) 1840 **** (Etievant 1991) Acid fruit 20 *(Guth 1997b) (Swiegers et al. 2005) Ethyl butyrate Ethyl Pentanoate Ethyl valerate Sweet fruity (Lasekan et al. 2007) No data found Ethyl Hexanoate Green apple 14 **(Ferreira et al. 2000) (Swiegers et al. 2005) Ethyl Octanoate Sweet, soap 5 **(Ferreira et al. 2000) (Swiegers et al. 2005) 2* (Etievant 1991) Ethyl Decanoate Pleasant, soap 200 **(Ferreira et al. 2000) 0-2.1(Swiegers et al. 2005) Ethyl Dodecanaote Soapy estery No data found ¹ All (Siebert et al. 2005) unless stated, *10% ethanol/ 90% water, **Synthetic wine 11% v/v ethanol, *** Red wine, ****Wine 17 17
28 Table 2.3 Branched Chain and Ethyl Cinammic Esters Compound Formula Organoleptic character¹ Threshold (µg/l) Concentration in Wine (mg/l) Ethyl-2 methyl propanoate (CH 3) 2CHCOOC 2H 5 Ethyl isobutyrate Ethyl -2 methyl butanoate CH 3CH 2CH(CH 3)COOC 2H 5 ethyl methyl butyrate Ethyl cinnamate C 6H 5CH=CHCOOC 2H 5 Cinnamic ester Fruity 15* (Ferreira et al. 2000, Guth 1997b) Sweet Fruit 18** (Ferreira et al. 2000) 1* (Guth 1997b) Cinnamon 1.1** (Ferreira et al. 2000) No data 0.7 (Lambrechts and Pretorius 2000) ¹ All (Siebert et al. 2005) unless stated, *10% ethanol/ 90% water, **Synthetic wine 11% v/v ethanol, *** Red wine, ****Wine 18 18
29 2.3.2 Volatile Fatty Acids A range of volatile fatty acids are formed in wine during alcoholic fermentation. They are referred to as short chain (C 2 C 4), medium chain (C 6 C 10), and branched-chain fatty acids (e.g. 2- methylpropanoic acid and 2 methyl butanoic acid) (Moreno-Arribas et al. 2009b). The volatile acid component of wine is usually between mg/l which is about 10-15% of the total wine acidity (Lambrechts and Pretorius 2000). Acetic acid, which can account for 90% of total volatile acidity, has the largest sensory impact of the fatty acids. The distinctive vinegar notes becomes obvious above the aroma threshold of 0.7 to 1.1g/L (depending on wine style) (Dubois 1994). Up to and at threshold acetic acid can provide warmth to the palate and a lift to the nose of particularly a full bodied red wine. Over threshold a sourness/sharpness creeps in until the vinegar odour become obvious at higher concentrations. Acetic acid is formed as a by-product of glycolysis, via pyruvate, during anaerobic fermentation by Saccharomyces cerevisiae. Medium-chain volatile fatty acids and their ethyl esters are natural inhibitors of alcoholic fermentation, with their ability to retard yeast growth being proportional to their solubility (Lambrechts and Pretorius 2000). These straight-chain fatty acids (C 4 C 12) are by-products of saturated fatty acid metabolism. Malonyl-CoA is produced from acetyl-coa by acetyl-coa carboxylase-β activity and then the synthase enzyme complex catalyses the later reactions. Chain lengths are increased sequentially by two C units with C 16 and C 18 fatty acids being the final products. If acetyl-coa carboxylase is inhibited during the process the fatty acid can be released early producing short and medium chain acids (Bardi et al, 1999 in (Moreno-Arribas et al. 2009a, Moreno- Arribas et al. 2009b). (See figure 2.6) As the fatty acid chain lengthens the volatility decreases and the odours become increasingly sour then rancid and cheesy (Francis and Newton 2005). Recent studies have suggested that hexanoic, octanoic and decanoic acids can contribute positively to the aroma of some white wines (Smyth 2005). Branched chain fatty acids are not produced during saturated fatty acid synthesis but are derived from the oxidation of α-keto acids during amino acid metabolism. These fatty acids are thought to contribute to the fermentation bouquet with isobutyric acid (2-methylpropanoic acid) typically exceeding the threshold level. 19
30 (Figure removed subject to copyright) Figure 2.6 Fatty acid metabolism. Reproduced from Lambrechts and Pretorius (2000) As with esters, the accumulation of fatty acids in wine by fatty acid synthase complex is dependent on a wide range of variables including yeast strain, nitrogen status of the must, nutrient balance, sugar concentration, inoculum level, fermentation temperature, aeration and ph (Moreno-Arribas et al. 2009b). Table 2.4 shows the formulae, organoleptic characters, threshold values and concentrations found in wine of important fatty acids. 20
31
32 2.3.3 Sulphide Compounds Volatile sulphur containing compounds have a significant influence on the perceived odour of many foods and beverages (Landaud et al. 2008). About 10% of the total volatile components detected in such products are sulphur compounds (Boelens and Van Gemert 1993) and they are responsible for the characteristic notes of many different foods and beverages. Many of these compounds have very low sensory threshold values (ng/l to µg/l), are associated with fermentation and also with unpleasant characteristics (Rauhut 1993a). These characteristics are generally considered to be off odours in wine, contributing aromas of rotten egg, cooked cabbage, onion and rubber (Bell and Henschke 2005, Rauhut 1993a, Swiegers et al. 2005). A great deal still remains to be understood about these compounds, most notably their impact on negative perceptions of wine aroma and the effects of bottle closure type and storage conditions on their formation and stability. Although sulphides are generally associated with off odours, long-chain polyfunctional sulphur compounds are seen as exceptions to this because at low concentrations they are perceived as pleasant and fruity, though at higher concentrations they can be objectionable. These thiols have been shown to act as impact compounds on the aromas of certain varietals e.g. the tropical fruit notes in Sauvignon blanc (3-mercapto-hexanal-1-ol (3-MH) and its acetate ester 3-MHA) (Dubourdieu et al. 2006, Mestres et al. 2000b). Dimethyl sulphide (DMS) with aromas of molasses, corn and asparagus can also be seen as pleasant in some wine varietals at sub threshold concentrations (Mestres et al. 2000a). DMS appears to be important in red wines acting as an enhancer of berry aromas (Escudero et al. 2007). Odours like truffle and quince have also been linked to this compound and this seems affected by the age and style of the wine plus DMS concentration (Segurel et al. 2004, Silva Ferreira et al. 2003). Yeasts produce sulphur compounds during fermentation. Which compounds are formed and at what concentration depends on many interacting variables. There are many biochemical pathways capable of producing these compounds due to the complexity of the yeast s sulphur metabolism (Ribéreau- Gayon et al. 2006). Researchers have classified the sulphide and thiol compounds causing reductive odours into three groups according to their volatility (boiling point) (Chatonnet, 1993 in (Mestres et al. 2000b) The light or low-boiling point group of compounds have boiling points below 90 C. These include hydrogen sulphide (H 2S), methanethiol (methyl mercaptan), ethanethiol (ethyl mercaptan), dimethyl 22
33 sulphide and carbon disulphide. These compounds are produced during and after fermentation and have unpleasant odours even at low concentrations (1-1.5 µg/l). They may increase with aging but because of their volatility sparging or aeration can lower concentrations. Some of this group (H 2S and the thiols) react with copper and so can therefore be removed from wine and must by the addition of small quantities of copper sulphate. Of these compounds hydrogen sulphide, methanethiol and to lesser degree ethanethiol are responsible for reductive defects. H 2S and methanethiol are directly produced by yeast metabolism. Yeasts synthesise methanethiol from methionine (De Mora et al. 1986b). H 2S production is mainly driven by the enzymes responsible for reducing sulphates to form the amino acids cysteine and methionine (Ribéreau-Gayon et al. 2006). However the final levels of H 2S concentrations in the wine can be affected by many variables including, levels of elemental sulphur and fungicides on the grapes at harvest (Zoecklein et al. 1999), the yeast strain chosen and internal metabolism of that strain (Linderholm et al. 2008), juice or must chemistry (YAN, vitamins etc) pre fermentation and the timing of additions made to supplement nutrition (Butzke 1997), redox potential of must/wine which is affected by winemaking choices (Jackson 2008), fermentation conditions like temperature, solids level present, oxygen availability etc. (Gump et al, 2001), yeast health during fermentation (Zoecklein 2007) and the subsequent presence of yeast lees and lees stirring (Linderholm et al, 2005). The second group of heavy or high boiling point compounds have boiling points greater than 90 C. These compounds (e.g. diethyl sulphide and dimethyl disulphide) are only produced by yeasts during fermentation and remain in the wine subsequently. Unlike light sulphur compounds that may increase in concentration during aging, heavy compounds remain stable. They have low volatility so are not reduced by aerating the wine. Treatment with copper addition is also ineffective for removal of these compounds (Mestres et al. 2000b). Finally the thiol-acetic esters are odourless compounds with very high boiling points that can release thiols when broken down by hydrolysis and so can contribute to unpleasant odours (Mestres et al. 2000b). Table 2.5 shows the formulae, organoleptic characters, threshold values and concentrations found in wine of important sulphide compounds. Sulphur compounds can cause very unpleasant aroma notes and are therefore detrimental to perceived wine quality. Descriptors like garlic, rubber and onion do not suggest fine wine qualities. However research has confirmed that lower concentrations of some sulphur compounds like dimethyl sulphide can produce pleasant complexing savoury wine aromas (Spedding et al, 1982) and 23
34 that during wine aging the concentration of this compound increases in red wines (Segurel et al. 2005) (Ugliano et al. 2012). The concentration of sulphur compounds in wine is part of its unique aroma and flavour and can have different effects due to individual sulphide concentrations or interactions with other compounds. These interactions can mask aromas or magnify them and the absolute or relative concentrations of these compounds can also make them either alluring or disgusting. For example hydrogen sulphide can give a negative quality impression with a rotten egglike aroma in a white wine while the same concentration may not be perceptible in a red wine (Swiegers et al. 2007), and 4-mercapto-4-methypentan-2-one has variously been described as black currant at low concentrations and cat urine at higher levels (Schneider et al. 2003). As previously stated, some sulphur compounds contribute the typicity of varietal aromas. For example in Sauvignon blanc, 3-mercaptohexanol (box tree, passion fruit) and 4-mercapto-4-methylpentan-2- one (cat pee) contribute to the varieties unique aroma character (Tominaga et al. 1998a). These compounds generally have very low perception thresholds but are also found in relatively small qualities in wine. Winemakers can manipulate the presence or absence of volatile sulphur compounds in red winemaking. Generally nitrogen is added to avoid or remove sulphides (usually H 2S) that could form during the fermentation process. But in some boutique wineries in New Zealand and California protocols have been developed that encouraged yeast stress with the aim of more complex, better quality finished Pinot noir wine (Le Follet 2008). In the extreme no extra nitrogen is added during fermentation and if sulphides do develop no chemical additions are made though aeration may be encouraged. The sulphides are thought to add to the complexity or house style of the wine (Bicknell 2003). Therefore some winemakers attribute changes in quality aspects including complexity, mouthfeel and differences in flavour and aroma to winemaking and aging decisions that will influence sulphides. Information from winemakers about these protocols and the resulting wines is anecdotal but can be based on observation over years and trials within the winery. These discussions raise interesting subjects for research but are seldom couched in scientific terms. 24
35 Table 2.5 Sulphur Compounds Compound Formula Organoleptic character¹ Threshold (µg/l) ¹ Hydrogen sulphide H 2S Rotten egg, sewage-like, vegetal (Siebert et al.) Methanethiol Methyl mercaptan MeSH Rotten cabbage, burnt rubber, putrfication, stagnant water (Solomon 2010) Ethanethiol EtSH Onion, rubbery, burnt match, sulphidy, earthy 1.1 (Goniak and Noble 1987) Ethyl mercaptan Methyl thioacetate MeSAc sulphurous, cheesy, egg 50* (Hughes 2001) Ethyl thioacetate EtSAc sulphurous, garlic, onion 10* (Hughes 2001) Dimethyl sulphide DMS Quince truffle black currant **, cooked cabbage, canned corn, asparagus 25 (Goniak and Noble 1987) Diethyl sulphide DES Garlic, rubbery 0.9 (Goniak and Noble 1987) Carbon disulphide CS 2 sweet, ethereal, slight green **, rubber, sulphidy >38 (Spedding and Raut 1982) Dimethyl disulphide DMDS Quince asparagus 29 (Goniak and Noble 1987) Diethyl disulphide DEDS Onion 4.3 (Goniak and Noble 1987) ¹ All (Siebert et al. 2010)) unless stated, *In beer, ** At low levels 25 25
36 2.4 Yeast Available Nitrogen and Mechanisms of Nitrogen Uptake by Yeast Nitrogen plays a major role in many of the biological functions of grapevines and fermentation organisms. Amino acids and ammonium ions make up the largest percentage of the must nitrogen fraction. The most common amino acids are proline and arginine which make up 30-65% of total amino acids (Henschke and Jiranek 1991). Not all of the nitrogen present in grape must is useful to the yeast. Proline, for example, though prevalent in grape must, is not generally metabolized by yeast because proline permease requires oxygen and is inhibited by other nitrogenous sources (Henschke and Jiranek 1991, Ough et al. 1991). The amount of nitrogen in the must that is readily useable by yeast is termed yeast available nitrogen (YAN) and this includes ammonia, primary amino nitrogen and the side-chain of L-arginine (Dukes and Butzke 1998). During the early stages of fermentation these compounds are rapidly taken up by the yeast to fulfil requirements for amino acids needed for growth and protein synthesis (Henschke and Jiranek 1993). As previously stated, a YAN of at least 140 mg N/L is required to complete fermentation under standard conditions (Agenbach 1977), with an optimum suggested as 190 mg N/L (Bely et al. 1990). The impact of ammonium and free amino acids on the yeast is to promote cell growth (Bisson 1991), increase yeast cell numbers (Bell et al. 1979), affect fermentation kinetics as well as influence the production of ethanol, glycerol, aromatic and spoilage compounds (Albers et al. 1996, Bisson 1991). Therefore nitrogen metabolism by yeast influences the amount and types of volatile compounds present in a wine. Low must YAN can lead to low yeast populations, deactivation of glucose uptake within the cells and subsequently poor fermentation vigour and sluggish ferments (Salmon 1989, Varela et al. 2004). This can also be accompanied by increased production of undesirable sulphur compounds and higher alcohols, and low production of esters and long chain fatty acids (Bell and Henschke 2005). Earlier research has shown that the common winery practice of supplementation of the must with extra nitrogen as diammonium phosphate (DAP) is a useful tool to lower the risk of slow or stuck ferments and has generally decreased the production of hydrogen sulphide and other volatile sulphur compounds during fermentation (Bell and Henschke 2005, Jiranek et al. 1995a). Winemakers therefore add DAP to increase the rate of fermentation, increase the surety fermentations will complete and as a tool to manage sulphides. 26
37 DAP additions have been shown to affect which nitrogen sources are taken up by the yeast. A study by Marks et al. (2003) suggested that DAP additions affected the transcription of 65 genes involved in amino acid metabolism. The overall result was reduction in the uptake of arginine (as general amino acid and arginine permease were repressed) which lead to the arginine starved cells switching to its production from glutamate and ornithine (Marks et al. 2003). A positive effect of decreased arginine uptake is less production of the potential carcinogen ethyl carbamate (Ough et al. 1990). (One of the products of the catabolism of arginine is urea which is excreted by S. cerevisiae and reacts with alcohol to form ethyl carbamate (Ough et al. 1990). ) Yeast utilise nitrogen through a number of mechanisms and preferentially utilise (and transport into the cell) assimilable nitrogen by a mechanism called nitrogen catabolite repression (NCR) (Magasanik 1992). NCR mediates the order of selection of nitrogen sources by allowing the use of certain permease transport systems and degrading inappropriate permeases (Magasanik and Kaiser 2002). The most preferred and first to be transported into the yeast cells are ammonium, glutamine and asparagine, followed by arginine, alanine, aspartate, glycine and glutamate and then least favoured are urea and proline (Bisson 1991). Very little proline is taken up by the yeast under any conditions (Ough et al. 1991). Early in fermentation only the favoured sources are used but as they are depleted the transport systems for the less desired sources are enabled. Researchers have noted differences in the induction patterns for amino acid transport system permeases and this is thought to be explained by differences in yeast strains and also media composition (importantly YAN) (Magasanik and Kaiser 2002, Ough et al. 1991). Once inside the yeast cell the nitrogen sources are used to synthesise glutamate or glutamine. These compounds are in turn used to synthesise amino acids (e.g. glutamic acid), purines and pyrimidines according to the yeast s metabolic needs (Magasanik and Kaiser 2002). The pathways for use of a variety of nitrogen sources, including urea, proline and arginine, are shown below in figure 2.7. The nitrogenous compounds in the cell are synthesized from either glutamate or glutamine. Glutamine is synthesized by the combination of ammonia with glutamate. The main pathway for glutamate synthesis involves the combination of ammonia with a-ketoglutarate, which is synthesized from acetyl CoA and oxaloacetate through the early steps of the citric acid cycle. The S. cerevisiae gene for each of the enzymatic steps is shown in italics (Magasanik and Kaiser 2002). 27
38 (Figure removed subject to copyright) Figure 2.7 Central pathways for nitrogen metabolism in a yeast cell Reproduced from Magasanik and Kaiser (2002). In low to moderate YAN conditions (< mg N/L) all sources are rapidly assimilated and the yeast evolves from NCR metabolism to de-repression as the preferred sources are exhausted (Beltran et al. 2004, Bisson 1991). In very high YAN must (1200 mg N) the preferred sources of nitrogen (especially ammonium) were not depleted so NCR metabolism was used for the whole fermentation (Beltran et al. 2004). The consumption of branched-chain and aromatic amino acids was found to be higher in musts with very high YAN, while inhibited arginine and alanine uptake led to a lower consumption of glutamic acid, aspartic acid and glutamine. Thus YAN levels in grape must influence which compounds the yeast takes up and therefore impacts on the production of important secondary metabolites including glycerol, succinic acid, acetic acid and volatile aroma compounds (Beltran et al. 2004, Fleet 2003), The impact on wine quality is variable as increases in glycerol and succinic acid are positive however increased volatile acidity is not desirable. 28
39 2.5 Previous Research on the Influence of Nutrition on Red Wine Composition Manipulation of grapevine nutrition and addition of nitrogen in the winery has the potential to influence quality components in the grape must and therefore ultimately the final wine (Bell and Henschke 2005). Recent studies have indicated that amino acid concentration in the grape must can have a directing influence on which volatile compounds the yeast will produce. This can be by producing the compounds directly or indirectly via action on volatile precursor compounds (Hernández-Orte et al. 2005) Most of the research to date has considered the YAN status of the must and possible effects on the production of volatile compounds responsible for the wine aroma properties. Early studies linked the YAN availability to the production of higher alcohols (Ayrapaa, 1971 in (Ugliano et al. 2008). Later research on model or white wine fermentations supplemented with DAP suggested that nutrient additions caused an increase in the formation of volatile compounds, particularly esters (Butzke 1998, Hernández-Orte et al. 2005). Little research work has been carried out on nitrogen supplementation during red wine production and the effects of DAP supplementation on red wine aroma composition is only beginning to be studied. Ugliano et al. (2008) considered the effect of DAP addition on low YAN Shiraz fermentations. They found that increased DAP supplementation resulted in two effects: 1. There was an increase in the formation of acetates. The highest YAN treatments showed a 4- fold increase over the control for 2-methylpropyl acetate, 3-methylbutyl acetate, hexyl acetate and phenyl ethyl acetate. This may have positive implications for the wine aroma. Acetate esters are some of the compounds that are responsible for fruitiness in wines and 3- methylbutyl acetate was recognised by Guth (2002) as an important odorant in red wines. 2. The final concentrations of most medium chain (C 6-C 12) fatty acids (MCFA) and their MCFA ethyl esters also increased. This could also have a positive effect on final wine quality as MCFA ethyl esters have been identified as compounds that contribute to the fermentation bouquet of Bordeaux wine (Guth 2002). There was however, no effect on the concentrations of low molecular weight sulphur compounds, hydrogen sulphide (H 2S), dimethyl sulphide (DMS) and carbon disulphide (CS 2) by the addition of DAP pre fermentation. This was in contrast to earlier research (Jiranek et al. 1995b) that found increased nitrogen addition decreased the production of H 2S during fermentation. Ugliano et al. (2008) did 29
40 note that the must used in the study was low in methionine. Studies by Spiropoulos et al. (2000) found that the effectiveness of nitrogen addition in suppressing H 2S formation is dependent on the concentration of methionine. The results were strain dependent but they found H 2S formation was lowest under high methionine and high ammonium conditions. Rauhut et al. (1996) reported that the concentration of H 2S in the finished wine did not reflect what the yeast had produced during fermentation as the compound is highly volatile. These points could explain why Ugliano et al. (2008) observed little difference in the final H 2S concentration of the wine from musts of differing YANs. The wines were also artificially aged by storing at 30 C for 6 weeks in the Ugliano et al. (2008) study. Analysis of these aged wines indicated that during aging some of the large differences observed in the young wines tended to decrease, particularly with regard to the medium chain fatty acids (MCFA) ethyl esters, which decreased at a higher rate in DAP- treatment wines. Ugliano et al. (2008) suggested that the higher YAN treatments stimulated the production of esters leading to higher concentrations post fermentation which in turn led to a higher rate of hydrolysis during aging. However at the end of the aging the DAP treated wines still had significantly higher concentrations of acetates and MCFA ethyl esters than the controls. The branch-chain esters were the only group of esters that showed an increase during aging. This agrees with research by Diaz-Maroto et al. (2005) that the acid ester equilibrium was the most effective in generating the branched fatty acid ethyl esters from their corresponding acids during wine aging. As the young wine aged the rate of esterification increased. Interestingly despite the fact that DAP supplementation had no effect on dimethyl sulphide (DMS) concentration at bottling, it was the only sulphur compound to show a marked increase with aging. In the highest DAP supplementation treatment wines the DMS concentration was about 560% higher than in the young wines. DMS is found in wines of most grape varieties at less than parts per billion to sub-parts per million levels, but often exceeds its perception threshold of 27 ppm in red wines (Segurel et al. 2004, Segurel et al. 2005). It has been found to increase during aging of wine (Segurel et al. 2004). The influence this compound has on wine aroma appears complex, because it can be perceived either positively or negatively depending on the DMS level and type of wine (Segurel et al. 2005). For example it has been variously described as cabbage, asparagus, corn, and molasses as well as at low concentrations herbaceous (Mestres et al. 2000a) and an enhancer of fruit character (De Mora et al. 1987)). Aged Syrah wine has been shown to contain high DMS levels which enhance the fruity character of the wine (Segurel et al. 2004). Research on DMS in Pinot noir seems to be limited to a report by Spedding et al (1982) in which the presence of DMS was described as being totally faulty at trace levels. 30
41 2.6 Analytical Tools for the Analysis of Wine Volatiles Progress in improving wine quality requires knowledge of the components responsible for the aroma characteristics in wine (both defects and positive traits). To gain this knowledge research has been required into both the chemical nature and the sensory properties of wines. As concentrations of these individual compounds may vary from nanograms to milligrams per litre (Barbe et al. 2008) accurate analysis of the chemical components involved in a wine aroma can be a challenge. Many studies have focused on particular classes or groups of components to avoid interference from other components or to increase sensitivity. Because the analytes are volatile, gas chromatography has been the most widely used chemical analysis method (Polaskova et al. 2008). This analytical process consists of discrete steps: sampling, sample preparation, separation, quantification and data analysis (Pawliszyn et al. 1997). Sample preparation is vitally important to achieve accurate results. Historically preparation of wine volatiles involved isolation using time consuming and sometimes hazardous distillation or solvent extraction methods (Ebeler 2001). These have been replaced by more rapid and sensitive methods using headspace analysis (Polaskova et al. 2008). The extract is sampled using either static headspace sampling (Guth 1997a), dynamic headspace sampling (Le Fur et al. 2002, Pollien et al. 1997) or latterly solid phase microextraction (SPME) (Marti et al. 2003) to collect the volatiles. SPME has gained popularity since it was developed in the 1990 s for wine aroma analysis due to its sensitivity, simplicity and speed (Grosch 2001). SPME is a fast, solvent-free sample preparation method for the processing of either liquid or solid samples (Pawliszyn et al. 1997). The SPME assembly is comprised of a syringe needle with a retractable fibre coated in a sorbent material. The polymeric fibre is pierced through the septum of a vial containing the sample, exposed to the headspace and the volatiles are absorbed by the fibre (Polaskova et al. 2008) The whole assembly is then transferred to a heated GC injector where the fibre is exposed to a carrier gas and the volatiles are desorbed from the fibre. There are different fibres available that are suitable for specific volatiles (e.g. polyacrylate, divinylbenzene and carboxen) (Pawliszyn et al. 1997). Other variables that influence the accuracy of the SPME technique are: time of fibre exposure, sample temperature, the ph and ionic strength of the solvent and matrix composition (Howard et al. 2005). All of these variables need to be optimized to enhance the accuracy and reproducibility of the method for each analtye and matrix type (Polaskova et al. 2008). Stable Isotope Dilution Analysis (SIDA) method aimed at reducing matrix effects during headspace solid phase microextraction (HS-SPME) analysis of grapes and wine. This technique uses wine 31
42 samples that have been spiked with stable istopically labelled (using 2 H or 13 C) internal standards that are matched to the compounds the researcher is interested in (Polaskova et al. 2008). Because the internal standard and the compound have similar structures any interactions with the matrix will be comparable. The spiked standards are analysed in the SPME-GC Mass Spectrometer run with samples and the response ratio of the sample to the internal standard are used to quantify the concentration of the sample against previously determined calibration curves. This technique has been used to quantify compounds at ng/l levels (e.g. IBMP in Cabernet Sauvignon (Chapman et al. 2004), cork taint TCA (Butzke et al. 1998), fermentation derived products (Siebert et al. 2005) and ester formation in grape juice fermentations (Vianna and Ebeler 2001). 2.7 Research Linking Sensory Perception to Chemical Composition Research that directly linked analysed chemical data to actual human sensory response to the wine has been relatively recent, as efforts tended to concentrate on either one aspect or the other (Francis and Newton 2005). The measurement of the sensory attributes of wines is difficult especially when working with wide groups of wines with very complex aromas (Lawless 1999). Therefore linking wine sensory and chemical data has been fragmented (Francis and Newton 2005) and it has been a gradual process as improving technology has enabled more accurate chemical analysis and skills have developed in gathering scientific sensory data. Determination of robust relationships between instrument data and sensory analysis could provide a practical guide regarding the quality of a wine given its composition, but this has yet to be achieved. Winemakers and wine scientists share the desire to identify the volatile compounds that are important contributors to particular olfactory attributes in wines. To this end wine aroma research initially focused on measurement of the numerous individual aroma compounds in wine and food and human thresholds for those compounds (Guadagni et al. 1963) but by the 1970 s food researchers were beginning to doubt that all the volatiles detected actually contributed to the final aroma of a product. Wine is a complex mixture and wine scientists have needed to determine those components that are most likely contributing to the aroma. Researchers started to concentrate on determining which of the detected volatiles which had sensory significance in the wine (Noble et al ). Development of a gas chromatography-olfactometry (GC-O) method (Fuller et al. 1964) enabled the systematic identification and ranking in importance of compounds causing food aromas (Grosch 32
43 2001). GC-O is a combination of sensory and instrumental analysis. GC and SPME have been covered in the previous section, the variation with GC-O is that the aliquot of volatiles that is concentrated in the headspace is then separated by high-resolution GC and the effluent is split into a flame ionisation detector (FID) and an effluent port (Berger and Grosch 2007). The gas chromatogram on its own does not provide any information about aroma, only that there are volatiles peaks at intervals. There needs to be a linkage to human perception and this is provided by a judge or panel evaluating the output from the gas chromatographic effluent (GCsniff) (Noble et al ). Along with developments in analytical technology, GC-O research has progressed using various olfactory techniques to rank the aroma compounds according to their potential importance in the food. The olfactory techniques can be broadly classified into three groups: 1. Those based on determination of threshold concentration of the aroma compounds (Moreno-Arribas et al. 2009a) using multiple dilutions of the wine extract (Grosch 1994). This involved either (CHARM) (Acree et al. 1984) or aroma extra dilution analysis (AEDA) (Grosch 1994). The main difference between the two methods is that the CHARM measures the dilution value over the entire elution period, while AEDA determines a Flavour Dilution value (FD) which corresponds to the maximum dilution at which it can be perceived by at least one of the judges (Grosch 1994, Grosch 2001, Moreno-Arribas et al. 2009a) 2. GC-O researchers have also used techniques based on the frequency of the judges in the group detecting odorants (Pollien et al. 1997). Two measurements could be determined from this: the Nasal Impact Frequency (NIF) i.e. the proportion of people able to detect an odorant and the Surface of Nasal Impact Frequency (SNIF) i.e. the time the sensation lasts. The extract only needs to be run once rather than repeated at different dilution and this aimed to improve repeatability of the results. 3. The final category is based on assessment of aroma intensity and aimed to overcome the problems of the previous techniques. This includes OSME (Miranda-Lopez et al. 1992), cross modality matching (Etievant 1991) and flavour impact values (van Ruth 2001).These methods all aim to measure the perceived odour intensity of the eluting compound e.g. for OSME the judge denotes the intensity of an aroma by twisting a knob. With improved accuracy of quantitative analysis researchers were able to develop the concept of odour activity values (OAVs) as a measure to assess the relative importance of the individual compounds found in a wine sample (Francis and Newton 2005). The concentration data is first converted into an OAV by dividing the concentration of the odorant by the detection threshold for that substance in the specified matrix (Grosch 1994). The compounds that have been identified as 33
44 having OAV >1 were considered by researchers to be those that contribute to the wine aroma. This information was hailed as giving an indication of which components are of greatest influence on the aroma of a sample (Francis and Newton 2005). All of these techniques, when done properly and precisely, have allowed rapid monitoring of a large number of volatile compounds including those present at low concentrations (Polaskova et al. 2008). As a result of this body of GC/O work by various research groups, the most significant potent compounds have been identified and the most aroma-active areas of a chromatogram can now be assigned to known compounds. These techniques have been used to study aroma profiles of various wine varieties including Chardonnay (Ballester et al. 2005) Riesling (Chisholm et al. 1994, Komes et al. 2006), Gewürztraminer (Guth 1997b), Pinot noir (Moio and Etievant 1995), Cabernet Sauvignon, Merlot and Grenache (López et al. 1999) and Madeira (Campo et al. 2007). It must be remembered however, that while isolating these chemicals is useful, in the wine the odorants and matrix components interact chemically to impact odorant volatility and overall flavour perception of wines (Polaskova et al. 2008). 2.8 Sensory Analysis Without sensory analysis of the wine as a whole (even if there is precise information about the volatile composition above the wine) it is impossible to predict the flavour (including aroma) that will be perceived. The measurement of the sensory attributes of wines is difficult especially when working with wide groups of wines with very complex aromas (Lawless 1999). The primary sensory tool developed for specifying the characteristics of a complex aroma is descriptive analysis. Descriptive analysis techniques use a panel to evaluate the qualitative and quantitative sensory characteristics of a product (Campo et al. 2010) and the intensities of these specific attributes (Lawless 1999). In some cases the panel has been trained with reference standards to align the concepts of each participant as to the types of experiences referred to by a given attribute, in other situations a panel of experts with professional expertise in the product are used (Lawless 1999). Sensory scientists have developed numerous descriptive methods including Free Choice Profiling (Williams and Langron 1984), Quantitative Descriptive Analysis (Lawless and Heymann 2010) and the most widely used profile technique - conventional descriptive analysis (DA) (Campo et al. 2010). Campo et al (2010) succinctly described the key steps of DA that makes use of limited judge numbers (8-15) who provide an intensity rating of selected attributes of the product being tested. 34
45 (a) Familiarization with the product space and generation of attributes that describe the differences among products. (b) Reduction of the initial list of attributes to achieve a list which comprehensively and accurately describes the product space. Redundant and/or less cited terms are grouped on semantic basis and/or eliminated according to judges consensual decisions. (c) Training of the judges. The aims are twofold: reaching a consensus about the meaning of each attribute and achieving intensity rating in a reliable way. To facilitate this task, a definition and physical references are usually associated to each of the attributes present in the list. (d) Monitoring of judge performance in terms of discrimination power, reproducibility and homogeneity. The proficiency of the panel is monitored until performance is considered adequate. (e) Individual evaluation of the target products, including replications. Descriptive Analysis has been used widely to evaluate a wide range of food products and it is known as a psychophysical model as it assumes the intensity of the individual perception of a stimulus is directly related to the odour concentration (Campo et al. 2010). It has been shown to have limitations when trying to profile products with complex odours (Lawless 1999). Research has shown humans have limited capacity to reliably identify common odorants in a mixture with the limit being about three components for most individuals (Laing and Francis 1989). This analytical method also encourages the panellist to dissect their perception into independent sensory dimensions rather than a holistic view of the potential interactions and complex perceptions (Cartier et al. 2006). To circumvent these limitations some authors have used similarity-bases approaches (which consists of grouping samples into their similarities and differences), like the sorting task (Cartier et al. 2006, Lawless et al. 1995), projective mapping (Risvik et al. 1994), napping (Perrin et al. 2008) followed by a description of each sample (or group) to deal with complex mixtures (Campo et al. 2010). The tasks can be described as being either global sensory evaluation methods or analytical rating tasks. Analytical rating tasks are considered data driven and encourage the participant to focus on a specific property of the wine (e.g. (Dalton 2000)). In contrast, global evaluation tasks require the participant to employ an overall or holistic evaluation while assessing the wine. Global evaluation also allows for the influence of low-impact and sub-threshold odorants in the overall perception of the wine s aroma; while rating tasks tends to highlight the high-impact odorants only. 35
46 Overall sensory scientists need to be sensitive to situations where the choice of method or task may drive the results or influence interpretations and choose methods appropriately (Lawless 1999). Today many researchers use hybrid approaches to method choice (Lawless and Heymann 2010). Both global evaluation and analytical rating tasks were used in the sensory sessions for this study. 2.9 Red Wine Aroma Determining relationships between the chemistry of a complex matrix like red wine and the perceived wine aroma has proven difficult for researchers. Red wine aroma is generally not influenced by one particular impact compound as with some white varietals (e.g. linalool in Muscat wine (Ribereau-Gayon et al. 1975)). In red wines there are many aroma compounds present but not all directly impact the wine aroma. However these compounds, even if at sub threshold levels, may influence aroma when part of a family of similar compounds or when part of several groups of families of compounds (Ferreira 2010) or can act individually as aroma enhancers and aroma depressors (Moreno-Arribas et al. 2009a). The major sources of these aroma compounds are the grapes (effected by variety), pre-fermentation treatments, yeast and bacteria metabolism and post fermentation treatments and storage (Berger and Fischer 2007, Francis and Newton 2005, Rapp et al. 1995). Descriptions of red wine aromas include terms like cherry, blackberry, cassis, raspberry, strawberry with nuances that imply red and black fruit characters (Baldy 1997, Pineau et al. 2009). It is generally considered that from a sensory viewpoint that these berry fruit aromas are of primary importance for consumer preference of red wines (Heymann and Noble 1987, Piombino et al. 2004). In fact research by Morrot et al. (2001) suggested that the odours of a wine are most often represented by objects that have the same colour as the wine (Morrot et al. 2001). These fruity aromas in red wines result from the presence of a large number of potentially interacting compounds that are influenced by the matrix composition (Ebeler 1999). Therefore attempts to link sensory aroma compounds to volatile composition have involved the use of multivariate statistical techniques (Ebeler 1999) and these linkages do not always show an easily interpretable picture. An example of this is work by Pineau et al. (2009) on Bordeaux red wine which highlighted various odour-active zones using GC-O analysis. GC-MS analysis of the extracts found that 15 of those zones were identified as ethyl esters or alkyl acetates but below their olfactory thresholds. Though these compounds would seem to have no direct individual impact on the fruity aroma in combination they give an overall sensory nuance of red and blackberry. 36
47 The aroma profile typicity of the Pinot noir grape varietal is described as exhibiting distinct fruity aromas of stone fruit (cherries, plums) and of berry fruit (raspberry, strawberry, blackcurrant and blackberry) (Fang 2005). Like other red wines, no particular impact chemical has been pinpointed as responsible for Pinot noir aroma. Research on the aroma compounds of Pinot noir dates back to the early 1980 s and used GC-MS detection to identify what compounds were present (Kwan and Kowalski 1980). Later studies have quantified the types of compounds present in Pinot noir in various parts of the world. Methods of analysis for specific chemical groups found in Pinot noir were developed in the mid 1990 s e.g. methoxypyrazines (Allen et al. 1994) and volatile sulphur compounds (Park et al. 1994). In the late 1990 s French researchers developed methods to quantify the esters anthranilate and cinnamate in wines from Burgundy (the home of Pinot noir) (Aubry et al. 1997) and investigated the impact of barrel choice on Pinot noir aroma (Feuillat et al. 1999). Oregon researchers Fang and Qian developed SPME methods to measure levels of sulphur compounds in Pinot noir (Fang and Qian 2005). Fang and Qian also looked at the aroma profiles of two Pinot noir wines from Oregon indicated that Pinot noir aroma profiles were a complex formulation of aroma compounds and different proportions of these compounds could give perceived odour differences. They concluded that no single compound dominated Pinot noir aroma but suggested a number of compounds as having significant influence. In particular they highlighted 2-phenylethanol and 3- methylbutanol as potentially contributing to overall aroma in the wines tested (Fang 2005). However they also indicated that it is a complex picture with acids, alcohols, sulphur compounds, esters and some aldehydes also potentially playing significant roles in the aroma of Pinot noir wine. A summary of aroma compounds found in Pinot noir is shown in Table 2.6. Recent research into interaction between the chemistry of New Zealand Pinot noir and the aroma perceived (Tomasino 2011a) considered whether there are perceptible sensory and chemical differences between wines produced in the four main Pinot noir regions in New Zealand. This study suggested that although NZ Pinot noir did not have one particular impact compound, changes in the concentrations of four aroma compounds (benzaldehyde, ethyl octanoate, ethyl decanoate and 2- phenyl ethanol) did influence the aroma of the wines. Benzaldehyde in particular showed changes in aroma with very small differences in concentration e.g. 6 μg/l. Descriptive analysis linked these compounds to specific aroma traits. The results suggested that the concentration of ethyl octanoate was related to the perception of raspberry and red cherry aromas; the concentration of both ethyl octanoate and ethyl decanoate are related to the perception of black cherry and chocolate aromas; the concentration of benzaldehyde and ethyl decanoate is related to the perception of oak aroma and the concentration of 2-phenyl ethanol is related to the perception of violet aroma. 37
48 Table 2.6 Ranges of concentration found for aroma compounds previously in Pinot noir Reproduced from Tomasino (2011a) (Figure removed subject to copyright) 38 38
49 Table 2.6 Ranges of concentration found for aroma compounds previously in Pinot noir continued. Reproduced from Tomasino (2011a) (Figure removed subject to copyright) 39 39
50 Table 2.6 Ranges of concentration found for aroma compounds previously in Pinot noir continued. Reproduced from Tomasino (2011a) (Figure removed subject to copyright) a (Escudero et al. 2007), b (Guth 1997b), c (Ferreira et al. 2000), d (Dunlevy et al. 2009), e (Ribéreau-Gayon et al. 2006), f (Zea et al. 2001), g (Nelson et al. 1977), h (Ibáñez et al. 1999), i (Pino and Fajardo 2011), j (Pineau et al. 2007), k (Genovese et al. 2005) 40 40
51 2.10 Aim of the Study The aim of this research was to use established chemical and sensory analysis methods to assess whether changing one winemaking practice would significantly impact perceived Pinot noir wine quality in the short and long term. The two treatments used in the study were nitrogen addition to supplement yeast requirements (i.e. different levels of diammonium phosphate) and aging the wine artificially to assess whether any changes caused by the DAP additions were impacted by long-term storage. The DAP additions aimed to mimic a potential New Zealand winery situation. The Central Otago Pinot noir grapes had sufficient YAN for a successful fermentation but unless analysis is available wineries will make prophylactic additions of diammonium phosphate to ensure a trouble free fermentation. The nitrogen additions were excess to requirements of the Saccharomyces cerevisiae var. bayanus yeast strain. This study aimed to assess if the flavour and aroma compounds produced during fermentation were significantly impacted by the elevated levels of nitrogen. The esters and fatty acids chosen to be measured by HS-SPME-GC-MS methods had been highlighted in earlier research as contributing to Pinot noir aroma. The sulphides measured have previously been shown as impacted by DAP addition but have also been labelled as potential components of Pinot noir complexity. A sensory panel of New Zealand wine professionals evaluated whether the wine treatments were perceptibly different and determined the most common descriptors used to categorise the wines. Research has shown that expertise influences the results of tasting (Brochet and Dubourdieu 2001, Zamora and Guirao 2004) and wine professionals have in-depth knowledge about wine from their native region. Wine professionals are therefore considered valuable tasters even if their training is not standardised and controlled as with trained sensory panels (Gawel 1997, Parr et al. 2002). Limited availability for trials is sometimes cited as an issue for use of wine professional panels (Perrin et al. 2007). However the Marlborough Research Centre has a pool of wine professionals that are interested in being involved and the researcher was able to use contacts within the wine industry. The aim was to see if the differences in chemistry equated to any change in the way the wines were perceived and described by the sensory panel. 41
52 Chapter 3 Winemaking Protocol 3.1 Introduction The wines in this trial were twelve Pinot noir microvins from the 2009 vintage. The aim of the trial was to investigate the effect of inorganic nitrogen additions to the composition of wine obtained from relatively high YAN musts. The trial involved three levels of fermentation nutrition (DAP addition) and then half of each treatment was aged artificially for 6 weeks at 30 C. 3.2 Methods Grape Selection Two hundred kilograms of Central Otago Pinot noir grapes were sourced from Serendipity Vineyard, Ripponvale. The vine clones are 5, 10/5, 777, 667, 115 spaced at 1.33 x 2.44m with a vineyard density of vines per ha. The grapes were hand harvested on April 23 rd 2009 and the analysis of of the initial juice sample was 25 Brix, 3.37 ph, 7.1 g/l, titratable acidity and a total yeast available nitrogen of 457ppm (i.e. YAN = 374 ppm NOPA + 83 ppm NH 3). All analysis was done by Pacific Rim Oenology Blenheim Grape Processing Upon arrival at the Lincoln University winery on April 24 th, the grapes were destemmed and crushed before being divided into nine replicates of 18 kg in 25 litre plastic fermenters. The grapes had spent 24 hours in transit so 50 ppm of sulphur dioxide was added to stop the fermentation from commencing immediately and to protect the must from further oxidation. The ferments were cold soaked in a 6 C cool room for 5 days and then warmed in a 28 C room before inoculation Diammonium Phosphate Addition Treatment Diammonium phosphate additions were made at three levels, with each one fermented in triplicate to give a total of nine fermentations. The controls (which had no DAP addition) represented the lowest nitrogen concentration (457 mg/l YAN), the two additional treatments had final YAN concentrations of 600 mg/l (addition of 150 mg/l DAP) and 700 mg/l (addition of 250 mg/l DAP), respectively. The additions were made in two stages: two thirds prior to inoculation and one third 42
53 once the ferments reached 16 Brix. All treatments had a tartaric acid addition of 1 g/l prior to fermentation Microvin Fermentation The ferments were inoculated with Lalvin EC-1118, a Saccharomyces cerevisiae bayanus strain, at a rate of cells/ml (0.2g/L) following rehydration in water at 40 C for 30 min. Fermentations were carried out in a room heated to 28 C, with the cap plunged 3 times per day. The fermentation progress was monitored daily by hydrometer (Brix ) and temperature. The wines were left to macerate on grape skins until the slowest treatment reached dryness (residual sugars < 2 g/l), after which the fermented musts were pressed and the wines were collected in 20 L glass demijohns. The wines were inoculated with Vinoflora Oenos malolactic bacteria (0.06 g/l). Malolactic ferment progress was monitored using thin layer chromatography. Potassium metabisulphite (70 mg/l) was added to the wines once malolactic fermentation completion had been confirmed by enzymatic analysis. The wines did not receive any oak treatments as that could have hidden any subtle chemical or sensory changes caused by the treatments and would have introduced a complicating variable. The wines were left to settle for two weeks at 8 C under the protection of inert gas and then racked. Free sulphur dioxide levels were checked and adjusted to 20 ppm free SO 2 before the wines were filtered through 0.45 μm membranes (Sartorius, Gottingen, Germany) and bottled under screw top caps Wine Aging Treatment Five bottles (half of the total) from each triplicate treatment were randomly selected. These were subjected to a short-term ageing test adapted from Ugliano (2008). The wine bottles were heated to 30 C in a temperature controlled room for 6 weeks and then transferred for storage in the Lincoln University winery cellar at approximately 8 C for 8.5 months. They are referred to throughout this thesis as artificially aged. The other half (referred to as naturally aged ) were aged at cellar temperature (approx. 8 C) for ten months. 43
54 Chapter 4 Chemical Analysis 4.1 Introduction In commercial wineries, a set of chemical analysis is undertaken on the grape juice and subsequent wine throughout the winemaking process to monitor progress and alert the winemaker to any issues. This study required standard winemaking analysis of the treatment microvins during fermentation and prior to pre-bottling filtration. Post bottling and aging, HS-SPME-GC-MS analysis of chosen esters, fatty acids and sulphides was undertaken to gauge if the treatments had caused any significant differences in the concentrations of these compounds. The compounds chosen for HS-SPME-GC-MS analysis were compounds that had been highlighted by previous studies as either potentially impacting Pinot noir aroma and flavour, or being affected by nitrogen addition (Ugliano et al. 2008, Ugliano et al. 2010). Measurement for esters and fatty acids were both done using stable isotope dilution analysis with HS-SPME-GC-MS methods developed at Lincoln University (Breitmeyer 2010). Concentrations of the following esters were measured: acetate esters (ethyl acetate, 2-methylpropyl acetate, 2-methylbutyl acetate, 3-methylbutyl acetate, hexyl acetate and phenylethyl acetate), ethyl esters (ethyl propanoate, ethyl butanoate, ethyl 2- methylpropanoate, ethyl 2-methylbutanoate, ethyl 3-methylbutanoate, ethyl hexanoate, ethyl decanoate, ethyl octanoate, ethyl dodecanoate). Six fatty acids were measured: 2-methylpropanoic acid, 3-methylbutanoic acid, 2-methylbutanoic acid, hexanoic acid, octanoic acid, decanoic acid. Sulphide analysis was done at the Australian Wine Research Institute (AWRI) using static headspace injection and cool-on-column gas chromatography coupled with sulphur chemiluminescence detection (GC-SCD). The ten volatile sulphur compounds analysed are found after fermentation and are considered relevant to reduced aromas and off-odours (Siebert et al. 2010). They are potent, low molecular weight and low boiling point sulphur compounds, plus related acetates and disulphides. Concentrations of hydrogen sulphide, methanethiol, ethanethiol, dimethyl sulphide, carbon disulphide, diethyl sulphide, methyl thioacetate, dimethyl disulphide, ethyl thioacetate and diethyl disulphide were measured. Multivariate statistical analyses were employed on the results for the esters, fatty acids and sulphides. The aim being to identify which variables contributed most to the overall variability in the raw data and to isolate any variables that were related. Multiple linear regression was used to model the relationship between the treatment and response variables to determine if there was a 44
55 mathematical relationship between them. The techniques used were multivariate analysis of variance (MANOVA), canonical variate analysis (CVA) and principle component analysis (PCA). MANOVA determined whether either (or both) of the treatments had significantly impacted the concentration of a compound. If the interaction was significant in the MANOVA it was then possible to use the multi-dimensional mean separation technique, canonical variate analysis (CVA). CVA produces a dimensional representation (a scatter plot of specimens along the two first canonical axes), that highlights as accurately as possible the differences that exist between the data subsets. CVA linear combinations of the original variables are selected to maximize the ratio of the between sample to the within sample variance (Tatsuoka 1971). Principle component analysis (PCA) was also used to compare mean data for the treatments to assess and describe any similarities between the individual wines. In PCA, linear combinations of the original variables are derived which explain the maximum amount of variation in the data set and which are orthogonal (i.e. uncorrelated and perpendicular to each other) (Heymann and Noble 1987). Therefore PCA effectively reduces the number of variables and can illustrate the relationships amongst the variables and the wines. 4.2 Methods and Materials Chemical Analysis of Juice and Wine. The juice and wines were analysed by standard methods described in Iland et al. (2004). ph and titratable acidity (TA) were measured using a Metrohm 827 meter (using titration for the TA). Brix was measured by hydrometry and residual sugar by enzymatic glucose / fructose UV spectrophotometry. Malic acid and acetic acid were analysed using Randox enzymatic kits and UV spectrophotometry. Yeast available nitrogen was determined using the combined results of ammonia enzymatic UV spectrophotometry and NOPA primary amino acid determination as described in Dukes (1998). Free sulphur dioxide was determined by aspiration method and alcohol was measured by ebulliometry Ester Chromatographic Analysis The concentrations of fifteen esters (6 acetate esters and 9 ethyl esters) were determined using a modified HS-SPME-GC-MS-SIDA method previously described in Parr et al (2007). These researchers 45
56 used the method to quantify methoxypyrazine concentrations in Sauvignon blanc and used only one poly-deuterated internal standard. The current study used seven non- deuterated standards. All wine samples were diluted immediately prior to analysis. This sample dilution involved pipetting 0.9 ml of wine and 8.06 ml of deionised water into 20 ml SPME sample vials followed by 40 μl of the composite deuterated internal standard solution (a 10 fold dilution of the wine). Sodium chloride (3.0 g) was added to the SPME vial just prior to capping. Samples were incubated initially for 10 minutes at 60 ºC during which time the vial was agitated at 500 rpm. After 10 minutes the SPME fibre was exposed to the headspace of the vial for a period of 60 minutes at 60 ºC, during which time the headspace volatiles were adsorbed onto the fibre. No agitation was used during the 60 minute extraction period. Analysis was carried out using a Shimadzu GC-MS-QP2010 gas chromatograph mass spectrometer equipped with a CTC Combi-Pal autosampler (CTCAnalytics AG, Switzerland) using Version 2.50 of Shimadzu s GC-MS solution data 59 acquisition software. The NIST05 (National Institute of Standards and Technology) mass spectra library was used to confirm the identities of all standards. The SPME fibre used was a 2 cm long Stableflex DVB/CAR/PDMS combination SPME fibre (p/n U, 50/30 μm thickness, 24 gauge). A twin column system was used in series: a Rtx-Wax 30.0 m x 0.25 mm ID x 0.5 μm film thickness (Polyethylene Glycol - Restek, Bellefonte, PA, USA) and a Rxi-1MS 15 m x 0.25 mm ID x 0.5 μm (100% dimethyl polysiloxane - Restek, Bellefonte, PA, USA). The total run time was 67 minutes with aroma compounds eluting at different times over that period. A helium carrier gas was used was set to a constant linear velocity of 33.5 cm/s. The column oven was held at 35 C for 3 minutes (during desorption of the SPME fibre), then increased to 250 C at 4 C/min and held at this temperature for 10 minutes. Full scan mode was used for all of the analytes except ethyl cinnamate which was analysed using single ion monitoring (SIM) mode Fatty Acid Chromatographic Analysis Analysis for concentrations of six fatty acids was carried out using a Head Space Solid Phase Micro- Extraction Gas Chromatograph Mass Spectrometric (HS-SPME-GC-MS) method fully described in Tomasino (2011b). The same Shimadzu GC-MS, SPME cable and dual column set-up was used as per the ester analysis. All standards and samples were prepared in the same manner as for ester analysis. The ph of the solution in the vials was adjusted by using water adjusted to ph 3.5 to ensure the fatty acids were all in non-ionised volatile forms. 46
57 The total run time was 27.3 minutes. Splitless injection was used for the first 3 minutes of the runtime, after which split mode was used at a 20:1 ratio. The helium (He) carrier gas was set to a constant linear velocity of 46.8 cm/s. The column oven was held at 50 C for 3 minutes, increased to 240 C at 10 C min-1, then further increased to 250 C at 30 C min -1 and held at this temperature for 5 minutes. The total run time was 27.3 minutes. The interface and MS source temperatures were set at 250 C and 200 C respectively and the MS was operated in electron impact mode (EI) at an ionization energy of 70 ev. Full scan mode was used for all standards Sulphide Chromatographic Analysis Ten sulphides were quantified using a volatile sulphur compound analysis method described by Siebert et al. (2010). Static headspace-cool-on-column (HS-COC) GC-SCD was used, with ethyl methyl sulphide (EMS) and propyl thioacetate (PrSAc) as internal standards. Analysis of the sulphur compounds in wine has proved challenging to researchers for a number of reasons including; the complexity of the sample matrix (i.e. wine), because sulphur compounds are at low concentration levels, are highly reactive and have a wide range of volatility due to differing boiling points (Fang and Qian 2005, Mestres et al. 1997, Mestres et al. 1998, Mestres et al. 2000b). The samples were analysed using an Agilent 6890 gas chromatograph (Forest Hill, VIC, Australia) equipped with a Gerstel multipurpose sampler (MPS 2XL, Lasersan Australasia, Robina, QLD, Australia) and coupled to an SCD. GC-SCD uses a Sulphur Chemiluminescence detector for identification of sulphur containing compounds. The SCD is a very sensitive and selective detector for sulphur compounds. It gives a linear response over a wide concentration range and there is no problem of hydrocarbon quenching (which is an issue with other sulphur detectors). Sample compounds exiting the column are combusted to form sulphur monoxide (SO). The sulphur monoxide passes into a reaction cell where it reacts with ozone. The light produced by the reaction is directly proportional to the amount of sulphur in a compound, allowing for the determination of concentration. This method of analysis is most commonly used for the detection of sulphur compounds in wine such as hydrogen sulphide (H 2S) and dimethyl sulphide (DMS). Wine samples were cooled to 4 C in their original containers prior to opening, and all sample handling was completed in a temperature-controlled room at 4 C. An aliquot of wine (10 ml) was added to a 20 mm Lamber glass headspace vial containing 2 g of NaCl. Internal standard solution (25 μl) was added to give known final concentrations of the internal standards EMS (approximately 50 47
58 μg/l) and PrSAc (approximately 125 μg/l). Acetaldehyde (4 μl) was added to each wine sample vial to remove interference from sulphur dioxide. The gas chromatograph was fitted with a 15 mm x 0.25 mm FactorFour VFWAXms fused silica capillary column, 0.50 μm film thickness (Varian, Mulgrave, VIC, Australia) connected with a fused silica universal straight connector (Grace Davison Discovery Sciences) to a 60 m x 0.25 mm VICI ValcoBond VB-5 fused silica capillary column, 0.50 μm film thickness (Chromalytic Technology, Boronia, VIC, Australia), with a 2 m x 0.53 mm retention gap. Helium (Air Liquide ultrahigh purity), linear velocity = 37 cm/s, flow rate = 2.7mL/ min in constant flow mode, was used as the carrier gas. The initial oven temperature was held at 5 C for 5 min, increased to 150 at 5 C/min, and held at this temperature for 5 min. The cool-on-column (COC) inlet (AgilentG3440A) (pressurized to kpa) was held at 30 C for 10 min and ramped at the same rate as the oven. 4.3 Results and Discussion In a commercial winery, juice samples are analysed the day after the grapes have been harvested and put into tank. The parameters tested are soluble solid content, acidity levels and yeast available nitrogen. Soluble solids ( Brix) provides an indication of ripeness and potential alcohol. Acidity (assessed by ph and titratable acidity (TA)) also shows degree of ripeness and enables the winemaker to gauge whether tartaric acid addition or deacidification is required. Yeast available nitrogen is measured to see if additional nitrogen is required to provide sufficient nutrients for the yeast to complete fermentation without the production of sulphides. The wines in this study were allowed to settle in tank one day before analysis. The final chemical assessment of commercial wines is done just before bottling. This analysis generally includes alcohol level, acid levels (ph and TA), residual sugar (fructose and glucose) and malic acid Standard Chemical Parameters of the Experimental Wines Standard compositional parameters of the juice on the day of processing and wines pre-bottling are given in Tables 4.1 and 4.2, respectively. The wine samples were composite samples of the replicate ferments for each treatment. The must analysis shows the grapes were ripe with a high sugar level of 48
59
60 Addition of nutrients to fermentations has been shown to influence the basic chemical composition of wines, probably because of changes in yeast activity. In this study the ph trended downward with increasing YAN. This was similar to the findings of Ugliano et al. (2010) which suggested the ph change was related to the residual DAP in the wine. Findings in a study by Hernandez-Orte (2006) also found a decrease in the ph of the wines with increased nutrition. That study used a somewhat different protocol; the wines were synthetic and nitrogen levels were boosted to 400 mg N/L with ammonium sulphate. However their explanation for ph decrease seems plausible and fits with the data from the current study. They argued that the yeast utilises nitrogen sources by rapid active transport of the ammonium into the cell (Dubois and Grenson 1979). Nitrogen added early in the fermentation is mostly assimilated into amino acids and stimulates protein synthesis to increase the yeast cell population. In amino acid synthesis the ammonium ion is completely incorporated in the yeast carbon skeleton without the intercellular ph changing. Any ammonium not used is stored in the vacuoles so it is available when needed (Bisson 1991) or transformed into ammonia and hydrogen ions in the cytoplasm. To avoid acidification of the cytoplasm the yeast cell must actively pump protons out into the surrounding medium using membrane ATPase, therefore decreasing the wine ph value. Past research results for titratable acidity (TA) trends are varied and seem to be impacted by the yeast strain. In the present study TA decreased with increasing nitrogen availability and this is the same as Ugliano et al (2010) results for AWRI 1176, a S. bayanus yeast. However the same study found an upwards shift in TA with S. cerevisiae yeast D254. Therefore the change in acidity is not entirely straightforward and requires more observation. Whichever the trend, the changes in acidity can impact wine balance and affect the final perceived flavour of the wine (Sowalsky and Noble 1998). The slight decrease in ethanol content (Table 4.2) with increasing nitrogen supplementation agrees with the findings of Ugliano et al (2010). They postulated that increased YAN caused a shift in carbon utilization with the yeast cells resulting in lower ethanol concentrations and this agreed with findings by Kutyna (2010). Hernandez-Orte (2006) suggested the variables affecting the amount of alcohol production were more complex and probably dependent on at least three interacting variables - yeast strain, timing of nitrogen additions as well as the amount of nitrogen added. Their trial used three different Saccaromyces cerevisiae yeast strains, two of which showed significant increases in ethanol with increasing nutrition and the other a decrease. Further study into the interaction of 50
61 these variables on yeast metabolism and subsequent alcohol production is needed. Increased alcohol levels have been found to reduce the perceived intensity of berry attributes in red wines (Escudero et al. 2007, Guth 2002). The sensory implications will be discussed in a later chapter (refer to section 6.4.1) Impact of DAP Addition and Artificial Aging on Concentrations of Esters Results for the ester analysis of the wines showed that diammonium phosphate addition had statistically significant effects on the concentrations of ten of the fifteen esters measured. The trends caused by the treatments varied between (and within) the classes of esters (Tables 4.3 and 4.4). There were significant interactions between the DAP and aging treatments for ethyl acetate (p<0.05) and ethyl pentanoate (p<0.001). Both compounds showed a significant decrease in concentration (p<0.001) with increasing DAP treatment but the aging patterns were unclear. There were also significant decreases (p<0.001) in concentrations for four other esters (ethyl butanoate, ethyl hexanoate, phenyl ethyl acetate and ethyl 2-methyl butanoate) with increasing DAP supplementation. The exceptions to this trend were ethyl decanoate, ethyl 2-methyl propanoate, hexyl acetate (p<0.001) and ethyl octanoate (p<0.05), that showed significant increases in concentrations. Artificial aging of the wines showed significant effects on the concentrations of six esters with five increasing in concentration. The concentration of ethyl propanoate, ethyl decanoate, ethyl 2-methyl propanoate, ethyl 2-methyl butanoate (p<0.001) and ethyl octanoate (p<0.05) in the aged wines were significantly increased compared to the naturally-aged wines. Hexyl acetate was the only ester analysed to show a significant decrease with aging (p<0.05). 51
62 Table 4.3 Pinot noir Ethyl Fatty Acid Ester concentrations (µg/l) for three treatments of DAP addition and two levels of aging Treatments Ethyl Ethyl Ethyl Ethyl Ethyl Ethyl Ethyl DAP additions a Aging b Propanoate Butanoate Pentanoate Hexanoate Octanoate Decanoate Dodecanaote C N T 1 N T 2 N C A T 1 A T 2 A DAP add ns *** *** *** ** *** ns Aging *** ns ns ns ** *** ns DAP add x Aging ns ns *** ns ns ns ns Significance levels are: ns is P > 0.05; ** is P < 0.05; *** is P < a C, Control, 457mg/L YAN; T1, same juice as control but initial YAN increased by 150mg/L; T2, same juice as control but initial YAN increased by 250mg/L b N, the wine aged naturally for 10 months; A, the wine was aged artificially for 6 weeks at 30⁰ C post bottling then aged naturally for 10 months
63 Table 4.4 Pinot noir Ester concentrations (µg/l) for three treatments of DAP addition and two levels of aging Treatments Ethyl 2-methyl 3-methyl Hexyl Phenyl ethyl Ethyl Ethyl 2-methyl Ethyl DAP additions a Aging b acetate propyl acetate butyl acetate acetate acetate isobutyrate butanoate cinnamate C N 8.7 x T 1 N 7.8 x T 2 N 7.5 x C A 8.6 x T 1 A 7.8 x T 2 A 8.2 x DAP add *** ns ns *** *** *** *** ns Aging ns ns ns ** ns *** *** ns DAP add x Aging ** ns ns ns ns ns ns ns Significance levels are: ns is P > 0.05; ** is P < 0.05; *** is P < a C, Control, 457mg/L YAN; T1, same juice as control but initial YAN increased by 150mg/L; T2, same juice as control but initial YAN increased by 250mg/L b N, the wine aged naturally for 10 months; A, the wine was aged artificially for 6 weeks at 30⁰ C post bottling then aged naturally for 10 months
64 In order to consider the contributions of both treatments (DAP and artificial aging) on the wine composition, multivariate statistical methods were applied using Genstat 12.2 (VSN International Ltd). Multivariate analysis of variance (MANOVA) results suggested that both DAP addition and aging had a significant influence on the production of esters (p < 0.001) and there was no interaction between the treatments. With no significant interactions evident using MANOVA it was possible to use canonical variate analysis (CVA) on the raw statistical data to get a graphical map of the sample mean separations (Figure 4.1). CVA produces a dimensional representation that highlights as accurately as possible the differences that exist between the data subsets. CVA linear combinations of the original variables are selected to maximize the ratio of the between sample to the within sample variance (Tatsuoka 1971). The first canonical variate 1 (CV1) explained more than half of the total variance (60.0%) although variate 2 had some influence (30.7%). The distribution of the wines on the plot shows that the naturally-aged wines clustered toward the lower half and the artificially aged in the upper part of the diagram and seem related to CV2. The DAP treatments are separated across both canonical variants and this pattern of positioning is mirrored for the artificially aged treatments but further upward. The esters that contributed the most to the separation of the treatment means across the two variates can be determined using the data in Table 4.5. The greatest contributors to separation on the CV1 axis were phenyl ethyl acetate followed by ethyl acetate, ethyl hexanoate and ethyl-2 methyl butanoate. The main esters influencing separation in CV2 were ethyl decanoate followed by ethyl isobutyrate. The relationship between the change in concentration of these esters and the different treatments is not entirely clear but CV1 does seemed more linked to the DAP treatment changes and CV2 to aging. 54
65 DAP Treatments are: C (Control, 457mg/L YAN) T1 (YAN increased by 150mg/L) T2 (YAN increased by 250mg/L) DAP Treatments are: C (Control, 457mg/L YAN) T1 (YAN increased by 150mg/L) T2 (YAN increased by 250mg/L) Aging Treatments are: N (Natural - 10 months at 8 C) A (Artificial 6 weeks at 30 C, then naturally for 10 months) Aging Treatments are: N (Natural - 10 months at 8 C) A (Artificial 6 weeks at 30 C, then naturally for 10 months) Figure 4.1 Canonical variate analysis representation of the mean separation for the ester data. 55
66 Table 4.5 Canonical variate correlations between the latent root vectors and various esters. Ester Vector 1 Vector 2 Ethyl acetate Ethyl propanoate Ethyl isobutyrate methylpropyl acetate Ethyl butanoate Ethyl-2 methyl butanoate Isoamyl acetate Ethyl pentanoate Ethyl hexanoate Hexyl acetate Ethyl octanoate Ethyl decanoate Ethyl dodecanoate Ethyl cinnamate Phenyl ethyl acetate Effect of DAP Addition on Ester Concentrations Aromatic ethyl esters constitute one of the largest and most important groups of compounds affecting flavour in fermented beverages (Peddie 1990). They have been found to be important to the perception of fruity aromas in red wine and are found at concentrations above their threshold values in Merlot, Cabernet sauvignon, Cabernet franc and Grenache (Ferreira and Cacho 2009, Ferreira et al. 1998, Kotseridis and Baumes 2000, López et al. 1999). However concentrations of ethyl esters in Pinot noir have been typically found to be lower than other varietals (Ferreira 2010). Few studies have measured the concentrations of volatile organic components in New Zealand Pinot noir wines. However useful comparisons can be made between range of concentrations found in this study and Pinot noir research wines from Oregon (Fang and Qian 2006), Burgundy (Schreier et al. 1980) and Waipara New Zealand (Kemp 2010) plus a recent survey of selected commercial Pinot noir 56
67 from four areas in New Zealand (Tomasino 2011b). The concentration of ethyl butanoate, ethyl hexanoate, ethyl pentanoate, isoamyl acetate and hexyl acetate in this study were at similar levels found in commercial NZ Pinot noir (Tomasino 2011b). Ethyl isobutyrate, ethyl hexanoate and ethyl cinnamate were at the low end of the NZ Pinot noir range. Ethyl octanoate and ethyl decanoate concentrations were all lower than those found in NZ Pinot noir (Tomasino 2011b) but within range for concentrations found in Oregon Pinot noir (Fang and Qian 2006). Ethyl acetate concentrations were considerably higher than found in Burgundy wines (Schreier et al. 1980) but lower than the NZ research Pinot noir wine (Kemp 2010). The concentration of ten esters were significantly impacted by nitrogen addition, with the most common trend being a decrease in concentration with increasing DAP. Of the ethyl fatty acid esters; ethyl butanoate, pentanoate and hexanoate all decreased in concentration but ethyl octanoate and decanoate increased with additional DAP. Ethyl esters are formed intracellularly by fermenting yeast cells from ethanol and a medium chain-chain fatty acid (MCFA) (Saerens et al. 2008). The rate of formation is dependent on three factors: the concentrations of the two co-substrates (ethanol and the acyl coenzyme A component) and the activity of the enzymes that are involved, with the availability of the fatty acid precursor being the major limiting factor (Saerens et al. 2008). The final wine concentration is also affected by rate of diffusion out of the yeast cell. The esters are lipid soluble so can diffuse through the yeast cell membrane into the fermenting medium. Nykänen (1977) concluded the ease of transfer of ethyl esters through the yeast cell wall tends to decrease with increasing chain length from 100% for ethyl hexanoate to 54-68% for ethyl octanoate. This potentially equates to higher final wine concentrations for the smaller MCFA ethyl esters. However the results for this study shows not only high concentrations of ethyl propanoate at all DAP levels but also for the larger C 6 and C 8 compounds. This implies that the variables involved are more complex. Previous research into the effect of nutrition on the volatile composition of wines has found that increased nutrition impacted positively on MCFA and MCFA ester total production but the individual compounds showed different responses. This seemed to be influenced by the form of ammonium provided (Vilanova et al. 2007), the yeast species and the experimental conditions (Hernandez-Orte et al. 2006, Ugliano et al. 2010, Vilanova et al. 2007). The pattern of results in the current study (the shorter ethyl MCFA esters decreased in concentration with increased nutrition whereas the longer chain ethyl octanoate and ethyl decanoate increased) do not match similar studies using either Saccharomyces cerevisiae (var. cerevisiae) or S. bayanus yeast (Ugliano and Henschke 2008, Ugliano et al. 2010). The DAP treatments levels were lower in the earlier trials (final YAN 400mg/L and lower) but the general trends were, for S. cerevisiae fermentations all MCFA esters concentrations 57
68 increased, while for S. bayanus, ethyl propanoate significantly increased and the larger esters decreased. S. cerevisiae var. bayanus was used in this study so the increase in concentration of C 8 and C 10 may be influenced by yeast strain response complicated by very high nitrogen conditions. A further factor is the issue of yeast strain. Vilanova et al (2007) suggested that the rate of conversion of MCFA into their corresponding ethyl esters is also strongly dependent on the yeast strain. Their research used two strains of S. cerevisiae var. cerevisiae (AWRI 796 and M05). These strains are the same species and race but showed significant differences in volatile production. For example increasing YAN levels resulted in a decrease in the production of C 6 fatty acid and ester by AWRI 796 but not M05. They also noted that at the same DAP treatment levels AWRI 796 produced between three and four times more MCFA than M05, however MCFA ethyl esters never exceeded double the M05 concentration. Vilanova et al (2007) suggested that differences in expression of the ethyl ester synthetic genes EHT1 and EEB1 or regulation of the balance between their ester synthetic and esterase activities could be involved. Differences in metabolism between species, races and strains does appear to impact fatty acid and subsequent ester formation resulting from changes in nutrition. The current study used S. cerevisiae var. bayanus and it is difficult to isolate the impact of yeast species from DAP addition effects. The concentrations of the fatty acid precursors (Table 4.5) mimic the trend of MCFA ethyl esters concentrations. This agrees with findings that precursor availability rather than expression of the esterification pathway controls the formation of MCFA ethyl esters (Saerens et al. 2008). Therefore it is likely that the trends seen in this and other similar studies e.g. (Ugliano et al. 2010, Vilanova et al. 2007) are the result of regulation of the biosynthesis of the precursor fatty acids rather than their esterification (Saerens et al. 2006). In the results for the present study, the trends in the esters concentrations (ethyl decanoic, ethyl octanoate and ethyl isobutyrate) mimic those of their MCFA precursors, decanoic, octanoic and isobutryic acids respectively. MCFAs are formed through acylation by coenzyme A during the early stages of fatty acid biosynthesis, with the exception of the smaller C3 and C4 fatty acids precursors which are formed from α- ketobutyrate using a different metabolic pathway to the larger fatty acids (Eden et al. 2001). The corresponding esters are then formed enzymatically through the action of an esterase or an acyl-coa ethanol transferase, with the latter being responsible for a large part of the MCFA ethyl esters produced during fermentation (Mason and Dufour 2000). The fatty acids discussed later in this section therefore have a strong influence on final ester concentration in wine. 58
69 Branched-chain ethyl esters are derived from branched chain acids as part of the amino acid metabolism of yeast. Branched chain amino acids (valine, leucine, isoleucine) are transaminated to α-keto acids, which undergo decarboxylation to form aldehydes which are oxidised to form branched chain fatty acids (Dickinson et al. 1997). Previously overlooked, GC-O studies in the last decade have highlighted that because of their low odour thresholds (between 1-18 ᶙg/L) branched-chain ethyl esters can be important odorants in wine (Aznar et al. 2001, Guth 1997a). In this trial increased addition of nitrogen resulted in a mixed pattern for the branched chain ethyl esters (ethyl isobutyrate tended to increase and ethyl 2-methyl butanoate decrease). Ugliano (2010) compared the response of S. cerevisiae var. cerivisiae and S. bayanus strains to increased nutrition. The results showed significant decreases in both compounds for both yeast species, therefore the ethyl isobutyrate increase in the present study may be due to yeast race or a response to the much higher levels of YAN. In line with other studies (Ugliano et al. 2008, Ugliano et al. 2010) the concentrations of the fatty acid precursors (isobutryic acid, 2-methyl butanoic acid) show the same trends as their respective esters and may determine the final concentration of these esters. Of the five acetate esters measured, the concentrations of three were affected by DAP supplement. Ethyl acetate and phenyl ethyl acetate significantly decreased, however hexyl acetate concentration increased with additional nutrition. Acetate esters are made up of an acid acetate group and an alcohol group (either ethanol or a complex alcohol derived from amino acid metabolism). They are formed during an energy requiring process that takes place inside the yeast cell and requires the metabolite acetyl-coa (Nordström 1961). This involves condensation of the alcohol with acetyl-coa catalysed by alcohol acyl transferase enzymes (Mason and Dufour 2000). Maximum acetate ester concentration would be expected at the end of fermentation when formation ceases (Nordström 1962). Acetate esters are produced at higher concentrations and therefore are easier to measure than ethyl esters (Saerens et al. 2008). Yoshimoto (2002) found that increased nitrogen availability can increase transcription of ATF1 and ATF2, the genes which encode the two main alcohol acyl transferases in yeast, therefore leading to higher acetate concentrations. It should be noted that research was done using synthetic wines and a combination of amino acids and ammonium citrate were used as nitrogen supplementation rather than diammonium phosphate. Increased nitrogen nutrition has been shown to increase ethyl acetate and other acetates (Ugliano et al. 2008). This applied for ethyl acetate, hexyl acetate, 2-methylpropyl acetate, 3-methylbutyl acetate and phenyl ethyl acetate. Later research by Ugliano (2010) suggested that yeast species used may have an influence on response to added nutrition. S. cerevisiae yeast generally showed higher production of acetate esters than S. bayanus and increased nutrition reinforced that trend. 59
70 Concentrations of ethyl acetate (which is produced by yeast at the highest concentration of any acetate) significantly increased with S. cerevisiae var. cerevisiae but decreased in the S. bayanus fermentations. The results from the present study (using S. cerevisiae var. bayanus yeast) agree with the S. bayanus results in the Ugliano study (2010) with hexyl acetate being the only acetate to significantly increase with increasing nutrition. Therefore yeast race, as well as species, may influence ester formation and response to nutrition. Canonical variate analysis of the current data (Figure 4.1) suggested that the ester concentrations were impacted by both the DAP treatment and aging. The separation of the DAP treatments showed changes in ester concentrations with are influenced by contributions from both CV1 and CV2. The distribution of treatments across CV1 suggests that decreases in the concentrations of four esters, ethyl 2-methyl butanoate, phenyl ethyl acetate and ethyl acetate (with increasing DAP) explains much of the separation across the nitrogen treatments. However increases in concentrations of ethyl decanoate, ethyl 2-methyl propanoate and to a lesser degree ethyl octanoate also contributed. Findings from other trials on nitrogen nutrition studies (Carrau et al. 2008, Ugliano et al. 2008, Ugliano et al. 2010, Vilanova et al. 2007) support the hypothesis that the availability of precursors controls the production of MCFA and the branched chain ethyl esters rather than the activity of esterification pathway. This is in agreement with the trends observed here for the decanoic, octanoic and isobutryic acids, precursors to ethyl decanoic, ethyl octanoate and ethyl isobutyrate respectively. A further complicating factor is the issue of yeast strain. Vilanova et al (2007) suggested that the rate of conversion of MCFA into their corresponding ethyl esters is also strongly dependent on the yeast strain. Their research used two strains of S. cerevisiae var. cerevisiae (AWRI 796 and M05). At the same DAP treatment levels AWRI 796 produced between three and four times more MCFA than M05, however MCFA ethyl esters never exceeded double the M05 concentration. Vilanova et al (2007) suggested that differences in expression of the ethyl ester synthetic genes EHT1 and EEB1 or regulation of the balance between their ester synthetic and esterase activities could be involved. The fatty acids discussed later in this section therefore have a strong influence on final ester concentration in wine. Effect of Aging on Ester Concentrations Early studies on aging found that in maturing wines esters may be lost due to hydrolysis, be formed through chemical esterification or remain in equilibrium depending on their initial post fermentation concentrations (Ramey and Ough 1980). Later studies of storage conditions and wine aroma 60
71 composition have shown that acetate esters and ethyl MCFA esters tend to decrease in concentration with aging. The changes in concentration are accelerated by high temperature and low ph but also depend on the esters and the corresponding acids (Aznar et al. 2001, Marais 1978). In contrast, the concentrations of ethyl esters of branched-chain acids can remain constant or even increase with aging (Diaz-Maroto et al. 2005, Robinson et al. 2010). Changes in the acid-ester equilibrium are thought to be the major pathway for the formation of branched-chain ethyl esters during aging (Diaz-Maroto et al. 2005). The concentrations of the branched-chain ethyl esters (ethyl isobutyrate and ethyl 3-methyl butanoate) measured in this study did increase with aging as expected. The acetate ester hexyl acetate also followed the expected trend and decreased. In contrast the concentrations of ethyl propanoate, ethyl octanoate and ethyl decanoate significantly increased with aging. However the clear difference between the aged and naturally-aged groups was consistent across DAP treatments. In a similar trial to the present one, Ugliano et al. (2008) combined increased DAP addition with aging. Those results showed concentrations of all esters decreasing with aging except the branchedchain ethyl esters. Therefore the increase in concentration of the ethyl MCFA ester in the present study may be a direct impact of the higher levels of DAP addition compared to Ugliano et al. (2008). The canonical variate analysis of the data (Figure 4.1) show the aged treatments distributed across both axes CV1 and CV2. Therefore both canonical variants contribute to the separation differentiating aging treatments. An increase in the concentration of branched-chain ethyl ester, ethyl 2 methyl butanoate was the only significant result for aging in CV1 and therefore explains most of the separation of the aging response. For CV2 increases in the concentrations of ethyl decanoate, ethyl 2 methyl propanoate and ethyl octanoate were significant results for aging and explain about 30% of the aging separation. The significant increase in concentration of the branched-chain ethyl ester ethyl 2 methyl butanoate, with aging agrees with results from other studies. Diaz-Maroto (2005) suggested that formation during aging could depend on the acid ester equilibrium, if the esterification molar ratios of the branched fatty acids were lower in young wines than in aged wines at the equilibrium. They could also be formed by the shifting of this acid ester equilibrium, due to the formation of branched fatty acids. Ugliano (2008) agreed with this hypothesis. 61
72 As previously stated, other studies of wine aging have observed the levels of ethyl esters of MCFA and that of the fusel alcohol acetates generally decrease during wine aging (Pérez-Coello et al. 2003, Shinohara and Watanabe 1981, Ugliano et al. 2008). Therefore the data from the present study with three MCFA ethyl esters showing significant increases with aging is unexpected. The aging of the wine seems to have provided conditions for the conversion of fatty acids to fatty acid esters. Ugliano (2008) did observe an increase in ethyl propanoate for the two treatments above 250 mg/l YAN so potentially high levels of nitrogen in this study may have influenced the aging response. The method for artificially aging also differs between the studies and may have impacted the final results. For example the present study aged the bottled wine for 6 weeks at 30 C, Ugliano (2008) adjusted the wine ph to 3.5 prior to storage at 30 C and Pérez-Coello (2003) used naturally aged commercial wines. Overall, esters concentrations tended to decrease with nitrogen addition with the exception of ethyl octanoate, ethyl decanoate, hexyl acetate and ethyl 2 methyl butanoate. Conversely, artificially aging the wines significantly increased the concentration of four esters and decreased only hexyl acetate. Decreases in the concentrations of phenyl ethyl acetate, ethyl acetate and ethyl hexanoate explained much of the variation between the wines however the increase in ethyl decanoate (related to DAP additions and artificial aging) was also important Impact of DAP Addition and Artificial Aging on Concentrations of Fatty Acids The addition of DAP significantly affected the concentration of six of the eight fatty acids measured (Table 4.6). The concentration of hexanoic and 2-methylbutanoic (p<0.001), acetic, butanoic and isovaleric acids (p<0.05) decreased as DAP increased. Decanoic acid was the only fatty acid that significantly increased (p<0.001) with DAP supplementation. Decanoic acid concentration (p<0.001) also increased with artificial aging, conversely butanoic acid (p<0.05) decreased following artificial aging relative to natural aging. 62
73 Table 4.6 Pinot noir Fatty Acid concentrations (µg/l) for three treatments of DAP addition and two levels of aging Treatments Acetic Butanoic Hexanoic Octanoic Decanoic Isobutyric Isovaleric 2 methyl DAP additions a Aging b acid acid acid acid acid acid acid butanoic acid C N 5.4 x T 1 N 5.2 x T 2 N 5.0 x C A 5.2 x T 1 A 5.1 x T 2 A 5.0 x DAP add ** ** *** ns *** ns ** *** Aging ns ** ns ns *** ns ns ns DAP add x Aging ns ns ns ns ns ns ns ns Significance levels are: ns is P > 0.05; ** is P < 0.05; *** is P < a C, Control, 457mg/L YAN; T1, same juice as control but initial YAN increased by 150mg/L; T2, same juice as control but initial YAN increased by 250mg/L b N, the wine aged naturally for 10 months; A, the wine was aged artificially for 6 weeks at 30⁰ C post bottling then aged naturally for 10 months
74 The fatty acid data for the wine samples were standardised prior to statistical analysis. This was because the concentration of acetic acid was 10 2 to 10 3 times higher than those of the other fatty acids. Results of PCA (Table 4.7) showed that PC1 and PC2 accounted for 40.43% and 22.28% of the variance, respectively. The correlation matrix suggested that butanoic acid, isovaleric acid and 2-methylbutanoic acid (all negative loadings) contributed most to the variation in PC1 and isobutryic acid to PC2. Decanoic acid was the only fatty acid to have a positive correlation for PC1.Multivariate analysis of variance (MANOVA) produced a similar result to that for esters; both DAP addition and aging had a significant influence on the production of fatty acids (p < 0.001) and there was no interaction between the treatments. Table 4.7 Correlation matrix for Principle Component Analysis of fatty acid data. Fatty Acid Vector 1 Vector 2 Acetic acid Isobutyric acid Butanoic acid Isovaleric acid methylbutanoic acid Hexanoic acid Octanoic acid Decanoic acid Canonical variate analysis showed that 92.8% of the variation could be accounted for in the first canonical variate (Figure 4.2). The pattern of separation of the wines on the plot clearly shows separation of the DAP treatments across CV1 and the artificially and naturally aged treatments along CV2. The fatty acids that contribute the most to the separation of the treatment means across the two variates are shown in Table 4.8. Isovaleric, hexanoic and 2-methylbutanoic acids (negative loadings) contributed most to separation in CV1 and therefore seem related to DAP treatment. Changes in decanoic acid concentration are the dominant influence to CV2 and seem to be related to aging treatment. However the CV2 account for only 5.9% of the variation so the effect of DAP treatments appeared to predominant for fatty acids. 64
75 CA Control Aged, CN Control Naturally-aged, T1A Treatment 1 Aged T1N Treatment 1 Naturally-aged, T2A Treatment 2 Aged, T2N Treatment 2 Naturally-aged DAP Treatments are: C (Control, 457mg/L YAN) T1 (YAN increased by 150mg/L) T2 (YAN increased by 250mg/L) Aging Treatments are: N (Natural - 10 months at 8 C) A (Artificial 6 weeks at 30 C, then naturally for 10 months) Figure 4.2 Canonical variate analysis representation of the mean separation for the fatty acid data Table 4.8 Canonical variate correlations matrix values for fatty acids. Fatty Acid Vector 1 Vector 2 Acetic acid Isobutyric acid Butanoic acid Isovaleric acid methylbutanoic acid Hexanoic acid Octanoic acid Decanoic acid
76 Effect of DAP Addition on Fatty Acid Concentration The concentrations of fatty acids found in the present study are within the ranges measured in regional NZ Pinot noir wines by Tomasino (2011a). However there are no published research results for typical concentrations of decanoic acid. This is unfortunate as of the eight fatty acids analysed for in this trial, the concentrations of five were significantly decreased by DAP addition with the exception of decanoic acid which increased. Fatty acids are important components needed by yeast to build new membranes. Therefore during the early rapid cell multiplication phases of fermentation yeasts must synthesise large amounts of fatty acids, sterols and phospholipids (Ribéreau-Gayon et al. 2006). Fatty acids are formed in the presence of oxygen, using a complex process catalysed by a multi-enzymatic complex (fatty acid synthase) to initially produce palmitic acid which is then used to produce other fatty acids (Zamora 2009). Fatty acids are found in grape juice and appear to be taken up by the yeast, as some researchers have found that excessive juice clarification drastically reduces the fatty acid content of the resultant wine and can cause stuck fermentations (Delfini et al. 1992). Earlier studies summarised in Lambrechts (2000) found that the final concentration of fatty acids can be affected by many variables including changes in growth substrate and minor alternations in growth conditions (e.g. ph, temperature, dissolved oxygen and the levels of nutrients). The concentrations and portions of the medium-chain fatty acids (MCFA) subsequently released into the fermentation are also thought to be dependent on the yeast strain, composition of the medium and fermentation conditions like, ph, aeration and nutrient levels of the must (Lambrechts and Pretorius 2000, Paltauf et al. 1992). This is a complex group of interacting variables and so it would seem logical that additions of diammonium phosphate would affect fatty acid production and secretion but it may be difficult to pinpoint the variables being affected. In this study concentrations of fatty acids tended to decrease with added nutrition with the exception of decanoic acid. Other research on nitrogen availability (Hernandez-Orte et al. 2006, Hernández-Orte et al. 2005, Ugliano et al. 2008, Vilanova et al. 2007) observed added nitrogen had a strong impact on the total concentration of MCFAs in the final wine, however the response of individual fatty acids varied to increasing nutrition. Vilanova (2007) suggested the responses could be influenced by differences in formation pathways used for smaller C3 and C4 MCFA compared to the larger fatty acids. However differences in treatment response between the larger compounds, as seen for C6-10 compounds in this study (which are produced in the same metabolic pathways) are more difficult to explain. Yeast strain and race variation is another possible explanation and different 66
77 strains have been shown to effect production of fatty acids at different nitrogen levels (Hernandez- Orte et al. 2006, Hernández-Orte et al. 2005, Vilanova et al. 2007). For example hexanoic acid which showed the most significant decrease (with increasing nutrition) in this study, similarly decreased in Vilanova (2007) for AWRI 796 ferments but increased for M05 ferments (both S. cerevisiae var cerevisiae). Hernandez-Orte et al (2006) also observed a strong influence of the yeast strain on the production of this compound at different nitrogen levels, with some strains producing less at high nitrogen levels. The increase in decanoic acid concentration (with increasing nutrition) in this study agrees with Ugliano et al. (2008) who found higher nitrogen resulted in an increase in the final concentration of C6, C8 and C10 fatty acids measured but their results were only significant for decanoic acid. They suggested this shows a nitrogen saturation effect on the net synthesis of the smaller compounds. Although the studies are not identical it is possible to compare the concentrations of this Pinot noir study and Ugliano et al. (2008) (which used Shiraz wines); the range concentration of all the fatty acids measured were higher in Ugliano et al. (2008). The higher YAN levels of the present study may have reached a nitrogen saturation level for all of the fatty acids except decanoic acid. Certainly the variables influencing fatty acid production are numerous and the interaction with responses to nutrition does not provide a clear pattern. More research is required to clarify this complex area. Acetic acid is an important fatty acid in wine production as its presence can negatively impact quality and its concentration in all finished wine exceeds that of any other fatty acid. Acetic acid typically shows an inverse relationship with nitrogen availability at low to moderate nitrogen levels followed by a direct relationship at higher levels (Bely et al. 2003, Hernandez-Orte et al. 2006). The significant decrease (p<0.05) with increasing DAP agreed with the findings of Ugliano et al. (2008), Hernandez (2006) et al and Bely (2003) who found a negative correlation between DAP supplementation and volatile acidity. Bely (2003) modified the nutrition of high sugar musts and suggested the increased nitrogen stimulated the yeast to produce NADH, decreasing the need for the cell to generate NADH from other redox reactions like the formation of acetic acid from acetaldehyde. Bely (2003) used potentially difficult to ferment, high sugar, botrytised juices. Their results found an optimum level of addition of 190 mg N/L below which acetic acid was reduced and above the concentration increased. This was not seen in the current data in healthy higher YAN fermentations. Another explanation for decreasing acetic acid concentrations at high YAN levels could be that the nitrogen-induced growth stimulation increases lipid synthesis, which then increases acetyl-coa demand, thereby limiting acetic acid accumulation (Ugliano et al. 2008). Early research by Peynaud (1947) demonstrated that the volatile acidity produced during the first 100g/L of sugar consumption was later metabolised by 67
78 the yeast. So possibly the higher nitrogen levels increased the rate of metabolism by one of the pathways discussed above. The CVA results (Figure 4.2) showed a clear separation between the control and DAP amended treatments along the CV1 axis, which was most highly correlated with 2-methyl butanoic acid, isovaleric acid and hexanoic acid. The concentrations of all three compounds decreased with increasing nitrogen addition. These results agree with previous research (Ugliano et al. 2010), (Vilanova et al. 2007) who found that the yeast type influenced the treatment effect on the concentration of fatty acids produced. Saccharomyces bayanus yeast (AWRI 1176) ferments showed decreases in concentration of 2-methyl butanoic acid, isovaleric acid and hexanoic acid with increasing DAP addition (Ugliano et al. 2010). In contrast Saccharomyces cerevisiae var. cerevisiae D254 showed significant increases in the same compounds. The present study used EC118, a S. cerevisiae var. bayanus yeast and the trend of decreased concentration with increasing DAP addition was repeated. This is a complex picture as the patterns of all volatile compounds production are not necessarily homogenous within the Saccaromyces cerevisiae and bayanus species (Hernandez-Orte et al. 2006, Vilanova et al. 2007). However Vilanova et al (2007) suggested here may be nutrient levels where the strain effects are at their lowest. They found the highest similarities in fermentation-derived volatiles (not just fatty acids) produced by two S. cerevisiae yeasts were found at an initial nitrogen concentration of 250 mg/l YAN. This is lower than all on the YAN levels in the current trial. Overall, fatty acid concentrations tended to decrease with nitrogen addition with the only exception being decanoic acid which significantly increased. As expected this mirrored the trend shown for the respective ethyl fatty acid esters which the fatty acids are precursors for. The sensory impact of changes in fatty acid concentration will be discussed in later chapters. Effect of aging on Fatty Acid Concentrations Artificial aging of the wines had significant effects on only two of the fatty acids, decrease in concentration of butanoic acid (p<0.05) and increase in decanoic acid (p<0.001). As previously discussed the MCFA are converted over time to their corresponding ethyl esters with a rate that is impacted by yeast strain choice. In this trial the aging treatments had a significant effect on more MCFA esters than the fatty acids themselves. Many of the fatty acid concentration results showed downward trends but only the results for butanoic acid were significant. Though wine aging is well researched there is little literature on the impact of bottle age on fatty acid concentration. 68
79 The (CVA) results showed that the greatest between-group related to decanoic acid and the aging treatment. The graph shows a clear vertical split along the CV2 axis between the control and aged treatments. However the CV2 explains only 6% of total variance is of limited significance Impact of DAP Addition and Artificial Aging on Concentrations of Sulphides Table 4.9 defines the parameters of the AWRI GC-SCD sulphide analysis method used (Siebert et al. 2010). It shows the limit of quantitation to the nearest μg/l for all analytes. In this instance, trace concentrations were defined as those between the limit of detection (lowest value that can be positively identified as present by instrumentation) and the limit of quantification (lowest concentration at which a result can be confidently cited in the matrix) (AWRI 2009). Of the complement of sulphide compounds analysed (i.e. carbon disulphide, diethyl disulphide, diethyl sulphide, dimethyl disulphide, dimethyl sulphide, ethanethiol, ethyl thioacetate, hydrogen sulphide, methanethiol and methyl thioacetate) only three, dimethyl sulphide (DMS), carbon sulphide and methanethiol were detected at concentrations above those defined as trace (Table 4.10). As this is AWRI analysis method has been used for similar trials (Ugliano et al. 2009, Ugliano et al. 2008) it has been assumed that the degree of sensitivity was sufficient for this study. A more recent study (He et al. 2013a) that have looked at sulphide levels in finished aged Chardonnay and Pinot noir wines (measured at 6, 12, 18, 24 and 36 months post bottling) showed above trace levels (ųg/l) of methyl thioacetate, ethyl thioactate, methanthiol as well as dimethyl disulphide. Interestingly hydrogen sulphide levels were not detectable until after the wine had been bottled for 18 months and then concentrations were detected at 18, 24 and 36 months. DAP supplementation significantly decreased the concentration of dimethyl sulphide (p<0.05). The artificial aging treatment significantly increased methanethiol (p<0.05) and dimethyl sulphide (p<0.001) concentrations in the wines. 69
80 Table 4.9 Determination of low molecular weight sulphur compounds using GC-SCD sulphide analysis (AWRI 2009). 1 detection limit is the lowest value that can be positively identified as present by the instrumentation 2 quantification limit is the lowest level at which a result can be confidently cited in matrix As much of the sulphide chemical analysis results registered as trace only, the statistical analysis was restricted to methanthiol, carbon disulphide and dimethyl sulphide. Canonical variate analysis (CVA) results showed that 96.9% of the between-group variation was in the direction of the first canonical variate. Figure 4.3 illustrates the CVA relationship of the treatment means and their separation in relation to the two canonical variate vectors. The naturally-aged wines are grouped tightly on the right side of CV1 and the artificially aged in a slightly less compact group on the left. The correlations presented in Table 4.10 show the impact of dimethyl sulphide dominates the horizontal and most important variant CV1 whereas the CV2 variate weights methanthiol and carbon sulphide equally (all with negative loadings). The change in concentration of dimethyl sulphide due to artificial aging seems to be the major cause of variation between the wines. 70
81 Table 4.10 Pinot noir Sulphide concentrations (µg/l) for three treatments of DAP addition and two levels of aging Treatments - All other sulphide compounds registered as trace. DAP additions a Aging b Methanethiol Dimethyl sulphide Carbon sulphide C N T 1 N T 2 N Control A T 1 A T 2 A DAP add ns ** ns Aging ** *** ns DAP add x Aging ns ns ns Significance levels are: ns is P > 0.05; ** is P < 0.05; *** is P < a C, Control, 457mg/L YAN; T1, same juice as control but initial YAN increased by 150mg/L; T2, same juice as control but initial YAN increased by 250mg/L b N, the wine aged naturally for 10 months; A, the wine was aged artificially for 6 weeks at 30 ⁰C post bottling then aged naturally for 10 months. 71
82 DAP Treatments are: C (Control, 457mg/L YAN) T1 (YAN increased by 150mg/L) T2 (YAN increased by 250mg/L) Aging Treatments are: N (Natural - 10 months at 8 C) A (Artificial 6 weeks at 30 C, then naturally for 10 months) Figure 4.3 Canonical variate analysis representation of the mean separation for the sulphide data. Table 4.11 Canonical variate correlations between the latent root vectors and the sulphide compounds. Sulphide compound Vector 1 Vector 2 Methanthiol Carbon disulphide Dimethyl sulphide
83 Effect of DAP addition on Sulphide Concentrations Supplementation of must with inorganic nitrogen (as DAP) has been shown to decrease the risks of problem ferments and also affect the formation of volatile sulphur compounds (Bell and Henschke 2005, Jiranek et al. 1995a). Data from the present study showed only dimethyl sulphide was significantly affected by DAP supplementation (p < 0.005). Dimethyl sulphide (DMS) decreased across the DAP treatments while methanethiol (MetSH) and carbon disulphide (CS 2) concentrations were not significantly affected. These results are similar to those of Ugliano et al (2008) who found that concentrations of the low molecular-weight sulphur compounds H 2S, DMS and CS 2 detected in the finished wines were not affected by nitrogen addition. Conversely in later similar trials (Ugliano et al. 2009, Ugliano et al. 2010) found nitrogen supplementation (up to a maximum of 400 mg/l) induced an increase in concentration of all seven sulphide compounds measured including DMS. The chemical pathways for the production of these sulphur compounds are not well understood. Ugliano et al (2008) suggested that sulphides and disulphides can be formed by yeast as a result of the catabolism of the sulphur amino acids cysteine and methionine or by the sulphur amino acid biosynthetic pathways. Both hypotheses would explain the effect of nitrogen additions and are in line with previous findings by Spinnler (2001) and Landaud (2008). The increase in methanethiol was explained by the previous findings that sulphides and methanethiol are formed on an interrelated metabolic pathway and share methionine as common precursor (Perpète et al. 2006, Rauhut 1993b). The much higher levels of nitrogen in the present study may be the reason for the different responses. The decrease in DMS (as DAP addition is increased) in this study could be because DMS production reached an upper limit and then declined. All of the DMS concentrations detected were well above the range µg/l previously found in commercial Pinot noir wines (Fang and Qian 2005). The perception threshold of DMS is in the range of µg/l (Ferreira 2010) and greatly dependent on the wine type. The concentrations found in this study ( µg/l) may well be above the perception threshold. The mechanism for the formation of DMS during fermentation is not fully understood but it is thought that DMS formation by the yeast during fermentation is linked to amino acid (probably cysteine, cysteine and methionine) or glutathione metabolism (Goniak and Noble 1987, Rauhut 1993a). Yeast production from S-methylmethionine or dimethyl sulfoxide (Segurel et al. 2005) has also been suggested. 73
84 The lack of detection or significant results for hydrogen sulphide (H 2S) in this trial was expected. As previously discussed a recent study by He (2013a) on impacts of aging on aroma compounds in Chardonnay and Pinot noir did not detect H 2S until 18 months of aging in bottle. Also the experimental wines in this study were made from clean, disease-free fruit with attention to detail during the winemaking process. A commonly adopted strategy by winemakers to avoid the formation of hydrogen sulphide during fermentation has been to provide adequate yeast assimiliable nitrogen to ensure sufficient supply of amino acid precursors (Bell and Henschke 2005). However recent studies (Mendes-Ferreira et al. 2002, 2009, Ugliano et al. 2008, 2010) suggest that addition of YAN may not reduce H 2S formation and can in some cases exacerbate the issue. These researchers also suggest the effect of YAN supplementation can vary depending on the yeast strain suggesting interaction between the genetic background of the yeast, the level of YAN and regulation of H 2S production. Ugliano (2008) found that addition of DAP (to YAN 250 and 400 mg/l) for a S. var. cerevisiae yeast resulted in an increase in H 2S production while a S. bayanus strain showed the opposite effect. A later trial by Ugliano (2011) using only S. cerevisiae strains found that moderate YAN supplementation (e.g. to 250 mg/l) gave significantly higher residual H 2S compared to wine from high nitrogen ferments. Therefore the combination of two factors i.e. that the yeast used (EC1118) is a S. cerevisiae var. bayanus yeast and that all the fermentations could be classified as high nitrogen ferments, could explain why concentrations found for hydrogen sulphide were not significant in this study. Effect of aging on Sulphide Concentrations The CVA results (Figure 4.3) showed a clear separation between naturally-aged and artificially aged treatments on CV1 which was significantly correlated with dimethyl sulphide concentration. DMS concentrations showed a significant increase with aging (p < 0.001) in this study. Increase in DMS concentration with wine aging has been reported in numerous studies (Fedrizzi et al. 2007, Marais 1979, Segurel et al. 2004). It is thought that DMS can be formed from non-volatile precursors like dimethyl sulfoxide (DMSO), methionine sulfoxide (MSO), dimethylsulfonium propanic acid (DMSPA), cysteine (De Mora et al. 1993) and S-methylmethionine (SMM) (Segurel et al. 2005). Methanethiol can be oxidised (in air and temperatures above 20 C) to dimethyl sulphide but this is unlikely in this study (Rauhut 1993a). The most likely chemical pathways that have been suggested for formation of DMS during aging are dimethyl sulfoxide reduction (De Mora et al. 1993) or S- methylmethionine degradation (Segurel et al. 2005). Ugliano et al (2008) suggested that the higher DMS post aging may be linked to higher residual YAN of the supplemented treatments. The results of this trial agree with those observations. In the 74
85 Ugliano et al (2008) trial the highest YAN treatment of 400 mg/l showed a 559% increase in concentrations of DMS between the young and aged wines. The maximum increase in DMS with aging in this study was 200% for the highest level of YAN 725 mg/l. Increases in DMS with aging have also been linked to positive aging characteristics (De Mora et al. 1986a, Loubser and Du Plessis 1976, Marais 1979). Methanethiol concentrations also showed a significant increase with aging in this study (p < 0.005). Previous studies have found concentrations of methanethiol in the range µg/l in commercial Pinot noir (Fang and Qian 2005). Like many volatile sulphide compounds the aroma detection threshold for methanethiol is matrix dependent. A recent aroma detection threshold study determined methanthiol thresholds of 1.8 μg/l in white and 3.1 μg/l red wines (Solomon et al. 2010). All of the treatments showed concentrations above this in the range of µg/l, also well above the perception threshold of 0.3 µg/l (Escudero et al. 2007). The CVA results showed methanethiol was also correlated with CV1, although not as strongly as DMS. It has been suggested that during aging methanethiol can originate from the hydrolysis of methylthioacetate which is a yeast-derived ester (Leppanen et al. 1980). Another source is the reduction of the corresponding disulphides in low oxygen conditions (as in a closed bottle) (Belancic Majcenovic et al. 2002). The occurrence of reactive species such as quinones can also affect the mercaptan concentration in wine (Belancic Majcenovic et al. 2002). 75
86 Chapter 5 Sensory Analysis 5.1 Introduction As a beverage to be savoured and enjoyed, how a wine tastes and smells is of prime importance to the producer and the final consumer. Without sensory analysis of the wine as a whole (even if there is precise information about the volatile composition above the wine) it is impossible to predict the flavour and aroma that will be perceived. Therefore it was important to run credible sensory trials to gather information about the similarities and differences between the wines and to generate descriptors to aid that differentiation. The aim was to then compare the sensory results to the chemical data for the treatments. Sensory evaluation trials were run at the Marlborough Research Centre sensory facility in August The aim was to determine if the participants could perceive any sensory differences between the wine treatments. Marlborough wine industry professionals including winemakers, consultants and wine laboratory staff were recruited. No specific training was provided for the participants prior to their participation in this study as all had extensive experience of winemaking and New Zealand Pinot noir. The evaluations were held over two sessions and wine from both treatments were presented within the same flights. Each session had both an analytical rating task (encouraging participants to focus on a specific properties of the wine) and a global evaluation task that required the participant to employ an overall or holistic evaluation while assessing the wine. 5.2 Materials and Methods Participants The panel for the sensory evaluations was made up of 19 Marlborough wine industry professionals who were selected on the basis of extensive experience with the production or analysis of Pinot noir wine. The 11 male and 8 female participants had a mean age of 38.1 years (range = 28-55). The mean number of years of experience in the wine industry was 13.4 (range = 5-28). None of the participants were smokers. Seventeen of the 19 participants listed their major occupation as winemaker, and 5 participants had formal wine-judging experience. No specific training was provided for the participants prior to their participation in this study as all had domain-specific expertise in the form of extensive experience of winemaking and New Zealand Pinot noir. 76
87 5.2.2 Experimental wines Wines used in the sensory experiment were a subset of the research wines previously described. The wine making protocol for the 2009 vintage microvinifications is described in Chapter 3. The sample set for the sensory study was reduced to 12 wines from the total 18 to avoid participant fatigue. Two sample bottles were chosen at random from each combination of treatments; that is, two wines from the three replicates of each combination of the independent variables (2 levels of aging: naturally aged and artificially aged; three levels of DAP treatment: Control C Juice YAN = 457ppm, T1 Juice YAN + 150ppm DAP, T2 Juice YAN + 250ppm DAP) were included. The alcohol concentrations of the 12 wines used in the sensory experiment ranged between 14.5 and 14.8 %. All wines were sealed with screw-cap closures. The wines had been stored in a climate controlled cellar (approx. 8 C) prior to the tasting and transported to Marlborough from Canterbury under controlled conditions (e.g., ambient temperature < 12 0 C). A new bottle of wine was used for each session. Twelve hours before the experimental trials commenced the wines were allowed to warm to 15 C. 5.3 Sensory Procedures The study was conducted at the Marlborough Wine Research Centre sensory facilities over two onehour sessions separated by 48 hours. The environment of the purpose-built sensory facility was controlled according to the standards of International Wine Competitions (O.I.V. 1994) to provide minimum distraction to the participants. This included light coloured walls and furniture, natural lighting, and minimal external odours or noise. Throughout the experiment, the ambient room temperature was kept at 22 C ± 1. Three to seven wine professionals were scheduled to participate at any one time. In keeping with ethical standards consented by Lincoln University Ethics Committee, prior to participation each person was provided with information about the study and given the opportunity to ask questions. Once ready the participants completed and signed an informed consent form. Participants were then seated at one of the 5 booths or 2 tasting tables provided. Figure 5.1 below shows the setting layout per booth/table consisting of from left - a palate conditioner glass (often called a warm-up wine), 12 wines (each labelled with a three digit code) in opaque glasses topped with cover slips (removed once the participant began tasting), a spittoon and a water glass (off camera). The data from the palate conditioning wine were not recorded. 77

88
89 Descriptive task: Participant-generated wine description The participants were asked to evaluate the aroma and taste of each wine sample in the order presented and generate a maximum of six descriptors to describe the salient sensory features of each wine. The purpose of this task was to gather data concerning the most pronounced characteristics of the wines in the sample set. The descriptors produced during this procedure were later collated and the terms ranked in terms of their citation frequency to identify the most relevant descriptors to employ in Session 2 of the study. That is, these data were used to generate experimenter-provided descriptors for the Session 2 descriptive rating task. Free sorting task The free sorting task required participants to evaluate the aroma and taste of the wines and to categorise the wines in the sample set into meaningful groups. This task has a well-established precedent in the sensory science published literature (e.g., Parr et al (2007)). Participants were asked to organise the wines into groups on the basis of any criteria that made sense to them such as basing their classification on perceived similarities and/or differences amongst the wines. They were advised that there were no right or wrong answers and the classifications they produced were entirely up to them. They could choose as many or as few categories as seemed appropriate to them. Participants were also asked to provide the criteria upon which they had based their classification. This was done by a participant drawing a box on their data sheet for each category they defined, inserting the code numbers of the wines into the relevant box, and providing two or three descriptors that were salient in their decision to allocate the wines into that respective category. No clues or direction was given to influence the participants response to the wines Session 2 Session 2 involved participants completing two further tasks with the same 12 wines as used in Session 1. As previously mentioned, all wines in both tasks were evaluated by full tasting, i.e., both by olfaction and gustation. Participants first undertook an analytical, descriptive evaluation task that comprised rating the wines in relation to selected descriptors. The specific descriptors employed had been determined on the basis of the frequencies of the participant-generated wine descriptors produced in Session 1 (see Table 5.1) but also by considering (i) sensory descriptors found in previous Pinot noir sensory studies (e.g., (Aubry et al. 1999, Fang 2005, Kilmartin and Nicolau 2007) and (ii) the specific hypotheses to-be-tested in the present experiment. Table 5.2 shows that the experimenter-provided descriptors used in Session 2 included flavours, aromas and mouth-feel 79
90 characteristics (trigeminal nerve stimulation). After a short break, participants then repeated the non-directed sorting task as per Session 1. Descriptive evaluation rating task In the first task the participants were asked to rate each wine in terms of 16 wine attributes. The intensity of each descriptor was rated via a 100mm, horizontal visual analogue scale (VAS: see Parr et al.(2007) for a full description). The first ten descriptors being flavour characteristics were rated between absent and extreme. Five descriptors (e.g., palate weight) were judged between poor and very good and the final descriptor (wine maturity) was rated between young and evolved (see Table 5.2 for the scales of attributes rated). Free sorting task The second task was a repetition of the categorisation activity undertaken in Session 1 and required participants to review the wines and to categorise them into meaningful groups, differentiate them on the data sheet by drawing a box around each group formed and provide two or three descriptors to summarise the category. As in session 1, no clues or direction was given to influence the participants response to the wines. 5.4 Sensory Data Analysis Descriptive rating task: Participant-generated descriptors The initial sensory exercise in Session 1 required each taster to provide up to six descriptors to each wine. A total of 152 different terms were produced in total by the 19 participants. The raw data were then reduced by two researchers using the following methods which have precedent in the literature (Parr et al. 2011). The first step was to search for synonyms by categorising the generated terms into groups of identical or very similar meaning and with the same root (e.g., oak and oaky ). The two researchers had to agree on the classification of descriptors as synonyms. This resulted in 77 descriptor groups being formed. The second step involved a frequency count. This was done to ascertain the most commonly-used terms to discriminate among the wines. Table 5.1 shows the thirty most frequently-reported descriptor groups generated by this activity. Based on the frequency table, the experimenters determined the most appropriate descriptors to employ in the Session 2, descriptor-rating task. The sixteen selected descriptors were chosen on both a quantitative basis (i.e., the most frequently-produced descriptors), but also selected on a qualitative basis as descriptors 80
91 that most effectively discriminated or separated the wines. The generated descriptors were also compared for validity with those used in the literature for Pinot noir sensory testing (e.g. (Aubry et al. 1999, Fang 2005, Kilmartin and Nicolau 2007). Finally, the specific hypotheses being tested in the study were taken in to account when determining appropriate descriptors to employ. The sixteen descriptors generated by this process are shown in Table
92 Table 5.1. Descriptive rating task Session 1 results. Citation frequency of the 30 most frequently reported descriptor groups generated by Session 1 Descriptive Rating task Wines Descriptor Overall Frequency 1 dark plum/cherry oak/toasty red fruit/light red fruit/rhubarb/tamarillo thin/short/light/dilute/lean good palate weight/midpalate dark berry fruit spice/cloves/nutmeg/mixed smooth/soft tannin/supple/creamy/mellow/velvety fruity/fresh/lifted/vibrant good length/finish phenolic/chewy tannins/obvious/green/harsh/0ak obvious high alcohol astringent muted/lacks expression/non varietal/oak dominates
93 Descriptor Overall Frequency 15 chocolate/dark ripe/plump/rich concentrated/juicy good structure/integrated acid obvious/fresh acid/ tight Acid/sharp/tart good balance oak spice rubber/gloves/reduced/tarry/sulphide/smoky savoury vanilla/ vanillin complex/savoury jammy/stewed fruit/dried fruits/fruit cake green simple violet flower berries/wild
94 Table 5.2 Descriptors employed in Session 2 Descriptive Rating task. Descriptor Rating scales Wine attribute Floral/Fruit Bouquet (nose only) Absent - Extreme Orthonasal olfaction (bouquet) Fresh Dark Fruits Absent - Extreme Aroma and palate Fresh Red Fruits Absent - Extreme Aroma and palate Oak Absent - Extreme Aroma and palate Spice/Spicy Absent - Extreme Aroma and palate Jammy/Over-ripe/Stewed Fruit Absent - Extreme Aroma and palate Reduced character/ Sulphides Absent - Extreme Aroma and palate Bitterness Absent - Extreme Aroma and palate Astringency Absent - Extreme Palate Heat (Alcohol sensation) Absent - Extreme Palate Palate weight Poor Very Good Palate Acid/flavour balance Poor Very Good Aroma and Palate Phenolic Structure Poor Very Good Palate Varietal Expression Poor Very Good Aroma and Palate Perceived Complexity Poor Very Good Aroma and Palate Wine Maturity Young - Evolved Aroma and Palate Data Analysis: Non-directed Sorting The non- directed sorting task was replicated with the tasters completing this classification task at both of the two tasting sessions. Data sets from both the sorting tasks (Tables 5.3 and 5.4) were converted into similarity matrices by summing over all participants the number of times each pair of wines was sorted into the same group. This produced two matrices, one for each session (Tables 5.5 and 5.6). Data sets were missing for two subjects (111 and 116) for the Session 2 matrix as they were unable to attend that day of the experiment. 84
95 The data from the similarity matrices was analysed with multidimensional scaling (MDS) implemented by the PROXSCAL procedure in Statistical Package for the Social Sciences (SPSS) 21 software. The aim of using MDS was to uncover potential underlying dimensions based on the series of similarity or distance judgments by the subjects (Garson 2012). A simple Euclidian model was applied to the ordinal data and this generated a simulated 2D object. The matrices were submitted to a Wards Method hierarchical cluster analysis (HCA) to identify clusters of related wines which were then drawn as groups on the MDS space. The map provides a spatial representation of the relationship between the wines, with the relative proximity of any two wines being an approximation of their perceived similarity. Similarity between the three solutions, one for each session and one from the pooled sessions, was tested with the RV coefficient (Robert and Escoufier 1976) which is a multivariate generalisation of the correlation coefficient. The coefficient was computed using the formula in Abdi (2007). The RV coefficient ranges between 0 and 1 and the closer the values are to 1 the better the map corresponds to the actual proximity data. An RV value of 0.68 has been considered good correspondence (Tang and Heymann 2002). How well a MDS model fits the original data can also be judged by the stress value, an index of "badness of fit". The lower the stress and the higher the RV value, the better the fit. Usually the RV coefficient is a better indicator of the appropriate dimensionality as it is a direct measure of the proportion of variance accounted for by the MDS model (Schiffman ) Data Analysis: Descriptive Rating Task The participants intensity ratings scores were calculated using VAS scales (i.e. the 10 cm scales measured to nearest 0.5 mm). For each experimenter-provided, flavour descriptor were quantified in terms of a number between zero and 100. Ratings to other descriptors (e.g., wine balance) were similarly quantified (Appendix 1.). Separate univariate analyses of variance (ANOVAs) were conducted on each descriptor s ratings with DAP addition and Aging as independent treatment variables to determine significant effects. ANOVA analysis was conducted using SPSS 21 software. Those descriptors showing significant effects were subsequently included in a Principal Components Analysis (PCA). PCA was performed on means for each descriptor averaged across participants. PCA was performed with R using software RStudio using principal within the psych package with varimax rotation. Principal Components Analysis is used to convert the set of observations of possibly correlated variables into a set of values of linearly uncorrelated variables called principal components. In this case the purpose of PCA is to describe the similarities between the individual wines and to determine which flavours and descriptors happen simultaneously. 85
96 5.5 Sensory Results and Discussion Sorting Task Results In the sorting tasks for both sessions all the participants divided the wines into different labelled categories. These ranged in number from two to five categories with an average of 3.7 in session 1 and 3.2 in session 2. As well as grouping the wines, the participants were also asked to provide 2-3 descriptors to indicate what makes these wines fit the category. These delineations varied from simple like and dislike to descriptors of different types of fruit and perceptions of tannins. The raw data results for the categories and descriptors generated by each participant are shown in Table 5.3 for Session 1 and Table 5.4 for Session 2. As stated previously the data sets from both the sorting tasks were converted into similarity matrices by summing over all participants the number of times each pair of wines was sorted into the same group. This produced two matrices, one for each session (Tables 5.5 and 5.6) which were analysed for similarities using multidimensional scaling Qualitative Data: Participant-generated Descriptors The labels used by the participants to explain the grouping classifications showed a large range of descriptors and opinions about the wines. In session 1 four of the nineteen participants made reference to wine age, using terms like older aged wines, older, young wine, developed, evolved and more aged /developed. This increased to half the participants in Session 2. There was however varied success (40%) at linking the terms with the appropriate age treatment. The majority of the participants focused on specific intrinsic qualities of the wines (Charters and Pettigrew 2007), with one participant concentrating on pleasure with two categories labelled like and dislike. Another grouped the wines by age ability and one participant by degrees of mouth-feel astringency. Descriptors relating to fruit were the most common with over 80% of the participants over both sessions making reference to fruit characters. Examples being Red fruit, dark fruit light spicy fruit, black cherry plum, stewed fruit as well as descriptors that express lack of fruit like savoury, gamey, earthy. 86

97 Table 5.3 Free Sorting Task Session 1 Category Descriptors 87
98 Table 5.4 Free Sorting Task Session 2 Category Descriptors 88
 C - Juice YAN = 457ppm, Control T1 - Juice YAN +")

99 Table 5.5 Free Sorting Task - Wine similarity matrices Session 1. N - Natural aging A - Accelerated Aging ( artificially 6 weeks at 30 ⁰C) C - Juice YAN = 457ppm, Control T1 - Juice YAN + 150ppm DAP T2 - Juice YAN + 250ppm DAP F ferment number Table 5.6 Free Sorting Task - Wine similarity matrices Session 2. N - Natural aging A - Accelerated Aging ( artificially 6 weeks at 30 ⁰C) C - Juice YAN = 457ppm, Control T1 - Juice YAN + 150ppm DAP T2 - Juice YAN + 250ppm DAP F ferment number 89
100 5.5.3 Sorting Task: Multidimensional Scaling Results The multidimensional scaling analysis results for the sorting tasks are represented two dimensionally by Figures 5.2, 5.3 and 5.4. The MDS solutions provided optimal results for sorting tasks in both sessions with normalised raw stress values of and respectively. Figure 5.2 (Session 1) and Figure 5.3 (Session 2) plots show results from the MDS and HCA analysis for the two sorting tasks. The proximity and degree of grouping displays relative perceived similarities or differences between the wines. Sorting behaviour across sessions shows some similarities, but there were also some differences as the RV coefficient was 0.31 (1.0 being a perfect fit). Figure 5.2 (Session 1 data) shows that in general the naturally-aged wines clustered toward the left and lower portion of the plot. There is a less clear pattern for the artificially-aged wines although they tend to be grouped toward the right hand side of the plot, separated from the naturally-aged wines along the X axis. Of the three clusters identified by HCA iterations, the left-hand group shows the clearest delineation by treatment and replicate. All of the naturally-aged control and treatment 1 wines are grouped together plus one of the artificially-aged control replicates. This suggests participants detected a sensory change from artificial aging of the wines. The effect of added nutrition is less clear; although the aged treatment wines are grouped loosely to the right of the plot there is little evidence of an influence of nutrition addition. Sorting Dimension Aged A Artificially aged N Naturally-aged Treatment c Treatment 1 control +150mg/L Treatment 2 control +250mg/L Control 457mg/L YAN Dimension 1 Figure 5.2 MDS and HCA analysis for non-directed sorting task Session 1 90
101 Figure 5.3 shows the data from the second session. This provides a clearer diagonal division of the aging variable on the first dimension, with naturally-aged positioned lower left and artificially-aged in the upper right quadrant. Likewise, the HCA groupings are into two clusters, one containing all the naturally aged wines plus one artificially aged T1 replicate and the other containing all the remaining simulated-aged wines. Within-subject variability may be a factor in the differences demonstrated between Session 1 and Session 2. Conceivably, at least some participants may have been more confident in Session 2, and/or had benefitted from a learning experience between Session 1 sorting and that of Session 2. That is, possibly the participants became more familiar with both the wines and the tasks by the final sorting task thus improving their performance. This is mirrored in the labels given to the groupings in Session 2, with more than half the participants using age related descriptors as categories. Sorting Dimension Aged A Artificially aged N Naturally-aged Treatment c Treatment 1 control +150mg/L Treatment 2 control +250mg/L Control 457mg/L YAN Dimension 1 Figure 5.3 MDS and HCA analysis for non-directed sorting task Session 2 Figure 5.4 shows the pooled data. The pooled data demonstrate a more effective grouping of the wines by the participants. The pooled data produced a solution with the lowest stress value (0.020) meaning this model corresponded best to the original data. Figure 5.3 shows clear separation of the data by the aging variable with the exception again of one of the artificially aged treatment 1 samples. The separation appears to be in terms of both Component 1 and Component 2. 91
102 Combined sorting 1.0 Dimension Aged A Artificially aged N Naturally-aged Treatment c Treatment 1 control +150mg/L Treatment 2 control +250mg/L Control 457mg/L YAN Dimension 1 Figure 5.4 MDS and HCA analysis for pooled Session 1 and 2 Non-directed sorting tasks Changes in DAP addition did not affect the sensory perception of the wines. Neither session indicates any sensory effect from the change in nitrogen addition. RV values were computed to compare performance in each individual session with that of data for two sessions combined. The RV value for session 2 sorting s comparison was 0.75 compared to 0.51 for session 1. As mentioned above, it is conceivable that discrimination between the wines and perception of any sensory differences as a function of the experimental manipulations improved from Session 1 to Session 2. Another factor influencing the results could be human variability of performance due to personal factors like perception thresholds to various wine components. In summary, the MSD results from both free sorting tasks and the choice of descriptors used to represent the groups show the participants could differentiate that the wines had differences that were somehow related to age. Any sensory effects from variations in DAP addition were not able to be perceived either because the variation was to subtle or overwhelmed by the more obvious differences caused by the artificial aging. 92
103 5.5.4 Descriptor Rating Task Results. The descriptor rating task in session two, using the descriptors generated from session one, did yield significant results but again more related to artificial aging than DAP addition. Tables 5.7 (DAP addition treatment) and 5.8 (Aging treatment) show the outcomes from the individual one-way ANOVAs performed on each rated attribute. These results demonstrate how the wines from each set of treatments were perceived, on average, in terms of the intensity of the sensory characteristics provided to the participants for rating. There were no significant results for the nutrient addition treatments (Table 5.7); participants apparently could not perceive any noticeable variation in the wines as a function of nutrient addition, at least not in terms of the levels applied in this particular experiment. This mirrors the sorting task results from sessions one and two, with no perceived sensory effect from the change in nitrogen addition. The data presented in Table 5.8 show seven significant results due to the aging treatment. The participants used wine age-related descriptors like wine maturity, reduced character/ sulphides (p<0.001) and jammy/ over-ripe/ stewed fruit (p<0.05) significantly more for the artificially aged wines. Less expected was that the artificially aged wines rated highly for the spice/spicy, perceived complexity and palate weight (p<0.05) characteristics. Conversely the naturally-aged wines were significantly distinctive in terms of floral/ fruit bouquet (p<0.05). The descriptor rating task results are in line with those from the non directed sorting tasks. In fact the participants seemed to be more successful in differentiating between the age treatments in the descriptor task when required them to rate the wines for specific traits.the provided descriptors possibly acts as hints and encouraged the participants to be more firm in their decisions about the wines traits. 93
104 Table 5.7 Descriptor Rating Task ANOVA Results DAP Treatment Mean attribute rating for each sensory character as a function of DAP b treatment Control (C) Treatment One (T1) Treatment Two (T2) Mean Standard Deviation Mean Standard Deviation Mean Standard Deviation F(2,182) MSE Floral/ Fruit Bouquet (nose only) Fresh Dark Fruits Fresh Red Fruits Oak Spice/ Spicy Jammy/ Over-ripe/ Stewed Fruit Reduced character/ Sulphides Bitterness Astringency Heat (Alcohol sensation) Acid/ flavour balance Palate Weight Phenolic Structure Varietal Expression Perceived Complexity Wine Maturity Significance levels are: *p< 0.05 **p< 0.01 ***p< b C, Control, 457mg/L YAN; T1, same juice as control but initial YAN increased by 150mg/L; T2, same juice as control but initial YAN increased by 250mg/L 94
105 Table 5.8 Descriptor Rating Task ANOVA Results Mean attribute rating for each sensory character as a function of Aging a treatment Artificially Aged (A) Naturally Aged (N) Mean Standard Deviation Mean Standard Deviation F (1, 182) MSE Floral/ Fruit Bouquet (nose only) * 298 Fresh Dark Fruits Fresh Red Fruits Oak Spice/ Spicy * 277 Jammy/ Over-ripe/ Stewed Fruit * 403 Reduced character/ Sulphides ** 256 Bitterness Astringency Heat (Alcohol sensation) Acid/ flavour balance Palate Weight * 323 Phenolic Structure Varietal Expression Perceived Complexity * 447 Wine Maturity ** 409 Significance levels are: *p< 0.05 **p< 0.01 ***p< b C, Control, 457mg/L YAN; T1, same juice as control but initial YAN increased by 150mg/L; T2, same juice as control but initial YAN increased by 250mg/L 95 95
106 5.5.5 Descriptor Rating Task: Principal Components Analysis Results. Principle component analysis (PCA) was used to visually present the similarities between the individual wines and to display which flavours and descriptors happened simultaneously. Only the descriptors that had shown significant effects in the ANOVAs for the attribute-rating data were included in the analysis (Fischer et al. 1999). Figure 5.4 shows the two-dimensional spatial spread of the descriptors in relation to the wine treatments. This PCA solution explains only 72% of the variance but considering a third dimension did not add anything coherent to the outcome (Green, 2013 pers com). Principle component 1 accounts for the majority of the variance (42%) and the spread across this axis seems to be explained by the extremes of fresh characters (floral fruity and red fruits) opposing more over-ripe or mature wine characteristics (e.g. jammy, mature, reduced). The vertical axis principle component 2 explains a further 30% of the variation and this seems related to palate weight and complexity. An additional intermediate loading of mature/reduced/spice can be seen between the two components. As the PCA analysis only included descriptors that were significant in the ANOVA data analysis and those all related to aging, Figure 5.4 shows a somewhat exaggerated picture of the participants response to the wines. The aging treatments are very clearly differentiated and the DAP treatments follow no clear pattern Component 2 (30%) A T2 2 Palate Perc. complexity Weight A C 2 Maturity A C 3 N T2 2 Reduced Spice Red fruit A T1 2 Jam N T2 C 23 N T1 2 N T1 3 Floral A T1 3 Fruit A T2 3 N C Component 1 (42%) Figure 5.5 Descriptor rating task PCA Session 2. PCA of the variables that had significant age effects in the ANOVA. 96
107 The overlay of the treatment wines in Figure 5.4 shows; the artificially-aged wines tending to fall in the right quadrant (with the exception of one control replicate) with naturally-aged wines positioned lower left. The naturally aged wines are clearly separated from the aged wines. The naturally aged wines were perceived by participants as more fresh red fruit and floral / fruity on the nose and less likely to be perceived as jammy. In contrast the artificially aged wines were influenced by both components 1 and 2. Some of the artificially-aged wines were seen as weightier on the palate, more complex, spicy, reduced and mature but the results were not consistent for all replicates. As seen in the sorting task results, there is no indication of any sensory effect from the change in nitrogen addition. The DAP treatment wines do not fall into any organised pattern, again suggesting changes in DAP addition did not affect the sensory perception of the wines. In summary, all the sensory tasks in both sessions showed the participants could successfully differentiate the wines that had been artificially aged and those that had not. When provided with generated descriptors (that seemed to act as clues) the participants were more successful at identifying the age treated wines that when not directed (as in the sorting tasks). Generally the artificially aged wines were described as more complex, weighty, mature and reduced. The naturally aged wines were described as fresh red fruit and floral / fruity on the nose and less likely to be perceived as jammy. The participants were not able to perceive any sensory differences between the DAP treatments in either the non-directed sorting tasks or the descriptor rating task. The possible explanations for this are that because the Aged treatments and DAP treatments were included in the same wine flights; the sensory differences between the DAP treatments were drowned out by more obvious differences related to ageing or that the DAP related sensory differences were too subtle for recognition no matter what the experimental set-up. 97
108 Chapter 6 Relationship between Sensory and Volatile Aroma 6.1 Introduction Relating the chemical data to the sensory results was necessary to provide a clearer picture of which compounds were influencing the perceived sensory differences between the wines. As the aging treatments had been recognised as the major cause of sensory variance, relating chemical to sensory data highlighted which compounds were most associated with both the aged and fresh characteristics in the wines. All of the statistical analysis for the sensory results and relating the chemical data to the sensory was done using specialist software and with expertise kindly provided by Dr James Green, Otago University. 6.2 Data Analysis: Comparison Between Sensory and Volatile Aroma Compounds The sensory descriptive rating data was associated with the chemical data from the 12 wines that had been used for both the sensory and chemical analysis. To do this partial least squares regression (PLSR) was carried out using the Python plug-in (additional application) for the software SPSS 21. PLSR is a method used to construct predictive models when the factors are many and highly collinear. The emphasis is on predicting the responses and not necessarily on trying to understand the underlying relationship between the variables (Tobias 1997). In this instance PLSR predicts a reduced combination of sensory descriptors (Y) with a reduced combination of chemical concentrations (X) (Green, 2013 pers com). That is, the PLSR analysis attempts to summarise two sets of data into as few factors or components as possible, taking an additional constraint into account, namely that the summarised chemical data (X factor) should also be optimised in their ability to predict the sensory data (Y factor). 6.3 Results: Relationship between Sensory and Volatile Aroma Compounds Partial least square regression (PLSR) was conducted on the sensory (ratings to descriptors) and chemical data (concentrations), the aim being to determine whether the perceived sensory differences were related to particular chemicals or groups of compounds. The outcome from the PLSR analysis is shown over three plots for ease of understanding. Figure 6.1 shows the PLSR X weights for the chemical concentrations only and shows that the first two PLSR components explained 67% of the total X-variance (chemical). Figure 6.2 shows the chemical and sensory spaces 98
109 overlaid, with 47% of the total Y (sensory) variance explained and 67% of the X (chemistry) variance explained. Figure 6.3 completes the picture, showing the naturally and artificially aged wines projected on to the shared space. As with the sensory PCA results, there is a clear delineation across the horizontal axis with red fruit and floral fruit bouquet on the left of the plot and jammy to the right. Spicy, palate weight and perceived complexity form the second latent factor. Latent Factor 2 (X-20% Y-12%) Acetic Ac. Butanoic Ac. Eth pentoate Eth hexanoate Hex Acetate Decanoic Ac. Ethy propanoate Eth octanoate Eth isobutyrate Eth decanoate Eth 2M-butanoate Latent Factor 1 (X-47% Y-35%) Figure 6.1 Partial Least Squares Regression (PLSR) of the volatile compounds concentrations (X loading weights). 99
110 Latent Factor 2 (X-20% Y-12%) Acetic Ac. Butanoic Ac. Red Fruit Floral Fruit Eth pentanoate Eth hexanoate Hex Acetate Spicy Jammy Decanoic Ac. Palate Wgt Eth propanoate Perc. Complex. Reduced Eth isobutyrate Eth decanoate Eth 2M-butanoate Maturity Eth octanoate Latent Factor 1 (X-47% Y-35%) Figure 6.2 Partial Least Squares Regression (PLSR) of the volatile compounds concentrations to predict sensory characteristics (Loadings weights, for X (chemical) and Y (sensory)). Latent Factor 2 (X-20% Y-12%) Acetic Ac. Butanoic Ac. Red Fruit Floral Fruit Eth pentoate Eth hexanoate Hex Acetate Spicy Jammy Palate Wgt Ethy propanoate Perc. Complex. Reduced Maturity Eth octanoate Decanoic Ac. Eth isobutyrate Eth decanoate Eth 2M-butanoate Latent Factor 1 (X-47% Y-35%) Figure 6.3 Partial Least Squares Regression (PLSR) of the volatile compounds concentrations to predict sensory characteristics. The naturally (green) and artificially aged (red) wines are projected on to the shared space. 100
111 It is clear from Figure 6.3 that some chemical compounds and perceived sensory descriptors were associated within the two-dimensional space. Close proximity of a sensory characteristic with a certain chemical (or chemicals) suggest they may be related as cause and effect. It is possible to conclude that ethyl isobutyrate and ethyl decanoate may be associated with jammy characteristics, while ethyl octanoate and ethyl 2-methyl butanoate associate with maturity. Higher concentrations of butanoic acid plus low levels of ethyl isobutyrate and ethyl decanoate associate with red fruit characteristics. Floral fruit nose seems associated with ethyl pentanoate and lower levels of ethyl isobutyrate and ethyl decanoate. Three characteristics (reduced, perceived complexity and palate weight) appear to associate with levels of ethyl propanoate. The presence of decanoic acid associates with the perception of spicy characteristics. 6.4 Discussion: Interrelationship of Chemical and Sensory Results Sensory Implications of Chemical Data In theory predictions about changes to the sensory qualities of the wines are possible by considering the significant changes in the measured concentration of the chemicals within wine treatments and comparing to previous research. In the present study both treatments of varied nutrition and aging the wine showed significant impacts on the concentrations of individual compounds and classes of compounds. As a result of observed chemical difference between and within the treatments one might expect the sensory results would reflect perceived differences between the wines but this was not the case. The artificially aged wines were perceived as significantly different for the naturally aged. However the nitrogen treatments were not differentiated by the panel of wine industry professionals. Wine is a complex matrix and research has shown that the perceived aroma of a wine is different from the sum of its parts measured chemically (Ribereau-Gayon et al. 1975). In some varietals the aroma is dominated by a single impact compound (e.g. cis-rose oxide in Gewürztraminer (Guth 1997b)), in others it is groups of impact compounds with similar chemistry (e.g. thiols and methoxyprazines in Sauvignon blanc (Tominaga et al. 2000)). Typically the aromas of red wines are not dominated by impact compounds (with the possible exception of rotundone in Syrah) but are categorised by subtle mixtures working synergistically (Ferreira 2010). Red wines contain hundreds of different aroma compounds (Ferreira et al. 2007), many with concentrations above their perception thresholds but others below threshold levels that may still have an impact on the final aroma. Combinations of compounds can act together to different ends e.g. have a lower perception thresholds than the individual compounds (e.g. linalool and geraniol in Muscat wine (Ribereau-Gayon et al. 1975). They can act as enhancers to other compound groups e.g. the presence β-damascenone 101
112 has been shown to increase the fruity aroma of wine by lowering the observed threshold of two esters - ethyl cinnamate and ethyl caproate (Pineau et al. 2007). Conversely they can act as depressors to the perception of other compound groups e.g. Brettanomyces yeast product 4-ethyl phenol depressing fruitiness perception (Chatonnet et al. 1995). Overlaying this is the influence of the relative concentration of compounds present. Compounds like isoamyl acetate can be found at high concentrations in some wine and in that instance will act as an impact chemical adding a banana nuance. At lower concentrations it adds a fruity or sweet subtlety acting as a net contributor to a fruity note rather than an impact compound (Ferreira 2010). The perception of Pinot noir aroma is still not fully understood. It can be described as the result of subtle interplays between large numbers of compounds at concentrations both above and below perception thresholds. There have been limited studies that have investigated the influence of the specific aroma compounds found in Pinot noir on the sensory perception of the wine. Recent studies like Tomasino (2013) which considered regional differences of New Zealand Pinot noir, have started to map some of the important chemical interactions than influence final aroma and can assist in categorising wines into geographical areas and show the influence of winemaking techniques. The current results add to the literature concerning sensory characterisation of Pinot noir wines, specifically New Zealand wines. The compounds measured for this study were chosen because their concentration could potentially be influenced by DAP addition (Ugliano et al. 2008, Ugliano et al. 2010) and some may have an influence on Pinot noir varietal aroma (e.g. fatty acid ethyl esters). The following sections discuss the expected sensory results for the chemical data, compares those to the actual sensory results and relevant research, plus considers the variables involved with using a panel of wine professionals. The aim was to see if either of the treatments chemical data could be linked to any highlighted traits of the Pinot noir research wines Changes in Standard Chemical Parameters Increasing the nutrition levels across the treatments had two effects on the standard chemical compounds measured, it increased the titratable acidity and decreased the alcohol levels of the final wines. The ratio of acids and the ph of the wine have been shown to influence perception of astringency and sweetness (Martin 1970, Noordeloos and Nagel 1972). Increasing acidity suppresses perception of sweetness in wines (Gawel et al. 2007). Conversely increasing ph dampens the perception of astringency (Fontoin et al. 2008) as low ph wines have been shown to reinforce tannin oligomer astringency (Guinard et al. 1986, Noble 1998). It has been suggested that tartaric acid addition influence aroma activity co-efficients by enhancing ethanol aggregation, however this has 102
113 not proven conclusively (Pozo-Bayón and Reineccius 2009). Therefore in this study, the decrease in ph and corresponding increase in titratable acidity across the DAP treatments could potentially have underlined the decreased sweetness and increased astringency. However the DAP treatments did not have a perceived impact on the sensory attributes of the wines. Differences in alcohol concentration affect the balance of wines and can influence the perception of components of the wine. The perception of sweetness, astringency and bitterness have been shown to be influenced by alcohol concentration (Fontoin et al. 2008). Ethanol enhances the perception of bitterness significantly at typical wine alcohol levels (11-15%) (Fontoin et al. 2008). Conversely perception of astringency has been variously reported as decreasing as the level of ethanol increased (Fontoin et al. 2008) or having a minimal effect (Noble 1998). The concentration of alcohol has also been shown to influence the perception of sweetness (Martin 1970) and fruitiness (Escudero et al. 2007, Guth 2002). Increasing alcohol enhances sweetness (Martin 1970) however fruity smell attributes tend to decrease. The nature of the odour changes with berry attributes becoming less specific fruity and sweet with increasing alcohol (Escudero et al. 2007). Ugliano (2010) suggested that the lower concentration of alcohol in higher DAP treatments enhanced red fruit and dark fruit attributes even though concentrations of certain fruity esters decreased in concentration. Altering ethanol concentration has also been shown to impact the solution polarity and therefore the gas-liquid partition co-efficient of the wine. Increasing ethanol content decreases the activity coefficients of volatile compounds because of an increase in solubility the wine (Voilley et al. 1991), therefore reducing the release of volatiles compounds from wine and the intensity of the aroma (Guth 2002, Hartmann et al. 2002, Whiton and Zoecklein 2000). From this review it could have been expected the alcohol concentration decrease would have had some significant impact on wine perception, i.e. a decrease in perception of bitterness and sweetness, increased astringency, potentially increased the perception of berry attributes and the release of volatiles compounds from wine. However, as can be seen in Table 5.7, no significant results were noted from the sensory trials in relation to the DAP treatment. However the combined effect of the alcohol increases may have worked synergistically and subtly influenced the overall perception of the wines Changes in Ester Concentrations and Sensory Results with DAP Amendment Aromatic esters are a large important group of compounds that influence the flavour and aroma of many fermented beverages (Peddie 1990). The direct relationship between specific esters and the 103
114 nuances of red and black fruitiness of red wines have proven more difficult to pinpoint. Classical reconstitution and omission tests failed to determine the origin due to the difficulty in establishing a clear hierarchy of odorants, the numbers of compounds involved and the complex interactions between them (Ferreira et al. 1995). The additional use of GC-O technology in the last ten years has assisted in piecing together a clearer picture. Ethyl esters have long been thought important to the perception of fruit aromas in red wines (Ferreira and Cacho 2009, Ferreira et al. 1998, Kotseridis and Baumes 2000, López et al. 1999). They are typically above their threshold values in many red wines, including Cabernet sauvignon, Cabernet franc and Grenache but are generally found at lower concentrations in Pinot noir (Ferreira 2010). Research by Pineau (2009) highlighted that specific ethyl esters combinations even at concentrations well below their perception threshold levels can influence fruit perception. Wines highest in ethyl propanoate, ethyl 2-methylpropanoate and ethyl 2-methylbutanoate showed more pronounced black-berry aromas, whereas ethyl butanoate, ethyl hexanoate, ethyl octanoate, and ethyl 3- hydroxybutanoate conferred red-berry aromas. Recent studies on New Zealand Pinot noir (Tomasino 2011b) have also signalled the importance of specific esters to pinot noir aroma nuance. Ethyl octanoate influenced red cherry aroma and the combination of ethyl octanoate and ethyl decanoate influenced black cherry aroma. In the current study increasing DAP additions tended to decrease the concentrations of all ethyl fatty acid esters except ethyl octanoate and ethyl decanoate with both compounds showing significant increases. The canonical variate analysis of the ester concentration data also attributed the increases in concentration of ethyl decanoate, octanoate and the branched chain ester ethyl isobutyrate as contributing to the variance (30%) between the treatments. However these chemicals also increased with artificial aging and it is difficult to isolate the effects of the individual treatments to the overall result. It should also be noted the ethyl ester concentrations were below threshold level, e.g. the maximum concentrations of ethyl octanoate in the naturally aged wines was μg/l and olfactory threshold (in dearomatized red wine) is 960 μg/l (Pineau et al. 2009). Any sensory change due to DAP treatments would not have been due to any direct effect of these compounds but perhaps a combination of these compounds acting synergistically. Considering the sensory results for Pinot noir found in Tomasino (2011b) the expected impact could have been a change in the perception of fruitiness from red cherry to black cherry with increasing ethyl decanoate and octanoate as the DAP additions increased. Fruit attributes were among the most common descriptors used by the sensory participants to describe the wines in the session one descriptive rating task, with the most used being dark plum/cherry and red fruit/light 104
115 red fruit third and black berry fifth (Table 5.1). These generated descriptors were then used in the session 2 descriptor rating task. However the ANOVA results for that task did not highlight any significant differences in perception by the tasters of fruitiness across the DAP treatments. The changes may have been too subtle for perception or possibly the inclusion of the aged wines in the same line-up overshadowed and dominated the contrasts. As previously stated the decrease in alcohol concentration across the DAP treatments may also have enabled fruit perception to remain at a similar level across the treatments even though the concentration of many of the ethyl fatty acid esters decreased. The branched chain ethyl esters ethyl isobutyrate and ethyl 2-methyl butanoate were both highlighted as of importance in the canonical variate analysis of the ester results (Table 4.5). These compounds have strawberry-like aromas and are thought to contribute directly to red fruit notes in some red wines (Piombino et al. 2004). They have relatively low odour threshold levels and are considered the most powerful odorants in the ester class of compounds (Ugliano and Henschke 2008). The impact of branched chain ethyl esters on wine aroma is still to be fully established (Escudero et al. 2007). In this study ethyl 2-methyl butanoate concentrations were below threshold (18 μg/) (Ferreira et al. 2000) and decreased with added DAP. Ethyl isobutryate concentrations were well above threshold levels (15 μg/l) (Guth 1997b) and significantly increased with DAP treatment. This suggest ethyl isobutyrate (described as fruity above threshold level) could have had a direct impact on sensory while any impact by ethyl 2-methyl butanoate would have been as part of the aroma nuance. It is interesting the partial least squares regression analysis (Figure 6.3) relating the compounds to sensory, linked ethyl isobutyrate with jammy and ethyl 2-methyl butanoate to maturity. However the aging treatment seem to influence the concentration of these compounds more than the DAP treatment and this will be discussed later. Three of the acetate esters measured, ethyl acetate, hexyl acetate and phenyl ethyl acetate showed significant change in concentration with additional nutrition. Only hexyl acetate increased across the DAP treatments and only ethyl acetate was above perception thresholds levels. All ethyl acetate concentrations was well above threshold levels, hexyl acetate and phenyl ethyl acetate were below. Regression coefficients for red fruit and dark fruit for experimental wines from DAP treatments (Ugliano et al. 2010) correlated all three compounds positively these traits. However the net changes in this study did not equate to any perceived sensory differences between the wines. Ester concentrations have been shown to influence fruit attributes in red wines when at both above and below threshold levels e.g. (Pineau et al. 2009). DAP supplementation has also been seen to influence the formation of acetates and fatty acid ethyl esters (Ugliano et al. 2008). In other studies 105
116 increasing YAN levels up to 400mg/L by DAP supplementation has increased positive sensory fruity attributes (Ugliano et al. 2010). However in this study though there are significant changes to ester concentration with DAP addition, no significant sensory differences were identified by the tasting participants. The possible reasons for this are many, the most obvious being that with both aging treatments included in the same wine flights, the sensory changes affected by the aging treatments overshadowed any subtle changes in the DAP treatments. Also the changes in non-volatile components like alcohol and acidity may have ameliorated any variation, the very high YAN levels compared to other research could have influenced the results, the interactions of the esters at different concentrations could have ameliorated the effects or the changes were too subtle to be perceptible to the sensory participants. More research is required to get a clearer picture of the main causes Changes in Ester Concentrations and Sensory Results with Aging The aging treatment significantly impacted the concentrations of only six esters, ethyl propanoate, ethyl octanoate, ethyl decanoate, hexyl acetate, ethyl isobutyrate and ethyl 2-methyl butanoate. All concentrations increased with artificial aging except hexyl acetate. The sensory results did signal significant differences between the wines that had been artificially aged compared to naturally-aged. Artificially aged wines rated significantly lower for floral fruity nose but as expected were higher in attributes like maturity, jammy overripe (both p<0.01), reduced, perceived complexity and spicy (p<0.05) (Table 5.8). Principal component analysis clearly separated the naturally aged wines from the aged wines and designated the younger wines more fresh red fruit and floral/ fruity on the nose (Figure 5.4). Partial least square regression using the chemical data to predict the sensory characteristics (Figure 6.3) mirrored the previous results placing most of the naturally aged wines in the red fruit, floral fruit nose dimension and the aged wines in the maturity, reduced and jammy planes. PLSR related increasing concentrations of ethyl decanoate and ethyl isobutyrate with jammy, ethyl octanoate and ethyl 2-methyl butanoate to maturity, ethyl propanoate seemed linked to palate weight, perceived complexity and reduced. The decreased concentration of hexyl acetate related somewhat to palate weight. All compounds are within the expected range of concentration previously found in Pinot noir wines (Fang and Qian 2006) and none were above perception threshold (Pineau et al. 2009). Increased ethyl decanoate, ethyl octanoate and ethyl propanoate concentration have previously been shown to be fruity aroma enhancers (Lytra et al. 2013, Tomasino 2011b). For example Lytra (2013) showed that even at sub threshold concentrations a decrease in 106
117 concentration of ethyl propanoate led to a 2.6 fold decrease in the olfactory threshold of the fruity pool constituted by the other esters present. The significant increases in concentrations of branched chain esters ethyl isobutryate and ethyl 2-methyl butanoate (both above perception threshold) would also have been expected to increase fruity attributes in the wine. The increased concentration of branched-chain ester are in line with results of other aging experiments (He et al. 2013b). However against the trends of other aging studies the concentrations of most of fruity ethyl and acetate esters did not decrease significantly with age. In summary, the decrease in fruit perception and increase in perceived maturity in the wines that were aged artificially in this study, seemed related to the increased concentration of five esters (ethyl propanoate, octanoate, ethyl decanoate, ethyl isobutyrate and ethyl 2-methyl butanoate). This is unexpected as individually these esters are associated with fruity notes and some have been shown to interact to highlight fruity attributes (Tomasino 2011a). A possible explanation for this is other interactions in the complex wine matrices (e.g. changes in concentration of dimethyl sulphide and methanethiol) may have modified the expression of the esters masking fruitiness and modifying the wine aroma and flavour Changes in Fatty Acid Concentrations and Sensory Results with DAP Amendment Fatty acids are associated with pungent odours with descriptors like cheese (butanoic acid), fatty (decanoic acid) parmesan/rancid (isobutyric acid) (Siebert et al. 2005). As expected in the experimental wines, acetic acid was present in the highest concentrations of the fatty acids measured and as in previous studies e.g. (Ugliano et al. 2008) decreased with increasing nutrition. With a volatile acidity maximum of 0.54 g/l for the naturally aged control, the acetic acid levels would have lifted the nose rather than giving negative attributes. Fatty acids are important as precursors for the more aromatic fatty acid esters (Saerens et al. 2008) and the concentration trends in this study are mirrored between the classes. Yeast strain has been shown to significantly influence the concentration and trends of fatty acid production in relation to DAP addition (Ugliano et al. 2010). In this study DAP additions reduced the concentrations of most of the fatty acids (acetic, butanoic, hexanoic, isovaleric and 2-methyl butanoic acids) with the only significant increase being decanoic acid. Ugliano (2010) found similar decreases in fatty acid concentration with increasing DAP additions. The intensity of fatty acids negative attributes has been shown to mask fruitiness at higher 107
118 concentration (Pena 2008). Conversely decreases in concentration have been shown to suppress the intensity of descriptors like cheese, earth and yeast which were attributed primarily to 2- methylbutanoic acid and isovaleric acid Ugliano (2010). Decreases in isovaleric acid were pinpointed as being of particular importance to impacting aroma due to its odour activity value (Ugliano et al. 2010). The results of the canonical variate analysis of fatty acid concentration in this study (Table 4.8) agree with the results of Ugliano (2010). The majority of the variation in fatty acid concentration across the treatments were due to decreases in 2-methylbutanoic acid, hexanoic acid and isovaleric acid. However the sensory results did not highlight any trends toward increased fruitiness. In fact the net fruitiness decreased in the aged treatments compared to the naturally-aged. Decanoic acid increased significantly with both aging and DAP treatments, though at below threshold concentrations. Described as having fatty unpleasant attributes, increased decanoic acid concentrations would have negatively influenced wine fruitiness. Therefore, similar to the DAP treatment results for esters, with the inclusion of aged and naturally-aged wines in the same flights, the sensory changes affected by the aging treatments may have overshadowed any subtle changes displayed in the DAP treatments Changes in Fatty Acid Concentrations and Sensory Results with Aging The aging treatments significantly influenced the concentrations of hexanoic acid (decreased with aging) and decanoic acid (increased with aging). Little research has been done linking fatty acids with their sensory importance in red wines. Certainly both hexanoic and decanoic acid have been shown as important odorants in Australian Rieslings (Smyth 2005) but their impact (if any) on Pinot noir aroma is unknown. The canonical variate analysis for fatty acids (Figure 4.2) suggest that the DAP treatment explained 92% of the concentration changes in fatty acids rather than the aging treatment. Decanoic acid did seem related to spicy characters in the PLSR relating the chemical concentrations to attributes (Figure 6.3). However the concentrations of both hexanoic and decanoic acid were at sub threshold values in this study, would suggest that the change in fatty acid concentrations due to aging were probably not of major importance to the sensory attributes perceived in the aged wines. 108
119 6.4.7 Changes in Sulphide Concentrations and Sensory Results with DAP Amendment The volatile sulphur compounds commonly found in wine are hydrogen sulphide, methanethiol, ethanethiol, dimethyl sulphide, methyl thioacetate, ethyl thioaceate, dimethyl sulphide and dimethyl trisulphide (He et al. 2013a). Most are associated with negative attributes like rotten egg, cooked cabbage and onion. The concentrations of these compounds vary with wine style, production and the age of the wine. The concentrations of all the volatile sulphur compounds were very low in the experimental wines. Changes in DAP nutrition additions significantly influenced only one compound, decreasing the concentration of dimethyl sulphide. Dimethyl sulphide (DMS) is described as having truffle quince attributes. It can be perceived as either positive or negative depending on concentration and also the style of wine it is in (De Mora et al. 1987, Segurel et al. 2004). DMS is often found at low levels in young wines and the concentrations found in the red wine DAP treatments were at sub threshold levels (Anocibar Beloqui 1998). The canonical variate analysis for sulphides (Figure 4.3) showed that 97% of the between treatment concentration variation was due to aging rather than the DAP treatments. So though DMS has an important role in wine aroma its influence in this study was more important related to artificial aging than the DAP treatment Changes in Sulphide Concentrations and Sensory Results with Aging The aging treatments significantly increased the concentration of methanethiol and dimethyl sulphide. Methanethiol is associated with cooked cabbage stagnant water attributes and has a perception threshold of 0.7 μg/l in a clean wine. Dimethyl sulphide is a less pungent smelling compound with a higher perception threshold of 1.4 μg/l (Ribéreau-Gayon et al. 2006) but this be as high as μg/l depending wine type (Ferreira 2010). Threshold levels in red wine have been documented as 27 μg /L (Anocibar Beloqui 1996). Both compounds were at concentrations above their thresholds in all of the research wines. Canonical variate correlations (Table 4.10) suggested that major cause of variation between the wines was the increase in dimethyl sulphide concentration followed by that of methanethiol, both as a result of the aging treatment. DMS has been found to increase with age in other similar trials (Segurel et al. 2005, Ugliano et al. 2012). The amount of DMS formed during aging has been linked to a number of variables including grape variety, viticultural practices (Dagan 2006), fermentation 109
120 conditions (including nitrogen supplementation) (Ugliano et al. 2012), aging temperature, oxygen availability and the presence of precursor S-methyl methionine (Segurel et al. 2005). Methanethiol is not considered to provide positive attributes to quality wine. It is potential contributor to reductive odour (Mestres et al. 2000a) and has been shown to accumulate post bottling to levels over threshold levels (Ugliano et al. 2012). A recent study suggest that DMS and methanethiol (MeSH) can react synergistically to support reductive odours in red wines (Ugliano et al. 2012). Increases in dimethyl sulphide with aging have been linked to positive complex wine characteristics (De Mora et al. 1986a, Loubser and Du Plessis 1976, Marais 1979, Segurel et al. 2004). Studies suggest that increased DMS concentration can result variously in higher rating for red fruits and berry fruits sensory descriptors (Segurel et al. 2004) with additional truffle, black olive and more unpleasant cabbage notes (Ugliano et al. 2008). Generally higher concentrations have been shown to produce savoury effects in red wine (e.g. green olive for DMS levels >100 μg/l (Anocibar Beloqui 1998). DMS has a wide range of impacts on different wine varietals: e.g. enhancement of fruity character in aged Syrah (Anocibar Beloqui 1998), regarded as a positive in Cabernet sauvignon (De Mora et al. 1987), contributor to reductive notes in Syrah (Ugliano et al. 2012), as totally faulty at trace levels in a red Pinot wine (Spedding and Raut 1982). Therefore the influence on red wine aroma can be perceived either positively (De Mora et al. 1987) or negatively (Spedding and Raut 1982) depending on the concentration of DMS and the style and varietal of the wine. This sensory impact may be direct from the dimethyl sulphide but also in combination with other compounds like methionol (Segurel et al. 2004) and higher alcohols (Van der Merwe and Van Wyk 1981) has also been shown to modulate the perceived fruitiness derived from esters. The results for this trial showed most significant sensory results for the artificially aged treatments. The descriptors used for the artificially aged wines were (in decreasing order of significance level), reduced character/ sulphides, wine maturity, jammy/overripe, spicy, perceived complexity and palate weight (Table 5.8). The principal component analysis (Figure 5.4) of variables with significant age effects also linked most of the aged treatments to the same sensory attributes. Dimethyl sulphide in high concentrations has been shown to impart similar characteristics. Therefore it was surprising that PLSR of the chemical component concentration linked to sensory attribute (figure 6.2) did not link either of the sulphides to characteristics associated with artificial aging. 110
121 In summary, the concentration of methanethiol and dimethyl sulphide increased with aging and were present in above threshold levels in the wine. Though the PLSR analysis relating sensory and chemistry attributed the aged treatment sensory changes to increases in concentration of five fruity esters (ethyl propanoate, octanoate, ethyl decanoate, ethyl isobutyrate and ethyl 2-methyl butanoate), their aroma expression may have been influenced by the increasing concentrations of dimethyl sulphide and possibly methanethiol. There is little research on the impact of different concentrations of DMS on the aroma of Pinot noir but it could be postulated that in this trial the high DMS concentrations (double the threshold in red wine) influenced the aroma and flavours of the wines. Possibly there was some synergistic reaction with methanethiol. These interactions may have imparted mature wine characters either directly or via interaction with other flavour constituents (possibly the esters). 6.5 Conclusions It was not possible to obtain strong correlation between the statistically significant chemical differences between the wine treatments and the perception of the sensory participants. Increasing levels of DAP addition did have a significant impact on the volatile compounds, with most significant results showing decreases in concentration. Decreases in concentrations of most esters (except ethyl 2-methyl propanoate, ethyl decanoate and octanoate), decreases in fatty acids (except decanoic acid) and a significant decrease in concentration of dimethyl sulphide. However no sensory differences were perceived between the DAP treatments by the participants. There may have been subtle differences with some compounds counteracting each other potentially. For example a potential loss of fruit perception with increasing DAP additions because of the decrease in fruit esters (phenyl ethyl acetate, ethyl acetate and ethyl hexanoate highlighted by CV analysis) could have been counteracted by the decrease in concentration of fatty acids with unpleasant odours (2- methylbutanoic acid and hexanoic acid highlighted by CV analysis) and decrease in alcohol concentration. However overall, the excessive nitrogen levels did not impact or detract from the quality of the wines. Sensory analysis results were dominated by the comparison of wines that had been artificially aged to those that had not. Generally the sensory panel successfully grouped the wines, with the naturally aged wines predominantly showed as red fruit, floral fruit aroma, while the aged wines showed characteristics described as jammy, maturity, spicy and seemed related to perceived complexity and palate weight. In hindsight, including these wines in the same flight as the DAP treatment wines was a fault in the experimental design because if there were any sensory 111
122 differences between the DAP treatments, they were too subtle to be perceived in contrast to the aged treatments. Any later research considering sensory differences between DAP treatments should not include another variable like aging so any significant sensory results can be highlighted and correlated to the chemical results. Fewer volatile compounds had concentrations affected by artificially aging the wines at 30 C for 6 weeks than for the DAP treatments. Most of the significant ester results showed increases in concentration, which was expected for the branched chain fatty acids (ethyl isobutyrate and ethyl 2- methyl butanoate) but not for the fruity fatty acid esters (ethyl esters ethyl propanoate, ethyl decanoate and ethyl octanoate). The aging treatment seems to have accelerated conversion of fatty acid precursors to corresponding esters. The fatty acid results show decreasing trends but only butanoic acid showed a significant decrease in concentration. An increase in esters would have been expected to cause fruit attributes but the aged wines were described as more mature, reduced, jammy with less floral, fruity on the nose. Certainly PLSR results (Figure 6.2) related ethyl octanoate and 2 methyl ethyl butanoate to maturity and ethyl decanoate and ethyl isobutyrate to jammy. The changes in concentration of other compounds must have had an effect on the perception of the esters and on the overall characteristics of the artificially aged wines. Significant increases in the fatty acid decanoic acid with aging seems to be partially responsible for the maturity characteristics. The sensory results correlated it to the spicy characteristics (Figure 6.2). The increases in the two sulphides methanethiol and dimethyl sulphide, though not highlighted by the sensory analysis results, may also have influenced the character of the artificially aged wines. Both compounds were at concentrations well above their sensory threshold in all the aged wines. Dimethyl sulphide has been previously shown to impact the perception of wine fruitiness, enhancing at lower concentrations (Anocibar Beloqui 1998, Segurel et al. 2004) and replacing it with savoury at higher (Ugliano et al. 2008). PLSR results did not link DMS to any wine descriptors but possibly it acted as an aroma enhancer. Methanethiol has been shown to work synergistically with dimethyl sulphide to produce reduced characters in wine (Ugliano et al. 2012). These interactions may have imparted mature wine characters either directly or via interaction with other flavour constituents (possibly the esters). 112
123 Chapter 7 Future Research The area of DAP addition impact on Pinot noir chemical and sensory characteristics requires further research. There is limited published work on the impact of YAN on red wine volatile composition and this is the only study using Pinot noir. The high YAN concentrations in this trial mimicked what can occur in some wineries i.e. prophylactic addition of DAP without doing YAN analysis. Though there were significant changes in concentration of volatile compounds across the DAP amendments in this study, this was not perceived by the sensory panel. One possible explanation is that the concentrations of all the volatile compounds measured were low, below perception threshold in red wine for all the esters and fatty acids measured and of the sulphides, dimethyl sulphide was above threshold for the aged treatments only. There may have been interactions within and between the groups of compounds that may have subtly affected the wine aroma. Interactions with non-volatile wine components may also have influenced aroma. However no significant differences across the DAP amendments were perceived. Inclusion of the naturally and artificially-aged wines in the same flights may have been an error in experimental design as the more obvious differences between the aging treatments dominated the results. Any later trials should present naturally aged wines separately in different flights. An interesting variation of this trial using grapes with a low YAN status (<100 ppm) would probably result in the formation of more sulphides (including hydrogen sulphide) and give the opportunity of exploring if the complexity of house style in boutique Pinot noir winemaking is related to residual volatile sulphides. The choice of yeast strain has been shown to impact the response to nitrogen supplementation (Ugliano et al. 2011, Ugliano et al. 2010). The impact of nutrition on aroma volatile production is influenced greatly by the yeast involved in the fermentation because of subtle difference in metabolism. The variables in yeast choice are numerous, two main species (S. cerevisiae and S. bayanus) but also the complexity of races (S. cerevisiae var. cerevisiae or var. bayanus) and then different strains within those groups. Trials using Saccharomyces cerevisiae var. cerevisiae in contrast to Saccharomyces cerevisiae var. bayanus or S. bayanus sp. showed species and race can highly influential on chemical results for Australian Syrah (Ugliano et al. 2010). The yeast chosen for this trial (Saccharomyces cerevisiae var. bayanus, EC1118) is commonly used for red fermentation. However there are no published research results related to nutrition addition using this yeast. More research is needed to be able to generalise about the impact of different levels of nitrogen supplementation on aroma and final wine quality, for different yeast groups. Future trials could replicate DAP treatments on different yeasts to further understand the chemical and sensory effects of different yeast strains. 113
124 The major impacts of aging the wines in this study were; unexpected significant increases in concentrations of five fruity esters, increased concentrations of the fatty acid decanoic acid and increased concentrations methanthiol and dimethyl sulphide. Sensory differences were perceived between the aging treatments and the sensory panel successfully grouped the wines into age categories, linking descriptors to possible related compounds. The artificial aging technique used for this trial needs to be calibrated. A possible trial could measure the volatile components of artificially aged wines compared to wines naturally aged for a range of time periods. This would enable evaluation of the effectiveness of this technique at mimicking aging in cellar conditions (8 C) for two or three years. Dimethyl sulphide has been shown to influences the sensory characteristics of red wine as it ages (De Mora et al. 1987, Segurel et al. 2004). Significant increases in concentration were observed with aging in this trial. PLSR of the chemical component concentration did not link DMS to a particular sensory attribute however there may have been an interactive cumulative impact on the perception of other compounds. Further research is required into dimethyl sulphide flavour perception, how it influences wine aroma and the impact it has on the characteristics of New Zealand Pinot noir as the wine ages. Qualifications There are several qualifications for the study that require mention. First, the wines employed in the study were research wines produced from Central Otago fruit. Therefore, care is needed in generalising the results to commercial Pinot noir wines, and to wines produced in locations other than New Zealand. Second, it must be noted that artificial aging of wines cannot necessarily be consider to replicate normal wine aging in all facets. Therefore, once again any generalisation of the current results to situations involving normally-aged wines must be undertaken with caution. 114

125 Appendix A. Sensory Evaluation of Pinot noir Wines in August
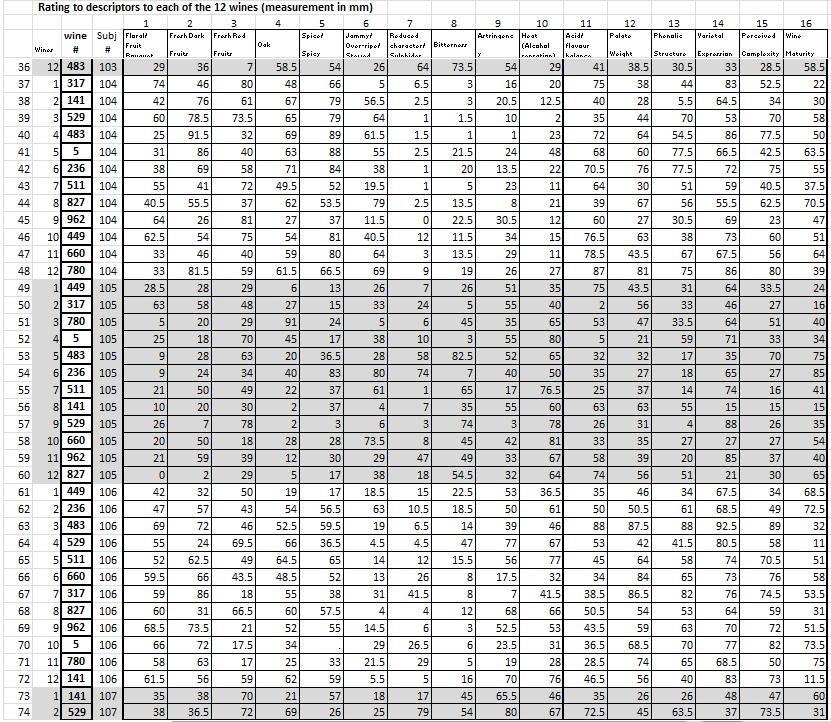
126
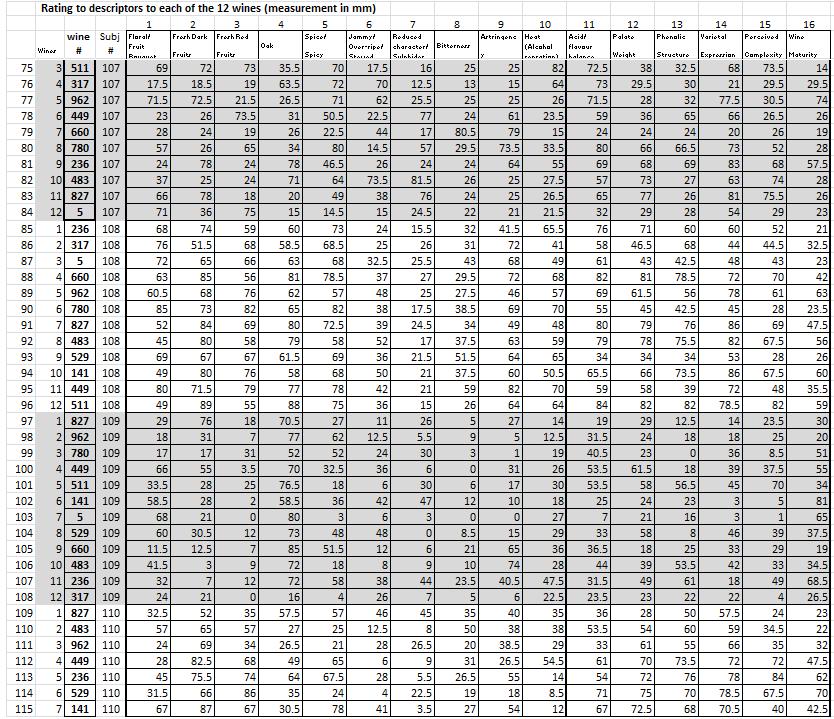
127 117
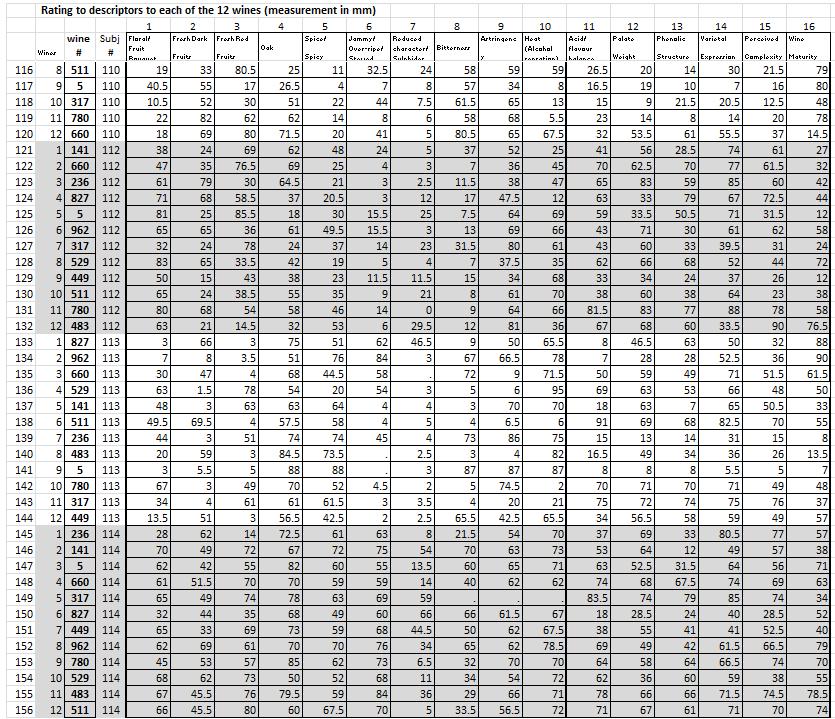
128 118
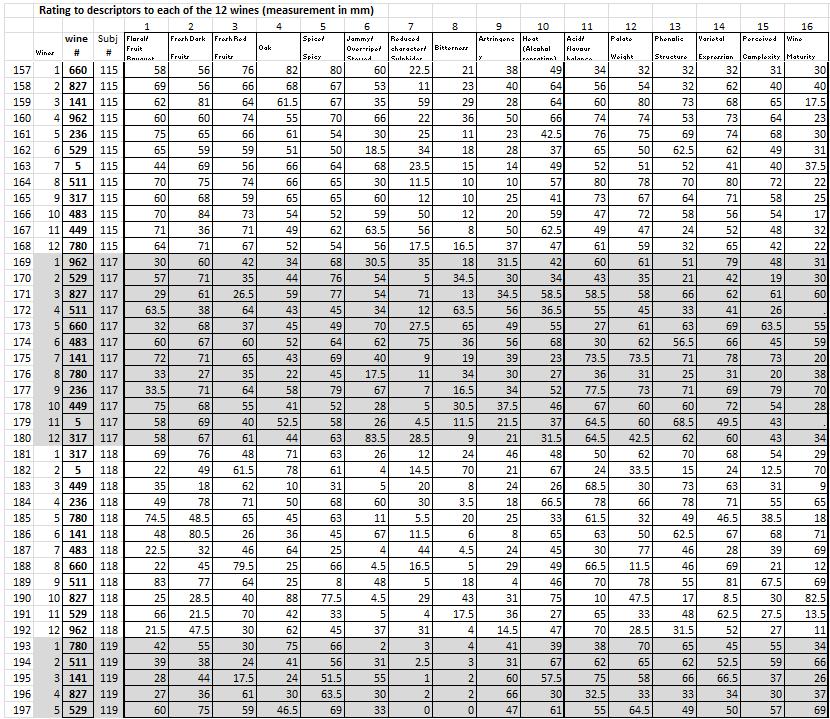
129 119
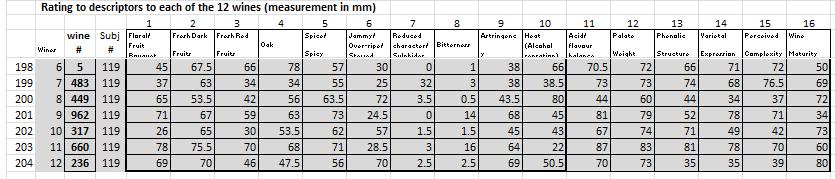
130
Grapes, the essential raw material determining wine volatile. composition. It s not just about varietal characters.
 Grapes, the essential raw material determining wine volatile composition. It s not just about varietal characters. Paul Boss and Eric Dennis Food Futures Flagship and CSIR Plant Industry, P Box 350 Glen
Unit code: A/601/1687 QCF level: 5 Credit value: 15
 Unit 24: Brewing Science Unit code: A/601/1687 QCF level: 5 Credit value: 15 Aim This unit will enable learners to apply knowledge of yeast physiology and microbiology to the biochemistry of malting, mashing
Harvest Series 2017: Yeast Nutrition
 Harvest Series 2017: Yeast Nutrition Jasha Karasek Winemaking specialist Enartis USA WEBINAR INFO 40 Minute presentation + 20 minute Q&A Save Qs until end of presentation Use chat box for audio/connection
Varietal Specific Barrel Profiles
 RESEARCH Varietal Specific Barrel Profiles Beaulieu Vineyard and Sea Smoke Cellars 2006 Pinot Noir Domenica Totty, Beaulieu Vineyard Kris Curran, Sea Smoke Cellars Don Shroerder, Sea Smoke Cellars David
Flavor and Aroma Biology
 Flavor and Aroma Biology limonene O OCH3 O H methylsalicylate phenylacetaldehyde O H OCH3 benzaldehyde eugenol O H phenylacetaldehyde O neral O geranial nerolidol limonene Florence Zakharov Department
Nitrogen is a key factor that has a significant
 WINEMAKING PRACTICAL WINERY & VINEYARD Nitrogen Plays Many Roles During Fermentation Uncovering the relationship between nitrogen and aroma development By Anne Ortiz-Julien, Ann Dumont, Edouard Lordat
Enhancing red wine complexity using novel yeast blends
 Enhancing red wine complexity using novel yeast blends The influence of yeast on wine composition has been well established, particularly for white grape varieties such as Sauvignon Blanc where key aroma
Influence of yeast strain choice on the success of Malolactic fermentation. Nichola Hall Ph.D. Wineries Unlimited, Richmond VA March 29 th 2012
 Influence of yeast strain choice on the success of Malolactic fermentation Nichola Hall Ph.D. Wineries Unlimited, Richmond VA March 29 th 2012 INTRODUCTION Changing conditions dictate different microbial
Fermentation-derived aroma compounds and grape-derived monoterpenes
 Fermentation-derived aroma compounds and grape-derived monoterpenes Leigh Francis Flavours from yeast Volatile phenols Higher alcohols Volatile acidity VINEGAR MEDICINAL SPIRITOUS FLORAL FRUITY Monoterpenes
Flavor and Aroma Biology
 Flavor and Aroma Biology utline Introduction to our sensory system and the perception of flavor Relationships between fruit composition and flavor perception Fruit biology and development of flavor components
World of Wine: From Grape to Glass
 World of Wine: From Grape to Glass Course Details No Prerequisites Required Course Dates Start Date: th 18 August 2016 0:00 AM UTC End Date: st 31 December 2018 0:00 AM UTC Time Commitment Between 2 to
5. Supporting documents to be provided by the applicant IMPORTANT DISCLAIMER
 Guidance notes on the classification of a flavouring substance with modifying properties and a flavour enhancer 27.5.2014 Contents 1. Purpose 2. Flavouring substances with modifying properties 3. Flavour
Timing of Treatment O 2 Dosage Typical Duration During Fermentation mg/l Total Daily. Between AF - MLF 1 3 mg/l/day 4 10 Days
 Micro-Oxygenation Principles Micro-oxygenation is a technique that involves the addition of controlled amounts of oxygen into wines. The goal is to simulate the effects of barrel-ageing in a controlled
How yeast strain selection can influence wine characteristics and flavors in Marquette, Frontenac, Frontenac gris, and La Crescent
 How yeast strain selection can influence wine characteristics and flavors in Marquette, Frontenac, Frontenac gris, and La Crescent Katie Cook, Enologist, University of Minnesota Fermentation Yeast Saccharomyces
INVESTIGATIONS INTO THE RELATIONSHIPS OF STRESS AND LEAF HEALTH OF THE GRAPEVINE (VITIS VINIFERA L.) ON GRAPE AND WINE QUALITIES
 ON GRAPE AND WINE QUALITIES") INVESTIGATIONS INTO THE RELATIONSHIPS OF STRESS AND LEAF HEALTH OF THE GRAPEVINE (VITIS VINIFERA L.) ON GRAPE AND WINE QUALITIES by Reuben Wells BAgrSc (Hons) Submitted in fulfilment of the requirements
INVESTIGATIONS INTO THE RELATIONSHIPS OF STRESS AND LEAF HEALTH OF THE GRAPEVINE (VITIS VINIFERA L.) ON GRAPE AND WINE QUALITIES by Reuben Wells BAgrSc (Hons) Submitted in fulfilment of the requirements
World of Wine: From Grape to Glass Syllabus
 World of Wine: From Grape to Glass Syllabus COURSE OVERVIEW Have you always wanted to know more about how grapes are grown and wine is made? Perhaps you like a specific wine, but can t pinpoint the reason
Flavor and Aroma Biology
 Flavor and Aroma Biology limonene O OCH3 O H methylsalicylate phenylacetaldehyde O H OCH3 benzaldehyde eugenol O H phenylacetaldehyde O neral O geranial nerolidol limonene Florence Zakharov Department
Technical note. How much do potential precursor compounds contribute to reductive aromas in wines post-bottling?
 Technical note How much do potential precursor compounds contribute to reductive aromas in wines post-bottling? Introduction The formation of unpleasant reductive aromas in wines is an issue of concern
Effects of Capture and Return on Chardonnay (Vitis vinifera L.) Fermentation Volatiles. Emily Hodson
 Fermentation Volatiles. Emily Hodson") Effects of Capture and Return on Chardonnay (Vitis vinifera L.) Fermentation Volatiles. Emily Hodson Thesis submitted to the faculty of the Virginia Polytechnic Institute and State University in partial
Effects of Capture and Return on Chardonnay (Vitis vinifera L.) Fermentation Volatiles. Emily Hodson Thesis submitted to the faculty of the Virginia Polytechnic Institute and State University in partial
Dr.Nibras Nazar. Microbial Biomass Production: Bakers yeast
 Microbial biomass In a few instances the cells i.e. biomass of microbes, has industrial application as listed in Table 3. The prime example is the production of single cell proteins (SCP) which are in
Effects of Leaf Removal and UV-B on Flavonoids, Amino Acids and Methoxypyrazines
 Effects of Leaf Removal and UV-B on Flavonoids, Amino Acids and Methoxypyrazines Professor Brian Jordan Centre for Viticulture & Oenology, Lincoln University What are the major factors to be considered
Factors influencing mandarin fruit quality. What drives the eating. Outline. experience in mandarins?
 Factors influencing mandarin fruit quality David Obenland, USDA-ARS, Parlier, CA Mary Lu Arpaia, UCR What drives the eating Outline experience in mandarins? Exterior appearance is important for the initial
Session 4: Managing seasonal production challenges. Relationships between harvest time and wine composition in Cabernet Sauvignon.
 Session 4: Managing seasonal production challenges Relationships between harvest time and wine composition in Cabernet Sauvignon Keren Bindon Cristian Varela, Helen Holt, Patricia Williamson, Leigh Francis,
Sensory Quality Measurements
 Sensory Quality Measurements Evaluating Fruit Flavor Quality Appearance Taste, Aroma Texture/mouthfeel Florence Zakharov Department of Plant Sciences fnegre@ucdavis.edu Instrumental evaluation / Sensory
Increasing Toast Character in French Oak Profiles
 RESEARCH Increasing Toast Character in French Oak Profiles Beaulieu Vineyard 2006 Chardonnay Domenica Totty, Beaulieu Vineyard David Llodrá, World Cooperage Dr. James Swan, Consultant www.worldcooperage.com
Little Things That Make A Big Difference: Yeast Selection. Yeast selection tasting
 Little Things That Make A Big Difference: Yeast Selection Yeast selection tasting Wine Aroma PRIMARY AROMAS Grape-derived Monoterpenes (floral, fruity) Norisoprenoids (floral, perfumy) Methoxypyrazines
The Importance of Dose Rate and Contact Time in the Use of Oak Alternatives
 W H I T E PA P E R The Importance of Dose Rate and Contact Time in the Use of Oak Alternatives David Llodrá, Research & Development Director, Oak Solutions Group www.oaksolutionsgroup.com Copyright 216
Flavor and Aroma Biology
 Flavor and Aroma Biology utline Introduction to our sensory system and the perception of flavor Relationships between fruit composition and flavor perception Fruit biology and development of flavor components
Christian Butzke Enology Professor.
 Christian Butzke Enology Professor butzke@purdue.edu www.indyinternational.org www.indianaquality.org Film Yeasts vs Varietal Character Malolactic in the Cold Color Extraction & Stability High ph and High
VQA Ontario. Quality Assurance Processes - Tasting
 VQA Ontario Quality Assurance Processes - Tasting Sensory evaluation (or tasting) is a cornerstone of the wine evaluation process that VQA Ontario uses to determine if a wine meets the required standard
Carolyn Ross. WSU School of Food Science
 Sensory Evaluation of Wine Faults Carolyn Ross Assistant Professor WSU School of Food Science WSU Viticulture and Enology Team Gustatory Faults Most are obvious to the nose Need only confirmation by palate
Yeast and Flavour Production. Tobias Fischborn Lallemand Brewing
 Yeast and Flavour Production Tobias Fischborn Lallemand Brewing Content Flavour production by yeast How to control Flavour Production Non-Traditional Yeast to Brew Beer Contribution To Beer Flavor Contribution
Investigating the factors influencing hop aroma in beer
 Investigating the factors influencing hop aroma in beer Graham Eyres, Tobias Richter, Jamie Scrimgeour, Pat Silcock and Phil Bremer Department of Food Science University of Otago, Dunedin, New Zealand
Characterisation of New Zealand hop character and the impact of yeast strain on hop derived compounds in beer
 Characterisation of New Zealand hop character and the impact of yeast strain on hop derived compounds in beer Graham Eyres, B. Gould, V. Ting, M. Leus, T. Richter, P. Silcock, and P.J. Bremer Department
yeast-derived flavours
 yeast-derived flavours Positive flavour in some beers - offflavour in others Produced by yeast during fermentation Critically affected by wort [Zn] and yeast health Can also be produced by contaminant
Sensory evaluation of virgin or cold-pressed edible oils
 Sensory evaluation of virgin or cold-pressed edible oils Bertrand Matthäus and Ludger Brühl Max Rubner-Institut, Working Group for Lipid Research, Detmold, Germany The most important parameter for the
AN ENOLOGY EXTENSION SERVICE QUARTERLY PUBLICATION
 The Effects of Pre-Fermentative Addition of Oenological Tannins on Wine Components and Sensorial Qualities of Red Wine FBZDF Wine. What Where Why How 2017 2. October, November, December What the authors
Project Summary. Principal Investigator: C. R. Kerth Texas A&M University
 Project Summary Determination of aromatic production from surface browning to improve flavor in steaks using differences in steak thickness and cook surface temperature Principal Investigator: C. R. Kerth
MLF co-inoculation how it might help with white wine
 MLF co-inoculation how it might help with white wine Malolactic fermentation (MLF) is an important process in red winemaking and is also increasingly used in white and sparkling wine production. It is
Flavour release and perception in reformulated foods
 Flavour release and perception in reformulated foods Towards a better understanding Christian Salles INRA, France 1 Background Many solutions have been proposed to decrease salt in foods but most of them
Oregon Wine Advisory Board Research Progress Report
 Grape Research Reports, 1996-97: Fermentation Processing Effects on Anthocyanin and... Page 1 of 10 Oregon Wine Advisory Board Research Progress Report 1996-1997 Fermentation Processing Effects on Anthocyanin
About OMICS Group Conferences
 About OMICS Group OMICS Group International is an amalgamation of Open Access publications and worldwide international science conferences and events. Established in the year 2007 with the sole aim of
Wine-Tasting by Numbers: Using Binary Logistic Regression to Reveal the Preferences of Experts
 Wine-Tasting by Numbers: Using Binary Logistic Regression to Reveal the Preferences of Experts When you need to understand situations that seem to defy data analysis, you may be able to use techniques
SULPHIDES IN WINE. Treatment and Prevention - a practical approach
 SULPHIDES IN WINE Treatment and Prevention - a practical approach SULPHIDES and the screwcap challenge A VERY common wine fault, especially in screwcap wines: of the bottles with faults, cork taint stayed
distinct category of "wines with controlled origin denomination" (DOC) was maintained and, in regard to the maturation degree of the grapes at
 was maintained and, in regard to the maturation degree of the grapes at") ABSTARCT By knowing the fact that on an international level Romanian red wines enjoy a considerable attention, this study was initiated in order to know the possibilities of obtaining in Iaşi vineyard
ABSTARCT By knowing the fact that on an international level Romanian red wines enjoy a considerable attention, this study was initiated in order to know the possibilities of obtaining in Iaşi vineyard
THE WINEMAKER S TOOL KIT UCD V&E: Recognizing Non-Microbial Taints; May 18, 2017
 THE WINEMAKER S TOOL KIT UCD V&E: Recognizing Non-Microbial Taints; May 18, 2017 Sue Langstaff, Sensory Scientist Applied Sensory, LLC The first difficulty that tasters encounter is to find and to translate
Christian Butzke Enology Professor.
 Christian Butzke Enology Professor butzke@purdue.edu www.indyinternational.org www.indianaquality.org SO 2 & Sorbate Management Oxygen Management Skin Contact Time Residual Nutrients Temperature, ph &
UNIT 10. CHEMISTRY OF FLAVOR, ODOUR AND TASTE COMPONENTS IN FOOD
 UNIT 10. CHEMISTRY OF FLAVOR, ODOUR AND TASTE COMPONENTS IN FOOD 1. FLAVOUR AND ODOUR Flavour plays an important and indispensable role in modern food Flavor is the sensation produced by a material taken
is pleased to introduce the 2017 Scholarship Recipients
 is pleased to introduce the 2017 Scholarship Recipients Congratulations to Elizabeth Burzynski Katherine East Jaclyn Fiola Jerry Lin Sydney Morgan Maria Smith Jake Uretsky Elizabeth Burzynski Cornell University
Growing Grapes for White Wine Production: Do s and Don ts in the Vineyard
 Washington Winegrowers Convention Kennewick, WA, February 6-8, 2018 Growing Grapes for White Wine Production: Do s and Don ts in the Vineyard Markus Keller Aroma, flavor: Volatiles for white wine Norisoprenoids
Condensed tannin and cell wall composition in wine grapes: Influence on tannin extraction from grapes into wine
 Condensed tannin and cell wall composition in wine grapes: Influence on tannin extraction from grapes into wine by Rachel L. Hanlin Thesis submitted for Doctor of Philosophy The University of Adelaide
The impact of smoke exposure on different grape varieties. Renata Ristic and Kerry Wilkinson
 The impact of smoke exposure on different grape varieties Renata Ristic and Kerry Wilkinson Flavours Colour Tannins TA ph Anthocyanins SMOKE TAINT MAGIC BOX OF KNOWLEDGE What Grape to do varieties in a
Flavour Legislation Past Present and Future or From the Stone Age to the Internet Age and Beyond. Joy Hardinge
 Flavour Legislation Past Present and Future or From the Stone Age to the Internet Age and Beyond Joy Hardinge PAST Pre 1988 No EU legislation Each Member State had the possibility have their own legislation.
Réseau Vinicole Européen R&D d'excellence
 Réseau Vinicole Européen R&D d'excellence Lien de la Vigne / Vinelink 1 Paris, 09th March 2012 R&D is strategic for the sustainable competitiveness of the EU wine sector However R&D focus and investment
Stuck / Sluggish Wine Treatment Summary
 800.585.5562 BSGWINE.COM 474 Technology Way Napa, CA 94558 Stuck / Sluggish Wine Treatment Summary 1. BEFORE REINOCULATING 1.1 Check yeast viability with methylene blue. Mix a sample of must with an equal
RISK MANAGEMENT OF BEER FERMENTATION DIACETYL CONTROL
 Buletin USAMV-CN, 62/2006 (303-307) ISSN 1454 2382 RISK MANAGEMENT OF BEER FERMENTATION DIACETYL CONTROL Mudura Elena, SevastiŃa Muste, Maria Tofană, Crina Mureşan elenamudura@yahoo.com University of Agricultural
Analysing the shipwreck beer
 Analysing the shipwreck beer Annika Wilhelmson, John Londesborough and Riikka Juvonen VTT Technical Research Centre of Finland Press conference 10 th May 2012 2 The aim of the research was to find out
Anaerobic Cell Respiration by Yeast
 25 Marks (I) Anaerobic Cell Respiration by Yeast BACKGROUND: Yeast are tiny single-celled (unicellular) fungi. The organisms in the Kingdom Fungi are not capable of making their own food. Fungi, like any
AN ENOLOGY EXTENSION SERVICE QUARTERLY PUBLICATION
 Effect of non-saccharomyces yeasts on the volatile chemical profile of Shiraz wine M.E. B. Whitener, J. Stanstrup, S. Carlin, B. Divol, M.Du Toit And U. Vrhovsek What the authors did. They investigated
Brewing Country Wines. Benjamin F. Lasseter, Ph.D. Chair, Hampton Roads American Chemical Society
 Brewing Country Wines Benjamin F. Lasseter, Ph.D. Chair, Hampton Roads American Chemical Society What is a country wine? An alcoholic beverage produced at home, instead of commercially possibly using grapes.
MIC305 Stuck / Sluggish Wine Treatment Summary
 Page: 1 of 5 1. BEFORE reinoculating 1.1 Check yeast viability with methylene blue. If < 25 % of yeasts are viable, rack off yeast lees and skip to reinoculation method below. If there are many live cells,
Specific Yeasts Developed for Modern Ethanol Production
 2 nd Bioethanol Technology Meeting Detmold, Germany Specific Yeasts Developed for Modern Ethanol Production Mike Knauf Ethanol Technology 25 April 2006 Presentation Outline Start with the Alcohol Production
Introduction to Wine Judging A preparatory course for AWS Certified Wine Judge Training
 Introduction to Wine Judging A preparatory course for AWS Certified Wine Judge Training Joseph A. Fiola, Ph.D. Specialist in Viticulture and Small Fruit UMD/Maryland Cooperative/WMREC Gary C. Pavlis, Ph.D.
RELATIONSHIPS BETWEEN THE SPEED OF FERMENTATION AND LEVELS OF FLAVOUR COMPOUNDS POST- FERMENTATION
 1 RELATIONSHIPS BETWEEN THE SPEED OF FERMENTATION AND LEVELS OF FLAVOUR COMPOUNDS POST- FERMENTATION Maria Josey, James Bryce and Alex Speers Young Scientists Symposium 2016 Chico, California Yeast Derived
The Purpose of Certificates of Analysis
 207/SOM2/SCSC/WRF/020 The Purpose of Certificates of Analysis Submitted by: FIVS 7 th Wine Regulatory Forum -2 May 207 The Purpose of Certificates of Analysis Greg Hodson, Ph.D. President, FIVS Wine Institute
Yeasts for low (and high) alcohol
 alcohol") Yeasts for low (and high) alcohol Ana Hranilovic ASVO Adelaide Seminar 19.11.2015 ARC Training Centre for Innovative Wine Production adelaide.edu.au/tc-iwp/ Earlier, shorter, hotter vintages are stressful
Yeasts for low (and high) alcohol Ana Hranilovic ASVO Adelaide Seminar 19.11.2015 ARC Training Centre for Innovative Wine Production adelaide.edu.au/tc-iwp/ Earlier, shorter, hotter vintages are stressful
Enhanced Maturity Trial Wine Evaluation Isosceles Vineyard, Te Mata Estates Maraekakaho Rd, SH50, Hastings
 Enhanced Maturity Trial 2016- Wine Evaluation Isosceles Vineyard, Te Mata Estates Maraekakaho Rd, SH50, Hastings November 2016 Prepared by: Helen Henry Reviewed by: Ant Mackenzie Consultant winemaker Hawke
INSTRUCTIONS FOR CO-INOCULATION
 INSTRUCTIONS FOR CO-INOCULATION Preliminary Considerations Objective of this protocol is to promote malolactic fermentation in conjunction with alcoholic fermentation. 1. Work within a temperature range
Christian Butzke & Jill Blume enology.butzke.com
 Christian Butzke & Jill Blume butzke@purdue.edu 765.494.6500 enology.butzke.com Chemistry Sensory Causes Prevention-Management-Removal Reduction Oxidation Volatile Acidity Nailpolish Brettanomyces Buttery
VINOLOK (VINOSEAL) closure evaluation Stage 1: Fundamental performance assessment
 closure evaluation Stage 1: Fundamental performance assessment") AWRI Report VINOLOK (VINOSEAL) closure evaluation Stage 1: Fundamental performance assessment Author: Neil Scrimgeour 14 March, 2014 Project Number: PCS13060 Commercial in confidence Page 1 of 6 1. Introduction
AWRI Report VINOLOK (VINOSEAL) closure evaluation Stage 1: Fundamental performance assessment Author: Neil Scrimgeour 14 March, 2014 Project Number: PCS13060 Commercial in confidence Page 1 of 6 1. Introduction
Comparisons of yeast from wine, sake and brewing industries. Dr. Chandra Richter MBAA District Meeting October 25 th, 2014.
 Comparisons of yeast from wine, sake and brewing industries Dr. Chandra Richter MBAA District Meeting October 25 th, 2014 E&J Gallo Winery E&J Gallo Winery Began in 1933 Started by two brothers: Ernest
MAKING WINE WITH HIGH AND LOW PH JUICE. Ethan Brown New Mexico State University 11/11/2017
 MAKING WINE WITH HIGH AND LOW PH JUICE Ethan Brown New Mexico State University 11/11/2017 Overview How ph changes during winemaking Reds To adjust for high ph and how Whites Early harvest due to poor conditions
Chair J. De Clerck IV. Post Fermentation technologies in Special Beer productions Bottle conditioning: some side implications
 Chair J. De Clerck IV Post Fermentation technologies in Special Beer productions Bottle conditioning: some side implications Chair J. De Clerck XIV, september 14 Bottle conditioning: some side implications
Strategies for reducing alcohol concentration in wine
 Strategies for reducing alcohol concentration in wine Cristian Varela Senior Research Scientist Alcohol in Australian wine 2014 2005 Average 13.6% 14.5% Ethanol Godden et al. 2015 Why is alcohol increasing?
BLUEBERRY MUFFIN APPLICATION RESEARCH COMPARING THE FUNCTIONALITY OF EGGS TO EGG REPLACERS IN BLUEBERRY MUFFIN FORMULATIONS RESEARCH SUMMARY
 BLUEBERRY MUFFIN APPLICATION RESEARCH COMPARING THE FUNCTIONALITY OF EGGS TO EGG REPLACERS IN BLUEBERRY MUFFIN FORMULATIONS RESEARCH SUMMARY BLUEBERRY MUFFIN RESEARCH EXECUTIVE SUMMARY For this study,
TECHNICAL INFORMATION SHEET: CALCIUM CHLORIDE FLAKE - LIQUOR TREATMENT
 TECHNICAL INFORMATION SHEET: CALCIUM CHLORIDE FLAKE - LIQUOR TREATMENT PRODUCT NAME: CALCIUM CHLORIDE FLAKE PRODUCT CODE: CALCHLF COMMODITY CODE: 25201000 PACKAGING: 5 AND 25 KG Description Calcium Chloride
Monitoring Ripening for Harvest and Winemaking Decisions
 Joseph A. Fiola, Ph.D. Specialist in Viticulture and Small Fruit Western MD Research & Education Center 18330 Keedysville Road Keedysville, MD 21756-1104 301-432-2767 ext. 344; Fax 301-432-4089 jfiola@umd.edu
SIVCBD INTERNAL REGULATIONS VINIFICATION SPECIFICATIONS 2009
 SIVCBD INTERNAL REGULATIONS VINIFICATION SPECIFICATIONS Foreword The objective of the winegrowers of the S.I.V.C.B.D (international union of winegrowers practising biodynamic farming) is to produce a wine
Flavourings Legislation and Safety Assessment
 Flavourings Legislation and Safety Assessment Dr Iona Pratt, FSAI Food Improvement Agents Package (FIAP) Regulation 1331/2008 establishing a common authorisation procedure for additives, enzymes and flavourings
Introduction to MLF and biodiversity
 Introduction to MLF and biodiversity Maret du Toit DEPARTMENT OF VITICULTURE AND OENOLOGY INSTITUTE FOR WINE BIOTECHNOLOGY Stellenbosch University E-mail: mdt@sun.ac.za Microbiology of wine your perpsectives
Non-Microbial Off Aromas
 Non-Microbial Off Aromas Oxidation Prevention: Reduce oxygen exposure SO 2 Hyper-oxidation (for some whites) Control for metals (Cu, Fe) Enartis Pro FT, other thiols Control for oxidation of phenolic compounds
Introduction to the Practical Exam Stage 1. Presented by Amy Christine MW, DC Flynt MW, Adam Lapierre MW, Peter Marks MW
 Introduction to the Practical Exam Stage 1 Presented by Amy Christine MW, DC Flynt MW, Adam Lapierre MW, Peter Marks MW 2 Agenda Exam Structure How MW Practical Differs from Other Exams What You Must Know
MLF tool to reduce acidity and improve aroma under cool climate conditions
 MLF tool to reduce acidity and improve aroma under cool climate conditions Maret du Toit Lynn Engelbrecht, Elda Lerm, Doris Rauhut, Caroline Knoll and Sibylle Krieger-Weber Malolactic fermentation l Deacidification
QUALITY DESCRIPTOR / REPRESENTATIONS GUIDELINES FOR THE
 QUALITY DESCRIPTOR / REPRESENTATIONS GUIDELINES FOR THE AUSTRALIAN FRUIT JUICE INDUSTRY Adopted 30 September 2005 Reviewed 12 January 2007 CODE OF PRACTICE QUALITY DESCRIPTOR/REPRESENTATIONS GUIDELINES
Juice Microbiology and How it Impacts the Fermentation Process
 Juice Microbiology and How it Impacts the Fermentation Process Southern Oregon Wine Institute Harvest Seminar Series July 20, 2011 Dr. Richard DeScenzo ETS Laboratories Monitoring Juice Microbiology: Who
RESOLUTION OIV-OENO MONOGRAPH ON GLUTATHIONE
 RESOLUTION OIV-OENO 571-2017 MONOGRAPH ON GLUTATHIONE THE GENERAL ASSEMBLY, IN VIEW OF Article 2, paragraph 2 iv of the Agreement of 3 April 2001 establishing the International Organisation of Vine and
THE BREWING VALUE OF HOPS HOP & BREW SCHOOL A UG 29 S EPT 1, 2017, Y AKIMA
 THE BREWING VALUE OF HOPS HOP & BREW SCHOOL A UG 29 S EPT 1, 2017, Y AKIMA Introduction Hop research at De Proefbrouwerij The brewing value of hops Analysis Case studies Summary Take home messages 2 INTRODUCTION
Asian Journal of Food and Agro-Industry ISSN Available online at
 As. J. Food Ag-Ind. 2009, 2(02), 135-139 Research Paper Asian Journal of Food and Agro-Industry ISSN 1906-3040 Available online at www.ajofai.info Complex fruit wine produced from dual culture fermentation
CHAPTER 8. Sample Laboratory Experiments
 CHAPTER 8 Sample Laboratory Experiments 8.a Analytical Experiments without an External Reference Standard; Conformational Identification without Quantification. Jake Ginsbach CAUTION: Do not repeat this
YEAST STRAINS AND THEIR EFFECTS DURING FERMENTATION. Dr. Nichola Hall MN Grape Growers Association 2017 Cool Climate Conference February 17 th 2017
 YEAST STRAINS AND THEIR EFFECTS DURING FERMENTATION Dr. Nichola Hall MN Grape Growers Association 2017 Cool Climate Conference February 17 th 2017 OUTLINE Examine the yeast associated with the winemaking
Somchai Rice 1, Jacek A. Koziel 1, Anne Fennell 2 1
 Determination of aroma compounds in red wines made from early and late harvest Frontenac and Marquette grapes using aroma dilution analysis and simultaneous multidimensional gas chromatography mass spectrometry
CONCENTRATIONS PROFILES OF AROMA COMPOUNDS DURING WINEMAKING
 CONCENTRATIONS PROFILES OF AROMA COMPOUNDS DURING WINEMAKING Pavel Timár, Katarína Furdíková, Vladimír Báleš Faculty of Chemical and Food Technology, Slovak University of Technology, Bratislava, Slovakia
MALOLACTIC FERMENTATION QUESTIONS AND ANSWERS SESSION
 MALOLACTIC FERMENTATION QUESTIONS AND ANSWERS SESSION ML SCHOOL September 2016 University Stellenbosch QUESTIONS Why should I care about specific wine lactic acid bacteria? Why should I pay if MLF comes
A NEW APPROACH FOR ASSESSING
 5 TH YOUNG SCIENTISTS SYMPOSIUM IN MALTING, BREWING AND DISTILLING 21-23 APRIL 2016, CHICO, USA A NEW APPROACH FOR ASSESSING THE INTRINSIC ALDEHYDE CONTENT OF BEER Jessika De Clippeleer, Jeroen Baert,
Flavor and Aroma Biology
 benland-zakharov "Flavor & Aroma Biology" Flavor and Aroma Biology utline Introduction to our sensory system and the perception of flavor Florence Zakharov Department of Plant Sciences David benland USDA/ARS
Exploring microbial diversity :
 Exploring microbial diversity : Production of flavours using yeasts isolated from tropical fruits Thomas PETIT Interest in studying microbial diversity? What can we expect from microbial diversity? Potential
Identifying Wine Sensory Attributes. Dr. Renee Threlfall Research Scientist University of Arkansas
 Identifying Wine Sensory Attributes Dr. Renee Threlfall Research Scientist University of Arkansas Physiology of Sensory Human Senses Vision Touch Olfaction Trigeminal factors Taste Hearing Vision and Sensory
Virginie SOUBEYRAND**, Anne JULIEN**, and Jean-Marie SABLAYROLLES*
 SOUBEYRAND WINE ACTIVE DRIED YEAST REHYDRATION PAGE 1 OPTIMIZATION OF WINE ACTIVE DRY YEAST REHYDRATION: INFLUENCE OF THE REHYDRATION CONDITIONS ON THE RECOVERING FERMENTATIVE ACTIVITY OF DIFFERENT YEAST
Overview of Distilled Spirits Flavor Production and Evaluation of Their Characteristics with Selected Aroma Bottle Samples
 Overview of Distilled Spirits Flavor Production and Evaluation of Their Characteristics with Selected Aroma Bottle Samples Gary Spedding Brewing and Distilling Analytical Services, LLC With John Jeffery,
Predicting Wine Quality
 March 8, 2016 Ilker Karakasoglu Predicting Wine Quality Problem description: You have been retained as a statistical consultant for a wine co-operative, and have been asked to analyze these data. Each