SEASONAL IMPACTS OF CLIMATE ON TEA PRODUCTION IN SRILANKA DECEMBER 2017
|
|
|
- Dorthy Bishop
- 5 years ago
- Views:
Transcription


1 SEASONAL IMPACTS OF CLIMATE ON TEA PRODUCTION IN SRILANKA DECEMBER 2017 Partners: Foundation for Environment, Climate and Technology,Sri Lanka South Eastern University, Sri Lanka National Science and Technology commission, Sri Lanka Centre for Science and Technology of the Non-Aligned and Other Developing Countries (NAM S&T Centre)
2 Tropical Climate C/o Mahaweli Authority of Sri Lanka, Digana Village, Rajawella, Kandy, KY 20180, Sri Lanka Partners Foundation for Environment, Climate and Technology, Sri Lanka South Eastern University, Sri Lanka National Science and Technology commission, Sri Lanka Centre for Science and Technology of the Non Aligned and Other Developing Countries (NAM S&T Centre) Citation - Nijamdeen, A., Zubair, L., Dharmadasa, M., Najimuddin, N., P. and Malge, C. (2017). Seasonal Impact of Climate on Tea Production in Sri Lanka. International Roundtable on the Impact of Extreme Natural Events: Science and Technology for mitigation IRENE (pp.25). Sri Lanka: South Eastern University.
3 Content Presentation on Seasonal impacts of Climate on Tea Production in Sri Lanka Abstract of the International round table on the impact of extreme natural events (IRENE) science and Technology for Mitigation -Seasonal impacts of Climate on Tea Production in Sri Lanka The paper of the International round table on the impact of extreme natural events (IRENE) science and Technology for Mitigation -Seasonal impacts of Climate on Tea Production in Sri Lanka Introduction This document shows a presentation of the analysis of Seasonal impacts of Climate on Tea Production in Sri Lanka presented at the conference of the International roundtable on the impact of extreme natural events (IRENE) Science and Technology for Mitigation and latter section, the extended abstract of the Seasonal impacts of Climate on Tea Production in Sri Lanka.
4 Seasonal Impacts of Climate on Tea production in Sri Lanka Ashara Nijamdeen, Lareef Zubair, Madura Dharmadasa, Nushrath Najimuddin, Chalani Malge Foundation for Environment, Climate and Technology, Mahaweli Authority of Sri Lanka, Digana Village 1
5 Introduction Tea (Camillia Sinensis) has a rich history in Sri Lanka for 150 years Economically important (1.2 % Of GDP) and livelihoods for 600,000 Sri Lanka Tea fetches the highest prices because of its unique flavours. These flavours vary by region made distinctive because of unique climate Tea sector is faced with challenges Diminishing economic returns, Shortfalls in Labour, Fragmentation of Land, Soil Erosion and Challenges from Climate Variability, Change and Shocks Climate variability, change and shocks poses a threat to quality and the production system We report on initial work to understand these threats We seek to quantify the historical sensitivity of tea production climate starting with the impact of seasonality and inter-annual variation. 2
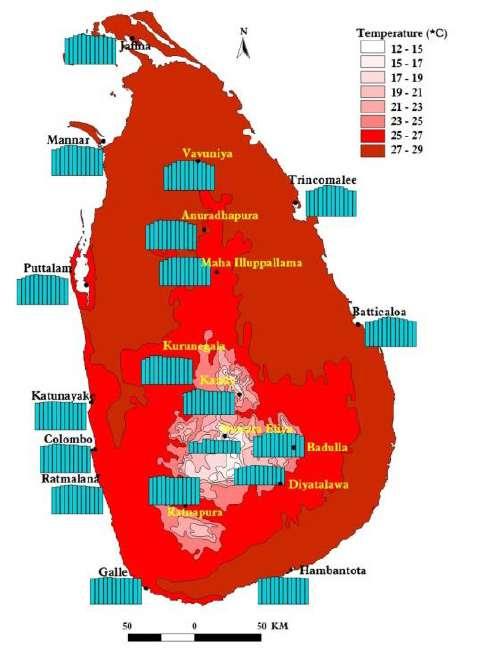
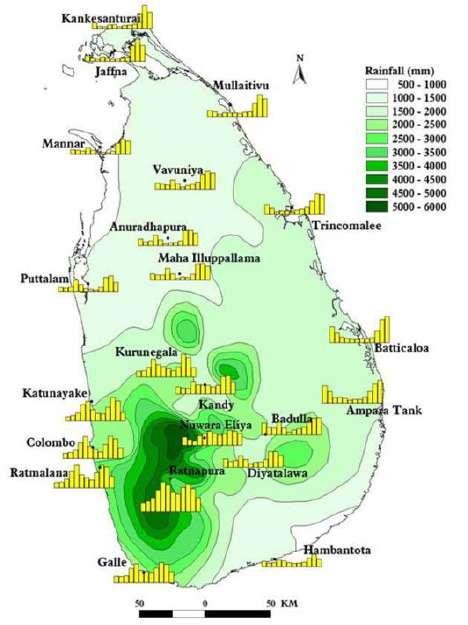
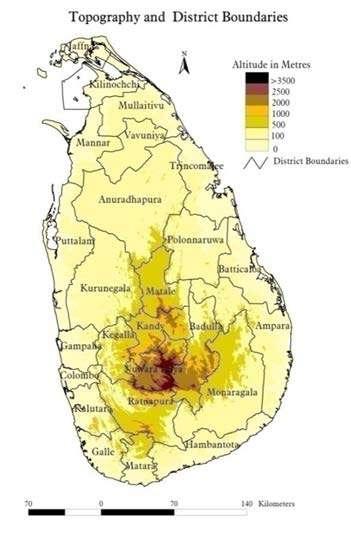
6 Topography, Climate, Environment, Tea Areas Topography Temperature Rainfall Tea areas

7 Economic importance of Tea for Sri Lanka Typical Share of the Global Production by Country Sri Lanka is one of the largest tea producer with a production of 317 million kg made tea in 2005 Sri Lankan tea fetches the highest price due to its unique flavor and aroma 4
8 Impact Climate change and variability on Tea Globally Sri Lanka Tea crop depends on air and soil temperature, rainfall, air saturation deficits, soil water, radiation, sunshine hours and evaporation (Carr, 1972,Stephens & Carr, 1991) Climate determines where a crop is grown and the potential yield; the actual yields obtained depend on the prevailing weather (Carr & Stephens 1992, Devanathan, 1975) 5
9 Objectives and Hypothesis Objectives Assess the seasonality of Tea production and its regional character Assess Seasonal impact of climate on tea production in Sri Lanka Identify seasonal relationship of climate with tea Assess sensitive seasons for climate influence on tea Hypothesis Climate is a critical factor in the production of tea Seasonality of production is influenced by that of climate Tea sensitivity to rainfall and temperature has seasonal variation Climate can predict some of the variance in Tea production 6
, Mid (Green) and High (Yellow)")
10 Aggregate Production in Sri Lanka (Black) and Regionally for Low (Red), Mid (Green) and High (Yellow) Grown Tea
11 Monthly Average of Production (Black), Rainfall (Blue), Maximum (Green) and Minimum Temperature (Red) 8


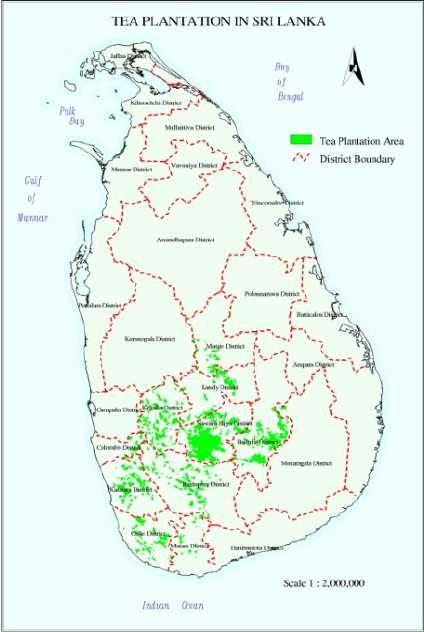
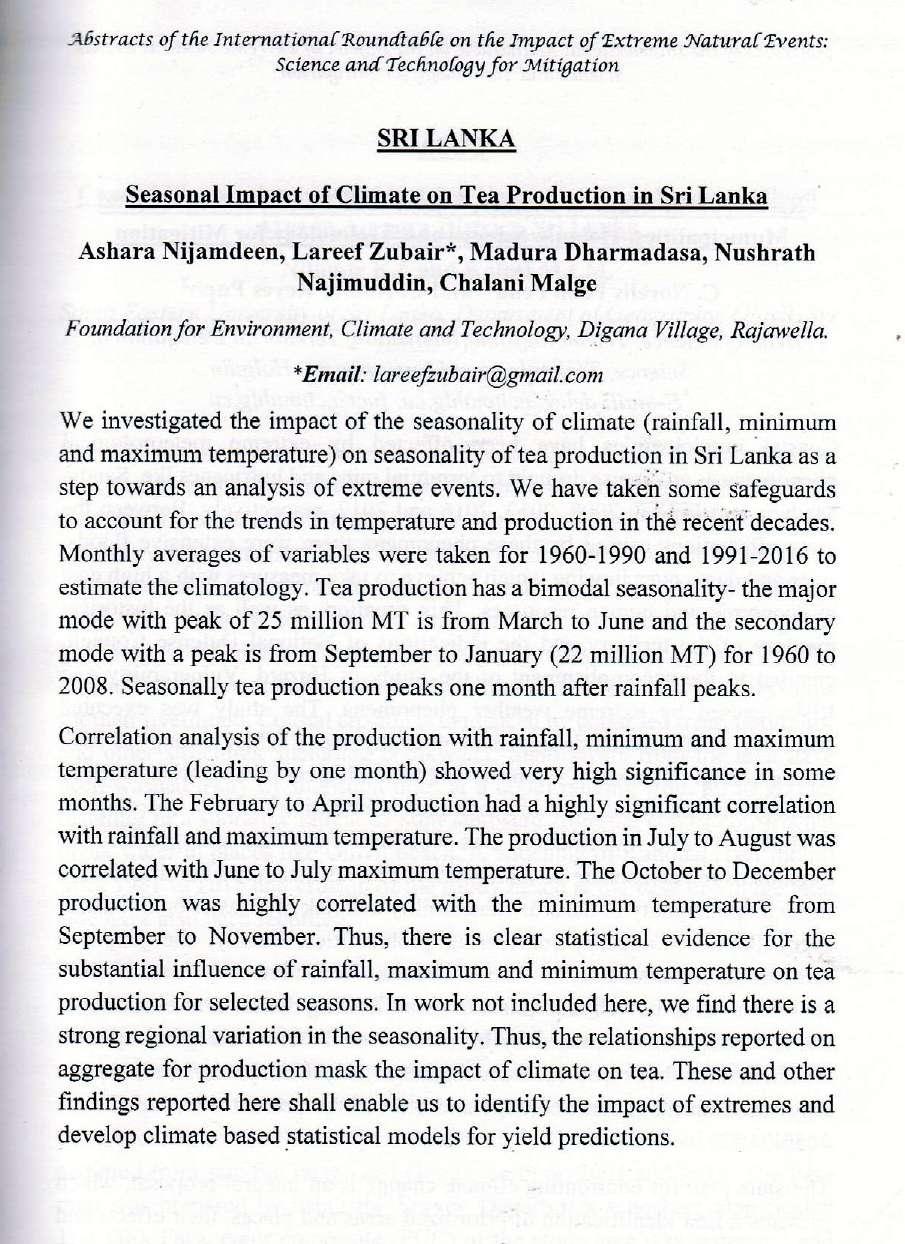
12 Geography and Regions Tea Growing Areas Seasonality of Production and Rainfall 9
 Spearman ranked correlation (r*) X- Seasonal tea production D-")

13 Correlation Analysis- Is a measure of relationships between two time series. Pearson Correlation(r) Spearman ranked correlation (r*) X- Seasonal tea production D- Difference between the ranks Y- Rainfall, Tmax, Tmin n- 30 years from 1960 to 1990 As there shall be a lag between the climate influence and its impacts on production, we have undertaken lag analysis from 1-6 months 10
14 Feb-Apr Mar- Apr Jun-Jul Aug- Sep Oct- Dec Identified Seasonal Relationships between Rainfall Production and Rainfall, Minimum and Maximum Temperature: Correlation (Blue) and Ranked Correlation (Red) Tmax Tmin 11
15 Conclusions 12 Seasonality of Production A clear bimodal seasonality of tea production the high production modes are from March to June and October to December. Seasonality of Climate in Relation to Production Seasonally peak tea production follows peak rainfall by one month Seasons with Consistent Climate Influence on Production Seasonally peak tea production follows peak rainfall by one month The February to May Rainfall is highly correlated with March to June Production The February to April Minimum Temperature is highly correlated with March to June Production There is an inverse lag relationship between Maximum Temperature and Production from March to April and a direct relation for October to November and June to July Production
16 Future Work Consider Solar Radiation, Humidity and Wind Consider Regional Differentiation Impact of Climate Change Better Observation Networks 13


17 Approach to asses the impacts of Climate change on Tea Plantation systems We focus on impacts on tea production, yield and quality and with a secondary focus on the impacts on Water Resources, Renewable Energy Supply, Health, Land Management, Logistics, Wildlife and Disaster Risk of the Plantation System We undertake research on the hill country areas with Tea Plantation initially and we shall focus on the estates that are under Dilmah engagement for detailed study 14


18 January 2000 onwards
19 THANK YOU! "Not often is it that men have the heart, when their one great industry is withered, to rear up in a few years another as rich to take its place; and the tea fields of Ceylon are as true a monument to courage as is the lion of Waterloo Sir Arthur Conan Doyle 16
20
21 Seasonal Impact of Climate on Tea Production in Sri Lanka Ashara Nijamdeen 1, Lareef Zubair 2*, Madura Dharmadasa 3, Nushrath Najimuddin 4, Chalani Malge 5 1,2,3,4, Foundation for Environment, Climate and Technology, Digana Village, Rajawella. *Corresponding Author: lareefzubair@gmail.com Abstract: We investigated the impact of the seasonality of climate (rainfall, minimum and maximum temperature) on seasonality of tea production in Sri Lanka as a step towards an analysis of extreme events. We have taken some safeguards to account for the trends in temperature and production in the recent decades. Monthly averages of variables were taken for and to estimate the climatology. Tea production has a bimodal seasonality- the major mode with peak of 25 million MT is from March to June and the secondary mode with a peak is from September to January (22 million MT) for 1960 to Seasonally tea production peaks one month after rainfall peaks. Correlation analysis of the production with rainfall, minimum and maximum temperature (leading by one month) showed very high significance in some months. The February to April production had a highly significant correlation with rainfall and maximum temperature. The production in July to August was correlated with June to July maximum temperature. The October to December production was highly correlated with the minimum temperature from September to November. Thus, there is clear statistical evidence for the substantial influence of rainfall, maximum and minimum temperature on tea production for selected seasons. In work not included here, we find there is a strong regional variation in the seasonality. Thus, the relationships reported on aggregate for production mask the impact of climate on tea. These and other findings reported here shall enable us to identify the impact of extremes and develop climate based statistical models for yield predictions. Keywords: Tea, Climate, Seasonality, Sri Lanka, Statistical Analysis, Climate Impact 1. Introduction Introduction to Tea in Sri Lanka: Tea (Camellia sinensis) is a perennial crop that contributes significantly to the economy of Sri Lanka. Sri Lanka produces tea throughout the year and the total tea production in 2005 has reached a record of million kilograms (Zoysa 2015). Tea plantations (Figure 1) are found in varying climatic conditions extending from low to high elevations exceeding 2000m (Wijeratne et al. 2011). The pioneer planters had observed the effect of the diverse climate in tea production. Ecophysiology of Tea focusing on climate: Tea crop depends on air and soil temperature, rainfall, air saturation deficits, soil water, radiation, sunshine hours and evaporation (Carr, 1972, Stephens & Carr, 1991). Fluctuations in the production of tea during the year are a well-documented phenomenon with both short-term Figure 1-The areas with tea cultivation
22 variations within a growing season (Fordham, 1970) and variation between seasons of the year (Barua, 1969; Squire, 1979). Climate determines where a crop is grown and the potential yield; the actual yields obtained depend on the prevailing weather (Carr & Stephens 1992, Devanathan, 1975). Changes in temperature, rainfall, and the occurrence of extreme weather events have adverse effects on Tea sector (Gunathilaka, 2017). Objective of the Research: We have studied the seasonal impact of climate on tea production in Sri Lanka based on seasonal differentiation of climate impacts mainly on analysis of the impacts of rainfall, minimum and maximum temperature. We have taken some safeguards to account for the trends in temperature and production in the recent decades. The role of climate is nuanced, and we need to consider the spatial aspect of both tea and climate production as well. 2. Materials and Methodology 2.1 Regionalization of Tea Growing Areas The tea regions are broadly grouped according to their elevations, with high grown above 1200m elevation, medium grown ranging between 600 m to 1200 m and low grown from sea level up to 600 m (SLTB 2010). Note, the allocation of data for the low, medium and high elevations are for large estates which span elevation tiers appear to be based on the location of the factory or office (Marby, 1972). 2.2 Data: Monthly data for production Statistics for tea production are available spanning the 150 years of large scale tea cultivation. Aggregate monthly production data was accessible at national scale (1960 to 2016), and by the 3 tier elevation zones (from 1970 onwards) and at district scale and tea district scale for shorter durations. Monthly Climate data To construct representative climate indices for the tea producing areas, we used monthly rainfall (Prcp), minimum and maximum temperature (Tmin and Tmax) data for Katugastota, NuwaraEliya, Diyatalawa, Bandarawela, Badulla, Ratnapura and Galle for These stations of the Department of Meteorology are reasonably well distributed in the tea producing areas. The Diyatalawa station was moved to neighboring Bandarawela in 1993 but since there is high correlation, we use their data in concatenation. Construction of climate indices Climate indices were constructed by averaging across all the stations. We have taken safeguards to account for trends in temperature and production in the recent decades. 2.3 Methodology: Climatology Averages of the climate and production were obtained for different periods from As there are significant trends for production and temperature after 1990, we have reported some of the results for In addition, we have checked that detrended analysis leads to similar conclusions. The IRI Data Library was used for the analysis ( Correlation Analysis We use Pearson correlation (r) to evaluate relations between production and climate variables. We have compared the reported results with Spearman ranked correlation (r*) so as to discount spurious results due to outliers. As there shall be a lag between the
23 climate influence and its impacts on production, we have undertaken lag analysis from 1-6 months. ( Identifications of consistent seasons After undertaking a month by month analysis with a lag of one month, we identified adjacent months with high correlations and with a consistent sign. We undertook further analysis for these seasons so as to unravel the largest climate influence. ( 3. Results and Discussion 3.1 Analysis Figure 2- Tea production for low, medium elevation and high elevation from 1960 to The mid country production has slightly declined after 1985; the low country production has increased three-fold after 1985 (5MT-15MT). (Figure 2) Seasonality Figure3- The monthly average tea production, rainfall, maximum and minimum temperature from 1960 to 2008.
24 The seasonality of production from 1960 to 2008 is bimodal with modes from March to June and from October to November and with lower production in February and July to September. Even in these months, the drop of the production is less than 25% of the total. The rainfall shows a bimodal seasonality with the major modes from October to November and the subsidiary mode from March to June. The seasonal high temperatures occur in March and April with the lows in the months of December to January. The difference across these months is around 6 0 C (figure 3). Rainfall peaks in relation to the tea production by our analysis has not shown why the peaks of March to May production are more than the October to December peak. This may be due to the reduced solar radiation and cloudiness Correlations between Production and Climate Month Rainfall Tmax Tmin r r* r-1 r r* r-1 r r* r-1 Jan Feb Mar Apr May Jun Jul Aug Sep Oct Nov Dec Table 1-Correlation(r), ranked correlation (r*), and lag correlation by a month (r-1) of Production with Rainfall, Tmax and Tmin from 1960 to Correlation at each significance level is show with a different font as 90% , 95% , 99% The correlation for rainfall and production is strongest in February and March and it shows greater significance for the February to April/May period if production lags rainfall by a month. Lagged correlations also show significance between August and September while November and December show opposing relationships. Correlation for Tmax and production is negatively stronger in March and April. It shows greater significance for March to May period if production lags Tmax by a month. The correlation shows a strong in June and October while lagged correlations show significance for July, November and December.
25 The correlation for Tmin and production is stronger in February and it shows greater significance for February to April period if production lags Tmin by a month. It also shows stronger correlations in June and October. (Table 1) Identification of Consistent Seasons for Rainfall and Tmin, Tmax impact We have tried to find relationships that are useable for modeling by seasons by considering periods with consistent climate influence on production. Below are results for analysis by such seasons as inferred from Table 1 (Table 2). Seasons Rainfall Tmax Tmin Feb-Apr 0.645(0.734) 0.561(0.611) Mar-Apr (-0.317) Jun-Jul 0.517(0.420) Aug-Sep 0.496(0.337) Oct-Dec 0.611(0.475) Table 2- Correlation (and ranked correlation) of seasonal production with Rainfall, maximum and minimum Temperature from Notation as in Table 1. Rainfall The rainfall for January to March shows a strong positive correlation with the production of February to April. The relationship between rainfalls in August to September with the rainfall from July to August is significant as well. (Table 2). Temperature Maximum Temperature (Tmax): The maximum temperature of February and March shows a negative correlation with March to April production. The maximum temperature from May to June has a positive correlation with production from June to July. The maximum temperature from September to November has a positive relationship with production from October to December. Minimum Temperature (Tmin): The minimum temperature in the months of January to March shows a positive correlation with the production in the months of February to April (Table 2). 4. Conclusion There are discernible climate impacts on tea production in Sri Lanka which is brought out by nuanced analysis. A month by month analysis of 30 years from and a separate analysis from shows the relationship between and production and climate variables (Rainfall, Tmin, Tmax) are highly significant in certain months with a month s lag. These significant correlations were retained with rank correlation showing a robust relationship. There are consistent seasons of climate influence on production (February to April, July to August, October to December) and the relationships for these seasons are skillful enough so that climate indices could be used in a predictive mode.
26 In work not reported here, we find there is strong regional variation on the seasonality of climate and its impact. Thus, the relationships reported on aggregate for production mask the impact of climate on tea. These findings shall enable us to identify the impact of extremes and develop climate based statistical models for production and yield predictions. References: Barua, D.N., Seasonal dormancy in tea (Camellia sinensis L.). Nature, 224, p.514. Carr MKV & Stephens W (1992), Climate, weather and the yield of tea, In, Tea Cultivation to consumption (Eds. KC Willson & MN Clifford) Chapman Hall, London, pp Carr, M. K. V. (1972) "The climatic requirements of the tea plant: A review." Experimental Agriculture 8, No. 1: Devanathan, M.A.V., The quantification of climatic constraints on plant growth. Tea Quarterly. 43 p.45. Fordham, R., Factors affecting tea yields in Malawi. Annual Report, Tea Research Foundation of Central Africa, Mulanje, Malawi, pp Marby, H., Tea in Ceylon: an attempt at a regional and temporal differentiation of the tea growing areas in Ceylon (Vol. 1). Franz Steiner Verlag. Gunathilaka, R.D., Smart, J.C. and Fleming, C.M., The impact of changing climate on perennial crops: the case of tea production in Sri Lanka. Climatic Change, 140(3-4), pp Squire, G.R., 1979.Weather, physiology and seasonality of tea (Camellia sinensis) yields in Malawi. Experimental Agriculture, 15(4), pp Sri Lanka Tea Board (SLTB), 2010, Annual Report, Colombo. Stephens, W. and Carr, M.K.V., Responses of tea (Camellia sinensis) to irrigation and fertilizer. II. Water use. Experimental Agriculture, 27(2), pp Wijeratne, M.A., Anandacoomaraswamy, A., Amarathunga, M.K.S.L.D., Ratnasiri, J., Basnayake, B.R.S.B. and Kalra, N., Assessment of impact of climate change on productivity of tea (Camellia sinensis L.) plantations in Sri Lanka. Journal of the National Science Foundation of Sri Lanka, 35(2). Zoysa, A. K. N. 2015, Hand Book on Tea. Tea Research Institute (TRI), Colombo.
Regression Models for Saffron Yields in Iran
 Regression Models for Saffron ields in Iran Sanaeinejad, S.H., Hosseini, S.N 1 Faculty of Agriculture, Ferdowsi University of Mashhad, Iran sanaei_h@yahoo.co.uk, nasir_nbm@yahoo.com, Abstract: Saffron
MONTHLY COFFEE MARKET REPORT
 1 E MONTHLY COFFEE MARKET REPORT March 2014 Ongoing uncertainty over the Brazilian coffee crop has caused significant fluctuations in coffee prices during March, with monthly volatility of the International
Coffee market ends 2017/18 in surplus
 Coffee market ends 217/18 in surplus World coffee production in coffee year 217/18 is estimated 5.7% higher at 164.81 million bags as output of Arabica increased by 2.2% to 11.82, and Robusta grew 11.7%
IMPACT OF RAINFALL AND TEMPERATURE ON TEA PRODUCTION IN UNDIVIDED SIVASAGAR DISTRICT
 International Journal of Agricultural Science and Research (IJASR) ISSN (P): 2250-0057; ISSN (E): 2321-0087 Vol. 8, Issue 1 Feb 2018, 51-56 TJPRC Pvt. Ltd. IMPACT OF RAINFALL AND TEMPERATURE ON TEA PRODUCTION
Record exports in coffee year 2017/18
 Record exports in coffee year 2017/18 Total coffee exports increased each year since 2010/11 with a new record reached in 2017/18 at 121.86 million bags, 2% higher than 2016/17. In the twelve months ending
Problem Set #3 Key. Forecasting
 Problem Set #3 Key Sonoma State University Business 581E Dr. Cuellar The data set bus581e_ps3.dta is a Stata data set containing annual sales (cases) and revenue from December 18, 2004 to April 2 2011.
Record Exports for Coffee Year 2016/17
 Record Exports for Coffee Year 2016/17 Total exports in September 2017 reached 8.34 million bags, compared to 9.8 million in September 2016. While coffee year 2016/17 registered a decrease in its final
QUARTERLY REVIEW OF THE PERFORMANCE OF THE DAIRY INDUSTRY 1
 QUARTERLY REVIEW OF THE PERFORMANCE OF THE DAIRY INDUSTRY 1 The information in this document is from sources deemed to be correct. Milk SA, the MPO and SAMPRO are not responsible for the results of any
Coffee market continues downward trend
 Coffee market continues downward trend Since August 2017, the ICO composite indicator price has declined in each month except January 2018. The composite indicator decreased by 1.1% in March 2018 to an
2018/19 expected to be the second year of surplus
 2018/19 expected to be the second year of surplus Coffee year 2018/19 is expected to be the second consecutive season of surplus, as global output, estimated at 167.47 million bags, exceeds world consumption,
Coffee market remains volatile but lacks direction
 Coffee market remains volatile but lacks direction Prices fluctuated significantly during August, with the ICO composite indicator dropping by 10 cents before jumping back up another 12 cents by the end
Downward correction as funds respond to increasingly positive supply outlook
 Downward correction as funds respond to increasingly positive supply outlook Coffee prices fell sharply at the end of April as institutional investors sold off their positions. The coffee market continues
Coffee market ends 2016/17 coffee year in deficit for the third consecutive year
 Coffee market ends 2016/17 coffee year in deficit for the third consecutive year The ICO composite indicator continued its downward trend that started at the end of August, averaging 124.46 US cents/lb.
Volatility returns to the coffee market as prices stay low
 Volatility returns to the coffee market as prices stay low Daily coffee prices hit their lowest level in 19 months during August, as commodity markets worldwide were negatively affected by currency movements
Coffee prices rose slightly in January 2019
 Coffee prices rose slightly in January 2019 In January 2019, the ICO composite indicator rose by 0.9% to 101.56 US cents/lb as prices for all group indicators increased. After starting at a low of 99.16
Coffee market settles lower amidst strong global exports
 Coffee market settles lower amidst strong global exports The ICO composite indicator price declined by 1.2% in February 2018 to an average of 114.19 US cents/lb. Indicator prices for all three Arabica
Prices for all coffee groups increased in May
 Prices for all coffee groups increased in May In May 2018, the ICO composite indicator increased by 0.7% to an average of 113.34 US cents/lb, following three months of declines. Prices for all coffee groups
Tea Production Mn Kg (2015 & 2016)
") 233 rd Experiments & Extension Forum Keynote Address I Sarath B Abeysinghe Director, Tea Research Institute Tea Production Mn Kg (2015 & 2016) Elevation 2016 2015 Change % Change High 64.40 75.53-11.13-14.73
233 rd Experiments & Extension Forum Keynote Address I Sarath B Abeysinghe Director, Tea Research Institute Tea Production Mn Kg (2015 & 2016) Elevation 2016 2015 Change % Change High 64.40 75.53-11.13-14.73
Seasonal trends in hectares planted, sales volumes on markets and market prices. Pieter van Zyl, Potatoes South Africa
 Seasonal trends in hectares planted, sales volumes on markets and market prices Pieter van Zyl, Potatoes South Africa Producers plant between 5 and 54 hectares of potatoes each year. According to Figure
MONTHLY COFFEE MARKET REPORT
 E MONTHLY COFFEE MARKET REPORT May 2014 After five consecutive months of rising prices, the coffee market reversed lower in May. From a high of 179 cents/lb in April, the daily price of the ICO composite
MONTHLY COFFEE MARKET REPORT
 E MONTHLY COFFEE MARKET REPORT February 2014 February 2014 has seen significant developments in the coffee market, with prices shooting upwards at a startling rate. The ICO composite daily price has increased
ECONOMICS OF COCONUT PRODUCTS AN ANALYTICAL STUDY. Coconut is an important tree crop with diverse end-uses, grown in many states of India.
 ECONOMICS OF COCONUT PRODUCTS AN ANALYTICAL STUDY Introduction Coconut is an important tree crop with diverse end-uses, grown in many states of India. Coconut palm is the benevolent provider of the basic
Growing divergence between Arabica and Robusta exports
 Growing divergence between Arabica and Robusta exports In April 218, the ICO composite indicator decreased by.4% to an average of 112.56, with the daily price ranging between 11.49 and 114.73. Prices for
Coffee prices maintain downward trend as 2015/16 production estimates show slight recovery
 Coffee prices maintain downward trend as 2015/16 production estimates show slight recovery The coffee market fell again in December 2015, reaching its second lowest monthly average of the year. This decrease
Mango Retail Performance Report 2017
 Mango Retail Performance Report 2017 1 Table of Contents Pages 3-9 Pages 10-15 Pages 16-34 Pages 35-44 Pages 45-51 Pages 52-54 Executive Summary Fruit and Tropical Fruit Performance Whole Mango Performance
World coffee consumption increases but prices still low
 World coffee consumption increases but prices still low The coffee market stabilised slightly in February, but prices remain at very low levels. A lack of news regarding fundamentals with expectations
Coffee Season 2013/14 Finishes in Balance but Deficit Expected Next Year
 Coffee Season 2013/14 Finishes in Balance but Deficit Expected Next Year Coffee prices were volatile again over the course of September, mostly reacting to weather news from Brazil. Daily prices fell initially
International Journal of Research and Review ISSN:
 International Journal of Research and Review www.gkpublication.in ISSN: 2349-9788 Original Research Article Trend and Forecasting of Sri Lankan Tea Production N. R. Abeynayake, W. H. E. B. P. Weerapura
Cultivation Pattern:
 Introduction: Cumin seed commonly know as Jeera (Cuminum cyminum) belongs to Apiacae family. Though Cumin is a native of Egypt, it now mostly produced in India. India is the largest producer and consumer
Vivekanandan, K. and G. D. Bandara. Forest Department, Rajamalwatta Road, Battaramulla, Sri Lanka.
 Vivekanandan, K. and G. D. Bandara. Forest Department, Rajamalwatta Road, Battaramulla, Sri Lanka. LEUCAENA SPECIES RESISTANCE TO PSYLLID (H ETERO PSYLLA CUBANA CRAWFORD) IN SRI LANKA Introduction. Giant
Price monitoring of key food items in Donetsk and Luhansk Oblasts
 Market update Issue (October ) UKRAINE Price monitoring of key food items in Donetsk and Luhansk Oblasts Fighting hunger worldwide Highlight Cost of food basket remained higher at national level throughout
WEEKLY MAIZE REPORT 30 OCTOBER 2018
 WEEKLY MAIZE REPORT 30 OCTOBER 2018 Unigrain (Pty) Ltd Tel. No. : +27 11 692 4400 Fax. No. : +27 11 412 1183 INTERNATIONAL MARKET Table 1: CME Maize prices and weekly changes (cents/bushel) Currently 23/10/2018
2007 Sonoma Research Associates - All rights reserved.
 2007 Sonoma Research Associates - All rights reserved. Practical Applications of the Price Elasticity of Demand Presented by Dan Karnowsky, President Sonoma Research Associates Presented at Competitive
Economic Role of Maize in Thailand
 Economic Role of Maize in Thailand Hnin Ei Win Center for Applied Economics Research Thailand INTRODUCTION Maize is an important agricultural product in Thailand which is being used for both food and feed
Statistics & Agric.Economics Deptt., Tocklai Experimental Station, Tea Research Association, Jorhat , Assam. ABSTRACT
 Two and a Bud 59(2):152-156, 2012 RESEARCH PAPER Global tea production and export trend with special reference to India Prasanna Kumar Bordoloi Statistics & Agric.Economics Deptt., Tocklai Experimental
Coffee market recovers slightly from December slump
 Coffee market recovers slightly from December slump After reaching its lowest level in 22 months in December 2017, the monthly average of the ICO composite indicator price increased by 1.4% to 115.60 US
Overview of the Manganese Industry
 39th Annual Conference Istanbul, Turkey 2013 Overview of the Manganese Industry International Manganese Institute Alberto Saavedra Market Research Manager June, 2013 Introduction Global Production Supply,
July marks another month of continuous low prices
 July marks another month of continuous low prices In July 2018, the ICO composite indicator price decreased by 2.9% to an average of 107.20 US cents/lb, which is the lowest monthly average for July since
WEEKLY OILSEED REPORT 31 OCTOBER 2018
 WEEKLY OILSEED REPORT 31 OCTOBER 218 Unigrain (Pty) Ltd Tel. No. : +27 11 692 44 Fax. No. : +27 11 412 1183 INTERNATIONAL MARKET Table 1: CME Soybean prices and weekly change (cents/bushel) Currently 24/1/218
MONTHLY COFFEE MARKET REPORT
 E MONTHLY COFFEE MARKET REPORT June 2013 Coffee prices fell sharply in June 2013, as market fundamentals, combined with an uncertain macroeconomic outlook, drove the ICO composite indicator price to its
THIS REPORT CONTAINS ASSESSMENTS OF COMMODITY AND TRADE ISSUES MADE BY USDA STAFF AND NOT NECESSARILY STATEMENTS OF OFFICIAL U.S.
 THIS REPORT CONTAINS ASSESSMENTS OF COMMODITY AND TRADE ISSUES MADE BY USDA STAFF AND NOT NECESSARILY STATEMENTS OF OFFICIAL U.S. GOVERNMENT POLICY Required Report - public distribution Date: GAIN Report
For personal use only
 SEPTEMBER 216 GLOBAL DAIRY UPDATE European milk production has decreased for the first time since early 215, with volumes in June down 2 compared to last year. Last week we announced our annual results,
Comparing canola and lupin varieties by time of sowing in the Northern Agricultural Region
 Comparing canola and lupin varieties by time of sowing in the Northern Agricultural Region Martin Harries and Greg Shea, DPIRD Key messages Lupin yielded 3.0 t/ha and canola 2.0 t/ha from late May emergence.
Pinto and Great Northern Bean Prices: Historical Trends and Seasonal Patterns
 EXTENSION EC825 Pinto and Great Northern Bean Prices: Historical Trends and Seasonal Patterns Jessica J. Johnson Extension Educator-Agricultural Economics Cover photo by David Ostdiek 2 The Board of Regents
Economic Losses from Pollution Closure of Clam Harvesting Areas in Machias Bay
 Economic Losses from Pollution Closure of Clam Harvesting Areas in Machias Bay Kevin Athearn, Ph.D. University of Maine at Machias June 8, 2012 Tora Johnson (UMM) and Brian Beal (UMM) assisted with this
ANALYSIS OF THE EVOLUTION AND DISTRIBUTION OF MAIZE CULTIVATED AREA AND PRODUCTION IN ROMANIA
 ANALYSIS OF THE EVOLUTION AND DISTRIBUTION OF MAIZE CULTIVATED AREA AND PRODUCTION IN ROMANIA Agatha POPESCU University of Agricultural Sciences and Veterinary Medicine, Bucharest, 59 Marasti, District
MANGO PERFORMANCE BENCHMARK REPORT
 MANGO PERFORMANCE BENCHMARK REPORT 2015-2016 TABLE OF CONTENTS Page 3 Page 5 Page 12 Page 15 Page 27 Page 36 Page 46 Approach and Data Set Parameters Overview and Mango Trend-Spotting Fruit and Tropical
GLOBAL DAIRY UPDATE KEY DATES MARCH 2017
 MARCH 2017 GLOBAL DAIRY UPDATE European milk production decreased for the seventh consecutive month, while the US remains strong. The rate of decline in New Zealand production is easing. US exports continue
Coffee market ends 2014 at ten month low
 Coffee market ends 2014 at ten month low Coffee prices continued to slide downwards in December 2014, with the monthly average of the ICO composite indicator at its lowest level since February. Recent
MARKET ANALYSIS REPORT NO 1 OF 2015: TABLE GRAPES
 MARKET ANALYSIS REPORT NO 1 OF 215: TABLE GRAPES 1. INTRODUCTION The following text is a review of the table grapes marketing environment. This analysis is updated on a quarterly 1 basis. The interval
WEEKLY OILSEED REPORT 27 JUNE 2018
 WEEKLY OILSEED REPORT 27 JUNE 218 Unigrain (Pty) Ltd Tel. No. : +27 11 692 44 Fax. No. : +27 11 412 1183 INTERNATIONAL MARKET Table 1: CME Soybean prices and weekly change (cents/bushel) Currently 2/6/218
A Climate for Sauvignon Blanc: Lake County
 A Climate for Sauvignon Blanc: Lake County Viala et al (1901) Traite General de Viticulture Gregory V. Jones Director: Center for Wine Education Professor: Wine Studies & Environmental Studies Lake County,
MONTHLY COFFEE MARKET REPORT
 E MONTHLY COFFEE MARKET REPORT December 2011 In December 2011 Arabica prices underwent significant downward corrections while Robusta prices increased slightly. The average of the 2 nd and 3 rd positions
WALNUT HEDGEROW PRUNING AND TRAINING TRIAL 2010
 WALNUT HEDGEROW PRUNING AND TRAINING TRIAL 2010 Carolyn DeBuse, John Edstrom, Janine Hasey, and Bruce Lampinen ABSTRACT Hedgerow walnut orchards have been studied since the 1970s as a high density system
WEEKLY MAIZE REPORT 28 NOVEMBER 2018
 WEEKLY MAIZE REPORT 28 NOVEMBER 2018 Unigrain (Pty) Ltd Tel. No. : +27 11 692 4400 Fax. No. : +27 11 412 1183 INTERNATIONAL MARKET Table 1: CME Maize prices and weekly changes (cents/bushel) Currently
Coffee weather report November 10, 2017.
 Coffee weather report November 10, 2017. awhere, Inc., an agricultural intelligence company, is pleased to provide this map-and-chart heavy report focused on the current coffee crop in Brazil. Global stocks
Soft Commodity Markets - Upcoming Milestones, and How the Market Could Be Affected
 Soft Commodity Markets - Upcoming Milestones, and How the Market Could Be Affected September 15, 2014 Judith Ganes President J. Ganes Consulting, LLC Weather & Politics Current Weather Expectations El
Sugar scenario in CIS countries:
 Sugar scenario in CIS countries: on the way to self-sufficiency Andrey Bodin Eurasian Sugar Association Commonwealth of Independent States (CIS) consists of 11 countries CIS Moldova Belarus Population
INDUSTRY CAPABILITY REPORT SPICE & ALLIED PRODUCT SECTOR
 INDUSTRY CAPABILITY REPORT SPICE & ALLIED PRODUCT SECTOR Prepared by: Export Development Board (EDB), Sri Lanka June, 2017 Contents 1. INTRODUCTION... 3 2. TYPE OF PLAYERS... 3 3. SUPPORT INSTITUTIONS...
EFFECT OF DIFFERENT PRUNING TIMES ON THE YIELD OF TEA (Camellia sinensis L.) UNDER THE CLIMATIC CONDITIONS OF MANSEHRA-PAKISTAN
 UNDER THE CLIMATIC CONDITIONS OF MANSEHRA-PAKISTAN") EFFECT OF DIFFERENT PRUNING TIMES ON THE YIELD OF TEA (Camellia sinensis L.) UNDER THE CLIMATIC CONDITIONS OF MANSEHRA-PAKISTAN FAYAZ AHMAD 1, FARRUKH SIYAR HAMID 1*, SAIR SARWAR 2, ABDUL WAHEED 1, SOHAIL
EFFECT OF DIFFERENT PRUNING TIMES ON THE YIELD OF TEA (Camellia sinensis L.) UNDER THE CLIMATIC CONDITIONS OF MANSEHRA-PAKISTAN FAYAZ AHMAD 1, FARRUKH SIYAR HAMID 1*, SAIR SARWAR 2, ABDUL WAHEED 1, SOHAIL
The Development of a Weather-based Crop Disaster Program
 The Development of a Weather-based Crop Disaster Program Eric Belasco Montana State University 2016 SCC-76 Conference Pensacola, FL March 19, 2016. Belasco March 2016 1 / 18 Motivation Recent efforts to
WEEKLY OILSEED REPORT 22 NOVEMBER 2018
 WEEKLY OILSEED REPORT 22 NOVEMBER 2018 Unigrain (Pty) Ltd Tel. No. : +27 11 692 4400 Fax. No. : +27 11 412 1183 INTERNATIONAL MARKET Table 1: CME Soybean prices and weekly change (cents/bushel) Currently
Advanced Paper 1: Markets and how they work. Sample assessment materials for first teaching September 2015 Time: 2 hours
 Write your name here Surname Other names Pearson Edexcel Level 3 GCE Centre Number Economics B Advanced Paper 1: Markets and how they work Candidate Number Sample assessment materials for first teaching
MONTHLY COFFEE MARKET REPORT
 E MONTHLY COFFEE MARKET REPORT July 2012 Coffee prices rebounded in July 2012, with the ICO composite indicator increasing by 9.5% compared to June, following nine consecutive months of price falls. The
Double Crop Soybean Production System The Syngenta Story SW Ontario REWARD VS REAL RISK
 Double Crop Soybean Production System The Syngenta Story SW Ontario REWARD VS REAL RISK Syngenta Canada Eric Richter, C.C.A., ASR February 10th, 2016 - Illinois Soybean Association Double Crop Soys Mt
Record exports from Brazil weigh heavy on the coffee market
 Record exports from Brazil weigh heavy on the coffee market Coffee exports from Brazil reached a record high of 36.8 million bags in crop year 2014/15 (April to March), fuelled by domestic stocks and encouraged
WEEKLY MAIZE REPORT 13 JUNE 2018
 17/08/01 17/08/15 17/08/29 17/09/12 17/09/26 17/10/10 17/10/24 17/11/07 17/11/21 17/12/05 17/12/19 18/01/02 18/01/16 18/01/30 18/02/13 18/02/27 18/03/13 18/03/27 18/04/10 18/04/24 18/05/08 18/05/22 18/06/05
Strawberry Production & Supply
 Trends in North American Strawberry Production & Supply by Tom Sjulin, Consultant Presented at the International Strawberry Congress Antwerp, Belgium 1 September 2010 1 Objectives Review North American
TURKEY ICAC RESEARCH ASSOCIATE PROGRAM 6-16 APRIL 2009 WASHINGTON D.C./USA SOME FACTS ABOUT SOME FACTS ABOUT SOME FACTS ABOUT
 ICAC RESEARCH ASSOCIATE PROGRAM TURKEY - Geographically, Turkey straddles two continents, Europe in the west and Asia in the east. - The two continents are divided by Istanbul and Dardanelles straits.
Networkers Business Update. December 2014
 Networkers Business Update December 2014 Agenda Forecast Milk Price Global markets V3 Strategy Growing our share of New Zealand milk Page 2 Forecast Milk Price 110 100 2012/13 2013/14 2014/15 Forecast
WEEKLY MAIZE REPORT 06 FEBRUARY 2019
 WEEKLY MAIZE REPORT 06 FEBRUARY 2019 Unigrain (Pty) Ltd Tel. No. : +27 11 692 4400 Fax. No. : +27 11 412 1183 INTERNATIONAL MARKET Table 1: CME Maize prices and weekly changes (cents/bushel) Currently
Composition and Value of Loin Primals
 Composition and Value of Loin Primals Tom J. Baas, Ph.D. Iowa State University Pork producers today are interested in adding value over and above traditional commodity markets to the hogs they produce
World of sugar PAGE 54
 World of sugar More than 1 countries produce sugar, about 8% of which is made from sugar cane grown primarily in the tropical and sub-tropical zones of the southern hemisphere, and the balance from sugar
QUARTELY MAIZE MARKET ANALYSIS & OUTLOOK BULLETIN 1 OF 2015
 QUARTELY MAIZE MARKET ANALYSIS & OUTLOOK BULLETIN 1 OF 2015 INTRODUCTION The following discussion is a review of the maize market environment. The analysis is updated on a quarterly 1 basis and the interval
Agriculture and Food Authority
 Agriculture and Food Authority Presentation by: SOLOMON ODERA Interim Head of Sugar Directorate Agriculture and Food Authority November, 2017 KENYA SUGARCANE INDUSTRY OUTLINE 1) Introduction 2) Kenyan
Problem Set #15 Key. Measuring the Effects of Promotion II
 Problem Set #15 Key Sonoma State University Business 580-Business Intelligence Dr. Cuellar Measuring the Effects of Promotion II 1. For Total Wine Sales Using a Non-Promoted Price of $9 and a Promoted
Leaf Development and Expansion in Tea [Camellia sinensis (L.) Kuntze] and their Relationships with Thermal Time: A Case Study
![Leaf Development and Expansion in Tea [Camellia sinensis (L.) Kuntze] and their Relationships with Thermal Time: A Case Study](/thumbs/76/74247038.jpg "Leaf Development and Expansion in Tea [Camellia sinensis (L.) Kuntze] and their Relationships with Thermal Time: A Case Study") Tropical Agricultural Research Vol. 25 (4): 450 459 (2014) Leaf Development and Expansion in Tea [Camellia sinensis (L.) Kuntze] and their Relationships with Thermal Time: A Case Study H.A.S.L. Jayasinghe
Tropical Agricultural Research Vol. 25 (4): 450 459 (2014) Leaf Development and Expansion in Tea [Camellia sinensis (L.) Kuntze] and their Relationships with Thermal Time: A Case Study H.A.S.L. Jayasinghe
WEEKLY MAIZE REPORT 11 JULY 2018
 28 29 21 211 212 213 214 215 216 217 218 WEEKLY MAIZE REPORT 11 JULY 218 Unigrain (Pty) Ltd Tel. No. : +27 11 692 44 Fax. No. : +27 11 412 1183 INTERNATIONAL MARKET Table 1: CME Maize prices and weekly
UPPER MIDWEST MARKETING AREA THE BUTTER MARKET AND BEYOND
 UPPER MIDWEST MARKETING AREA THE BUTTER MARKET 1987-2000 AND BEYOND STAFF PAPER 00-01 Prepared by: Henry H. Schaefer July 2000 Federal Milk Market Administrator s Office 4570 West 77th Street Suite 210
Dairy Outlook. December By Jim Dunn Professor of Agricultural Economics, Penn State University. Market Psychology
 Dairy Outlook December 2015 By Jim Dunn Professor of Agricultural Economics, Penn State University Market Psychology The Class III market has taken a beating lately as cheese prices have drifted down and
PRODUCTION AND EXPORT PERFORMANCE OF CARDAMOM IN INDIA
 PRODUCTION AND EXPORT PERFORMANCE OF CARDAMOM IN INDIA Dr.R.Govindasamy Guest Lecturer, Department of Economics, Bharathiar University, Coimbatore Abstract Cardamom is generally produced in the tropical
THIS REPORT CONTAINS ASSESSMENTS OF COMMODITY AND TRADE ISSUES MADE BY USDA STAFF AND NOT NECESSARILY STATEMENTS OF OFFICIAL U.S.
 THIS REPORT CONTAINS ASSESSMENTS OF COMMODITY AND TRADE ISSUES MADE BY USDA STAFF AND NOT NECESSARILY STATEMENTS OF OFFICIAL U.S. GOVERNMENT POLICY Required Report - public distribution Date: GAIN Report
Milk and Milk Products: Price and Trade Update
 Milk and Milk Products: Price and Trade Update June 217 * International dairy prices The FAO Dairy Price Index averaged 29 points in June, up 16 points (8.3 percent) from January 217 and 71 points (51.5
MARKETING TRENDS FOR COCONUT PRODUCTS IN SRI LANKA
 ,'6 b l\o L( cl/\r!y ~?\ 1IJ7'X ~.fsool- CR Cc~~ ~t).> MARKETING TRENDS FOR COCONUT PRODUCTS IN SRI LANKA 1950-1981 By Sunil Chandra ~~nnapperuma B.A. (Ceylon) A dissertation submitted in partial fulfilment
The Changing Landscape of Dairy: A Regional Outlook. Mark Stephenson Director of Dairy Policy Analysis
 The Changing Landscape of Dairy: A Regional Outlook Mark Stephenson Director of Dairy Policy Analysis Millions of Pounds Let s remember when 32,000 30,000 28,000 Wisconsin Annual Milk Production It s the
PERFORMANCE OF HYBRID AND SYNTHETIC VARIETIES OF SUNFLOWER GROWN UNDER DIFFERENT LEVELS OF INPUT
 Suranaree J. Sci. Technol. Vol. 19 No. 2; April - June 2012 105 PERFORMANCE OF HYBRID AND SYNTHETIC VARIETIES OF SUNFLOWER GROWN UNDER DIFFERENT LEVELS OF INPUT Theerachai Chieochansilp 1*, Thitiporn Machikowa
MGEX Spring Wheat 2013
 MGEX Spring Wheat 213 The Minneapolis Grain Exchange, Inc. (MGEX) has been the principal market for hard red spring (HRS) wheat since 1881, offering futures and options contracts based on this unique commodity.
Joseph G. Alfieri 1, William P. Kustas 1, John H. Prueger 2, Lynn G. McKee 1, Feng Gao 1 Lawrence E. Hipps 3, Sebastian Los 3
 Joseph G. Alfieri 1, William P. Kustas 1, John H. Prueger 2, Lynn G. McKee 1, Feng Gao 1 Lawrence E. Hipps 3, Sebastian Los 3 1 USDA, ARS, Hydrology & Remote Sensing Lab, Beltsville MD 2 USDA,ARS, National
Fresh Produce Report. P13: 12 w/e 3rd January Kantar Worldpanel
 Fresh Produce Report P13: 12 w/e 3rd January 2016 1 HOW IS TOTAL PRODUCE PERFORMING? Total Produce is worth 2.1bn and is growing by 4.1% compared to the same period last year. Much of this is driven by
Dairy Market. Overview. Commercial Use of Dairy Products
 Dairy Market Dairy Management Inc. R E P O R T Volume 21 No. 6 June 2018 DMI NMPF Overview U.S. dairy markets received a one-two punch during the first weeks of June in the form of collateral damage from
Plant root activity is limited to the soil bulbs Does not require technical expertise to. wetted by the water bottle emitter implement
 Case Study Bottle Drip Irrigation Case Study Background Data Tool Category: Adaptation on the farm Variety: Robusta Climatic Hazard: Prolonged dry spells and high temperatures Expected Outcome: Improved
Vintage 2006: Umpqua Valley Reference Vineyard Report
 Vintage 2006: Umpqua Valley Reference Vineyard Report Summary: The 2006 vintage started off slow with a cool, wet spring and was followed by a largely climatically favorable growing season. The summer
THIS REPORT CONTAINS ASSESSMENTS OF COMMODITY AND TRADE ISSUES MADE BY USDA STAFF AND NOT NECESSARILY STATEMENTS OF OFFICIAL U.S.
 THIS REPORT CONTAINS ASSESSMENTS OF COMMODITY AND TRADE ISSUES MADE BY USDA STAFF AND NOT NECESSARILY STATEMENTS OF OFFICIAL U.S. GOVERNMENT POLICY Required Report - public distribution Date: GAIN Report
Structures of Life. Investigation 1: Origin of Seeds. Big Question: 3 rd Science Notebook. Name:
 3 rd Science Notebook Structures of Life Investigation 1: Origin of Seeds Name: Big Question: What are the properties of seeds and how does water affect them? 1 Alignment with New York State Science Standards
Brazil. Citrus Semi-annual. Fresh Oranges and Orange Juice
 THIS REPORT CONTAINS ASSESSMENTS OF COMMODITY AND TRADE ISSUES MADE BY USDA STAFF AND NOT NECESSARILY STATEMENTS OF OFFICIAL U.S. GOVERNMENT POLICY Required Report - public distribution Date: GAIN Report
Washington State Wine 101
 Washington State Wine 101 Washington 2 nd Largest Producer in US Washington State produces: Premium wines of superior quality Range of varieties Distinctive character Unique balance of Old World and New
Grapevine Cold Hardiness And Injury: Dynamics and Management
 Grapevine Cold Hardiness And Injury: Dynamics and Management Dr. Robert Wample California State University- Fresno Low Temperature Tolerance Vs Avoidance Tolerance Supercooling Avoidance (?)(Permanent
India. Oilseeds and Products Update. August 2012
 THIS REPORT CONTAINS ASSESSMENTS OF COMMODITY AND TRADE ISSUES MADE BY STAFF AND NOT NECESSARILY STATEMENTS OF OFFICIAL U.S. GOVERNMENT POLICY Required Report - public distribution Oilseeds and Products
Research Report: Use of Geotextiles to Reduce Freeze Injury in Ontario Vineyards
 Research Report: Use of Geotextiles to Reduce Freeze Injury in Ontario Vineyards Prepared by Dr. Jim Willwerth CCOVI, Brock University February 26, 20 1 Cool Climate Oenology & Viticulture Institute Brock
Improving Capacity for Crime Repor3ng: Data Quality and Imputa3on Methods Using State Incident- Based Repor3ng System Data
 Improving Capacity for Crime Repor3ng: Data Quality and Imputa3on Methods Using State Incident- Based Repor3ng System Data July 31, 2014 Justice Research and Statistics Association 720 7th Street, NW,