3 rd Quarter & 9 Months 2014 Financial Results 10 November 2014
|
|
|
- Amie Briggs
- 5 years ago
- Views:
Transcription

1 3 rd Quarter & 9 Months 2014 Financial Results 10 November 2014
2 Disclaimer The presentation is prepared by Super Group Ltd ( Super or the Group ) and is solely for the purpose of corporate communication and general reference only. The presentation is not intended as an offer to sell, or to solicit an offer to buy or to form any basis of investment decision for any class of securities of the Group in any jurisdiction. All such information should not be used or relied on without professional advice. The presentation is a brief summary in nature and does not purport to be a complete description of the Group, its business, its current or historical operating results or its future business prospects. The statements are not and should not be construed as management s representation on the future performance of Super. Our forward-looking statements involve risks and uncertainties, many of which are beyond our control, and important factors that could cause actual results to differ materially from those in the forward-looking statements include, but are not limited to, increased competition, pricing actions, continued volatility in commodity costs, increased costs of sales, risks from operating globally and tax law changes. This presentation is provided without any warranty or representation of any kind, either expressed or implied. The Group specifically disclaim all responsibilities in respect of any use or reliance of any information, whether financial or otherwise, contained in this presentation. 2
3 Content Performance Summary 3Q14 Segmental Review Strategy & Outlook Our 3-pronged growth strategy Outlook: Focus on product innovation to drive growth Appendix Financial Snapshot Balance Sheet Highlights BC: Our Top Brands and Product Ranges BC: Our Product Offerings FI Production Capacities 3
4 A challenging 3 rd quarter Amid cost pressures and stiffer competition A transitional period for the Group - Continuing branding initiatives for Branded Consumer ( BC ) business and premiumisation of Food Ingredients ( FI ) business Sales decreased marginally to S$129.5m - BC sales dipped 6% Year on Year ( YoY ) to S$82.0m - FI sales rose 3% YoY to S$47.5m Net profit dropped to S$10.5m - Cost pressures, particularly palm kernel oil - Higher effective tax rate Strong balance sheet - Cash and cash equivalents of S$77.4m - NAV per share at cents 4
 dropped 5ppt Cost pressures, particularly palm kernel oil Higher composition of FI sales, which carry lower GPM Higher selling and distribution expenses (3Q14: 12%;")
5 3Q14 Results Summary Cost pressures affected profitability Sales S$129.5m Operating Profit S$12.0m 3% 45% BC sales 6% to S$82.0m FI sales 3% to S$47.5m Gross profit margin ( GPM ) dropped 5ppt Cost pressures, particularly palm kernel oil Higher composition of FI sales, which carry lower GPM Higher selling and distribution expenses (3Q14: 12%; 3Q13: 11%) Marketing campaigns eg. Thailand, Malaysia. Higher general and administrative expenses (3Q14: S$14.3m; 3Q13: S$13.0m) Deferred gain amortization of S$0.8m per quarter ended in FY13 Higher depreciation expense Net Profit Higher effective tax rate (3Q14: 20%; 3Q13: 8%) S$10.5m EPS 0.89 cents 46% Expiry of an overseas subsidiary s tax incentive Write-back of overprovision of tax in 3Q13 5
6 Segmental Review BC continues to be the major revenue contributor Super s integrated business model Downstream Upstream BC segment BC accounts for 63% of sales (3Q13: 65%) FI segment FI accounts for 37% of sales (3Q13: 35%) 3Q14 Sales (S$'000) 3Q13 Sales (S$'000) 47,475, 37% BC Sales FI Sales 46,105, 35% 82,026, 63% 86,888, 65% 6
7 BC: Signs of recovery in certain core markets Some core markets recovered despite lower overall BC sales Coffee continued to be the major revenue contributor at 79%, followed by Cereal at 9% Continue to focus on product innovation to drive growth Sales by Product Category (S$m) (12%) (9%) (79%) 68.0 (14%) (8%) (78%) Others* Cereal Coffee 3Q14 3Q13 * Include cup noodles, potato chips and tea products 7
8 BC: Geographical Segment Review Southeast Asia Thailand, Myanmar and Malaysia sales improved Sales for Singapore dipped mainly due to teething issues relating to relocation of Singapore packaging plant to Malaysia in July 2014 Philippines sales affected by the delisting of non-performing products East Asia China s sales were lower YoY as last year s sales were lifted by a new product launch in 3Q13 Others Factory relocation affected sales to export markets such as Mongolia, Maldives, Pacific Islands and Middle East etc Sales by Geographical Area (S$m) (6%) (6%) (8%) (8%) Others* (88%) (84%) East Asia Southeast Asia 3Q14 3Q13 ** Include Europe, Middle East, Africa, Oceania, North and South America markets 8
9 FI: Boosted by higher sales Sales rose 3% to S$47.5m driven by higher Non-dairy Creamer ( NDC ) sales 3Q14: Soluble Coffee Powder ( SCP ) and NDC continue to be main revenue contributor Plans to roll-out premium products such as Botanical Herbal Extracts ( BHE ) and Nutritional Oil Powders ( NOP ) and value-add existing products to drive growth Sales by Product Category (S$m) (77%) (23%) 15.0 (67%) (33%) Others* Non-dairy Creamer Soluble Coffee Powder 3Q14 3Q13 * Include malt cereals, tea and other products 9
10 FI: Geographical Segment review Southeast Asia YoY increase in sales boosted by Philippines East Asia China and Taiwan sales improved Sales by Geographical Area (S$m) (54%) 24.2 (3%) (53%) Others** Southeast Asia East Asia (46%) (44%) 3Q14 3Q13 ** Include Europe, Middle East, Africa, Oceania, North and South America markets 10


11 Growth Strategy BC Core FI Complementary FI BC Branding Branding Innovation Overseas Expansion Enhancing Manufacturing Capabilities Botanical Herbal Extracts Liquid Glucose Syrup Solids Nutritional Oil Powders Innovation BC: Premiumisation of existing product portfolio BC: New product launches FI: Roll out more premium, higher value-added products such as BHE Streamlined Portfolio Rationalisation of SKUs Focus on revenue drivers Deepen Core Markets & Establish New Markets Enhance brand presence Extend category depth & penetration Enlarge consumer base 11
12 Outlook: BC remains as main pillar of growth Branding and product innovation to drive growth New product launches to create product differentiation Expand geographically FI as the complementary pillar Roll-out premium products Nutritional oil powders Botanical herbal extracts Value-add existing products Enhancing NDC with nutritional values Expand footprint in food service sector Bag-in-box ( BIB ) coffee, tea and herbal concentrate Cost control measures Liquid glucose syrup solids plant 12


13 Appendix 13
14 Financial Snapshot Financial Highlights (S$ 000) 3Q14 3Q13 % Change 9M14 9M13 % Change Revenue 129, ,993 (3) 385, ,712 (4) Gross Profit 41,501 48,953 (15) 135, ,766 (11) Gross Profit Margin (%) (5)^ (3)^ Total Operating Expenses (29,493) (27,259) 8 (85,695) (82,122) 4 Profit from Operating Activities 12,008 21,694 (45) 49,463 69,644 (29) Profit from Operating Activities (%) 9 16 (7)^ (4)^ Net Finance Income/(Loss)* 778 (1,689) 146 1, Net Other Income 501 1,426 (65) 1,200 19,183** (94) Net Profit 10,521 19,519 (46) 44,805 79,791 (44) Net Profit Margin (%) 8 15 (7)^ (8)^ EBITDA 18,612 24,877 (25) 64,669 99,251 (35) EBITDA Margin (%) (5)^ (8)^ Earnings per share (cents) *** (47) *** (45) ^: Denote percentage points. *: Foreign exchange gain amounting to S$1.1m in 3Q14, compared to foreign exchange loss of S$1.5m in 3Q13 **: Include non-recurring S$17.1m gain on disposal of the Company s 35.3% interests in Sun Resources Holdings Pte Ltd in 2Q13 *** : Restated as required by FRS
15 Balance Sheet Highlights In S$ 000 Sep 14 Dec 13 Non-Current Assets Fixed assets 294, , , ,644 In S$ 000 Sep 14 Dec 13 Non-Current Liabilities Deferred taxation 7,701 7,607 7,131 6,974 Current Assets Inventories Trade receivables Cash and bank balances Current Liabilities Trade payables Other payables and accruals Bank loan 320, ,702 93,338 79, ,475 39,514 39,240 28, , ,640 92,363 98, ,390 36,888 47,787 - Shareholders Equity 461, ,934 Ratios NAV per share (cents) Debt-to-equity ratio (times)** Current ratio (times) Receivables turnover (mths) Inventory turnover (mths) Payables turnover (mths) * *: Restated as required by FRS 33. **: Computed based on Total Liabilities divided by Total Equity. Fixed assets increased due to expansion projects Increase in inventories due to higher raw material balances at period end Increase in trade receivables due to higher sales recorded towards the end of the period Bank loans were used to finance expansion projects Other payables and accruals decreased due to payment of accrued expenses and construction costs D/E ratio of 0.28 times; low gearing 15


16 BC: Our Top Brands & Product Ranges Super Coffee Super Coffee - Palettes Super - Charcoal Roasted White Coffee Tea Infusions Super Coffee - Master Barista NutreMill Cereal & Soymilk Super Power 16


17 BC: Our Product Offerings New launches in the offering Super Cup - Signature Super Cup Hot Chocolate Milk Tea HORECA Products Owl - Tea Nutrifield OWL Owl Secret Recipe Soothing Brew Products Owl White Coffee Tarik Owl Kopitiam Roast 17


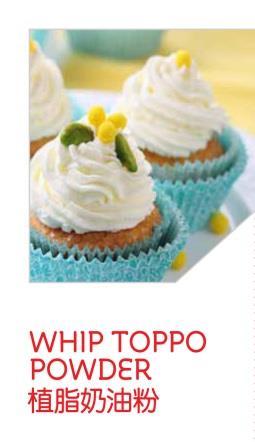
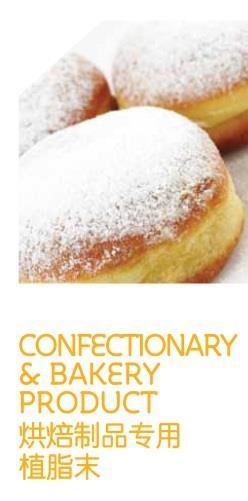
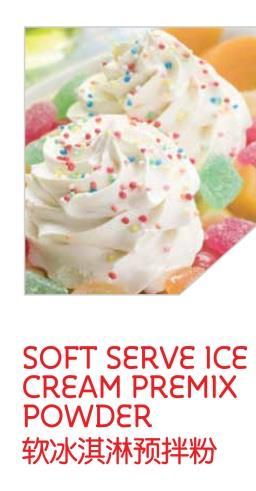
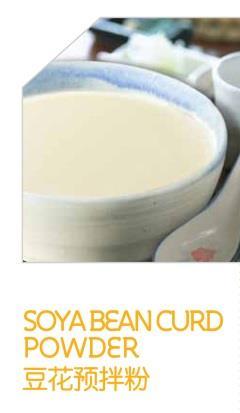
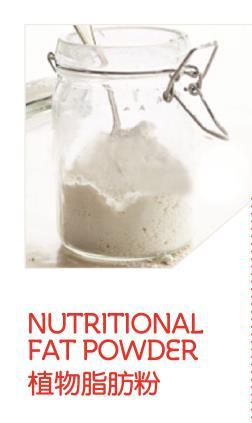


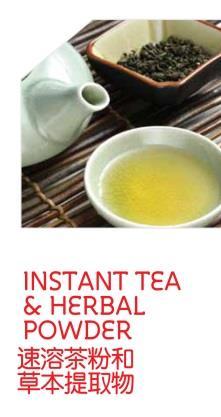

18 FI Products COFFEE CREAMER OTHERS BAKERY & OTHERS SPECIALTY POWDER
 3,000MT of liquid concentrates, spray-dried and freeze-dried powders 20,000MT of instant soluble coffee powder capacity annually; 1,500MT freeze-dried coffee ( FDC ) Has 100,000MT of")
19 Our Strategic Food Ingredients Expertise Specialises in premium creamer products such as foaming creamer and cold water soluble creamer Has 25,000MT of creamer capacity annually Botanical Herbal Extracts ( BHE ) 3,000MT of liquid concentrates, spray-dried and freeze-dried powders 20,000MT of instant soluble coffee powder capacity annually; 1,500MT freeze-dried coffee ( FDC ) Has 100,000MT of creamer capacity annually Produces Liquid Glucose Syrup Solids ( LGSS ) Produces Nutritional Oil Powders ( NOP )


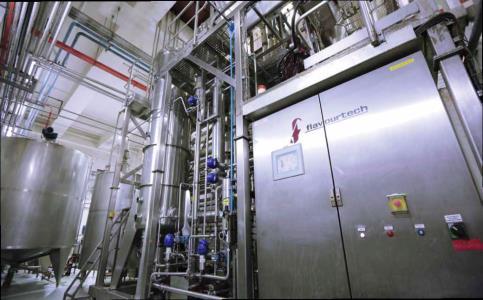
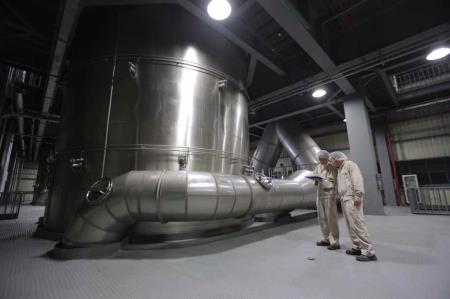
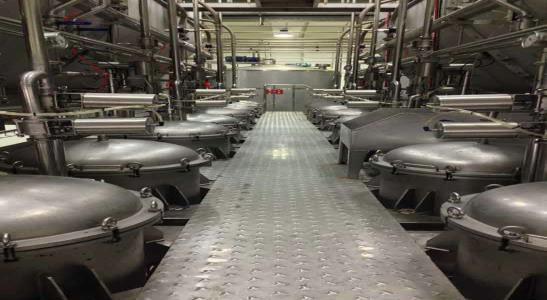
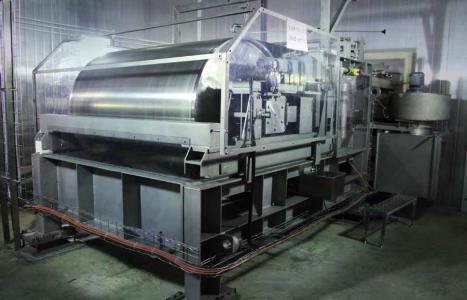
20 Our FI Expertise & State-of-the-Art Facilities

 Annual mfg cap")


21 FI Production Capacities FY2012 FY2013 FY2014E Ingredient Type Annual mfg cap (metric tons) Annual mfg cap (metric tons) Annual mfg cap (metric tons) Spray-Dried Coffee 11,500 15,000 17,500 ( prorated ) Freeze-Dried Coffee NA 1,500 1,500 Cereal Flakes 4,000 4,000 4,000 Non-Dairy Creamer Foaming Creamer Cold Soluble Creamer 125, , ,000 Fat Filled Milk 21
 6753 3088 ext 749 www.supergroupltd.com 22")
22 For Investor Relations, please contact: Candy Chng Group Corporate Affairs & Investor Relations Tel: (65) ext
Financial Results for Fiscal Year Ending December 31, February 12, 2016 Suntory Beverage & Food Limited
 2016 SUNTORY 2013 BEVERAGE SUNTORY BEVERAGE & FOOD & LIMITED. Limited. All Rights All Reserved Rights Reserved. Financial for Fiscal Year Ending December 31, 2015 February 12, 2016 Suntory Beverage & Food
$ BUY STARBUCKS CORPORATION (SBUX) Rena Kaufman. Valuation Methodology. Market Data. Financial Summary (7/1/2018) Profile. Financial Analysis
 Rena Kaufman. Valuation Methodology. Market Data. Financial Summary (7/1/2018) Profile. Financial Analysis") STARBUCKS CORPORATION (SBUX) Market Data Market Cap (intraday): $69,991M Enterprise Value (Aug 9, 2018): $74,898M Enterprise Value/EBITDA (ttm): 14.97x Rena Kaufman $51.88 - BUY Valuation Methodology Method
STARBUCKS CORPORATION (SBUX) Market Data Market Cap (intraday): $69,991M Enterprise Value (Aug 9, 2018): $74,898M Enterprise Value/EBITDA (ttm): 14.97x Rena Kaufman $51.88 - BUY Valuation Methodology Method
Peet's Coffee & Tea, Inc. Reports 62% Increase in Second Quarter 2008 Diluted Earnings Per Share
 Peet's Coffee & Tea, Inc. Reports 62% Increase in Second Quarter 2008 Diluted Earnings Per Share EMERYVILLE, Calif., July 31, 2008 /PRNewswire-FirstCall via COMTEX News Network/ -- Peet's Coffee & Tea,
Financial Results for H1 Fiscal Year Ending December 31, August 6, 2015 Suntory Beverage & Food Limited
 Financial Results for H1 Fiscal Year Ending December 31, 2015 August 6, 2015 Suntory Beverage & Food Limited 2015 SUNTORY 2013 BEVERAGE SUNTORY BEVERAGE & FOOD & LIMITED. Limited. All Rights All Reserved
Company Presentation. Opportunity Day 3Q2013 December, 2013
 Company Presentation Opportunity Day 3Q2013 December, 2013 Company Presentation Opportunity Day 3Q2013 December, 2013 Disclaimer Copyright 2013 MK Restaurant Group Public Company Limited. All rights reserved.
Three-month sales. April 19, 2018 Nestlé three-month sales 2018
 Three-month sales 1 Disclaimer This presentation contains forward looking statements which reflect Management s current views and estimates. The forward looking statements involve certain risks and uncertainties
Business Update DECEMBER 2018
 Business Update DECEMBER 2018 Disclaimer This presentation may contain forward-looking statements and projections. There can be no certainty of outcome in relation to the matters to which the forward-looking
Financial Results for Fiscal Year Ending December 31, February 13, 2017 Suntory Beverage & Food Limited
 2017 SUNTORY 2013 BEVERAGE SUNTORY BEVERAGE & FOOD & LIMITED. Limited. All Rights All Reserved Rights Reserved. Financial Results for Fiscal Year Ending December 31, 2016 February 13, 2017 Suntory Beverage
9 Months Sales Roddy Child-Villiers Head of Investor Relations. 22 October 2009
 9 Months Sales 2009 Roddy Child-Villiers Head of Investor Relations 22 October 2009 Disclaimer This presentation contains forward looking statements which reflect Management s current views and estimates.
OUR POTENTIAL. Business Update MAY 2017
 OUR POTENTIAL Business Update MAY 2017 Disclaimer This presentation may contain forward-looking statements and projections. There can be no certainty of outcome in relation to the matters to which the
Investor Presentation 2014 (Herfy)
") Investor Presentation 2014 (Herfy) 1 Disclaimer This document has been prepared by Herfy ( the Company ) solely for presentation purposes. The information contained in this document has not been independently
Investor Presentation 2014 (Herfy) 1 Disclaimer This document has been prepared by Herfy ( the Company ) solely for presentation purposes. The information contained in this document has not been independently
ONE YEAR ANNUAL RESULTS FONTERRA FONTERRA CO-OPERAT CO-OPERA IVE GROUP LTD
 ONE YEAR. 2012 ANNUAL RESULTS FONTERRA CO-OPERATIVE GROUP LTD 1 SIR HENRY VAN DER HEYDEN CHAIRMAN FONTERRA CO-OPERATIVE GROUP LTD 2 OVERVIEW Highlights Business performance Update on strategy Questions
Nestlé Investor Seminar 2014
 Nestlé Investor Seminar 2014 Beverage Nestlé USA Rob Case Nestlé Beverage Division President June 3 rd & 4 th, Liberty Hotel, Boston, USA Disclaimer This presentation contains forward looking statements
Financial Results for Q3 Fiscal Year Ending December 31, 2018 November 5, 2018 Suntory Beverage & Food Limited
 Financial Results for Q3 Fiscal Year Ending December 31, 2018 November 5, 2018 Suntory Beverage & Food Limited 2018 SUNTORY BEVERAGE & FOOD LIMITED. All Rights Reserved. 1 Results for Q3, FY2018 (9 months)
Three-month sales April 20, 2017 Nestlé three-month sales 2017
 Three-month sales 2017 1 Disclaimer This presentation contains forward looking statements which reflect Management s current views and estimates. The forward looking statements involve certain risks and
DELIVERING REFRESHING SOFT DRINKS
 BEVERAGES DIVISION DELIVERING REFRESHING SOFT DRINKS Swire Beverages manufactures, markets and distributes refreshing soft drinks to consumers in Hong Kong, Taiwan, Mainland China and the USA. 46 215 PERFORMANCE
Financial Results for Fiscal Year Ended December 31, 2018 February 14, 2019 Suntory Beverage & Food Limited
 Financial Results for Fiscal Year Ended December 31, 2018 February 14, 2019 Suntory Beverage & Food Limited 2019 SUNTORY BEVERAGE & FOOD LIMITED. All Rights Reserved. 1 FY2018 Review FY2019 Forecast Saburo
LOCAL TASTE GLOBAL MARKET
 LOCAL TASTE GLOBAL MARKET ANNUAL GENERAL MEETING FY2016 MILESTONES * As defined in Euromonitor International report, Events Catering Services in Singapore, dated April 2016 whereby events catering refers
Preliminary unaudited financial results for the full year ended 30 June Amount for this reporting period
 Marlborough Wine Estates Group Limited Results for Announcement to the Market Preliminary unaudited financial results for the full year ended 30 June 2017 Reporting Period 1st July to 30th June 2017 Previous
Welcome to the Nine-Month Sales Conference
 Welcome to the Nine-Month Sales Conference Disclaimer This presentation contains forward looking statements which reflect Management s current views and estimates. The forward looking statements involve
Autumn Press Conference October 19, Name of chairman
 Autumn Press Conference October 19, 2006 Disclaimer This presentation contains forward looking statements which reflect Management s current views and estimates. The forward looking statements involve
Leading the Category Driving Growth Creating Value. Fiona KENDRICK Head of Coffee and Beverages Strategic Business Unit
 Leading the Category Driving Growth Creating Value Fiona KENDRICK Head of Coffee and Beverages Strategic Business Unit Disclaimer This presentation contains forward looking statements which reflect Management
Australian Vintage Ltd. December 2017 Half Year Results 21 st February 2018
 Australian Vintage Ltd. December 2017 Half Year Results 21 st February 2018 Australian Vintage Ltd. December 2017 Half Year Results Disclaimer The presentation has been prepared by Australian Vintage Limited
Strong Holiday Performance Drives 5% Global Comp Growth, Global Traffic Increases 2%
 Starbucks Delivers Record Q1 Revenue and EPS Strong Holiday Performance Drives 5% Global Comp Growth, Global Traffic Increases 2% Revenues rise 13% to a record $4.8 billion; EPS of $1.30 includes a gain
ABN Australian Vintage Limited Full Year Result to 30 June 2018 Profit up 79% and Record Cash Flow
 ABN 78 052 179 932 Company Announcements Australian Securities Exchange 29 August 2018 Key Points Australian Vintage Limited Full Year Result to 30 June 2018 Profit up 79% and Record Cash Flow Net Profit
Strengthening our coffee leadership
 Strengthening our coffee leadership Nestlé enters agreement for the perpetual global licensing rights of Starbucks consumer and foodservice products May 7, 2018 Mark Schneider François-Xavier Roger Chief
DECEMBER 2015 HALF YEAR RESULTS BRANDED SALES DRIVES PROFIT UP BY 80% 24 th February 2016
 DECEMBER 2015 HALF YEAR RESULTS BRANDED SALES DRIVES PROFIT UP BY 80% 24 th February 2016 Disclaimer The information in this presentation is general advice, given in good faith and derived from sources
For personal use only
 ABNN 78 052 179 932 Company Announcements Australian Securities Exchange 24 February 2016 Australian Vintage Half Year Result to 31 December 20155 Branded Sales Dry Profit up by 80% % Key Points Net Profit
CCL Products (India) Ltd.
 Ltd.") Jan-16 Feb-16 Mar-16 Apr-16 May-16 Jun-16 Jul-16 Aug-16 Sep-16 Oct-16 Nov-16 Dec-16 Jan-17 s. CCL Products (India) Ltd.. February 6, 2017 BSE Code: 519600 NSE Code: CCL Reuters Code: CCLP.NS Bloomberg
Jan-16 Feb-16 Mar-16 Apr-16 May-16 Jun-16 Jul-16 Aug-16 Sep-16 Oct-16 Nov-16 Dec-16 Jan-17 s. CCL Products (India) Ltd.. February 6, 2017 BSE Code: 519600 NSE Code: CCL Reuters Code: CCLP.NS Bloomberg
Analyst Call Q August 11, 2017
 Analyst Call Q1 2017-18 August 11, 2017 Agenda 1. BUSINESS PERFORMANCE 2. FINANCIAL OVERVIEW 2 Business Performance 3 Key Highlights 5 th consecutive quarter of operating profit growth despite higher spends
July 2010 Barry Callebaut - Roadshow presentation
 Barry Callebaut 9-month key sales figures 2009/10 July 2010 July 2010 Barry Callebaut - Roadshow presentation Agenda Barry Callebaut at a glance Highlights 9 months 2009-2010 Outlook July 2010 Barry Callebaut
Nestlé nine-month sales: 3.3% organic growth, 2.5% real internal growth Full-year outlook: organic growth around 3.5% with margin improvement
 Press release Vevey, 20 October 2016 Follow today's event live 08:30 CEST Sales conference webcast Full details: http://www.nestle.com/media/mediaeventscalendar/allevents/nine-month-sales-2016 This press
Seeka Limited. Retail Investors March 2019
 Seeka Limited Retail Investors March 2019 Orchard-to-market excellence Seeka is an international fresh produce business In Australia Grow, process and market - Kiwifruit - Nashi pears - European pears
Three-month Sales April 18, 2019 Nestlé three-month sales 2019
 Three-month Sales 2019 1 Disclaimer This presentation contains forward looking statements which reflect Management s current views and estimates. The forward looking statements involve certain risks and
Reinforcement of Full-line Beverage Service Business. May 25, 2015 Suntory Beverage & Food Limited
 Reinforcement of Full-line Beverage Service Business May 25, 2015 Suntory Beverage & Food Limited Background of Basic Agreement Group s Philosophy Management Principles Suntory Beverage & Food Limited
July 2010 Barry Callebaut - Roadshow presentation
 Barry Callebaut 9-month key sales figures 2009/10 Agenda Barry Callebaut at a glance Highlights 9 months 2009-2010 Outlook 2 Barry Callebaut is active along the entire cocoa and chocolate value chain Cocoa
This is Haruhisa Inada. I will explain the financial results of the first quarter of FY 2018.
 This is Haruhisa Inada. I will explain the financial results of the first quarter of FY 2018. 1 Compared to the previous year, revenue was 277.1 billion yen, up 3.3%, operating income was 26.6 billion
Coca-Cola beverages bring a refreshing taste to consumers.
 Coca-Cola beverages bring a refreshing taste to consumers. BEVERAGES DIVISION DELIVERING REFRESHING SOFT DRINKS Swire Beverages manufactures, markets and distributes refreshing soft drinks to consumers
Presentation on Half Yearly Results. Analyst Meet November 2014
 Presentation on Half Yearly Results Analyst Meet November 2014 1 Agenda Key Themes Performance Highlights Operating Performance Review Financial Review 2 Key Themes H1 2014-15 Improved profitability in
For personal use only
 7 December 2017 FONTERRA REVISES 2017/18 FORECAST FARMGATE MILK PRICE Fonterra Co-operative Group Limited today reduced its forecast Farmgate Milk Price for the 2017/18 season from $6.75 to $6.40 per kgms
First Half 2014: 4.7% organic growth in a volatile trading environment CHF 8 billion share buy-back programme
 Press release Vevey, 7 August 2014 First Half 2014: 4.7% organic growth in a volatile trading environment CHF 8 billion share buy-back programme Sales of CHF 43 billion, 4.7% organic growth, 2.9% real
Pizza Pizza Royalty Corp. ANNUAL GENERAL MEETING May 29, 2013
 Pizza Pizza Royalty Corp. ANNUAL GENERAL MEETING May 29, 2013 1 Elizabeth Wright, Board Chair 2 Forward-Looking Statement This presentation will contain forward-looking statements. Investors should be
Three-Month Sales François-Xavier Roger Chief Financial Officer
 Three-Month Sales 2016 François-Xavier Roger Chief Financial Officer Disclaimer This presentation contains forward looking statements which reflect Management s current views and estimates. The forward
North America Ethyl Acetate Industry Outlook to Market Size, Company Share, Price Trends, Capacity Forecasts of All Active and Planned Plants
 North America Ethyl Acetate Industry Outlook to 2016 - Market Size, Company Share, Price Trends, Capacity Forecasts of All Active and Planned Plants Reference Code: GDCH0416RDB Publication Date: October
Ontario Wine and Grape Industry Performance Study
 Ontario Wine and Grape Industry Performance Study 2015 Performed by VQA Ontario and Deloitte on behalf of the Ontario wine and grape industry March 2016 FINANCIAL INFORMATION I II 2015 ONTARIO WINE AND
Nestlé three-month sales: 3.9% organic growth, 3.0% real internal growth, full-year outlook confirmed
 Press release Vevey, 14 April 2016 Follow today's event live 08:30 CEST Investor call audio webcast Full details: http://www.nestle.com/media/mediaeventscalendar/allevents/2016-3m-sales Nestlé three-month
2016 was Telepizza Group s best year for chain sales 1 and EBITDA growth over the last decade
 Telepizza Full-Year Results for 2016 2016 was Telepizza Group s best year for chain sales 1 and EBITDA growth over the last decade Chain sales 1 grew by 7% to 517M while Underlying EBITDA rose by 10% to
VIETNAM COFFEE MARKET REPORT Q1/2018
 VIETNAM COFFEE MARKET REPORT Q1/2018 Content Abbreviations 3 3. Vietnam coffee market 49 Summary 4 3.1 Classification of coffee produced in Vietnam 49 1. Business environment 1.1 Macroeconomic situation
Access China Conference Deutsche Bank Beijing 2 March 05
 Access China Conference Deutsche Bank Beijing 2 March 05 Agenda! Offering Summary! China s Wine Market! Introduction to Dynasty! Competitive Strengths! Financial Highlights! Strategies & Plans! Use of
This presentation and subsequent discussion may contain certain forward-looking statements. These forward-looking statements reflect the company s
 1 This presentation and subsequent discussion may contain certain forward-looking statements. These forward-looking statements reflect the company s view on some future events and involve known and unknown
REMARKS BY PAUL BULCKE, GROUP CHIEF EXECUTIVE OFFICER, NESTLÉ S.A. MEDIA CONFERENCE, NAIROBI, FRIDAY, JULY 2, 2010
 REMARKS BY PAUL BULCKE, GROUP CHIEF EXECUTIVE OFFICER, NESTLÉ S.A. MEDIA CONFERENCE, NAIROBI, FRIDAY, JULY 2, 2010 Disclaimer This speech might not reflect absolutely all exact words spoken. This speech
C O R P O R AT E S T R AT E G Y U P D AT E. October, 2018
 C O R P O R AT E S T R AT E G Y U P D AT E October, 2018 FORWARD LOOKING STATEMENTS This presentation contains forward-looking statements, that should be considered as good faith estimates. Such statements
For personal use only
 11 December 2013 FONTERRA MAINTAINS FORECAST FARMGATE MILK PRICE FOR 2013/14 SEASON AND CONTINUES INVESTING IN THE FUTURE Forecast Fonterra Co-operative Group Limited is maintaining its forecast Farmgate
Press release Vevey, October 18, Nestlé reports nine-month sales for 2018
 Press release Vevey, October 18, 2018 Follow today's event live 14:00 CEST Investor call audio webcast Full details: https://www.nestle.com/media/mediaeventscalendar/allevents/2018-nine-month-sales Nestlé
Nestlé nine-month sales: broad-based organic growth of 4.5% in a volatile environment
 Press release Vevey, 16 October 2014 Nestlé nine-month sales: broad-based organic growth of 4.5% in a volatile environment Sales of CHF 66.2 billion, organic growth of 4.5%, real internal growth of 2.3%
Global Hot Dogs Market Insights, Forecast to 2025
 Report Information More information from: https://www.wiseguyreports.com/reports/3366552-global-hot-dogs-market-insights-forecast-to-2025 Global Hot Dogs Market Insights, Forecast to 2025 Report / Search
Regional Brands, National Potential. International Summit Agricultural & Food Transportation
 Regional Brands, National Potential International Summit Agricultural & Food Transportation Wednesday, December 3, 2008 1 Mike Townsley President Food Products Division 2 3 4 5 Our Way of Doing Business
Australian Vintage Ltd. June 2017 Results 30 th August 2017
 Australian Vintage Ltd. June 2017 Results 30 th August 2017 Australian Vintage Ltd. June 2017 Results Disclaimer The presentation has been prepared by Australian Vintage Limited (ACN 052 179 932) ( AVG
Ontario Wine and Grape Industry Performance Study
 Ontario Wine and Grape Industry Performance Study 2016 Performed by VQA Ontario and Deloitte on behalf of the Ontario wine and grape industry March 2017 FINANCIAL INFORMATION I II 2016 ONTARIO WINE AND
Cocoa -key for our future growth. Steven Retzlaff President Global Cocoa
 Cocoa -key for our future growth Steven Retzlaff President Global Cocoa October, 2014 Agenda Cocoa Market Terminal market Supply & Demand Combined ratio Powder market Global Cocoa business Strategic reasons
IN THIS ISSUE FEBRUARY Financial Calendar: Late September 2014 Annual Results Announced. 26 March 2014 Interim Results Announced
 FEBRUARY 2014 Welcome to our latest Global Dairy Update. This update is part of Fonterra s commitment to informing our farmers and wider stakeholders about the global dairy market, trends in New Zealand
Raymond James 33 rd Annual Institutional Investors Conference March 5, DineEquity, Inc. All rights reserved.
 Raymond James 33 rd Annual Institutional Investors Conference March 5, 2012 Forward-Looking Information Statements contained in this presentation may constitute forward-looking statements within the meaning
Analyst Meet 2009/2010 Performance. Peter Unsworth
 Analyst Meet 2009/2010 Performance Peter Unsworth Performance Strong financial performance in a challenging environment; Group integrated and transformed Group operating income up 19% at Rs 5821 crores
ASIA FRANCHISE BUSINESS UNIT (FBU) Siddharth Varma, Managing Director
 Siddharth Varma, Managing Director") ASIA FRANCHISE BUSINESS UNIT (FBU) Siddharth Varma, Managing Director Yum! Asia FBU: Partnering For Growth China = 3,900 units Thailand = 480 units Asia FBU = 4,500+ units Asia FBU Asia FBU: Collection
ASIA FRANCHISE BUSINESS UNIT (FBU) Siddharth Varma, Managing Director Yum! Asia FBU: Partnering For Growth China = 3,900 units Thailand = 480 units Asia FBU = 4,500+ units Asia FBU Asia FBU: Collection
NZ Dairy Industry Report 2015
 NZ Dairy Industry Report 2015 Executive Summary December 2015 www.tdb.co.nz 1 Principal contacts for this report: Geoff Taylor, Director Nigel Atherfold, Director Mob: 027 465 0024 Mob: 027 4650 057 Email:
Top 10 financial planning mistakes
 2017 Annual TWGAA Conference Top 10 financial planning mistakes Presented by: Amanda Sims, Associate, Silicon Valley Bank # 10 Improper sourcing strategies 2015 Annual Wine Conditions Survey 21 February
More information at Global and Chinese Pressure Seal Machines Industry, 2018 Market Research Report
 Report Information More information at https://www.htfmarketreport.com/reports/1320915 Global and Chinese Pressure Seal Machines Industry, 2018 Market Research Report Report Code: HTF1320915 Pages: 150
UNDERSTANDING, LEADING, BUILDING & WINNING IN THE BUSINESS OF COFFEE FARMER BROTHERS
 UNDERSTANDING, LEADING, BUILDING & WINNING IN THE BUSINESS OF COFFEE FARMER BROTHERS WE ARE A COFFEE COMPANY DESIGNED TO DELIVER THE COFFEE PEOPLE WANT, THE WAY THEY WANT IT. FARMER BROTHERS 2 We have
John Culver. group president, Global Retail
 John Culver group president, Global Retail Starbucks has delivered strong growth globally GLOBAL RETAIL CONSOLIDATED REVENUE USD BILLIONS OPERATING INCOME USD BILLIONS CAGR 12% CAGR 17% $13.0 $18.5 $2.8
Ten Peaks Coffee Company Inc. 1
 Ten Peaks Coffee Company Inc. 1 Management s Discussion and Analysis This Management s Discussion & Analysis ( MD&A ) of Ten Peaks Coffee Company Inc. ( Ten Peaks or the Company ), dated as of March 16,
Table grape. Horticulture trade intelligence. Quarter 1: January to March 2017
 Horticulture trade intelligence A custom report compiled for Hort Innovation by Euromonitor International Table grape Quarter 1: January to March 217 Horticulture trade intelligence: Table grape: 217:
Majestic Wine 2013/14 Interim Results
 Majestic Wine 2013/14 Interim Results Key Competitive Advantages > > Excellent customer service delivered by highly trained store teams > > Taste before you buy, free to attend wine events and wine courses
CIF Stock Recommendation Report (Fall 2012)
") Section (A) Summary CIF Stock Recommendation Report (Fall 2012) Company Name and Ticker: Starbucks Coffee_(SBUX)_ Recommendation Buy: Yes No Target Price: 59.21 Sector: Cyclical goods and serv. Current
Section (A) Summary CIF Stock Recommendation Report (Fall 2012) Company Name and Ticker: Starbucks Coffee_(SBUX)_ Recommendation Buy: Yes No Target Price: 59.21 Sector: Cyclical goods and serv. Current
TTFB RESTAURANT GROUP Co., Ltd.
 TTFB RESTAURANT GROUP Co., Ltd. Pantone color chart Squid piece: length/width Squid piece: length/width Lemon leave width Chili slice : length/width String bean : length/width Potato slice:
The supply and demand for oilseeds in South Africa
 THIS REPORT CONTAINS ASSESSMENTS OF COMMODITY AND TRADE ISSUES MADE BY USDA STAFF AND NOT NECESSARILY STATEMENTS OF OFFICIAL U.S. GOVERNMENT POLICY Required Report - public distribution Date: GAIN Report
Nestlé first-quarter sales: 4.3% organic growth, full-year outlook confirmed
 Press release Follow today's events live 08:30 CET Investor webcast Full details: http://www.nestle.com/media/mediaeventscalendar/allevents/2013- first-quarter-sales This press release is also available
Private Equity Investments
 Overview for Private Equity Investments Strategic capital and expertise for the wine industry Prepared: September 2011 Copyright 2010 Bacchus Capital Management In classical mythology, Bacchus is the god
Optimism paired with results Winery Benchmarking Publication date: May 2017
 Optimism paired with results Winery Benchmarking 0 Publication date: May 0 Contents Welcome Executive Summary Results - Profitability Results - Financial position Results - Vineyards Results - Ratios 0
Interim Result MARCH 2018 OUR POTENTIAL OUR CO-OPERATIVE OUR PERFORMANCE
 OUR CO-OPERATIVE OUR POTENTIAL OUR PERFORMANCE Interim Result 2018 21 MARCH 2018 Disclaimer This presentation may contain forward-looking statements and projections. There can be no certainty of outcome
Focused on Delivering
 34 Swire Pacific Annual Report 2009 Focused on Delivering Swire Beverages is one of the largest Coca-Cola bottlers in the world and the number one bottler in Mainland China with a powerful production and
Caribou Coffee Company. January 12, 2012
 Caribou Coffee Company January 12, 2012 SAFE HARBOR STATEMENT Certain statements made in this presentation constitute forward-looking statements, within the meaning of the Private Securities Litigation
Starbucks Delivers Record Q1 Revenues and EPS Q1 Fiscal 2016 Highlights:
 Starbucks Delivers Record Q1 Revenues and EPS Strong Holiday Performance Drives 9% Comp Growth in the U.S. and Americas, 8% Globally; Global Traffic up 4% Consolidated Net Revenues Rise 12% to a Record
OUR POTENTIAL. Interim Result MARCH 2017
 OUR POTENTIAL Interim Result 2017 22 MARCH 2017 Disclaimer This presentation may contain forward-looking statements and projections. There can be no certainty of outcome in relation to the matters to which
DESICCATED COCONUT Introduction Market Packaging Production capacity Sales revenue
 DESICCATED COCONUT 1. Introduction Desiccated coconut is used commonly in sweetmeat preparations, as toppings in desserts, ice creams, puddings, etc., as a filler in betel leaves and a variety of products.
Vintage 2012 New Zealand wine industry benchmarking survey
 Vintage 2012 New Zealand wine industry benchmarking survey Publication date: November 2012 A joint publication from Deloitte and New Zealand Winegrowers What though youth gave love and roses, Age still
Germany is the largest importer of cheese and UK and Italy are the second- and third-largest importers.
 EXTRACTSFROMTHEREPORT 1.Introduction 1.1. Background The cheese market has been one of the most dynamic food segments in the last 20 year with steady growth in production, consumption and international
Caribou Coffee Company
 Caribou Coffee Company Consumer Conference June 5, 2012 SAFE HARBOR STATEMENT Certain statements made in this presentation constitute forward-looking statements, within the meaning of the Private Securities
Paper Packaging Practice June Copyright 2015 RISI, Inc. All rights reserved.
 Global Containerboard Outlook Ken Waghorne, VP Paper Packaging Practice June 2015 1 Today s Agenda Regional Containerboard Markets Asia Europe Western Eastern North America Latin America Rest of World
Asian Containerboard Markets
 Asian Containerboard Markets An Update on China: The Changes Keep Coming International Containerboard Conference November 2018 Beth Lis Vice President, Asian Paper & Packaging Beth Lis VP Asian Paper &
INTERIM RESULTS FOR THE PERIOD ENDED 31 DECEMBER DECEMBER 2017
 INTERIM RESULTS RESULTS INTERIM FOR THE RESULTS YEAR ENDED FOR THE 30 PERIOD JUN 2017 ENDED FOR THE PERIOD ENDED 31 DECEMBER 2017 31 DECEMBER 2017 OVERVIEW R3.7 billion restaurant sales achieved Comparable
2017 FINANCIAL REVIEW
 2017 FINANCIAL REVIEW In addition to activity, strategy, goals, and challenges, survey respondents also provided financial information from 2014, 2015, and 2016. Select results are provided below: 2016
For personal use only
 DONGFANG MODERN AGRICULTURE HOLDING GROUP Annual General Meeting 29 May 2017 Disclaimer No representation or warranty, express or implied, is made as to the fairness, accuracy, completeness or correctness
GLOBAL DAIRY UPDATE KEY DATES MARCH 2017
 MARCH 2017 GLOBAL DAIRY UPDATE European milk production decreased for the seventh consecutive month, while the US remains strong. The rate of decline in New Zealand production is easing. US exports continue
2008 Year End Results
 2008 Year End Results» Review of Business Stan McCarthy CEO» Financial Review Brian Mehigan CFO» Outlook and Future Prospects Stan McCarthy CEO» Q&A 2008 Headlines» Solid Kerry business development and
GLOBAL DAIRY UPDATE KEY DATES MAY New Zealand production for the 2016/17 season (from 1 June 2016) is down 2% to the end of March.
 is down 2% to the end of March.") MAY 2017 GLOBAL DAIRY UPDATE New Zealand production for the 2016/17 season (from 1 June 2016) is down 2 to the end of March. US exports rate of growth is declining. New Zealand and Australia exports up
MAY 2017 GLOBAL DAIRY UPDATE New Zealand production for the 2016/17 season (from 1 June 2016) is down 2 to the end of March. US exports rate of growth is declining. New Zealand and Australia exports up
Becle, S.A.B. de C.V. Santander s Consumer Day Corporate Presentation
 Becle, S.A.B. de C.V. Santander s Consumer Day Corporate Presentation Nov, 20 2018 Disclaimer This presentation has been prepared by Becle, S.A.B. de C.V. ( Becle, Cuervo or the Company ) for informational
Dairy Market. November 2017
 Dairy Market Dairy Management Inc. R E P O R T Volume 20 No. 10 November 2017 DMI NMPF Overview U.S. Cheddar cheese prices hit a 10-month high in October, while butter prices softened but remained well
QUARTELY MAIZE MARKET ANALYSIS & OUTLOOK BULLETIN 1 OF 2015
 QUARTELY MAIZE MARKET ANALYSIS & OUTLOOK BULLETIN 1 OF 2015 INTRODUCTION The following discussion is a review of the maize market environment. The analysis is updated on a quarterly 1 basis and the interval
Profit before tax of US$764 million (US$712 million before exceptionals and profit on
 42 XII. Anexos Anexo 1 Relevantes Anuales Total lager beer volumes up 10% to 53 million hectolitres Profit before tax of US$764 million (US$712 million before exceptionals and profit on sale of subsidiary
Yum! Brands Drive Profitable International Expansion. Graham Allan YRI President
 Yum! Brands Drive Profitable International Expansion Graham Allan YRI President Yum! International Division Agenda... 2006 Results/2007 Outlook Building Our Global Brands Future Growth Another Strong Year