TRENDS IN SALES OF MILK & DAIRY PRODUCTS A RETAIL PERSPECTIVE. Milk Market Observatory 25 January 2017
|
|
|
- Hugh Patterson
- 6 years ago
- Views:
Transcription


1 TRENDS IN SALES OF MILK & DAIRY PRODUCTS A RETAIL PERSPECTIVE Milk Market Observatory 25 January 2017
2 France Period ending 25 December 2016 Product category ) 4 weeks period (P13 15/P13 16) ) Year on year (P13 14-P13 15 / P13 15 P13 16) Price ) 4 week period (P13 15/P13 16) Price ) Year on year (P13 14-P13 15 / P13 15 P13 16) Total liquid milk -0,5% -2,8% +1,2% +2,6% Of which UHT semiskimmed milk Yoghurt & fresh cheese -6,4% -5,5% +0,4% +2,9% +1,7-0,8% -0,7% -0,7% Butter +0,9% +0,1% +0,3% +1,9% Cream -1,6% -1,4% -2,7% +0,8% Cheese +1,7% +1,7% -0,7% -0,5% Source: Kantar World Panel via FranceAgriMer (Min. de l Agriculture) 2

3 France Sales of organic versus conventional milk & dairy products Organic milk & dairy products Organic dairy products sales have continued to increase. The increase is registered on every product. 40% Consumption of organic versus conventional milk & dairy products % in volume, year to year 52 weeks 25/12/2016 Organic Conventional Organic market shares (% vol. 25/12/2016) 23,2% 22,2% 21,8% Liquid milk 7,5% 20% 18,0% 14,7% Butter 3,4% Yogurts 3,4% 6,4% 1,6% Cream Fresh cheese 1,1% 1,5% 0% -3,5% -1,5% -2,4% -0,6% -1,7% Cheese 0,5% 0% 2% 4% 6% 8% -20% Liquid milk Yoghurt Fresh cheese Butter Cream Cheese Source: Kantar World Panel via FranceAgriMer (Min. de l Agriculture) 3
4 Composition of the milk price in Germany according to value-added steps in 2016 (cents per litre) Producer price 15,3 Acquisition costs 1,4 Production costs of the dairy 8 Dairy management and margin 0,5 Packaging 8 Warehousing and logistics 1,8 Green Dot 1,6 Retailer cost and margin 6,4 VAT Source: Statista 4
5 Germany consumer prices January-October : litre fresh milk, 3,5% fat 0,64 0,60-6,3% 1 litre UHT milk, 3,5% fat 0,62 0,57-8,1% 1 litre organic fresh milk, 3,8% fat 1 litre organic UHT milk, 3,5% fat 1,13 1,13 0,0% 1,20 1,22 +1,7% Quark, 500g, 0,1% fat 0,75 0,63-16% Own-brand butter, 250g 0,97 0,96-1% Gouda, 1kg 5,58 5,11-8,4% Whiped Cream 0,45 0,37-17,8% 5
6 Germany Period ending October 2016 Product category % change YTD % change YTD Butter +0,1% -1,0% UHT milk -1,7% -8,4% Fresh milk -0,2% -3,0% Quark +0,0 % -4,6% Natural yoghurt +2,3% +0,7% Fruit yoghurt -3,9% -3,9% Desserts -1,5% -3,4% Dairy drinks +8,6% +8,5% TOTAL -0,6% -3,5% 6
7 Hungary Product category December 2016 vs December 2015 January December 2016 vs 2015 Fresh and UHT milk +13,3% -2,4% Milk products and cream +0,3% -1,8% Milk desserts and puddings +13,2% +3,2% Cheese +14,7% +3,5% Butter, margarine +5,3% -1,5% As of 1 st of January, the VAT for fresh milk decreased from 18% to 5%; Source: Nielsen 7
8 Italy Period: 2016 vs Product category 2016 vs % change Q vs Q % change VALUE 2016 vs % change VALUE Q vs Q % change Fresh milk -3,5% -0,4% -4,4% -1,7% UHT milk -3,1% -3,2% -6,8% -6,1% Yoghurt +0,7% 0,0% -1,0% -1,8% Fresh cheese (1) +1,0% +0,9% -1,7% -1,6% Fresh dessert +4,2% +7,2% +3,2% +4,5% Cheese (1) +2,2% +2,7% +0,03% +1,1% Source: Market Track Nielsen (1) Peso imposto 8
9 Poland Period ending - September 2016 Product category Sept 2016 vs Sept 2015) Jan-Sep 2016 vs Jan-Sep 2015) Sept 2016 vs Sept 2015) Jan-Sept 2016 vs Jan-Sept 2015) Coffee creamers +2,6% +6,8% +2,7% +0,7% Condensed milk -8,5% -8,7% -9,4% -9,8% Cream -2,3% +0,1% -1,3% -1,5% Cultured buttermilk +4,9% +2,5% +4,4% +1,6% Hard cheese +9,3% +17,4% +7,7% +13,5% Kefir -0,4% +0,7% +0,7% +0,2% Milk +1,6% +5,1% +0,9% +0,7% Milk desserts -3,2% +3,3% -3,8% +0,3% Mix yoghurt & juices -32,4% +110,4% -38,8% +99,1% Mould cheeses +6,9% +5,8% +2,4% +1,6% Processed cheese -6% -4,9% -5,5% -1,5% Sweet fresh cheese +1,4% +8,7% +1,3% +4,3% White Cheese +3,4% +8,7% +3,5% +6,7% Yellow fats -4,3% -2,5% +6,8% +0,0% Yoghurts -1,0% +4,5% -1,5% +2,37% TOTAL +0,04% +3,5% +1,9% +2,11% Source: Nielsen 9
10 Poland COFFEE CREAMERS 0,69% -8,74% CONDENSED MILK -9,78% 6,79% s Jan-Sept 2016 vs Jan-Sept 2015) Jan-Sept 2016 vs Jan-Sept 2015) CREAM -1,48% 0,13% 2,49% CULTURED BUTTERMILK 1,58% HARD CHEESE KEFIR MILK MILK DESSERTS 13,56% 17,39% 0,73% 0,26% 5,11% 0,69% 3,32% 0,31% MIX YOGURT & JUICES 99,08% 110,38% MOULD CHEESE 1,61% 5,77% -4,28% PROCESSED CHEESE -1,52% SWEET FROMAGE FRAIS WHITE CHEESE YELLOW FATS YOGHURTS Source: Nielsen 10-2,55% 0,06% 4,32% 8,69% 2,37% 4,54% 8,68% 6,74%
11 Poland - sales of dairy products in supermarkets 9,0 % 8,34% value volume 8,0 % 7,19% 7,0 % 6,0 % 5,0 % 4,0 % 6,01% 5,27% 4,08% 5,13% 3,83% 3,0 % 2,88% 2,67% 2,55% 2,0 % 1,83% 1,91% 1,0 % 0,43% 0,0 % -1,0 % JAN 2016 Source: Nielsen 11 FEB ,30% 0,34% 0,37% -0,75% 0,04% MAR 2016 APR 2016 MAY 2016 JUN 2016 JUL 2016 AUG 2016 SEP 2016
12 Portugal Period ending 25 December 2016 Product category s year-to-date) s year-on-year) year-to-date) ) year-on-year Fresh milk -10,7% -10,7% -10,2% -10,2% UHT milk -6,6% -6,6% -7,6% -7,6% Yoghurt -1,7% -1,7% +0,2% +0,2% Fresh cheese +2,0% +2,0% +0,9% +0,9% Butter -1,0% -1,0% -3,6% -3,6% UHT Cream +1,0% +1,0% -0,4% -0,4% Fresh desert +13,5% +13,5% +14,8% +14,8% Cheese +4,9% +4,9% +1,7% +1,7% Source: Nielsen 12
13 Spain Period ending November 2016 Product category s Nov 2016 vs Nov 2015) s Jan-Nov 2016 vs Jan-Nov 2015) Nov 2016 vs Nov 2015) Jan-Nov 2016 vs Jan-Nov 2015) Price Nov 2016 vs Nov 2015) Price Jan-Nov 2016 vs Jan-Nov 2015) Standard liquid milk Other types of milk -2,9% -5,3% -4,4% -6,7% -1,5% -1,5% +5,9% +3,1% +0,1% -0,1% -5,5% -3,1% Milkshakes +4,2% +6,3% +4,8% +5,1% +0,6% -1,0% Yoghurts and fermented milk -0,5% -0,9% -2,2% -1,7% -1,7% -0,8% Fresh desserts -0,6% -0,4% -1,1% -0,7% -0,5% -0,3% Fresh cheese 0,0% -0,9% -0,1% +0,5% -0,1% +1,4% Local, traditional cheese Processed cheese Imported cheese 13 specialties +8,6% +6,8% +2,8% +2,2% -5,4% -4,3% -1,4% -2,4% -1,2% -1,9% +0,2% +0,5% +2,5% +2,4% +0,6% -0,3% -1,9% -2,7%
14 Spain Period ending November 2016 Product category Nov 2016 vs Nov 2015) Jan-Nov 2016 vs Jan-Nov 2015) Nov 2016 vs Nov 2015) Jan-Nov 2016 vs Jan-Nov 2015) Price Nov 2016 vs Nov 2015) Price Jan-Nov 2016 vs Jan-Nov 2015) Grated cheese Other types of cheese +3,5% +3,2% +3,4% +3,2% -0,1% 0,0% -0,6% -0,4% -2,4% -1,4% -1,8% -1,0% Cream +2,2% +0,8% +0,8% -0,4% -1,4% -1,2% Butter +13,0% +3,9% +11,0% +2,7% -1,8% -1,2% Desserts and yoghurt with long conservation Non-liquid milk Total dairy products -11,6% -24,7% -27,9% -40,3% -18,5% -20,6% +0,2% +3,0% -0,9% +1,5% -1,1% -1,5% -0,3% -2,1% -0,9% -1,5% -0,6% +0,6% 14 Source: Nielsen and FeNIL


15 Spain Source: Nielsen and FeNIL 15
16 Sweden Period ending 25 December 2016 Product category in the last 4 weeks) last 52 weeks) in the last 4 weeks) last 52 weeks) Milk Hard cheese Cream Yoghurt Cottage cheese/curd Cold desserts Butter -1,3% -0,8% -0,2% +1,7% +0,5% +1,7% +2,8% -1,7% +1,0% +1,5% +1,7% +0,9% +0,9% -0,5% +0,7% -0,8% +3,6% +3,2% +1,4% +0,1% +8,5% + 10% +13,4% +17,8% -2,7% +7,8% -3,2% +6,0% Source: Nielsen 16

17 United Kingdom UK Dairy Product Retail Price Indices In November 2016, the RPI increased by 0,26% compared with October and is 2,19% higher than the same month last year. The fresh milk price index increased 0,18% on the month and was also up 1,55% on the year. The butter index increased on the month by 1,85% but decreased on the year by 5,45%. Cheese saw a decrease on the month of 1,65% and a fall of 3,77% on the year. 17
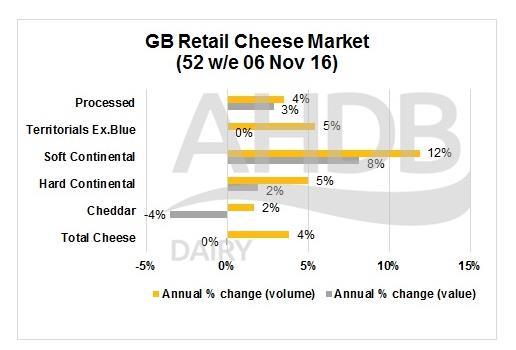
18 United Kingdom 18
19 United Kingdom 19
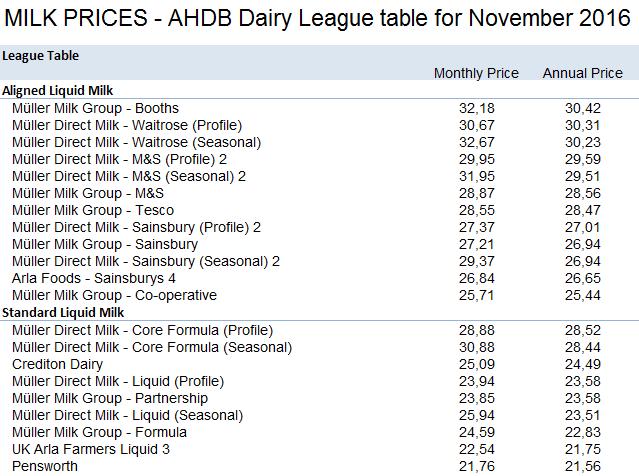
20 United Kingdom: contract league table 20
21 United Kingdom unit price (p) Jan-17 Dec-16 Month Diff. Jan-16 Annual Diff. Liquid milk Retail (4 pints)* n/c Doorstep (1 pint)** n/c 81 n/c ppl Nov-16 Oct-16 Month Diff. Nov-15 Annual Diff. Cream Total Cream n/c Double Cream Single Cream p/kg Nov-16 Oct-16 Month Diff Nov-15 Annual Diff. Cheddar Total market Mature Mild updated monthly ; updated quarterly ; *pasteurised (private label) **milkandmore monthly spot price - semi-skimmed glass bottle Source: Kantar Worldpanel Online 21
TRENDS IN SALES OF MILK & DAIRY PRODUCTS A RETAIL PERSPECTIVE. Milk Market Observatory 28 March 2017
 TRENDS IN SALES OF MILK & DAIRY PRODUCTS A RETAIL PERSPECTIVE Milk Market Observatory 28 March 2017 Belgium Product February 2017 vs. February 2016 Consumer Price Index Whole milk -9,15% Semi-skimmed milk
TRENDS IN SALES OF MILK & DAIRY PRODUCTS A RETAIL PERSPECTIVE. Milk Market Observatory 26 September 2017
 TRENDS IN SALES OF MILK & DAIRY PRODUCTS A RETAIL PERSPECTIVE Milk Market Observatory 26 September 2017 Belgium Product August 2017 vs. August 2016 Consumer Price Index Total 2016 vs. 2015 Consumer Price
MMO Economic Board. Milk Market Observatory. Meeting of 28 November 2017
 Milk Market Observatory Last update : 29.11.2017 MMO Economic Board Meeting of 28 November 2017 o The 24th meeting of the MMO Economic Board took place on 28/11/2017, with the participation of experts
TRENDS IN SALES OF MEAT PRODUCTS A RETAIL PERSPECTIVE. Meat Market Observatory 25 June 2018
 TRENDS IN SALES OF MEAT PRODUCTS A RETAIL PERSPECTIVE Meat Market Observatory 25 June 2018 Belgium Product category Total pigmeat Price evolution (% change Apr-18 vs Apr-17) Price evolution (% change Jan-Apr
GLOBAL DAIRY UPDATE KEY DATES MARCH 2017
 MARCH 2017 GLOBAL DAIRY UPDATE European milk production decreased for the seventh consecutive month, while the US remains strong. The rate of decline in New Zealand production is easing. US exports continue
SFR Condo Residential Lot Sales Inventory Sales Inventory Sales Inventory. Month YTD Month Month YTD Month Month YTD Month
 Grand Strand Market Report 2018 was a strong month for sales activity in the Grand Strand with SFR and condo sales volume up 5.11% and 19.14%, respectively, for the month. Residential lot sales are also
For personal use only
 SEPTEMBER 216 GLOBAL DAIRY UPDATE European milk production has decreased for the first time since early 215, with volumes in June down 2 compared to last year. Last week we announced our annual results,
Price monitoring of key food items in Donetsk and Luhansk Oblasts
 Market update Issue (October ) UKRAINE Price monitoring of key food items in Donetsk and Luhansk Oblasts Fighting hunger worldwide Highlight Cost of food basket remained higher at national level throughout
SFR Condo Residential Lot Sales Inventory Sales Inventory Sales Inventory. Month YTD Month Month YTD Month Month YTD Month
 Grand Strand Market Report 2017 Grand Strand market activity took a slight step back in after 3 months of steady growth. SFR sales volume dropped 5.7% for the month but is still up 7.2% year-to-date. The
SFR Condo Residential Lot Sales Inventory Sales Inventory Sales Inventory. Month YTD Month Month YTD Month Month YTD Month
 Grand Strand Market Report 2016 Sales activity in the Grand Strand ended 2016 with a solid month of sales. SFR sales are up 2.0% for the month and up 4.1% for the year; setting a new market record for
SFR Condo Residential Lot Sales Inventory Sales Inventory Sales Inventory. Month YTD Month Month YTD Month Month YTD Month
 Grand Strand Market Report 2017 SFR sales activity slides in as full year production flat to 2016. Tightening inventory contributing to SFR sales price growth. Condo sales volume and median sales prices
Coffee prices maintain downward trend as 2015/16 production estimates show slight recovery
 Coffee prices maintain downward trend as 2015/16 production estimates show slight recovery The coffee market fell again in December 2015, reaching its second lowest monthly average of the year. This decrease
Problem Set #3 Key. Forecasting
 Problem Set #3 Key Sonoma State University Business 581E Dr. Cuellar The data set bus581e_ps3.dta is a Stata data set containing annual sales (cases) and revenue from December 18, 2004 to April 2 2011.
Fresh Produce Report. P13: 12 w/e 3rd January Kantar Worldpanel
 Fresh Produce Report P13: 12 w/e 3rd January 2016 1 HOW IS TOTAL PRODUCE PERFORMING? Total Produce is worth 2.1bn and is growing by 4.1% compared to the same period last year. Much of this is driven by
QUARTERLY REVIEW OF THE PERFORMANCE OF THE DAIRY INDUSTRY 1
 QUARTERLY REVIEW OF THE PERFORMANCE OF THE DAIRY INDUSTRY 1 The information in this document is from sources deemed to be correct. Milk SA, the MPO and SAMPRO are not responsible for the results of any
2007 Sonoma Research Associates - All rights reserved.
 2007 Sonoma Research Associates - All rights reserved. Practical Applications of the Price Elasticity of Demand Presented by Dan Karnowsky, President Sonoma Research Associates Presented at Competitive
Mango Retail Performance Report 2017
 Mango Retail Performance Report 2017 1 Table of Contents Pages 3-9 Pages 10-15 Pages 16-34 Pages 35-44 Pages 45-51 Pages 52-54 Executive Summary Fruit and Tropical Fruit Performance Whole Mango Performance
CONSUMER PRICE INDEX : April April 2014 Local, imported and all items
 SDT:339 CONSUMER PRICE INDEX : 03 04, imported and all items 4.0.0 08.0 Index 06.0 0.0 98.0 96.0 94.0 Apr Apr Mar 03 Mar Feb Jan Dec Nov Oct Sep Aug Jul Jun Apr 9.0 04 All Items Fig : Graphical representation
LETTER FROM THE EXECUTIVE DIRECTOR
 E LETTER FROM THE EXECUTIVE DIRECTOR COFFEE MARKET REPORT December 2008 Price levels in December confirmed the downward trend recorded in the coffee market since September 2008. The monthly average of
BRUSSELS, 4 OCTOBER 2012 HANS-CHRISTOPH BEHR, AMI, BONN
 The Demand for fresh Tomatoes in Europe BRUSSELS, 4 OCTOBER 2012 HANS-CHRISTOPH BEHR, AMI, BONN Agenda Fresh Tomato Consumption in different European Countries Development of Tomato Consumption in Germany
Coffee market continues downward trend
 Coffee market continues downward trend Since August 2017, the ICO composite indicator price has declined in each month except January 2018. The composite indicator decreased by 1.1% in March 2018 to an
Coffee market recovers slightly from December slump
 Coffee market recovers slightly from December slump After reaching its lowest level in 22 months in December 2017, the monthly average of the ICO composite indicator price increased by 1.4% to 115.60 US
much better than in As may be seen in Table 1, the futures market prices for the next 12 months
 Dairy Outlook December 2009 By Jim Dunn Professor of Agricultural Economics, Penn State University Market Psychology prices are higher than last month, especially Class IV. The outlook for dairy prices
Dairy Outlook. December By Jim Dunn Professor of Agricultural Economics, Penn State University. Market Psychology
 Dairy Outlook December 2015 By Jim Dunn Professor of Agricultural Economics, Penn State University Market Psychology The Class III market has taken a beating lately as cheese prices have drifted down and
World coffee consumption increases but prices still low
 World coffee consumption increases but prices still low The coffee market stabilised slightly in February, but prices remain at very low levels. A lack of news regarding fundamentals with expectations
Coffee market ends 2016/17 coffee year in deficit for the third consecutive year
 Coffee market ends 2016/17 coffee year in deficit for the third consecutive year The ICO composite indicator continued its downward trend that started at the end of August, averaging 124.46 US cents/lb.
Record Exports for Coffee Year 2016/17
 Record Exports for Coffee Year 2016/17 Total exports in September 2017 reached 8.34 million bags, compared to 9.8 million in September 2016. While coffee year 2016/17 registered a decrease in its final
Seasonal trends in hectares planted, sales volumes on markets and market prices. Pieter van Zyl, Potatoes South Africa
 Seasonal trends in hectares planted, sales volumes on markets and market prices Pieter van Zyl, Potatoes South Africa Producers plant between 5 and 54 hectares of potatoes each year. According to Figure
Record exports in coffee year 2017/18
 Record exports in coffee year 2017/18 Total coffee exports increased each year since 2010/11 with a new record reached in 2017/18 at 121.86 million bags, 2% higher than 2016/17. In the twelve months ending
Globalization of Agriculture: An Ownership and Market Perspective. Ken Sullivan March 7, 2017
 Globalization of Agriculture: An Ownership and Market Perspective Ken Sullivan March 7, 2017 History and Context 3 $14BN COMPANY THAT OPERATES IN 23 U.S. STATES AND 5 COUNTRIES Smithfield s vertically
July marks another month of continuous low prices
 July marks another month of continuous low prices In July 2018, the ICO composite indicator price decreased by 2.9% to an average of 107.20 US cents/lb, which is the lowest monthly average for July since
Coffee market ends 2017/18 in surplus
 Coffee market ends 217/18 in surplus World coffee production in coffee year 217/18 is estimated 5.7% higher at 164.81 million bags as output of Arabica increased by 2.2% to 11.82, and Robusta grew 11.7%
Growing divergence between Arabica and Robusta exports
 Growing divergence between Arabica and Robusta exports In April 218, the ICO composite indicator decreased by.4% to an average of 112.56, with the daily price ranging between 11.49 and 114.73. Prices for
Coffee market settles lower amidst strong global exports
 Coffee market settles lower amidst strong global exports The ICO composite indicator price declined by 1.2% in February 2018 to an average of 114.19 US cents/lb. Indicator prices for all three Arabica
Networkers Business Update. December 2014
 Networkers Business Update December 2014 Agenda Forecast Milk Price Global markets V3 Strategy Growing our share of New Zealand milk Page 2 Forecast Milk Price 110 100 2012/13 2013/14 2014/15 Forecast
MANGO PERFORMANCE BENCHMARK REPORT
 MANGO PERFORMANCE BENCHMARK REPORT 2015-2016 TABLE OF CONTENTS Page 3 Page 5 Page 12 Page 15 Page 27 Page 36 Page 46 Approach and Data Set Parameters Overview and Mango Trend-Spotting Fruit and Tropical
CMG GardenNotes #746 Climate Summary: Fort Collins, Greeley, and Estes Park, Colorado
 CMG GardenNotes #746 Climate Summary: Fort Collins, Greeley, and Estes Park, Colorado Monthly Temperatures Jan Feb Mar Apr Jun Jul Aug Sept Oct Nov Dec Annual Estes Park average extreme high 53 55 60 69
Consumer Price Index
 KINGDOM OF Consumer Price Index Website: E-mail : Statistics Department P.O. Box 149 Nuku alofa Kingdom of Tonga www.spc.int/prism/tonga/ dept@stats.gov.to Mar, 2018 Price: $ 2.50 Fig 3: Contribution
GPS Leaders Conference: Global Dairy & Milk Protein Opportunities November 2016
 GPS Leaders Conference: Global Dairy & Milk Protein Opportunities November 2016 2 If this can happen..anything can happen! 3 Topics covered + Hoogwegt Organization + US Dairy Export Update + Global Trends
MONTHLY COFFEE MARKET REPORT
 E MONTHLY COFFEE MARKET REPORT November 2010 Coffee prices rose sharply during the month of November with the monthly average of the ICO composite indicator price reaching a level of 173.90 US cents per
World Dairy Situation. IDF SC DPE, Paris April 11, 2013
 World Dairy Situation IDF SC DPE, Paris April 11, Current dairy situation Dairy production progressed in 2012 in supplying regions but is now stabilizing, even declining in some countries Export demand
MONTHLY COFFEE MARKET REPORT
 E MONTHLY COFFEE MARKET REPORT May 2014 After five consecutive months of rising prices, the coffee market reversed lower in May. From a high of 179 cents/lb in April, the daily price of the ICO composite
Industry Advisory Panel Item 4c Trade of Stainless Steel Scrap
 Industry Advisory Panel Item 4c Trade of Stainless Steel Scrap Lisbon Tuesday 22 April 2008 Sven Tollin Chief Statistician 1 Stainless Steel Waste & Scrap Comparison calendar with Except Kazakhstan only
Coffee market ends 2014 at ten month low
 Coffee market ends 2014 at ten month low Coffee prices continued to slide downwards in December 2014, with the monthly average of the ICO composite indicator at its lowest level since February. Recent
The Portuguese clipfish market 2017
 The Portuguese clipfish market 2017 08.02.2018 Johnny Thomassen Fiskeriutsending i Portugal On this presentation we will try to answer: - How is the Portuguese economy doing? - Are the consumer habits
Coffee prices rose slightly in January 2019
 Coffee prices rose slightly in January 2019 In January 2019, the ICO composite indicator rose by 0.9% to 101.56 US cents/lb as prices for all group indicators increased. After starting at a low of 99.16
Record exports from Brazil weigh heavy on the coffee market
 Record exports from Brazil weigh heavy on the coffee market Coffee exports from Brazil reached a record high of 36.8 million bags in crop year 2014/15 (April to March), fuelled by domestic stocks and encouraged
LETTER FROM THE EXECUTIVE DIRECTOR COFFEE MARKET REPORT. November 2004
 International Coffee Organization Organización Internacional del Café Organização Internacional do Café Organisation Internationale du Café E LETTER FROM THE EXECUTIVE DIRECTOR COFFEE MARKET REPORT November
LETTER FROM THE EXECUTIVE DIRECTOR
 E LETTER FROM THE EXECUTIVE DIRECTOR COFFEE MARKET REPORT April 2010 Prices of Colombian Milds and Brazilian Naturals were slightly down in April compared to their levels in March while prices of Other
Coffee Season 2013/14 Finishes in Balance but Deficit Expected Next Year
 Coffee Season 2013/14 Finishes in Balance but Deficit Expected Next Year Coffee prices were volatile again over the course of September, mostly reacting to weather news from Brazil. Daily prices fell initially
Sugar scenario in CIS countries:
 Sugar scenario in CIS countries: on the way to self-sufficiency Andrey Bodin Eurasian Sugar Association Commonwealth of Independent States (CIS) consists of 11 countries CIS Moldova Belarus Population
Downward correction as funds respond to increasingly positive supply outlook
 Downward correction as funds respond to increasingly positive supply outlook Coffee prices fell sharply at the end of April as institutional investors sold off their positions. The coffee market continues
USDA Dairy Import License Circular for 2019
 USDA Dairy Import License Circular for 2019 Commodity/Note Country Name TRQ Jan Feb Grand Total NonCheese 21,864,781 322,073 1,438,863 1,760,936 BUTTER (Note 6, G) 6,977,000 158,425 1,055,472 1,213,897
Prices for all coffee groups increased in May
 Prices for all coffee groups increased in May In May 2018, the ICO composite indicator increased by 0.7% to an average of 113.34 US cents/lb, following three months of declines. Prices for all coffee groups
Barilla Pasta Meal Seasons Post- Holiday Bemer For You
 Barilla Pasta Meal Seasons Post- Holiday Bemer For You January March Post- Holiday BFY Seasonal Opportunity Bemer For You Pasta and Sauces Barilla PLUS Barilla Whole Grain Barilla White Fiber Post- Holiday
COMMITTEE ON COMMODITY PROBLEMS INTERGOVERNMENTAL GROUP ON TEA NINETEENTH SESSION. New Delhi, India, May 2010
 May 2010 CCP:TE 10/CRS 19 E COMMITTEE ON COMMODITY PROBLEMS INTERGOVERNMENTAL GROUP ON TEA NINETEENTH SESSION New Delhi, India, 12 14 May 2010 MARKET DEVELOPMENTS IN SELECTED COUNTRIES INDIA Indian Tea-
Volatility returns to the coffee market as prices stay low
 Volatility returns to the coffee market as prices stay low Daily coffee prices hit their lowest level in 19 months during August, as commodity markets worldwide were negatively affected by currency movements
2018/19 expected to be the second year of surplus
 2018/19 expected to be the second year of surplus Coffee year 2018/19 is expected to be the second consecutive season of surplus, as global output, estimated at 167.47 million bags, exceeds world consumption,
GLOBAL DAIRY UPDATE KEY DATES FEBRUARY Continued strong import demand for dairy in China. Latin America and Asia imports decrease.
 FEBRUARY 2018 GLOBAL DAIRY UPDATE Continued strong import demand for dairy in China. Latin America and Asia imports decrease. Fonterra and The a2 Milk Company form comprehensive strategic relationship.
Source : Intl Coffee Org. Other Milds. Brazil 26,08 % 29,28 % 28,27 % 26,37 % 28,81 % 39,76 % 27,78 % 34,19 % Prices Kenya
 2 nd World Coffee Conference, Bahia 23-25 September 25 Lesson emerging from the crisis : New paths for the coffee sector Session 2 : Coffee policies in a market economy Giuseppe Lavazza Source : Intl Coffee
Soybean Oil and Palm Oil Account For An Increasing Share of World Vegetable Oil Consumption
 United States Department of Agriculture Foreign Agricultural Service Circular Series FOP 01-03 January 2003 Soybean Oil and Palm Oil Account For An Increasing Share of World Vegetable Oil Consumption Percent
STANDARDIZED MILK PRICE CALCULATIONS for DECEMBER 2013 deliveries
 STANDARDIZED MILK PRICE CALCULATIONS for DECEMBER deliveries Company Milcobel Alois Müller Nordmilch Arla Foods Hämeenlinnan Osuusmeijeri Bongrain CLE (Basse Normandie) Da (Pas de Calais) Lactalis (Pays
For personal use only
 DECEMBER 2016 GLOBAL DAIRY UPDATE New Zealand, Australia and Europe continue to see decreased milk production while United States growth is maintained. Solid growth in exports for the month across all
MONTHLY COFFEE MARKET REPORT
 E MONTHLY COFFEE MARKET REPORT February 2014 February 2014 has seen significant developments in the coffee market, with prices shooting upwards at a startling rate. The ICO composite daily price has increased
MONTHLY COFFEE MARKET REPORT
 E MONTHLY COFFEE MARKET REPORT June 2012 In June 2012 coffee prices, particularly those of Arabicas, continued the fall recorded in recent months. The drop in Robusta prices was less marked than in the
MONTHLY COFFEE MARKET REPORT
 E MONTHLY COFFEE MARKET REPORT August 2012 Coffee prices experienced negative corrections across the board in August 2012, with the ICO composite indicator falling by 6.6% compared to July. This continues
MONTHLY COFFEE MARKET REPORT
 1 E MONTHLY COFFEE MARKET REPORT March 2014 Ongoing uncertainty over the Brazilian coffee crop has caused significant fluctuations in coffee prices during March, with monthly volatility of the International
Outline. Long-term Outlook for Cotton Consumption. World End-Use Consumption of Textile Fibers. World Consumption of Textile Fibers
 World Cotton Supply and Use International Cotton Advisory Committee Secretariat Outline! Long-term Outlook for Consumption! Outlook for /! Developments in World Cotton Trade Fifth Open Session: Cotton
Overview of the Manganese Industry
 39th Annual Conference Istanbul, Turkey 2013 Overview of the Manganese Industry International Manganese Institute Alberto Saavedra Market Research Manager June, 2013 Introduction Global Production Supply,
% of Reference Price 190% Jan Feb Mar Apr May Jun Jul Aug Sep Oct Nov Dec Beef & Veal Production (E28 Slaughtering) - Tonnes
 - Tonnes") Trade Prices Production Production & Stocks DG AGRI DASHBOARD: BEEF AND VEAL Last update: 23.11217 Carcasse Live Animals 2.2% 9.3% -6.3% -4.% -1.9% -6.2% 5.2% /1 kg Tonnes cw /head /kg 14.2% 1.1% -1.7%
Trade Prices Production Production & Stocks DG AGRI DASHBOARD: BEEF AND VEAL Last update: 23.11217 Carcasse Live Animals 2.2% 9.3% -6.3% -4.% -1.9% -6.2% 5.2% /1 kg Tonnes cw /head /kg 14.2% 1.1% -1.7%
Coffee market remains volatile but lacks direction
 Coffee market remains volatile but lacks direction Prices fluctuated significantly during August, with the ICO composite indicator dropping by 10 cents before jumping back up another 12 cents by the end
Outlook for the World Coffee Market
 Outlook for the World Coffee Market International Coffee Council 26-3 September 211 London, England José Sette Executive Director a.i. ICO composite indicator price Daily: 1 October 29 to 26 September
Global Considerations
 What Does Being a Global Player Mean to the U.S. Dairy Sector? Global Considerations 2 1 A Decade of Change $8, 4,5 $7, 4, (Million $) $6, $5, $4, $3, $2, $1, 3,5 3, 2,5 2, 1,5 1, 5 (Million Lbs.) $ 23
OUR POTENTIAL. Business Update MAY 2017
 OUR POTENTIAL Business Update MAY 2017 Disclaimer This presentation may contain forward-looking statements and projections. There can be no certainty of outcome in relation to the matters to which the
IN THIS ISSUE FEBRUARY Financial Calendar: Late September 2014 Annual Results Announced. 26 March 2014 Interim Results Announced
 FEBRUARY 2014 Welcome to our latest Global Dairy Update. This update is part of Fonterra s commitment to informing our farmers and wider stakeholders about the global dairy market, trends in New Zealand
Drinks Ontario Fall Members Meeting 22 November 2013
 Drinks Ontario Fall Members Meeting 22 November 2013 Shari Mogk-Edwards Vice President, Products, Sales and Merchandising Kathy Cannon Director, VINTAGES Dave Misetich Inventory Manager, VINTAGES Kelly
Brazil. Citrus Semi-annual. Fresh Oranges and Orange Juice
 THIS REPORT CONTAINS ASSESSMENTS OF COMMODITY AND TRADE ISSUES MADE BY USDA STAFF AND NOT NECESSARILY STATEMENTS OF OFFICIAL U.S. GOVERNMENT POLICY Required Report - public distribution Date: GAIN Report
THIS REPORT CONTAINS ASSESSMENTS OF COMMODITY AND TRADE ISSUES MADE BY USDA STAFF AND NOT NECESSARILY STATEMENTS OF OFFICIAL U.S.
 THIS REPORT CONTAINS ASSESSMENTS OF COMMODITY AND TRADE ISSUES MADE BY USDA STAFF AND NOT NECESSARILY STATEMENTS OF OFFICIAL U.S. GOVERNMENT POLICY Required Report - public distribution Date: 5/16/2016
Agricultural Exports, Economic Prospects and Jobs
 Agricultural Exports, Economic Prospects and Jobs West Hills Community College District Essential Elements Harris Ranch Inn and Conference Center November 6, 2014 Daniel A. Sumner University of California
What Does Being a Global Player Mean to the U.S. Dairy Sector?
 What Does Being a Global Player Mean to the U.S. Dairy Sector? Global Considerations Copyright of Daily Dairy Report, Inc. 2 A Decade of Change $8,000 4,500 $7,000 4,000 (Million $) $6,000 $5,000 $4,000
MONTHLY COFFEE MARKET REPORT
 E MONTHLY COFFEE MARKET REPORT July 2011 Downward corrections to coffee prices recorded in June continued during July 2011, as the monthly average of the ICO composite indicator price fell to 210.36 US
GLOBAL DAIRY UPDATE KEY DATES MAY New Zealand production for the 2016/17 season (from 1 June 2016) is down 2% to the end of March.
 is down 2% to the end of March.") MAY 2017 GLOBAL DAIRY UPDATE New Zealand production for the 2016/17 season (from 1 June 2016) is down 2 to the end of March. US exports rate of growth is declining. New Zealand and Australia exports up
MAY 2017 GLOBAL DAIRY UPDATE New Zealand production for the 2016/17 season (from 1 June 2016) is down 2 to the end of March. US exports rate of growth is declining. New Zealand and Australia exports up
GLOBAL DAIRY UPDATE KEY DATES DECEMBER 2017
 DECEMBER 2017 GLOBAL DAIRY UPDATE Demand for dairy remains strong in China and Asia. Middle East and Africa and Latin America imports decline. Dairy exports from New Zealand and the USA continue to decline.
MONTHLY COFFEE MARKET REPORT
 E MONTHLY COFFEE MARKET REPORT December 2011 In December 2011 Arabica prices underwent significant downward corrections while Robusta prices increased slightly. The average of the 2 nd and 3 rd positions
MONTHLY COFFEE MARKET REPORT
 E MONTHLY COFFEE MARKET REPORT June 2013 Coffee prices fell sharply in June 2013, as market fundamentals, combined with an uncertain macroeconomic outlook, drove the ICO composite indicator price to its
GDT AUCTIONS. From September 2010 GDT auctions were held twice a month.
 GDT AUCTIONS After much controversy, in July 2008, NZ dairy giant Fonterra launched a monthly dairy product auction. They set up a subsidiary globaldairytrade to oversee the auction which was contracted
(A report prepared for Milk SA)
") South African Milk Processors Organisation The voluntary organisation of milk processors for the promotion of the development of the secondary dairy industry to the benefit of the dairy industry, the consumer
South African Milk Processors Organisation The voluntary organisation of milk processors for the promotion of the development of the secondary dairy industry to the benefit of the dairy industry, the consumer
LETTER FROM THE EXECUTIVE DIRECTOR
 E LETTER FROM THE EXECUTIVE DIRECTOR COFFEE MARKET REPORT January 2010 The upward trend in coffee prices recorded in December2009 continued during the first fortnight of 2010, with the monthly average
Welcome to our May 2014 Global Dairy Update
 Welcome to our May 2014 Global Dairy Update IN THIS EDITION New Zealand milk volumes 8% higher and Australia 3% lower to 30 April 2014 Business Update: NZ Milk Products third quarter update Regulatory
China s Export of Key Products of Pharmaceutical Raw Materials
 China s Export of Key Products of Pharmaceutical Raw Materials During the period of the 62nd API China& INTERPHEX CHINA, China Pharmaceutical Industry Association released its annual Report on Analysis
THOMSON REUTERS INDICES CONTINUOUS COMMODITY TOTAL RETURN INDEX
 THOMSON REUTERS INDICES CONTINUOUS COMMODITY TOTAL RETURN INDEX December 2012 1 TABLE OF CONTENTS Index Description 3 Methodology 3 Contract Roll 4 Real-Time Pricing Considerations 4 Constituent Contracts
GLOBAL DAIRY UPDATE KEY DATES NOVEMBER Foodservice business tops $2 billion in revenue.
 NOVEMBER 2017 GLOBAL DAIRY UPDATE Strong growth in dairy imports continues in China and Asia. Middle East and Africa imports continue to soften. Foodservice business tops $2 billion in revenue. Further
THIS REPORT CONTAINS ASSESSMENTS OF COMMODITY AND TRADE ISSUES MADE BY USDA STAFF AND NOT NECESSARILY STATEMENTS OF OFFICIAL U.S.
 THIS REPORT CONTAINS ASSESSMENTS OF COMMODITY AND TRADE ISSUES MADE BY USDA STAFF AND NOT NECESSARILY STATEMENTS OF OFFICIAL U.S. GOVERNMENT POLICY Required Report - public distribution Date: GAIN Report
Sunflower & Soybean Forum
 Sunflower & Soybean Forum 28 November 2016 Nico Hawkins General Manager Sunflower Sunflower: Supply & Demand National vs. International Marketing season SAGIS NAMC (S&D) International (USDA) Mar - Feb
Dairy Market. November 2017
 Dairy Market Dairy Management Inc. R E P O R T Volume 20 No. 10 November 2017 DMI NMPF Overview U.S. Cheddar cheese prices hit a 10-month high in October, while butter prices softened but remained well
COMPANY PRESENTATION STAR CONFERENCE LONDON 2006, 27 th September
 COMPANY PRESENTATION STAR CONFERENCE 2006 LONDON 2006, 27 th September AGENDA 1. THE GROUP AT A GLANCE 2. MARKET OVERVIEW 3. FINANCIALS 4. SHARE PRICE 5. STRATEGY STAR CONFERENCE 2006 Pag. 2 SPEAKERS LUIGI
Dairy Market R E P O R T
 Volume 18 No. 12 Dairy Market R E P O R T D e c e m b e r 2 0 1 5 DMI NMPF Overview The U.S. average all-milk price, which spent seven months of 2015 hovering around $16.70 per hundredweight, has moved
Ceramic Sanitary Ware Produced by IAR Team Focus Technology Co., Ltd.
 Ceramic Sanitary Ware 2013.04 Produced by IAR Team Focus Technology Co., Ltd. Contents 1. Chinese Ceramic Sanitary Ware Industry Exports Analysis...4 1.1. 2010-2012 Chinese Ceramic Sanitary Ware Export
WEEKLY MAIZE REPORT 28 NOVEMBER 2018
 WEEKLY MAIZE REPORT 28 NOVEMBER 2018 Unigrain (Pty) Ltd Tel. No. : +27 11 692 4400 Fax. No. : +27 11 412 1183 INTERNATIONAL MARKET Table 1: CME Maize prices and weekly changes (cents/bushel) Currently
WFP MONTHLY MARKET UPDATE
 WFP MONTHLY MARKET UPDATE SUDAN, MAY 218 Highlights The national average retail price of sorghum significantly increased by 9.7 percent, in WFP areas, compared to the previous month. The retail prices