HERE ARE SOME HIGHLIGHTS FROM THIS YEAR S REPORT:
|
|
|
- Kenneth Bryan Park
- 6 years ago
- Views:
Transcription
1
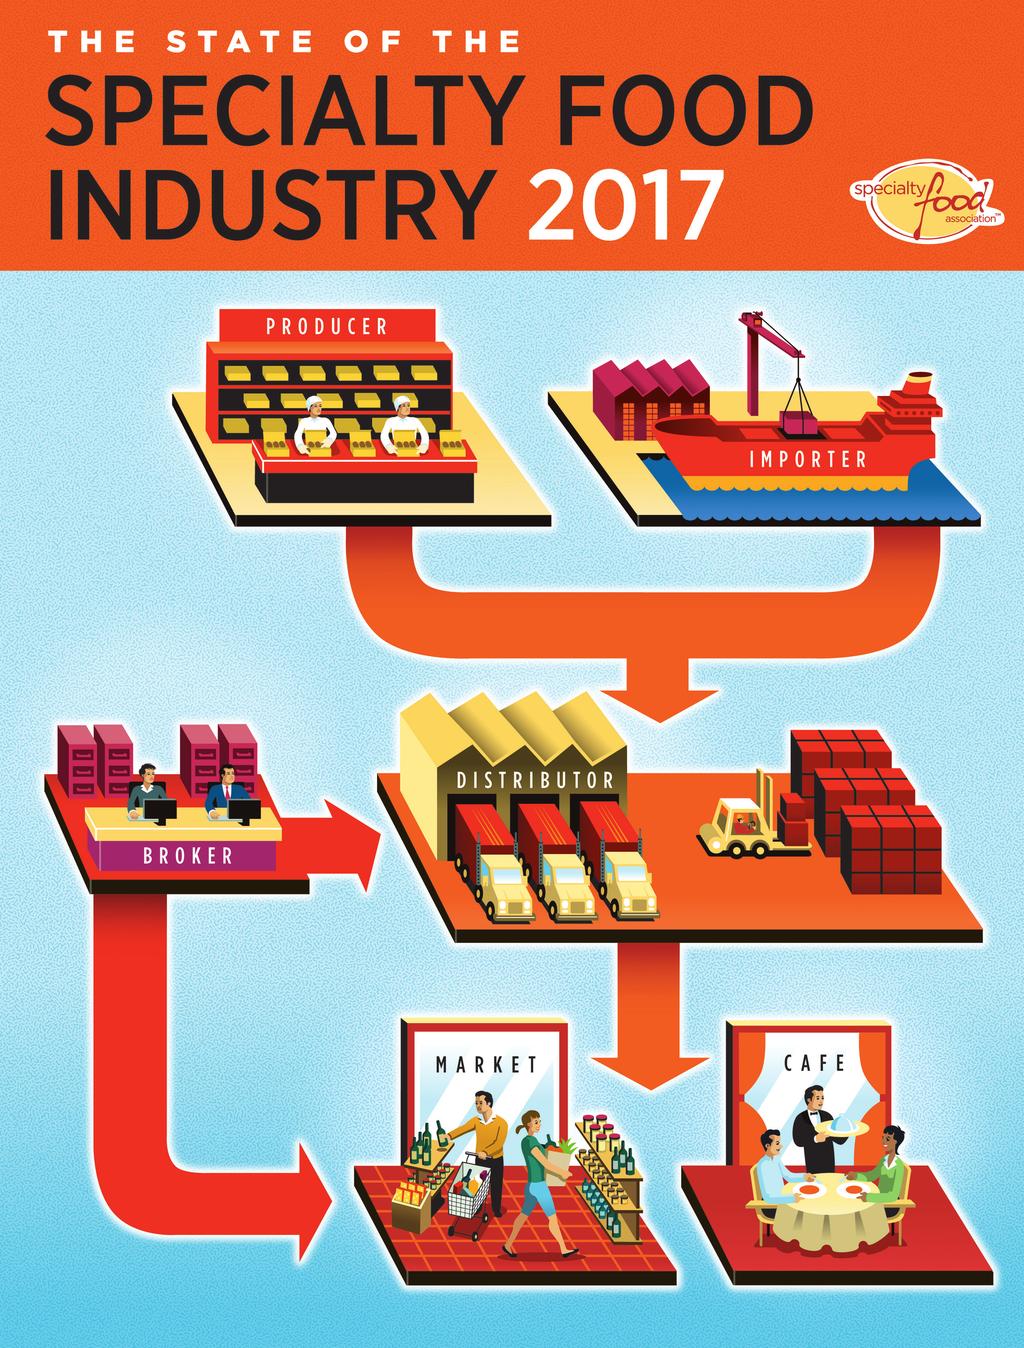
2 by Ron Tanner and Denise Purcell The specialty food industry continues to grow at a strong clip. Dollar sales hit $127 billion, a 15 percent jump in total sales between 2014 and, according to the State of the Specialty Food Industry, an annual report published by the Specialty Food Association and Mintel. By comparison, retail sales of all food grew by an anemic 2.3 percent. Total unit sales for specialty foods were up 13.6 percent. Specialty foods are outpacing their non-specialty counterparts in almost every category, as consumers continue to become more aware of quality in their food choices. Categories aligned with better-for-you options, health and wellness, and freshness are growing fastest. HERE ARE SOME HIGHLIGHTS FROM THIS YEAR S REPORT: Seventy-eight percent of specialty food sales happen at retail; between 2014 and retail sales growth was slightly stronger than foodservice, 15.4 percent versus 13.7 percent. Specialty retailers achieved total sales of nearly $6.4 billion in, about 11 percent of the total market. Dollar sales grew 12 percent between 2014 and, the most modest among retail channels during this time period. Natural stores (excluding Whole Foods Market) comprise the smallest retail channel for specialty foods, at $4.3 billion in sales last year. Dollar sales grew 14 percent between 2014 and. Specialty foods account for 14.8 percent of all food sales at retail, equaling categories such as meat and produce. Protein continues to dominate, with the top two categories Cheese and Plant-Based Cheese and Frozen and Refrigerated Meat, Poultry, and Seafood at $4.42 billion and $3.74 billion, respectively. Seven of the 10 fastest growing categories are refrigerated or frozen. Only four of 61 specialty categories recorded sales declines between 2014 and. Gluten-free, Non-GMO, and Convenient/Easy to Prepare lead product innovation plans of manufacturers for Retailers average transaction size increased 19 percent in. ABOUT THE RESEARCH The Specialty Food Association s State of the Specialty Food Industry is a joint research project prepared by Mintel and SPINS/IRI. The research encompasses the three most recent calendar years of sales data and includes figures for 61 specialty food categories, pulled from the SPINS database of mainstream and natural food stores. In addition, Mintel surveyed specialty food manufacturers, importers, distributors, brokers, and retailers to develop the statistics presented in this report. load a full, 175-page report with full charts and data as well as more information at: specialtyfood.com/stateindustry2017 Illustrations: Maria and Peter Hoey 2 STATE OF THE SPECIALTY FOOD INDUSTRY 2017
3 Insights and Takeaways Here are some discoveries about the growing sales channels, product categories, and areas of consumer interest that can help retailers and producers better position and grow their businesses. Online slows traditional sales growth. While the specialty food industry enjoyed an overall upturn, growth at retail and foodservice slowed over the previous year, to 5.5 percent versus 9.1 percent in Increased purchases online contributed to slower year-over-year growth, says Mintel. Manufacturers report a decreasing percentage of sales from brick-and-mortar retailers. While those stores still account for the most sales (64 percent), numbers have trended downward since 2014, as channels like third-party e-commerce sites and their own direct-to-consumer websites have gained ground. Mainstream retail channels heat up. Millennials, a convenience-oriented consumer group, buy specialty foods wherever they shop. This trend has helped drive sales in multi-unit grocery and mass merchants, where growth outpaced that of natural or specialty chains for the first time. Emerging discounters like Aldi and Lidl, which offer specialty products, are both planning significant U.S. expansion, which is concerning to retailers. Foodservice is a bright spot. Manufacturers say fine dining restaurants are among their fastestgrowing channels, and point to other foodservice institutions like hotels and universities as among their biggest successes last year. The sector is ripe for continued growth as foodservice operators seek out specialty products to enhance menus, create efficiencies, and provide solutions. Even traditional retailers are citing success with cafes and catering services. Producers could well position themselves to determine how their products fit in foodservice and to build up their contacts and infrastructure to service the channel. Specialty beverages outpace growth of food. Sales of specialty beverages, which hit $10.5 billion in, represent about 18 percent of the total specialty retail market. Though specialty food accounts for the majority of market share at 82 percent, beverage growth outperformed that of food between 2014 and, at 24 percent versus 15 percent. Water, Refrigerated Juices and Functional Beverages, Shelf-Stable and Refrigerated RTD Tea and Coffee are all driving this increase. Center store is alive and well. Fresh and perishable categories are king, but center store is hardly dead, and retailers shouldn t be too aggressive with space allocation cutbacks. Grocery shelf-stable specialty foods accounted for 61 percent of the total specialty food market in, or $36.2 billion. It was led by strong growth performance in categories like Water, Wellness Bars and Gels, and Nut and Seed Butters, which all grew 20 percent or more. Specialty snack foods nab over one-quarter of the total market. As snacking becomes the norm, the segment now commands about 28 percent of the total specialty food market. Sales reached $16.3 billion in, a 16 percent jump. Of the 13 snack segments represented in the report (including Chips, Pretzels, and Snacks; Chocolate and Confectionery; Yogurt and Kefir; Nuts, Trail Mix, Dried Fruit; Refrigerated Juices and Functional Beverages; Cookies and Snack Bars; Refrigerated Salsas and Dips; Wellness Bars and Gels; Crackers and Crispbreads; Frozen Appetizers and Snacks; Nut and Seed Butters; Jerky and Meat Snacks; and Rice Cakes), about half experienced growth of more than 20 percent, led by Jerky and Meat Snacks. Consumer interest shifts to sustainable. Organic, Non-GMO, and Local often make the supply chain s list of claims more interesting to consumers currently or in the near future. This year, the Sustainable claim is getting more attention from the supply chain. Close to 40 percent of manufacturers produced Sustainable products, up from 22 percent last year. Among retailers, sustainable products accounted for 16 percent of sales, and share increased notably this year. Along with Non-GMO, the supply chain predicts Sustainable will be the claim most interesting to consumers in the next three years. Trending categories: Jerky, probiotics, and bars. Jerky is still on fire: sales reached $235 million in, and consumer interest in protein snacks has contributed to extremely strong growth (+86 percent) since Among the largest categories in unit sales ranking, the top five fastest-growing include two perishable segments; Yogurt and Kefir (+19 percent), and Refrigerated Juices and Functional Beverages (+35 percent), predominantly made up of kombucha drinks. Both segments share a common thread: probiotics. Specialty Wellness Bars and Gels sales reached $1.2 billion in, and nearly half of all bar/gel sales are now coming from these types of products, a clear indication of how far the segment has come from its athletic bar origins. The category is innovating across usage occasions and nutritional needs, and is fueled by trends in snacking, protein, and portability. STATE OF THE SPECIALTY FOOD INDUSTRY

4 THE SIZE OF THE SPECIALTY FOOD INDUSTRY AT RETAIL AND FOODSERVICE Total U.S. Sales of Specialty Food In millions of dollars 2014 Retail Channels* $86,412 Food Service $24,368 Total $110, $94,385 $26,428 $120,813 $99,706 $27,718 $127,425 % Share 78.2% % Change 15.4% 13.7% 15. $ $ $ $ What You Need to Know Foodservice is an essential part of the specialty food mix, representing almost 22 percent of specialty food sales. Focusing on this channel is important for manufacturers. /SPINS/IRI *Retail channels include sales from natural, specialty, and MULO** outlets, as well as an estimate for specialty food perishables (PLU or random-weight specialty items sold in bakery, deli, meat, and seafood) sold in these outlets. In addition, these figures include estimated specialty food sales from Trader Joe's and Whole Foods Market. ** MULO, or multi outlet, is representative of the following channels: total U.S. grocery, mass, total U.S. drug, total Walmart, dollar, military, and club. SPECIALTY FOODS Natural Food Market What You Need to Know Mainstream competition is intensifying. Larger retailers are recognizing that specialty appeals to their customers and can help improve the bottom line. Millennials shopping habits will continue to drive this. Sales of Specialty Food by Retail Channel In millions of dollars Mainstream Stores* Specialty Food Stores Natural Food Stores Total 2014 $48,643 $6,361 $4,251 $59,075 % Share 82.1% 10.7% 7.1% 10 % Change % /SPINS/IRI * MULO, or multi outlet, is representative of the following channels: total U.S. grocery, mass, total U.S. drug, total Walmart, dollar, military, and club. Does not include private-label sales, random weight (PLU) items, or sales through Trader Joe's or Whole Foods Market. Editor s note: The market size for the specialty food industry has been calculated as follows: SPINS provides three-year scanner data sales for food, drug, and mass segments and natural supermarkets (excluding Trader Joe s, Walmart, and Whole Foods Market) for sales in 61 categories. To reach the U.S. sales total, Mintel added estimated sales of products that were not collected by scanner data. This includes PLU sales through all channels, including specialty food stores, as well as sales through Trader Joe s and Whole Foods Market, but not Walmart. 4 STATE OF THE SPECIALTY FOOD INDUSTRY 2017
5 SALES OF SPECIALTY FOOD BY CATEGORIES Here is a snapshot of the largest and fastest-growing specialty food categories by dollar sales, as well as those with the highest market share. The pages that follow offer a more in-depth explanation of this data. Retail Sales of Specialty Food: Top 10 Categories In millions of dollars Cheese and Plant-Based Cheese $4,422 Frozen and Refrigerated Meat, Poultry, and Seafood $3,738 Chips, Pretzels, and Snacks $3,570 Coffee and Cocoa (non-rtd) $3,223 Bread and Baked Goods $2,798 Chocolate and Confectionery $2,195 Yogurt and Kefir $2,042 Frozen Lunch and Dinner Entrees $2,017 Refrigerated Lunch and Dinner Entrées $1,963 Condiments, Dressings, and Marinades $1,928 % Share % % 4.7% 3.7% 3.4% 3.4% 3.3% 3.3% % Change % 12.1% % 18.1% % What You Need to Know Protein remains powerful, with cheese and meat taking the top seller slots. Specialty bars have emerged as a trending category too; they account for nearly half of total bar sales at retail. /SPINS/IRI Does not include private-label sales, random weight (PLU) items, or sales through Trader Joe's or Whole Foods Market What You Need to Know Consumers seek specialty foods in the refrigerated section. Dollar and unit sales are up across fresh, refrigerated specialty categories, including meat alternatives, condiments, and pasta. Specialty Food Categories with Highest Dollar Sales Growth % Change Eggs 183. Refrigerated RTD Tea and Coffee 114.3% Jerky and Meat Snacks 86.1% Water 75.2% Shelf -Stable RTD Tea & Coffee 37.2% Frozen Meat Alternatives 37. Rice Cakes 33.6% Refrigerated Dairy & Plant-Based Items 33.1% Refrigerated Entrées 33. Frozen Desserts 31.1% /SPINS/IRI Does not include private-label sales, random weight (PLU) items, or sales through Trader Joe's or Whole Foods Market. Specialty Food Categories with Highest Market Share % Share of total market Refrigerated Meat Alternatives 10 Refrigerated Salsas and Dips 82.7% Tea (Non-RTD) 57. Refrigerated Condiments 55.1% Refrigerated Pasta and Pizza Sauces 49. Wellness Bars and Gels 48. Refrigerated Pasta 4 Refrigerated Plant-Based Milk and Creamer 38. Frozen Meat Alternatives 35. /SPINS/IRI Does not include private-label sales, random weight (PLU) items, or sales through Trader Joe's or Whole Foods Market. What You Need to Know In addition to protein products, refrigerated, fresh, and shelf-stable beverages are leading the growth in specialty. Beverage growth outperformed that of food between 2014 and, 24 percent versus 15 percent. STATE OF THE SPECIALTY FOOD INDUSTRY
6 SALES OF SPECIALTY FOOD AT RETAIL BY CATEGORY Fifty-seven of the 61 categories covered in this report grew, many driven by health and wellness trends. The four that experienced declines or flat growth were: Frozen Juices and Beverages (-68 percent); Shelf-Stable Plant-Based Milk and Creamer (-5.3 percent); Beans, Grains, and Rice (-1.5 percent); and Cold Cereals (-1.6 percent). The top five categories by dollar sales are led by perishables perennial leader Cheese and Plant-Based Cheese, which hit $4.4 billion, and Frozen or Refrigerated Meat, Poultry, and Seafood, which accounted for $3.7 billion. Shelf-stable segments rounded out the top five, including Chips, Pretzels, and Snacks, Non-RTD Coffee and Hot Cocoa, and Bread and Baked Goods. Grocery, or shelf-stable specialty foods, made up 61 percent of the total specialty food market in. Refrigerated was the second-largest department with 24 percent of sales. It grew 20.2 percent from 2014 and, led in large part by Yogurt and Kefir, Refrigerated Entrees, and Refrigerated Juices and Functional Beverages. Cheese & Plant-Based Cheese Frozen or Refrigerated Meat, Poultry, & Seafood Chips, Pretzels, & Snacks Non-RTD Coffee & Hot Cocoa Bread & Baked Goods Chocolate & Confectionery Yogurt & Kefir Frozen Entrées Refrigerated Entrées Shelf-Stable Condiments, Dressings, & Marinades Frozen Desserts Water Nuts, Trail Mix, & Dried Fruit Refrigerated Juices & Functional Beverages Cookies & Snack Bars Refrigerated Plant-Based Milk & Creamer Shelf-Stable Juices Refrigerated Salsas & Dips Wellness Bars & Gels Baking Mixes, Ingredients, & Flours Oils & Vinegars Shelf-Stable Fruit & Vegetables Shelf-Stable RTD Tea & Coffee Non-RTD Tea Crackers & Crispbreads Seasonings Shelf-Stable Pickles & Olives Soup Shelf-Stable Pasta & Pizza Sauces Soda & Carbonated Beverages Cold Cereals Sweeteners Shelf-Stable Dry Beans, Grains, & Rice Shelf-Stable Entrées & Mixes Frozen Fruit & Vegetables Refrigerated Dairy & Plant-Based Items Shelf-Stable Pasta Frozen Appetizers & Snacks Baby Food Shelf-Stable Meat, Poultry, & Seafood Refrigerated Condiments Nut & Seed Butters Shelf-Stable Salsas & Dips Jerky & Meat Snacks Fruit Spreads, Jams, & Jellies Shelf-Stable Desserts & Toppings Shelf-Stable Plant-Based Milk & Creamer Frozen Breakfast Foods Frozen Meat Alternatives Refrigerated Pasta Milk Refrigerated RTD Tea & Coffee Hot Cereals Refrigerated Meat Alternatives Eggs Tofu Shelf-Stable Functional Beverages Drink Mixes & Concentrates Refrigerated Pasta and Pizza Sauces Rice Cakes Frozen Juices & Beverages Total 2014 Millions $3,933 $3,354 $3,141 $2,875 $2,416 $1,996 $1,605 $1,707 $1,476 $1,783 $1,363 $856 $1,387 $1,081 $1,254 $1,212 $1,022 $1,080 $896 $989 $905 $973 $738 $954 $762 $743 $782 $706 $640 $600 $712 $544 $643 $532 $509 $414 $477 $408 $350 $408 $336 $304 $323 $126 $196 $183 $220 $170 $125 $132 $141 $70 $128 $99 $28 $70 $50 $46 $32 $29 $6 $51,042 % Share 7.7% 6.6% 6.2% 5.6% 4.7% % 3.3% % 1.7% 2.7% 2.1% % % 1.2% 1.1% 1.3% % 0.7% Millions $4,422 $3,738 $3,570 $3,223 $2,798 $2,195 $2,042 $2,017 $1,963 $1,928 $1,787 $1,500 $1,464 $1,413 $1,328 $1,307 $1,190 $1,188 $1,156 $1,100 $1,083 $1,052 $1,012 $998 $846 $845 $833 $801 $725 $719 $701 $635 $633 $617 $591 $550 $501 $463 $433 $423 $398 $372 $353 $235 $228 $220 $209 $202 $171 $170 $152 $150 $142 $125 $78 $76 $53 $50 $41 $39 $2 $59,255 % Share % % 4.7% 3.7% 3.4% 3.4% 3.3% 3.3% % 2.2% % 1.7% 1.2% 1.2% 1.2% 1.1% 1.1% % 0.7% 0.7% % Change % 12.1% % 18.1% % 31.1% 75.2% % % % 19.6% 8.1% 37.2% 4.7% % 6.4% % 19.7% -1.6% 16.7% % 16.1% 33.1% 5.1% 13.4% % 18.2% 22.3% 9.3% 86.1% 16.2% 20.7% -5.3% 19.2% % % 10.7% 26.7% % % % % /SPINS/IRI Does not include private-label sales, random weight (PLU) items, or sales through Trader Joe's or Whole Foods Market 6 STATE OF THE SPECIALTY FOOD INDUSTRY 2017
7 SALES OF ALL FOOD AT RETAIL BY CATEGORY Mass-market foods are struggling as consumers move away from legacy brands toward specialty. Sales of all food at retail inched up by just 2.3 percent, with 25 of 60 categories not even reaching that lackluster number. Several leading specialty food categories don t make the top 10 in All Food sales, notably Non-RTD Coffee and Hot Cocoa, Yogurt and Kefir, Refrigerated Entrees, and Shelf-Stable Condiments, Dressings, and Marinades. Mintel explains that ethical concerns around fair trade and organic coffee and cocoa, health and convenience trends, and authentic flavors help drive sales in these categories among specialty food consumers but the same characteristics may not resonate with mainstream consumers Millions Frozen or Refrigerated Meat, Poultry, & Seafood $34,282 Bread & Baked Goods $27,067 Chocolate & Confectionery $19,555 Chips, Pretzels, & Snacks $18,628 Soda & Carbonated Beverages $19,486 Cheese & Plant-Based Cheese $17,916 Frozen Entrées $17,552 Milk $17,367 Frozen Desserts $11,884 Cookies & Snack Bars $11,517 Water $9,741 Non-RTD Coffee & Hot Cocoa $9,325 Shelf-Stable Condiments, Dressings, & Marinades $9,484 Cold Cereals $9,172 Shelf-Stable Fruit & Vegetables $8,514 Yogurt & Kefir $7,895 Nuts, Trail Mix, & Dried Fruit $7,210 Shelf-Stable Juices $7,277 Dairy & Plant-Based Items $6,562 Refrigerated Juices & Functional Beverages $6,529 Refrigerated Entrées $5,498 Soup $6,653 Shelf-Stable Functional Beverages $5,460 Crackers & Crispbreads $5,910 Frozen Fruit & Vegetables $6,045 Baking Mixes, Ingredients, & Flours $6,214 Eggs $6,087 Baby Food $5,777 Seasonings $4,784 Shelf-Stable Entrées & Mixes $5,205 Frozen Appetizers & Snacks $4,549 Oils & Vinegars $4,125 Sweeteners $3,908 Shelf-Stable Meat, Poultry, & Seafood $3,556 Refrigerated Plant-Based Milk & Creamer $3,081 Frozen Breakfast Foods $3,101 Shelf-Stable Desserts & Toppings $3,083 Shelf-Stable RTD Tea & Coffee $2,497 Shelf-Stable Pickles & Olives $2,483 Shelf-Stable Pasta & Pizza Sauces $2,430 Wellness Bars & Gels $2,012 Nut & Seed Butters $2,481 Shelf-Stable Pasta $2,263 Refrigerated Salsas & Dips $1,880 Shelf-Stable Salsas & Dips $1,921 Shelf-Stable Dry Beans, Grains, & Rice $1,877 Non-RTD Tea $1,901 Hot Cereals $1,480 Jerky & Meat Snacks $1,242 Drink Mixes & Concentrates $1,537 Refrigerated RTD Tea & Coffee $869 Fruit Spreads, Jams, & Jellies $983 Shelf-Stable Plant-Based Milk & Creamer $942 Refrigerated Condiments $720 Frozen Meat Alternatives $466 Refrigerated Pasta $363 Frozen Juices & Beverages $306 Rice Cakes $205 Refrigerated Meat Alternatives $106 Tofu $84 Refrigerated Pasta & Pizza Sauces $79 % Share % % % 2.2% % 1.7% 1.7% % 1.6% % 1.3% 1.2% 1.1% Millions $33,696 $28,227 $20,027 $19,676 $19,419 $18,244 $17,823 $15,418 $12,397 $11,637 $11,557 $10,055 $9,741 $8,957 $8,503 $8,168 $7,431 $7,268 $6,751 $6,677 $6,665 $6,541 $6,310 $6,055 $6,028 $6,023 $5,795 $5,778 $5,157 $5,049 $4,658 $4,291 $3,908 $3,417 $3,373 $3,220 $3,119 $3,102 $2,587 $2,570 $2,452 $2,442 $2,330 $2,067 $2,033 $1,895 $1,813 $1,482 $1,421 $1,407 $1,095 $999 $911 $811 $482 $410 $249 $225 $124 $92 $85 % Share 8.4% 7.1% % % % 2.1% % 1.7% 1.6% % 1.3% 1.2% 1.1% % Change -1.7% 4.3% 5.6% % 4.3% % % -2.3% % % 21.2% -1.7% 15.6% % -3.1% % 24.2% 4.2% % % 14.4% -8.4% % -3.4% 12.7% % 7.1% Total $391, $400, % /SPINS/IRI Does not include private-label sales, random weight (PLU) items, or sales through Trader Joe's or Whole Foods Market STATE OF THE SPECIALTY FOOD INDUSTRY
8 SPECIALTY FOOD SHARE OF ALL FOOD BY SALES BY CATEGORY Specialty food sales as a share of the total food market reached 14.8 percent in, a bump of 1.8 percentage points since Specialty foods are making significant penetration into the mass market, with shares above 20 percent in 23 categories. Six of the 10 categories with top share are refrigerated, including Salsas and Dips and Plant-Based Milk and Creamer. Specialty food segments with the biggest share of total sales also include Non-RTD Tea, Wellness Bars and Gels, and Shelf-Stable Beans, Grains, and Rice. Higher-volume categories, such as Milk, Eggs, and Soda & Carbonated Beverages, have smaller shares for specialty. Chilled and frozen items show the fastest growth in specialty food share, including Refrigerated Pasta and Pizza Sauces, Refrigerated or Frozen Meat Alternatives, and Refrigerated RTD Tea and Coffee. Among grocery items, Jerky and Meat Snacks and Water were among leaders in market gains; both grew four or more points since Refrigerated Meat Alternatives Tofu Refrigerated Salsas & Dips Non-RTD Tea Refrigerated Condiments Refrigerated Pasta & Pizza Sauces Wellness Bars & Gels Refrigerated Pasta Refrigerated Plant-Based Milk & Creamer Frozen Meat Alternatives Shelf-Stable Dry Beans, Grains, & Rice Shelf-Stable RTD Tea & Coffee Shelf-Stable Pickles & Olives Non-RTD Coffee & Hot Cocoa Refrigerated Entrées Shelf-Stable Pasta & Pizza Sauces Oils & Vinegars Yogurt & Kefir Cheese & Plant-Based Cheese Shelf-Stable Plant-Based Milk & Creamer Fruit Spreads, Jams, & Jellies Shelf-Stable Pasta Refrigerated Juices & Functional Beverages Shelf-Stable Condiments, Dressings, & Marinades Nuts, Trail Mix, & Dried Fruit Baking Mixes, Ingredients, & Flours Chips, Pretzels, & Snacks Rice Cakes Shelf-Stable Salsas & Dips Jerky & Meat Snacks Seasonings Shelf-Stable Juices Sweeteners Nut & Seed Butters Frozen Desserts Crackers & Crispbreads Refrigerated RTD Tea & Coffee Water Shelf-Stable Meat, Poultry, & Seafood Shelf-Stable Fruit & Vegetables Soup Shelf-Stable Entrées & Mixes Cookies & Snack Bars Frozen Entrées Frozen or Refrigerated Meat, Poultry, & Seafood Chocolate & Confectionery Frozen Appetizers & Snacks Bread & Baked Goods Frozen Fruit & Vegetables Hot Cereals Refrigerated Dairy & Plant-Based Items Cold Cereals Baby Food Shelf-Stable Desserts & Toppings Frozen Breakfast Foods Soda & Carbonated Beverages Drink Mixes & Concentrates Eggs Milk Shelf-Stable Functional Beverages Frozen Juices & Beverages Average Specialty % Share of All Sales % % % % 32.6% 32.2% 32.1% % 25.2% % % % 18.3% 18.1% 17.4% 17.3% % 16.4% 16.3% 15.2% 14.4% % % 12.2% % 11.1% % % 6.3% 3.7% 3.6% 1.3% /SPINS/IRI 8 STATE OF THE SPECIALTY FOOD INDUSTRY 2017
9 SALES GROWTH OR DECLINE BY SALES CATEGORY Consumers are turning to specialty in refrigerated and protein-based foods. This preference is shown in the variance; for instance, the market in specialty Eggs exploded by percent between 2014 and, whereas the total market dropped by almost 5 percent, yielding a variance of 188 percent. Also of note is the jump in specialty Nut and Seed Butters, by 22.3 percent, compared to a drop in mass-market products in that category. Some large categories grew in modest, single digits from 2014 to, including Shelf-Stable Condiments, Dressings, and Marinades and Cookies and Snack Bars. But, specialty varieties still outpaced their non-specialty counterparts in sales growth. The slowest-growing or declining categories include Shelf-Stable Beans, Grains, and Rice, Cold Cereals, Shelf-Stable Plant-Based Milk & Creamer, and Frozen Juices and Beverages. Non-specialty versions of these products are also dropping in sales, indicating that the decline isn t specific to specialty but points to the categories diminishing overall consumer appeal. Eggs Refrigerated RTD Tea & Coffee Jerky & Meat Snacks Water Frozen Meat Alternatives Refrigerated Dairy & Plant-Based Items Refrigerated Juices & Functional Beverages Frozen Desserts Refrigerated Pasta & Pizza Sauces Nut & Seed Butters Yogurt & Kefir Baby Food Rice Cakes Soda & Carbonated Beverages Milk Shelf-Stable Desserts & Toppings Shelf-Stable Entrées & Mixes Drink Mixes & Concentrates Sweeteners Shelf-Stable Juices Frozen Entrées Frozen Fruit & Vegetables Refrigerated Pasta Oils & Vinegars Frozen Breakfast Foods Soup Fruit Spreads, Jams, & Jellies Baking Mixes, Ingredients, & Flours Frozen or Refrigerated Meat, Poultry, & Seafood Shelf-Stable RTD Tea & Coffee Refrigerated Entrées Bread & Baked Goods Frozen Appetizers & Snacks Cheese & Plant-Based Cheese Hot Cereals Non-RTD Tea Refrigerated Meat Alternatives Crackers & Crispbreads Shelf-Stable Fruit & Vegetables Chips, Pretzels, & Snacks Chocolate & Confectionery Shelf-Stable Meat, Poultry, & Seafood Shelf-Stable Pasta & Pizza Sauces Wellness Bars & Gels Seasonings Refrigerated Condiments Shelf-Stable Condiments, Dressings, & Marinades Cookies & Snack Bars Non-RTD Coffee & Hot Cocoa Shelf-Stable Salsas & Dips Nuts, Trail Mix, & Dried Fruit Shelf-Stable Pickles & Olives Shelf-Stable Pasta Cold Cereals Refrigerated Salsas & Dips Tofu Refrigerated Plant-Based Milk & Creamer Shelf-Stable Plant-Based Milk & Creamer Shelf-Stable Dry Beans, Grains, & Rice Shelf-Stable Functional Beverages Frozen Juices & Beverages Specialty Market % Change % 86.1% 75.2% % 30.7% 31.1% % 27.2% % 19.7% % 16.1% 9.7% 16.7% 16.4% 18.1% 16.1% 28.6% 19.6% 19.2% % 11.1% % % % 4.7% 26.7% % 13.6% % 13.2% % 18.2% 8.1% % 9.3% % 5.1% -1.6% % % Total Market % Change % 18.6% % 4.3% 7.1% -1.6% % 1.1% % % 1.6% -3.1% -1.7% 24.2% 21.2% 4.3% % % % 2.7% % 4.2% % % % % -18. Variance % Points Total 16.1% 2.3% 13.8 Specialty market does not include private-label sales, random weight (PLU) items, Trader Joe's, or Whole Foods Market /SPINS/IRI STATE OF THE SPECIALTY FOOD INDUSTRY
10 UNIT SALES OF SPECIALTY FOOD Across all 61 product categories, total unit sales of specialty food are up 13.6 percent between 2014 and, proving that people are buying more specialty products, not just paying higher prices. Chips, Pretzels, and Snacks lead in unit sales, at 1.19 billion. Beverages, including Refrigerated RTD Tea and Coffee, are sporting some of the strongest unit increases. The top five fastest-growing categories by unit sales from 2014 to include two protien and perishable categories: Jerky and Meat Snacks, which grew 85.3 percent, and Refrigerated Juices and Functional Beverages, which were up 35 percent. Chips, Pretzels, & Snacks Cheese & Plant-Based Cheese Yogurt & Kefir Bread & Baked Goods Chocolate & Confectionery Frozen or Refrigerated Meat, Poultry, & Seafood Shelf-Stable Condiments, Dressings, & Marinades Shelf-Stable Fruit & Vegetables Water Wellness Bars & Gels Shelf-Stable Juices Cookies & Snack Bars Frozen Desserts Non-RTD Coffee & Hot Cocoa Frozen Entrées Refrigerated Plant-Based Milk & Creamer Refrigerated Juices & Functional Beverages Shelf-Stable RTD Tea & Coffee Baking Mixes, Ingredients, & Flours Refrigerated Salsas & Dips Nuts, Trail Mix, & Dried Fruit Shelf-Stable Pickles & Olives Seasonings Soup Refrigerated Entrées Shelf-Stable Pasta Soda & Carbonated Beverages Non-RTD Tea Shelf-Stable Entrées & Mixes Crackers & Crispbreads Baby Food Shelf-Stable Pasta & Pizza Sauces Shelf-Stable Meat, Poultry, & Seafood Cold Cereals Oils & Vinegars Frozen Fruit & Vegetables Shelf-Stable Dry Beans, Grains, & Rice Shelf-Stable Desserts and Toppings Refrigerated Dairy & Plant-Based Items Frozen Appetizers & Snacks Shelf-Stable Salsas & Dips Sweeteners Refrigerated Condiments Shelf-Stable Plant-Based Milk & Creamer Nut & Seed Butters Frozen Breakfast Foods Jerky & Meat Snacks Fruit Spreads, Jams, & Jellies Milk Frozen Meat Alternatives Eggs Drink Mixes & Concentrates Refrigerated Pasta Hot Cereals Refrigerated Meat Alternatives Refrigerated RTD Tea and Coffee Tofu Shelf-Stable Functional Beverages Rice Cakes Refrigerated Pasta & Pasta Sauces Frozen Juices & Beverages Total 2014 Millions 1, , Millions 1, ,597 Millions 1, ,639 Specialty market does not include private-label sales, random weight (PLU) items, Trader Joe's, or Whole Foods Market /SPINS/IRI Change % % 19.3% % 6.3% % % 6.4% 27.1% 12.1% % % % % % % % -9.7% % % 38.1% % 25.2% % 6.2% % 13.6% 10 STATE OF THE SPECIALTY FOOD INDUSTRY 2017

11 THE SPECIALTY FOOD SUPPLY CHAIN MANUFACTURERS More than 40 percent of specialty food manufacturers had sales increases of 20+ percent. Average net profit comes in at 18 percent, though cost of ingredients and minimum wage hikes are among manufacturers biggest concerns. One-third of manufacturers say distributor to retail is their fastest-growing trade segment. Mean Annual Sales: $2,471,212 Mean # of SKUs: 36 Mean # of Staff: 33 Full-time, 18 Part-time Own Manufacturing Facility: 7 Co-Pack for Manufacturers: 4 Co-Pack Private Label for Retailers: 4 Net Profit: 1 At-a-Glance Production, Warehousing, Shipping, and Labor 24% Advertising and Marketing Mean Share of Total Expenses Raw Materials 3 Packaging 13% Administrative 11% or more Mean Share of Sales by Channel Third-party Internet Retail Sites (e.g., Amazon, Mouth.com) Direct to Consumer (farmers markets, etc.) Distributors to Foodservice 4% Distributors to Retail 3 The Manufacturer Viewpoint: Channel Sales Growth 2017 Natural Supermarkets (e.g., Whole Foods Market) Specialty Food Stores Conventional Supermarkets (e.g., Kroger, Safeway) Foodservice (e.g., restaurants, cafés, school/office cafeterias) Club Stores (e.g., Costco, Sam's Club) Convenience Stores Mass Merchandisers (e.g., Target, Walmart) Department Stores Dollar Sales Change in 13% % 16% Fastest Growing 23% 23% 17% 13% 3% 3% 1% Slowest Growing 1 3% 1 7% 26% 6% 1 Direct to Consumer via Own Website Direct to Foodservice 6% Direct to Retail 34% Unchanged 7% 1% 3% Natural/Ethical Product Growth Will Grow Interests Consumers Most Today the Most in the Next ThreeYears Non-GMO Organic Local All-natural Sustainable Fair trade Eco-friendly % 52% 21% 1 61% 46% 42% % Product Innovation Manufacturer Plans For Specialty food that is also: Gluten-free 5 Non-GMO 57% Convenient/easy to prepare 56% Indulgent 37% Plant-based, vegetarian, or vegan* 3 Allergen-free (dairy, nut, soy, etc.) 32% Low/no/reduced sugar 3 Functional 2 Portable 26% Organic 2 Less indulgent and more healthful 22% High protein 13% * New in 2017 What You Need to Know Manufacturers cited entries into Amazon, club stores, hotels, and universities as among their successes. Those not equipped to sell to these channels should start by building up contacts and infrastructure. Fine dining restaurants are the fastest growing foodservice sales channel for manufacturers, who can boost their business with a product that fits the needs of this channel. Plant-based, vegetarian, and vegan foods have emerged as an area of product innovation for more than one-third of manufacturers, and signal an area of growing opportunity. STATE OF THE SPECIALTY FOOD INDUSTRY
12 I THE SPECIALTY FOOD SUPPLY CHAIN IMPORTERS mporters are not growing as quickly as manufacturers, but 36 percent report sales increases of 20+ percent in the past year. Ninety-three percent of total annual sales come from specialty foods. Importers are concerned about consolidation, competition from domestic producers, and shifts like Whole Foods Market s move to centralized buying, leading more to turn to direct sales to consumers via online and social media. Mean Annual Sales: $1,977,273 Mean # of SKUs: 126 Mean # of Countries Imported From: 2.9 At-a-Glance 73% of importers are planning to expand the number of specialty food products they offer in Dollar Sales Change in or more % Unchanged Direct to Foodservice 7% 1 Mean Share of Sales by Channel Direct to Retail 2 Direct to Consumer 11% Distributor to Foodservice 1 Distributor to Retail 34% What You Need to Know Importers are bullish on specialty foods, with 73 percent planning to expand their offerings in Importers say foodservice is their slowestgrowing category, boding well for local and regional products in that channel. African cuisine is poised to take off, according to importers. Products that capture the flavors and ingredients of Africa will be in demand The Importer Viewpoint: Channel Sales Growth Natural Supermarkets (e.g., Whole Foods Market) Conventional Supermarkets (e.g., Kroger, Safeway) Foodservice (e.g., restaurants, cafés, school/office cafeterias) Mass Merchandisers (e.g., Target, Walmart) Specialty Food Stores Third-Party Internet Retail Sites (e.g., Amazon, Mouth.com) Club Stores (e.g., Costco, Sam's Club) Convenience Stores Department Stores Fastest Growing 27% 1 1 Slowest Growing/ Declining 27% 36% 36% Organic All Natural Non-GMO Eco-Freindly Sustainable Fair Trade Characteristics Of Products Imported Import this type of Product 10 91% 64% 36% 36% 27% Natural/Ethical Product Growth Interests Consumers Most Today Organic 6 All Natural 5 Local 56% Non-GMO 52% Sustainable 21% Fair Trade 1 Eco-Freindly Estimated % of Sales 41% 6 52% 22% 2 2% Grow Most in the Next Three Years 36% 4 27% 36% 64% 4 12 STATE OF THE SPECIALTY FOOD INDUSTRY 2017
13 H THE SPECIALTY FOOD SUPPLY CHAIN DISTRIBUTORS alf of distributors surveyed saw sales grow 10 percent or more in. Specialty foods comprise 86 percent of total SKUs that distributors carry and account for 84 percent of their total dollar sales. Specialty food store sales make up an average of 37 percent of distributors sales; conventional supermarkets account for 22 percent of sales. 2 1 Mean Annual Sales: $6,745,000 Mean # of SKUs: 2,125 Mean # of Stores Serviced: 978 Dollar Sales Change in or more = Unchanged At-a-Glance of distributors will expand or add private-label products in 2017 What You Need to Know Seventy percent of distributors plan to expand their specialty food offerings in Ongoing consumer interest in health and wellness products and beverages have their attention. Eighty percent of distributors currently, or plan to, verify that their suppliers are complying with the Food Safety Modernization Act, a heads-up for manufacturers. The Distributor Viewpoint: Channel Sales Growth Distributors see growing consumer interest in sustainable and eco-friendly product claims over the next three years. Manufacturers and retailers should consider integrating this into their product development plans and shelf allotment Fastest Growing Slowest Growing Specialty Food Stores 5 2 Conventional Supermarkets (e.g., Kroger, Safeway) Foodservice (e.g., restaurants, cafés, school/office cafeterias) DISTRIBUTOR Natural Supermarkets (e.g., Whole Foods Market) 1 Club Stores (e.g., Costco, Sam's Club) Convenience Stores Department Stores 2 Natural/Ethical Product Growth Direct to Consumer Own Website Direct to Consumer Third-Party Internet Retail Sites (e.g., Amazon, Mouth.com, Thrive Market) Mass Merchandisers (e.g., Target, Walmart) Organic All-Natural Local Non-GMO Sustainable Eco-friendly Fair trade Interests Consumers Most Today Will Grow the Most in the Next Three Years STATE OF THE SPECIALTY FOOD INDUSTRY

14 THE SPECIALTY FOOD SUPPLY CHAIN BROKERS Brokers are not doing as well as other industry segments, with more than 40 percent reporting flat or declining sales. Specialty foods represent 79 percent of total SKUs that brokers carry and account for 78 percent of total sales. Mean Annual Sales: $3,654,762 Mean # of SKUs: 2,274 At-a-Glance Dollar Sales Change in or more % % 1-24% 1 Unchanged Two-thirds of brokers say they will expand their specialty food offerings this year The Broker Viewpoint: Channel Sales Growth 2017 Club Stores (e.g., Costco, Sam's Club) Convenience Stores % Stores/ Channels Serviced 2 43% % Fastest Growing Stores/ Channels 1 % Slowest Growing or Declining 1 What You Need to Know Forty-three percent of brokers say they will develop or further grow a private-label program. Clearly, distributors and retailers are asking for these products to add to their mix. Brokers are another segment of the supply chain who see sustainable products growing in consumer interest in the next three years. Manufacturers and retailers both should be prepared to address the need. Conventional Supermarkets (e.g., Kroger, Safeway) 57% 14% Department Stores 43% 14% Foodservice (e.g., restaurants, cafeterias, school/office cafeterias) 43% 1 Gift Stores* 4 24% Mass Merchandisers (e.g., Target, Walmart) 4 14% 1 Natural Supermarkets (e.g., Whole Foods Market) 86% 1 1 Spas* Specialty Food Stores 1 86% 1 1 Natural/Ethical Product Growth Third-Party Internet Retail Sites (e.g., Amazon, Mouth.com, Thrive Market) Wineries* * New for % 24% 1 Local Non-GMO Organic All-Natural Eco-friendly Fair trade Sustainable Interests Consumers Most Today 67% 62% 62% 33% 1 14% 14% Will Grow the Most in the Next Three Years 43% 4 43% 24% 1 24% 3 14 STATE OF THE SPECIALTY FOOD INDUSTRY 2017
15 THE SPECIALTY FOOD SUPPLY CHAIN RETAILERS More than 50 percent of retailers experienced dollar sales growth last year. Specialty foods account for two-thirds of total SKUs sold and comprise 63 percent of total retailer dollar sales. Retailers average transactions per week grew 15 percent in, and the average transaction size increased 19 percent. Mean Annual Sales: $23,371,897 Average Store Size: 4,738 sq. ft. Average SKUs per Store: 1,482 Value of Inventory: $13,190,013 Mean Number of Suppliers: 75 Average Transactions per Week: 5,842 Average Transactions Size: $37.82 At-a-Glance 4 of retailers plan to keep the number of specialty food products they offer the same as last year, while 3 will further develop private-label products. Dollar Sales Change in or more Local Organic All-Natural Non-GMO Sustainable Eco-Friendly Fair Trade 16% 16% 1 13% 11% 20 2 Sales By Department Yes, have this department Bakery 4 Cheese 72% Confectionery 46% Deli and Prepared Foods 5 Meat and Seafood 4 Non-Foods 7 On-Premise 2 Restaurant/Café* Produce 41% Specialty Grocery 84% Wine and 51% Alcoholic Beverages 21% Results add up to more than 100 percent because multiple answers are accepted *New in Interests Consumers Most Today 7 64% 44% 34% 23% 11% 1 Unchanged 1 Natural/Ethical Product Growth 11% 10 1 Characteristics Of Products Sold Carry this type of Product Local 87% All-Natural 8 Organic 8 Non-GMO 7 Fair Trade 6 Sustainable 66% Eco-Friendly 61% Will Grow the Most in the Next Year 54% 31% 2 54% 46% 31% 1 Estimated % of Sales 22% 34% 17% 1 16% 13% 20 2 Results add up to more than 100 percent because multiple answers are accepted Usually/Always Identify Products with this Claim on the Shelves (with Signage/Tags) 6 53% 6 44% Results add up to more than 10 because multiple answers are accepted What You Need to Know Retailers say local and regional foods will be a growing trend, along with authentic products such as pralines from New Orleans. To capitalize on this trend, manufacturers should have a mission and tell a story about their product. One-third of specialty food retailers plan to develop more private label in Manufacturers should let them know their capabilities. Retailers are listening more to their customers about new product discovery versus other sourcing avenues. Manufacturers would be wise to drum up consumer interest for their products as an entry point. STATE OF THE SPECIALTY FOOD INDUSTRY


16 THE SUPPLY CHAIN IN THEIR OWN WORDS MANUFACTURERS Successes in : Amazon entry club store expansion private label added more retail stores appearing on Shark Tank entering hotel chains getting into one of the top restaurants in the world Biggest threats: Minimum wage hikes cost of ingredients big distributors gobbling up smaller ones lack of market awareness cash flow not being able to find a co-packer so we can scale up Gripes: Cost of doing business with distributors expensive and time consuming to get certifications mega-manufacturers saying they are producing a specialty food buyers who only look for homeruns and don t give products enough time to gain traction a lot of channels to navigate and you have to pay to get entry into many of them RETAILERS Threats: Big-box retailers discounters carrying more specialty foods regulation customers opting to purchase online Successes: Growing while having to discontinue profitable lines due to them being everywhere growth of our catering business increasing contact with local suppliers having a café stay open for evening hours increasing general grocery sales by diversifying inventory Gripes: Deceptive labels cost of shipping for direct vendors distributors lack of automation for ordering everything is catalogs and spreadsheets staying competitive with grocery stores and mass merchants without underpricing ourselves that customers still struggle to reconcile high prices and high-quality food B ROKERS Successes: Gaining revenue and margin private label technology upgrades innovative SKUs online business New plans: Business development, expanding into new territories and developing our customer base expanding online creating our own brand managing imported lines vertically integrating manufacturing Gripes: Deductions FDA challenges too many new players buyers are no longer passionate about food. They are more focused on how much money a manufacturer has to spend regardless of sales volume IMPORTERS New plans: Going after larger distributors increase our direct business more use of social media to inform consumers Gripes: Very difficult to make a profit based on all the deductions FDA paperwork on a product that has been imported for decades lack of access to distributors for small food manufacturers/importers DISTRIBUTORS Threats: Rate of exchange increase of players offering similar items Amazon and Walmart more lines carried at large grocers retailers doing private label Successes in : Overall health and wellness growth surviving rate of exchange added three new lines New plans: Private label expansion focus on key brands more SKUs online purchasing Ron Tanner is the vice president, philanthropy, government, and industry relations for the Specialty Food Association. load the Specialty Food Association s webinar The State of the Specialty Food Industry at learning.specialtyfood.com. Denise Purcell is editor of Specialty Food Magazine. 16 STATE OF THE SPECIALTY FOOD INDUSTRY 2017
Grass-Fed THE STATE OF THE SPECIALTY FOOD INDUSTRY Sustainable. Organic. Olive. Eco-Friendly IMPORTS, INC.
 Grass-Fed THE STATE OF THE SPECIALTY FOOD INDUSTRY 2 $$ IMPORTS, INC. Olive m in www.specialtyfood.com THE STATE OF THE SPECIALTY FOOD INDUSTRY 2 By Ron Tanner and Denise Purcell Total U.S. sales of specialty
MACRO INDUSTRY OVERVIEW. The Rise of Specialty Snacking HOW QUICK EATS ARE CHANGING THE INDUSTRY. Susan Szymanski
 The Rise of Specialty Snacking HOW QUICK EATS ARE CHANGING THE INDUSTRY Susan Szymanski VP Marketing MACRO INDUSTRY OVERVIEW Channel Trends Category Contributions Category Insights 1 Who Is SPINS? SPINS
U.S. Bottled Water Market
 IBWA 2016 U.S. Bottled Water Market Market Trends November 9, 2016 Beverage Marketing Capabilities Beverage Marketing Corporation utilizes an integrated model for providing information, analysis and advice
CATEGORY INSIGHT REPORT
 20 17 CATEGORY INSIGHT REPORT A NEW DAY IN BREAKFAST A host of reasons show that the breakfast category is primed for clear growth and product exploration. A major opportunity in the space: Consumers as
Welcome to the. Find out more about the parts of the world where SIAL Network is established, thanks to the Euromonitor s study.
 Welcome to the Find out more about the parts of the world where SIAL Network is established, thanks to the Euromonitor s study. SELECT A REGION TO SEE THE REPORT Canada China Indonesia Middle East & Africa
Leverage the Rising Sustainability Wave
 Leverage the Rising Sustainability Wave New Research and Best Practices Fair Trade USA October 2016 Who is Fair Trade USA? 3 rd Party sustainable and ethical certification Apparel & Shoes Quinoa & Rice
IMPORTANCE OF LODI WINES IN THE RETAIL CHANNEL AND OPPORTUNITIES FOR GROWTH. Curtis Mann Director of Wine & Beverage Raley s Family of Fine Stores
 IMPORTANCE OF LODI WINES IN THE RETAIL CHANNEL AND OPPORTUNITIES FOR GROWTH Curtis Mann Director of Wine & Beverage Raley s Family of Fine Stores Raley s Overview 3 Billion Dollar Company 120 Stores across
Foodservice EUROPE. 10 countries analyzed: AUSTRIA BELGIUM FRANCE GERMANY ITALY NETHERLANDS PORTUGAL SPAIN SWITZERLAND UK
 Foodservice EUROPE MARKET INSIGHTS & CHALLENGES 2015 2016 2017 2020 Innovative European Foodservice Experts 18, avenue Marcel Anthonioz BP 28 01220 Divonne-les-Bains - France 10 countries analyzed: AUSTRIA
Boston Beer Company, Inc. SELL Price Target: $110 Key Statistics as of 04/29/2016. Thesis Points: Company Description: NYSE:SAM
 Boston Beer Company, Inc. NYSE:SAM Analyst: Sector: Lionel Krupka Consumer Disc. SELL Price Target: $110 Key Statistics as of 04/29/2016 Market Price: Industry: Market Cap: 52-Week Range: Beta: $156.08
MANGO PERFORMANCE BENCHMARK REPORT
 MANGO PERFORMANCE BENCHMARK REPORT 2015-2016 TABLE OF CONTENTS Page 3 Page 5 Page 12 Page 15 Page 27 Page 36 Page 46 Approach and Data Set Parameters Overview and Mango Trend-Spotting Fruit and Tropical
Small Winemaker Production and Sales Survey Report November 2017
 Small Winemaker Production and Sales Survey Report 2016-17 November 2017 Wine Australia 2 Summary of findings It is estimated that small winemakers (those crushing up to 500 tonnes) contribute 8 per cent
U.S. Retail Coffee. Joe Stanziano Senior Vice President and General Manager, Coffee
 U.S. Retail Coffee Joe Stanziano Senior Vice President and General Manager, Coffee 1 Our Coffee Vision Build BELOVED COFFEE BRANDS that ignite the senses and inspire passions every day. OUR STRATEGIC PRIORITIES
Mango Retail Performance Report 2017
 Mango Retail Performance Report 2017 1 Table of Contents Pages 3-9 Pages 10-15 Pages 16-34 Pages 35-44 Pages 45-51 Pages 52-54 Executive Summary Fruit and Tropical Fruit Performance Whole Mango Performance
Chapter 1 Executive Summary Scope and Methodology Scope of Report Exclusions Report Methodology The Products Consumer Health Awareness Drives
 Chapter 1 Executive Summary Scope and Methodology Scope of Report Exclusions Report Methodology The Consumer Health Awareness Drives Plant-Based Beverage Market Marketers of Plant Milks Focus on Natural
MILLENNIAL CONSUMERS SEEK NEW TASTES, WILLING TO PAY A PREMIUM FOR ALCOHOLIC BEVERAGES. Nielsen Releases Most Comprehensive Study To Date
 The Nielsen Company 150 North Martingale Road Schaumburg, IL 60173-2076 www.nielsen.com News Release CONTACT: Jennifer Frighetto, 847-605-5686 jennifer.frighetto@nielsen.com FOR IMMEDIATE RELEASE MILLENNIAL
Market Brief for Asia Fruit Logistica. Hong Kong & Macau, Makret Dynamic Markets for U.S. Exports
 Market Brief for Asia Fruit Logistica Hong Kong & Macau, Makret Dynamic Markets for U.S. Exports September 5, 2017 1 USDA Foreign Agricultural Service (FAS) - ATO Hong Kong - FAS offices are staffed by
Overview of the US Market By Rodd Willis
 Overview of the US Market By Rodd Willis 2016 Culinary Trends in the United States Chef-Driven fast casual Natural Ingredients Environmental Sustainability No Antibiotics Ethnic Inspired Breakfast items
Volumetric Assessment of. the Foodservice. Potato Market. Prepared for. Project #17624 Add-on project # December 31, Technomic Inc.
 Volumetric Assessment of the Foodservice Potato Market Prepared for December 31, 2107 Project #17624 Add-on project #17787 Introduction Technomic has provided updated volume data relating to both fresh
EXECUTIVE SUMMARY. Coffee. UK August AMY PRICE Senior Food & Drink Analyst
 UK EXECUTIVE SUMMARY Coffee The ongoing path to premiumisation for instant coffee, the increasing accessibility of coffee pods, and the emerging RTD chilled sector offer opportunities for real growth in
Grape Growers of Ontario Developing key measures to critically look at the grape and wine industry
 Grape Growers of Ontario Developing key measures to critically look at the grape and wine industry March 2012 Background and scope of the project Background The Grape Growers of Ontario GGO is looking
Drinks Sector Guide. The global alcoholic drinks market grew by 3.3% in 2014 to reach a value of $1,152,011.1 million.
 Drinks Sector Guide Drinks Sector Guide The global alcoholic drinks market grew by 3.3% in 2014 to reach a value of $1,152,011.1 million. Beer, cider and FABs is the largest segment of the global alcoholic
Fish and Chips in Commercial Foodservice 2016 JULIA BROOKS, JANUARY 2017
 Fish and Chips in Commercial Foodservice 2016 JULIA BROOKS, JANUARY 2017 INTRODUCTION Since the mid nineteenth century fish and chips have built their position as being a symbol of the UK s culinary culture
The National Association of Convenience Stores (NACS) defines a convenience store as:
 defines a convenience store as:") The National Association of Convenience Stores (NACS) defines a convenience store as: A retail business with primary emphasis placed on providing the public a convenient location to quickly purchase from
The National Association of Convenience Stores (NACS) defines a convenience store as: A retail business with primary emphasis placed on providing the public a convenient location to quickly purchase from
As Serious a Threat as HLB: The Collapsing Orange Juice Market
 As Serious a Threat as HLB: The Collapsing Orange Juice Market Allen Morris University of Florida, IFAS, Citrus Research and Education Center ramorris@crec.ifas.ufl.edu Indian River Citrus Show, Fort Pierce,
An update from the Competitiveness and Market Analysis Section, Alberta Agriculture and Forestry.
 An update from the Competitiveness and Market Analysis Section, Alberta Agriculture and Forestry. The articles in this series includes information on what consumers are buying and why they are buying it.
Table of Contents. Contact Information
 Case Study 2015 Table of Contents The Challenge.......................................................................... 1 Pizza Hut and the U.S. Pizza Market...................................................
THE POWER OF BAKERY CATEGORIES
 THE POWER OF BAKERY CATEGORIES Todd Hale Retail Insights Thought Leader Principal, Todd Hale, LLC March 30, 2015 DRIVING GROWTH IN DYNAMIC TIMES Staying connected with winning retailers & categories Engaging
45 Million 13% 79% 70% Wisconsin Milk 27% 62% Pounds. your checkoff dollars check all the boxes. Consumption of Total Dairy has risen by
 When it comes to increasing demand for Wisconsin dairy products, your checkoff dollars check all the boxes. Your checkoff dollars help drive demand in multiple ways. With your help, Dairy Farmers of Wisconsin
2016 STATUS SUMMARY VINEYARDS AND WINERIES OF MINNESOTA
 IN PARTNERSHIP WITH THE NORTHERN GRAPES PROJECT, AN USDA SPECIALITY CROPS RESEARCH INITIATIVE PROGRAM, NIFA 2016 STATUS SUMMARY VINEYARDS AND WINERIES OF MINNESOTA Brigid Tuck and William Gartner INTRODUCTION
Tea Statistics Report 2015
 Tea Statistics Report 215 Introduction This report presents the scope and scale of the UTZ tea program in 215. Throughout this report tea also includes rooibos unless otherwise specified. The statistics
THE AUSTRALIAN FOODSERVICE MARKET
 THE AUSTRALIAN FOODSERVICE MARKET FOOD INDUSTRY FORESIGHT WWW.FIFORESIGHT.COM FOOD INDUSTRY FORESIGHT - COMMERCIAL IN CONFIDENCE FEBRUARY 2018 AUSTRALIAN FOOD INDUSTRY 2 CONSUMER MARKETS RETAIL FOODSERVICE
Your local dairy checkoff is working for you
 RETURN ON INVESTMENT EDUCATION BUILDING DEMAND Your local dairy checkoff is working for you FLUID MILK MILK ALTERNATIVES Dairy MAX is developing a milk alternatives initiative to educate the public on
RESTAURANT OUTLOOK SURVEY
 Reference Period: Fourth Quarter 2016 RESTAURANT OUTLOOK SURVEY Prepared by Chris Elliott, Senior Economist January 23, 2017 Q2-2011 Restaurant Outlook Survey Fourth Quarter 2016 1 Highlights The share
THE AUSTRALIAN FOODSERVICE MARKET FUTURE IN FOODSERVICE SEPTEMBER 11, 2017
 THE AUSTRALIAN FOODSERVICE MARKET FUTURE IN FOODSERVICE SEPTEMBER 11, 2017 AUSTRALIAN FOOD INDUSTRY 3 CONSUMER MARKETS RETAIL FOODSERVICE $115 Billion + $57 Billion $172 Billion 4 ECONOMIC CONTRIBUTION
Peet's Coffee & Tea, Inc. Reports 62% Increase in Second Quarter 2008 Diluted Earnings Per Share
 Peet's Coffee & Tea, Inc. Reports 62% Increase in Second Quarter 2008 Diluted Earnings Per Share EMERYVILLE, Calif., July 31, 2008 /PRNewswire-FirstCall via COMTEX News Network/ -- Peet's Coffee & Tea,
Team Harvard Ecureuils Harvard University
 Case Question Team Harvard Ecureuils Harvard University Maxence BODDAERT Jonathan XU Jules THIERY Princeton University Graduate Consulting Club Case Competition 2016 Goals of this presentation Provide
2017 FINANCIAL REVIEW
 2017 FINANCIAL REVIEW In addition to activity, strategy, goals, and challenges, survey respondents also provided financial information from 2014, 2015, and 2016. Select results are provided below: 2016
INFLUENCER GENERATED CONTENT
 INFLUENCER GENERATED CONTENT COFFEE BRANDS BENCHMARK REPORT RTD & Cold Brew Coffee Will Continue To Generate Buzz in 2018 In 2017, 62% of Americans reported drinking coffee on a daily basis, up from 5%
Agenda. Peet s and Market Opportunity Our Growth Strategy and Focus Future Outlook
 January 2011 Legal Disclaimer These slides accompany an oral presentation by Peet s Coffee & Tea, which contains forward-looking statements. The Company s actual results may differ materially from those
2013 Annual Quantification Report: Media Feedback Report Coffee in South Africa
 2013 Annual Quantification Report: Media Feedback Report Coffee in South Africa 30 September 2013 Product Definitions Wine Pure Ground Pure Instant Mixed Ground Mixed Instant Definition This product comprises
Caribou Coffee Company
 Caribou Coffee Company Consumer Conference June 5, 2012 SAFE HARBOR STATEMENT Certain statements made in this presentation constitute forward-looking statements, within the meaning of the Private Securities
Regional Brands, National Potential. International Summit Agricultural & Food Transportation
 Regional Brands, National Potential International Summit Agricultural & Food Transportation Wednesday, December 3, 2008 1 Mike Townsley President Food Products Division 2 3 4 5 Our Way of Doing Business
The State of Foodservice and What it Means to the Pork Industry
 The State of Foodservice and What it Means to the Pork Industry Prepared for: Fall Packer Processor Industry Council Meeting SEPTEMBER 25, 2014 technomic.com 5 Critical Trends Driving Foodservice Directions
Media Feedback 2015 Category Quantification Report White Milk in South Africa
 Media Feedback 2015 Category Quantification Report White Milk in South Africa Product Definitions Product Pasteurised Milk ESL (Extended Shelf Life) Milk Sterilised Milk Definition Milk is heated in one
Market Brief for Seafood Expo Asia. Hong Kong & Macau, Makret Dynamic Markets for U.S. Exports
 Market Brief for Seafood Expo Asia Hong Kong & Macau, Makret Dynamic Markets for U.S. Exports September 4, 2017 1 USDA Foreign Agricultural Service (FAS) - ATO Hong Kong - FAS offices are staffed by Foreign
Jennie-O Turkey Store. Glenn Leitch Group Vice President President, Jennie-O Turkey Store
 Jennie-O Turkey Store Glenn Leitch Group Vice President President, Jennie-O Turkey Store Agenda Industry metrics Impact of avian influenza Brand strength Value added growth Summary Total Industry Live
Cheese, Bakery and Specialty Foods in the U.S. Marketplace. Arn Grashoff
 Cheese, Bakery and Specialty Foods in the U.S. Marketplace Arn Grashoff Considerations When Entering the US Market for Cheese, Bakery and Specialty Products: 1. Is there already a similar product distributed
TOTAL SOLUTIONS COFFEE EXPERTISE SUSTAINABILITY COMMITMENT
 BEYOND the CUP It begins with a partnership unlike any other. With passion, innovation, and a personalized approach, Keurig Green Mountain is disrupting the premium coffee category and redefining foodservice
NO TO ARTIFICIAL, YES TO FLAVOR: A LOOK AT CLEAN BALANCERS
 NO TO ARTIFICIAL, YES TO FLAVOR: A LOOK AT CLEAN BALANCERS 2018 TREND INSIGHT REPORT Out of four personas options, 46% of consumers self-identify as Clean Balancers. We re exploring this group in-depth
Craft Brewer Definition
 Craft Brewer Definition Craft Brewer: An American craft brewer is small, independent and traditional. Small = Annual production of beer less than 6 million barrels. Beer production is attributed to a brewer
Thailand Packaging Machinery Market. Jorge Izquierdo VP Market Development PMMI
 Thailand Packaging Machinery Market Jorge Izquierdo VP Market Development PMMI jizquierdo@pmmi.org www.pmmi.org/global www.pmmi.org/research Today General Economic and Political Highlights Current Packaging
The Future Tortilla Market: Organic, Ancient Grains, Transitional
 The Future Tortilla Market: Organic, Ancient Grains, Transitional THE EVOLUTION OF VALUE CREATION FROM CONSUMER TO GRAINS Macro Exposures Consumer Values Consumer Trends Customer Responses Category Value
BIS Foodservice offers an integrated data and research solution in the foodservice market
 BIS Foodservice offers an integrated data and research solution in the foodservice market Syndicated Multi-Client Studies Private Research Projects Foodservice Omnibus Consultancy BIS Foodservice has provided
This is Haruhisa Inada. I will explain the financial results of the first quarter of FY 2018.
 This is Haruhisa Inada. I will explain the financial results of the first quarter of FY 2018. 1 Compared to the previous year, revenue was 277.1 billion yen, up 3.3%, operating income was 26.6 billion
Focused on Delivering
 34 Swire Pacific Annual Report 2009 Focused on Delivering Swire Beverages is one of the largest Coca-Cola bottlers in the world and the number one bottler in Mainland China with a powerful production and
New York Beef Culinary Tour: Industry Trends
 New York Beef Culinary Tour: Industry Trends A l i s o n K r e b s, D i r e c t o r M a r k e t I n t e l l i g e n c e N a t i o n a l C a t t l e m e n s B e e f A s s o c i a t i o n A C o n t r a c
Caribou Coffee Company. January 12, 2012
 Caribou Coffee Company January 12, 2012 SAFE HARBOR STATEMENT Certain statements made in this presentation constitute forward-looking statements, within the meaning of the Private Securities Litigation
Retailer Survey Results
 Retailer Survey Results Chex Finer Foods October, 2014 1 Grocery Mix Pretty much everything we sell is natural/specialty Hard to see the difference with a lot of our selections. Many could fall into either
Chilled Seafood in Multiple Retail (2018)
") Market Insight Factsheet Chilled Seafood in Multiple Retail () This factsheet provides a summary of the performance of the chilled seafood sector in the multiple retail seafood market up to June. The chilled
Market Insight Factsheet Chilled Seafood in Multiple Retail () This factsheet provides a summary of the performance of the chilled seafood sector in the multiple retail seafood market up to June. The chilled
KOREA MARKET REPORT: FRUIT AND VEGETABLES
 KOREA MARKET REPORT: FRUIT AND VEGETABLES 주한뉴질랜드대사관 NEW ZEALAND EMBASSY SEOUL DECEMBER 2016 Page 2 of 6 Note for readers This report has been produced by MFAT and NZTE staff of the New Zealand Embassy
Why Culinary Secret Spices?
 On Sales Why Culinary Secret Spices? BEST FOR YOU AS A COMPANY Culinary Secrets is a premium national branded product, and is key to building your sales in this category. BEST FOR YOU, THE DSR Culinary
An Annual Report by ShipCompliant and Wines & Vines. Direct to consumer. Wine Shipping Report
 An Annual Report by ShipCompliant and Wines & Vines Direct to consumer Wine Shipping Report 2013 Trends and milestones for shipping wine directly to consumers. Introduction Executive summary Highlights
Chilean Table Grapes in North America. Presented by Tom Tjerandsen Managing Director - North America Chilean Fresh Fruit Association
 Chilean Table Grapes in North America Presented by Tom Tjerandsen Managing Director - North America Chilean Fresh Fruit Association 1 Chilean Table Grapes in North America Agenda Background on the Table
UTZ Cocoa Statistics Report 2017
 UTZ Cocoa Statistics Report 2017 UTZ is the largest program in the world for sustainable cocoa There are more than 760,000 cocoa farmers in the UTZ program UTZ certified cocoa is produced in 21 countries
Challenges in Fluid Milk Consumption. October 25, 2017
 Challenges in Fluid Milk Consumption October 25, 2017 Increased Competition At Store 1970 s Milk Soft Drinks Coffee Juice 1980 s Milk Soft Drinks Coffee Juice Bottled water RTD juice Teas 1990 s Milk Soft
Global Takeaway Food Delivery Market: Trends & Opportunities (2015 Edition) January 2016
 January 2016") Global Takeaway Food Delivery Market: Trends & Opportunities (2015 Edition) January 2016 Global Takeaway Food Delivery Market Report Scope of the Report The report titled Global Takeaway Food Delivery
Global Takeaway Food Delivery Market: Trends & Opportunities (2015 Edition) January 2016 Global Takeaway Food Delivery Market Report Scope of the Report The report titled Global Takeaway Food Delivery
INDUSTRY SPECIALTY FOOD THE STATE OF THE SPECIAL REPORT: GROUNDBREAKING STATISTICS OF THE SPECIALTY FOOD MARKETPLACE
 S ALES GROWTH OR DECLINE FOR SPECIALTY FOODS & MAINSTREAM FOODS THE STATE OF THE SPECIALTY FOOD RETAILER SPECIAL REPORT: GROUNDBREAKING STATISTICS OF THE SPECIALTY FOOD MARKETPLACE THE STATE OF THE SPECIALTY
DRIVING THE TORTILLA INDUSTRY GROWTH PRIVATE SECTOR INTERNSHIPS AND LINK
 DRIVING THE TORTILLA INDUSTRY GROWTH PRIVATE SECTOR INTERNSHIPS AND LINK MAY, 2014 TABLE OF CONTENTS I. MISSION FOODS DESCRIPTION II. INTERNSHIP PROGRAMS III. INNOVATION IMPACT ON CPG S HR I. MISSION FOODS
CORRELATING FORCES: THE ROLE OF PREMIUM AND SUSTAINABLE IN DRIVING GROWTH WITHIN CHOCOLATE CONFECTIONERY ALAN ROWNAN ICCO 2016
 CORRELATING FORCES: THE ROLE OF PREMIUM AND SUSTAINABLE IN DRIVING GROWTH WITHIN CHOCOLATE CONFECTIONERY ALAN ROWNAN ICCO 2016 ABOUT EUROMONITOR INTERNATIONAL About Euromonitor International Euromonitor
Wine On-Premise UK 2016
 Wine On-Premise UK 2016 T H E M E N U Introduction... Page 5 The UK s Best On-Premise Distributors... Page 7 The UK s Most Listed Wine Brands... Page 17 The Big Picture... Page 26 The Style Mix... Page
Trends & Styles in Northern European Markets
 Trends & Styles in Northern European Markets by Job de Swart MW RAI - AMSTERDAM 26 NOVEMBER 2018 Who is this guy? - Job de Swart is the 3rd Dutchman to become a Master of Wine in 2018 - Wine buyer for
MEXICO WATER REPORT. Bottled Water in Mexico: Second & Growing
 Issue 2 Spring 2011 Editor: Vince Lencioni General Manager Contributors: Claire Carranza, Alejandro Vega MEXICO WATER REPORT Bottled Water in Mexico: Second & Growing In 2009, Mexican bottled water volumes
Top Ten Trends for 2018 by Innova Market Insights Fi Europe 2017
 Top Ten Trends for 2018 by Innova Market Insights Fi Europe 2017 From technology to new products to consumers & markets TECHNOLOGY NEW PRODUCTS CONSUMERS MARKETS TECHNOLOGY NEW PRODUCTS CONSUMERS MARKETS
China: Opportunities & Challenges for Produce from South America. Mabel Zhuang Director, M.Z. Marketing Communications PMA China Consultant
 China: Opportunities & Challenges for Produce from South America Mabel Zhuang Director, M.Z. Marketing Communications PMA China Consultant Agenda A Little Background: China s Economy Overview Setting the
An update from the Competitiveness and Market Analysis Branch, Alberta Agriculture and Forestry.
 An update from the Competitiveness and Market Analysis Branch, Alberta Agriculture and Forestry. The articles in this series includes information on what consumers are buying and why they are buying it.
J / A V 9 / N O.
 July/Aug 2003 Volume 9 / NO. 7 See Story on Page 4 Implications for California Walnut Producers By Mechel S. Paggi, Ph.D. Global production of walnuts is forecast to be up 3 percent in 2002/03 reaching
EXECUTIVE SUMMARY OVERALL, WE FOUND THAT:
 THE ECONOMIC IMPACT OF CRAFT BREWERIES IN LOS ANGELES LA s craft brewing industry generates short-term economic impacts through large capital investments, equipment purchases, and the construction of new
74% of consumers say they prefer to eat their breakfast in the lodging foodservice facility, as opposed to taking it to go
 74% of consumers say they prefer to eat their breakfast in the lodging foodservice facility, as opposed to taking it to go Base: 1,001 consumers who have visited a foodservice location within a lodging
TOTAL STORE CONNECTIVITY: REVEALING NEW PATHWAYS TO WIN SPECIALTY CHEESE
 TOTAL STORE CONNECTIVITY: REVEALING NEW PATHWAYS TO WIN SPECIALTY CHEESE International Dairy Deli Bakery Association In partnership with Nielsen Perishables Group May, 2015 AGENDA Study Objectives 3 Deli
Breakfast Brief. Baby Boomers/Matures
 Breakfast Brief / boomers, individuals between the ages of 51 and 70, and matures, individuals older than 70, are entering new life stages, including retirement and senior living facilities. These two
Marketing Objectives. Sales & Marketing Goals. Increase domestic and global demand. Broaden awareness and understanding of
 Sales & Marketing Goals Increase domestic and global demand Create sustainable, diversified markets Maintain a premium price Marketing Objectives Broaden awareness and understanding of Oregon Hazelnuts
Foodservice Market Prospects
 Foodservice Market Prospects Australia & South East Asia Food SA Summit 5th June 2012 BIS Foodservice 3 4 Three Available Food & Beverage Markets The Three Food & Non-Alcoholic Beverage Markets Market
INTERNATIONAL SALES PROGRAM
 INTERNATIONAL SALES PROGRAM About Barney Butter We are a California based company, among the fastest growing brands in the Almond Butter Category Our California almonds are grown right in our own back
Food brands. Food Europe. Food North America
 Food brands Food Europe Cuisine de France offers the consumer traditional French breads, pastries and also a wide range of continental-style breads, confectionery and hot savoury items. Cuisine de France
SEAFOOD CONSUMPTION National and Local Preferences
 Barry Nash North Carolina State Seafood Laboratory North Carolina Sea Grant College Program SEAFOOD CONSUMPTION National and Local Preferences Statistics In 2007, Americans consumed $22.7 billion worth
1
 1 Introduction In his 213 budget, the then chancellor George Osborne abolished the beer duty escalator which increased beer duty by 2 per cent above the rate of inflation. A 1p cut in duty was also announced.
Fresh Produce Marketing Trends: Implications for Blueberries
 Fresh Produce Marketing Trends: Implications for Blueberries DR. ROBERTA COOK Dept. of Ag and Resource Economics University of California Davis May 2008 U.S. Fresh Blueberries: Production, Imports & Exports,
Welcome to Coffee Planet
 Welcome to Coffee Planet At Coffee Planet we roast our 100% Arabica specialty coffee in our own roastery on the Arabian Peninsula; where Arabica roasting began over 500 years ago. The combination of this
Wine Clusters Equal Export Success
 University of Wollongong Research Online Faculty of Commerce - Papers (Archive) Faculty of Business 2004 Wine Clusters Equal Export Success D. K. Aylward University of Wollongong, daylward@uow.edu.au Publication
New from Packaged Facts!
 New from Packaged Facts! FOODSERVICE MARKET INSIGHTS A fresh perspective on the foodservice marketplace Essential Insights on Consumer customerservice@packagedfacts.com (800) 298-5294 (240) 747-3095 (Intl.)
FOOD INDUSTRY FORESIGHT
 FOOD INDUSTRY FORESIGHT New Zealand Foodservice A RESEARCH STUDY CONDUCTED BY FOOD INDUSTRY FORESIGHT FOR MORE THAN TWO DECADES w w w. F I F o r e s i g h t. c o m THE NEW ZEALAND FOODSERVICE MARKET HAS
Starbucks / Dunkin Donuts research. Presented by Alex Hockley and Molly Fox. Wednesday, June 13, 2012
 F& H Starbucks / Dunkin Donuts research Presented by Alex Hockley and Molly Fox Executive Summary: These days there are a significant amount of coffee establishments located in Center City, Philadelphia.
CATEGORY CLOSE UP: FUELING THE FOUNTAIN
 CATEGORY CLOSE UP: FUELING THE FOUNTAIN Operators fend off competition and keep up with trends to ensure their cold dispensed beverage sales continue to grow. By Jamie Hartford On paper, cold dispensed
$ BUY STARBUCKS CORPORATION (SBUX) Rena Kaufman. Valuation Methodology. Market Data. Financial Summary (7/1/2018) Profile. Financial Analysis
 Rena Kaufman. Valuation Methodology. Market Data. Financial Summary (7/1/2018) Profile. Financial Analysis") STARBUCKS CORPORATION (SBUX) Market Data Market Cap (intraday): $69,991M Enterprise Value (Aug 9, 2018): $74,898M Enterprise Value/EBITDA (ttm): 14.97x Rena Kaufman $51.88 - BUY Valuation Methodology Method
STARBUCKS CORPORATION (SBUX) Market Data Market Cap (intraday): $69,991M Enterprise Value (Aug 9, 2018): $74,898M Enterprise Value/EBITDA (ttm): 14.97x Rena Kaufman $51.88 - BUY Valuation Methodology Method
GLOBAL SUPPLY UPDATE GLENN PROCTOR FEBRUARY 7, 2018
 GLOBAL SUPPLY UPDATE GLENN PROCTOR FEBRUARY 7, 2018 21 DEDICATED BROKERS IN 8 COUNTRIES GLOBALLY BASED TO BUILD YOUR BUSINESS WORLDWIDE INTRODUCTION - CIATTI CO 8 REGIONAL OFFICES WORLDWIDE - WINE, GRAPES,
Australian wine: Production, sales and inventory
 Wine Australia providing insights on Australian Wine Australian wine: Production, sales and inventory 2016 17 January 2018 Key takeaways The 2017 vintage saw historically high production for the second
Is Your Restaurant Ready for the Growing Online Ordering Trend?
 Is Your Restaurant Ready for the Growing Online Ordering Trend? Are you looking for a new way to grow your restaurant business? Consider online ordering. According to QSR Web, digital ordering is growing
DELIVERING REFRESHING SOFT DRINKS
 BEVERAGES DIVISION DELIVERING REFRESHING SOFT DRINKS Swire Beverages manufactures, markets and distributes refreshing soft drinks to consumers in Hong Kong, Taiwan, Mainland China and the USA. 46 215 PERFORMANCE
EastAgri Annual Meeting BEST FOOD: HOW TO PRODUCE BOTH QUALITY AND QUANTITY IN EUROPE AND CENTRAL ASIA
 1 EastAgri Annual Meeting BEST FOOD: HOW TO PRODUCE BOTH QUALITY AND QUANTITY IN EUROPE AND CENTRAL ASIA Belgrade, Serbia - 18-19 June 2014 EXPANSION INTO NEW MARKETS THROUGH QUALITY ENHANCEMENT: WHAT
Beverages 2017 The Shifting Beverage Landscape And What It Means for Packaging
 The Packaging Conference Beverages 2017 The Shifting Beverage Landscape And What It Means for Packaging February 6, 2017 Beverage Marketing Capabilities Beverage Marketing Corporation utilizes an integrated