Economic Census Overview and Exercises
|
|
|
- Phebe Hood
- 5 years ago
- Views:
Transcription
1 Economic Census Overview and Exercises NJ State Data Center Meeting New Brunswick, NJ June 20, 2012 Presented by: Andy Hait Economic Planning & Coordination Division
2 Outline Economic Programs At a Glance Update on the 2012 Economic Census American FactFinder (and other) Exercises 2
 Covers employer businesses in the U.S.")
3 Economic Programs Overview Yes, the Census Bureau does something other than the demographic programs! Economic Census Done on the years ending in 2 and 7 (2012 Economic Census kickoff in October) Covers employer businesses in the U.S. Collected on an establishment basis 3
 Governments (covered by Census of Governments) Very")
4 The Economic Census Offers Over 200 unique industry statistics National-, state-, metro-, county-, place-, and ZIP Code-level data (varies by sector) Industry detail: 2- thru 6-digit NAICS codes 18 of the 20 NAICS sectors covered; excluded: Agriculture (covered by USDA/NASS) Governments (covered by Census of Governments) Very accurate 4
5 Related Economic Programs Economic Census of Island Areas Covers American Samoa, Guam, Northern Mariana Islands, Puerto Rico, and the Virgin Islands Census of Governments Covers Federal, State, and Local Governments Survey of Business Owners Business data by Race, Ethnicity, Gender, Veteran Status of Business Owner 5
6 Other Economic Programs Monthly, Quarterly, & Annual Surveys Sample surveys drawn from universe of businesses identified in the Economic Census Fewer data items published Less geographic and industry detail Incomplete coverage Sampling and Nonsampling errors Benchmarked to the latest Economic Census 6
7 2012 Economic Census Update About 4.3 million establishments will be mailed one of over 500 unique versions of the form (tailored to specific industry) All large & mid-size employers Sample of small employers Electronic response also offered 2007 response rate - 93% large co s; 86% overall Outreach already started Report of Organization, Respondent Contact Cards, Advance Information Packets Partnerships with associations and organizations 7


8 business.census.gov 8

9 Major Features General Information Promotional Tools & Materials Respondent Information Data Use Scenarios Snapshots Videos Tell us how we can help! 9
10 Exercises 10
11 Sample Scenario: An entrepreneur is interested in opening a fast-food restaurant and has contacted you to find out what information can the Census Bureau provide that will help him understand this industry, develop a business plan, and identify a good place to locate the business. How will you help him? 11
12 Exercise 1 What programs at the Census Bureau provide data on Limited-Service Restaurants (NAICS ) that he might be able to use? (Hint Use the Industry Statistics Sampler, which can be accessed off the Business and Industry page) 12
13 Exercise 1 Steps & Answer Go to the Business & Industry page by clicking on the word Business at the top of the Census home page, type in in the Industry Search box, and click Go Click on in the results table Data on limited-service restaurants are available in the Annual Retail Trade survey, in County Business Patterns, in the Statistics of US Business, in the Economic Census, and in the Survey of Business Owners. 13
14 Exercise 2 He is thinking about opening his new fast-food restaurant in Middlesex County, NJ. How many fastfood restaurants were there in 2009 and how does this compare to the other counties in the state? Is this a good county to put my restaurant in? (Hint Use the data from the County Business Patterns program, available in the New American FactFinder) 14
15 Exercise 2 Steps Click on the AFF shortcut under the Guide to All Data Sources tab on the Industry Statistics Sampler. This will bring you into AFF with the Topics menu pre-select to Business Patterns. To select the industry: Expand the Industry Codes menu, expand the Industry Sector menu and select 72, Accommodation & Food Svcs, and finally select from the Industry Code Results list Click Add to put this code in the Your Selections box, and close the menu. 15
16 Exercise 2 Steps (cont) To select the state: Expand the Geographies menu, click the Name tab, and select New Jersey from the Geographic Results list, and click Add to put this item in the Your Selections box To select the counties: Click the List tab, select County and then New Jersey from the lists, then select All Counties within New Jersey from the list, and finally click Add to Your Selections to put these geographies in the Your Selections box. Close the menu. Select the first table (CB0900A1) from the Search Results list 16
17 2009 County Business Patterns NJ County Comparison for Limited Service Eating Places (NAICS ) Geographic area name Number of establishments Paid employees for pay period including March 12 (number) First quarter Annual payroll payroll ($1,000) ($1,000) Payroll per employee 2009 Population Estimate Population per establishment New Jersey 6,375 58, , ,994 13,599 8,707,739 1,366 Bergen County, New Jersey 720 5,544 19,341 83,924 15, ,250 1,243 Middlesex County, New Jersey 586 4,969 15,428 66,036 13, ,738 1,349 Essex County, New Jersey 505 4,574 14,853 63,192 13, ,644 1,524 Monmouth County, New Jersey 482 4,926 15,570 67,790 13, ,105 1,336 Hudson County, New Jersey 469 3,307 11,352 47,377 14, ,924 1,275 Morris County, New Jersey 404 3,750 11,818 50,019 13, ,518 1,209 Ocean County, New Jersey 398 3,311 10,227 48,489 14, ,678 1,441 Camden County, New Jersey 383 4,165 11,938 51,090 12, ,879 1,352 Passaic County, New Jersey 329 2,593 8,928 37,602 14, ,778 1,495 Burlington County, New Jersey 324 3,882 10,810 45,778 11, ,108 1,377 Union County, New Jersey 319 3,144 10,146 43,229 13, ,426 1,650 Mercer County, New Jersey 272 2,696 7,893 34,195 12, ,222 1,346 Somerset County, New Jersey 240 2,162 7,113 30,502 14, ,869 1,362 Atlantic County, New Jersey 185 2,063 6,356 28,076 13, ,712 1,469 Gloucester County, New Jersey 184 2,471 6,728 28,588 11, ,920 1,576 Cape May County, New Jersey ,839 15,714 25,510 96, Cumberland County, New Jersey 99 1,118 3,022 13,494 12, ,745 1,593 Hunterdon County, New Jersey ,944 8,680 13, ,034 1,461 Warren County, New Jersey ,180 9,218 12, ,638 1,260 Sussex County, New Jersey ,122 8,829 11, ,118 1,799 Salem County, New Jersey ,441 7,172 12,762 66,342 1,746
18 Exercise 2 Extra Credit! Which township or borough (Economic Place) within Middlesex County reported the highest sales of limited-service eating places in 2007 and how do the other places in the county compare? (Hint Use the Economic Place data from the Economic Census, available in the New American FactFinder) 18
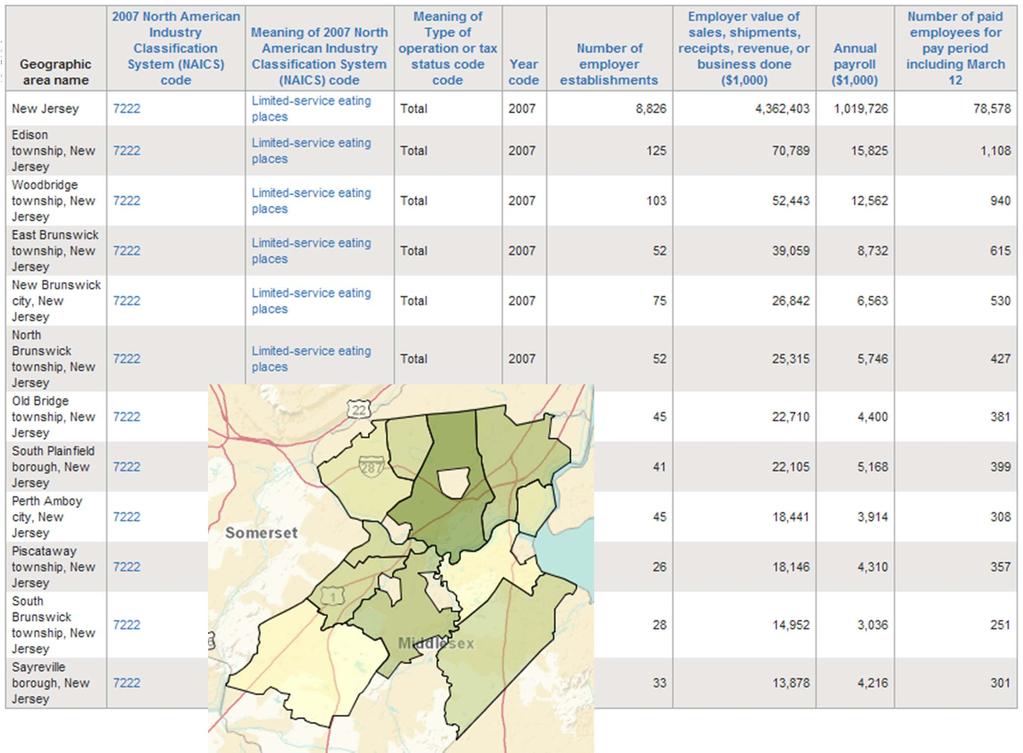
19
20 Exercise 3 I am considering offering either table service in my restaurant. How common is this in NJ fast-food restaurants, and what percentage of my food sales should I expect might come from drive-in service? (Hint Use the Product Lines data from Economic Census for the Accommodation and Foodservices sector, available in the New AFF) 20
21 Exercise 3 Steps & Answer Click on the Back to Search button Click the red X next to both Business Patterns and All Counties within New Jersey to remove these selections from the list. Select the Product Lines file (EC0744SLLS1) from the list. Of the 6,659 limited-service restaurants in NJ, 630 offered Meals & snacks served at a table by a server, accounting for $52.1 Million (1.6%) of the total $3.2 Billion in this industry. (See the next page for a visualization of these data.) 21
22 NJ Fast Food Restaurants Product Sales: 2007 (Total: $3.2 Billion) Food for catered events Groceries for consumption off premises Food and beverages mobile vending service 0% Food and beverages with table service 22% Food and beverages immediate consumption off site 19% Food Sales Detail: 2007 (Total: $3.1 Billion) Food and beverages without table service 37% Food and beverages drive thru service 22% Food for immediate consumption 97% Delivery services and coin operated machines Other merchandise, incl. alcoholic beverages 22
23 Exercise 4 What were the total sales of Limited-Service Eating Places (NAICS 7222) through the latest month and how does this compare to the prior period? (Hint Use the Monthly Retail Trade Economic Indicator Report) 23
24 Exercise 4 Steps & Answer Go to the Economic Indicators page by clicking on the Economic Indicators banner in the top right corner of census.gov Select the Advance Monthly Sales for Retail and Food Services survey from the list by clicking on the survey title Click the Excel (1992-present) link to the right of the Retail and Food Service Sales bullet under Monthly Retail Trade Report. Scroll down to NAICS 7222 under NOT ADJUSTED When this handout was created, the latest data was for April The preliminary monthly value for April was $18,611 (in $ Millions), down slightly from the $19,406 reported in March. The cumulative year-to-date value was $72,405. This is up $3,926 (5.7%) from the $68,479 published for the same period in
25 Additional Exercises to Do at Your Leisure What other types of data does the Census Bureau offer that I might find useful? Maybe something about the types of food sold in fast-food restaurants in New Jersey? (Hint Use the data from the Miscellaneous Subjects files from the Economic Census for the Accommodation and Foodservices sector, available in the New AFF) 25
26 Additional Exercise Steps Click on the American FactFinder link under the Data tab on census.gov Expand the Topics menu, then the + next to Program, and select Economic Census from the list. Economic Census will be added to the Your Selections box. Close the menu. To select the industry: Expand the Industry Codes menu, expand the Industry Sector menu and select 72, Accommodation & Food Svcs, and finally select from the Industry Code Results list. Click Add to put this code in the Your Selections box. Close the menu. 26
27 Additional Exercise Steps (cont) To select the Geography: Expand the Geographies menu, select New Jersey from the Geographic Results list, and click Add to put this item in the Your Selections box. Close the menu. Select the appropriate table from the Search Results list 27
28 Additional Exercise Results Fast Food Restaurant Sales in NJ by Type of Food Service: 2007 $30 $64 ($ Millions) $158 Order and pay at counter with inside seating Take out/drive through $1,405 $1,573 Delivery Cafeteria line with inside seating Other primary type of food service 2,000 Fast Food Restaurant Sales in NJ by Day Part: 2007 ($ Millions) 1,600 1, $1,580 $1, $309 6:00 a.m. to 11:00 a.m. 11:00 a.m. to 5:00 p.m. 5:00 p.m. to 11:00 p.m. $130 11:00 p.m. to 6:00 a.m. 28
29 3,000 2,500 2,000 1,500 1, Number of Fast Food Restaurants in NJ by Average Cost per Meal: Less than $ $2.00 to $4.99 2,426 $5.00 to $6.99 1,933 $7.00 to $9.99 1,009 $10.00 to $ $15.00 to $ $20.00 or more 2,000 1,600 Fast Food Restaurant Sales in NJ by Average Cost per Meal: 2007 ($ Millions) $1,532 1, $16 Less than $2.00 $346 $2.00 to $4.99 $5.00 to $6.99 $860 $7.00 to $9.99 $378 $10.00 to $14.99 $96 $15.00 to $19.99 $0 $20.00 or more 29
30 Fast Food Restaurant Sales in NJ by Franchise Status: 2007 ($ Millions) Non franchise establishments $1,301 Franchiseeowned establishments $1,566 Franchisorowned establishments $362 No food specialty Other food specialty Sandwich/sub shop Hamburgers Chicken Pizza Steak Seafood Other ethnic specialty Chinese Mexican Italian Fast Food Restaurant Sales in NJ by Principal Menu Type: 2007 ($ Millions) $163 $94 $226 $10 $1 $74 $139 $116 $277 $302 $519 $1,308 $0 $200 $400 $600 $800 $1,000 $1,200 $1,400 30

31 Questions

32 A Summary and What s Next Continue to learn about (and talk about) the Economic Census and our economic programs Use the materials on Business.census.gov Sign Up for updates 32
33 Thank You! If you have any questions, please feel free to contact me at: (301)
Food Manufacturing in New Jersey Industry Report FOOD MANUFACTURING IN NEW JERSEY
 FOOD MANUFACTURING IN NEW JERSEY 1 1.4% 1.3% 1% 6.2% Number of NJ Food Manufacturing Establishments by Subsector FIGURE 1 6.7% 6.7% 7.2% 13.5% 56% Bakeries and Tortilla Manufacturers Other Food Manufacturing
Food and beverage services statistics - NACE Rev. 2
 Food and beverage services statistics - NACE Rev. 2 Statistics Explained Data extracted in October 2015. Most recent data: Further Eurostat information, Main tables and Database. This article presents
Classification Bias in Commercial Business Lists for Retail Food Outlets in the U.S
 Classification Bias in Commercial Business Lists for Retail Food Outlets in the U.S American Public Health Association Denver, CO, U.S.A., vember 8, 2010 Euna Han, PhD University of Illinois at Chicago
Total cheese output (excluding cottage cheese) was 1.09 billion pounds, 2.6 percent above December 2016 and 3.0 percent above November 2017.
 was 1.09 billion pounds, 2.6 percent above December 2016 and 3.0 percent above November 2017.") Dairy Products ISSN: 949-0399 Released February, 208, by the National Agricultural Statistics Service (NASS), Agricultural Statistics Board, United States Department of Agriculture (USDA). Highlights Total
Dairy Products ISSN: 949-0399 Released February, 208, by the National Agricultural Statistics Service (NASS), Agricultural Statistics Board, United States Department of Agriculture (USDA). Highlights Total
Total cheese output (excluding cottage cheese) was 1.05 billion pounds, 2.8 percent above November 2016 but 2.0 percent below October 2017.
 was 1.05 billion pounds, 2.8 percent above November 2016 but 2.0 percent below October 2017.") Dairy Products ISSN: 9490399 Released January 4, 208, by the National Agricultural Statistics Service (NASS), Agricultural Statistics Board, United States Department of Agriculture (USDA). Highlights Total
Dairy Products ISSN: 9490399 Released January 4, 208, by the National Agricultural Statistics Service (NASS), Agricultural Statistics Board, United States Department of Agriculture (USDA). Highlights Total
Total cheese output (excluding cottage cheese) was 1.03 billion pounds, 2.3 percent above August 2016 but 0.7 percent below July 2017.
 was 1.03 billion pounds, 2.3 percent above August 2016 but 0.7 percent below July 2017.") Dairy Products ISSN: 949-0399 Released October 5,, by the National Agricultural Statistics Service (NASS), Agricultural Statistics Board, United States Department of Agriculture (USDA). Highlights Total
Dairy Products ISSN: 949-0399 Released October 5,, by the National Agricultural Statistics Service (NASS), Agricultural Statistics Board, United States Department of Agriculture (USDA). Highlights Total
The Economic Impact of the Craft Brewing Industry in Maine. School of Economics Staff Paper SOE 630- February Andrew Crawley*^ and Sarah Welsh
 The Economic Impact of the Craft Brewing Industry in Maine School of Economics Staff Paper SOE 630- February 2017 Andrew Crawley*^ and Sarah Welsh School of Economics, University of Maine Executive Summary
VECTOR SURVEILLANCE SUMMARY SHEET WEEK: 14
 VECTOR SURVEILLANCE SUMMARY SHEET WEEK: 14 Culiseta melanura Monitor September 4-6, 2002 Sites Green Bank (Burlington Co.) Corbin City (Atlantic Co.). Dennisville (Cape May Co.) Coastal Resting Boxes Sites
Total cheese output (excluding cottage cheese) was 1.07 billion pounds, 1.7 percent above October 2016 and 5.2 percent above September 2017.
 was 1.07 billion pounds, 1.7 percent above October 2016 and 5.2 percent above September 2017.") Dairy Products ISSN: 949-0399 Released December 5,, by the National Agricultural Statistics Service (NASS), Agricultural Statistics Board, United States Department of Agriculture (USDA). Highlights Total
Dairy Products ISSN: 949-0399 Released December 5,, by the National Agricultural Statistics Service (NASS), Agricultural Statistics Board, United States Department of Agriculture (USDA). Highlights Total
Total cheese output (excluding cottage cheese) was 1.06 billion pounds, 3.3 percent above March 2016 and 12.7 percent above February 2017.
 was 1.06 billion pounds, 3.3 percent above March 2016 and 12.7 percent above February 2017.") Dairy Products ISSN: 949-0399 Released May 4,, by the National Agricultural Statistics Service (NASS), Agricultural Statistics Board, United States Department of Agriculture (USDA). Highlights Total cheese
Dairy Products ISSN: 949-0399 Released May 4,, by the National Agricultural Statistics Service (NASS), Agricultural Statistics Board, United States Department of Agriculture (USDA). Highlights Total cheese
Total cheese output (excluding cottage cheese) was 1.05 billion pounds, 4.0 percent above May 2016 and 0.8 percent above April 2017.
 was 1.05 billion pounds, 4.0 percent above May 2016 and 0.8 percent above April 2017.") Dairy Products ISSN: 949-0399 Released July 6,, by the National Agricultural Statistics Service (NASS), Agricultural Statistics Board, United States Department of Agriculture (USDA). Highlights Total cheese
Dairy Products ISSN: 949-0399 Released July 6,, by the National Agricultural Statistics Service (NASS), Agricultural Statistics Board, United States Department of Agriculture (USDA). Highlights Total cheese
Peanut Stocks and Processing
 Stocks and Processing ISSN: 949-875 Released September 27,, by the National Agricultural Statistics Service (NASS), Agricultural Statistics Board, United States Department of Agriculture (USDA). Shelled
VECTOR SURVEILLANCE SUMMARY SHEET WEEK: 5
 VECTOR SURVEILLANCE SUMMARY SHEET WEEK: 5 Culiseta melanura Monitor June 3 July, Sites Coastal Resting Boxes Mean From Previous Years No. Per Box For This Collection Collected to Date Pools Submitted to
MANGO PERFORMANCE BENCHMARK REPORT
 MANGO PERFORMANCE BENCHMARK REPORT 2015-2016 TABLE OF CONTENTS Page 3 Page 5 Page 12 Page 15 Page 27 Page 36 Page 46 Approach and Data Set Parameters Overview and Mango Trend-Spotting Fruit and Tropical
Peanut Stocks and Processing
 Stocks and Processing ISSN: 949-875 Released November 29,, by the National Agricultural Statistics Service (NASS), Agricultural Statistics Board, United States Department of Agriculture (USDA). Shelled
Total cheese output (excluding cottage cheese) was 1.04 billion pounds, 3.7 percent above April 2016 but 2.1 percent below March 2017.
 was 1.04 billion pounds, 3.7 percent above April 2016 but 2.1 percent below March 2017.") Dairy Products ISSN: 949-0399 Released June 5,, by the National Agricultural Statistics Service (NASS), Agricultural Statistics Board, United States Department of Agriculture (USDA). Highlights Total cheese
Dairy Products ISSN: 949-0399 Released June 5,, by the National Agricultural Statistics Service (NASS), Agricultural Statistics Board, United States Department of Agriculture (USDA). Highlights Total cheese
Peanut Stocks and Processing
 Stocks and Processing ISSN: 1949-1875 Released September 29,, by the National Agricultural Statistics Service (NASS), Agricultural Statistics Board, United States Department of Agriculture (USDA). Shelled
THE ECONOMIC IMPACT OF BEER TOURISM IN KENT COUNTY, MICHIGAN
 THE ECONOMIC IMPACT OF BEER TOURISM IN KENT COUNTY, MICHIGAN Dan Giedeman, Ph.D., Paul Isely, Ph.D., and Gerry Simons, Ph.D. 10/8/2015 THE ECONOMIC IMPACT OF BEER TOURISM IN KENT COUNTY, MICHIGAN EXECUTIVE
Total cheese output (excluding cottage cheese) was 942 million pounds, 4.7 percent above September 2013 and 0.2 percent above August 2014.
 was 942 million pounds, 4.7 percent above September 2013 and 0.2 percent above August 2014.") Dairy Products ISSN: 1949-0399 Released November 4,, by the National Agricultural Statistics Service (NASS), Agricultural Statistics Board, United States Department of Agriculture (USDA). Highlights Total
Dairy Products ISSN: 1949-0399 Released November 4,, by the National Agricultural Statistics Service (NASS), Agricultural Statistics Board, United States Department of Agriculture (USDA). Highlights Total
THE ECONOMIC IMPACT OF WINE AND WINE GRAPES ON THE STATE OF TEXAS 2015
 THE ECONOMIC IMPACT OF WINE AND WINE GRAPES ON THE STATE OF TEXAS 2015 A Frank, Rimerman + Co. LLP Report Updated January 2017 This study was commissioned by the Texas Wine and Grape Growers Association
Iowa Native Wine Production & Sales Report for the period ending 6/30/2012 By Craig Tordsen, Iowa State University, November, 2012
 Iowa Native Wine Production & Sales Report for the period ending 6/30/2012 By Craig Tordsen, Iowa State University, November, 2012 Native Wine Inventory, Production and Sales Winery Size in Gallons of
Native Wine Production & Sales For the Year Ending (In Gallons)
") Iowa Native Wine & Report for the period ending 12/31/2016 By Craig Tordsen, February 2017 Native Wine, and Native Wine & Number of Wineries Dec-14 Dec-15 Winery Size in Gallons of by Winery Size % The
Iowa Native Wine & Report for the period ending 12/31/2016 By Craig Tordsen, February 2017 Native Wine, and Native Wine & Number of Wineries Dec-14 Dec-15 Winery Size in Gallons of by Winery Size % The
Hispanic Population by Region
 Hispanic Marketing Hispanic Population Largest ethnic group in the U.S., at 50.5 million consumers and growing 16% of the total population Those of Cuban, Mexican, Puerto Rican, South or Central American,
Biological Control of the Mexican Bean Beetle Epilachna varivestis (Coleoptera: Coccinellidae) Using the Parasitic Wasp Pediobius foveolatus
 Using the Parasitic Wasp Pediobius foveolatus") Biological Control of the Mexican Bean Beetle Epilachna varivestis (Coleoptera: Coccinellidae) Using the Parasitic Wasp Pediobius foveolatus (Hymenoptera: Eulophidae) 2017 Mexican bean beetle adult P.
Biological Control of the Mexican Bean Beetle Epilachna varivestis (Coleoptera: Coccinellidae) Using the Parasitic Wasp Pediobius foveolatus (Hymenoptera: Eulophidae) 2017 Mexican bean beetle adult P.
Chilean Table Grapes in North America. Presented by Tom Tjerandsen Managing Director - North America Chilean Fresh Fruit Association
 Chilean Table Grapes in North America Presented by Tom Tjerandsen Managing Director - North America Chilean Fresh Fruit Association 1 Chilean Table Grapes in North America Agenda Background on the Table
Notes on the Philadelphia Fed s Real-Time Data Set for Macroeconomists (RTDSM) Capacity Utilization. Last Updated: December 21, 2016
 Capacity Utilization. Last Updated: December 21, 2016") 1 Notes on the Philadelphia Fed s Real-Time Data Set for Macroeconomists (RTDSM) Capacity Utilization Last Updated: December 21, 2016 I. General Comments This file provides documentation for the Philadelphia
1 Notes on the Philadelphia Fed s Real-Time Data Set for Macroeconomists (RTDSM) Capacity Utilization Last Updated: December 21, 2016 I. General Comments This file provides documentation for the Philadelphia
Total cheese output (excluding cottage cheese) was 883 million pounds, 5.0 percent above January 2010 but 2.7 percent below December 2010.
 was 883 million pounds, 5.0 percent above January 2010 but 2.7 percent below December 2010.") Dairy Products ISSN: 1949-0399 Released March 2,, by the National Agricultural Statistics Service (NASS), Agricultural Statistics Board, United States Department of Agriculture (USDA). Highlights Total
Dairy Products ISSN: 1949-0399 Released March 2,, by the National Agricultural Statistics Service (NASS), Agricultural Statistics Board, United States Department of Agriculture (USDA). Highlights Total
Mango Retail Performance Report 2017
 Mango Retail Performance Report 2017 1 Table of Contents Pages 3-9 Pages 10-15 Pages 16-34 Pages 35-44 Pages 45-51 Pages 52-54 Executive Summary Fruit and Tropical Fruit Performance Whole Mango Performance
1. Expressed in billions of real dollars, seasonally adjusted, annual rate.
 ROUTPUT -- Real GNP/GDP 1. Expressed in billions of real dollars, seasonally adjusted, annual rate. 2. First Monthly Vintage: 1965:M11 First Quarterly Vintage: 1965:Q4 3. First Observation: 1947:Q1 4.
Total cheese output (excluding cottage cheese) was 982 million pounds, 4.2 percent above February 2017 but 10.5 percent below January 2018.
 was 982 million pounds, 4.2 percent above February 2017 but 10.5 percent below January 2018.") Dairy Products ISSN: 949-0399 Released April 4,, by the National Agricultural Statistics Service (NASS), Agricultural Statistics Board, United States Department of Agriculture (USDA). Highlights Total
Dairy Products ISSN: 949-0399 Released April 4,, by the National Agricultural Statistics Service (NASS), Agricultural Statistics Board, United States Department of Agriculture (USDA). Highlights Total
NEW BUSINESS INFORMATION PACKET. Welcome to the Village of West Dundee! We are so happy that you have chosen to open your doors to this community.
 NEW BUSINESS INFORMATION PACKET Welcome to the Village of West Dundee! We are so happy that you have chosen to open your doors to this community. We want to ensure that the process of opening your business
Notes on the Philadelphia Fed s Real-Time Data Set for Macroeconomists (RTDSM) Indexes of Aggregate Weekly Hours. Last Updated: December 22, 2016
 Indexes of Aggregate Weekly Hours. Last Updated: December 22, 2016") 1 Notes on the Philadelphia Fed s Real-Time Data Set for Macroeconomists (RTDSM) Indexes of Aggregate Weekly Hours Last Updated: December 22, 2016 I. General Comments This file provides documentation for
1 Notes on the Philadelphia Fed s Real-Time Data Set for Macroeconomists (RTDSM) Indexes of Aggregate Weekly Hours Last Updated: December 22, 2016 I. General Comments This file provides documentation for
18 May Primary Production Select Committee Parliament Buildings Wellington
 18 May 2017 Primary Production Select Committee Parliament Buildings Wellington select.committees@parliament.govt.nz PO Box 10232, The Terrace, Wellington 6143 Level 4, Co-operative Bank Building 20 Balance
Foodservice EUROPE. 10 countries analyzed: AUSTRIA BELGIUM FRANCE GERMANY ITALY NETHERLANDS PORTUGAL SPAIN SWITZERLAND UK
 Foodservice EUROPE MARKET INSIGHTS & CHALLENGES 2015 2016 2017 2020 Innovative European Foodservice Experts 18, avenue Marcel Anthonioz BP 28 01220 Divonne-les-Bains - France 10 countries analyzed: AUSTRIA
Economic Contributions of the Florida Citrus Industry in and for Reduced Production
 Economic Contributions of the Florida Citrus Industry in 2014-15 and for Reduced Production Report to the Florida Department of Citrus Alan W. Hodges, Ph.D., Extension Scientist, and Thomas H. Spreen,
Simplified Summer Feeding Program
 Simplified Summer Feeding Program 1 Meal Requirements Morning: Program Basics Afternoon: Program Details Review regulations on meal service Identify the rules around offer vs serve and practice identifying
THE ECONOMIC IMPACT OF THE WINE AND GRAPE INDUSTRY IN CANADA 2015
 THE ECONOMIC IMPACT OF THE WINE AND GRAPE INDUSTRY IN CANADA 2015 Canada s Wine Economy Ripe, Robust, Remarkable A Report with special assistance from Rob Eyler, President, Economic Forensics and Analytics
Trends. in retail. Issue 8 Winter The Evolution of on-demand Food and Beverage Delivery Options. Content
 Trends in retail Issue 8 Winter 2016 Content 1. The Evolution of On-Demand Food and Beverage Delivery Options Alberta Food and Beverage Sector Opportunities and Challenges 2. Data Highlights The Evolution
UPPER MIDWEST MARKETING AREA THE BUTTER MARKET AND BEYOND
 UPPER MIDWEST MARKETING AREA THE BUTTER MARKET 1987-2000 AND BEYOND STAFF PAPER 00-01 Prepared by: Henry H. Schaefer July 2000 Federal Milk Market Administrator s Office 4570 West 77th Street Suite 210
EXECUTIVE SUMMARY OVERALL, WE FOUND THAT:
 THE ECONOMIC IMPACT OF CRAFT BREWERIES IN LOS ANGELES LA s craft brewing industry generates short-term economic impacts through large capital investments, equipment purchases, and the construction of new
Q1 How frequently do you ride Kitsap Transit's fast-ferry service across the Puget Sound? Would you say...
 Q1 How frequently do you ride Kitsap Transit's fast-ferry service across the Puget Sound? Would you say... Answered: 800 Skipped: 0 Never Less than once a month Less than once a week 1 to 2 times a week
Attachment A. Core U.S. OJ & GJ Scanned Sales Data
 Attachment A Channels Core U.S. OJ & GJ Scanned Sales Data Food ($2M+ Grocery) Drug Convenience Mass Walmart Specialty Channel Larger U.S. Universe (please describe) Market / Account Level Product Categories
Iowa Department of Inspections and Appeals Food and Consumer Safety Bureau. 321 E. 12 th Street Des Moines, IA
 Iowa Department of Inspections and Appeals Food and Consumer Safety Bureau Lucas State Office Building 321 E. 12 th Street Des Moines, IA 50319-0083 Dear Applicant: Enclosed is an application for obtaining
More information from: https://www.wiseguyreports.com/reports/ global-online-food-delivery-and-takeaway-marketanalysis-by-order-type
 Report Information More information from: https://www.wiseguyreports.com/reports/1079744-global-online-food-delivery-and-takeaway-marketanalysis-by-order-type Global Online Food Delivery and Takeaway Market
Total cheese output (excluding cottage cheese) was 1.08 billion pounds, 2.8 percent above August 2017 but 0.7 percent below July 2018.
 was 1.08 billion pounds, 2.8 percent above August 2017 but 0.7 percent below July 2018.") Dairy Products ISSN: 949-0399 Released October 4,, by the National Agricultural Statistics Service (NASS), Agricultural Statistics Board, United States Department of Agriculture (USDA). Highlights Total
Dairy Products ISSN: 949-0399 Released October 4,, by the National Agricultural Statistics Service (NASS), Agricultural Statistics Board, United States Department of Agriculture (USDA). Highlights Total
Total cheese output (excluding cottage cheese) was 950 million pounds, 2.2 percent above April 2013 but 1.4 percent below March 2014.
 was 950 million pounds, 2.2 percent above April 2013 but 1.4 percent below March 2014.") Dairy Products ISSN: 1949-0399 Released June 4,, by the National Agricultural Statistics Service (NASS), Agricultural Statistics Board, United States Department of Agriculture (USDA). Highlights Total
Dairy Products ISSN: 1949-0399 Released June 4,, by the National Agricultural Statistics Service (NASS), Agricultural Statistics Board, United States Department of Agriculture (USDA). Highlights Total
Total cheese output (excluding cottage cheese) was 1.06 billion pounds, 3.1 percent above September 2017 but 2.0 percent below August 2018.
 was 1.06 billion pounds, 3.1 percent above September 2017 but 2.0 percent below August 2018.") Dairy Products ISSN: 949-0399 Released November,, by the National Agricultural Statistics Service (NASS), Agricultural Statistics Board, United States Department of Agriculture (USDA). Highlights Total
Dairy Products ISSN: 949-0399 Released November,, by the National Agricultural Statistics Service (NASS), Agricultural Statistics Board, United States Department of Agriculture (USDA). Highlights Total
Rural Vermont s Raw Milk Report to the Legislature
 Rural Vermont s Raw Milk Report to the Legislature March 2015 Art Credit: Phil Herbison Overview: Raw milk has been a part of Vermont s agricultural heritage for hundreds of years. It is recognized by
Virginia. Accommodation and Food Services Profile
 Virginia Accommodation and Food Services Profile May 2015 For additional information or explanation of the contents of this document, you may contact the Economic/Operations Research section at (804) 786-7497
HOUSE COMMITTEE ON APPROPRIATIONS FISCAL NOTE. HOUSE BILL NO. 466 PRINTERS NO. 521 PRIME SPONSOR: Turzai
 HOUSE COMMITTEE ON APPROPRIATIONS FISCAL NOTE HOUSE BILL NO. 466 PRINTERS NO. 521 PRIME SPONSOR: Turzai COST / (SAVINGS) FUND FY 2014/15 FY 2015/16 State Stores Fund $0 See fiscal impact State Stores Fund
City of Dubuque Health Services Food Establishment License Application (including Mobile Units)
") City of Dubuque Health Services Food Establishment License Application (including Mobile Units) This is an application for obtaining a food establishment license from the (Iowa Department of Inspections
City of Dubuque Health Services Food Establishment License Application (including Mobile Units) This is an application for obtaining a food establishment license from the (Iowa Department of Inspections
The Economic Contribution of the Colorado Wine Industry
 The Economic Contribution of the Colorado Wine Industry Doug Caskey, Exec. director CO Wine Industry Development Board Dawn Thilmany, PhD CSU Dept. of Ag and Resource Economics and CSU Extension Contributions
Access to Affordable and Nutritious Food: Measuring and Understanding Food Deserts and Their Consequences
 Access to Affordable and Nutritious Food: Measuring and Understanding Food Deserts and Their Consequences Shelly Ver Ploeg Economic Research Service, USDA Workshop on Farm and Food Policy and Obesity UC-Davis
Dairy Market. Overview. Commercial Use of Dairy Products. U.S. Dairy Trade
 Dairy Market Dairy Management Inc. R E P O R T Volume 21 No. 5 May 2018 DMI NMPF Overview Many of the key dairy market statistics reported for March and April indicated that milk prices for U.S. dairy
Alberta Foodservice Forecast
 C A N A D I A N R E S T A U R A N T A N D F O O D S E R V I C E S A S S O C I A T I O N Alberta Foodservice Forecast Alberta Foodservice Expo 2011 By Jill Holroyd Senior Vice President, Marketing & Communications
CHAPTER I BACKGROUND
 CHAPTER I BACKGROUND 1.1. Problem Definition Indonesia is one of the developing countries that already officially open its economy market into global. This could be seen as a challenge for Indonesian local
The University of Georgia
 The University of Georgia Center for Agribusiness and Economic Development College of Agricultural and Environmental Sciences A Survey of Pecan Sheller s Interest in Storage Technology Prepared by: Kent
The 2006 Economic Impact of Nebraska Wineries and Grape Growers
 A Bureau of Business Economic Impact Analysis From the University of Nebraska Lincoln The 2006 Economic Impact of Nebraska Wineries and Grape Growers Dr. Eric Thompson Seth Freudenburg Prepared for The
Total cheese output (excluding cottage cheese) was 1.12 billion pounds, 3.0 percent above October 2017 and 6.1 percent above September 2018.
 was 1.12 billion pounds, 3.0 percent above October 2017 and 6.1 percent above September 2018.") Dairy Products ISSN: 949-0399 Released December 4,, by the National Agricultural Statistics Service (NASS), Agricultural Statistics Board, United States Department of Agriculture (USDA). Highlights Total
Dairy Products ISSN: 949-0399 Released December 4,, by the National Agricultural Statistics Service (NASS), Agricultural Statistics Board, United States Department of Agriculture (USDA). Highlights Total
Total cheese output (excluding cottage cheese) was 1.10 billion pounds, 2.7 percent above March 2017 and 11.6 percent above February 2018.
 was 1.10 billion pounds, 2.7 percent above March 2017 and 11.6 percent above February 2018.") Dairy Products ISSN: 949-0399 Released May 3,, by the National Agricultural Statistics Service (NASS), Agricultural Statistics Board, United States Department of Agriculture (USDA). Highlights Total cheese
Dairy Products ISSN: 949-0399 Released May 3,, by the National Agricultural Statistics Service (NASS), Agricultural Statistics Board, United States Department of Agriculture (USDA). Highlights Total cheese
Total cheese output (excluding cottage cheese) was 1.09 billion pounds, 1.4 percent above May 2017 and 1.7 percent above April 2018.
 was 1.09 billion pounds, 1.4 percent above May 2017 and 1.7 percent above April 2018.") Dairy Products ISSN: 949-0399 Released July 5,, by the National Agricultural Statistics Service (NASS), Agricultural Statistics Board, United States Department of Agriculture (USDA). Highlights Total cheese
Dairy Products ISSN: 949-0399 Released July 5,, by the National Agricultural Statistics Service (NASS), Agricultural Statistics Board, United States Department of Agriculture (USDA). Highlights Total cheese
Buena Vista County Environmental Health Court house 215 E. 5 th PO Box 301 Storm Lake, Iowa Dear Applicant:
 Buena Vista County Environmental Health Court house 215 E. 5 th PO Box 301 Storm Lake, Iowa 50588 Dear Applicant: Enclosed is an application for obtaining a food establishment license from the Buena Vista
A Comparison of X, Y, and Boomer Generation Wine Consumers in California
 A Comparison of,, and Boomer Generation Wine Consumers in California Marianne McGarry Wolf, Scott Carpenter, and Eivis Qenani-Petrela This research shows that the wine market in the California is segmented
Sportzfun.com. Source: Joseph Pine and James Gilmore, The Experience Economy, Harvard Business School Press.
 National Extension Tourism Conference Park City, Utah Center for Agribusiness and Economic Development June 15 th, 2009 or Agribusin siness and Econ onomic Deve Center fo velopment What does Agritourism
How to Implement Summer Food Standards of Excellence in Your Community
 How to Implement Summer Food Standards of Excellence in Your Community As an anti-hunger advocate, you understand the clear link between the food served at summer food sites and participation rates. Simply
North America Ethyl Acetate Industry Outlook to Market Size, Company Share, Price Trends, Capacity Forecasts of All Active and Planned Plants
 North America Ethyl Acetate Industry Outlook to 2016 - Market Size, Company Share, Price Trends, Capacity Forecasts of All Active and Planned Plants Reference Code: GDCH0416RDB Publication Date: October
Characteristics of U.S. Veal Consumers
 Characteristics of U.S. Veal Consumers by Jason Henderson and Ken Foster Staff Paper -2 April 2 Dept. of Agricultural Economics Purdue University Purdue University is committed to the policy that all persons
Challenges in Fluid Milk Consumption. October 25, 2017
 Challenges in Fluid Milk Consumption October 25, 2017 Increased Competition At Store 1970 s Milk Soft Drinks Coffee Juice 1980 s Milk Soft Drinks Coffee Juice Bottled water RTD juice Teas 1990 s Milk Soft
2016 STATUS SUMMARY VINEYARDS AND WINERIES OF MINNESOTA
 IN PARTNERSHIP WITH THE NORTHERN GRAPES PROJECT, AN USDA SPECIALITY CROPS RESEARCH INITIATIVE PROGRAM, NIFA 2016 STATUS SUMMARY VINEYARDS AND WINERIES OF MINNESOTA Brigid Tuck and William Gartner INTRODUCTION
An update from the Competitiveness and Market Analysis Branch, Alberta Agriculture and Forestry.
 An update from the Competitiveness and Market Analysis Branch, Alberta Agriculture and Forestry. The articles in this series includes information on what consumers are buying and why they are buying it.
Paper Reference IT Principal Learning Information Technology. Level 3 Unit 2: Understanding Organisations
 Centre No. Candidate No. Surname Signature Paper Reference(s) IT302/01 Edexcel Principal Learning Information Technology Level 3 Unit 2: Understanding Organisations Wednesday 3 June 2009 Morning Time:
Cerro Gordo County Department of Public Health 22 N Georgia Ave Suite 300 Mason City IA (641)
") 22 N Georgia Ave Suite 300 Mason City IA 50401 (641) 421 9336 Dear Applicant: Enclosed is an application for obtaining a food establishment license from the Cerro Gordo County Department of Public Health.
22 N Georgia Ave Suite 300 Mason City IA 50401 (641) 421 9336 Dear Applicant: Enclosed is an application for obtaining a food establishment license from the Cerro Gordo County Department of Public Health.
Implement Summer Food Standards of Excellence in Your Community
 Implement Summer Food Standards of Excellence in Your Community As an anti-hunger advocate, you understand the clear link between the food served at summer food sites and participation rates. Simply put,
Local Food Action Plan Columbus City and Franklin County, Ohio Consumer Survey Summary. Overview
 Local Food Action Plan Columbus City and Franklin y, Ohio Consumer Survey Summary Overview An online survey was developed by the Local Food Action Plan Team, consisting of Columbus Public Health, Local
QUESTIONS FOR REFLECTION: VISUAL 4.1 WHY DID THE COLONISTS PROSPER BETWEEN 1585 AND 1763?
 VISUAL 4.1 WHY DID THE COLONISTS PROSPER BETWEEN 1585 AND 1763? Gold and silver had not been discovered in colonial America during this period, and there were no spices to trade. England held sway as a
Louisville Business First
 Louisville Business First Allison Stines astines@bizjournals.com List Catering Firms (2017) Date submitted: March 16, 2017 12:33AM Respondent Name: Emilie Heim Pfeiffer via Simple Submit Respondent Contact:
Fairtrade Policy 2018
 Fairtrade Policy 2018 What is Fairtrade? Fairtrade is about better prices, decent working conditions and fair terms of trade for farmers and workers. It s about supporting the development of thriving farming
Overview of Presentation
 The Changing Marketplace for California Crops: Focus on Fresh Fruits and Vegetables Dr. Roberta Cook Dept. of Agricultural and Resource Economics UC Davis March 2005 Overview of Presentation US food industry
New from Packaged Facts!
 New from Packaged Facts! FOODSERVICE MARKET INSIGHTS A fresh perspective on the foodservice marketplace Essential Insights on Consumer customerservice@packagedfacts.com (800) 298-5294 (240) 747-3095 (Intl.)
Report Brochure HISPANIC WINE DRINKERS IN THE US MARKET NOVEMBER REPORT PRICE: GBP 1000 EUR 1200 USD 1600 AUD 1700 or 2 Report Credits
 Report Brochure HISPANIC WINE DRINKERS IN THE US MARKET NOVEMBER 2013 REPORT PRICE: GBP 1000 EUR 1200 USD 1600 AUD 1700 or 2 Report Credits Wine Intelligence 2013 CONTENTS 1. Introduction 10 Key learnings
How Rest Area Commercialization Will Devastate the Economic Contributions of Interstate Businesses. Acknowledgements
 How Rest Area Commercialization Will Devastate the Economic Contributions of Interstate Businesses Acknowledgements The NATSO Foundation, a charitable 501(c)(3) organization, is the research and educational
Activity 10. Coffee Break. Introduction. Equipment Required. Collecting the Data
 . Activity 10 Coffee Break Economists often use math to analyze growth trends for a company. Based on past performance, a mathematical equation or formula can sometimes be developed to help make predictions
Total cheese output (excluding cottage cheese) was 1.07 billion pounds, 0.9 percent above April 2017 but 3.7 percent below March 2018.
 was 1.07 billion pounds, 0.9 percent above April 2017 but 3.7 percent below March 2018.") Dairy Products ISSN: 949-0399 Released June 4,, by the National Agricultural Statistics Service (NASS), Agricultural Statistics Board, United States Department of Agriculture (USDA). Highlights Total cheese
Dairy Products ISSN: 949-0399 Released June 4,, by the National Agricultural Statistics Service (NASS), Agricultural Statistics Board, United States Department of Agriculture (USDA). Highlights Total cheese
COMSTRAT 310 Semester-Long Project Part Three
 COMSTRAT 310 Semester-Long Project Part Three WEB METRICS & SEO SETUP INSTRUCTIONS Web Metrics Setup Integrating Google Analytics into your mock company website: Wix 1. Log in to your Wix account > select
Market Insight Factsheet. Haddock (2018 Update)
") Market Insight Factsheet Haddock (2018 Update) Market Overview: This factsheet provides a summary of the UK value chain for haddock. It is intended to inform stakeholders of the UK seafood industry about
Market Insight Factsheet Haddock (2018 Update) Market Overview: This factsheet provides a summary of the UK value chain for haddock. It is intended to inform stakeholders of the UK seafood industry about
UNDERSTANDING CHINA: THE PECAN EXPORT MARKET & TOTAL CONSUMPTION
 UNDERSTANDING CHINA: THE PECAN EXPORT MARKET & TOTAL CONSUMPTION INSHELL PECAN IMPORTS BY CHINA UNITED STATES SOUTH AFRICA MEXICO U.S. INSHELL AND PECAN KERNEL EXPORTS TO CHINA (MT) (12 Month Comparison:
Annika Stensson. Director Research Communications National Restaurant Association Washington, D.C. Restaurant.org/Research.
 Annika Stensson Director Research Communications National Restaurant Association Washington, D.C. @WeRRestaurants /RestaurantDotOrg /NationalRestaurantAssociation Restaurant.org/Research 1 Agenda Overview
For the purposes of this page, this distribution arrangement will be referred to as a wine boutique and wine includes wine coolers.
 Beer and Wine Tax Beer and wine taxes are included in the price you pay for: made by an Ontario manufacturer, microbrewer or brew pub that you buy from: Brewers Retail Inc. (i.e., The Beer Store) licensed
The Economic Impact of Wine and Grapes in Lodi 2009
 The Economic Impact of Wine and Grapes in Lodi 2009 Prepared for the Lodi District Grape Growers Association and the Lodi Winegrape Commission May 2009 A S T O N E B R I D G E R E S E A R C H R E P O R
Inside Gulf Cooperation Council 4 (GCC) Beef Trade
 Beef Trade") MARKET ACCESS SECRETARIAT Global Analysis Report Inside Gulf Cooperation Council 4 (GCC) Beef Trade September 2015 TRADE SUMMARY The Gulf Cooperation Council (GCC) states, Bahrain, Kuwait, Oman, Qatar,
MARKET ACCESS SECRETARIAT Global Analysis Report Inside Gulf Cooperation Council 4 (GCC) Beef Trade September 2015 TRADE SUMMARY The Gulf Cooperation Council (GCC) states, Bahrain, Kuwait, Oman, Qatar,
Welcome to Grubhub. Table of contents. You ve joined the nation s leading online and mobile food ordering platform. Set up your account...
 Training guide Welcome to Grubhub You ve joined the nation s leading online and mobile food ordering platform. We re here to help you, whether you need to set up orders on your tablet, change your delivery
Sales of Prepared Food by Food Service Providers
 Sales of Prepared Food by Food Service Providers TB-71 Issued May 13, 2013 Tax: Sales and Use Tax PREPARED FOOD In general, sales of food and food ingredients purchased for human consumption are exempt
Wine On-Premise UK 2016
 Wine On-Premise UK 2016 T H E M E N U Introduction... Page 5 The UK s Best On-Premise Distributors... Page 7 The UK s Most Listed Wine Brands... Page 17 The Big Picture... Page 26 The Style Mix... Page
INCOMPLETE APPLICATIONS WILL BE RETURNED WITHOUT REVIEW.
 Linn County Public Health 501 13 Street NW Cedar Rapids, IA 52405 Dear Applicant: Enclosed is an application for obtaining a food establishment license from the Linn County Public Health Department. Iowa
Informing Wineries Tourism Decisions: Studies of Tasting Room Visitors and Wine Tourism Collaboration
 Informing Wineries Tourism Decisions: Studies of Tasting Room Visitors and Wine Tourism Collaboration Dan McCole, Don Holecek and Anna Popp Department of Community Sustainability Michigan State University
Adelaide Plains Wine Region
 SA Winegrape Crush Survey Regional Summary Report 2017 Adelaide Plains Wine Region Adelaide Plains Vintage overview OVERVIEW OF VINTAGE STATISTICS A total of 3,496 tonnes of Adelaide Plains winegrapes
THE FOODSCAPE OF POST-PRIMARY SCHOOLS IN IRELAND.
 THE FOODSCAPE OF POST-PRIMARY SCHOOLS IN IRELAND. Callaghan, M., Molcho, M., Nic Gabhainn, S. & Kelly, C. Presented by: Mary Callaghan Health Promotion Research Centre NUI Galway Ireland mary.callaghan@nuigalway.ie
CHAPTER Committee Substitute for Committee Substitute for House Bill No. 315
 CHAPTER 98-408 Committee Substitute for Committee Substitute for House Bill No. 315 An act relating to tax on sales, use, and other transactions; amending s. 212.08, F.S.; revising the exemption for food
Assessment of Management Systems of Wineries in Armenia
 International Wine Conference "Global Trends and Best Practices in the Wine World: Implications and Recommendations for Armenia" November 24, 2017 Assessment of Management Systems of Wineries in Armenia