EU COP balance sheets 2014/2015 and forecasts 2015/16. AGRI C 4 22 September 2015
|
|
|
- Marsha Thompson
- 5 years ago
- Views:
Transcription


1 EU COP balance sheets 2014/2015 and forecasts 2015/16 AGRI C 4 22 September 2015
2 2014/2015 Marketing Year Cereals 2
3 EU TRADE 2014/2015 EU net exporter 1. + Common wheat export new record : 1. - Russian export tax and exports restrictions in UKR, 2. - extension of maximum level of humidity (13.5%) for Egyptian purchases, 2. + Barley Export new record (FR competitiveness on Chinese market) 3. + Maize Export new record (Access to the Chinese market) 1. + exchange rate 2. + low costs of freights
4 EU MS exporting common wheat (incl. flour and groats) BG 4% LT 5% PL 10% RO 12% 11% 33.3 mio t. +64% Source: EUROSTAT (COMEXT) DE 23% FR 35% (Thousand tons) PL 2% FR % DE % RO % PL % LT % BG % % LT 4% RO 6% DE 21% BG 3% 9% 20.4 mio t. FR 55% 4
5 EU common wheat (incl. flour and groats) export destinations Algeria 17% Algeria 21% 47% 33.3 mio t. Source: EUROSTAT (COMEXT) +64% Iran 7% Egypt 13% Morocco 8% Saudi Arabia 8% (Thousand tons) 49% Algeria % Egypt % Morocco % Saudi Arabia % Iran % % 20.4 mio t. Iran 6% Egypt 10% Morocco 10% Saudi Arabia 4% 5
6 EU MS exporting barley (incl. malt) BG 3% DK 5% UK 7% BE 9% 13% RO 13% 12.7 mio t. +80% Source: EUROSTAT (COMEXT) DE 16% FR 34% (Thousand tons) BG 2% UK 5% FR % DE % RO % BE % UK % DK % BG % % DK 7% 17% BE 15% 7.1 mio t. RO 8% FR 27% DE 19% 6
7 EU barley (incl. malt) export destinations 35% Jordan 3% Iran Libya 3% 4% 12.7 mio t. +80% Algeria 5% Source: EUROSTAT (COMEXT) Japan 6% China 24% Saudi Arabia 20% (Thousand tons) Algeria 4% Libya 1% Iran 1% Jordan 3% China % Saudi Arabia % Japan % Algeria % Libya % Iran % Jordan % % 56% China 3% 7.1 mio t. Saudi Arabia 28% Japan 4% 7
8 EU MS exporting maize (incl. processed products) 12% 17% FR 11% BG 13% 4.0 mio t. +78% RO 64% FR 23% 2.2 mio t. RO 48% BG 12% Source: EUROSTAT (COMEXT) (Thousand tons) RO % BG % FR % % 8
9 EU maize (incl. processed products) export destinations 35% Iran 5% Libya 5% Source: EUROSTAT (COMEXT) 4.0 mio t. +78% Israel 5% China 7% Turkey 18% Egypt 11% South Korea 14% (Thousand tons) Turkey % South Korea % Egypt % China Israel % Libya % Iran % % 53% Turkey 11% 2.2 mio t. Libya 5% Iran 2% South Korea 15% Egypt 11% Israel 3% 9 China 0%
10 EU MS importing common wheat (incl. flour and groats) EL 9% UK 14% 12% 2.9 mio t. -7% IT 35% EL 6% UK 15% 15% 3.1 mio t. IT 27% ES 30% ES 37% Source: EUROSTAT (COMEXT) (Thousand tons) IT % ES % UK % EL % % 10
11 EU common wheat (incl. flour and groats) import origins Moldova 4% Russia 3% 11% 21% Ukraine 24% United States 11% Canada 21% 2.9 mio t. -7% Ukraine 50% Moldova 1% Russia 13% 3.1 mio t. United States 22% Canada 19% Source: EUROSTAT (COMEXT) (Thousand tons) Ukraine % Canada % United States % Russia % Moldova % % 11
12 EU MS importing durum wheat (incl. flour) BE 13% ES 4% DE 4% 4% 2.8 mio t. +48% IT 75% ES 1% BE 12% DE 3% 4% ( ) 1.9 mio t. IT 80% Source: EUROSTAT (COMEXT) (Thousand tons) ( ) IT % BE % ES % DE % % 12
13 EU durum wheat (incl. flour) import origins Australia 3% 9% Mexico 4% United States 12% Canada 72% Australia 9% 14% Canada 2.8 mio t. ( ) Mexico 49% 10% 1.9 mio t. +48% United States 18% Source: EUROSTAT (COMEXT) (Thousand tons) ( ) Canada % United States % Mexico % Australia % % 13
14 EU MS importing maize (incl. Processed products) IE DE 3% 3% UK 6% PT 9% IT 10% 9% 9.3 mio t. +12% Source: EUROSTAT (COMEXT) NL 21% ES 39% (Thousand tons) IE 2% ES % NL % IT % PT % UK % DE % IE % % DE 3% UK 5% PT 16% 12% IT 10% 8.3 mio t. NL 14% ES 38% 14
15 EU maize (incl. Processed products) Import origins Brazil 6% United States 6% Canada 7% Argentina 6% 4% Serbia 11% 9.3 mio t. +12% Ukraine 60% United States 4% Canada 3% Argentina 5% Brazil 13% 15% 8.3 mio t. Ukraine 51% Source: EUROSTAT (COMEXT) (Thousand tons) Ukraine % Serbia % Canada % United States % Brazil % Argentina % % Serbia 9% 15
16 16
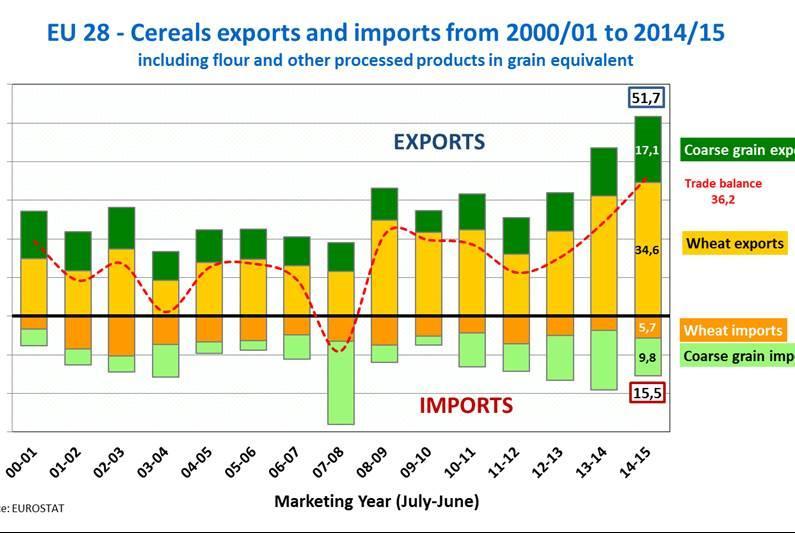
17 EU-28 Cereals balance sheet:marketing year: 2014/2015 Aug-15 Common (Mio t) wheat Barley Durum Maize Rye Sorghum Oats Triticale EUR 28 Beginning stocks ( ) 9,1 7,2 0,3 15,3 1,1 0,2 0,6 0,6 0,3 34,7 Usable production 148,8 60,2 7,6 77,8 8,7 0,8 7,7 13,0 4,5 329,1 Import 2,9 0,1 2,8 9,3 0,1 0,1 0,0 0,0 0,1 15,5 TOTAL AVAILABILITIES 160,8 67,5 10,7 102,4 9,9 1,1 8,3 13,6 5,0 379,3 USE - Human 48,0 0,4 8,1 5,0 3,0 0,2 1,1 0,1 0,0 65,7 - Seed 4,7 2,3 0,4 0,5 0,5 0,0 0,5 0,5 0,3 9,6 - Industrial 10,5 9,3 0,1 10,0 1,5 0,0 0,1 0,6 0,1 32,1 of which alcohol 12,6 o.w. bioethanol/biofuel 4,4 0,7 4,7 0,8 0,5 11,0 - Animal feed 52,4 35,9 0,1 60,0 3,5 0,6 4,9 11,3 3,3 172,0 TOTAL USE 115,5 47,8 8,7 75,4 8,5 0,8 6,6 12,4 3,7 279,5 Losses (excl on-farm) 0,9 0,4 0,1 0,6 0,1 0,0 0,1 0,1 0,0 2,2 Solde disponible 44,3 19,3 2,0 26,4 1,3 0,3 1,7 1,1 1,2 97,6 Export 33,3 12,7 1,2 4,0 0,2 0,0 0,2 0,0 0,0 51,7 Ending stocks ( ) 11,0 6,6 0,8 22,4 1,1 0,3 1,4 1,1 1,2 45,9 17
18 EU BALANCE SHEET 2014/2015 EU Production at record level (including soft wheat and maize) + Mainly yield effect + higher percentage of feed wheat Record EU trade for wheat, barley and maize + EU 1st world exporter of soft wheat and barley Strong recovery in stocks
19 2015/2016 Marketing Year Cereals 19
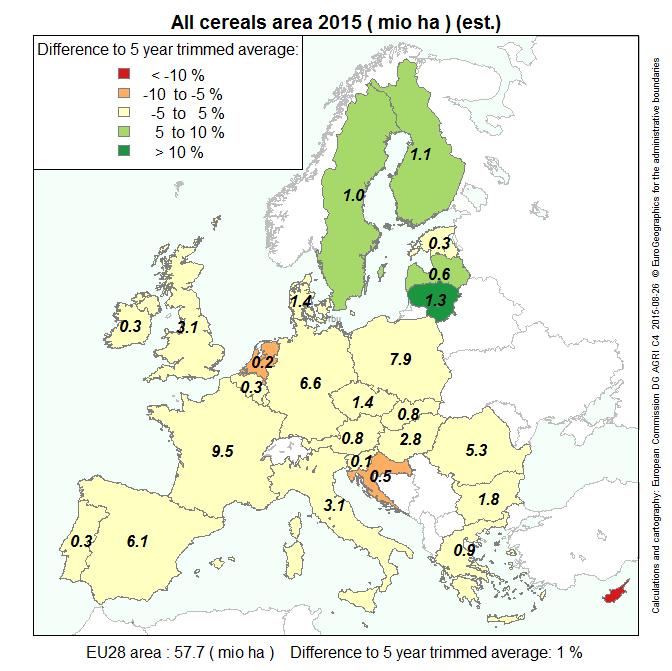
20 EU areas Forecasts EU EVOL CEREALS AREA % change Mio ha July fcst Aug fcst 2014/2015 TOTAL 57,9 58,2 57,9 57,7-0,8 Soft wheat 23,4 24,4 24,3 24,2-0,8 Durum wheat 2,4 2,3 2,4 2,4 4,5 Barley 12,7 12,4 12,4 12,4 0,0 Maize 9,8 9,7 9,4 9,4-3,3 Rye 2,6 2,1 2,2 2,2 6,1 Oats 2,6 2,5 2,5 2,5-2,1 Sources : DG AGRI - C4 20
21 21
22 22
23 EU Production Forecasts EU EVOL CEREALS USABLE PRODUCTIONS 2013/ / / /2016 %change Mio t July fcst Aug fcst 2014/2015 TOTAL 304,8 329,1 301,7 296,6-9,9 Soft wheat 135,1 148,8 139,4 140,7-5,4 Durum wheat 8,0 7,6 7,8 7,9 3,9 Barley 60,6 60,2 56,5 57,2-5,0 Maize 66,8 77,8 65,5 58,7-24,6 Rye 10,1 8,7 8,1 8,1-6,9 Oats 8,3 7,7 7,5 7,5-2,6 Sources : DG AGRI -C4 23
24 EU production Forecasts Most important producers (80% of EU production) total cereals prod changes 2014/2015 FR -3,9% DE -9,6% PL -11,8% IT -10,7% UK -7,7% ES -0,3% HU -21,3% RO -25,2% 24
25 EU production Forecasts 2015/2016 Marketing Year usable prod EC Stratégie CCR ADM Europe Mio t DG AGRI Grain Total Août Août Août Août Cereals 296,6 302,2 298,3 304,5 Soft Wheat 140,7 144,0 141,0 146,2 Durum Wheat 7,9 7,6 7,6 7,7 Barley 57,2 58,8 57,0 59,3 Maize 58,7 59,6 60,4 59,7 Rye 8,1 8,3 8,2 8,2 25
26 26
27 27
28 28
29 29
30 TRADE MEASURES - Russia : wheat export tax : 50 percent of the customs price minus roubles but not less than 50 roubles per tonne - Egypt : extension of maximum level of humidity (13.5%) for import of soft wheat (May 2016) - Iran : New duty on private traders imports of soft wheat - China : rumoured changes to China s maize price support - China : Import system of licence for barley Trade protocol agreement with UK
31 EU-28 Cereals balance sheet:marketing year: 2015/2016 août-15 Common (Mio t) wheat Barley Durum Maize Rye Sorghum Oats Triticale EUR 28 Beginning stocks ( ) 11,0 6,6 0,8 22,4 1,1 0,3 1,4 1,1 1,2 45,9 Usable production 140,7 57,2 7,9 58,7 8,1 0,6 7,5 11,5 4,3 296,6 Import 3,0 0,3 1,8 10,0 0,1 0,2 0,0 0,0 0,1 15,6 TOTAL AVAILABILITIES 154,7 64,1 10,5 91,2 9,3 1,2 9,0 12,5 5,6 358,1 USE - Human 48,0 0,4 8,1 5,0 3,0 0,2 1,2 0,1 0,3 66,1 - Seed 4,7 2,3 0,4 0,5 0,5 0,0 0,5 0,5 0,3 9,6 - Industrial 10,6 9,3 0,1 10,0 1,5 0,0 0,1 0,6 0,1 32,3 of which alcohol 12,8 o.w. bioethanol/biofuel 4,5 0,7 4,7 0,8 0,5 11,2 - Animal feed 52,0 36,6 0,1 61,3 3,4 0,7 4,8 11,0 3,2 173,1 TOTAL USE 115,3 48,5 8,7 76,8 8,4 0,9 6,5 12,1 4,0 281,1 Losses (excl on-farm) 0,9 0,4 0,1 0,6 0,1 0,0 0,1 0,1 0,0 2,2 Solde disponible 38,5 15,1 1,8 13,8 0,9 0,3 2,4 0,3 1,6 74,8 Export 27,9 9,0 1,2 3,0 0,2 0,0 0,2 0,0 0,0 41,5 Ending stocks ( ) 69,6 29,1 4,2 30,0 4,4 0,7 4,7 5,7 3,0 151,4 Ending stocks ( ) 10,6 6,1 0,6 10,8 0,7 0,3 2,2 0,3 1,6 33,3
32
33 EU BALANCE SHEET 2015/2016 Good level of harvest : higher percentage of milling wheat Lower feed grains Comfortable availabilities Slight increase in use for animal feed Decrease in stocks
34 Marketing year 2015/2016 Oilseeds and Protein Forecasts 34
35 EU areas Forecasts EU EVOL Oilseeds and Protein crops AREA % change Mio ha July fcst Aug fcst 2014/2015 Rapeseed 6,70 6,71 6,41 6,44-4,0 Sunflower 4,58 4,18 4,20 4,19 0,1 Soja 0,47 0,57 0,74 0,74 30,4 Linseed 0,07 0,08 0,08 0,08 0,0 TOTAL 11,82 11,54 11,43 11,45-0,8 Field peas 0,45 0,49 0,63 0,62 27,3 Broad beans 0,36 0,40 0,43 0,42 5,0 Sweet lupins 0,06 0,08 0,09 0,09 8,5 TOTAL 0,86 0,97 1,14 1,13 16,5 Sources : DG AGRI - C4 35
36 EU Production Forecasts EU EVOL Oilseeds and Protein crops Production % change Mio t July fcst Aug fcst 2014/2015 Rapeseed 20,90 24,28 20,73 20,81-14,3 Sunflower 9,06 9,07 8,19 7,70-15,2 Soja 1,07 1,85 2,02 1,97 6,3 Linseed 0,14 0,14 0,13 0,13-11,9 TOTAL 31,17 35,35 31,07 30,60-13,4 Field peas 1,23 1,28 1,62 1,58 23,3 Broad beans 1,02 1,29 1,26 1,20-6,4 Sweet lupins 0,13 0,13 0,14 0,14 8,5 TOTAL 2,38 2,70 3,02 2,92 8,5 Sources : DG AGRI - C4 36
37 Thank you for your attention! Balance sheet updates & market presentation available: lance-sheets/index_en.htm
EU Cereals Trade 2014/15 Marketing Year July - June. AGRI C 4 Committee for the Common Organisation of Agricultural Markets 27 August 2015
 EU Cereals Trade Marketing Year July - June AGRI C 4 Committee for the Common Organisation of Agricultural Markets 27 August 215 mio t 6 5 4 3 EU 28 - Cereals exports and imports from 2/1 to including
EU Cereals Trade 2017/18 Marketing Year July - March. AGRI G 4 Committee for the Common Organisation of Agricultural Markets 31 May 2018
 EU Cereals Trade 217/18 Marketing Year July - March AGRI G 4 Committee for the Common Organisation of Agricultural Markets 31 May 218 Content 1. EU trade data for total cereals 2. EU trade data for soft
Cereals, Oilseeds and Protein Crops. Market Situation. CROPS Market Observatory 12 th April 2018
 Cereals, Oilseeds and Protein Crops Market Situation CROPS Market Observatory 12 th April 2018 CONTENTS EU market situation Cereals Oilseeds Protein crops Cereals EU Soft Wheat Exports and Imports (July-December)
Oilseeds and Protein Crops market situation. Committee for the Common Organisation of Agricultural Markets. 27 September 2018
 Oilseeds and Protein Crops market situation Committee for the Common Organisation of Agricultural Markets 27 September 2018 1. World Oilseeds Contents 2. EU Oilseeds & Protein crops: areas & production
% of Reference Price 190% Jan Feb Mar Apr May Jun Jul Aug Sep Oct Nov Dec Beef & Veal Production (E28 Slaughtering) - Tonnes
 - Tonnes") Trade Prices Production Production & Stocks DG AGRI DASHBOARD: BEEF AND VEAL Last update: 23.11217 Carcasse Live Animals 2.2% 9.3% -6.3% -4.% -1.9% -6.2% 5.2% /1 kg Tonnes cw /head /kg 14.2% 1.1% -1.7%
Trade Prices Production Production & Stocks DG AGRI DASHBOARD: BEEF AND VEAL Last update: 23.11217 Carcasse Live Animals 2.2% 9.3% -6.3% -4.% -1.9% -6.2% 5.2% /1 kg Tonnes cw /head /kg 14.2% 1.1% -1.7%
Monitoring EU Agri-Food Trade: Development until December 2016
 Monitoring EU Agri-Food Trade: Development until December 2016 EU agri-food exports at highest annual level ever: EUR 130.7 billion The annual value of EU agri-food exports in 2016 reached a new record
Monitoring EU Agri-Food Trade: Development until October 2018
 Monitoring EU Agri-Food Trade: Development until October 2018 October 2018: best EU agri-food export performance ever The monthly value of EU agri-food trade in October 2018 was second biggest ever recorded
Monitoring EU Agri-Food Trade: Development until November 2016
 Monitoring EU Agri-Food Trade: Development until November 2016 November 2016 EU agri-food exports again at record level The monthly value of EU agri-food exports in November 2016 reached a new record level
Monitoring EU Agri-Food Trade: Development until March 2018
 Monitoring EU Agri-Food Trade: Development until March 2018 14.000 EU28: Export to Extra-EU of Agri-Food Products 13.000 12.000 11.000 10.000 2018 2017 2015 2016 2014 9.000 8.000 7.000 6.000 Jan Feb Mar
Monitoring EU Agri-Food Trade: Development until June 2017
 Monitoring EU Agri-Food Trade: Development until June 2017 June 2017: Agri-food exports again above previous years level After a rebound in May, the monthly value of EU agri-food exports went down to EUR
Monitoring EU Agri-Food Trade: Development until August 2018
 Monitoring EU Agri-Food Trade: Development until August 2018 August 2018: Export performance remains stable; imports from US continue to increase The value of EU agri-food trade in the month of August
Monitoring EU Agri-Food Trade: Development until October 2016
 Monitoring EU Agri-Food Trade: Development until October 2016 October 2016 EU agri-food exports stabilise at high level The monthly value of EU agri-food exports in October 2016 stabilised at EUR 11.4
Monitoring EU Agri-Food Trade: Development until January 2016
 Monitoring EU Agri-Food Trade: Development until January 2016 January 2015 - EU agri-food exports in line with seasonal trend EU agri-food exports in January 2016 were worth EUR 9.3 billion, thus just
Monitoring EU Agri-Food Trade: Development until August 2017
 Monitoring EU Agri-Food Trade: Development until August 2017 August 2017: Agri-food exports continue strong The monthly value of EU agri-food exports rose slightly to EUR 11.5 billion in August 2017, a
Monitoring EU Agri-Food Trade: Development until April 2017
 Monitoring EU Agri-Food Trade: Development until April 2017 April 2017: Agri-food exports back to average values The monthly value of EU agri-food exports in April 2017 reached a value of EUR 10.6 billion,
Monitoring EU Agri-Food Trade: Development until December 2015
 Monitoring EU Agri-Food Trade: Development until December 2015 December 2015 - EU agri-food exports again higher than in previous years EU agri-food exports in December 2015 achieved a value of EUR 11.2
Monitoring EU Agri-Food Trade: Development until September 2018
 Monitoring EU Agri-Food Trade: Development until September 2018 September 2018: Slowdown in EU export performance; imports from Brazil and US still on the rise The monthly value of EU agri-food trade in
Monitoring EU Agri-Food Trade: Development until January 2018
 Monitoring EU Agri-Food Trade: Development until January 2018 January 2018: good start of a year for EU agri-food exports The value of EU agri-food exports in January 2018 kept its very high level, now
DG AGRI DASHBOARD: WINE. EU Prices. Production. EU Trade. Consumption. Last update: Place of Consumption. Stocks Jan 2015.
 EU Prices EU Trade Production Consumption DG AGRI DASHBOARD: WINE 1980 2002-03 2003-04 2004-05 1985 2005-06 2006-07 1990 2007-08 2008-09 2009-10 1995 2010-11 2011-12 2000 2012-13 2013-14 2014-15 2005 2015-16
3.7.1 World exports and EU external trade in all products, agricultural products ( 1 ) and other products 10/01/2014 EU-27 (Mrd EUR)
 and other products 10/01/2014 EU-27 (Mrd EUR)") 3.7.1 World exports and EU external trade in all products, agricultural products ( 1 ) and other products 10/01/2014 EU-27 (Mrd EUR) 2007 2008 2009 2010 2011 2012 1 2 3 4 5 6 7 World exports ( 2 ) - All
3.7.1 World exports and EU external trade in all products, agricultural products ( 1 ) and other products 10/01/2014 EU-27 (Mrd EUR) 2007 2008 2009 2010 2011 2012 1 2 3 4 5 6 7 World exports ( 2 ) - All
Monitoring EU Agri-Food Trade: Development until March 2017
 Monitoring EU Agri-Food Trade: Development until March 2017 March 2017: record value in monthly agri-food exports at EUR 12.7 billion The monthly value of EU agri-food exports in March 2017 reached a value
Soybean Oil and Palm Oil Account For An Increasing Share of World Vegetable Oil Consumption
 United States Department of Agriculture Foreign Agricultural Service Circular Series FOP 01-03 January 2003 Soybean Oil and Palm Oil Account For An Increasing Share of World Vegetable Oil Consumption Percent
An overview of the European flour milling industry. Gary SHARKEY, European Flour Millers Vice-President
 An overview of the European flour milling industry Gary SHARKEY, European Flour Millers Vice-President 24 + 5 national member associations The European flour millers on their internal market A large variety
Fruit & vegetable preparations 2 558
 United States: Main Exported Agricultural products average 2008-2010 (million US 2 558 $) Bovine meat Oilcakes Pork meat Poultry meat Fruits - fresh or dried (excl. citrus) Tropical - fruits & spices Cotton
SEP'16: 162 MAR'17: 169 SEP'17: 176 Daily Volume. Euronext milling wheat futures 14/05 24/05 03/06 13/06 23/06 03/07 13/07
 Trade Weekly volume - thousand tonnes Total for MY - million tonnes Weekly volume - thousand tonnes Total f or MY - million tonnes Weekly volume - thousand tonnes Total f or MY - million tonnes TRQs Thousand
AGRITECH FIELD CROPS KEY INFO IN POINTS
 AGRITECH FIELD CROPS KEY INFO IN 10 POINTS 1 9.3 2 FRANCE: 3 DIVERSIFIED 4 FRANCE: MILLION HECTARES GIVEN OVER TO CEREAL PRODUCTION In 2017, 11.8 million hectares were used for field crops, representing
THE GLOBAL PULSE MARKETS: recent trends and outlook
 THE GLOBAL PULSE MARKETS: recent trends and outlook CICILS/IPTIC 2004 CONVENTION 10-12 12 June 2004 Beijing, China Boubaker BENBELHASSEN Commodities and Trade Division United Nations Food and Agriculture
Export prices FOB. Export prices FOB. $/t. Meals export prices - monthly average
 DG AGRI DASHBOARD: OILSEEDS -1% 1% % 3% -3% % -1% -1% -1% % -3% soyoil Argentina - Up River -7% sunoil Ukraine -5% canola oil EU (Rotterdam) -5% palm oil Indonesia % 4% Export prices FOB -1% % soymeal
Citrus: World Markets and Trade
 United States Department of Agriculture Foreign Agricultural Service Citrus: World Markets and Trade Oranges Global orange production for 2012/13 is forecast to drop over 4 percent from the previous year
SEP'16: 154 MAR'17: 163 SEP'17: 173 Daily Volume. Euronext milling wheat futures 07/05 17/05 27/05 06/06 16/06 26/06 06/07
 Trade Weekly volume - thousand tonnes Total for MY - million tonnes Weekly volume - thousand tonnes Total f or MY - million tonnes Weekly volume - thousand tonnes Total f or MY - million tonnes TRQs Thousand
Fresh Deciduous Fruit (Apples, Grapes, & Pears): World Markets and Trade
: World Markets and Trade") Fresh Deciduous Fruit (Apples, Grapes, & Pears): World Markets and Trade June 21 APPLES Record Production but Trade Estimate Revised Downward The world production estimate for 29/1 is virtually unchanged
Fresh Deciduous Fruit (Apples, Grapes, & Pears): World Markets and Trade June 21 APPLES Record Production but Trade Estimate Revised Downward The world production estimate for 29/1 is virtually unchanged
EU-28: Main imported Agricultural products (average in million Euro)
") EU-28: Main imported Agricultural products (average 2011-2013 - in million Euro) Oilcakes Soyabeans Cocoa Oilseeds, other than soyabeans Raw tobacco Cereals, other than wheat and rice Beet and cane sugar
EU-28: Main imported Agricultural products (average 2011-2013 - in million Euro) Oilcakes Soyabeans Cocoa Oilseeds, other than soyabeans Raw tobacco Cereals, other than wheat and rice Beet and cane sugar
North America Grains Outlook
 banchero costa North America Grains Outlook (covering wheat and coarse grains) September 2018 bancosta blue studies volume DRY 2018/#12 banchero costa research www.bancosta.com ; research@bancosta.com
Dairy sector: production and exports to Russia
 Dairy sector: production and exports to Russia Summary In 2013, the EU produced close to 153 million tonnes of milk, i.e. around 20% of the world production. Close to 40% of the production takes place
JUL'16: 172 DEC'16: 181 JUL'17: 185 Daily volume. Euronext milling wheat futures 09/04 19/04 29/04 09/05 19/05 29/05 08/06
 Trade Weekly volume - thousand tons Total f or MY - million tons Weekly volume - thousand tons Total f or MY - million tons Weekly volume - thousand tons Total f or MY - million tons TRQs Thousand tons
SEP'17: 171 MAR'18: 182 SEP'18: 183 Daily Volume. Euronext milling wheat futures 20/05 30/05 09/06 19/06 29/06 09/07 19/07
 Trade Weekly volume - thousand tonnes Total MY - million tonnes Weekly volume - thousand tonnes Total MY - million tonnes Weekly volume - thousand tonnes Total MY - million tonnes Million tonnes Production
Citrus: World Markets and Trade
 Department of Agriculture eign Agricultural Service January Citrus: World Markets and Trade Citrus: / ecast Global Orange Production and Trade Expand Global production and trade for is forecast at. million
SEP'17: 170 MAR'18: 177 SEP'18: 178 Daily Volume. Euronext milling wheat futures 04/03 14/03 24/03 03/04 13/04 23/04 03/05
 Trade Weekly volume - thousand tonnes Total MY - million tonnes Weekly volume - thousand tonnes Total MY - million tonnes Weekly volume - thousand tonnes Total MY - million tonnes Million tonnes Production
Agri-Food Exports. Alberta to 2014 Economics and Competitiveness. Highlights on Alberta Agri-Food Exports in Tables:
 Agri-Food Exports Alberta 2005 to 2014 Economics and Competitiveness Highlights on Alberta Agri-Food Exports in 2014 Tables: Alberta Agri-Food Exports, 2005-2014: - Top 5 Export Products and Markets -
Alberta Agri-Food Exports, 2008 to 2017 (1)
") Alberta Agri-Food Exports, 2008 to 2017 (1) Table of Content Tables Page 1 Alberta Agri-Food Exports, Top Products and Markets, 2008-2017, Value 1 2 Alberta Agri-Food Exports by Product, 2008-2017, Value
Alberta Agri-Food Exports, 2008 to 2017 (1) Table of Content Tables Page 1 Alberta Agri-Food Exports, Top Products and Markets, 2008-2017, Value 1 2 Alberta Agri-Food Exports by Product, 2008-2017, Value
EU Oilseeds trade 2011/12. AGRI C 5 Management Committee for the Common Organisation of Agricultural Markets 20 December 2012
 EU Oilseeds trade 2011/12 AGRI C 5 Management Committee for the Common Organisation of Agricultural Markets 20 December 2012 EU MS importing soybeans EU Soybeans imports by MS Campaign 2011-12: 11.9 mio
DEC'17: 163 MAY'18: 172 DEC'18: 177 Daily Volume. Euronext milling wheat futures 03/09 13/09 23/09 03/10 13/10 23/10 02/11
 Trade Weekly volume - thousand tonnes Total MY - million tonnes Weekly volume - thousand tonnes Total MY - million tonnes Weekly volume - thousand tonnes Total MY - million tonnes Million tonnes Production
RUSSIA & UKRAINE: COMPETITIVE ENVIRONMENT OF THE MARKET OF SUNFLOWER SEEDS & BY- PRODUCTS
 RUSSIA & UKRAINE: COMPETITIVE ENVIRONMENT OF THE MARKET OF SUNFLOWER SEEDS & BY- PRODUCTS Svitlana Synkovska Marketing Director APK-Inform Media Group HIGHLIGHTS OF THE PRESENTATION Global sunflower oil
China Importing Record Levels of Soybeans
 United States Department of Agriculture Foreign Agricultural Service Circular Series FOP 10-03 October 2003 China Importing Record Levels of Soybeans 25,000 20,000 1,000 MT 15,000 10,000 5,000 0 1997/98
MAR'17: 172 SEP'17: 174 MAR'18: 178 Daily Volume. Euronext milling wheat futures 24/12 03/01 13/01 23/01 02/02 12/02 22/02
 Trade Weekly volume - thousand tonnes Total MY - million tonnes Weekly volume - thousand tonnes Total MY - million tonnes Weekly volume - thousand tonnes Total MY - million tonnes Million tonnes Production
Soybean Exports Top 66 MMT in 2005/06
 United States Department of Agriculture Foreign Agricultural Service Circular Series FOP 6-05 June 2005 Soybean Exports Top 66 MMT in 2005/06 35 30 Major Exporters Major Importers 25 MMT 20 15 10 5 0 Argentina
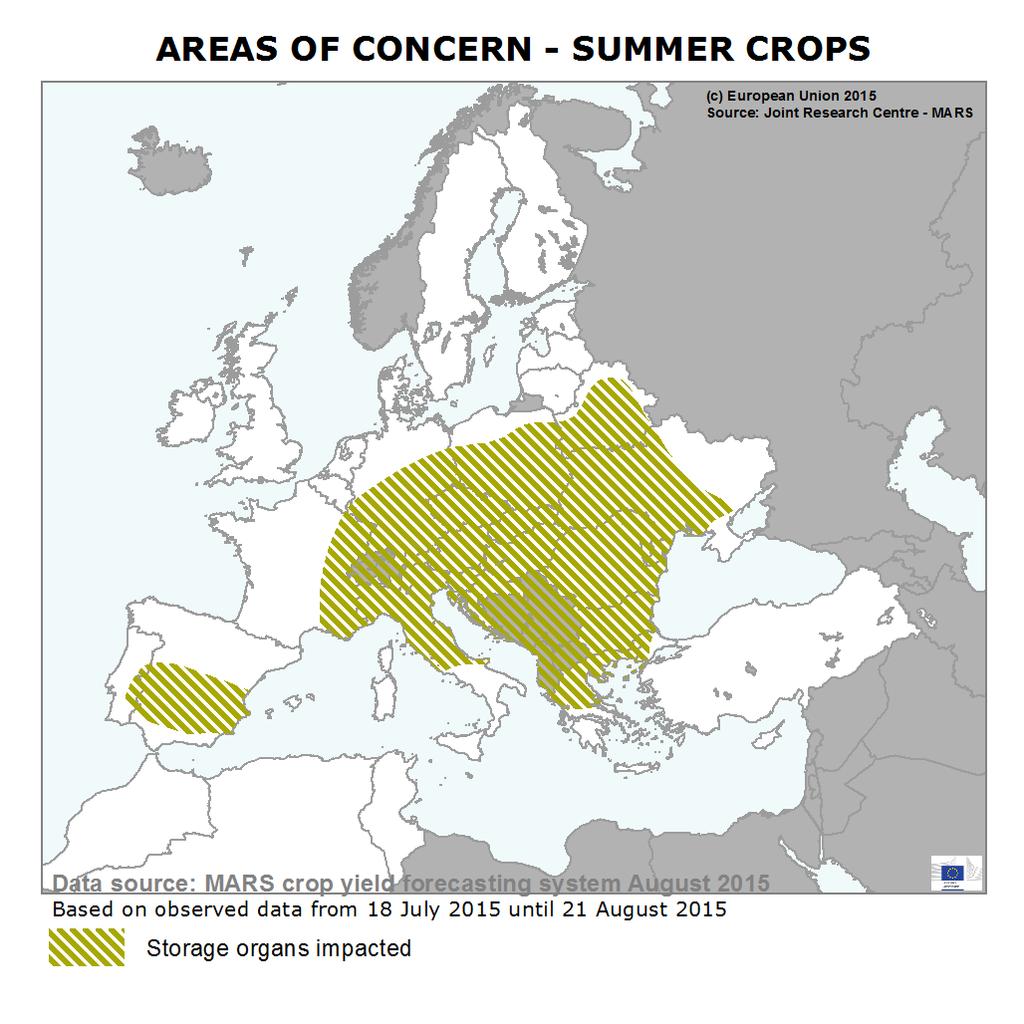
Weather conditions / sowings
 Trade Weekly volume - thousand tonnes Total MY - million tonnes Weekly volume - thousand tonnes Total MY - million tonnes Weekly volume - thousand tonnes Total MY - million tonnes Million tonnes Production
World Soybean Stocks Rise Sharply
 United States Department of Agriculture Foreign Agricultural Service Circular Series FOP 08-04 August 2004 World Soybean Stocks Rise Sharply Million Tons 50 40 World Stocks U.S. Stocks Brazil Stocks 50
Milk and Milk Products. Price and Trade Update: October
 October Milk and Milk Products Price and Trade Update Weekly Newsletter Milk and Milk Products Price and Trade Update: October 1 INTERNATIONAL PRICES: Weak import demand causes prices to fall International
MMT / / / / / /05* *Forecast. United States Department of Agriculture. Foreign Agricultural Service
 United States Department of Agriculture Foreign Agricultural Service Circular Series FOP 12-04 December 2004 Brazilian Soybean Exports Revised Higher in 2003/04, Gain in U.S. Dominated Markets Brazil s
China s Vegetable Oil Imports Forecast to Reach a Record in 2004/05
 United States Department of Agriculture Foreign Agricultural Service Circular Series FOP 09-04 September 2004 China s Vegetable Oil Imports Forecast to Reach a Record in 2004/05 Million Tons 8 8 7 Soy
General information on feed
 General information on feed 3. CRL workshop, Copenhagen 18./19. September 2008 Cereals and Feeding Stuff. Finn V. Povlsen, DLG Industrial compound feed production in EU27 per country 149.7 mill. ton in
South American Soybean Stocks (Argentina and Brazil) Expected to Increase in 2001/02 to Record Level Despite Record Exports
 Expected to Increase in 2001/02 to Record Level Despite Record Exports") United States Department of Agriculture Foreign Agricultural Service Circular Series FOP 02-02 February 2002 South American Soybean Stocks (Argentina and Brazil) Expected to Increase in 2001/02 to Record
United States Department of Agriculture Foreign Agricultural Service Circular Series FOP 02-02 February 2002 South American Soybean Stocks (Argentina and Brazil) Expected to Increase in 2001/02 to Record
Chinese Peanut Exports Hit Record High
 United States Department of Agriculture Foreign Agricultural Service Circular Series FOP 04-03 April 2003 Chinese Peanut Exports Hit Record High 600 500,000 MT 400 China US 300 Vietnam Argentina 200 India
U.S. Oilseeds and Products Imports Rise Significantly in FY 2004
 United States Department of Agriculture Foreign Agricultural Service Circular Series FOP 1-05 January 2005 U.S. Oilseeds and Products Imports Rise Significantly in FY 2004 2.5 2 Billion Dollars 1.5 1 0.5
South American Soybeans Continue to Gain World Market Share
 United States Department of Agriculture Foreign Agricultural Service Circular Series FOP 01-04 January 2004 South American Soybeans Continue to Gain World Market Share Percent 70 60 50 40 30 20 10 S. Amer
World Palm Oil Imports
 United States Department of Agriculture Foreign Agricultural Service Circular Series FOP 11-03 November 2003 World Palm Oil Imports 20,000 1,000 MT 15,000 10,000 5,000 0 1999/00 2000/01 2001/02 2002/03
Fresh Deciduous Fruit (Apples, Grapes, & Pears): World Markets and Trade
: World Markets and Trade") Million MT United States Department of Agriculture Foreign Agricultural Service December 21 Fresh Deciduous Fruit (Apples, Grapes, & Pears): World Markets and Trade 21/11 Forecast: World Apple Trade Declines;
Million MT United States Department of Agriculture Foreign Agricultural Service December 21 Fresh Deciduous Fruit (Apples, Grapes, & Pears): World Markets and Trade 21/11 Forecast: World Apple Trade Declines;
Fresh Deciduous Fruit (Apples, Grapes, & Pears): World Markets and Trade
: World Markets and Trade") United States Department of Agriculture Foreign Agricultural Service Fresh Deciduous Fruit (Apples, Grapes, & Pears): World Markets and Trade 9 1, MT Deciduous Fruit on Seasonal Cycles 6 Northern Hemisphere
United States Department of Agriculture Foreign Agricultural Service Fresh Deciduous Fruit (Apples, Grapes, & Pears): World Markets and Trade 9 1, MT Deciduous Fruit on Seasonal Cycles 6 Northern Hemisphere
Milk and Milk Products. Price and Trade Update. Weekly Newsletter. Milk and Milk Products. Price and Trade Update: April
 April Milk and Milk Products Price and Trade Update Weekly Newsletter Milk and Milk Products Price and Trade Update: April 1 PRICES: Remain depressed International dairy product prices began the year at
U.S. Imports of Soybeans, Meal, and Oil
 United States Department of Agriculture Foreign Agricultural Service Circular Series FOP 03-04 March 2004 U.S. Imports of Soybeans, Meal, and Oil 1,000 MT 450 400 350 300 250 200 150 100 50 0 '99/00 '00/01
WORLD PISTACHIO TRADE
 WORLD PISTACHIO TRADE 2017 Schramm, Williams & Associates, Inc. October 2017, First Edition Copyright 2008 through 2017 Schramm, Williams & Associates, Inc. Printed in the United States of America. All
Strong U.S. Soybean Exports to Date Should Lead to Marketing Year Record
 United States Department of Agriculture Foreign Agricultural Service Circular Series FOP 04-01 April 2001 Strong U.S. Soybean Exports to Date Should Lead to Marketing Year Record U.S. Soybean Exports to
Global Considerations
 What Does Being a Global Player Mean to the U.S. Dairy Sector? Global Considerations 2 1 A Decade of Change $8, 4,5 $7, 4, (Million $) $6, $5, $4, $3, $2, $1, 3,5 3, 2,5 2, 1,5 1, 5 (Million Lbs.) $ 23
Cereals and Oilseeds Review
 Catalogue no. 22-007-X Cereals and Oilseeds Review April 2012 How to obtain more information Specific inquiries about this product and related statistics or services should be directed to: Client Services,
Industry Advisory Panel Item 4c Trade of Stainless Steel Scrap
 Industry Advisory Panel Item 4c Trade of Stainless Steel Scrap Lisbon Tuesday 22 April 2008 Sven Tollin Chief Statistician 1 Stainless Steel Waste & Scrap Comparison calendar with Except Kazakhstan only
Our Business. Our Values. Transparency : Services : Integrity :
 Our Business The Straits International Pte Ltd, founded in 2010, is a Singapore based supply chain manager specializing in agricultural and protein commodities. We originate and buy physical products from
Finnish foreign trade 2015 Figures and diagrams FINNISH CUSTOMS Statistics 1
 Finnish foreign trade 215 Figures and diagrams 8.2.216 FINNISH CUSTOMS Statistics 1 IMPORTS, EXPORTS AND TRADE BALANCE 199-215 7 billion e 6 5 4 3 2 1-1 9 91 92 93 94 95 96 97 98 99 1 2 3 4 5 6 7 8 9 1
India: Soybean Oil Forecast to Gain Larger Share of Import Market in 2004/05
 United States Department of Agriculture Foreign Agricultural Service Circular Series FOP 3-5 March 25 India: Soybean Oil Forecast to Gain Larger Share of Import Market in 8 Percentage 6 4 2 2/1 21/2 22/3
WORLD OILSEEDS AND PRODUCTS
 WORLD OILSEEDS AND PRODUCTS 218 / World Oilseeds and Products: FAPRI 2004 Agricultural Outlook World Soybean and Soybean Products The world soybean price climbed strongly in 2003/04, driven by robust demand
AGRI-FOOD TRADE STATISTICAL FACTSHEET. European Union - Mediterranean Basin Countries (excluding EU)
") European Commission Directorate-General for Agriculture and Rural Development AGRI-FOOD TRADE STATISTICAL FACTSHEET European Union - Mediterranean Basin Countries (excluding EU) Notes to the reader: The
European Commission Directorate-General for Agriculture and Rural Development AGRI-FOOD TRADE STATISTICAL FACTSHEET European Union - Mediterranean Basin Countries (excluding EU) Notes to the reader: The
Market Implications for GM Crops
 Market Implications for GM Crops By Lloyd George www.farmhorizons.com Ph 03 9573 98 lloyd@farmhorizons.com Agriculture Australia 2003 Melbourne 12-14 August Farm Horizons Australian grain information service
World vitiviniculture situation
 World vitiviniculture situation Surface area Grape Wine Global grape production Table and dried grapes Production Consumption Trade 2017 OIV Focus: Vine varietal distribution in the world 2 Global area
Stocks Build as Soybean Supply Rises in 2004/05
 United States Department of Agriculture Foreign Agricultural Service Circular Series FOP 06-04 June 2004 Stocks Build as Soybean Supply Rises in 2004/05 Percent Change from 2003/04 14% 12% 10% 8% 6% 4%
Ukrainian Market for Fruits and Vegetables. Oksana Varodi International Finance Corporation Berlin, Fruit Logistica 2011
 Ukrainian Market for Fruits and Vegetables Oksana Varodi International Finance Corporation Berlin, Fruit Logistica 2011 Content of the Presentation Production Trade Current challenges and opportunities
Milk and Milk Products: Price and Trade Update
 Milk and Milk Products: Price and Trade Update June 217 * International dairy prices The FAO Dairy Price Index averaged 29 points in June, up 16 points (8.3 percent) from January 217 and 71 points (51.5
World Dairy Situation. IDF SC DPE, Paris April 11, 2013
 World Dairy Situation IDF SC DPE, Paris April 11, Current dairy situation Dairy production progressed in 2012 in supplying regions but is now stabilizing, even declining in some countries Export demand
What Does Being a Global Player Mean to the U.S. Dairy Sector?
 What Does Being a Global Player Mean to the U.S. Dairy Sector? Global Considerations Copyright of Daily Dairy Report, Inc. 2 A Decade of Change $8,000 4,500 $7,000 4,000 (Million $) $6,000 $5,000 $4,000
Outline. Long-term Outlook for Cotton Consumption. World End-Use Consumption of Textile Fibers. World Consumption of Textile Fibers
 World Cotton Supply and Use International Cotton Advisory Committee Secretariat Outline! Long-term Outlook for Consumption! Outlook for /! Developments in World Cotton Trade Fifth Open Session: Cotton
Comparison across international sources of the value of exports for top 25 countries, 1992 (US$ billion )
") Table 1 Comparison across international sources of the value of exports for top 25 countries, 1992 (US$ billion ) FAO WB IFS UN WB b.o.p. United States 448.2 448.0 448.2 444.2 440.4 Germany 429.7 422.0
Table 1 Comparison across international sources of the value of exports for top 25 countries, 1992 (US$ billion ) FAO WB IFS UN WB b.o.p. United States 448.2 448.0 448.2 444.2 440.4 Germany 429.7 422.0
Blow Molding Machine Produced by IAR Team Focus Technology Co., Ltd
 Blow Molding Machine 2012.08 Produced by IAR Team Focus Technology Co., Ltd Contents 1. 2009-2011 Chinese Blow Molding Machines Export Trend Analysis...3 2009-2011 Chinese Blow Molding Machines Export
AGRI-FOOD TRADE STATISTICAL FACTSHEET. European Union - OECD (excl EU incl US Virgin Isl)
") European Commission Directorate-General for Agriculture and Rural Development AGRI-FOOD TRADE STATISTICAL FACTSHEET European Union - OECD (excl EU incl US Virgin Isl) Notes to the reader: The data used
European Commission Directorate-General for Agriculture and Rural Development AGRI-FOOD TRADE STATISTICAL FACTSHEET European Union - OECD (excl EU incl US Virgin Isl) Notes to the reader: The data used
Oilseeds of the Middle East: Conventional and Promising Uses
 Oilseeds of the Middle East: Conventional and Promising Uses Ismail H. Hussein, Abdalbasit A. Mariod, Mohamed A. Abusinn and Salah A. Elhussein National Oilseed Processing Research Institute (NOPRI) University
Turkey... Growing Market for Vegoils & Fats
 Turkey... Growing Market for Vegoils & Fats Faik Genç AgriPro Limited Black Sea Grain, Kiev 13-14 April 2011 Main Topics 1. World Oils/Oilseeds& Sun Complex 2. Turkey 3. Turkish Oils & Oilseeds Balances
2018 World Vitiviniculture Situation. OIV Statistical Report on World Vitiviniculture
 2018 World Vitiviniculture Situation OIV Statistical Report on World Vitiviniculture Introduction This report has been prepared by the Statistics department of the International Organisation of Vine and
SINGAPORE. Summary Table: Import of Fresh fruits and Vegetables in Fresh fruit and Vegetables Market Value $000 Qty in Tons
 SINGAPORE A. MARKET FOR FRESH FRUIT AND VEGETABLES 1. Market Trend and Opportunities Summary Table: Import of Fresh fruits and Vegetables in Fresh fruit and Vegetables Market Products/ Other Info. Product
Bob Dickey. Bob Dickey. President, National Corn Growers Association Corn Grower from Laurel, Nebraska
 Bob Dickey Corn farmers in the United States are graded each year on how they respond to market demands, handle the pressure of weather extremes and improve their overall production practices. Their end
Effect of new markets on the supply-demand balance
 Effect of new markets on the supply-demand balance Presentation to ICO Seminar Robert Simmons, LMC International, Oxford, UK www.lmc.co.uk Global coffee consumption has grown at by over 2% per annum over
World vitiviniculture situation
 World vitiviniculture situation Surface area Grape Wine Global grape production Production Consumption Trade 2016 FAO-OIV Focus: Table and Dried Grapes 2 Global area under vines Area under vines in the
Overview of the Manganese Industry
 39th Annual Conference Istanbul, Turkey 2013 Overview of the Manganese Industry International Manganese Institute Alberto Saavedra Market Research Manager June, 2013 Introduction Global Production Supply,
ANALYSIS ON THE STRUCTURE OF HONEY PRODUCTION AND TRADE IN THE WORLD
 ANALYSIS ON THE STRUCTURE OF HONEY PRODUCTION AND TRADE IN THE WORLD GU G., ZHANG Ch., HU F.* Department of Sericulture and Apiculture, College of Animal Science Zhejiang University, Hangzhou 310029, CHINA
EU28: Main exported Agricultural products (average in million Euro)
") EU28: Main exported Agricultural products (average 2011-2013 - in million Euro) Agricultural products Spirits and liqueurs Wine and vermouth Wheat Pork meat (fresh, chilled or frozen), w/o preparations
EU28: Main exported Agricultural products (average 2011-2013 - in million Euro) Agricultural products Spirits and liqueurs Wine and vermouth Wheat Pork meat (fresh, chilled or frozen), w/o preparations
Monthly Economic Letter U.S. and Global Market Fundamentals
 Monthly Economic Letter U.S. and Global Market Fundamentals August 2012 www.cottoninc.com After trading within relatively narrow bands throughout July, New York futures moved higher in early August, with
Coffee: World Markets and Trade
 United States Department of Agriculture Foreign Agricultural Service June 2016 Coffee: World Markets and Trade 2016/17 Forecast Overview World coffee production for 2016/17 is forecast to rise 2.4 million
2017 Update: Potentially Affected Trade from World Agricultural Exporters with European Union Regulation of Endocrine Disruptors
 Prepared for the European Crop Protection Association 2017 Update: Potentially Affected Trade from World Agricultural Exporters with European Union Regulation of Endocrine Disruptors Part II, Country Data
AMERICAN PECAN COUNCIL. Pecan Industry Position Report. For the Crop Year Ended August 31, 2018
 Pecan Industry Position Report INTER-HANDLER TRANSFERS OF PECANS Total Inshell Pounds Transferred: Improved 109,898,013 Native/Seedling 14,813,988 Substandard 16,809,311 Total 141,521,312 YEAR-END INVENTORY
State of the Vitiviniculture World Market
 Punta del Este, November 19th, 2018 State of the Vitiviniculture World Market Jean-Marie Aurand Director General Topics Potential of viticultural production Production of grapes Production of wine Consumption
MARCOS S. JANK. JAPAN BRAZIL Bilateral Dynamics and Partnership in the Agri-Food Sector
 MARCOS S. JANK JAPAN BRAZIL Bilateral Dynamics and Partnership in the Agri-Food Sector JAPAN-BRAZIL BUSINESS COUNCIL Tokyo, Japan 24 th July 2018 Japan and Brazil Competitive Advantages in the Agri-Food
Commodity Profile of Edible Oil for July
 Commodity Profile of Edible Oil for July - 2018 As on 23.07.2018 Contents 1. Edible Oil estimates for India (marketing year- November 2017- October 2018)... 2 2. Production Trend of Domestic Oilseeds...
P E C A N R E P O R T
 P E C A N R E P O R T Agricultural Marketing Service 16 Forest Parkway Specialty Crops Programs Building 1-218 Market News Division Forest Park, Georgia 30297 Phone (404) 361-1376 FAX (404) 363-2523 Pecan