Supporting information Table S1. The native and invasive ranges of 10 study aquatic plant invaders
|
|
|
- Tracy Mitchell
- 5 years ago
- Views:
Transcription
1 Supporting information Table S1. The native and invasive ranges of 10 study aquatic plant invaders Name Family Native ranges Invasive ranges Alternanthera philoxeroides Amaranthaceae Argentina, Bolivia, Brazil, Paraguay, Peru, Venezuela Australia, China, France, Indonesia, Italy, New Zealand, United States Ceratophyllum demersum Ceratophyllaceae United Kingdom, United States Burkina Faso, China, Finland, New Zealand, Norway, Sweden Crassula helmsii Crassulaceae Australia Belgium, Denmark, France, Germany, Ireland, Netherlands, United Kingdom Elodea canadensis Hydrocharitaceae United States Australia, Austria, Denmark, Finland, France, Germany, Mexico, New Zealand, Norway, Poland, Portugal, Russia, South Africa, Spain, Sweden, Switzerland Hydrilla verticillata Hydrocharitaceae India, South Korea New Zealand, United States Ludwigia peruviana Onagraceae Argentina, Belize, Bolivia, Brazil, Colombia, Costa Rica, Cuba, Ecuador, El Salvador, Guatemala, Honduras, Jamaica, Mexico, Nicaragua, Panama, Paraguay, Peru, Venezuela Najas minor Hydrocharitaceae Austria, Belgium, France, Germany, India, Italy, Japan, Poland, Portugal, Russia, Ukraine Pistia stratiotes Araceae Argentina, Bolivia, Brazil, Colombia, Ecuador, Paraguay, Peru, Suriname, Venezuela, Australia, Dominican Republic, Indonesia, Puerto Rico, United States Canada, United States Australia, Burkina Faso, Papua New Guinea, Puerto Rico, United States Potamogeton crispus Potamogetonaceae Australia, Colombia Canada, New Zealand, United States Sagittaria platyphylla Alismataceae Mexico, Panama, United States Australia, Georgia, New Zealand
2 Table S2. Summary of bioclimatic variables that were used as bioclimatic layers of Maxent modeling Code Environmental variables Unit Bio1 Annual mean temperature C Bio2 Mean diurnal range C Bio4 Temperature seasonality SD*100 Bio8 Mean temperature of the wettest quarter C Bio12 Annual precipitation mm Bio14 Precipitation of the driest month mm Bio15 Precipitation seasonality CV* Bio18 Precipitation of the warmest quarter mm *CV represents coefficient of variation; SD represents standard deviation.
3 Table S3. The training omission rate for all 10 aquatic plant invaders. Species Alternanthera philoxeroides Ceratophyllum demersum Native Invasive Native Invasive Crassula helmsii Native Invasive Elodea canadensis Native Invasive Hydrilla verticillata Native Ludwigia peruviana Invasive Native Invasive Najas minor Native Invasive Pistia stratiotes Native Potamogeton crispus Sagittaria platyphylla Invasive Native Invasive Native Invasive Mean SD : Fixed cumulative value 1 training omission; 2: Fixed cumulative value 5 training omission; 3: Fixed cumulative value 10 training omission; 4: 10 percentile training presence training omission; 5: Equal training sensitivity and specificity training omission; 6: Maximum training sensitivity plus specificity training omission; 7: Balance training omission, predicted area and threshold value training omission; 8: Equate entropy of thresholded and original distributions training omission; SD represents standard deviation.
4 Table S4. Climatic niche overlap of all 10 aquatic plant invaders between native and invasive models across 12 freshwater biomes on the global scale. Species Alternanthera philoxeroides D I Ceratophyllum demersum D I Crassula helmsii D I Elodea canadensis D I Hydrilla verticillata D I Ludwigia peruviana D I Najas minor D I Pistia stratiotes D I Potamogeton crispus D I Sagittaria platyphylla D I D represents Schoener s D for APIs between native and invasive models on both native and invasive ranges; I represents the measure derived from Hellinger distance called I based on both the native and invasive ranges.
5 Table S5. Numerical data of climatic suitability for all 10 aquatic plant invaders in the native ranges based on freshwater biomes Species Alternanthera philoxeroides C Native C Invasive Ceratophyllum demersum C Native C Invasive Crassula helmsii C Native C Invasive Elodea canadensis C Native C Invasive Hydrilla verticillata C Native C Invasive Ludwigia peruviana C Native C Invasive Najas minor C Native C Invasive Pistia stratiotes C Native C Invasive Potamogeton crispus C Native C Invasive Sagittaria platyphylla C Native C Invasive : large lakes; 2: large river deltas; 3: montane freshwaters; 4: oceanic islands; 5: polar freshwaters; 6: temperate coastal rivers; 7: temperate floodplain rivers and wetlands; 8: temperate upland rivers; 9: tropical and subtropical coastal rivers; 10: tropical and subtropical floodplain rivers and wetland complexes; 11: tropical and subtropical upland rivers; 12: xeric freshwaters and endorheic (closed) basins. C Native and C Invasive represent the climatic suitability based on native and invasive models. Other codes were the same as Fig. 1.
6 Table S6. Numerical data of climatic suitability for all 10 aquatic plant invaders in the invasive ranges based on freshwater biomes Species Alternanthera philoxeroides C Native C Invasive Ceratophyllum demersum C Native C Invasive Crassula helmsii C Native C Invasive Elodea canadensis C Native C Invasive Hydrilla verticillata C Native C Invasive Ludwigia peruviana C Native C Invasive Najas minor C Native C Invasive Pistia stratiotes C Native C Invasive Potamogeton crispus C Native C Invasive Sagittaria platyphylla C Native C Invasive : large lakes; 2: large river deltas; 3: montane freshwaters; 4: oceanic islands; 5: polar freshwaters; 6: temperate coastal rivers; 7: temperate floodplain rivers and wetlands; 8: temperate upland rivers; 9: tropical and subtropical coastal rivers; 10: tropical and subtropical floodplain rivers and wetland complexes; 11: tropical and subtropical upland rivers; 12: xeric freshwaters and endorheic (closed) basins. C Native and C Invasive represent the climatic suitability based on native and invasive models. Other codes were the same as Fig. 1.

7
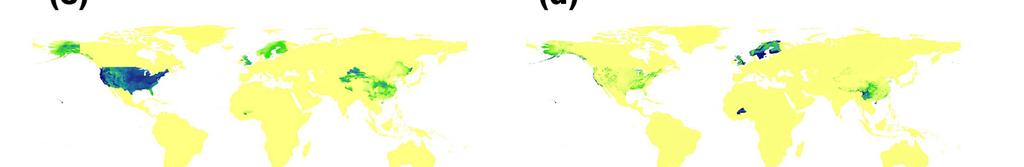
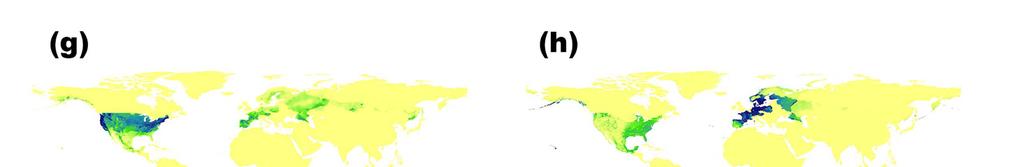
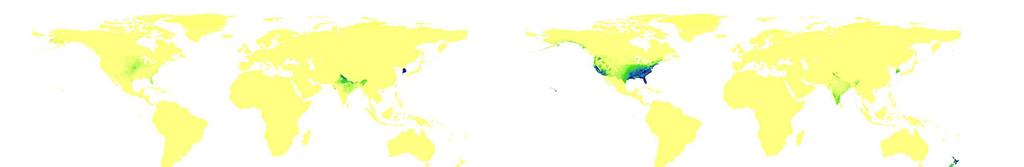
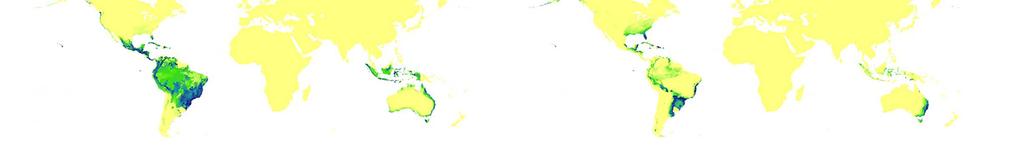
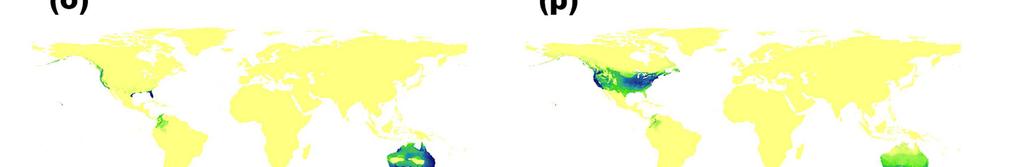
8 Fig. S1. The climatic suitability maps based on native and invasive models for Alternanthera philoxeroides (a, b); Ceratophyllum demersum (c, d); Crassula helmsii (e, f); Elodea Canadensis (g, h); Hydrilla verticillata (i, j); Ludwigia peruviana (k; l); Pistia stratiotes (m, n); Potamogeton crispus (o, p); Sagittaria platyphylla (q, r).
1. Registry situation
 Index Registry situation page 1 Production evolution page 2 Foreign market summary page 3 Foreign market 2014 page 4 Cava sales within the EU page 6 Cava sales in other foreign markets page 7 Evolution
LETTER FROM THE EXECUTIVE DIRECTOR
 E LETTER FROM THE EXECUTIVE DIRECTOR COFFEE MARKET REPORT August 2009 Although the monthly average of the ICO composite indicator price increased by 4% in August, from 112.90 US cents per lb in July to
The IWSR Global LOCAL KNOWLEDGE, GLOBAL INTELLIGENCE
 2008 The IWSR Global Wine Handbook LOCAL KNOWLEDGE, GLOBAL INTELLIGENCE 2008 The IWSR Disclaimer: While at all times The IWSR tries to ensure that the information presented in the database and reports
COMPARATIVE JUDGMENTS UNDER UNCERTAINTY 1. Supplemental Materials. Under Uncertainty. Oliver Schweickart and Norman R. Brown. University of Alberta
 COMPARATIVE JUDGMENTS UNDER UNCERTAINTY 1 Supplemental Materials Magnitude Comparison Extended: How Lack of Knowledge Informs Comparative Judgments Under Uncertainty Oliver Schweickart and Norman R. Brown
MONTHLY COFFEE MARKET REPORT
 E MONTHLY COFFEE MARKET REPORT November 2010 Coffee prices rose sharply during the month of November with the monthly average of the ICO composite indicator price reaching a level of 173.90 US cents per
MONTHLY COFFEE MARKET REPORT
 E MONTHLY COFFEE MARKET REPORT July 2011 Downward corrections to coffee prices recorded in June continued during July 2011, as the monthly average of the ICO composite indicator price fell to 210.36 US
LETTER FROM THE EXECUTIVE DIRECTOR
 E LETTER FROM THE EXECUTIVE DIRECTOR COFFEE MARKET REPORT January 2010 The upward trend in coffee prices recorded in December2009 continued during the first fortnight of 2010, with the monthly average
EU Oilseeds trade 2011/12. AGRI C 5 Management Committee for the Common Organisation of Agricultural Markets 20 December 2012
 EU Oilseeds trade 2011/12 AGRI C 5 Management Committee for the Common Organisation of Agricultural Markets 20 December 2012 EU MS importing soybeans EU Soybeans imports by MS Campaign 2011-12: 11.9 mio
MONTHLY COFFEE MARKET REPORT
 E MONTHLY COFFEE MARKET REPORT August 2012 Coffee prices experienced negative corrections across the board in August 2012, with the ICO composite indicator falling by 6.6% compared to July. This continues
LETTER FROM THE EXECUTIVE DIRECTOR
 E LETTER FROM THE EXECUTIVE DIRECTOR COFFEE MARKET REPORT December 2008 Price levels in December confirmed the downward trend recorded in the coffee market since September 2008. The monthly average of
MONTHLY COFFEE MARKET REPORT
 E MONTHLY COFFEE MARKET REPORT December 2011 In December 2011 Arabica prices underwent significant downward corrections while Robusta prices increased slightly. The average of the 2 nd and 3 rd positions
USDA Dairy Import License Circular for 2019
 USDA Dairy Import License Circular for 2019 Commodity/Note Country Name TRQ Jan Feb Grand Total NonCheese 21,864,781 322,073 1,438,863 1,760,936 BUTTER (Note 6, G) 6,977,000 158,425 1,055,472 1,213,897
World Beer Cup Overview
 Date and location 2012 World Beer Cup judging took place May 1-2, 2012 at the Town and Country Resort in San Diego, California. Awards were presented May 5, 2012 at the Town and Country Resort in San Diego,
SHIPPING COSTS. countries
 SHIPPING COSTS countries s 10+ 0+4 Aland Islands [1] USD - - - - - - - - 5.00 American Samoa USD 31.00 4.00 60.00 78.00 - - 13.00-18.00 Anguilla USD 3.00 78.00 78.00 91.00 - - 3.00-5.00 Antigua And Barbuda
Assessed contributions payable by Member States and Associate Members
 s Assessed s payable by Member States and Associate Members - -, Afghanistan 0.0060 64,610 (7,200) 57,400 28,700 28,700 28,700 28,700 Albania 0.0080 86,150 (9,600) 76,540 38,270 38,270 38,270 38,270 Algeria
LETTER FROM THE EXECUTIVE DIRECTOR
 E LETTER FROM THE EXECUTIVE DIRECTOR COFFEE MARKET REPORT April 2010 Prices of Colombian Milds and Brazilian Naturals were slightly down in April compared to their levels in March while prices of Other
Coffee: World Markets and Trade
 United States Department of Agriculture Foreign Agricultural Service Circular Series December 213 Coffee: World Markets and Trade 4 in Producing Countries to Continue Rising Million 6 Kilogram Bags 3 2
MONTHLY COFFEE MARKET REPORT
 E MONTHLY COFFEE MARKET REPORT January 2012 Prices of the three Arabica groups remained relatively firm in January, while those of Robustas fell slightly. The monthly average of the ICO composite indicator
GLOBAL DISTRIBUTION OF AGRICULTURAL LAND Agricultural land (thousands of ha)
") Asia-Pacific GLOBAL DISTRIBUTION OF AGRICULTURAL LAND of as all Average size of ( 1,990,228 447,614 420,348 93.9% 689,737 34.7% 1.6 China 521,775 200,555 200,160 99.8% 370,000 70.9% 1.8 India 179,759 138,348
Asia-Pacific GLOBAL DISTRIBUTION OF AGRICULTURAL LAND of as all Average size of ( 1,990,228 447,614 420,348 93.9% 689,737 34.7% 1.6 China 521,775 200,555 200,160 99.8% 370,000 70.9% 1.8 India 179,759 138,348
MONTHLY COFFEE MARKET REPORT
 E MONTHLY COFFEE MARKET REPORT June 2012 In June 2012 coffee prices, particularly those of Arabicas, continued the fall recorded in recent months. The drop in Robusta prices was less marked than in the
Comparison across international sources of the value of exports for top 25 countries, 1992 (US$ billion )
") Table 1 Comparison across international sources of the value of exports for top 25 countries, 1992 (US$ billion ) FAO WB IFS UN WB b.o.p. United States 448.2 448.0 448.2 444.2 440.4 Germany 429.7 422.0
Table 1 Comparison across international sources of the value of exports for top 25 countries, 1992 (US$ billion ) FAO WB IFS UN WB b.o.p. United States 448.2 448.0 448.2 444.2 440.4 Germany 429.7 422.0
Revised World Coffee Production Forecast Remains on Track for Record 140
 United States Department of Agriculture Foreign Agricultural Service Circular Series FTROP 4-8 December 28 Revised World Coffee Forecast Remains on Track for Record 14 12 Million 6 kilo bags 1 8 6 4 2
Coffee: World Markets and Trade
 United States Department of Agriculture Foreign Agricultural Service June 2016 Coffee: World Markets and Trade 2016/17 Forecast Overview World coffee production for 2016/17 is forecast to rise 2.4 million
World Cocoa and CBE markets. Presentation to Global Shea 2014 By Owen Wagner, LMC International, Raleigh, NC
 World Cocoa and CBE markets Presentation to Global Shea 214 By Owen Wagner, LMC International, Raleigh, NC www.lmc.co.uk Outline Background to the chocolate and CBE markets Chocolate and CBE demand trends
YUM! Brands Inc. Restaurant Units Activity Summary December 31, 2011 Total
 Total Unconsolidated Excluding Company Affiliates Franchisees Licensees (a) Total Worldwide Beginning of Year 7,271 525 27,852 35,648 New Builds 749 73 1,058 1,880 Acquisitions 137 - (137) - Refranchising
Maximum Residue Levels (MRLs) for pesticides: Members are also requested to send the Executive Director:
 for pesticides: Members are also requested to send the Executive Director:") ED 2087/10 8 April 2010 Original: English E Information requested from Members by 1 June 2010: Costs of production 2000/01 to 2009/10 Employment generated by the coffee sector MRLs for pesticides Mixtures
ED 2087/10 8 April 2010 Original: English E Information requested from Members by 1 June 2010: Costs of production 2000/01 to 2009/10 Employment generated by the coffee sector MRLs for pesticides Mixtures
Outlook for the World Coffee Market
 Outlook for the World Coffee Market International Coffee Council 26-3 September 211 London, England José Sette Executive Director a.i. ICO composite indicator price Daily: 1 October 29 to 26 September
Coffee: World Markets and Trade
 United States Department of Agriculture Foreign Agricultural Service June 2017 Coffee: World Markets and Trade 2017/18 Forecast Overview World coffee production for 2017/18 is forecast at 159 million bags
2018 World Vitiviniculture Situation. OIV Statistical Report on World Vitiviniculture
 2018 World Vitiviniculture Situation OIV Statistical Report on World Vitiviniculture Introduction This report has been prepared by the Statistics department of the International Organisation of Vine and
W or ld Cocoa and CBE mar kets. Presentation to Global Shea 2013 By Richard Truscott, LMC International, Oxford, UK
 W or ld Cocoa and CBE mar kets Presentation to Global Shea 2013 By Richard Truscott, LMC International, Oxford, UK www.lmc.co.uk Outline The use of CBEs Chocolate and CBE demand trends Cocoa production
School milk programmes: A joint FAO/IDF global review. Dr Judith Bryans
 School milk programmes: A joint FAO/IDF global review Dr Judith Bryans School Milk With thanks to J Milk With thanks to J Milk School Milk Global Review: A bit of history Michael Griffin School Milk Unit
World Yoghurt Market Report
 World Yoghurt Market Report 2000-2020 Price: 1,800 /$2,200 The report contains 330 pages of valuable information Analysis of the current market situation and future possibilities in all regions of the
ICC April 2006 Original: French. Study. International Coffee Council Ninety-fifth Session May 2006 London, England
 ICC 95-3 International Coffee Organization Organización Internacional del Café Organização Internacional do Café Organisation Internationale du Café 19 April 2006 Original: French Study E International
PHILIPPINES. 1. Market Trends: Import Items Change in % Major Sources in %
 PHILIPPINES A. MARKET OF FRESH FRUITS & VEGETABLES 1. Market Trends: Import Items 2003 2007 Change in % Major Sources in % Value Quantity Value Quantity Value Quantity USD '000 Tons USD '000 Tons Grapes
LETTER FROM THE EXECUTIVE DIRECTOR COFFEE MARKET REPORT. November 2004
 International Coffee Organization Organización Internacional del Café Organização Internacional do Café Organisation Internationale du Café E LETTER FROM THE EXECUTIVE DIRECTOR COFFEE MARKET REPORT November
DESSERT INSPIRATION FACTS AND FIGURES GLOBAL PRODUCT TRENDS VIOGERM WHEAT GERMS OUR PROPOSALS
 DESSERT INSPIRATION DESSERT INSPIRATION FACTS AND FIGURES GLOBAL PRODUCT TRENDS VIOGERM WHEAT GERMS OUR PROPOSALS 2 FACTS & FIGURES Market value for the top 10 countries in 2012 in millions of euros Total:
PEACEKEEPING ASSESSMENTS. From: To: Mandate: 1-Jul Dec-2018 Rates: 1-Jan Dec-2018
 Mission: From: To: Mandate: 1-Jul-2018 31-Dec-2018 Rates: 1-Jan-2018 31-Dec-2018 PEACEKEEPING ASSESSMENTS UN Document ID: ST/ADM/SER.B/983 Legislative Basis GA: General Assembly resolution 72/293 of 5
AMERICAN PECAN COUNCIL. Shipments and Inventory on Hand. For the One Month and Five Months Ended January 31, 2019
 Shipments and Inventory on Hand One Month Five Months Shipments: Shelled Meats Retail/Grocery/Export 11,247,569 65,205,488 Inter-handler Transfers Shipped 28,470 3,650,972 Inter-handler Transfers Received
Are we loosing the young generation? Amund Bråthen Senior Advisor Estoril February 7 th 2019
 Are we loosing the young generation? Amund Bråthen Senior Advisor Estoril February 7 th 2019 A MAJOR PART OF WPP, THE WORLD S LARGEST MARKETING COMMUNICATIONS GROUP ADVERTISING & MEDIA HEALTHCARE PR &
YUM! Brands Inc. Restaurant Units Activity Summary June 16, 2012 Total
 Unconsolidated Company Affiliates Franchisees Licensees (a) Worldwide Beginning of Year 7,437 587 26,928 34,952 New Builds 352 28 359 739 Acquisitions 200-275 475 Refranchising (200) - 200 - Closures (56)
2015 FINANCIAL DETAILS
 2015 FINANCIAL DETAILS index Page 1/Registry situation 03 2/Expeditions 05 3/Cava in world 06 4/Foreign Market 09 5/Cava in the EU 12 6/Cava in other foreign countries 13 7/Domestic market 14 8/Sales by
Alberta Agri-Food Exports, 2008 to 2017 (1)
") Alberta Agri-Food Exports, 2008 to 2017 (1) Table of Content Tables Page 1 Alberta Agri-Food Exports, Top Products and Markets, 2008-2017, Value 1 2 Alberta Agri-Food Exports by Product, 2008-2017, Value
Alberta Agri-Food Exports, 2008 to 2017 (1) Table of Content Tables Page 1 Alberta Agri-Food Exports, Top Products and Markets, 2008-2017, Value 1 2 Alberta Agri-Food Exports by Product, 2008-2017, Value
KEEGAN & COPPIN COMPANY, INC.
 Keegan & Coppin REAL ESTATE O N C O R I N T E R N AT I O N A L Commercial Real Estate Services Picturesque 78± Acres w/ Vineyard, House & Ponds 12800 Tomki Road 28± Acres Planted: 16.6± Acres of Zinfandel
Joint Working Group Webinar Series
 Joint Working Group Webinar Series August 2018: Infrastructure Working Group Wednesday, 8 August 2018 11:00am 12:00pm ET Introduction to Systems Engineering in the Dutch non-residential building sector
Fresh Deciduous Fruit (Apples, Grapes, & Pears): World Markets and Trade
: World Markets and Trade") Fresh Deciduous Fruit (Apples, Grapes, & Pears): World Markets and Trade June 21 APPLES Record Production but Trade Estimate Revised Downward The world production estimate for 29/1 is virtually unchanged
Fresh Deciduous Fruit (Apples, Grapes, & Pears): World Markets and Trade June 21 APPLES Record Production but Trade Estimate Revised Downward The world production estimate for 29/1 is virtually unchanged
MONTHLY COFFEE MARKET REPORT
 E MONTHLY COFFEE MARKET REPORT July 2012 Coffee prices rebounded in July 2012, with the ICO composite indicator increasing by 9.5% compared to June, following nine consecutive months of price falls. The
Wine Intelligence Compass
 Wine Intelligence Compass 2015-16 Strategic planning tool to understand the global wine market attractiveness VI International Wine Marketing Seminar Fondazione Edmund Mach San Michele all Adige November
Beer Market Insights 2014 Italy In-depth Analysis of Key Brewers, Brands, Volume, Value and Segmentation Trends and Opportunities in the Beer Market
 Beer Market Insights 2014 Italy In-depth Analysis of Key Brewers, Brands, Volume, Value and Segmentation Trends and Opportunities in the Beer Market www.canadean.com Summary The Italy Beer Market Insights
AMERICAN PECAN COUNCIL. Shipments and Inventory on Hand. For the One Month Ended November 30, 2018
 Shipments and Inventory on Hand Shipments: Total Shelled Meats 15,791,127 Inshell 3,035,663 Total Shipments (Inshell Basis) 34,617,917 Total Pecans in Inventory: Shelled Meats 43,994,659 Inshell 48,911,798
Where boutique wine producers and wine importers connect
 Wine Pleasures Workshops Where boutique wine producers and wine importers connect Marketing & Sponsorship Opportunities Buyer meets Celler in ITALY Buyer meets Celler in SPAIN 2 24-26 October 2016 6-8
WINE EXPORTS. February Nadine Uren. tel:
 WINE EXPORTS February 2012 Nadine Uren tel: +27 21 807 5707 e-mail: nadine@sawis.co.za OVERVIEW OF WINE EXPORTS HIGHLIGHTS Exports as a percentage of wine production decreased from 48.5% in 2010 to 43.2%
Major California Agricultural Exports to the Top Destinations in 1999* (1) Canada Rank Approximate Export Value (millions)
 Canada Rank Approximate Export Value (millions)") (1) Canada Rank Approximate Export Value (millions) Table Grapes 1 119 Tomatoes, Processed 2 115 Lettuce 3 102 Wine 4 84 Strawberries 5 78 Carrots 6 50 Tomatoes, Fresh 7 43 Peaches/Nectarines 8 42 Broccoli
(1) Canada Rank Approximate Export Value (millions) Table Grapes 1 119 Tomatoes, Processed 2 115 Lettuce 3 102 Wine 4 84 Strawberries 5 78 Carrots 6 50 Tomatoes, Fresh 7 43 Peaches/Nectarines 8 42 Broccoli
Canadian Grain Exports
 Canadian Grain Exports Crop year 2005 2006 www.grainscanada.gc.ca Canadian Grain Exports Crop year 2005 2006 Table of Contents Tables 1. grain and wheat flour exports...3 2. Major importers of Canadian
@WineIntell Wine Intelligence
 @WineIntell Wine Intelligence 2015 1 About Wine Intelligence Decision-making based on evidence Last year we spoke with more than 80,000 wine consumers in more than 27 wine markets We conducted quantitative
Where has globalisation occurred?
 Student activities: Which countries produce coffee? 1. Use Table 1 to locate and mark onto a blank political map of the world, the coffee producing countries. 2. Draw proportional flow lines to show the
Sugar: World Markets and Trade
 United States Department of Agriculture Foreign Agricultural Service November 2017 Sugar: World Markets and Trade Record Global Production Spurs Record Consumption Million Metric Tons, Raw Value 190 185
Competitive Trade Analysis Mexico
 MARKET ACCESS SECRETARIAT Global Analysis Report Competitive Trade Analysis Mexico September 2015 REPORT CONTENT SUMMARY This report looks to highlight the major sectors in Mexico, and attempts to identify
United States Is World Leader in Tree Nut Production and Trade
 Special Article United States Is World Leader in Tree Nut and Trade by Doyle C. Johnson Abstract: Crops of all major U.S. tree nuts will be larger in 997. However, beginning stocks of most tree nuts are
Effect of new markets on the supply-demand balance
 Effect of new markets on the supply-demand balance Presentation to ICO Seminar Robert Simmons, LMC International, Oxford, UK www.lmc.co.uk Global coffee consumption has grown at by over 2% per annum over
World vitiviniculture situation
 World vitiviniculture situation Surface area Grape Wine Global grape production Table and dried grapes Production Consumption Trade 2017 OIV Focus: Vine varietal distribution in the world 2 Global area
Strong U.S. Soybean Exports to Date Should Lead to Marketing Year Record
 United States Department of Agriculture Foreign Agricultural Service Circular Series FOP 04-01 April 2001 Strong U.S. Soybean Exports to Date Should Lead to Marketing Year Record U.S. Soybean Exports to
Coffee Market Outlook
 Coffee Market Outlook 15 th Asia International Coffee Conference Ho Chi Minh City, Vietnam 7-9 December 2009 Néstor Osorio Executive Director ICO composite indicator price Monthly: January 2000 to November
COFFEE: A LOOK FORWARD TO 2030
 COFFEE: A LOOK FORWARD TO 2030 José Sette Executive Director International Coffee Organization Sintercafé, Costa Rica 11 November 2017 WHO WE ARE The International Coffee Organization (ICO) is the main
AMAZONIA (BRAZIL) NUTS MACADAMIAS HAZELNUTS PISTACHIOS WALNUTS PINE NUTS PECANS
 NUTS MACADAMIAS HAZELNUTS PISTACHIOS WALNUTS PINE NUTS PECANS") HAZELNUTS MACADAMIAS PECANS PINE NUTS INTRODUCTION WORLD PRODUCTION PRODUCTION AND CONSUMPTION TRENDS SUPPLY VALUE ALMONDS AMAZONIA (BRAZIL) NUTS CASHEWS PISTACHIOS WALNUTS PEANUTS DATES 05 06 09 13 14
HAZELNUTS MACADAMIAS PECANS PINE NUTS INTRODUCTION WORLD PRODUCTION PRODUCTION AND CONSUMPTION TRENDS SUPPLY VALUE ALMONDS AMAZONIA (BRAZIL) NUTS CASHEWS PISTACHIOS WALNUTS PEANUTS DATES 05 06 09 13 14
PERMITTED Products of Animal origin for Internment by Tourists
 PERMITTED Products of origin for Internment by Tourists Use Merchandise Requirements and Specifications Countries with MCRZI combination of requirements Butter Cream Yoghurt Liquid pasteurized or UHT,
AMERICAN PECAN COUNCIL. Pecan Industry Position Report. For the Crop Year Ended August 31, 2018
 Pecan Industry Position Report INTER-HANDLER TRANSFERS OF PECANS Total Inshell Pounds Transferred: Improved 109,898,013 Native/Seedling 14,813,988 Substandard 16,809,311 Total 141,521,312 YEAR-END INVENTORY
COMPANY PROFILE Verdeoro srl.
 COMPANY PROFILE 1 THE WORLD OF VERDEORO A BREIF INTRODUCTION Verdeoro srl is an Italian Olive Oil company that has been ran by the Mantuano family since the early 1900 s. Verdeoro has grown into one of
Industry Advisory Panel Item 4c Trade of Stainless Steel Scrap
 Industry Advisory Panel Item 4c Trade of Stainless Steel Scrap Lisbon Tuesday 22 April 2008 Sven Tollin Chief Statistician 1 Stainless Steel Waste & Scrap Comparison calendar with Except Kazakhstan only
Carretera de Magallón s/n Fuendejalón (Zaragoza) Spain. Tel: Fax:
 Spain. Tel: Fax:") Carretera de Magallón s/n. 50529 Fuendejalón (Zaragoza) Spain. Tel: +34-976 86 21 53 Fax: +34-976 86 23 63 www.bodegasaragonesas.com D.O. Campo de Borja. The Empire of Garnacha Long winemaking tradition
Carretera de Magallón s/n. 50529 Fuendejalón (Zaragoza) Spain. Tel: +34-976 86 21 53 Fax: +34-976 86 23 63 www.bodegasaragonesas.com D.O. Campo de Borja. The Empire of Garnacha Long winemaking tradition
Outlook for the. ASEAN INTERNATIONAL SEMINAR ON COFFEE June 2012 Kuta, Bali, Indonesia
 Outlook for the World Coffee Market ASEAN INTERNATIONAL SEMINAR ON COFFEE 12 13 June 212 Kuta, Bali, Indonesia José Sette Head of Operations ICO Composite Indicator Price (in current terms) Monthly averages:
Overview. 1. Organic Superfoods Page Organic Dried Fruits Page Organic Seeds & Grains Page Organic Nuts Page 5
 NutriBoost Overview 1. Organic Superfoods Page 2-4 2. Organic Dried Fruits Page 4 3. Organic Seeds & Grains Page 5 4. Organic Nuts Page 5 5. Organic Sugar and Sweeteners Page 6 6. Others Page 6 7. Conventional
EXHIBITION STATISTICS (as of 16 August 2016)
") EXHIBITION STATISTICS (as of 16 August 2016) Show Name : FHA Food&HotelAsia2016 Co-located with PWA ProWine Asia Date : 12 to 15 April 2016 : The 20 th International Food & Drinks, Hotel, Restaurant, Bakery
EXHIBITION STATISTICS (as of 16 August 2016) Show Name : FHA Food&HotelAsia2016 Co-located with PWA ProWine Asia Date : 12 to 15 April 2016 : The 20 th International Food & Drinks, Hotel, Restaurant, Bakery
Effective Through 01/31/2018
 This is to certify that the 2 products specified in the listing below, distributed by AMWAY of the above address, All products listed below are certified only when bearing the Star-K symbol. SKIFQ3Q63Q2
FRANCE A. MARKETS FOR FRESH FRUITS AND VEGETABLES. 1.Market Trends and Opportunities. 1.1 Market Opportunities
 FRANCE A. MARKETS FOR FRESH FRUITS AND VEGETABLES 1.Market Trends and Opportunities 1.1 Market Opportunities France is the third largest importer and the large consumer market of fresh fruits and vegetables
MONTHLY COFFEE MARKET REPORT
 E MONTHLY COFFEE MARKET REPORT February 2012 Coffee prices presented a mixed performance in February, with Arabicas slipping and Robustas increasing by a similar amount. This resulted in a sharp narrowing
Coffee: World Markets and Trade
 United States Department of Agriculture Foreign Agricultural Service June 2018 Coffee: World Markets and Trade Forecast Overview World coffee production for is forecast 11.4 million bags higher than the
Commodity Profile of Edible Oil for November
 Commodity Profile of Edible Oil for November - 2017 As on 20.11.2017 Contents 1. Edible Oil estimates for India ( marketing year- November 2016- October 2017)... 2 2. Production Trend of Domestic Oilseeds...
Introduction. Copyright - The IWSR 2009 Page 1
 Introduction The global wine and spirits market has been affected by the credit crunch and volumes for 2009 are expected to be down across many markets. A recovery will be seen in most categories and markets
WORLD PISTACHIO TRADE
 WORLD PISTACHIO TRADE 2017 Schramm, Williams & Associates, Inc. October 2017, First Edition Copyright 2008 through 2017 Schramm, Williams & Associates, Inc. Printed in the United States of America. All
Fresh Deciduous Fruit (Apples, Grapes, & Pears): World Markets and Trade
: World Markets and Trade") United States Department of Agriculture Foreign Agricultural Service Fresh Deciduous Fruit (Apples, Grapes, & Pears): World Markets and Trade 9 1, MT Deciduous Fruit on Seasonal Cycles 6 Northern Hemisphere
United States Department of Agriculture Foreign Agricultural Service Fresh Deciduous Fruit (Apples, Grapes, & Pears): World Markets and Trade 9 1, MT Deciduous Fruit on Seasonal Cycles 6 Northern Hemisphere
Fresh Deciduous Fruit (Apples, Grapes, & Pears): World Markets and Trade
: World Markets and Trade") Million MT United States Department of Agriculture Foreign Agricultural Service December 21 Fresh Deciduous Fruit (Apples, Grapes, & Pears): World Markets and Trade 21/11 Forecast: World Apple Trade Declines;
Million MT United States Department of Agriculture Foreign Agricultural Service December 21 Fresh Deciduous Fruit (Apples, Grapes, & Pears): World Markets and Trade 21/11 Forecast: World Apple Trade Declines;
P E C A N R E P O R T
 P E C A N R E P O R T Agricultural Marketing Service 16 Forest Parkway Specialty Crops Programs Building 1-218 Market News Division Forest Park, Georgia 30297 Phone (404) 361-1376 FAX (404) 363-2523 Pecan
Global Alcoholic Drinks Consumption. Prepared by: Sally Easton DipWSET, MW for WSET Alumni
 Global Alcoholic Drinks Consumption Prepared by: Sally Easton DipWSET, MW for WSET Alumni The alcoholic drinks market is undeniably a valuable one. Euromonitor data shows that in 2015 it was valued at
ICC Rev September 2012 Original: English. Obstacles to consumption
 ICC 109 4 Rev. 1 11 September 2012 Original: English E International Coffee Council 109 th Session 24 28 September 2012 London, United Kingdom Obstacles to consumption Background 1. In accordance with
An insight into the viticulture sector
 An insight into the viticulture sector Business Analysis Pio De Gregorio Head Luca Schianchi Senior analyst Brescia, 12 June 2015 World production of wine Billion of liters 2007 2008 2009 2010 2011 2012
Import Volume of coffee into Japan (metric tons) Total Green Beans equivalent. Soluble Coffee
 Total Green Beans equivalent. Soluble Coffee") Market in Japan -111- History 1. A limited amount of coffee was drunk by Dutch residents of Nagasaki at the end of the eighteenth century. However, coffee was not generally sold until the last quarter
Market in Japan -111- History 1. A limited amount of coffee was drunk by Dutch residents of Nagasaki at the end of the eighteenth century. However, coffee was not generally sold until the last quarter
ANNEX XI TO THE DECISION OECD SCHEME FOR THE VARIETAL CERTIFICATION OF MAIZE SEED
 ANNEX XI TO THE DECISION OECD SCHEME FOR THE VARIETAL CERTIFICATION OF MAIZE SEED 123 ANNEX XI TO THE DECISION OECD SCHEME FOR THE VARIETAL CERTIFICATION OF MAIZE SEED 124 ANNEX XI TO THE DECISION OECD
Processed Pork Not Heat Product with Fully Cooked - Heat Treated - Heat Treated Treated - Second Inhib Thermally Weekly Percent
 Imported Meat Passed for Entry in the U.S. by Country Agriculture Marketing Service Livestock, Poultry and Grain Market News Friday, September 07, 2018 For Reporting Period: 08/26/2018 to 09/01/2018 Metric
Processed Pork Not Heat Product with Fully Cooked - Heat Treated - Heat Treated Treated - Second Inhib Thermally Weekly Percent
 Imported Meat Passed for Entry in the U.S. by Country Agriculture Marketing Service Livestock, Poultry and Grain Market News Friday, June 29, 2018 For Reporting Period: 06/17/2018 to 06/23/2018 Metric
World Cocoa Conference Nov 2012
 World Cocoa Conference 19-23 Nov 2012 Situation and prospects for cocoa supply & demand Laurent Pipitone Director of Economics & Statistics Division 1 Improving market information and transparency One
Case 2:17-cv RMP ECF No filed 01/12/18 PageID.693 Page 1 of 6 EXHIBIT E
 Case 2:17-cv-00223-RMP ECF No. 27-5 filed 01/12/18 PageID.693 Page 1 of 6 EXHIBIT E Case 2:17-cv-00223-RMP ECF No. 27-5 filed 01/12/18 PageID.694 Page 2 of 6 20.32 Imported Meat Passed for Entry in the
2012 EXPORT HIGHLIGHTS BRITISH COLUMBIA AGRIFOODS
 2012 EXPORT HIGHLIGHTS BRITISH COLUMBIA AGRIFOODS REVISED FEBRUARY 2014 Table of Contents British Columbia Agrifoods Export Highlights - 2012... 1 Total BC Agrifoods Exports... 1 Top BC Agrifoods Exports
WP Board No. 934/03. 7 May 2003 Original: English. Executive Board May 2003 London, England
 WP Board No. 934/03 International Coffee Organization Organización Internacional del Café Organização Internacional do Café Organisation Internationale du Café 7 May 2003 Original: English Executive Board
Agri-Food Exports. Alberta to 2014 Economics and Competitiveness. Highlights on Alberta Agri-Food Exports in Tables:
 Agri-Food Exports Alberta 2005 to 2014 Economics and Competitiveness Highlights on Alberta Agri-Food Exports in 2014 Tables: Alberta Agri-Food Exports, 2005-2014: - Top 5 Export Products and Markets -
Interregional Seminar on the International Trademark Registration
 Interregional Seminar on the International Trademark Registration Puebla, Mexico March 23-24, 2015 Jean-Pierre Maeder Special Delegate IP Advocacy Nestlé A strong brand identity known worldwide The nest
Monitoring EU Agri-Food Trade: Development until October 2016
 Monitoring EU Agri-Food Trade: Development until October 2016 October 2016 EU agri-food exports stabilise at high level The monthly value of EU agri-food exports in October 2016 stabilised at EUR 11.4
UTZ Coffee Statistics Report 2017
 UTZ Coffee Statistics Report 2017 UTZ is the largest certification program in the world for sustainable coffee More than 480,000 coffee farmers and workers benefit from the UTZ program UTZ certified coffee
Jigsaw. Win Win Solutions. Student Handouts: Jigsaw Groups #1 - #5
 CLASS4 UNIT 2: UNDERSTANDING FAIR TRADE Jigsaw Materials Needed Student Handouts: Jigsaw Groups #1 - #5 Classroom Narrative ACTIVITY: Place students into five groups. Have students study their group s
Competitive Trade Analysis Hong Kong
 MARKET ACCESS SECRETARIAT Global Analysis Report Competitive Trade Analysis Hong Kong June 2015 REPORT CONTENT SUMMARY This report looks to highlight the major sectors in Hong Kong, and attempts to identify
Chinese Peanut Exports Hit Record High
 United States Department of Agriculture Foreign Agricultural Service Circular Series FOP 04-03 April 2003 Chinese Peanut Exports Hit Record High 600 500,000 MT 400 China US 300 Vietnam Argentina 200 India