Growth Trends in Area, Production and Productivity of Coconut in Major Growing Countries
|
|
|
- Shana Allen
- 6 years ago
- Views:
Transcription
1 IOSR Journal Of Humanities And Social Science (IOSR-JHSS) Volume 22, Issue 9, Ver. 12 (September. 2017) PP e-issn: , p-issn: Growth Trends in Area, Production and Productivity of Coconut in Major Growing Countries J. Nehru Naik Research Scholar, UGC Faculty Development Program, Department of Economics, Andhra University, Visakhapatnam ABSTRACT: The present study seeks to examine the growth trends in area, production and productivity in major coconut growing countries. It focuses on the performance of different counties in coconut production and also observed magnitude of variations in production trend. The study is based on secondary data obtained from reports of Food and Agriculture Organization of the United Nations. The time period consider for this study is span of 15 years from to and out of the 97 coconut producing countries, 15 countries are selected as sample of the study. The study used average, coefficient of variation, Instability, Compound Annual growth and Semi-Log function for analyzing the data. The results reveals that the leading coconut producing countries in world, viz. Brazil, Malaysia, Vanuatu, Ghana, Papua New Genuine. Among the countries of the world, the coconuts productivity in the Ghana had increased highest followed Papau New Guninea, India, Vanuatu, Malaysia, Sri Lanka and Myanmar Date of Submission: Date of acceptance: I. INTRODUCTION The coconut (Cocos nucifera) is an important horticulture crop which provides food, oil, beverage, medicine fiber and variety of raw materials for the production of an array of products of commercial importance (Karen, 1984). The coconut palm grows throughout the tropics and is widely called the tree of life for its important role in smallholders livelihoods as a direct source of cash income, nutrition and materials (Warner, 2007). The coconut, having originated in South East Asia including Australasia appears to have dispersed eastwards along the Pacific and further in to America, towards the West. It moved to India and Madagascar over the calm tropical waters. Although, it was often considered as an ocean-dispersed nut due to its sustenance viability in sea water for over 100 days, sea travellers were also responsible for the worldwide introduction and propagation of coconut plantation. This is significant from the fact that Spaniards introduced it into West Indies and southern shores of the Caribbean Sea and the Portuguese introduced it to Bahia and other parts of Brazil. Polynesians sea-farmers further spread it to different Islands of the Pacific. The Arabs disseminated it on the African coasts and maritime Tamils together with the Mariners of the Bengal coast distributed it into the lands of the Indian Ocean (GoI, 2008). However, the greatest economic benefit to coconut producers has come from drying the coconuts into copra for further processing into copra oil. Coconut harvesting and primary processing is dominated by smallholders, as large coconut estates turn to more profitable crops. Papua New Guinea, Fiji, Solomon Islands, Marshall Islands, Vanuatu and Kiribati have substantial exports of copra and copra oil for further refining. In contrast, India, Indonesia and the Philippines produce three quarters of the world s coconuts, much of this in plantations, and fully process it locally (PARDI, 2011). More than 97 countries spread over the tropical belt in the regions of Asia, East Africa and America grows coconuts and those countries are also potential producers. Philippines and Indonesia were the leading producers which along contributed about 56 per cent of the world production, followed by India and Brazil. Moreover, the ten major coconut producing countries viz. Indonesia, Philippines, India, Brazil, Sri Lanka, Thailand, Vietnam, Malaysia, Papua New Guinea and Tanzania. India ranks third among the leading coconut growing of the world, accounting for more than per cent of the total world production of nuts (Coir Board, 1989). In India, coconut is grown in 17 states and 3 union territories under varying soil and climatic conditions. Production of coconut in the country is concentrated mainly in the four southern states, namely Kerala, Tamil Nadu, Karnataka and Andhra Pradesh (Elias, 2015). DOI: / Page
2 II. LITERATURE REVIEW Gopala krishnan (1998) in his study highlights, the history and growth of coconut in India, the study also reveals that the coconut board will continue to serve the coconut industry and will help to stabilize the coconut based economy in the country. Barman and Ahmed (1998) in their study examined the performance of production and productivity of coconut in Bangladesh and also state that there is considerable expansion in the coastal regions in Chittagong and Khulna divisions. These two divisions account for about 81 per cent of coconut area and 83 per cent of production. Singh (1998) in his study analysed area, production and productivity of coconut is different in coconut growing countries. He has also reported the state wise area, production and productivity of coconut in India. Even though a wide range of coconut products are internationally traded, the traditional products such as copra, coconut oil, copra meal, desiccated coconut and coir dominate among them. Mamoria (1999) In this study primarily focused on Indian in terms of area and productivity of coconut is the second largest producer of coconut in the world and majority of this area is concentrated in Kerala, Karnataka, Tamil Nadu, Goa-Derman and Din. In Tamil Nadu, majority of production is obtained from Thanjavur, Coimbatore, Kanyakumari, Madurai, Trichy, Selam, Ramanathapuram and Theni districts. Rethinam & Idroes (2003) explored the scope for the increased production of copra. Coconut, a perennial vegetable oil yielding crop occupies million hectares distributed over 93 countries and produces million tons of copra equivalents per annum (2004). World area of coconut grew at 3.05 per cent per annum for the last four decades and the production in terms of copra equivalent accelerated annually at 2.9 per cent. Lathika & Kumar (2005) their study analysed the growth trends in coconut area, production and productivity for five years ( ) in the different coconut producing states of India and came to the conclusion that area effect assumes greater role in output growth in almost all coconut regions of the country, though some states like Kerala and Orissa recently showed signs of a productivity based output growth. States like Andhra Pradesh and Karnataka are already on the path of vast area expansion. Rethinam (2005) in his study on Steps for Yield Increase said that nearly 50 products of coconut are being traded from the producing countries. Of them coconut oil is the largest coconut product. The price trend of copra, and coconut oil in India, Indonesia, the Philippines and Sri Lanka during reveals that domestic prices are the highest in India and Sri Lanka and the lowest in Indonesia. Lathika& Kumar (2009) identified the prospective coconut producing countries that put up formidable trade competition to India, and to examine the growth performance of coconut in major producing countries, especially the ones identified to be real challengers to Indian interests. Philippines, Indonesia and India formed the cluster of major stakeholders. India fared better than both the other countries in the major cluster, in respect of area, production and yield; and therefore, it should enjoy a comparative advantage. Arancon (2010) explored production and global trade scenario of coconut. The global exports of some coconut products during the last 5 years showed an increasing trend, particularly for coco powder, desiccated coconut, coco chemicals, shell charcoal and coir, and coir products. There was a decrease in the export of copra, coconut oil, coconut cream and copra meal, and a significant increase in coco chemicals, coconut shell charcoal, coir as well as coir products. Muyengiet al. (2015) assessed the production of coconuts and factors affecting the production of coconut and to advise suitable research and development areas in coconut sub-sector in Tanzania. Data were analysed using descriptive statistics and Multiple Regression Model. Results showed that palm population was 50 tree/ha which is below the recommended by 60.8%. Kishore& Murthy (2016) were estimated the growth in area, production and productivity of coconut in Karnataka and its districts using compounded annual growth rate analysis. The necessary secondary data was collected for a period of fifteen years from to Growth rates in area, production and productivity of coconut in Karnataka state was positive and significant. Aim and hypothesis This study mainly analyses trends in coconut cultivation in terms of area, production and productivity of major producing countries during the study period and also expected that there is considerable expansion in the in coconut cultivation in sample courtiers. The present study seeks to examine the growth trends in coconut area, production and productivity for the past 15 year s period. It focuses on the performance of different counties in coconut production and also observed magnitude of variation in production growth. DOI: / Page
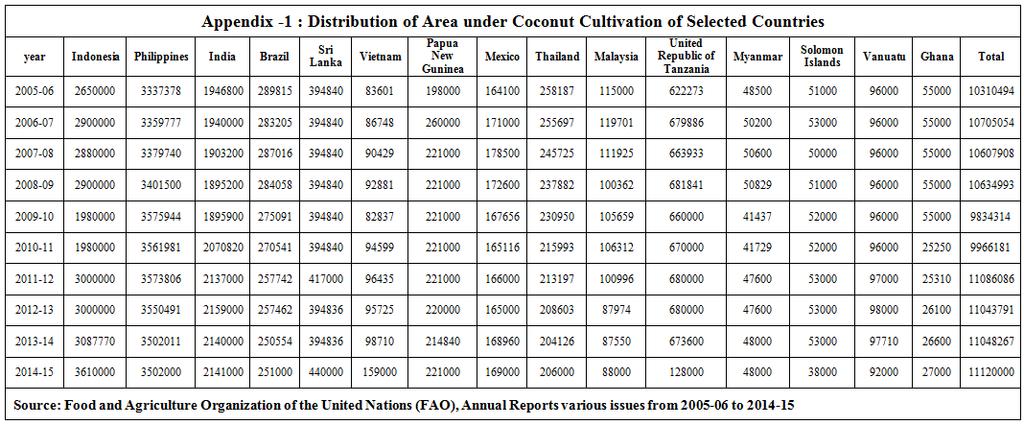
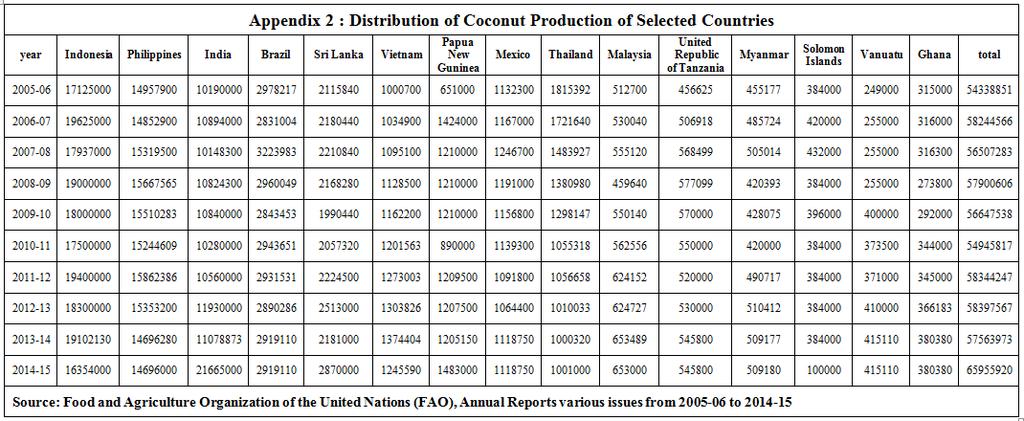
3 III. DATA AND METHODOLOGY The study is mainly based on secondary data obtained from reports of Food and Agriculture Organization of the United Nations. The time period we consider for this study is span of 15 years from to Out of the 97 coconut producing countries, 15 countries are selected as sample of the study. In the present study we calculated average of area, production and productivity. Arithmetic average is also called as mean. It is the most common and widely used measure of central tendency or an average (Kothari, 2004). The coefficient of variation indicates the relative magnitude of the standard deviation as compared with the mean of the distribution as a percentage (Daniel et al, 2003). Instability is one of the important decision parameters in development dynamics, more so in the context of production (Krishan & Chanchal, 2014). Compound Annual growth is a way to measure change reliably at any time or for any time difference (Tague et all, 1981) and calculated trend with Semi-Log function for 15 years time period. As Semi-Log regression model coefficients (ie slope parameters) are elasticity coefficients (Gujarathi, 1988). IV. RESULTS AND DISCUSSION Area under Coconut Cultivation: From Table 1 and Appendix -1 it is clear that the average country-wide area under coconut cultivation during to Among the major countries of the world cultivating coconut, Philippines occupied the first rank, with an average of 34,74,463 hectares, followed by Indonesia ranking second with 27,98,777 hectares, India ranking third with 20,22,892 hectares, United Republic of Tanzania ranking fourth with 6,13,953 hectares and Sri Lanka in the fifth rank with 4,01,571 hectares. Philippines contributed per cent share of the total area under coconut cultivation, followed by Indonesia with per cent, India per cent, and United Republic of Tanzania 5.77 per cent and the Sri Lanka 3.78 per cent during the period of study. During the year , Philippines had the highest area of hectares under coconut cultivation accounting for per cent of the total area of hectares under cultivation in the world, due to the invariable spread of rain in the countries. In Indonesia had the highest area of 36,10,000 hectares under coconut cultivation accounting for per cent of the total world area under cultivation which was 1,11,20,000 hectares, due to the scarcity of rain in the countries. In , the India had the highest area of 35,50,491 hectares under coconut cultivation accounting for per cent of the total world area of 1,10, 43,791 hectares under cultivation due to the low spread of rain in the countries. In , United Republic of Tanzania had the highest area of 6, 80,000 hectares under coconut cultivation accounting for 6.13 per cent of the total world area of 1,10,86,086 hectares under cultivation due to the low spread of rain in the countries. In , Sri Lanka had the highest area of 4,17,000 hectares under coconut cultivation accounting for 3.76 per cent of the total world area of 1,10,86,086 hectares under cultivation due to the low spread of rain in the countries. It can be noted from Table 2 that the trend coefficient is positive and significant in such countries namely, India, Philippines, Sri Lanka and Vietnam while Indonesia also positive trend but not significant. In Brazil, Thailand, Ghana and Malaysia the trend coefficient is observed negative and significant whereas Papua New Guninea, Mexico, Myanmar, Soloman Island and Vanuatu are also noticed negative trend but not significant. It is also inferred from the Table that among the countries of the world, the area under coconut cultivation in the Vietnam had increased at the rate of 6.64 per cent per annum followed by 3.14 per cent per annum in India, 1.11 per cent per annum in the Papua New Geneva and 1.09 per cent per annum in Sri Lanka. The area under coconut cultivation had decreased at the Compound Annual Growth rate of 14.63, 6.87, 2.90, 2.64, 2.23, 1.43, 0.42, 0.29 and 0.10 per cent per annum United Republic Tanzania, Ghana, Sri Lanka, Malaysia Thailand, Brazil, Vanuatu, Mexico and Myanmar respectively. Father, CV reveals that the area under coconut cultivation in Ghana had experienced a variation of per cent followed by a variation of per cent in the United Republic of Tanazia, per cent in Vietnam, per cent in Indonesia and per cent in Malaysia. As the whole, the rate of variation is observed in magnitude of area under coconut cultivation in all countries (Table - 2). Coconut Production: From Table 3 and Appendix 2, it is observed the average country-wide coconut production since Among the major countries of the world coconut production, Indonesia occupied the first rank, with an average of 1,82,34,313 nuts, followed by Philippines ranking second with 1,52,16,062.3 nuts, India ranking third with 1,18,41,047.3 nuts, Brazil ranking fourth with 29,44,039.4 nuts and the Sri Lanka in the fifth rank with 22,51,166 nuts. Indonesia contributed per cent share of the total world production coconut followed by Philippines with per cent, India per cent, and Brazil 5.09 per cent and the Sri Lanka 3.89 per cent during the study period. In , Indonesia had the highest production of 1, 96,25,000 nuts accounting for per cent of the total world production of coconuts which was 5,82,44,566 nuts, due to the invariable spread of rain in the countries. In the Philippines had the highest production of 1, 58,62,386 nuts DOI: / Page
4 accounting for per cent of the total world production of coconuts which was 5,83,44,247 nuts. In the Philippines had the highest production of 2,16,65,000 nuts accounting for per cent of the total world production of coconuts which was 6,59,55,920 nuts due to the spread of rain in the countries. In , Indonesia had the smallest production of 1, 63, 54,000 nuts accounting for per cent of the total world production of coconuts which was 6, 59, 55,920 nuts. In , Philippines had the smallest production of 1, 46, 96,000 nuts accounting for per cent of the total world production of coconuts, which was 6, 59, 55,920 nuts, due to the uneven spread of rain in the countries. In , India had the smallest production of 1, 01, 48,300 nuts accounting for per cent of the total world production of coconuts, which was 5, 65, 07,283 nuts, due to the low rate of rain fall in the countries. In , Brazil had the smallest production of 28, 31,004 nuts accounting for 4.86 per cent of the total world production of coconuts, which was 5, 82, 44,566 nuts, due to the insufficient rain throughout the countries. It can be observed from Table 4 that the trend coefficient is positive and significant in such countries namely, Malaysia, Ghana, Vietnam, India and Sri Lanka whereas in Mexico, Thailand and Solomon Island are registered negative growth and significant. Papua New Guninea, Tanzania and Myanmar are observed positive growth while Philippines, Brazil and Indonesia are noticed negative trend but not significant during the to Father, it is also reveals from the Table that among the countries of the world, the production of coconuts in the Papua New Geneva had increased at the rate of 8.58 per cent per annum followed by 7.38 per cent per annum in India, 5.24 per cent per annum in the Vanuatu and 3.10 per cent per annum in Sri Lanka. The production of coconut had decreased at the Compound Annual Growth rate (CAGR) of 12.59, 5.78, 0.46, 0.20, 0.18, and 0.12 per cent per annum Solomon Island, Thailand, Indonesia, Brazil, Philippines and Mexico respectively. As can be noted from Table 2.5 the area under production of coconut in India had experienced a variation of per cent followed by a variation of per cent in the Thailand, per cent in Solomon Island, per cent in Papu New Geneva and per cent in Sri Lanka, percent in Malaysia, percent in Ghana, percent in Vietnam, remaining all countries less than ten percent the rate of variation in production of coconut. Coconut Productivity: Table 5 and Appendix 3 shows the average country-wide productivity of coconut since Among the major countries of the world s coconut productivity, Brazil placed at the first rank, with an average of 1,09,324 nuts, followed by Myanmar ranking second with 99, 956 nuts, Ghana ranking third with 97,184 nuts, Vietnam ranking fourth with 90,031 nuts and the Solomon Island in the fifth rank with 70,991 nuts, Mexico in the sixth rank with 67,677 nuts per hectare, Indonesia in the seventh rank with 61,205 nuts, India is the eighth rank with 58,338 nuts, Malaysia in the ninth rank with 57,090 nuts and Sri Lanka in the tenth rank with 55,969 nuts, eleventh, twelve thirteenth fourteenth and fifteenth, Thailand (55,603 nuts), Papua New Genuine (52,498 nuts), Philippines (46,816 nuts), Vanuatu (35,389 nuts), and United Republic Arab (7,647 nuts) respectively. In the year , Brazil had the highest productivity of 1,16,506 nuts per hectare, followed by Myanmar with 1,06,079 nuts per hectare, the Ghana with 1,43,000 nuts per hectare, the Vietnam countries with 78,340 nuts per hectare and Solomon Island, with the lowest productivity of 72,453 nuts per hectare. The trend coefficient is positive and significant in such countries namely, Brazil, Malaysia, Vanuatu, Ghana, Papua New Genuine and Myanmar whereas Vietnam, Sri Lanka, Philippines and India are observed positive growth in terms of productivity but not statistically significant. In Thailand Indonesia, Mexico and Solomon Island the negative trend in productivity has witnessed at significant level excluding United Republic of Tanzania. Majority of selected countries observed a positive phase in coconut productivity during study period. Among the countries of the world, the coconuts productivity in the Ghana had increased at the rate of 9.42 per cent per annum followed by 7.39 per cent per annum in Papau New Genuine, 6.81 per cent per annum in India, 5.96 per cent per annum in Vanuatu, 5.23 per cent per annum in Malaysia, 1.99 per cent per annum in Sri Lanka and 1.25 per cent per annum in Myanmar. The productivity of coconut had decreased at the Compound Annual Growth rate (CAGR) of 9.98, 5.28, 3.63, 3.49, 0.66 and 0.65 per cent per annum Solomon Island, United Republic Tanzania, Thailand, Indonesia, Philippines and Vietnam respectively. Table - 6 also shows that the productivity of coconut in Ghana had experienced a variation of per cent followed by a variation of per cent in the India, per cent in Philippines, per cent in Solomon Island and per cent in United Republic Tanzania and percent in Papua New Genuine remaining all countries less than ten percent the rate of variation in productivity of coconuts in the world countries during the period(table 6). DOI: / Page
5 Table 1: Average Area under Coconut Cultivation of Selected Countries during to Sl. No Country Average Percentage Rank 1 Indonesia Philippines India Brazil Sri Lanka Vietnam Papua New Guninea Mexico Thailand Malaysia United Republic of Tanzania Myanmar Solomon Islands Vanuatu Ghana Total Source: Appendix -1 Table - 2: Trends in Area under Coconut Cultivation of Selected Countries Countries Semi-Log CAGR R 2 CV Regression (per cent/ Constant (Per cent) Coefficient Annum) Instability Indonesia NS (0.130) (0.021) Philippines ** (0.013) (0.002) India * (0.023) (0.004) Brazil * (0.011) (0.002) Sri Lanka *** (0.022) (0.004) Vietnam ** (0.095) (0.015) Papua New NS Guninea (0.048) (0.008) Mexico NS (0.018) (0.003) Thailand * (0.014) (0.002) Malaysia * (0.032) (0.005) United Republic of NS Tanzania (0.329) (0.053) Myanmar NS (0.051) (0.008) Solomon Islands NS (0.067) (0.011) Vanuatu NS (0.012) (0.002) Ghana * (0.150) (0.024) Source: Appendix -1 Note: Figures in parenthesis are standard error. * Significant at 1% level, ** Significant at 5% level & *** Significant at 10% level. NS Not significant. DOI: / Page
6 Table 3: Average Coconut Production of Selected Countries during to Sl. No Country Average Production Parentage Rank 1 Indonesia Philippines India Brazil Sri Lanka Vietnam Papua New Guninea Mexico Thailand Malaysia United Republic of Tanzania Myanmar Solomon Islands Vanuatu Ghana Total Source: Appendix - 2 Countries Table - 4: Trends in Coconut Production of Selected Countries Semi log R 2 CAGR (per cent/ Annum) CV (Per cent) Instability Constant Regression Co-efficient Indonesia NS (0.042) (0.007) Philippines NS (0.019) (0.003) India *** (0.130) (0.021) Brazil NS (0.025) (0.004) Sri Lanka *** (0.061) (0.010) Vietnam * (0.26) (0.004) Papua New Guninea NS (0.154) (0.025) Mexico *** (0.026) (0.004) Thailand * (0.049) (0.008) Malaysia * (0.047) (0.008) United Republic of NS Tanzania (0.47) (0.008) Myanmar NS (0.055) (0.009) Solomon Islands *** (0.261) (0.42) Vanuatu * (0.076) (0.012) Ghana ** (0.052) (0.008) Source: Appendix - 2 Note: Figures in parenthesis are standard error.* Significant at 1% level, ** Significant at 5% level & *** Significant at 10% level. NS Not significant. DOI: / Page
7 Table 5: Average Coconut Productivity of Selected Countries during to Sl. No Counties Average Percentage Rank 1 Indonesia Philippines India Brazil Sri Lanka Vietnam Papua New Guninea Mexico Thailand Malaysia United Republic of Tanzania Myanmar Solomon Islands Vanuatu Ghana Total Source: Appendix 3 Countries Table - 6: Trends in Coconut Productivity of Selected Countries Constant Semi-Log Regression Coefficient R 2 CAGR (per cent/ Annum) CV (Per cent) Instability Indonesia ** (0.062) (0.010) Philippines NS (0.110) (0.018) India NS (0.136) (0.022) Brazil * (0.022) (0.004) Sri Lanka NS (0.051) (0.008) Vietnam NS (0.055) (0.009) Papua New *** Guninea (0.119) (0.019) Mexico ** (0.013) (0.002) Thailand * (0.036) (0.006) Malaysia * (0.045) (0.007) United Republic NS of Tanzania (0.134) (0.022) Myanmar ** (0.043) (0.007) Solomon Islands *** (0.196) (0.032) Vanuatu * (0.074) (0.012) Ghana * (0.186) (0.030) Source: Appendix 3 Note: Figures in parenthesis are standard error. * Significant at 1% level, ** Significant at 5% level & *** Significant at 10% level. NS Not significant. DOI: / Page
8 V. CONCLUSION Area under cultivation continues to assume positive growth by almost all coconut regions of the world, though some counties like India, Philippines, Sri Lanka, Vietnam and Indonesia has positive trend. In Brazil, Thailand, Ghana and Malaysia the trend coefficient is observed significant negative trend while Papua New Guninea, Mexico, Myanmar, Soloman Island and Vanuatu are also noticed negative trend but not significant. The analysis of the growth of coconut production during the study period reveals that in Brazil, Malaysia, Vanuatu, Ghana, Papua New Guninea, Myanmar Vietnam, Sri Lanka, Philippines and India are observed positive growth. In Thailand Indonesia, Mexico and Solomon Island negative trend in productivity has witnessed at significant level. Majority of selected countries observed a positive phase in coconut production during study period and highest in Papua New Geneva then by India, Vanuatu and Sri Lanka. The country-wise productivity of coconut showed that the leading coconut producing countries in world, viz. Brazil, Malaysia, Vanuatu, Ghana, Papua New Guninea, Myanmar, Vietnam, Sri Lanka, Philippines and India. Among the countries of the world, the coconuts productivity in the Ghana had increased highest followed Papau New Guninea, India, Vanuatu, Malaysia, Sri Lanka and Myanmar. REFERENCES [1]. AranconJr, R. N. (2010), Production and global trade scenario of coconut. Indian Horticulture, 55(5), [2]. Barman, S.C. & Ahmed, M. (1998), Coconut and it s in area, production and productivity in Bangladesh, India coconut journal, 40(2), 6-7. [3]. Coir Board (1989): India s Production, Exports and Internal Consumption of Coir, Cochin, P.1. [4]. Daniel L. Fulks and Michael K. Staton (2003): Business Statistics, Schaum s outline series. McGraw-Hill Companies, Inc. New Delhi. [5]. Elias, G. (2015), Trends in the area of coconut cultivation in India. Indian Journal of Research, 4(6), [6]. GoI, (2008). Production and Marketing of Coconut in India. Department of Agriculture and Co-operation. Directorate of Marketing and Inspection, Ministry of Agriculture, Government of India, Nagpur, p 4. [7]. Gopalakrishnan, R. (1998), Sixteen Years of Coconut Development Board, Indian coconut journal, 29(4), [8]. Gujarathi, D. N. (1988). Basic Econometrics, McGraw-Hill, Singapore. [9]. Kishore,M. S., &Murthy, C. (2016), Growth in area, production and productivity of coconut inkarnataka, International Journal of Commerce and Business Management, 9(2), [10]. Kothari, C. R. (2004), Research methodology: Methods and techniques. New Age International, New Delhi [11]. Krishan, B., & Chanchal, A. (2014), Agricultural Growth and Instability in Western Himalayan Region: An Analysis of Himachal Pradesh, India, Journal of Agriculture and Life Sciences, 1(1), [12]. Lathika, M., & Kumar, C. A. (2005), Growth trends in area, production and productivity of coconut in India, Indian Journal of Agricultural Economics, 60(4), [13]. Lathika, M., & Kumar, C. A. (2009). Indian stakes in the global coconut scenario by the turn of the century: an empirical investigation. South Asia Economic Journal, 10(1), [14]. Mamoria, C.B. (1999), Economic and Commercial Geography of India, Shiva LataGarwala and Company, Agra,p.238. [15]. Muyengi, Z. E., Msuya, E., &Lazaro, E. (2015).Assessment of factors affecting coconut production in Tanzania.Journal of Agricultural Economics and Development, 4(6), [16]. PARDI (2011). Coconut Value Chain Review. Pacific Agribusiness Research & Development Initiative. The university of Adelaide, Adelaide. [17]. Rethinam P. (2005), Coconut - Steps for Yield Increase, The HinduSurvey of Indian Agriculture, 2005, pp [18]. Rethinam, P., & Idroes, A. (2003), Lourie oil outlook, Indian Coconut Journal, pp [19]. Singh, H.P. (1998), Coconut Industry in India Challenges and Opportunities, India coconut Journal, 30(4), 5-6. [20]. Smith, Karen (1984), Encyclopedia Americana, Vol. 7, [21]. Tague, J., Beheshti, J., & Rees-Potter, L. (1981). The law of exponential growth: evidence, implications and forecasts. Library Trends, 30(1), [22]. Warner, B., Quirke, D., & Longmore, C. (2007). A review of the future prospects for the world coconut industry and past research in coconut production and product. Australian Centre for International Agricultural Research (ACIAR), Canberra (Australia), ISBN , DOI: / Page
9 DOI: / Page
, vol. 22, no. 9, 2017, pp. 47 56.")
10 IOSR Journal Of Humanities And Social Science (IOSR-JHSS) is UGC approved Journal with Sl. No. 5070, Journal no J. Nehru Naik. Growth Trends in Area, Production and Productivity of Coconut in Major Growing Countries. IOSR Journal Of Humanities And Social Science (IOSR-JHSS), vol. 22, no. 9, 2017, pp DOI: / Page
ECONOMICS OF COCONUT PRODUCTS AN ANALYTICAL STUDY. Coconut is an important tree crop with diverse end-uses, grown in many states of India.
 ECONOMICS OF COCONUT PRODUCTS AN ANALYTICAL STUDY Introduction Coconut is an important tree crop with diverse end-uses, grown in many states of India. Coconut palm is the benevolent provider of the basic
Groundnut Production in India Scope for Extended Cultivation
 Groundnut Production in India Scope for Extended Cultivation By Pathan. A. L. 1, Sananse S. L. 2 and Bhonde S. R. 3 India is the second largest producer of groundnuts after China. Groundnut is the largest
PRODUCTION AND EXPORT PERFORMANCE OF CARDAMOM IN INDIA
 PRODUCTION AND EXPORT PERFORMANCE OF CARDAMOM IN INDIA Dr.R.Govindasamy Guest Lecturer, Department of Economics, Bharathiar University, Coimbatore Abstract Cardamom is generally produced in the tropical
Statistics & Agric.Economics Deptt., Tocklai Experimental Station, Tea Research Association, Jorhat , Assam. ABSTRACT
 Two and a Bud 59(2):152-156, 2012 RESEARCH PAPER Global tea production and export trend with special reference to India Prasanna Kumar Bordoloi Statistics & Agric.Economics Deptt., Tocklai Experimental
Chapter 3 PERFORMANCE OF SPICES TRADE IN INDIA AND KERALA
 Chapter 3 PERFORMANCE OF SPICES TRADE IN INDIA AND KERALA India occupies a prominent position in the world spice trade. In the estimated world trade of species of 8,50,000 tonnes valued at US$ 2,200 millions,
ICC September 2018 Original: English. Emerging coffee markets: South and East Asia
 ICC 122-6 7 September 2018 Original: English E International Coffee Council 122 st Session 17 21 September 2018 London, UK Emerging coffee markets: South and East Asia Background 1. In accordance with
Economic Role of Maize in Thailand
 Economic Role of Maize in Thailand Hnin Ei Win Center for Applied Economics Research Thailand INTRODUCTION Maize is an important agricultural product in Thailand which is being used for both food and feed
DETERMINANTS OF GROWTH
 POLICY OPTIONS AND CHALLENGES FOR DEVELOPING ASIA PERSPECTIVES FROM THE IMF AND ASIA APRIL 19-20, 2007 TOKYO DETERMINANTS OF GROWTH IN LOW-INCOME ASIA ARI AISEN INTERNATIONAL MONETARY FUND Paper presented
THE PROBLEMS AND PROSPECTS OF INDIAN TEA INDUSTRY AN ANALYSIS
 I J A B E R, Vol. 14, No. 14 (2016): 9893-9902 THE PROBLEMS AND PROSPECTS OF INDIAN TEA INDUSTRY AN ANALYSIS S. Siva Kumar * and N. Saravana Bhavan ** Abstract: India is one of the leading economies in
World of sugar PAGE 54
 World of sugar More than 1 countries produce sugar, about 8% of which is made from sugar cane grown primarily in the tropical and sub-tropical zones of the southern hemisphere, and the balance from sugar
January 2015 WORLD GRAPE MARKET SUPPLY, DEMAND AND FORECAST
 January 2015 WORLD GRAPE MARKET SUPPLY, DEMAND AND FORECAST Table of Contents Executive Summary... 4 1. VARIETIES OF GRAPES... 6 1.1. White table grapes... 6 1.2. Red table grapes... 6 2. WORLD DEMAND
IMPACT OF RAINFALL AND TEMPERATURE ON TEA PRODUCTION IN UNDIVIDED SIVASAGAR DISTRICT
 International Journal of Agricultural Science and Research (IJASR) ISSN (P): 2250-0057; ISSN (E): 2321-0087 Vol. 8, Issue 1 Feb 2018, 51-56 TJPRC Pvt. Ltd. IMPACT OF RAINFALL AND TEMPERATURE ON TEA PRODUCTION
Production and Export of Value Added tea in India and its Global Competitiveness
 Economic Affairs, Vol. 62, No. 4, pp. 705-710, December 2017 DOI: 10.5958/0976-4666.2017.00086.9 2017 New Delhi Publishers. All rights reserved Production and Export of Value Added tea in India and its
ANALYSIS OF THE EVOLUTION AND DISTRIBUTION OF MAIZE CULTIVATED AREA AND PRODUCTION IN ROMANIA
 ANALYSIS OF THE EVOLUTION AND DISTRIBUTION OF MAIZE CULTIVATED AREA AND PRODUCTION IN ROMANIA Agatha POPESCU University of Agricultural Sciences and Veterinary Medicine, Bucharest, 59 Marasti, District
A STUDY OF CHILLI PRODUCTION AND EXPORT FROM INDIA
 A STUDY OF CHILLI PRODUCTION AND EXPORT FROM INDIA R. Geetha 1, Dr. K.Selvarani 2 1 Assistant Professor of Commerce, Sri Kaliswari College (Autonomous), Sivakasi, Tamilnadu,India 2 Associate Professor
CONTEMPORARY RESEARCH IN INDIA (ISSN ): VOL. 7: ISSUE: 2 (2017)
: VOL. 7: ISSUE: 2 (2017)") ECONOMICS OF SUGARCANE IN WESTERN MAHARASHTRA Dr. J. S. Kumbhar 1, Dr. B. T. Kamble 2, Dr. S. S. Kaware 3 1 Field officer (II), 2 & 3 Jr. Res. Asstt., State Cost of Cultivation Scheme, MPKV, Rahuri, Dist.
ECONOMICS OF SUGARCANE IN WESTERN MAHARASHTRA Dr. J. S. Kumbhar 1, Dr. B. T. Kamble 2, Dr. S. S. Kaware 3 1 Field officer (II), 2 & 3 Jr. Res. Asstt., State Cost of Cultivation Scheme, MPKV, Rahuri, Dist.
SINGAPORE. Summary Table: Import of Fresh fruits and Vegetables in Fresh fruit and Vegetables Market Value $000 Qty in Tons
 SINGAPORE A. MARKET FOR FRESH FRUIT AND VEGETABLES 1. Market Trend and Opportunities Summary Table: Import of Fresh fruits and Vegetables in Fresh fruit and Vegetables Market Products/ Other Info. Product
RAW CASHEW PRODUCTION IN INDIA A ROADMAP FOR 20 LAKHS M.T. BY Dr. R.K. Bhoodes (Chairman, CEPCI)
") RAW CASHEW PRODUCTION IN INDIA A ROADMAP FOR 20 LAKHS M.T. BY 2025 Dr. R.K. Bhoodes (Chairman, CEPCI) A BRIEF HISTORY: Cashew a native of Brazil was introduced to the world by the Portuguese. Portuguese
RAW CASHEW PRODUCTION IN INDIA A ROADMAP FOR 20 LAKHS M.T. BY 2025 Dr. R.K. Bhoodes (Chairman, CEPCI) A BRIEF HISTORY: Cashew a native of Brazil was introduced to the world by the Portuguese. Portuguese
CHAPTER VI TEA INDUSTRY IN TAMIL NADU
 CHAPTER VI TEA INDUSTRY IN TAMIL NADU 6.1 Introduction Tamil Nadu is an important producer of tea. Nilgiris District of Tamil Nadu has the reputation of being one of the finest tea growing tracts in the
Tea Statistics Report 2015
 Tea Statistics Report 215 Introduction This report presents the scope and scale of the UTZ tea program in 215. Throughout this report tea also includes rooibos unless otherwise specified. The statistics
Growth dynamics and forecasting of finger millet (Ragi) production in Karnataka
 production in Karnataka") Growth dynamics and forecasting of finger millet (Ragi) production in Karnataka Veerabhadrappa Bellundagi*, K.B. Umesh and S.C. Ravi Department of Agricultural Economics, UAS, GKVK, Bengaluru, Karnataka,
Growth dynamics and forecasting of finger millet (Ragi) production in Karnataka Veerabhadrappa Bellundagi*, K.B. Umesh and S.C. Ravi Department of Agricultural Economics, UAS, GKVK, Bengaluru, Karnataka,
IMPACT OF PRICING POLICY ON DOMESTIC PRICES OF SUGAR IN INDIA
 RESEARCH ARTICLE IMPACT OF PRICING POLICY ON DOMESTIC PRICES OF SUGAR IN INDIA Kavita*, R.K. Grover, Sunita and Raj Kumar Department of Agricultural Economics, CCSHAU, Hisar-125004, Haryana Email: kavitayadav230@gmail.com
Coffee prices maintain downward trend as 2015/16 production estimates show slight recovery
 Coffee prices maintain downward trend as 2015/16 production estimates show slight recovery The coffee market fell again in December 2015, reaching its second lowest monthly average of the year. This decrease
CHAPTER 7.3 FOCUS ON FAIRTRADE PRODUCTS COCOA
 CHAPTER 7.3 FOCUS ON FAIRTRADE PRODUCTS COCOA MONITORING THE SCOPE AND BENEFITS OF FAIRTRADE SIXTH EDITION 2014 95 MONITORING THE SCOPE AND BENEFITS OF FAIRTRADE SIXTH EDITION 2014 96 7.3 Fairtrade Fact
Mango Market Profile
 Mango Market Profile Prepared by: Ministry of Industry, Commerce, Agriculture & Fisheries Agricultural Services Unit Hope Gardens, Kingston 6 Tel: (876)927-1731/Fax: (876)927-1792 Email: marketing@moa.gov.jm
World Scenario: Oilseed Production
 World Scenario: Oilseed Production Commodity 13/14 (Million Ton) 16/17 (Million Ton) Soybean 280.3 352 Sunflower seed 43.6 48.22 Rapeseed 69.6 63.13 Cotton Seed 44.4 39.52 Groundnuts 28.4 30.32 Palm-kernal
Global Hot Dogs Market Insights, Forecast to 2025
 Report Information More information from: https://www.wiseguyreports.com/reports/3366552-global-hot-dogs-market-insights-forecast-to-2025 Global Hot Dogs Market Insights, Forecast to 2025 Report / Search
ANALYSIS ON THE STRUCTURE OF HONEY PRODUCTION AND TRADE IN THE WORLD
 ANALYSIS ON THE STRUCTURE OF HONEY PRODUCTION AND TRADE IN THE WORLD GU G., ZHANG Ch., HU F.* Department of Sericulture and Apiculture, College of Animal Science Zhejiang University, Hangzhou 310029, CHINA
MARKETING TRENDS FOR COCONUT PRODUCTS IN SRI LANKA
 ,'6 b l\o L( cl/\r!y ~?\ 1IJ7'X ~.fsool- CR Cc~~ ~t).> MARKETING TRENDS FOR COCONUT PRODUCTS IN SRI LANKA 1950-1981 By Sunil Chandra ~~nnapperuma B.A. (Ceylon) A dissertation submitted in partial fulfilment
Sri Lanka s Edible Oils Exports. September 2016
 Sri Lanka s Edible Oils Exports September 2016 Key products in Sri Lanka s edible oils sector Animal and vegetable fats and oils exports accounted for only.51% of Sri Lanka s $11.1 billion total export
PHILIPPINES. 1. Market Trends: Import Items Change in % Major Sources in %
 PHILIPPINES A. MARKET OF FRESH FRUITS & VEGETABLES 1. Market Trends: Import Items 2003 2007 Change in % Major Sources in % Value Quantity Value Quantity Value Quantity USD '000 Tons USD '000 Tons Grapes
The Potential Role of Latin America Food Trade in Asia Pacific PECC Agricultural and Food Policy Forum Taipei
 The Potential Role of Latin America Food Trade in Asia Pacific 2011 PECC Agricultural and Food Policy Forum Taipei Universidad EAFIT, Colombia December 2, 2011 1 CONTENTS 1. Introduction 2. Food Trade
Table grape. Horticulture trade intelligence. Quarter 1: January to March 2017
 Horticulture trade intelligence A custom report compiled for Hort Innovation by Euromonitor International Table grape Quarter 1: January to March 217 Horticulture trade intelligence: Table grape: 217:
Coffee: World Markets and Trade
 United States Department of Agriculture Foreign Agricultural Service Circular Series December 213 Coffee: World Markets and Trade 4 in Producing Countries to Continue Rising Million 6 Kilogram Bags 3 2
MONTHLY COFFEE MARKET REPORT
 E MONTHLY COFFEE MARKET REPORT July 2012 Coffee prices rebounded in July 2012, with the ICO composite indicator increasing by 9.5% compared to June, following nine consecutive months of price falls. The
Thailand Packaging Machinery Market. Jorge Izquierdo VP Market Development PMMI
 Thailand Packaging Machinery Market Jorge Izquierdo VP Market Development PMMI jizquierdo@pmmi.org www.pmmi.org/global www.pmmi.org/research Today General Economic and Political Highlights Current Packaging
Production and Export Performance Indian Spices Etta Mohana Rao Dr.R.Sivaram Prasad. Department of Commerce and Business Administration
 Production and Export Performance Indian Spices Etta Mohana Rao Dr.R.Sivaram Prasad Department of Commerce and Business Administration Acharya Nagarjuna University, Nagarjuna Nagar, Guntur-522510, Andhra
Fresh Deciduous Fruit (Apples, Grapes, & Pears): World Markets and Trade
: World Markets and Trade") Million MT United States Department of Agriculture Foreign Agricultural Service December 21 Fresh Deciduous Fruit (Apples, Grapes, & Pears): World Markets and Trade 21/11 Forecast: World Apple Trade Declines;
Million MT United States Department of Agriculture Foreign Agricultural Service December 21 Fresh Deciduous Fruit (Apples, Grapes, & Pears): World Markets and Trade 21/11 Forecast: World Apple Trade Declines;
Coffee market ends 2017/18 in surplus
 Coffee market ends 217/18 in surplus World coffee production in coffee year 217/18 is estimated 5.7% higher at 164.81 million bags as output of Arabica increased by 2.2% to 11.82, and Robusta grew 11.7%
Record Exports for Coffee Year 2016/17
 Record Exports for Coffee Year 2016/17 Total exports in September 2017 reached 8.34 million bags, compared to 9.8 million in September 2016. While coffee year 2016/17 registered a decrease in its final
THE EXPORT PERFORMANCE OF INDONESIAN DRIED CASSAVA IN THE WORLD MARKET
 Agricultural Socio-Economics Journal P -ISSN: 1412-1425 Volume 17, Number 3 (2017): 134-139 E-ISSN: 2252-6757 THE EXPORT PERFORMANCE OF INDONESIAN DRIED CASSAVA IN THE WORLD MARKET Nico Adi Putra Hutabarat
Overview of the Manganese Industry
 39th Annual Conference Istanbul, Turkey 2013 Overview of the Manganese Industry International Manganese Institute Alberto Saavedra Market Research Manager June, 2013 Introduction Global Production Supply,
An analytical economic study of production and export of Green beans in Egypt
 Middle East Journal of Agriculture Research ISSN 2077-4605 Volume : 07 Issue : 04 Oct.-Dec. 2018 Pages:1208-1216 An analytical economic study of production and export of Green beans in Egypt Enaam A. Mohamed,
World Cocoa Prices. Commodity Prices Update: Coffee, Cocoa, and Cotton. Joelle Cook and Professor C. Leigh Anderson
 SDR per tonne Commodity Prices Update: Coffee, Cocoa, and Cotton Joelle Cook and Professor C. Leigh Anderson Prepared for the Agricultural Policy and Statistics Division of the Bill and Melinda Gates Foundation
International Table Grape Symposium November 2014 Australian Table Grapes Jeff Scott Chief Executive Officer
 International Table Grape Symposium November 2014 Australian Table Grapes Jeff Scott Chief Executive Officer Australian Table Grape Industry - Snapshot There are approximately 900 table grape growers throughout
The supply and demand for oilseeds in South Africa
 THIS REPORT CONTAINS ASSESSMENTS OF COMMODITY AND TRADE ISSUES MADE BY USDA STAFF AND NOT NECESSARILY STATEMENTS OF OFFICIAL U.S. GOVERNMENT POLICY Required Report - public distribution Date: GAIN Report
Global Rum Market Insights, Forecast to 2025
 Report Information More information from: https://www.wiseguyreports.com/reports/3652945-global-rum-market-insights-forecast-to-2025 Global Rum Market Insights, Forecast to 2025 Report / Search Code: WGR3652945
A STUDY ON CULTIVATION AND MARKETING PROBLEMS OF COCONUT GROWERS IN THALI PANCHAYAT, UDUMALPET
 A STUDY ON CULTIVATION AND MARKETING PROBLEMS OF COCONUT GROWERS IN THALI PANCHAYAT, UDUMALPET Dr.R.VANAMADEVI, ASSISTANT PROFESSOR OF COMMERCE, SRI G.V.G. VISALAKSHI COLLEGE FOR WOMEN, UDUMALPET-642128
J / A V 9 / N O.
 July/Aug 2003 Volume 9 / NO. 7 See Story on Page 4 Implications for California Walnut Producers By Mechel S. Paggi, Ph.D. Global production of walnuts is forecast to be up 3 percent in 2002/03 reaching
KUWAIT. Similarly there is a decreasing trend for other fresh fruits products like grapes and lychee. India shared 37.6% of import market in Kuwait.
 KUWAIT A. MARKET FOR FRESH FRUITS AND FRESH VEGETABLES 1. Market Trend and Opportunities: Fresh Fruits The market for fresh fruits in Kuwait has a downward trend. Bananas import volume decreased by 34%
World coffee consumption increases but prices still low
 World coffee consumption increases but prices still low The coffee market stabilised slightly in February, but prices remain at very low levels. A lack of news regarding fundamentals with expectations
Record exports in coffee year 2017/18
 Record exports in coffee year 2017/18 Total coffee exports increased each year since 2010/11 with a new record reached in 2017/18 at 121.86 million bags, 2% higher than 2016/17. In the twelve months ending
Monthly Economic Letter
 Monthly Economic Letter Cotton Market Fundamentals & Price Outlook RECENT PRICE MOVEMENT After falling in the days surrounding the release of last month s USDA report, NY futures and the A Index were mostly
International Market Trends on Cocoa Trade for Sustainable Development Programme
 International Market Trends on Cocoa Trade for Sustainable Development Programme Global Cocoa Trends: Production Primary cocoa growing regions are Africa, Asia and Latin America. Africa accounts for 70%
Taiwan Fishery Trade: Import Demand Market for Shrimps. Bith-Hong Ling
 International Symposium Agribusiness Management towards Strengthening Agricultural Development and Trade III : Agribusiness Research on Marketing and Trade Taiwan Fishery Trade: Import Demand Market for
STATE OF THE VITIVINICULTURE WORLD MARKET
 STATE OF THE VITIVINICULTURE WORLD MARKET April 2018 1 Table of contents 1. VITICULTURAL PRODUCTION POTENTIAL 3 2. WINE PRODUCTION 5 3. WINE CONSUMPTION 7 4. INTERNATIONAL TRADE 9 Abbreviations: kha: thousands
Measuring the extent of instability in foodgrains production in different districts of Karanataka INTRODUCTION. Research Paper
 Internationl Research Journal of Agricultural Economics and Statistics Volume 3 Issue 1 March, 2012 53-58 Research Paper Measuring the extent of instability in foodgrains production in different districts
EMBARGO TO ON FRIDAY 16 SEPTEMBER. Scotch Whisky Association. Exports of Scotch Whisky; Year to end of June 2016 (2016 H1)
") EMBARGO TO 00.01 ON FRIDAY 16 SEPTEMBER Scotch Whisky Association Exports of Scotch Whisky; Year to end of June 2016 (2016 H1) VOLUME UP 3.1% to 531 MILLION bottles VALUE DOWN SLIGHTLY BY 1.0% TO 1.70
EMBARGO TO 00.01 ON FRIDAY 16 SEPTEMBER Scotch Whisky Association Exports of Scotch Whisky; Year to end of June 2016 (2016 H1) VOLUME UP 3.1% to 531 MILLION bottles VALUE DOWN SLIGHTLY BY 1.0% TO 1.70
Fresh Deciduous Fruit (Apples, Grapes, & Pears): World Markets and Trade
: World Markets and Trade") Fresh Deciduous Fruit (Apples, Grapes, & Pears): World Markets and Trade June 21 APPLES Record Production but Trade Estimate Revised Downward The world production estimate for 29/1 is virtually unchanged
Fresh Deciduous Fruit (Apples, Grapes, & Pears): World Markets and Trade June 21 APPLES Record Production but Trade Estimate Revised Downward The world production estimate for 29/1 is virtually unchanged
Foodservice Market Prospects
 Foodservice Market Prospects Australia & South East Asia Food SA Summit 5th June 2012 BIS Foodservice 3 4 Three Available Food & Beverage Markets The Three Food & Non-Alcoholic Beverage Markets Market
World Yoghurt Market Report
 World Yoghurt Market Report 2000-2020 Price: 1,800 /$2,200 The report contains 330 pages of valuable information Analysis of the current market situation and future possibilities in all regions of the
Commodity Profile for Sugar, March, 2017
 (As on 10.3.2017) Commodity Profile for Sugar, March, 2017 Contents 1. Sugar Estimates for India... 2. World Sugar Estimates... 2 3. Production, Area under cultivation and Yield of Sugarcane and Sugar...
OPPORTUNITIES FOR SRI LANKAN VIRGIN COCONUT OIL IN TURKEY
 OPPORTUNITIES FOR SRI LANKAN VIRGIN COCONUT OIL IN TURKEY Prepared by: Embassy of Sri Lanka, Turkey June 2017 CONTENTS 1. SUMMARY... 3 2. MARKET DESCRIPTION... 3 3. POSITION OF SRI LANKAN VIRGIN COCONUT
Tuna Trade. Fatima Ferdouse
 Tuna Trade Fatima Ferdouse HIGHLIGHTS East Asia is the world s largest processing and exporting region for canned tuna. Producing countries in the region also depend on imported raw materials The fluctuating
China s Export of Key Products of Pharmaceutical Raw Materials
 China s Export of Key Products of Pharmaceutical Raw Materials During the period of the 62nd API China& INTERPHEX CHINA, China Pharmaceutical Industry Association released its annual Report on Analysis
UTZ Tea Statistics Report 2017
 UTZ Tea Statistics Report 2017 More than 107,000 tea farmers and workers benefit from the UTZ program UTZ certified tea is produced in 13 countries In 2017, more than 4.6 billion cups of UTZ certified
By Type Still, Sparkling, Spring. By Volume- Liters Consumed. By Region - North America, Europe, Asia Pacific, Latin America and Middle East
 Global Bottled Water Market (Value, Volume): Analysis By Type (Still, Sparkling, Spring), By Region, By Country: Opportunities and Forecast (2018-2023) By Type Still, Sparkling, Spring By Volume- Liters
Outline. Long-term Outlook for Cotton Consumption. World End-Use Consumption of Textile Fibers. World Consumption of Textile Fibers
 World Cotton Supply and Use International Cotton Advisory Committee Secretariat Outline! Long-term Outlook for Consumption! Outlook for /! Developments in World Cotton Trade Fifth Open Session: Cotton
assumes considerable significance in the national economy in view of rural employment and income generation.
 By: G. Palaniappan S. Subramaniam THE COCONUT REVIVAL The government needs to take all possible steps in order to make coconut farming productive, remunerative and reliable supplier of raw materials to
Asia Pacific Tuna Trade. Shirlene Maria Anthonysamy INFOFISH Pacific Tuna Forum 2017 Papua New Guinea
 Asia Pacific Tuna Trade Shirlene Maria Anthonysamy INFOFISH Pacific Tuna Forum 217 Papua New Guinea JAPANESE MARKET Demand for sashimi tuna remains highly seasonal strengthening during the spring festivals
HONDURAS. A Quick Scan on Improving the Economic Viability of Coffee Farming A QUICK SCAN ON IMPROVING THE ECONOMIC VIABILITY OF COFFEE FARMING
 HONDURAS A Quick Scan on Improving the Economic Viability of Coffee Farming 1 OBJECTIVES OF STUDY Overall objective Identify opportunities for potential benefits to coffee farmers from improved farm profitability
Volatility returns to the coffee market as prices stay low
 Volatility returns to the coffee market as prices stay low Daily coffee prices hit their lowest level in 19 months during August, as commodity markets worldwide were negatively affected by currency movements
UTZ Coffee Statistics Report 2017
 UTZ Coffee Statistics Report 2017 UTZ is the largest certification program in the world for sustainable coffee More than 480,000 coffee farmers and workers benefit from the UTZ program UTZ certified coffee
World vitiviniculture situation
 World vitiviniculture situation Surface area Grape Wine Global grape production Production Consumption Trade 2016 FAO-OIV Focus: Table and Dried Grapes 2 Global area under vines Area under vines in the
Deliveries to dairies 198/86 GENERAL AGREEMENT ON TARIFFS AND TRADE. Consurption of fresh milk (including exports) 1985/86. Industrial uses 1985/86
 1985/86. Industrial uses 1985/86") GENERAL AGREEMENT ON TARIFFS AND TRADE RESTRICTED DPC/STAT/12/Add. 14 23 September 1986 International Dairy Arrangement INTERNATIONAL DAIRY PRODUCTS Reply to Questionnaire 4 AUSTRALIA COUNCIL (Financial
GENERAL AGREEMENT ON TARIFFS AND TRADE RESTRICTED DPC/STAT/12/Add. 14 23 September 1986 International Dairy Arrangement INTERNATIONAL DAIRY PRODUCTS Reply to Questionnaire 4 AUSTRALIA COUNCIL (Financial
Monthly Economic Letter
 Monthly Economic Letter Cotton Market Fundamentals & Price Outlook RECENT PRICE MOVEMENT After some upward movement in April, most benchmark prices turned lower in early May. After climbing to the upper
AMAZONIA (BRAZIL) NUTS MACADAMIAS HAZELNUTS PISTACHIOS WALNUTS PINE NUTS PECANS
 NUTS MACADAMIAS HAZELNUTS PISTACHIOS WALNUTS PINE NUTS PECANS") HAZELNUTS MACADAMIAS PECANS PINE NUTS INTRODUCTION WORLD PRODUCTION PRODUCTION AND CONSUMPTION TRENDS SUPPLY VALUE ALMONDS AMAZONIA (BRAZIL) NUTS CASHEWS PISTACHIOS WALNUTS PEANUTS DATES 05 06 09 13 14
HAZELNUTS MACADAMIAS PECANS PINE NUTS INTRODUCTION WORLD PRODUCTION PRODUCTION AND CONSUMPTION TRENDS SUPPLY VALUE ALMONDS AMAZONIA (BRAZIL) NUTS CASHEWS PISTACHIOS WALNUTS PEANUTS DATES 05 06 09 13 14
Coffee market settles lower amidst strong global exports
 Coffee market settles lower amidst strong global exports The ICO composite indicator price declined by 1.2% in February 2018 to an average of 114.19 US cents/lb. Indicator prices for all three Arabica
FACTORS DETERMINING UNITED STATES IMPORTS OF COFFEE
 12 November 1953 FACTORS DETERMINING UNITED STATES IMPORTS OF COFFEE The present paper is the first in a series which will offer analyses of the factors that account for the imports into the United States
Prices for all coffee groups increased in May
 Prices for all coffee groups increased in May In May 2018, the ICO composite indicator increased by 0.7% to an average of 113.34 US cents/lb, following three months of declines. Prices for all coffee groups
Growing divergence between Arabica and Robusta exports
 Growing divergence between Arabica and Robusta exports In April 218, the ICO composite indicator decreased by.4% to an average of 112.56, with the daily price ranging between 11.49 and 114.73. Prices for
Food Additive Produced by IAR Team Focus Technology Co., Ltd
 Food Additive 2012.03 Produced by IAR Team Focus Technology Co., Ltd Contents 1. 2009-2011 Chinese Citric Acid Export Data Analysis... 3 2009-2011 Major Importers of Chinese Citric Acid...4 2. 2009-2011
Mexico Milk Cow Numbers and Milk Production per Cow,
 TABLE OF CONTENTS 1. Mexico 1.1. Mexico Milk Market Introduction 1.1.1. Dairy Market Structure and Supply Chain in Mexico 1.1.2. Mexico Cow Milk Market Production and Fluid Milk Consumption by Volume,
The aim of the thesis is to determine the economic efficiency of production factors utilization in S.C. AGROINDUSTRIALA BUCIUM S.A.
 The aim of the thesis is to determine the economic efficiency of production factors utilization in S.C. AGROINDUSTRIALA BUCIUM S.A. The research objectives are: to study the history and importance of grape
North America Ethyl Acetate Industry Outlook to Market Size, Company Share, Price Trends, Capacity Forecasts of All Active and Planned Plants
 North America Ethyl Acetate Industry Outlook to 2016 - Market Size, Company Share, Price Trends, Capacity Forecasts of All Active and Planned Plants Reference Code: GDCH0416RDB Publication Date: October
COMPARISON OF EMPLOYMENT PROBLEMS OF URBANIZATION IN DISTRICT HEADQUARTERS OF HYDERABAD KARNATAKA REGION A CROSS SECTIONAL STUDY
 I.J.S.N., VOL. 4(2) 2013: 288-293 ISSN 2229 6441 COMPARISON OF EMPLOYMENT PROBLEMS OF URBANIZATION IN DISTRICT HEADQUARTERS OF HYDERABAD KARNATAKA REGION A CROSS SECTIONAL STUDY 1 Wali, K.S. & 2 Mujawar,
Coffee Season 2013/14 Finishes in Balance but Deficit Expected Next Year
 Coffee Season 2013/14 Finishes in Balance but Deficit Expected Next Year Coffee prices were volatile again over the course of September, mostly reacting to weather news from Brazil. Daily prices fell initially
Commodity Profile for Sugar, September, 2017
 (As on 15.9.2017) Commodity Profile for Sugar, September, 2017 Contents 1. Sugar Estimates for India... 2 2. World Sugar Estimates... 2 3. Production, Area under cultivation and Yield of Sugarcane and
Emerging Local Food Systems in the Caribbean and Southern USA July 6, 2014
 Consumers attitudes toward consumption of two different types of juice beverages based on country of origin (local vs. imported) Presented at Emerging Local Food Systems in the Caribbean and Southern USA
Coffee prices rose slightly in January 2019
 Coffee prices rose slightly in January 2019 In January 2019, the ICO composite indicator rose by 0.9% to 101.56 US cents/lb as prices for all group indicators increased. After starting at a low of 99.16
OF THE VARIOUS DECIDUOUS and
 (9) PLAXICO, JAMES S. 1955. PROBLEMS OF FACTOR-PRODUCT AGGRE- GATION IN COBB-DOUGLAS VALUE PRODUCTIVITY ANALYSIS. JOUR. FARM ECON. 37: 644-675, ILLUS. (10) SCHICKELE, RAINER. 1941. EFFECT OF TENURE SYSTEMS
PERFORMANCE OF TEA INDUSTRIES IN SOUTH INDIA A COMPARATIVE ANALYSIS
 Volume 119 No. 18 2018, 3549-3568 ISSN: 1314-3395 (on-line version) url: http://www.acadpubl.eu/hub/ http://www.acadpubl.eu/hub/ PERFORMANCE OF TEA INDUSTRIES IN SOUTH INDIA A COMPARATIVE ANALYSIS 1 Dr.
MONTHLY COFFEE MARKET REPORT
 E MONTHLY COFFEE MARKET REPORT May 2014 After five consecutive months of rising prices, the coffee market reversed lower in May. From a high of 179 cents/lb in April, the daily price of the ICO composite
Citrus: World Markets and Trade
 United States Department of Agriculture Foreign Agricultural Service Citrus: World Markets and Trade Oranges Global orange production for 2012/13 is forecast to drop over 4 percent from the previous year
An Overview of the U.S. Bell Pepper Industry. Trina Biswas, Zhengfei Guan, 1 Feng Wu University of Florida
 An Overview of the U.S. Bell Pepper Industry Trina Biswas, Zhengfei Guan, 1 Feng Wu University of Florida Bell pepper is one of the most widely cultivated vegetable crops in the world. Characterized by
Monthly Economic Letter
 Monthly Economic Letter Cotton Market Fundamentals & Price Outlook RECENT PRICE MOVEMENT NY futures experienced volatility recently, with the net effect being a slight increase in prices. The A Index also
In 2017, the value of Scotch Whisky exports reached a record 4.37 billion.
 SCOTCH WHISKY 2017 EXPORT ANALYSIS #WHISKYFORTHEWORLD www.scotch-whisky.org.uk " In 2017, the value of Scotch Whisky exports reached a record 4.37 billion. To put this into perspective, more Scotch Whisky
Chile. Tree Nuts Annual. Almonds and Walnuts Annual Report
 THIS REPORT CONTAINS ASSESSMENTS OF COMMODITY AND TRADE ISSUES MADE BY USDA STAFF AND NOT NECESSARILY STATEMENTS OF OFFICIAL U.S. GOVERNMENT POLICY Required Report - public distribution Date: GAIN Report
GENERAL DESCRIPTION OF INDUSTRY AND COMPANY
 Appendix G Appendix Sample G: Import Business Business Plan: Otoro Plan: Import Company Otoro Import Company EXECUTIVE SUMMARY Otoro Imports is a spice importing and marketing corporation established in
Labor Supply of Married Couples in the Formal and Informal Sectors in Thailand
 Southeast Asian Journal of Economics 2(2), December 2014: 77-102 Labor Supply of Married Couples in the Formal and Informal Sectors in Thailand Chairat Aemkulwat 1 Faculty of Economics, Chulalongkorn University