Growing Innovation Innovation is vital to the success of ZESPRI Kiwifruit
|
|
|
- Jordan Stevens
- 5 years ago
- Views:
Transcription

1


, and is")


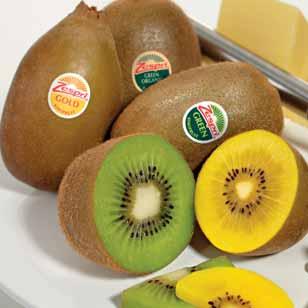


2 ZESPRI Growing Innovation Innovation is vital to the success of ZESPRI Kiwifruit From the moment Isabel Fraser brought the first small black seeds in to New Zealand, orchardists and horticulturists have worked hard to improve the quality of kiwifruit. This quest for constant improvement, innovation and excellence does not waver it is the cornerstone for ZESPRI s success. ZESPRI GOLD Kiwifruit is proof that the kiwifruit industry does not just sit back and watch the years go by. This delicious fruit was developed by Plant & Food Research (formerly HortResearch), and is now owned by ZESPRI. This innovative kiwifruit variety put ZESPRI at the forefront of the kiwifruit industry worldwide; ZESPRI GOLD Kiwifruit is now New Zealand s second-highest horticultural export earner after ZESPRI GREEN Kiwifruit. That s a pretty amazing feat to achieve in just 10 years on the market. In 2010, ZESPRI is working with growers to extend the selling season for ZESPRI GOLD Kiwifruit with the introduction of two new GOLD varieties. A new sweet GREEN variety has also been introduced, with the potential to attract new consumers to ZESPRI Kiwifruit. Other ways ZESPRI continues to strive for innovation excellence include: CONTENTS û û û û û û û û û û û Understanding our consumers and working to meet their needs Developing new varieties Understanding more about the unique health benefits of kiwifruit Finding new markets, customers and consumers Improving fruit quality Improving orchard profitability Improving supply chain efficiency Improving environmental growing methods Finding ways to reduce costs Understanding more about other kiwifruit production regions Improving the transfer of technical skills and knowledge to growers Annual Review PAGE About ZESPRI 1 ZESPRI 2009/10 2 Financial Highlights Season Overview 2 ZESPRI Group Limited Chairman & Chief Executive 3 Officer s Report John Loughlin and Lain Jager Growing the Category Responding to Market Signals 13 Investment in Innovation Marketing Platforms ü Brand ü Health ü New Varieties ü Sustainability ü Taste 12-month Customer Supply Growing the Category Enhancing Supply Management 16 Industry Decision-making and Co-operation Shipping Efficiencies Sales and Operations Planning Product Performance ZESPRI GREEN, GOLD & ORGANIC 18 Kiwifruit Key Highlights 2009/ /10 Market Performances Sustainability Growing a Better, Healthier Future 20 Soil Carbon Study Biogas Technology Shipping Sustainably Our People Global Team of Engaged 22 Employees ZESPRI Group Limited New Zealand Industry 24 Performance Alternative Revenue Statement Cause of Change Pool Costs Regional Production Analysis Total Fruit and Service Payments Industry Statistics ZESPRI Group Limited Office Directory 29


3 About ZESPRI As the market leader in kiwifruit, managing 30 percent of globally traded volume, ZESPRI carries a significant responsibility. We take this responsibility very seriously by focusing on: Growing consistently great-tasting, healthy kiwifruit; Growing the number of people around the world who regularly enjoy kiwifruit; and Growing returns for kiwifruit growers. Our shareholders are either current or past New Zealand growers and have an active voice in the strategic direction of the industry. In addition to our 2,700 New Zealand growers, we have partnered with over 1,200 offshore growers around the world to leverage our strong customer relationships and the ZESPRI Brand. In 2009/10, we sold 380,000 tonnes of premium-quality kiwifruit to 55 countries. We have 250 staff members across offices in Asia, Europe and North America, and our head office at the centre of New Zealand s kiwifruit region, Bay of Plenty. We work with growers and post-harvest operators to source top-quality ZESPRI Kiwifruit and supply this kiwifruit through our distribution partners to wholesale markets and retail customers. ZESPRI Annual Review 2009/10 1
4 ZESPRI 2009/10 Financial Highlights 2009/ /09 Variance New Zealand-grown fruit and service payments (including loyalty premium) $849.0 million $795.5 million +7% Per tray supplied $8.32 $ % Net profit after tax $25.9 million $23.9 million +8% New Zealand-grown Orchard Gate Return (OGR) per hectare $39,142 (average) $35,655 (average) +10% GREEN $29,561 $30,067-2% GREEN ORGANIC $39,403 $39,441 GOLD $83,094 $60, % Equity $77.9 million $74.0 million +5% Dividend per share (cents) The 2009/10 Interim dividend Final represents 78% (2008/09: 100%) Special* 7.41 of available profit Total ZESPRI global kiwifruit sales $1.501 billion $1.451 billion +3% ZESPRI global volume (trays sold) million million New Zealand-grown 98.5 million million -1% GREEN 71.9 million 72.7 million -1% GREEN ORGANIC 3.3 million 2.9 million +14% GOLD 22.0 million 21.9 million OTHER 1.3 million 2.5 million -48% Non-New Zealand-grown 9.8 million 8.7 million +13% GREEN 4.9 million 4.2 million +17% GOLD 4.9 million 4.5 million +9% * No special dividends were paid in the year ending 31 March A special dividend of 7.41 cents per share was paid in March 2009, this being the Company s 50 percent share of the ZESPRI GOLD licence tender proceeds for Tranche 3. Season Overview ZESPRI global kiwifruit sales increased by 3.4 percent to $1.501 billion, from $1.451 billion in 2008/09. Volumes of kiwifruit sold during 2009/10 were million trays 98.5 million from New Zealand and 9.8 million from other production regions. This was slightly down from the million trays sold in the prior year, due to impacts on the New Zealandgrown volumes from a successful crop-management programme and hail damage. New Zealand fruit and service payments (including loyalty premium) increased from $795.5 million to $849.0 million. Per tray, this resulted in an increase of 7.2 percent to $8.32 from $7.76 in 2008/09: a strong result given the underlying financial uncertainty during the season. The major factors that contributed to the increase in per-tray returns for New Zealand-grown kiwifruit were positive exchange rates, reduced costs (particularly fuel), successful marketing campaigns and strong industry collaboration. Notice of Annual General Meeting The Annual General Meeting of shareholders of ZESPRI Group Limited will take place at 1.00pm on Wednesday 18 August 2010 at Baycourt Theatre, Durham Street, Tauranga. New Zealand average Orchard Gate Return (OGR) per hectare increased by 10 percent to $39,142. While ZESPRI GREEN OGR decreased slightly and ZESPRI GREEN ORGANIC OGR remained relatively stable, the ZESPRI GOLD OGR increased 36 percent to an exceptional result of $83,094 per hectare. Profit before tax from non-new Zealand-grown kiwifruit increased by 46 percent to $8.6 million, from $5.9 million in 2008/09. The New Zealand Government announced in November 2009 a $35.7 million, seven-year co-investment with ZESPRI and the Foundation for Research, Science and Technology (FRST) to develop new kiwifruit varieties. In June 2010, ZESPRI announced that three new varieties of kiwifruit were being commercialised (two GOLD and one GREEN), and two red varieties entered pre-commercial grower block trials (the last stage prior to commercialisation). Total dividends for the year are cents per share, compared with cents in the previous year, representing 78 percent of available profit. Financial Calendar Financial year-end: March 2010 Annual Report issued: July 2010 Deadline for receipt of proxies for Annual General Meeting: pm, 16 August 2010 Annual General Meeting: pm, 18 August 2010 Indicative dates for dividend payments:... December (interim) and August (final) 2 ZESPRI Annual Review 2009/10

5 Chairman and Chief Executive Officer's Report John Loughlin and Lain Jager ZESPRI delivered an increase in sales revenue, industry returns and net profit in 2009/10: financial results that represent outstanding resilience in very challenging economic conditions. Any review of 2009/10 must start with reflection on what an extraordinary year it was a year that included what many economists are calling the worst financial crisis since the Great Depression of the 1930s. A crisis of confidence followed a collapse in the United States housing market. Financial markets and institutions came under extreme pressure and credit availability all but evaporated. Governments around the world were forced to make dramatic and unprecedented interventions that will have long-term consequences. The crisis resulted in a slowing of economies worldwide, a decline in international trade and low consumer confidence. Commodity prices fell, unemployment rates increased and many retailers moved towards value offerings. The global financial crisis coincided with excellent fruit-growing conditions in many countries and the combination of weak consumer demand and strong supply caused pressure on fruit pricing. In Europe, prices for many fruit items fell by 40 percent, some crops were not harvested and French growers undertook militant protest actions targeting foreign produce. Savage reductions in earnings were experienced by growers of kiwifruit in other countries and growers of other fruit in New Zealand. When considered in this context, ZESPRI s 2009/10 financial returns represent a very positive result, and reflect the benefits of the ZESPRI System, our long-term investment in trade and consumer marketing, our industry s cohesiveness and quality execution by the entire industry. These combined to protect growers returns and, as a consequence, protected ZESPRI s income. Strong Operational Decision-making In economic environments such as those faced in 2009, the focus shifts to damage minimisation. This requires a strong ability to proactively manage in crisis conditions. In 2009, the kiwifruit industry made a number of decisions that helped mitigate the impacts of the recession. Maximising the revenue potential of every market is an important aspect of ZESPRI s seasonal planning process, and this was even more critical in Early last year, ZESPRI initiated a proposal to crop-manage to ensure no market was oversupplied with fruit. This decision was made with a high level of support from the industry as it underlined its strong commercial focus. Shortly after the decision was made to crop-manage, many growers were impacted by severe hail events which further reduced supply. Again the industry pulled together in the face of unusual and adverse circumstances to manage both operational and grower equity issues effectively. Every year we ask more from growers and post-harvest partners, and every year they deliver. This is essential in maintaining dominance in the premium segment of the kiwifruit market and the associated pricing benefits. In 2009/10, we have successfully met our objectives to secure all-important early-season shelf-space in all of our key markets. Alongside our strategy for a strong and early start in all markets, we made some important decisions on pricing. It was important that we aligned pricing appropriately to ensure that our high-quality offering was perceived as being good value in a year of uncertainty and financial pressure. We dropped opening prices in local currencies and maintained an absolute focus on achieving weekly sales rates to sell through the inventory. Lain Jager ZESPRI Chief Executive Officer and John Loughlin ZESPRI Chairman Industry Collaboration Enabled Stable Results In challenging market conditions such as those faced in 2009, we see the real benefit of the Single Point of Entry (SPE) industry structure. With the strength of the New Zealand industry behind us, we were able to increase our investment in advertising and promotion for New Zealand-grown ZESPRI Kiwifruit from $69.4 million to $86.3 million, and continued to build on our strong brand profile and reputation for premium quality. Our integrated industry structure means we can quickly make significant strategic and operational changes. In 2009, this enabled us to respond to market conditions and allocate the crop accordingly, which reassured our trade customers that risk would be managed appropriately. The stability of the ZESPRI business had been remarked upon by those outside the business as extraordinary. While defending returns was a strong achievement in the 2009/10 economic conditions, directors and management remain highly focused on the imperative to lift GREEN returns. ZESPRI Annual Review 2009/10 3

6 Chairman and Chief Executive Officer's Report (continued) John Loughlin and Lain Jager Global Kiwifruit Sales Marketed by ZESPRI New Zealand-grown kiwifruit Non-New Zealand-grown kiwifruit 2001/ / / / / / / /09 $794.7 $5.7 $844.6 $16.2 $902.9 $8.2 $997.3 $24.9 $945.2 $45.9 $1,045.0 $80.4 $1,082.2 $81.6 $1,299.8 $ /10 $1,359.3 $141.8 NZD (m) NZ FRS figures 0.0to 2005/06 and NZ IFRS figures from / /10 Results ZESPRI global kiwifruit sales revenue increased from $1.451 billion in 2008/09 to $1.501 billion in 2009/10. ZESPRI reported a consolidated net profit after tax of $25.9 million for the year ended 31 March 2010, compared with $23.9 million in the year prior. ZESPRI global kiwifruit volumes sold decreased slightly from million trays in 2008/09 to million trays. Despite managing the season well, we were significantly impacted by fruit pricing in local currency terms, but the impact was offset by beneficial foreign exchange movements and lower oil costs. The movement in foreign exchange rates led to an increase of $76.4 million in returns to the industry, compared to the previous year. Average oil prices reduced from US$666 per tonne in 2008/09 to US$378 per tonne in 2009/10, contributing to a positive impact on costs for New Zealand-grown fruit of $37.5 million. Average fruit and service payments for New Zealand fruit (including the loyalty premium) increased from $795.5 million to $849.0 million. Orchard Gate Returns per hectare remained stable for GREEN and GREEN ORGANIC, with GOLD increasing by 36 percent to $83,094 per hectare, before orchard costs. This is a very good overall result in a year where many fruit growers around the world have been devastated by difficult markets, supply and demand imbalances and weak selling. We felt the impacts of the recession most heavily in our European and North American markets. Strong performances were achieved in Asian markets which were less affected by the economic crisis. Total Fruit and Service Payments New Zealand-grown kiwifruit (excluding loyalty premium) GREEN GREEN ORGANIC 600 GOLD OTHER NZD (m) / / / / / /10 NZ FRS figures to 2005/06 and NZ IFRS figures from 2006/07 4 ZESPRI Annual Review 2009/10
 over the last six years. There was a dip this year because of hail events and crop management. It is not only the New Zealand kiwifruit crop that is growing.")


7 Driving Value Back into the ZESPRI GREEN Business ZESPRI s single highest priority is driving value back into the ZESPRI GREEN Kiwifruit category. ZESPRI GREEN sales have grown by 12.8 million trays (or 21.7 percent) over the last six years. There was a dip this year because of hail events and crop management. It is not only the New Zealand kiwifruit crop that is growing. Over the last five years the Chilean crop has grown by an estimated 9 million trays and the Italian crop by approximately 34 million trays. This has occurred at a time when fruit consumption per capita is falling in most of the affluent countries of the world. ZESPRI GREEN Kiwifruit is not at the levels of profitability we would like to see. It is important to understand that the gap between ZESPRI GREEN and GOLD Kiwifruit returns is driven primarily by three factors: Market mix with proportionately less ZESPRI GREEN Kiwifruit (as a percentage of the total GREEN crop) going to Japan and proportionately more ZESPRI GREEN Kiwifruit being sold in marginal markets; Orchard yield with ZESPRI GOLD Kiwifruit yields 37 percent higher on average than ZESPRI GREEN Kiwifruit yields; and Growers can take heart from the improving outlook for ZESPRI GREEN Kiwifruit. The demand for ZESPRI GREEN Kiwifruit continues to grow at approximately five percent annually and in-market prices are expected to recover after an extraordinarily challenging Market price which for ZESPRI GREEN Kiwifruit is constrained to a greater extent by competition with Chile. ZESPRI continues to invest in research and technical transfer to increase ZESPRI GREEN Kiwifruit yields per hectare. ZESPRI GREEN Kiwifruit supply will be moderated to some extent by further grafting to ZESPRI GOLD, the new sweet GREEN variety, or other ZESPRI Kiwifruit varieties, in the 2010/11 and 2011/12 seasons. ZESPRI GREEN ORGANIC Growers Most Impacted by Recession The ZESPRI GREEN ORGANIC category felt the impacts of the global recession more than other categories due to a short-term shift by less-committed organic consumers towards cheaper conventional products. We anticipate some relief for this category as the economy recovers and as we grow our penetration in dedicated organic markets. ZESPRI GOLD Performs Strongly ZESPRI GOLD bucked the global trend in 2009 and delivered an outstanding result, reflecting where we are in the product life cycle. Stronger repeat purchasing from consumers is contributing to the success of ZESPRI GOLD, but significant also is the market mix: a third of the fruit went to the high-value market of Japan. Almost 50 percent of the increase in ZESPRI GOLD returns this year are attributable to a favourable movement in the New Zealand Dollar (NZD) to Japanese Yen exchange rate. For 2009/10, demand exceeded supply which led to strong market pricing and an early close to the season. We do expect returns for ZESPRI GOLD to soften over time, as the category grows, market mix normalises, competition increases and the NZD/Yen appreciates from historical low levels. ZESPRI Annual Review 2009/10 5


8 6 ZESPRI Annual Review 2009/10


9 Chairman and Chief Executive Officer's Report (continued) John Loughlin and Lain Jager ZESPRI Global Supply Increases Profits by 46 percent The ZESPRI Global Supply business delivered a 46 percent increase in profit before taxation, from $5.9 million in 2008/09 to $8.6 million in 2009/10. This was driven by strong market performance, greater operational stability in the key ZESPRI GOLD production regions of Europe and Asia, and the increased procurement of European ZESPRI GREEN Kiwifruit. We note that the rationale for this strategy is to strengthen the ZESPRI Brand and distribution network by ensuring a ZESPRI Brand presence for 12 months of the year, creating a 12-month partnership with our distributors, to provide our key customers with premium-quality ZESPRI Kiwifruit year-round. This is a real benefit for New Zealand growers in that it supports our initiative to sell New Zealand ZESPRI GREEN and GOLD volumes. The application of the strategy varies by market depending on a number of factors: The market s quality orientation we perform better in premium markets which are quality sensitive; Whether the market is supplied by domestically-grown kiwifruit; The strength of ZESPRI s distribution partners in that market; The product mix in the market; Market access constraints; and Market-specific political and commercial considerations. ZESPRI Group Limited Profitability Net profit as a % of revenue Net profit after tax (NPAT) NZD (m) ZGL NPAT NZD (m) 0.9% /02 1.7% /03 2.6% 2.6% 2.5% / / / /07 1.9% 1.7% 1.6% 1.7% / / /10 ZGL NPAT as % Revenue NZ FRS figures to 2005/06 and NZ IFRS figures from 2006/07 We will continue to grow the 12-month supply business in specific markets where it strengthens the ZESPRI Brand and distribution system and supports the sale of New Zealand kiwifruit. Our focus remains on growing demand and matching this with cost-effective, high-quality supply. In every production environment, we have encountered unique and specific challenges, which require targeted support, technical transfer and innovation. Of particular note this year was the challenge to our Italian supply due to the vine disease, batteriosi (see page 15), which is expected to reduce ZESPRI s Italian GOLD supply significantly in 2010/11. Costs Increased to Drive Sales and Grow the Business Facing tough economic market conditions, ZESPRI invested more heavily in 2009/10 on promotion than in the 2008/09 year. We focused the increase predominantly on driving ZESPRI GREEN sales in Japan, Europe and Korea: markets where we expected difficult sales conditions. A new television commercial (TVC) in Japan increased both sales rates and brand awareness. In Europe, with increased competition from Chile and a large overhang of Italian fruit in the market, we scheduled our TVCs earlier in Spain and the Benelux to kickstart our sales programmes and increase our weekly sales rate. In Korea, the significant movement in the KRW/USD exchange rate pushed retail pricing higher, so we increased our above-the-line advertising to ensure we could maintain reasonable sales rates, in line with our pricing. We continue to invest in human capability in the Company and during the year have added 10 extra roles into our offshore markets. These positions are focused on high-growth markets and represent an investment in the future as we extend our distribution reach. We have also added resource to our 12-month supply business to build capability as this business grows. The additional four positions in New Zealand are focused on new varieties, defending Turners & Growers deregulation agenda, and other strategic projects, such as sales and operations planning. A number of costs that fall outside of business-as-usual activities contributed to an increase in New Zealand overheads during the year under review. These costs, in excess of $1.9 million, were associated with the significant Bay of Plenty hail event in May 2009, new variety commercialisation, sales and operations planning processes and the defence of Turners & Growers deregulation attempts. Offshore costs increased by $5.9 million, with $4.7 million due to the movement in foreign exchange, and the remainder due to an increase in headcount and the cost of opening a new office in China. ZESPRI Annual Review 2009/10 7


10 Chairman and Chief Executive Officer's Report (continued) John Loughlin and Lain Jager Fast-tracking Innovation through Increased Investment ZESPRI invested $9.5 million in research and development in 2009/10, a 7.8 percent increase on the period prior. This is anticipated to continue to grow as we seek to: Bring new products to market; Build the science base to substantiate our health communication platforms and grow committed demand; Unlock further efficiencies in the supply chain; and Mitigate market-access-related risks. One of the highlights of the year was the announcement in November 2009 of a $35.7 million investment into our new variety breeding programme, conducted in partnership with Plant & Food Research. Funding contributors are the New Zealand Government entity Foundation for Research, Science and Technology (FRST) and ZESPRI. The investment by the New Zealand Government demonstrates its commitment to the New Zealand kiwifruit industry and has enabled the fast-tracking of the programme, with an increase in the number of seedlings screened each year. In June 2010, ZESPRI announced the commercialisation of three new varieties of ZESPRI Kiwifruit a new GOLD variety which has the ability to be sold earlier than ZESPRI GOLD, another new variety of GOLD which has the potential to extend the ZESPRI GOLD selling season, and a new sweet GREEN, which has the potential to attract new consumers to kiwifruit. ZESPRI also announced the intention to advance two red kiwifruit varieties into pre-commercial grower block trials the final stage of testing before commercialisation. These new variety decisions are very exciting and important announcements in the development of the New Zealand kiwifruit industry, and followed a very thorough process of testing and consideration. It is part of a decadelong programme to take ZESPRI and the New Zealand kiwifruit industry to the next stage of its development and it s realistic to anticipate more announcements of this nature in the years ahead. Foreign Exchange Volatility in 2009 Foreign exchange in 2009/10 was extremely volatile and we have seen significant movement in exchange rates during the year. Overall, the lower value of the New Zealand dollar generated an additional $76.4 million in New Zealand industry returns. Our hedging policy delivered a small gain in 2009/10 of $5.2 million after making a loss in 2008/09 as the currency fell. Significant levels of cover have been taken for future years and this is reflected in the unrealised $137.0 million in mark-tomarket gains on our balance sheet as at 31 March These gains reflect the difference between our hedged rates and the exchange rates as at that date. Trade Policy ZESPRI was pleased to accompany government officials on trade missions to the US and the Middle East during the past year, to host visiting dignitaries and to be present at the signing of the Free Trade Agreement (FTA) with Malaysia in October. The New Zealand Government continues to work hard on FTAs with Korea, India and the United States (through the Trans-Pacific Partnership). ZESPRI is strongly supportive as FTAs are beneficial for consumers and growers alike. Review of the ZESPRI Margin in 2009 One of the benefits of the SPE structure is leveraging ZESPRI s overheads against the scale of the business. As the volume of kiwifruit has increased, ZESPRI has been able to pass these benefits of scale back to growers through reduced commission costs per tray sold. For the 2010/11 season, ZESPRI s net commission on New Zealand-grown supply calculates to 7.3 percent of total net sales. This is a 32 percent reduction from 10 years ago when the commission was 10.7 percent. 1999/ / / percent net sales percent net return 6.0 percent net sales percent net return, less 15 cents per Class 1 TE loyalty 6.0 percent net sales percent net return, less 25 cents per Class 1 TE loyalty Total 10.7 percent Total 7.9 percent Total 7.3 percent For the 2010/11 season, it is estimated that ZESPRI s margin will be utilised as follows: Innovation investment ZESPRI overheads Profit before tax attributable to shareholders for New Zealand supply ZESPRI s net margin as a percentage of net sales for New Zealand-grown supply 0.7 percent 5.7 percent 0.9 percent 7.3 percent While it is appropriate to pass the benefits of scale back to growers, it is also important to continue to invest in the business. Investment in innovation has doubled from $4.8 million 10 years ago to $9.5 million in the 2009/10 season. In addition, we have invested and will continue to invest in human resources and information systems, in order to grow the business. Governance At the 2010 Annual General Meeting (AGM), to be held on Wednesday 18 August 2010, the directors to retire by rotation are Mark Bayly, John Loughlin and Peter McBride. Mark is not seeking re-election and will step down from the Board. The Board wishes to express thanks to Mark for his contribution to the industry. John and Peter are both seeking re-election. John has indicated to the Board his intention to commit to the industry for another three-year term, if re-elected at this AGM, before he will step down. This year, the Board has also decided to create a Director Remuneration Committee, featuring three shareholder representatives (to be elected by shareholders at this year s AGM), and a fourth member, appointed by the ZESPRI Board. The Committee will be tasked with reviewing and recommending director fees to shareholders at each year s AGM. Also the Board has announced an intention to complete a 1:5 share split in September This is to improve share alignment, enabling a closer match of one tray of production to one share, and to make shares more accessible for growers. A share issue and buy-back, such as the one conducted in 2005/06, is being considered also by the Board for 2011/12 or later. 8 ZESPRI Annual Review 2009/10


11 ZESPRI Annual Review 2009/10 9

12 Chairman and Chief Executive Officer's Report (continued) John Loughlin and Lain Jager Dividend For the past four years, ZESPRI has paid out 100 percent of available profits by way of dividend. In this time, annual revenues have grown 50 percent from $1.01 billion in 2005/06 to $1.54 billion in 2009/10 and investment in new varieties has also increased. ZESPRI currently has capital of $77.9 million and this capital is used both to fund the business and to ensure that ZESPRI can weather the risks inherent in its day-today business such as seasonal volume dips and litigation. One important aspect of ZESPRI s annual activity is that it can borrow up to $200 million annually as seasonal finance. This is to fund grower payments as the industry incurs the expense of harvesting and packing the crop before sales revenues start to flow. As industry volume grows, so do cash flow requirements and bank requirements for security. With strong future growth anticipated, the ZESPRI Board has adopted a policy to build the Company s capital base gradually over time. This will be done by paying dividends of between 70 percent and 90 percent of available profits annually, while retaining the remainder to build capital. The total capital required will be a reflection of business growth, so it is not possible to give a finite number, although we note the current capital-to-total-revenue ratio is at the lower end of what the Board considers to be prudent. The ZESPRI Board has announced an intention to declare a final dividend of 35 cents per share. This is in addition to the 35 cents per share interim dividend payment paid in December 2009 and will bring the total dividend for the year to 70 cents per share. This represents 78 percent of available profits. Shareholders should be reassured that the ZESPRI Board remains committed to paying a strong and stable dividend into the future. ZESPRI Group Limited Equity and Dividend Returned Dividend NZD Equity NZD (m) Equity NZD (m) $ /02 $ /03 $ /04 $77.0 $ / /06 $74.0 $77.9 $67.8 $ / / / /10 Strong Grower Association and Supportive Government New Zealand Kiwifruit Growers Incorporated (NZKGI) conducted a survey of growers in early 2010 and it was very pleasing to note the powerful grower endorsement of the SPE, where 90 percent of growers agreed that the SPE is critical for the future success of their industry. This compares with 84 percent in Within the survey results, it was also excellent to see strong support shown for NZKGI, which is delivering significant value for growers, particularly in regards to preserving the current industry structure. Dividend NZD NZ FRS figures to 2005/06 and NZ IFRS figures from 2006/07 In June 2010, ZESPRI shared with the New Zealand Prime Minister, Hon. John Key, our plan to triple export earnings to $3 billion by At that time, the Prime Minister reiterated his Government's support of the kiwifruit industry structure for as long as growers support it. He spoke positively of the industry's growth and recognised that other industries without a single desk seller weren't as successful as the New Zealand kiwifruit industry, and said he couldn't see any reason for change. ZESPRI employees are passionate about the work they do on behalf of growers and the industry. It was pleasing to have that work commended by the Minister for Agriculture, Hon. David Carter, during a visit to ZESPRI earlier this year. The Minister also congratulated the industry for being forwardthinking and demonstrating this through our strategy, people and operations. Outlook The short-term outlook is that the 2010 selling season started well and we are seeing modest recovery in most markets. While it is too early for a forecast, we expect some upside in local market returns in the coming year. Looking at the medium term, the Board has confirmed the CEO s priorities as follows: To build the Orchard Gate Returns for ZESPRI GREEN Kiwifruit to over $4.00 per tray on a 10-year average exchange rate basis; To continue to grow the ZESPRI GOLD Kiwifruit category strongly while we enjoy our first-mover advantage; To focus on extending the distribution of ZESPRI ORGANIC Kiwifruit to absorb the increased forecast volume and minimise the possible impact on sales and grower returns; and To successfully bring new products to market, thereby continuing to broaden the product portfolio, gain new consumers, earn additional shelf-space, and grow the category for the benefit of all growers. Our underlying focus on innovation and marketing as the drivers of both our sustainable competitive advantage and our growth, translates into our strategic plan which will be discussed in more detail with growers in August at the Annual General Meeting and the Momentum Kiwifruit Industry Conference. Thank you for your continued support. John Loughlin Chairman Lain Jager Chief Executive Officer 10 ZESPRI Annual Review 2009/10


13 ZESPRI Annual Review 2009/10 11

14

15 Growing the Category Responding to Market Signals A detailed understanding of our markets and a constant focus on the consumer enables ZESPRI to invest appropriately to build knowledge, programmes and products that will maintain and strengthen ZESPRI s position as the world leader in kiwifruit and deliver maximum value to our growers. Our key platforms for growth are innovation, marketing and 12-month supply. Targeted Investment in Innovation ZESPRI s investment in research and development (R&D) has increased over the past ten years, both in absolute dollar terms and as a percentage of total revenue. ZESPRI s $9.5 million R&D investment is tightly controlled and focused on the nine key areas we believe will drive the greatest growth: Consumer sensory ensuring ZESPRI products and product development are aligned with the taste expectations of consumers. Health and nutrition strengthening ZESPRI s natural protection communication platform, supported by robust research. Market access contributing to the effective mitigation of technical market access issues, such as pest-free supply. New varieties developing new and distinct varieties to invigorate the category and maximise profitability for growers. Orchard profitability increasing orchard profitability in line with market demands. Fruit quality finding ways to deliver better quality fruit to our customers and consumers. Supply chain performance developing processes and tools to maintain fruit quality, reduce fruit loss and lower supply chain costs. Sustainability developing tools and technologies to position ZESPRI as a world leader in sustainable practices. Global supply understanding and enhancing productivity in each of our offshore production regions. Strong Marketing Platforms ZESPRI concentrates marketing efforts in five key areas to retain our premium market position: Brand The ZESPRI Brand is a mark of excellence for customers and consumers worldwide. In 2008, ZESPRI developed a new brand architecture to futureproof our product portfolio and ensure easy visual navigation of the brand and products. As part of this, we have identified three tiers within the product portfolio: specialty, mainstream and value branded offerings. In 2009, ZESPRI consolidated K1W1 and D lish to create the new value brand, Family Kiwi. ZESPRI GREEN, GOLD and ORGANIC Kiwifruit currently occupy the mainstream tier of the brand architecture, and new varieties that are unique and highly valued will occupy the specialty brand tier. Health Health is second only to taste as a key driver of repeat kiwifruit purchase. Research has identified health and nutrition as the most immediate marketing opportunity to capture additional value. Health and nutrition is the second largest R&D investment for ZESPRI behind new varieties. In 2010, ZESPRI will make significant progress towards being able to release three significant health studies which support ZESPRI s global health positioning that ZESPRI Kiwifruit can help strengthen natural defences. Health messages to support research and development outcomes will be developed for use in-market to give our consumers and customers compelling new reasons to buy more ZESPRI Kiwifruit. ZESPRI Annual Review 2009/10 13


16 Growing the Category (continued) Responding to Market Signals New Varieties ZESPRI s kiwifruit plant breeding programme with Plant & Food Research is the world s largest and most advanced, with over 75,000 potential new varieties. In 2009, the New Zealand Government announced a seven-year, $35.7 million partnership with ZESPRI to develop new kiwifruit plant varieties. Through this partnership, ZESPRI will lift the size of the programme even further, to over 100,000 potential new varieties, with the aim of identifying five to seven new varieties from this population that will ultimately be released to New Zealand kiwifruit growers. During the next seven years the New Zealand kiwifruit industry will learn how to grow and evaluate new varieties more efficiently and how to establish and convert to new varieties more quickly than ever before, and start to produce and trial some exciting new products. Our robust processes mean that ZESPRI will commercialise a new variety only if it meets strict commercialisation criteria and exceeds customer expectations for taste and quality. ZESPRI s process is consumer driven and extensive research is carried out across the globe to identify consumer preferences and market opportunities. Successful varieties must also withstand the rigours of the orchard and supply chain picking, sorting, packing, transport, storage, retailing and purchase. While many different traits need to be measured, any new variety must deliver superior returns to ZESPRI growers. Developing a new kiwifruit variety is easy. Developing the world s best variety is a challenge and requires specialist expertise and rigorous controls and processes. ZESPRI s robust evaluation process ensures the product can stand up to the high standards demanded by customers and is economically viable to produce and market. ZESPRI, together with Plant & Food Research, has the world s largest, most advanced and longest running kiwifruit breeding programme. Parental Development 1 YEAR Seedling 4-5 YEARS Clonal Trials 2-4 YEARS ZESPRI, in partnership with Plant & Food Research, selects promising 'parent' vines with desired commercial attributes identified through significant consumer research such as good fruit size and taste, and through the process of pollination is able to produce seeds that combine the best attributes of each parent. ZESPRI employs only natural breeding techniques. ZESPRI chooses not to research, develop or market genetically engineered kiwifruit. Multiple seeds are germinated under controlled conditions. Each female seedling is a potential new variety. Seedlings are monitored and assessed for fruit taste, size, shape, storage capabilities and shelf life as they grow. ZESPRI currently has 75,000 potential new varieties in our kiwifruit breeding programme and over 100,000 potential new varieties will be evaluated during the next seven years. Top-performing seedlings are grafted onto existing rootstock on seven trial sites across New Zealand. This is done in partnership with ZESPRI Kiwifruit growers. After two years, the vines produce their first fruit for testing and evaluation, including yield, resistance to pests and disease, harvest and eating windows and cost of production. Promising new varieties are selected. ZESPRI currently has 54 potential new varieties in clonal trials. ZESPRI GOLD Kiwifruit is now worth over $525 million in global revenues, making it the most successful new variety released by any horticultural company in the past decade. In June 2010 ZESPRI made the strategic decision that the next best step to grow the business is to strongly grow the GOLD product line, and released two new varieties of gold kiwifruit to extend the selling season. Pre-commercial Trials 2-4 YEARS Promising new varieties are taken to pre-commercial grower block trials about 0.25ha per site: approximately 10ha per variety in total throughout New Zealand. The potential new varieties undergo extensive evaluation of their on-orchard, in-market and supply chain performance to determine whether it makes good commercial and economic sense to commercialise them. ZESPRI applies for Plant Variety Rights for the new variety (where appropriate). Following a Board decision in June 2010, two new varieties are now in pre-commercial block trials. ZESPRI will only commercialise a new kiwifruit variety if it meets strict commercialisation criteria and exceeds customer expectations for taste and quality. The ZESPRI Board makes a commercialisation decision based on the variety s potential to add value to the New Zealand kiwifruit industry. The new variety is progressively released to ZESPRI growers for commercial scale production. 14 ZESPRI Annual Review 2009/10


17 In addition, ZESPRI GREEN Kiwifruit is by far the volume driver and backbone of the industry, and in June 2010 ZESPRI also commercialised a new sweet GREEN variety for targeted release into key markets to attract new consumers to kiwifruit and generate future growth for the GREEN category. This decision follows a 10-year development programme by ZESPRI, in association with Plant & Food Research and partly funded by the New Zealand Government, four years of on-orchard, storage, shipping and taste tests in New Zealand, Europe and Japan, and extensive work with growers and international customers and consumers. Consumer taste tests, involving 1,500 consumers from Japan and Germany over the past three years, have provided extremely strong indicators of consumer acceptability and excitement about the new GOLD varieties and the sweet GREEN variety. Future plantings will be subject to on-orchard, storage, supply chain and market performance of each variety during successive seasons. As part of the June 2010 commercialisation decision, ZESPRI also announced that a further two new varieties will be advanced to pre-commercial grower block trials, both red kiwifruit varieties, which are now on the shortlist for commercialisation in the next 2-3 years. Sustainability Sustainability is expected to play a significant role in the future competitive advantage of companies. A focus on environmental, social and economic sustainability is critical to ZESPRI retaining its position as the world s leading marketer of kiwifruit. Our research in this area is focused on three areas of activity: quantifying our environmental footprint; assessing the environment-based risks and opportunities for our industry; and developing the tools to adapt our industry to respond to these risks and opportunities. For more information about some of the projects under way in this area, please refer to page 20. Taste Market research has shown repeat purchase of ZESPRI Kiwifruit is heavily influenced by taste and consistency. The Taste ZESPRI Programme ensures customers consistently receive delicious kiwifruit by providing payment incentives to growers who produce great-tasting kiwifruit. ZESPRI works closely with growers to provide orchard management tools and research that can help improve dry matter levels in kiwifruit a key indicator of great taste. Supplying Customers for 12-Months of the Year The global supply programme supports ZESPRI s brand and distribution network by partnering with growers around the world, to supply consumers with premium-quality kiwifruit, outside of the New Zealand supply window. This ensures that the ZESPRI Brand is on selected retailers shelves for 12-months of the year. ZESPRI continues to focus on the productivity drivers yield, size and quality and on research and development targeting orchard performance, long storage and disease mitigation. Northern hemisphere ZESPRI GREEN Kiwifruit volumes will also increase with improvements to our procurement model allowing ZESPRI to supply more European markets and, potentially, other strategic markets further afield. In 2008/09, the first symptoms of Pseudomonas Syringae Actinidiae (batteriosi), a bacterial disease affecting green and yellow-fleshed varieties of kiwifruit, were observed by ZESPRI in the Italian region of Latina. In early 2010, batteriosi had devastating effects on kiwifruit production, including ZESPRI GOLD. Adverse weather conditions in other regions will also have a significant impact on the 2010 crop. ZESPRI Annual Review 2009/10 15


18 Growing the Category Enhancing Supply Management Ensuring the supply of premium-quality, great-tasting kiwifruit to our customers is crucial to maintaining our position as the world s leading marketer of kiwifruit and creating future opportunities for growth. To achieve this, we must deliver what customers want, when and where they want it, at minimum cost. 16 ZESPRI Annual Review 2009/10


19 Strong Industry Decisionmaking and Co-operation The 2009/10 season began earlier than ever before and while we faced significant challenges, strong decision-making and co-operation across the industry ensured smooth operational performance. In late 2008, it became clear that the economic recession coupled with high crop volumes would create an excess of supply over demand for the 2009/10 season. ZESPRI, together with our supply partners, made a number of decisions, including the crop management of a volume of surplus kiwifruit. On 11 May 2009, 350 orchards in the Bay of Plenty, covering 660 hectares, were hit by hailstorms causing damage to fruit on the vine. The kiwifruit industry rallied together to support hail-affected growers, with ZESPRI and growers making contributions to a hail compensation fund. The industry also reversed some earlier crop management decisions to counter the effects of the hailstorms. In the 2009/10 season, our supply partners worked hard to ensure 95 percent of ZESPRI s export crop was delivered in full, on time and within specification, exceeding our 90 percent target. ZESPRI is confident of achieving our target again in 2010, based on the successful 2010 Supply Agreement process where the industry demonstrated a significant commitment to achieving the best possible outcomes. Shipping Efficiencies In the past 18 months, overall container capacity from New Zealand has reduced by approximately 20 percent, requiring ZESPRI to make the most efficient use of available resources. In 2009/10, ZESPRI moved to further optimise our use of charter vessels, maximising the available capacity by increasing the number of containers on deck. This has provided more flexibility to increase or decrease volumes based on market demand. In May 2009, we were able to secure the reefer ship, Sunbelt Spirit, a refrigerated cargo carrier, for the largest-ever single shipment of ZESPRI Kiwifruit: 7,300 pallets. ZESPRI is in the unique position of being one of the only New Zealand exporters able to co-ordinate this kind of volume to capture such an opportunity and benefit from the associated cost efficiencies. In 2009/10, ZESPRI introduced ship by rules for KiwiStart ZESPRI GOLD Kiwifruit to combat faster softening of early-harvested fruit, significantly reducing in-market quality issues. For 2010/11, ZESPRI has introduced ship by rules for KiwiStart ZESPRI GREEN Kiwifruit. In addition to these efficiencies, ZESPRI is working with the New Zealand Shippers Council, alongside other major New Zealand exporters, to explore long-term options to achieve efficiencies and reliability in New Zealand s supply chain infrastructure. Efficiencies in Sales and Operations Planning Last year was the first year of the three-year Sales and Operations Planning Project, involving team members from the markets right through the supply chain, including suppliers. The project is a game plan for how we, as an industry, can best manage the supply chain to provide the right products, in the right locations, at the right time, to satisfy customer demand at the lowest possible cost and with the most efficient use of assets. The project began by reviewing and designing agreed processes for translating market demand into operating and supply plans. A number of these plans have been implemented for the 2010/11 season and the remaining processes will be rolled out over the next year. In Southeast Asia, ZESPRI is focused on developing logistics and operations capability to support the rapid growth in this market. To this end, we have increased our in-market resource and continue to provide operational support from New Zealand. In 2010/11, the Sales and Operations Planning Project will focus on the selection of enhanced planning tools to ensure we have the necessary foundations and infrastructure to support future growth in the industry. KiwiStart is an incentive payment for growers designed to provide great-tasting fruit for early season sales. Ensuring an early start for ZESPRI Kiwifruit in key markets helps ZESPRI to secure shelf-space ahead of competitors and ensure a seamless transition between ZESPRI s New Zealand-grown and non-new Zealand supply seasons in our 12-month supply markets. KiwiStart has had a number of successes over the past two seasons: In 2009, early KiwiStart fruit added incremental value in the midst of the economic recession. In 2010, the dry summer resulted in a large volume of small early-season fruit. The entire industry responded quickly and collaboratively to amend KiwiStart rates to encourage larger-sized fruit to be submitted and discourage the harvest of smaller-sized fruit. Almost immediately following the announcement there was a dramatic rise in size profile. ZESPRI Annual Review 2009/10 17


 per hectare for ZESPRI GREEN Kiwifruit growers remained stable through the year, amounting to $29,561, which was slightly down on 2008/09 returns")
20 Product Performance ZESPRI GREEN, ZESPRI GOLD and ZESPRI ORGANIC Kiwifruit ZESPRI GREEN Kiwifruit Key Highlights 2009/10 Returns for ZESPRI GREEN Kiwifruit growers remained generally stable amidst the global economic crisis. This can largely be attributed to the strong performance of growers, post-harvest operators, ZESPRI and its partner distributors, and the benefits of the Single Point of Entry industry structure. Asia performed very strongly in 2009/10, with China driving the volume growth, up 33 percent on 2008/09, as marketing investment was increased and new distribution opportunities secured. In 2009, the focus in Japan was on rebuilding customer enthusiasm in ZESPRI GREEN. This was achieved through the high quality and taste of our fruit, the tighter management of inventory and a stronger promotional programme which included a new ZESPRI GREEN TV commercial, focusing on health. For the first time, sales of non-new Zealand ZESPRI GREEN Kiwifruit sold in Europe reached 4.9 million trays. 2009/10 Market Performance A total of 71.9 million trays of ZESPRI GREEN Kiwifruit were sold globally in 2009/10, down slightly on the 2008/09 record volumes of 72.7 million trays. This decrease was not unexpected given the impact on demand from the economic recession and grower's corresponding decision was to crop-manage a volume of kiwifruit. Following the significant hail events which struck the Bay of Plenty in May 2009 the crop management programme was cancelled. Our ability to maintain our high ZESPRI standards throughout the supply chain in 2009, alongside the strength of our business model, was fundamental to ZESPRI having to absorb only slight price decreases across key markets. We achieved the highest relative price premiums across Europe, as Chilean competitors and other fresh fruit marketers were more heavily impacted by the prevailing market conditions. Some other kiwifruit marketers discounted up to 40 percent on 2008/09 sale prices to move volume. ZESPRI has a broad range of markets at varying stages of maturity, in different economic zones, providing the flexibility to optimise our volumes, which was extremely beneficial in the economic climate in Average Orchard Gate Returns (OGR) per hectare for ZESPRI GREEN Kiwifruit growers remained stable through the year, amounting to $29,561, which was slightly down on 2008/09 returns of $30,067. While we did not see a large deterioration in returns for GREEN growers, our current return level is still not satisfactory, and improving GREEN returns is fundamental for ZESPRI in the future. ZESPRI ORGANIC 2009/10 Market Performance A total of 3.3 million trays of ZESPRI GREEN ORGANIC was sold in the 2009/10 season, along with 415,000 trays of ZESPRI GOLD ORGANIC, representing a 16 percent growth in sales volumes across the ZESPRI ORGANIC category. The 2009 season was challenging, with supply increases driven through orchard conversions to organics and improved yields, at a time when world markets were suffering from the effects of the global economic crisis. ZESPRI s markets across Europe and Asia responded to the challenge, achieving growth at a time when the global fruit trade reduced both in volume and value. 18 ZESPRI Annual Review 2009/10


21 ZESPRI GOLD Kiwifruit Key Highlights 2009/10 Average Orchard Gate Returns improved significantly for ZESPRI GOLD Kiwifruit growers, from $60,885 per hectare in 2008/09 to an impressive $83,094 in 2009/10 a 36 percent increase. China experienced strong growth, with distribution and infrastructure gains in China resulting in sales volumes increasing by 38 percent on 2008/09. In 2009/10, ZESPRI introduced ship by rules for early season ZESPRI GOLD Kiwifruit, which helped to reduce fruit loss from 4.4 percent in 2008/09 to 3.7 percent in 2009/10 and resulted in an additional 100,000 trays of ZESPRI GOLD Kiwifruit being available for sale in-market. Kiwifruit Key Highlights 2009/10 ZESPRI GREEN ORGANIC delivered average Orchard Gate Returns of $39,403 per hectare in 2009/10, only slightly down on 2008/09 returns of $39,441, despite the difficult economic climate. ZESPRI remains New Zealand s leading organic exporter by value. Our organic sales volumes in Europe showed resilience during the economic recession with 1.4 million trays sold, reflecting a 9.4 percent increase in sales volume. This is a strong result against a background of subdued organic consumer demand due to the economic recession. 2009/10 Market Performance The 2009/10 ZESPRI GOLD Kiwifruit season was characterised by strong, steady market demand, with short supply. At 22.0 million trays sold, sales volumes for ZESPRI GOLD Kiwifruit increased across a number of ZESPRI s key markets, compared with the 2008/09 period, with a particularly impressive increase in China including Hong Kong. Orchard Gate Returns for ZESPRI GOLD growers increased significantly to an average of $83,094 per hectare, from $60,885 per hectare in 2008/09. This impressive result was primarily due to the positive NZD/Yen exchange rate, maximised by an additional 216,000 trays of ZESPRI GOLD Kiwifruit sold in Japan. Japan was another highlight with strong early sales and new customer programmes driving a 7.5 percent increase in ZESPRI GREEN ORGANIC sales. Japanese customers also consumed more than half of the ZESPRI GOLD ORGANIC volume. Key distribution and retail relationships have been managed very closely by ZESPRI s team in Japan. The improving taste and low fumigation rates have built customer confidence in ZESPRI ORGANIC Kiwifruit, which has flowed through to increased sales. Southeast Asia experienced positive growth, with ZESPRI GREEN ORGANIC sales increasing more than 300 percent from 17,000 trays in 2008/09 to 75,000 trays in 2009/10, through broader distribution. ZESPRI s organic portfolio featured strongly at the Organics Aotearoa New Zealand (OANZ) Industry Conference at Waikato University in November. ZESPRI Annual Review 2009/10 19


22 Sustainability Growing a Better, Healthier Future ZESPRI, and the wider New Zealand kiwifruit industry, has a strong heritage in environmental innovations. Our focus on sustainability continues to gain momentum due to increased awareness of the need to nurture the environment. ZESPRI is working with growers, and our supply chain and research partners, to develop and implement a range of sustainability initiatives, some of which are included below. Soil Carbon Study A three-year soil carbon study is under way to understand the implications of various orchard management techniques on soil carbon levels. The study will enable the industry to develop techniques to reduce our carbon footprint and boost soil carbon, improving soil health and fertility. Initial findings indicate that soils under the cultivation of kiwifruit actively remove greenhouse gas emissions from the atmosphere. By building soil carbon, the soils also enhance their water retention properties, fertility and nutrient levels, and ultimately produce better kiwifruit. Understanding Biogas Technology Biogas technology is considered the most efficient way to harvest energy from the sun which is stored in plants in the form of cellulose, starch and sugars. Kiwifruit is regarded as a good feedstock for biogas production. ZESPRI commissioned a study to investigate the lowering of non-renewable energy inputs within the ZESPRI value chain by using distributed biogas plants to recover the energy and nutrients from waste kiwifruit. The study made comparisons between three different locations and configurations of biogas plants, analysing both greenhouse gas and cost benefit implications. The study found kiwifruit orchards which include additional land area for energy biomass crops have the potential to reduce greenhouse gas emissions by 31 percent on orchard and 10 percent in-market, if applied broadly across the industry. Growers may need to source waste fruit from neighbouring properties to fully utilise this technology. Shipping Sustainably Sea freight is the most efficient way to transport our kiwifruit to our markets. It is cost efficient, more environmentally friendly than air freight and offers significant opportunities to further reduce our environmental footprint. ZESPRI ships nearly all of its kiwifruit to Europe on highly efficient refrigerated vessels (reefers). A recent study analysing the carbon footprint implications of kiwifruit transportation from New Zealand to Europe, using various shipping options, found reefer shipping is 27 percent more carbon efficient than container shipping. When onshore logistics are included, reefer shipping is 36 percent more carbon efficient. Carrying containers on the decks of reefer vessels has improved the efficiency of our European shipping programme by optimising the volume of fruit moved per shipment and reducing emissions by up to eight percent. 20 ZESPRI Annual Review 2009/10

23 ZESPRI Annual Review 2009/10 21


24 Our People A Global Team of Engaged Employees ZESPRI employs over 250 people in 17 countries, with a wide range of skills and a commitment and passion synonymous with the New Zealand kiwifruit industry. ZESPRI prides itself on being a fantastic place to work, making it easier to attract and retain our talented, dedicated workforce. Looking After Our People ZESPRI takes the health and well-being of our employees seriously and offers a number of benefits to ensure a happy, healthy workforce and maintain our high rates of employee engagement and retention. In October 2009, ZESPRI organised a month of activities for New Zealand staff to promote health and well-being, from free health and fitness assessments to financial discussions, fitness classes and sight and hearing tests. In addition to standard benefits such as KiwiSaver, ZESPRI offers New Zealand permanent staff benefits such as life, total and permanent disablement and income protection insurance, counselling support and flexibility with working hours. ZESPRI also supports staff sports teams and has an active social club to encourage teamwork, communication and co-operation across the Company and in our community. At seven percent, ZESPRI s permanent employee turnover rate is one-third lower than the New Zealand average of 10 percent. ZESPRI prides itself on being a supportive workplace which encourages initiative, energy, strong interpersonal skills and personal ownership from each of its employees. ZESPRI actively encourages internal development and promotion. Last year almost 30 percent of ZESPRI s New Zealand vacancies were filled by internal applicants an additional 23 percent of our vacancies were filled through word of mouth, keeping recruitment costs to a minimum. 22 ZESPRI Annual Review 2009/10


25 ZESPRI Annual Review 2009/10 23
 (79,946) (54,350) Net sales of New")
 2,141 2,853 4,480 Hail self-insurance 2 2,801 441 1,481 IAC approved")
26 ZESPRI Group Limited and Subsidiaries 2009/10 New Zealand Industry Performance Annual Review for year ended 31 March 2010 ZESPRI Alternative Revenue Statement 2009/ / /08 $ 000 $ 000 $ 000 NZ IFRS NZ IFRS NZ IFRS Gross sales of New Zealand-grown kiwifruit 1,421,923 1,367,227 1,126,079 Promotional rebates, claims and discounts (74,833) (79,946) (54,350) Net sales of New Zealand-grown kiwifruit 1,347,090 1,287,281 1,071,729 Sales through collaborative marketers 12,182 12,558 10,441 Other pool income 1,862 4, Revenue attributable to New Zealand pools 1 1,361,134 1,303,999 1,082,356 Less pool costs: Freight 138, , ,026 Insurance (onshore and offshore excluding hail) 2,141 2,853 4,480 Hail self-insurance 2 2, ,481 IAC approved additional hail funding 2 1, Duty and customs 76,120 76,991 70,254 Other direct pool costs onshore 28,301 29,605 23,911 Other direct pool costs offshore 67,952 63,235 51,395 Promotion 86,271 69,384 61,374 Interest (income)/charge 3 (277) 3,394 1,940 KNZ fees NZKGI funding Total pool costs 403, , ,695 Return from fruit sales 957, , ,661 Distributed as New Zealand fruit and service payments 833, , ,254 ZESPRI margin 5 123, ,221 97,407 Other non-pool revenue 1,340 2,815 3,034 Research grant co-funding ZESPRI income attributable to New Zealand-grown kiwifruit 124, , ,647 Onshore costs: Innovation 6 9,062 8,570 9,910 Corporate hail funding Onshore overheads 32,817 30,887 29,244 42,379 39,457 39,154 Offshore costs 43,548 37,669 33,894 38,835 43,078 27,599 Add operating surplus/(deficit) from other business units: Processed fruit product (before taxation) 7 (553) (1,125) (284) Non-New Zealand-grown supply (before taxation) 7 8,552 5,862 3,534 Income from sale of ZESPRI GOLD licences (before taxation) 5,701 2,327 4,695 EBIT before loyalty premium 52,535 50,142 35,544 Net interest income 4,238 5,028 5,409 ZESPRI profit before tax and loyalty premium 56,773 55,170 40,953 Loyalty 10 cents per Class 1 tray 10,060 10,015 6,190 Enhanced loyalty premium 982 6,517 - Board-approved loyalty premium top-up 4,048-3,093 15,090 16,532 9,283 ZESPRI Group profit before taxation 41,683 38,638 31,670 Tax expense 15,793 14,704 11,940 ZESPRI Group profit after taxation 25,890 23,934 19,730 Total fruit and service payments 833, , ,254 Loyalty premium 15,090 16,532 9,283 Total fruit and service payments (including loyalty premium) 849, , ,537 The Alternative Revenue Statement is used for management information and is the basis for the calculation of the Supplier Return. Foreign exchange gains and losses are allocated differently from the way that they are allocated in the Financial Statements in that they are apportioned to the relevant line items above. The Alternative Revenue Statement is consistent with the business segment analysis in Note 30 of the Financial Statements within the ZESPRI Annual Report 2009/10. Notes 1 to 7: Refer to page ZESPRI Annual Review 2009/10
 795,538 The cause of change Add ZESPRI net profit after tax 2008/09 23,934 chart outlines the increase in the Return to industry")
 Foreign Exchange 76,467 Volume (1,435) Price (52,667) Return to industry 2009/10 874,902 $ 000 Total fruit and service payments 2009/10 833,922 Add ZESPRI")
27 Cause of Change 2009/10 vs 2008/09 $m Taxation Freight Other income/costs Foreign exchange Volume Price (52.7) (3.3) (1.1) (1.4) Total 55.4 Total fruit and service payments 2008/09 (including loyalty premium) 795,538 The cause of change Add ZESPRI net profit after tax 2008/09 23,934 chart outlines the increase in the Return to industry 2008/09 819,472 return to the industry this season to Movements due to change in: $874.9 million from Taxation (1,089) $819.5 million in 2008/09. Freight 37,497 Other income/costs (3,343) Foreign Exchange 76,467 Volume (1,435) Price (52,667) Return to industry 2009/10 874,902 $ 000 Total fruit and service payments 2009/10 833,922 Add ZESPRI loyalty premium 2009/10 15,090 Total including loyalty premium 2009/10 849,012 Add ZESPRI net profit after tax 2009/10 25,890 Return to industry 2009/10 874,902 New Zealand Pool Costs as a Percentage of Pool Revenue 2009/ / /08 ZESPRI margin (net of loyalty premium) 5 7.9% 7.7% 8.1% Freight 10.1% 12.3% 10.9% Insurance 0.5% 0.3% 0.6% Duty and customs 5.6% 5.9% 6.5% Other onshore direct costs 2.1% 2.3% 2.2% Other offshore direct costs 5.0% 4.8% 4.7% Promotion 6.3% 5.3% 5.7% Interest 3 0.0% 0.3% 0.2% KNZ/NZKGI 4 0.1% 0.1% 0.1% Total fruit and service payments (including loyalty premium) 62.4% 61.0% 61.0% 100% 100% 100% Revenue attributable to New Zealand pools ($ 000) 1 1,361,134 1,303,999 1,082,356 1 Net revenue attributable to the pools includes sales of New Zealand-grown kiwifruit, income from collaborative programmes and other pool income as noted in the Alternative Revenue Statement. 2 Pool and Corporate contributions to hail-affected growers have come from the following three sources: $2.8 million from the self-insured facility, $1.4 million additional pool funding approved by the Industry Advisory Council (IAC) and a ZGL Corporate contribution of $0.5 million. 3 The interest income is made up of the following: interest income of $0.9 million, interest paid of $0.3 million and an interest charge from ZESPRI of $0.3 million. This results in an overall interest income to the pools of $0.3 million. 4 Kiwifruit New Zealand (KNZ) is a statutory board appointed under regulation 39 of the Kiwifruit Export Regulations New Zealand Kiwifruit Growers Incorporated (NZKGI) is a kiwifruit grower representation body. NZKGI funding includes industry good activities of $57,774 (2008/09: $89,846). 5 ZESPRI margin is calculated in accordance with the New Zealand Supply Agreement, being 6.0 percent (2008/09: 6.0 percent, 2007/08: 6.0 percent) of net sales (excluding collaborative marketing programmes) and 6.0 percent (2008/09: 6.0 percent, 2007/08: 6.0 percent) of fruit payments to suppliers. 6 The Innovation result is net of a Research and Development Tax Credit expense of $75,000 (2008/09: $925,000 income, 2007/08: $Nil). 7 Further analysis of non-new Zealand-grown supply and Aragorn (processed fruit product) is available within the segment reporting in Note 30 of the Financial Statements. ZESPRI Group is winding down its direct involvement in the processed fruit business. ZESPRI Annual Review 2009/10 25
28 ZESPRI Group Limited and Subsidiaries 2009/10 (continued) New Zealand Industry Performance Annual Review for year ended 31 March 2010 New Zealand Regional Production Analysis 2009/ / / /07 Producing Producing Producing Producing hectares TE/HA* hectares TE/HA* hectares TE/HA* hectares TE/HA* ZESPRI GREEN Kiwifruit Northland 283 6, , , ,290 Auckland 456 7, , , ,043 Bay of Plenty Katikati 1,254 7,618 1,294 7,411 1,282 7,265 1,290 6,085 Opotiki 585 7, , , ,051 Tauranga 1,310 8,178 1,305 8,125 1,314 7,774 1,296 6,040 Te Puke 4,026 8,133 3,904 8,451 3,797 7,921 3,659 6,763 Waihi 168 6, , , ,569 Whakatane 620 5, , , ,492 Waikato 255 6, , , ,001 Poverty Bay 166 6, , , ,314 Hawke s Bay 117 5, , , ,763 Lower North Island 88 6, , , ,293 South Island 543 5, , , ,785 Total producing hectares 9,871 9,766 9,675 9,479 Average TE supplied per hectare 7,495 7,649 7,241 6,275 ZESPRI GREEN ORGANIC Kiwifruit Northland 5 1, , ,792 Auckland , , ,703 Bay of Plenty Katikati 27 6, , , ,002 Opotiki 20 4, , , ,655 Tauranga 210 7, , , ,146 Te Puke 85 6, , , ,595 Waihi 3 7, Whakatane 6 4, , , ,855 Waikato 122 6, , , ,702 Poverty Bay 6 7, , , ,111 Hawke s Bay 1 4, , ,109 Lower North Island 4 4, , , ,640 South Island 16 4, , , ,221 Total producing hectares Average TE supplied per hectare 6,661 6,088 6,427 5,199 ZESPRI GOLD Kiwifruit Northland 195 8, , , ,846 Auckland 68 10, , , ,299 Bay of Plenty Katikati 155 8, , , ,381 Opotiki , , , ,761 Tauranga , , , ,037 Te Puke , , , ,308 Waihi 17 8, , , ,010 Whakatane 58 9, , , ,729 Waikato 67 9, , , ,860 Poverty Bay 79 7, , , ,423 Hawke s Bay 40 8, , , ,159 South Island 31 9, , , ,492 Total producing hectares 2,149 2,091 2,060 2,032 Average TE supplied per hectare 10,287 10,761 9,618 8,390 * TE/HA = tray equivalent supplied to ZESPRI for export per hectare. Producing hectares includes all hectares producing fruit in the relevant season. Hectares that were 100 percent affected by hail have been excluded from the productive hectares. 26 ZESPRI Annual Review 2009/10
29 New Zealand Total Fruit and Service Payments (including loyalty premium) Return $million $ per TE $ per TE $ per TE $ per TE 2009/ / / / /07 NZ IFRS NZ IFRS NZ IFRS NZ IFRS NZ IFRS ZESPRI GREEN Kiwifruit Total tray equivalents supplied (m) Fruit payments Fruit incentives Service payments Loyalty premium Total fruit and service payments (including loyalty premium) ZESPRI GREEN ORGANIC Kiwifruit Total tray equivalents supplied (m) Fruit payments Fruit incentives Service payments Loyalty premium Total fruit and service payments (including loyalty premium) ZESPRI GOLD Kiwifruit Total tray equivalents supplied (m) Fruit payments Fruit incentives Service payments Loyalty premium Total fruit and service payments (including loyalty premium) Family Kiwi /K1W1 GREEN Kiwifruit Total tray equivalents supplied (m) Fruit payments Service payments Total fruit and service payments Family Kiwi /K1W1 GREEN ORGANIC Kiwifruit Total tray equivalents supplied (m) Fruit payments Service payments Total fruit and service payments Family Kiwi /K1W1 GOLD Kiwifruit Total tray equivalents supplied (m) Fruit payments Service payments Total fruit and service payments Non-Standard Supply Total tray equivalents supplied (m) Fruit payments Fruit incentives Service payments Total fruit and service payments TOTAL ALL POOLS Total tray equivalents supplied (m) Total fruit payments Total fruit incentives Total service payments Total loyalty premium Total fruit and service payments (including loyalty premium) Total fruit and service payments 2008/ Total fruit and service payments 2007/ Total fruit and service payments 2006/ ZESPRI Annual Review 2009/10 27
 8.17 7.59 6.83 7.81 6.72 7.49 Loyalty premium 0.")
 Trays submitted (gross) 107,034 109,386 102,012 89,919 87,752 85,799 Trays supplied 102,010 102,644 95,364 81,099 84,669 81,534 Trays sold 98,550 99,969 92,436 80,060 82,283")
30 ZESPRI Group Limited and Subsidiaries 2009/10 (continued) New Zealand Industry Performance Annual Review for year ended 31 March 2010 New Zealand Industry Statistics 2009/10 NZ IFRS 2008/09 NZ IFRS 2007/08 NZ IFRS 2006/07 NZ IFRS 2005/06 NZ FRS 2004/05 NZ FRS Distribution to Growers/Suppliers Fruit and service payments (excluding loyalty premium) Loyalty premium Total payments per tray Crop Volumes ( 000) Trays submitted (gross) 107, , ,012 89,919 87,752 85,799 Trays supplied 102, ,644 95,364 81,099 84,669 81,534 Trays sold 98,550 99,969 92,436 80,060 82,283 79,652 Trays sold as a percentage of trays supplied 97% 97% 97% 99% 97% 98% General Statistics Production per hectare (trays submitted) 8,546 8,866 8,371 7,514 7,655 7,847 Producing hectares 12,525 12,337 12,186 11,967 11,464 10,934 Orchard Gate Return per hectare (average) $39,142 $35,655 $28,169 $32,566 $28,687 $34,738 Number of producers 2,711 2,710 2,727 2,754 2,748 2,760 Average number of trays supplied per producer 37,628 37,876 34,970 29,448 30,811 29,541 Number of Orchards Registered 0 2 hectares hectares 1,479 1,490 1,472 1,450 1,460 1, hectares Over 10 hectares Total (KPINS) 3,080 3,110 3,106 3,077 3,025 3,190 Average Orchard Size (hectares) GREEN GOLD Number of Packhouses Used 0 500,000 trays ,000 1,000,000 trays ,000,000 2,000,000 trays Over 2,000,000 trays Total Average trays packed per packhouse ( 000) 1,507 1,541 1,360 1,124 1, Number of Coolstores Used 0 500,000 trays ,000 1,000,000 trays ,000,000 2,000,000 trays Over 2,000,000 trays Total Average trays stored per coolstore ( 000) 1,390 1,189 1,229 1,034 1, Number of Employees New Zealand based (excludes seasonal employees) Non-New Zealand based Total Global revenue per employee ($ 000) excluding seasonal employees $6,165 $6,323 $4,994 $5,306 $4,985 $5,818 Global revenue (adjusted to 31 March year average foreign exchange rates) per employee ($ 000) excluding seasonal employees $6,052 $6,617 $5,655 $5,445 $5,437 $5,734 Onshore seasonal employees per year ZESPRI Annual Review 2009/10
Peet's Coffee & Tea, Inc. Reports 62% Increase in Second Quarter 2008 Diluted Earnings Per Share
 Peet's Coffee & Tea, Inc. Reports 62% Increase in Second Quarter 2008 Diluted Earnings Per Share EMERYVILLE, Calif., July 31, 2008 /PRNewswire-FirstCall via COMTEX News Network/ -- Peet's Coffee & Tea,
Briefing from Zespri
 Briefing from Zespri Report of the Primary Production Committee Contents Recommendation 2 Introduction 2 Overview of Zespri 2 Market competition and innovation 2 Kiwifruit industry structure 3 Recovery
Simon Limmer. Beyond recovery: Growth, value and innovation in the kiwifruit industry
 Simon Limmer Beyond recovery: Growth, value and innovation in the kiwifruit industry AGENDA 1. An overview of our industry 2. Strategy: growing demand and increasing supply 3. The recovery from Psa 4.
Preliminary unaudited financial results for the full year ended 30 June Amount for this reporting period
 Marlborough Wine Estates Group Limited Results for Announcement to the Market Preliminary unaudited financial results for the full year ended 30 June 2017 Reporting Period 1st July to 30th June 2017 Previous
KOREA MARKET REPORT: FRUIT AND VEGETABLES
 KOREA MARKET REPORT: FRUIT AND VEGETABLES 주한뉴질랜드대사관 NEW ZEALAND EMBASSY SEOUL DECEMBER 2016 Page 2 of 6 Note for readers This report has been produced by MFAT and NZTE staff of the New Zealand Embassy
KGI Forum Presentation 4 September 2014
 KGI Forum Presentation 4 September 2014 Sir Brian Elwood Hendrik Pieters Ian Greaves Alister Hawkey Ruth Lee Richard Procter (KNZ) Agenda 1. Contextual framework 2. Collaborative marketing (2013-14 season)
Consumer and Market Insights Symposium James Omond Lawyer & trade mark attorney, Omond & Co Board Member, Wine Victoria and WFA
 Consumer and Market Insights Symposium 2015 James Omond Lawyer & trade mark attorney, Omond & Co Board Member, Wine Victoria and WFA Trade and Export Victorian wine industry is an important exporting partner
Briefing from New Zealand Kiwifruit Growers
 Briefing from New Zealand Kiwifruit Growers Report of the Primary Production Committee Contents Recommendation 2 Introduction 2 Economic value of kiwifruit 2 Biosecurity 2 Kiwifruit Industry Strategy Project
DELIVERING REFRESHING SOFT DRINKS
 BEVERAGES DIVISION DELIVERING REFRESHING SOFT DRINKS Swire Beverages manufactures, markets and distributes refreshing soft drinks to consumers in Hong Kong, Taiwan, Mainland China and the USA. 46 215 PERFORMANCE
Seeka Limited. Retail Investors March 2019
 Seeka Limited Retail Investors March 2019 Orchard-to-market excellence Seeka is an international fresh produce business In Australia Grow, process and market - Kiwifruit - Nashi pears - European pears
ABN Australian Vintage Limited Full Year Result to 30 June 2018 Profit up 79% and Record Cash Flow
 ABN 78 052 179 932 Company Announcements Australian Securities Exchange 29 August 2018 Key Points Australian Vintage Limited Full Year Result to 30 June 2018 Profit up 79% and Record Cash Flow Net Profit
Zespri 5 YEAR OUTLOOK
 NOVEMBER 2017 Zespri 5 YEAR OUTLOOK A. Introduction B. Industry Context C. Category Updates D. Corporate Outlook E. Beyond 2025 INTRODUCTION A. Introduction Purpose of this communication This outlook provides
For personal use only
 ABNN 78 052 179 932 Company Announcements Australian Securities Exchange 24 February 2016 Australian Vintage Half Year Result to 31 December 20155 Branded Sales Dry Profit up by 80% % Key Points Net Profit
STATE OF THE VITIVINICULTURE WORLD MARKET
 STATE OF THE VITIVINICULTURE WORLD MARKET April 2018 1 Table of contents 1. VITICULTURAL PRODUCTION POTENTIAL 3 2. WINE PRODUCTION 5 3. WINE CONSUMPTION 7 4. INTERNATIONAL TRADE 9 Abbreviations: kha: thousands
Focused on Delivering
 34 Swire Pacific Annual Report 2009 Focused on Delivering Swire Beverages is one of the largest Coca-Cola bottlers in the world and the number one bottler in Mainland China with a powerful production and
This is Haruhisa Inada. I will explain the financial results of the first quarter of FY 2018.
 This is Haruhisa Inada. I will explain the financial results of the first quarter of FY 2018. 1 Compared to the previous year, revenue was 277.1 billion yen, up 3.3%, operating income was 26.6 billion
M03/330/S(2) ECONOMICS STANDARD LEVEL PAPER 2. Wednesday 7 May 2003 (morning) 2 hours INSTRUCTIONS TO CANDIDATES
 ECONOMICS STANDARD LEVEL PAPER 2. Wednesday 7 May 2003 (morning) 2 hours INSTRUCTIONS TO CANDIDATES") c PROGRAMA IB DIPLOMA PROGRAMME PROGRAMME DU DIPLÔME DU BI DEL DIPLOMA DEL BI M03/330/S(2) ECONOMICS STANDARD LEVEL PAPER 2 Wednesday 7 May 2003 (morning) 2 hours INSTRUCTIONS TO CANDIDATES! Do not open
c PROGRAMA IB DIPLOMA PROGRAMME PROGRAMME DU DIPLÔME DU BI DEL DIPLOMA DEL BI M03/330/S(2) ECONOMICS STANDARD LEVEL PAPER 2 Wednesday 7 May 2003 (morning) 2 hours INSTRUCTIONS TO CANDIDATES! Do not open
GLOBAL DAIRY UPDATE KEY DATES MARCH 2017
 MARCH 2017 GLOBAL DAIRY UPDATE European milk production decreased for the seventh consecutive month, while the US remains strong. The rate of decline in New Zealand production is easing. US exports continue
Consistently higher production and more exportable supplies from Thailand are major factors in the decline in world rice prices in 2014 and continued
 Rice Consistently higher production and more exportable supplies from Thailand are major factors in the decline in world rice prices in 2014 and continued lower levels over the next ten years. Part of
For personal use only
 11 December 2013 FONTERRA MAINTAINS FORECAST FARMGATE MILK PRICE FOR 2013/14 SEASON AND CONTINUES INVESTING IN THE FUTURE Forecast Fonterra Co-operative Group Limited is maintaining its forecast Farmgate
CASE STUDY: HOW STARBUCKS BREWS LOGISTICS SUCCESS
 CASE STUDY: HOW STARBUCKS BREWS LOGISTICS SUCCESS We love to put order in your chaos. Morai Logistics Inc. is a 3rd party logistics provider with an operating agency agreement representing Mode Transportation.
Coca-Cola beverages bring a refreshing taste to consumers.
 Coca-Cola beverages bring a refreshing taste to consumers. BEVERAGES DIVISION DELIVERING REFRESHING SOFT DRINKS Swire Beverages manufactures, markets and distributes refreshing soft drinks to consumers
Work Sample (Minimum) for 10-K Integration Assignment MAN and for suppliers of raw materials and services that the Company relies on.
 for 10-K Integration Assignment MAN and for suppliers of raw materials and services that the Company relies on.") Work Sample (Minimum) for 10-K Integration Assignment MAN 4720 Employee Name: Your name goes here Company: Starbucks Date of Your Report: Date of 10-K: PESTEL 1. Political: Pg. 5 The Company supports the
Work Sample (Minimum) for 10-K Integration Assignment MAN 4720 Employee Name: Your name goes here Company: Starbucks Date of Your Report: Date of 10-K: PESTEL 1. Political: Pg. 5 The Company supports the
Chef de Partie Apprenticeship Standard
 Chef de Partie Apprenticeship Standard NCFE Level 3 Certificate In Hospitality and Catering Principles (Professional Cookery) (601/7915/6) NCFE Level 3 NVQ Diploma in Professional Cookery (601/8005/5)
Brazil Milk Cow Numbers and Milk Production per Cow,
 TABLE OF CONTENTS 1. Brazil 1.1. Brazil Milk Market Introduction 1.1.1. Brazil Cow Milk Market Production and Fluid Milk Consumption by Volume, 1.1.2. Brazil Milk Cow Numbers and Milk Production per Cow,
EMBARGO TO ON FRIDAY 16 SEPTEMBER. Scotch Whisky Association. Exports of Scotch Whisky; Year to end of June 2016 (2016 H1)
") EMBARGO TO 00.01 ON FRIDAY 16 SEPTEMBER Scotch Whisky Association Exports of Scotch Whisky; Year to end of June 2016 (2016 H1) VOLUME UP 3.1% to 531 MILLION bottles VALUE DOWN SLIGHTLY BY 1.0% TO 1.70
EMBARGO TO 00.01 ON FRIDAY 16 SEPTEMBER Scotch Whisky Association Exports of Scotch Whisky; Year to end of June 2016 (2016 H1) VOLUME UP 3.1% to 531 MILLION bottles VALUE DOWN SLIGHTLY BY 1.0% TO 1.70
2016 China Dry Bean Historical production And Estimated planting intentions Analysis
 2016 China Dry Bean Historical production And Estimated planting intentions Analysis Performed by Fairman International Business Consulting 1 of 10 P a g e I. EXECUTIVE SUMMARY A. Overall Bean Planting
Growing Trade & Expanding Markets. Presentation to the Canadian Horticultural Council Trade and Marketing Committee Fred Gorrell March 14, 2018
 Growing Trade & Expanding Markets Presentation to the Canadian Horticultural Council Trade and Marketing Committee Fred Gorrell March 14, 2018 Outline Sector Snapshot Export Trends & Opportunities Trade
Starbucks BRAZIL. Presentation Outline
 Starbucks BRAZIL Prepared by: Aminata Ouattara Daniele Albagli Melissa Butz Matvey Kostromichev Presentation Outline Introduction Mission & Objectives PESTEL Analysis PORTER Analysis SWOT Analysis Capabilities
2016 was Telepizza Group s best year for chain sales 1 and EBITDA growth over the last decade
 Telepizza Full-Year Results for 2016 2016 was Telepizza Group s best year for chain sales 1 and EBITDA growth over the last decade Chain sales 1 grew by 7% to 517M while Underlying EBITDA rose by 10% to
Press release Vevey, October 18, Nestlé reports nine-month sales for 2018
 Press release Vevey, October 18, 2018 Follow today's event live 14:00 CEST Investor call audio webcast Full details: https://www.nestle.com/media/mediaeventscalendar/allevents/2018-nine-month-sales Nestlé
Networkers Business Update. December 2014
 Networkers Business Update December 2014 Agenda Forecast Milk Price Global markets V3 Strategy Growing our share of New Zealand milk Page 2 Forecast Milk Price 110 100 2012/13 2013/14 2014/15 Forecast
Dairy Market. November 2017
 Dairy Market Dairy Management Inc. R E P O R T Volume 20 No. 10 November 2017 DMI NMPF Overview U.S. Cheddar cheese prices hit a 10-month high in October, while butter prices softened but remained well
Financial Results for Fiscal Year Ending December 31, February 12, 2016 Suntory Beverage & Food Limited
 2016 SUNTORY 2013 BEVERAGE SUNTORY BEVERAGE & FOOD & LIMITED. Limited. All Rights All Reserved Rights Reserved. Financial for Fiscal Year Ending December 31, 2015 February 12, 2016 Suntory Beverage & Food
The state of the European GI wines sector: a comparative analysis of performance
 The state of the European GI wines sector: a comparative analysis of performance Special Report November 2017 1. Overview of a growing global wine market Wine is one of the most globalised products. The
Thailand Packaging Machinery Market. Jorge Izquierdo VP Market Development PMMI
 Thailand Packaging Machinery Market Jorge Izquierdo VP Market Development PMMI jizquierdo@pmmi.org www.pmmi.org/global www.pmmi.org/research Today General Economic and Political Highlights Current Packaging
ONE YEAR ANNUAL RESULTS FONTERRA FONTERRA CO-OPERAT CO-OPERA IVE GROUP LTD
 ONE YEAR. 2012 ANNUAL RESULTS FONTERRA CO-OPERATIVE GROUP LTD 1 SIR HENRY VAN DER HEYDEN CHAIRMAN FONTERRA CO-OPERATIVE GROUP LTD 2 OVERVIEW Highlights Business performance Update on strategy Questions
Dairy Market. May 2016
 Dairy Market R E P O R T Volume 19 No. 5 May 2016 DMI NMPF Overview Increased production per cow and expectations for additional milk production growth is dampening the outlook for milk prices for the
Fonterra: GLOBAL DAIRY UPDATE JULY 2013 ISSUE ELEVEN
 Fonterra: GLOBAL DAIRY UPDATE JULY 2013 ISSUE ELEVEN Welcome to our latest Global Dairy Update. The Update is Fonterra s commitment to continually educating and informing our farmers and wider stakeholders
2. The proposal has been sent to the Virtual Screening Committee (VSC) for evaluation and will be examined by the Executive Board in September 2008.
 for evaluation and will be examined by the Executive Board in September 2008.") WP Board 1052/08 International Coffee Organization Organización Internacional del Café Organização Internacional do Café Organisation Internationale du Café 20 August 2008 English only Projects/Common
WP Board 1052/08 International Coffee Organization Organización Internacional del Café Organização Internacional do Café Organisation Internationale du Café 20 August 2008 English only Projects/Common
Raymond James 33 rd Annual Institutional Investors Conference March 5, DineEquity, Inc. All rights reserved.
 Raymond James 33 rd Annual Institutional Investors Conference March 5, 2012 Forward-Looking Information Statements contained in this presentation may constitute forward-looking statements within the meaning
January 2015 WORLD GRAPE MARKET SUPPLY, DEMAND AND FORECAST
 January 2015 WORLD GRAPE MARKET SUPPLY, DEMAND AND FORECAST Table of Contents Executive Summary... 4 1. VARIETIES OF GRAPES... 6 1.1. White table grapes... 6 1.2. Red table grapes... 6 2. WORLD DEMAND
Peaches & Nectarines and Cherry Annual Reports
 THIS REPORT CONTAINS ASSESSMENTS OF COMMODITY AND TRADE ISSUES MADE BY USDA STAFF AND NOT NECESSARILY STATEMENTS OF OFFICIAL U.S. GOVERNMENT POLICY Required Report - public distribution Date: GAIN Report
Grape Growers of Ontario Developing key measures to critically look at the grape and wine industry
 Grape Growers of Ontario Developing key measures to critically look at the grape and wine industry March 2012 Background and scope of the project Background The Grape Growers of Ontario GGO is looking
HONDURAS. A Quick Scan on Improving the Economic Viability of Coffee Farming A QUICK SCAN ON IMPROVING THE ECONOMIC VIABILITY OF COFFEE FARMING
 HONDURAS A Quick Scan on Improving the Economic Viability of Coffee Farming 1 OBJECTIVES OF STUDY Overall objective Identify opportunities for potential benefits to coffee farmers from improved farm profitability
Assessment of Management Systems of Wineries in Armenia
 International Wine Conference "Global Trends and Best Practices in the Wine World: Implications and Recommendations for Armenia" November 24, 2017 Assessment of Management Systems of Wineries in Armenia
Trade Report. Maersk Group. Brazil Faces Slightly Better Christmas for First Time Since 2010 BRAZIL Q3 2016
 Maersk Group Trade Report 2016 BRAZIL Brazil Faces Slightly Better Christmas for First Time Since 2010 Imports decline less and likely to go positive in 2017 Exports growth slowing on back of stronger
The connoisseurs choice for a portfolio with Fine French Wines
 The connoisseurs choice for a portfolio with Fine French Wines Ensuring better returns on secure investments Discerning investors are looking for safer investments. With a volatile worldwide economy, certain
REMARKS BY PAUL BULCKE, GROUP CHIEF EXECUTIVE OFFICER, NESTLÉ S.A. MEDIA CONFERENCE, NAIROBI, FRIDAY, JULY 2, 2010
 REMARKS BY PAUL BULCKE, GROUP CHIEF EXECUTIVE OFFICER, NESTLÉ S.A. MEDIA CONFERENCE, NAIROBI, FRIDAY, JULY 2, 2010 Disclaimer This speech might not reflect absolutely all exact words spoken. This speech
Yum! Brands Drive Profitable International Expansion. Graham Allan YRI President
 Yum! Brands Drive Profitable International Expansion Graham Allan YRI President Yum! International Division Agenda... 2006 Results/2007 Outlook Building Our Global Brands Future Growth Another Strong Year
Cocoa Prepared by Foresight October 3, 2018
 Cocoa Prepared by Foresight October 3, 2018 TABLES Cocoa Bean Price Forecast... P. 4 World Cocoa Supply/Demand, Crop Year... P. 7 World Cocoa Production... P. 8 Cocoa Crops in Major Producing Countries...
How we re making a difference revitalizing the Malawian tea industry for workers to earn living wages. How we re making a difference - Malawi
 How we re making a difference revitalizing the Malawian tea industry for workers to earn living wages How we re making a difference - Malawi 1 The Malawi Tea 2020 program, launched in September 2015, aims
J / A V 9 / N O.
 July/Aug 2003 Volume 9 / NO. 7 See Story on Page 4 Implications for California Walnut Producers By Mechel S. Paggi, Ph.D. Global production of walnuts is forecast to be up 3 percent in 2002/03 reaching
$ BUY STARBUCKS CORPORATION (SBUX) Rena Kaufman. Valuation Methodology. Market Data. Financial Summary (7/1/2018) Profile. Financial Analysis
 Rena Kaufman. Valuation Methodology. Market Data. Financial Summary (7/1/2018) Profile. Financial Analysis") STARBUCKS CORPORATION (SBUX) Market Data Market Cap (intraday): $69,991M Enterprise Value (Aug 9, 2018): $74,898M Enterprise Value/EBITDA (ttm): 14.97x Rena Kaufman $51.88 - BUY Valuation Methodology Method
STARBUCKS CORPORATION (SBUX) Market Data Market Cap (intraday): $69,991M Enterprise Value (Aug 9, 2018): $74,898M Enterprise Value/EBITDA (ttm): 14.97x Rena Kaufman $51.88 - BUY Valuation Methodology Method
Bottled Water Category Overview
 Bottled Water Category Overview 2014-2015 Disclaimer The following information is offered in good faith and represents an unqualified interpretation of a range of industry commentary and market data. It
World Kiwifruit Review 2015 Edition TABLE OF CONTENTS
 World Kiwifruit Review 2015 Edition TABLE OF CONTENTS Foreword 2 Table of Contents 3 Charts 5 Tables 6 Emerging from the PSA Crisis 7 1. Production of Kiwifruit 13 Production Potential Still Rising 13
Company name (YUM) Analyst: Roman Sandoval, Niklas Podhraski, Akash Patel Spring Recommendation: Don t Buy Target Price until (12/27/2016): $95
 Analyst: Roman Sandoval, Niklas Podhraski, Akash Patel Spring Recommendation: Don t Buy Target Price until (12/27/2016): $95") Recommendation: Don t Buy Target Price until (12/27/2016): $95 1. Reasons for the Recommendation One of the most important reasons why we don t want to buy Yum is the growth prospects of the company in
Recommendation: Don t Buy Target Price until (12/27/2016): $95 1. Reasons for the Recommendation One of the most important reasons why we don t want to buy Yum is the growth prospects of the company in
RESTAURANT OUTLOOK SURVEY
 Reference Period: Fourth Quarter 2016 RESTAURANT OUTLOOK SURVEY Prepared by Chris Elliott, Senior Economist January 23, 2017 Q2-2011 Restaurant Outlook Survey Fourth Quarter 2016 1 Highlights The share
Paper Reference IT Principal Learning Information Technology. Level 3 Unit 2: Understanding Organisations
 Centre No. Candidate No. Surname Signature Paper Reference(s) IT302/01 Edexcel Principal Learning Information Technology Level 3 Unit 2: Understanding Organisations Wednesday 3 June 2009 Morning Time:
and the World Market for Wine The Central Valley is a Central Part of the Competitive World of Wine What is happening in the world of wine?
 The Central Valley Winegrape Industry and the World Market for Wine Daniel A. Sumner University it of California i Agricultural l Issues Center January 5, 211 The Central Valley is a Central Part of the
Senior Chef Production Cooking Apprenticeship Standard
 Senior Chef Production Cooking Apprenticeship Standard NCFE Level 3 Certificate In Hospitality and Catering Principles (Professional Cookery) (601/7915/6) NCFE Level 3 NVQ Diploma in Professional Cookery
Outlook for the World Coffee Market
 Outlook for the World Coffee Market 8 th AFRICAN FINE COFFEE CONFERENCE & EXHIBITION 17 to 19 February 2011 Arusha, Tanzania José Sette Executive Director a.i. 225 ICO composite indicator price Monthly:
Table grape. Horticulture trade intelligence. Quarter 1: January to March 2017
 Horticulture trade intelligence A custom report compiled for Hort Innovation by Euromonitor International Table grape Quarter 1: January to March 217 Horticulture trade intelligence: Table grape: 217:
Nestlé Investor Seminar 2014
 Nestlé Investor Seminar 2014 Beverage Nestlé USA Rob Case Nestlé Beverage Division President June 3 rd & 4 th, Liberty Hotel, Boston, USA Disclaimer This presentation contains forward looking statements
Canada-EU Free Trade Agreement (CETA)
") Canada-EU Free Trade Agreement (CETA) The Issue: Following 5-years of negotiation, CETA was signed in principle on October 18, 2013, and signed officially by Prime Minister Trudeau on October 29, 2016,
Canada-EU Free Trade Agreement (CETA) The Issue: Following 5-years of negotiation, CETA was signed in principle on October 18, 2013, and signed officially by Prime Minister Trudeau on October 29, 2016,
THIS REPORT CONTAINS ASSESSMENTS OF COMMODITY AND TRADE ISSUES MADE BY USDA STAFF AND NOT NECESSARILY STATEMENTS OF OFFICIAL U.S.
 THIS REPORT CONTAINS ASSESSMENTS OF COMMODITY AND TRADE ISSUES MADE BY USDA STAFF AND NOT NECESSARILY STATEMENTS OF OFFICIAL U.S. GOVERNMENT POLICY Required Report - public distribution Date: GAIN Report
Dairy Market. May 2017
 Dairy Market Dairy Management Inc. R E P O R T Volume 20 No. 4 May 2017 DMI NMPF Overview The rate of milk production growth began to moderate during the first quarter, but additional milk production continues
Reaction to the coffee crisis at the beginning of last decade
 2000-2010 AND BEYOND: A PATH TO SUSTAINABILITY IN THE COFFEE SECTOR Andrea Illy Guatemala City Feb 28, 2010 Reaction to the coffee crisis at the beginning of last decade In order to resist the possible
Annual Review 2017/18
 Annual Review For a small fruit we ve got some ambitious plans Grow global sales kiwifruit revenue to $4.5 billion by 2025 Page 1 Our industry has what it takes to compete on the WORLD Backed by strong
ICC September 2018 Original: English. Emerging coffee markets: South and East Asia
 ICC 122-6 7 September 2018 Original: English E International Coffee Council 122 st Session 17 21 September 2018 London, UK Emerging coffee markets: South and East Asia Background 1. In accordance with
IN THIS ISSUE FEBRUARY Financial Calendar: Late September 2014 Annual Results Announced. 26 March 2014 Interim Results Announced
 FEBRUARY 2014 Welcome to our latest Global Dairy Update. This update is part of Fonterra s commitment to informing our farmers and wider stakeholders about the global dairy market, trends in New Zealand
GENERAL DESCRIPTION OF INDUSTRY AND COMPANY
 Appendix G Appendix Sample G: Import Business Business Plan: Otoro Plan: Import Company Otoro Import Company EXECUTIVE SUMMARY Otoro Imports is a spice importing and marketing corporation established in
GLOBAL DAIRY UPDATE. Welcome to our March 2015 Global Dairy Update IN THIS EDITION Financial Calendar
 GLOBAL DAIRY UPDATE Welcome to our ch 2015 Global Dairy Update IN THIS EDITION Fonterra milk collection New Zealand 7% lower in ruary 2015 and 1.5% higher for the season to date Australia 4% higher in
Economic Contributions of the Florida Citrus Industry in and for Reduced Production
 Economic Contributions of the Florida Citrus Industry in 2014-15 and for Reduced Production Report to the Florida Department of Citrus Alan W. Hodges, Ph.D., Extension Scientist, and Thomas H. Spreen,
Re: LCBO Lightweight Glass Wine Standard Implementation Date
 June 21, 2012 To: All Trade Associations Re: LCBO Lightweight Glass Wine Standard Implementation Date Further to my letter dated June 1st, 2011, I am writing to remind industry representatives that the
THIS REPORT CONTAINS ASSESSMENTS OF COMMODITY AND TRADE ISSUES MADE BY USDA STAFF AND NOT NECESSARILY STATEMENTS OF OFFICIAL U.S.
 THIS REPORT CONTAINS ASSESSMENTS OF COMMODITY AND TRADE ISSUES MADE BY USDA STAFF AND NOT NECESSARILY STATEMENTS OF OFFICIAL U.S. GOVERNMENT POLICY Required Report - public distribution Date: GAIN Report
For personal use only
 SEPTEMBER 216 GLOBAL DAIRY UPDATE European milk production has decreased for the first time since early 215, with volumes in June down 2 compared to last year. Last week we announced our annual results,
ZESPRI International Limited Implementation Case Study
 ZESPRI International Limited Implementation Case Study ZESPRI Introduction When New Zealand Kiwifruit hits the shelves of Europe s supermarkets in 2005, ZESPRI International Limited will have completed
Citrus: World Markets and Trade
 United States Department of Agriculture Foreign Agricultural Service Citrus: World Markets and Trade Oranges Global orange production for 2012/13 is forecast to drop over 4 percent from the previous year
Majestic Wine 2013/14 Interim Results
 Majestic Wine 2013/14 Interim Results Key Competitive Advantages > > Excellent customer service delivered by highly trained store teams > > Taste before you buy, free to attend wine events and wine courses
ETHIOPIA. A Quick Scan on Improving the Economic Viability of Coffee Farming A QUICK SCAN ON IMPROVING THE ECONOMIC VIABILITY OF COFFEE FARMING
 ETHIOPIA A Quick Scan on Improving the Economic Viability of Coffee Farming 1 OBJECTIVES OF STUDY Overall objective Identify opportunities for potential benefits to coffee farmers from improved farm profitability
Three-month sales April 20, 2017 Nestlé three-month sales 2017
 Three-month sales 2017 1 Disclaimer This presentation contains forward looking statements which reflect Management s current views and estimates. The forward looking statements involve certain risks and
Oregon Wine Industry Sustainable Showcase. Gregory V. Jones
 Oregon Wine Industry Sustainable Showcase Gregory V. Jones Panel Framework Oregon wineries and vineyards are implementing innovative sustainability and environmental practices across the entire system
Angela Mariani. University of Naples Parthenope
 Angela Mariani University of Naples Parthenope Workshop Mediterranean products in the global market Section 6: The global market for wine: issues and prospects p 17 June 2008 BRIEF COMMENTS ON THE FOLLOWING
Dairy Market. Overview. Commercial Use of Dairy Products
 Dairy Market Dairy Management Inc. R E P O R T Volume 21 No. 6 June 2018 DMI NMPF Overview U.S. dairy markets received a one-two punch during the first weeks of June in the form of collateral damage from
CHAPTER 7.3 FOCUS ON FAIRTRADE PRODUCTS COCOA
 CHAPTER 7.3 FOCUS ON FAIRTRADE PRODUCTS COCOA MONITORING THE SCOPE AND BENEFITS OF FAIRTRADE SIXTH EDITION 2014 95 MONITORING THE SCOPE AND BENEFITS OF FAIRTRADE SIXTH EDITION 2014 96 7.3 Fairtrade Fact
OUR POTENTIAL. Business Update MAY 2017
 OUR POTENTIAL Business Update MAY 2017 Disclaimer This presentation may contain forward-looking statements and projections. There can be no certainty of outcome in relation to the matters to which the
Autumn Press Conference October 19, Name of chairman
 Autumn Press Conference October 19, 2006 Disclaimer This presentation contains forward looking statements which reflect Management s current views and estimates. The forward looking statements involve
Fair Trade C E R T I F I E D
 Fair Trade C E R T I F I E D Every Purchase Matters. Apparel & Home Goods Program What is Fair Trade? Safe Working Conditions Guarantee of safe factory working conditions Advancement of People Direct mechanism
World Sweet Cherry Review
 World Sweet Cherry Review 2017 Edition TABLE OF CONTENTS Foreword 2 Table of Contents 3 Tables 5 Charts 6 The High Variability Challenge 8 I. World Production of Sweet Cherries 14 Erratic Rise in World
1
 1 Introduction In his 213 budget, the then chancellor George Osborne abolished the beer duty escalator which increased beer duty by 2 per cent above the rate of inflation. A 1p cut in duty was also announced.
Poland. Poland leads EU in processed strawberries
 THIS REPORT CONTAINS ASSESSMENTS OF COMMODITY AND TRADE ISSUES MADE BY USDA STAFF AND NOT NECESSARILY STATEMENTS OF OFFICIAL U.S. GOVERNMENT POLICY Voluntary - Public Date: 1/8/2010 GAIN Report Number:
west australian wine industry sustainable funding model
 west australian wine industry sustainable funding model west australian wine industry sustainable funding model PRODUCERS PRODUCERS Paid by owner of fruit at crusher Equitable contribution based on production
Sustainability Initiatives in Other Tropical Commodities Dr. Jean-Marc Anga Director, Economics and Statistics Division
 0 International Cocoa Organization Sustainability Initiatives in Other Tropical Commodities Dr. Jean-Marc Anga Director, Economics and Statistics Division 1 Sustainable Development 1983: Brundtland Commission
World of sugar PAGE 54
 World of sugar More than 1 countries produce sugar, about 8% of which is made from sugar cane grown primarily in the tropical and sub-tropical zones of the southern hemisphere, and the balance from sugar
THIS REPORT CONTAINS ASSESSMENTS OF COMMODITY AND TRADE ISSUES MADE BY USDA STAFF AND NOT NECESSARILY STATEMENTS OF OFFICIAL U.S.
 THIS REPORT CONTAINS ASSESSMENTS OF COMMODITY AND TRADE ISSUES MADE BY USDA STAFF AND NOT NECESSARILY STATEMENTS OF OFFICIAL U.S. GOVERNMENT POLICY Voluntary - Public Date: 4/24/2013 GAIN Report Number:
Asia Loses Its Sweet Tooth for Chocolate
 Asia Loses Its Sweet Tooth for Chocolate Rising prices, slower growth have Asian buyers shunning cocoa A Chinese visitor packs chocolates into one of her suitcases in Hong Kong, where demand for the sweet
ACOS ETHIOPIA CASE STUDY
 OUR HISTORY It was only 2005 when Acos Ethiopia came to light from a pioneering idea of forward thinking people, the Pedon family. Ethiopia then was an even more challenging environment than it is now,
Outlook for the. ASEAN INTERNATIONAL SEMINAR ON COFFEE June 2012 Kuta, Bali, Indonesia
 Outlook for the World Coffee Market ASEAN INTERNATIONAL SEMINAR ON COFFEE 12 13 June 212 Kuta, Bali, Indonesia José Sette Head of Operations ICO Composite Indicator Price (in current terms) Monthly averages:
STATE OF THE VITIVINICULTURE WORLD MARKET
 STATE OF THE VITIVINICULTURE WORLD MARKET April 2015 1 Table of contents 1. 2014 VITIVINICULTURAL PRODUCTION POTENTIAL 3 2. WINE PRODUCTION 5 3. WINE CONSUMPTION 7 4. INTERNATIONAL TRADE 9 Abbreviations: