Trade Conflicts: What s at Stake for US Agricultural?
|
|
|
- Gerald Small
- 5 years ago
- Views:
Transcription


1 Trade Conflicts: What s at Stake for US Agricultural? Joseph W. Glauber Senior Research Fellow International Food Policy Research Institute Gardner Agricultural Policy Lecture Normal, Illinois 31July 218


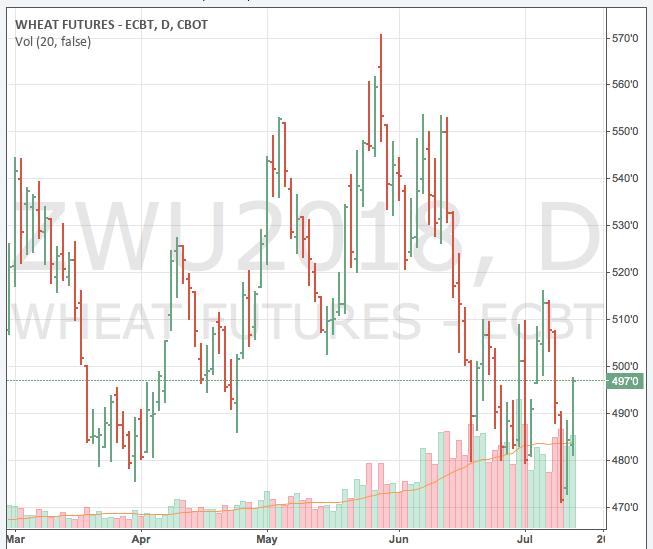
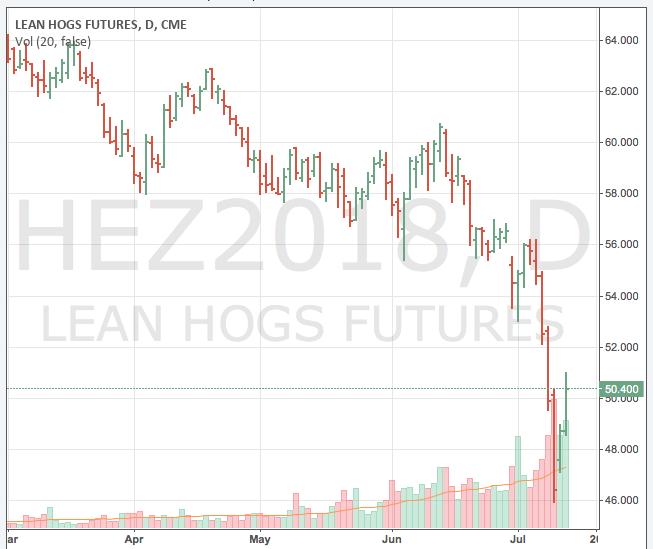
2 Trade worries tank markets Source: CME Group
3
4 Top US feed grain markets, Corn Rank Country Exports (mil MT) Other feed grains Rank Country Exports (Mil MT) 1 Mexico China Japan Mexico Colombia Japan Korea, South Sudan Peru Canada.85 6 Taiwan Kenya.82 7 Saudi Arabia Pakistan.7 8 Canada Djibouti.66 9 Guatemala South Africa.62 1 Costa Rica.78 1 Somalia.45 Source: US Dept Commerce
5 Top US feed grain markets, Corn Rank Country Exports (mil MT) Other feed grains Rank Country Exports (Mil MT) 1 Mexico China Japan Mexico Colombia Japan Korea, South Sudan Peru Canada.85 6 Taiwan Kenya.82 7 Saudi Arabia Pakistan.7 8 Canada Djibouti.66 9 Guatemala South Africa.62 1 Costa Rica.78 1 Somalia.45 Source: US Dept Commerce
6 Top 1 export markets for US soybeans and products Rank Soybeans Mil $ Soybean oil Mil $ Soybean meal Mil $ 1 China 12,346 Mexico 213 Mexico EU 1,822 Dom Republic 14 Philippines 74 3 Mexico 1,493 Korea, South 14 Canada 39 4 Japan 1,8 Colombia 53 Colombia 33 5 Indonesia 895 China 47 Thailand Taiwan 582 Venezuela 41 Dom Republic Thailand 352 Peru 41 EU Bangladesh 35 Guatemala 36 Venezuela Vietnam 298 Morocco 33 Guatemala Korea, South 248 Canada 24 Ecuador 113
7 Top 1 export markets for US soybeans and products Rank Soybeans Mil $ Soybean oil Mil $ Soybean meal Mil $ 1 China 12,346 Mexico 213 Mexico EU 1,822 Dom Republic 14 Philippines 74 3 Mexico 1,493 Korea, South 14 Canada 39 4 Japan 1,8 Colombia 53 Colombia 33 5 Indonesia 895 China 47 Thailand Taiwan 582 Venezuela 41 Dom Republic Thailand 352 Peru 41 EU Bangladesh 35 Guatemala 36 Venezuela Vietnam 298 Morocco 33 Guatemala Korea, South 248 Canada 24 Ecuador 113
8 Top US wheat markets, Rank Country Exports (mil MT) Rank Country Exports (Mil MT) 1 Mexico Thailand Japan Guatemala Philippines Peru Nigeria Yemen Korea, South Algeria Taiwan Dominican Republic China Ethiopia Indonesia Venezuela Colombia Chile European Union Morocco.321
9 Top 1 export markets for meat products Rank Beef Mil $ Pork Mil $ Poultry Mil $ 1 Japan 1,561 Japan 1,581 Mexico Korea, South 1,34 Mexico 1,381 Canada Mexico 1,16 Canada 79 Hong Kong Canada 818 China 61 Taiwan Hong Kong 79 Korea, South 437 Angola Taiwan 364 Hong Kong 352 Cuba European Union Australia(*) 186 Guatemala 19 8 Egypt 18 Colombia 123 Chile 89 9 United Arab Emirates 65 Philippines 85 Vietnam 8 1 Philippines 6 Dominican Republic 6 Philippines 79
10 Google Trends: TPP /1/213 2/1/214 2/1/215 2/1/216 2/1/217
11 Google Trends: TPP TPP negotiations concluded Conventions US pulls out of TPP /1/213 2/1/214 2/1/215 2/1/216 2/1/217
12 TPP Foregone benefits to ag: Farm Bureau: Ag exports: +$5.5 bil Farm income: +$4.4 bil USITC: Ag exports: +$7.2 bil (dairy +$1.8 bil; meats +$1.3 bil) ERS: Ag exports: +$3 bil CanadaWest: US loses due to preferential TPP access of others to Japan, Vietnam Dade and Ciuriak 218, CanadaWest Foundation `
13 Google search NAFTA Election Inauguration President announces intent to withdraw from Nafta /28/213 4/28/214 4/28/215 4/28/216 4/28/217
14 US-Canada agricultural trade Bil USD US exports to Canada Canada exports to US
15 US-Mexico agricultural trade Bil USD US exports to Mexico Mexico exports to US
16 Bilateral flows with the United States, Bil USD US-Canada Canada-US Bil USD US-Mexico Mexico-US
17 Bilateral trade with Canada, Soybean Meal Chickens, Fr/Froz Essential Oils Pork, Prep/Pres Pork, Fr/Froz Wine Lettuce, Fr Other Veg Oils/Waxes Other Dairy Prods Other Veg, Fr Related Sugar Prod Berries, Fr Chocolate & Prep Coffee Beef & Veal Fr/Froz Other Veg, Prep/Pres Beverages Ex Juice Other Feeds & Fodder Misc Hort Products Other Grain Prods US exports to Canada Bil USD US imports from Canada Planting Seeds Feeds & Fodders Sugars, Sweeteners, Bev Bases Wheat Roasted & Instant Coffee Coarse Grains Other Bulk Commodities Fresh Vegetables Processed Fruit & Vegetables Live Animals Other Vegetable Oils Other Intermediate Products Red Meats, FR/CH/FR Other Consumer Oriented Snack Foods Bil USD
18 Bilateral trade with Mexico, US exports to Mexico US imports from Mexico Feed Grain Prods Beef Variety Meats Turkeys, Fr/Froz Rice-Paddy, Milled Beverages Ex Juice Seeds, Field/Garden Other Grain Prods Cotton, Ex Linters Cheese Chickens, Fr/Froz Nonfat Dry Milk Other Feeds & Fodder Wheat, Unmilled Related Sugar Prod Misc Hort Products Beef & Veal Fr/Froz Soybean Meal Pork, Fr/Froz Soybeans Corn 1 2 Bil USD Other Dairy Products Other Bulk Commodities Roasted & Instant Coffee Bananas and Plantains Other Vegetable Oils Coffee, Unroasted Other Intermediate Fruit & Vegetable Juices Raw Beet & Cane Sugar Sugars, Sweeteners, Bev Live Animals Tree Nuts Other Consumer Oriented Red Meats, FR/CH/FR Processed Fruit & Snack Foods Wine and Beer Other Fresh Fruit Fresh Vegetables Bil USD
19 US fresh fruit and vegetables imports from Mexico Bil USD Vegetables Fruit
20 Percent of annual Mexican fresh vegetables exports to the US by month, % 12% 1% 8% 6% 4% 2% %
21 US utilization of selected fresh vegetables Per capita utilization (lbs) Onions Tomatoes 15 1 Leaf lettuce Brocolli Bell peppers Cucumbers 5 Squash Eggplant Garlic Artichokes Asparagus Import penetration (%)
22 US per capita utilization lbs 25. Fresh tomatoes lbs 12. Fresh bell peppers p p Domestic Imported Domestic Imported
23 Food processing sales of US affiliates in NAFTA markets Sales (bil USD) Mexico Canada Source: US Department of Commerce, Bureau of Economic Analysis


24 Global value chains f&v


25 Global value chains livestock, Mil USD 1,6 US livestock imports Mil USD 1,6 US meat exports 1,4 1,4 1,2 1,2 1, 1, 8 6 Canada Mexico 8 6 Canada Mexico Cattle and calves Swine Beef Pork
26 MFN applied duties % Animal products Dairy products Fruits, vegetable and plants Coffee, tea Cereals & prep Oilseeds, fats & oils Sugar Beverages and tobacco Cotton Other agricultural products Canada Mexico US
27 Trade disputes involving the US and its NAFTA partners Brought by US against Canada Brought by Canada against US 6 55 Brought by US against Mexico 9 2 Brought by Mexico against US NAFTA WTO
28 Looking forward Market access gains unlikely (without substantial tradeoffs) Big tradeoffs necessary: dairy (US, Canada), poultry (Canada), sugar (US) Seasonal trade remedy actions would be double-edged (f&v versus pork) Modernizing NAFTA: TPP (e-commerce, dispute settlement, SPS, IP) Greater efforts to harmonize standards, reduce regulatory barriers for trade Single Window Environments Do no harm but will the harm come from other areas of contention (Chapter 19, rules of origin, domestic content, softwood lumber, ) where agriculture suffers collateral damage? Opportunity costs of negotiations: renegotiating the past rather than negotiating the future
29 Google Trends: US China Trade War 12 1 Inauguration /1/213 2/1/214 2/1/215 2/1/216 2/1/217 Feb 218
30 Google Trends: US China Trade War 12 1 Steel and aluminum tariffs announced July 218
31 US exports to China, average Product Mil $ Product Mil $ Soybeans 12,346 Wheat 238 Coarse Grains (ex. corn) 1,333 Tree Nuts 211 Hides & Skins 1,54 Fresh Fruit 183 Cotton 796 Tobacco 177 Distillers Grains 722 Ethanol (non-bev.) 164 Pork & Pork Products 61 Processed Vegetables 135 Dairy Products 471 Prepared Food 119 Other Intermediate Products 443 Corn 118 Feeds & Fodders NESOI 343 Planting Seeds 113 Hay 342 Processed Fruit 11
32 US soybean exports Mil MT ROW China
33 US soybean exports 55% 5% 45% 4% 35% 3% 2/21 Share of production exported 22/23 24/25 26/27 28/29 21/ / / /217 3% 23% 4% 6% 9% Export Destination 55% China EU Mexico Japan Indonesia Other One in three acres of soybeans are exported to China and Mexico.
34 China soybean supplies Mil MT /21 21/22 22/23 23/24 24/25 25/26 26/27 27/28 28/29 29/21 21/ / / / / / / /218 Imports Production
35 China soybean imports by source Mil MT Other US Brazil + Argentina Source: COMTRADE, GTIS
36 Monthly Chinese Soybean Imports by Origin 12 1 Million Metric Tons /21 4/21 7/21 1/21 1/211 4/211 7/211 1/211 1/212 4/212 7/212 1/212 1/213 4/213 7/213 1/213 1/214 4/214 7/214 1/214 1/215 4/215 7/215 1/215 1/216 4/216 7/216 1/216 1/217 4/217 7/217 1/217 United States Argentina +Brazil ROW Source: Global Trade Information Services (GTIS)
37 China vegetable oil supply Soybean oil Vegetable oil imports 18, 16, 14, 12, 1, 8, 6, 4, 2, 12, 1, 8, 6, 4, 2, Palm oil Sunflowerseed oil Soybean oil Rapeseed oil Production Imports Palm Kernel oil Other
38 China soybean supplies Mil MT /21 21/22 22/23 23/24 24/25 25/26 26/27 27/28 28/29 29/21 21/ / / / / / / /218 Shortfall caused If US exports halted Imports Production
39 China soybean area Mil ha Area needed to offset lost US soybean exports
40 Brazil soybean area Mil ha Area needed to make up for lost US exports

41 Taheripour and Tyner (218)
42 Brazil US Spread ($/MT) Source: IGC -4 1-Jan 1-Feb 1-Mar 1-Apr 1-May 1-Jun 1-Jul
43 Long term effects 1973 soybean embargo: Very short duration, but actions spooked our major buyers (EU and Japan) Japan contracts with Brazilian growers EU increases oilseed support under the CAP 198 grain embargo: Largely ineffectual for FSU as they purchased grain from other countries US producer prices fell as US exporters scrambled to find alternative markets => grain into FOR/CCC => PIK in 1983 Wheat area has fallen over 15 million acres since trade war: Accelerate BZ area expansion?
44 Trade wars Trade wars easy to win? Like conventional war, difficult if trade war is fought on many fronts Tariffs impose large costs on target country, but also on one s own producers (who import primary and intermediate products for their manufacture) and consumers (who pay higher costs for imported products and for domestic products which depend on imported materials (eg, aluminum) While short term costs of trade wars (e.g., disrupted trade because of high tariffs) are high, costs of trade wars are often long-term disruption of supply chains; perception of exporter as reliable supplier What constitutes victory in trade war? Tariff concession; change in policy are typical outcomes; more murky: net trade balance

45 Thanks!
RENEGOTIATING NAFTA--what s at stake?
 RENEGOTIATING NAFTA--what s at stake? Joseph W. Glauber Senior Research Fellow, IFPRI 28 November 217 Midwest Agriculture s Ties to Global Economy Federal Reserve Bank of Chicago World agricultural exports,
Monitoring EU Agri-Food Trade: Development until October 2016
 Monitoring EU Agri-Food Trade: Development until October 2016 October 2016 EU agri-food exports stabilise at high level The monthly value of EU agri-food exports in October 2016 stabilised at EUR 11.4
Monitoring EU Agri-Food Trade: Development until March 2018
 Monitoring EU Agri-Food Trade: Development until March 2018 14.000 EU28: Export to Extra-EU of Agri-Food Products 13.000 12.000 11.000 10.000 2018 2017 2015 2016 2014 9.000 8.000 7.000 6.000 Jan Feb Mar
Monitoring EU Agri-Food Trade: Development until December 2015
 Monitoring EU Agri-Food Trade: Development until December 2015 December 2015 - EU agri-food exports again higher than in previous years EU agri-food exports in December 2015 achieved a value of EUR 11.2
Monitoring EU Agri-Food Trade: Development until April 2017
 Monitoring EU Agri-Food Trade: Development until April 2017 April 2017: Agri-food exports back to average values The monthly value of EU agri-food exports in April 2017 reached a value of EUR 10.6 billion,
Monitoring EU Agri-Food Trade: Development until January 2016
 Monitoring EU Agri-Food Trade: Development until January 2016 January 2015 - EU agri-food exports in line with seasonal trend EU agri-food exports in January 2016 were worth EUR 9.3 billion, thus just
Monitoring EU Agri-Food Trade: Development until March 2017
 Monitoring EU Agri-Food Trade: Development until March 2017 March 2017: record value in monthly agri-food exports at EUR 12.7 billion The monthly value of EU agri-food exports in March 2017 reached a value
Monitoring EU Agri-Food Trade: Development until January 2018
 Monitoring EU Agri-Food Trade: Development until January 2018 January 2018: good start of a year for EU agri-food exports The value of EU agri-food exports in January 2018 kept its very high level, now
Fresh Deciduous Fruit (Apples, Grapes, & Pears): World Markets and Trade
: World Markets and Trade") Million MT United States Department of Agriculture Foreign Agricultural Service December 21 Fresh Deciduous Fruit (Apples, Grapes, & Pears): World Markets and Trade 21/11 Forecast: World Apple Trade Declines;
Million MT United States Department of Agriculture Foreign Agricultural Service December 21 Fresh Deciduous Fruit (Apples, Grapes, & Pears): World Markets and Trade 21/11 Forecast: World Apple Trade Declines;
Monitoring EU Agri-Food Trade: Development until November 2016
 Monitoring EU Agri-Food Trade: Development until November 2016 November 2016 EU agri-food exports again at record level The monthly value of EU agri-food exports in November 2016 reached a new record level
Monitoring EU Agri-Food Trade: Development until December 2016
 Monitoring EU Agri-Food Trade: Development until December 2016 EU agri-food exports at highest annual level ever: EUR 130.7 billion The annual value of EU agri-food exports in 2016 reached a new record
Monitoring EU Agri-Food Trade: Development until June 2017
 Monitoring EU Agri-Food Trade: Development until June 2017 June 2017: Agri-food exports again above previous years level After a rebound in May, the monthly value of EU agri-food exports went down to EUR
Monitoring EU Agri-Food Trade: Development until August 2017
 Monitoring EU Agri-Food Trade: Development until August 2017 August 2017: Agri-food exports continue strong The monthly value of EU agri-food exports rose slightly to EUR 11.5 billion in August 2017, a
Monitoring EU Agri-Food Trade: Development until August 2018
 Monitoring EU Agri-Food Trade: Development until August 2018 August 2018: Export performance remains stable; imports from US continue to increase The value of EU agri-food trade in the month of August
Alberta Agri-Food Exports, 2008 to 2017 (1)
") Alberta Agri-Food Exports, 2008 to 2017 (1) Table of Content Tables Page 1 Alberta Agri-Food Exports, Top Products and Markets, 2008-2017, Value 1 2 Alberta Agri-Food Exports by Product, 2008-2017, Value
Alberta Agri-Food Exports, 2008 to 2017 (1) Table of Content Tables Page 1 Alberta Agri-Food Exports, Top Products and Markets, 2008-2017, Value 1 2 Alberta Agri-Food Exports by Product, 2008-2017, Value
Monitoring EU Agri-Food Trade: Development until October 2018
 Monitoring EU Agri-Food Trade: Development until October 2018 October 2018: best EU agri-food export performance ever The monthly value of EU agri-food trade in October 2018 was second biggest ever recorded
Fresh Deciduous Fruit (Apples, Grapes, & Pears): World Markets and Trade
: World Markets and Trade") Fresh Deciduous Fruit (Apples, Grapes, & Pears): World Markets and Trade June 21 APPLES Record Production but Trade Estimate Revised Downward The world production estimate for 29/1 is virtually unchanged
Fresh Deciduous Fruit (Apples, Grapes, & Pears): World Markets and Trade June 21 APPLES Record Production but Trade Estimate Revised Downward The world production estimate for 29/1 is virtually unchanged
Agri-Food Exports. Alberta to 2014 Economics and Competitiveness. Highlights on Alberta Agri-Food Exports in Tables:
 Agri-Food Exports Alberta 2005 to 2014 Economics and Competitiveness Highlights on Alberta Agri-Food Exports in 2014 Tables: Alberta Agri-Food Exports, 2005-2014: - Top 5 Export Products and Markets -
The Potential Role of Latin America Food Trade in Asia Pacific PECC Agricultural and Food Policy Forum Taipei
 The Potential Role of Latin America Food Trade in Asia Pacific 2011 PECC Agricultural and Food Policy Forum Taipei Universidad EAFIT, Colombia December 2, 2011 1 CONTENTS 1. Introduction 2. Food Trade
Fresh Deciduous Fruit (Apples, Grapes, & Pears): World Markets and Trade
: World Markets and Trade") United States Department of Agriculture Foreign Agricultural Service Fresh Deciduous Fruit (Apples, Grapes, & Pears): World Markets and Trade 9 1, MT Deciduous Fruit on Seasonal Cycles 6 Northern Hemisphere
United States Department of Agriculture Foreign Agricultural Service Fresh Deciduous Fruit (Apples, Grapes, & Pears): World Markets and Trade 9 1, MT Deciduous Fruit on Seasonal Cycles 6 Northern Hemisphere
Soybean Oil and Palm Oil Account For An Increasing Share of World Vegetable Oil Consumption
 United States Department of Agriculture Foreign Agricultural Service Circular Series FOP 01-03 January 2003 Soybean Oil and Palm Oil Account For An Increasing Share of World Vegetable Oil Consumption Percent
Trade Economics of Olives and Olive Oil: Data and Issues. Sacramento Valley Olive Day. Orland, July 6, 2018
 Trade Economics of Olives and Olive Oil: Data and Issues Sacramento Valley Olive Day Orland, July 6, 2018 Daniel A. Sumner and William A. Matthews University of California Agricultural Issues Center Motivation,
North America Grains Outlook
 banchero costa North America Grains Outlook (covering wheat and coarse grains) September 2018 bancosta blue studies volume DRY 2018/#12 banchero costa research www.bancosta.com ; research@bancosta.com
2017 U.S. DISTILLERS GRAINS EXPORTS
 217 U.S. DISTILLERS GRAINS EXPORTS 14, Annual U.S. Distillers Grains Exports 12, 12,695 1, 8, 6, 4, 2, 2,358 4,532 5,651 9,5 7,676 7,421 9,67 11,284 11,314 11,77 U.S. exports of distillers grains (DG)
KUWAIT. Similarly there is a decreasing trend for other fresh fruits products like grapes and lychee. India shared 37.6% of import market in Kuwait.
 KUWAIT A. MARKET FOR FRESH FRUITS AND FRESH VEGETABLES 1. Market Trend and Opportunities: Fresh Fruits The market for fresh fruits in Kuwait has a downward trend. Bananas import volume decreased by 34%
Part 1: California Ag Exports Main Points From 2008 to 2009 California agricultural exports declined about 5 percent.
 The Importance of California Agricultural Exports: Situation, Outlook and Policy Prospects, with emphasis on the Korea Free Trade Agreement California Fresh Carrot Advisory Board 11 Research hsymposium
SINGAPORE. Summary Table: Import of Fresh fruits and Vegetables in Fresh fruit and Vegetables Market Value $000 Qty in Tons
 SINGAPORE A. MARKET FOR FRESH FRUIT AND VEGETABLES 1. Market Trend and Opportunities Summary Table: Import of Fresh fruits and Vegetables in Fresh fruit and Vegetables Market Products/ Other Info. Product
Sugar: World Markets and Trade
 United States Department of Agriculture Foreign Agricultural Service November 2017 Sugar: World Markets and Trade Record Global Production Spurs Record Consumption Million Metric Tons, Raw Value 190 185
Strong U.S. Soybean Exports to Date Should Lead to Marketing Year Record
 United States Department of Agriculture Foreign Agricultural Service Circular Series FOP 04-01 April 2001 Strong U.S. Soybean Exports to Date Should Lead to Marketing Year Record U.S. Soybean Exports to
World Soybean Stocks Rise Sharply
 United States Department of Agriculture Foreign Agricultural Service Circular Series FOP 08-04 August 2004 World Soybean Stocks Rise Sharply Million Tons 50 40 World Stocks U.S. Stocks Brazil Stocks 50
THE GLOBAL PULSE MARKETS: recent trends and outlook
 THE GLOBAL PULSE MARKETS: recent trends and outlook CICILS/IPTIC 2004 CONVENTION 10-12 12 June 2004 Beijing, China Boubaker BENBELHASSEN Commodities and Trade Division United Nations Food and Agriculture
South American Soybean Stocks (Argentina and Brazil) Expected to Increase in 2001/02 to Record Level Despite Record Exports
 Expected to Increase in 2001/02 to Record Level Despite Record Exports") United States Department of Agriculture Foreign Agricultural Service Circular Series FOP 02-02 February 2002 South American Soybean Stocks (Argentina and Brazil) Expected to Increase in 2001/02 to Record
United States Department of Agriculture Foreign Agricultural Service Circular Series FOP 02-02 February 2002 South American Soybean Stocks (Argentina and Brazil) Expected to Increase in 2001/02 to Record
Monitoring EU Agri-Food Trade: Development until September 2018
 Monitoring EU Agri-Food Trade: Development until September 2018 September 2018: Slowdown in EU export performance; imports from Brazil and US still on the rise The monthly value of EU agri-food trade in
MARCOS S. JANK. JAPAN BRAZIL Bilateral Dynamics and Partnership in the Agri-Food Sector
 MARCOS S. JANK JAPAN BRAZIL Bilateral Dynamics and Partnership in the Agri-Food Sector JAPAN-BRAZIL BUSINESS COUNCIL Tokyo, Japan 24 th July 2018 Japan and Brazil Competitive Advantages in the Agri-Food
Milk and Milk Products: Price and Trade Update
 Milk and Milk Products: Price and Trade Update June 217 * International dairy prices The FAO Dairy Price Index averaged 29 points in June, up 16 points (8.3 percent) from January 217 and 71 points (51.5
Citrus: World Markets and Trade
 United States Department of Agriculture Foreign Agricultural Service Citrus: World Markets and Trade Oranges Global orange production for 2012/13 is forecast to drop over 4 percent from the previous year
PHILIPPINES. 1. Market Trends: Import Items Change in % Major Sources in %
 PHILIPPINES A. MARKET OF FRESH FRUITS & VEGETABLES 1. Market Trends: Import Items 2003 2007 Change in % Major Sources in % Value Quantity Value Quantity Value Quantity USD '000 Tons USD '000 Tons Grapes
MMT / / / / / /05* *Forecast. United States Department of Agriculture. Foreign Agricultural Service
 United States Department of Agriculture Foreign Agricultural Service Circular Series FOP 12-04 December 2004 Brazilian Soybean Exports Revised Higher in 2003/04, Gain in U.S. Dominated Markets Brazil s
Citrus: World Markets and Trade
 Department of Agriculture eign Agricultural Service January Citrus: World Markets and Trade Citrus: / ecast Global Orange Production and Trade Expand Global production and trade for is forecast at. million
South American Soybeans Continue to Gain World Market Share
 United States Department of Agriculture Foreign Agricultural Service Circular Series FOP 01-04 January 2004 South American Soybeans Continue to Gain World Market Share Percent 70 60 50 40 30 20 10 S. Amer
China Importing Record Levels of Soybeans
 United States Department of Agriculture Foreign Agricultural Service Circular Series FOP 10-03 October 2003 China Importing Record Levels of Soybeans 25,000 20,000 1,000 MT 15,000 10,000 5,000 0 1997/98
DEVELOPMENTS IN STEEL SCRAP IN 2009
 DEVELOPMENTS IN STEEL SCRAP IN 2009 AMERICAN SCRAP COALITION WASHINGTON, DC DEVELOPMENTS IN STEEL SCRAP 2009 The year 2009 demonstrated that the United States continues to experience a crisis with respect
Market Implications for GM Crops
 Market Implications for GM Crops By Lloyd George www.farmhorizons.com Ph 03 9573 98 lloyd@farmhorizons.com Agriculture Australia 2003 Melbourne 12-14 August Farm Horizons Australian grain information service
3.7.1 World exports and EU external trade in all products, agricultural products ( 1 ) and other products 10/01/2014 EU-27 (Mrd EUR)
 and other products 10/01/2014 EU-27 (Mrd EUR)") 3.7.1 World exports and EU external trade in all products, agricultural products ( 1 ) and other products 10/01/2014 EU-27 (Mrd EUR) 2007 2008 2009 2010 2011 2012 1 2 3 4 5 6 7 World exports ( 2 ) - All
3.7.1 World exports and EU external trade in all products, agricultural products ( 1 ) and other products 10/01/2014 EU-27 (Mrd EUR) 2007 2008 2009 2010 2011 2012 1 2 3 4 5 6 7 World exports ( 2 ) - All
Chinese Peanut Exports Hit Record High
 United States Department of Agriculture Foreign Agricultural Service Circular Series FOP 04-03 April 2003 Chinese Peanut Exports Hit Record High 600 500,000 MT 400 China US 300 Vietnam Argentina 200 India
Soybean Exports Top 66 MMT in 2005/06
 United States Department of Agriculture Foreign Agricultural Service Circular Series FOP 6-05 June 2005 Soybean Exports Top 66 MMT in 2005/06 35 30 Major Exporters Major Importers 25 MMT 20 15 10 5 0 Argentina
World Palm Oil Imports
 United States Department of Agriculture Foreign Agricultural Service Circular Series FOP 11-03 November 2003 World Palm Oil Imports 20,000 1,000 MT 15,000 10,000 5,000 0 1999/00 2000/01 2001/02 2002/03
China s Vegetable Oil Imports Forecast to Reach a Record in 2004/05
 United States Department of Agriculture Foreign Agricultural Service Circular Series FOP 09-04 September 2004 China s Vegetable Oil Imports Forecast to Reach a Record in 2004/05 Million Tons 8 8 7 Soy
Commodity Profile of Edible Oil for July
 Commodity Profile of Edible Oil for July - 2018 As on 23.07.2018 Contents 1. Edible Oil estimates for India (marketing year- November 2017- October 2018)... 2 2. Production Trend of Domestic Oilseeds...
Revised World Coffee Production Forecast Remains on Track for Record 140
 United States Department of Agriculture Foreign Agricultural Service Circular Series FTROP 4-8 December 28 Revised World Coffee Forecast Remains on Track for Record 14 12 Million 6 kilo bags 1 8 6 4 2
Stocks Build as Soybean Supply Rises in 2004/05
 United States Department of Agriculture Foreign Agricultural Service Circular Series FOP 06-04 June 2004 Stocks Build as Soybean Supply Rises in 2004/05 Percent Change from 2003/04 14% 12% 10% 8% 6% 4%
U.S. Imports of Soybeans, Meal, and Oil
 United States Department of Agriculture Foreign Agricultural Service Circular Series FOP 03-04 March 2004 U.S. Imports of Soybeans, Meal, and Oil 1,000 MT 450 400 350 300 250 200 150 100 50 0 '99/00 '00/01
Outline. Long-term Outlook for Cotton Consumption. World End-Use Consumption of Textile Fibers. World Consumption of Textile Fibers
 World Cotton Supply and Use International Cotton Advisory Committee Secretariat Outline! Long-term Outlook for Consumption! Outlook for /! Developments in World Cotton Trade Fifth Open Session: Cotton
U.S. Dry Bean Market Update: 2018
 U.S. Dry Bean Market Update: 2018 Suzanne Thornsbury and Jennifer Bond U.S. Dry Bean Convention U.S. Dry Bean Market Update: 2013 Dr. Suzanne Bonita Thornsbury Springs, FL and Hodan Farah Wells July 24,
U.S. Oilseeds and Products Imports Rise Significantly in FY 2004
 United States Department of Agriculture Foreign Agricultural Service Circular Series FOP 1-05 January 2005 U.S. Oilseeds and Products Imports Rise Significantly in FY 2004 2.5 2 Billion Dollars 1.5 1 0.5
Major California Agricultural Exports to the Top Destinations in 1999* (1) Canada Rank Approximate Export Value (millions)
 Canada Rank Approximate Export Value (millions)") (1) Canada Rank Approximate Export Value (millions) Table Grapes 1 119 Tomatoes, Processed 2 115 Lettuce 3 102 Wine 4 84 Strawberries 5 78 Carrots 6 50 Tomatoes, Fresh 7 43 Peaches/Nectarines 8 42 Broccoli
(1) Canada Rank Approximate Export Value (millions) Table Grapes 1 119 Tomatoes, Processed 2 115 Lettuce 3 102 Wine 4 84 Strawberries 5 78 Carrots 6 50 Tomatoes, Fresh 7 43 Peaches/Nectarines 8 42 Broccoli
2012 EXPORT HIGHLIGHTS BRITISH COLUMBIA AGRIFOODS
 2012 EXPORT HIGHLIGHTS BRITISH COLUMBIA AGRIFOODS REVISED FEBRUARY 2014 Table of Contents British Columbia Agrifoods Export Highlights - 2012... 1 Total BC Agrifoods Exports... 1 Top BC Agrifoods Exports
Quarterly AGRI-FOOD TRADE HIGHLIGHTS
 Quarterly AGRI-FOOD TRADE HIGHLIGHTS First Quarter 1998 Agriculture and Agri-Food Canada Agriculture et Agroalimentaire Canada QUARTERLY AGRI-FOOD TRADE HIGHLIGHTS FIRST QUARTER 1998 NO. 98:1 JULY 1998
Coffee: World Markets and Trade
 United States Department of Agriculture Foreign Agricultural Service June 2016 Coffee: World Markets and Trade 2016/17 Forecast Overview World coffee production for 2016/17 is forecast to rise 2.4 million
India: Soybean Oil Forecast to Gain Larger Share of Import Market in 2004/05
 United States Department of Agriculture Foreign Agricultural Service Circular Series FOP 3-5 March 25 India: Soybean Oil Forecast to Gain Larger Share of Import Market in 8 Percentage 6 4 2 2/1 21/2 22/3
World Yoghurt Market Report
 World Yoghurt Market Report 2000-2020 Price: 1,800 /$2,200 The report contains 330 pages of valuable information Analysis of the current market situation and future possibilities in all regions of the
Milk and Milk Products. Price and Trade Update: October
 October Milk and Milk Products Price and Trade Update Weekly Newsletter Milk and Milk Products Price and Trade Update: October 1 INTERNATIONAL PRICES: Weak import demand causes prices to fall International
Coffee: World Markets and Trade
 United States Department of Agriculture Foreign Agricultural Service June 2017 Coffee: World Markets and Trade 2017/18 Forecast Overview World coffee production for 2017/18 is forecast at 159 million bags
EMBARGO TO ON FRIDAY 16 SEPTEMBER. Scotch Whisky Association. Exports of Scotch Whisky; Year to end of June 2016 (2016 H1)
") EMBARGO TO 00.01 ON FRIDAY 16 SEPTEMBER Scotch Whisky Association Exports of Scotch Whisky; Year to end of June 2016 (2016 H1) VOLUME UP 3.1% to 531 MILLION bottles VALUE DOWN SLIGHTLY BY 1.0% TO 1.70
EMBARGO TO 00.01 ON FRIDAY 16 SEPTEMBER Scotch Whisky Association Exports of Scotch Whisky; Year to end of June 2016 (2016 H1) VOLUME UP 3.1% to 531 MILLION bottles VALUE DOWN SLIGHTLY BY 1.0% TO 1.70
US-MEXICO AGRICULTURAL PARTNERSHIP. March 2017
 US-MEXICO AGRICULTURAL PARTNERSHIP March 2017 Before 1994 Lack of clarity about trade and investment rules Lack of skills needed to compete in the global marketplace Limited competition Focus mainly on
Global Considerations
 What Does Being a Global Player Mean to the U.S. Dairy Sector? Global Considerations 2 1 A Decade of Change $8, 4,5 $7, 4, (Million $) $6, $5, $4, $3, $2, $1, 3,5 3, 2,5 2, 1,5 1, 5 (Million Lbs.) $ 23
U.S. Produce Imports from Mexico
 USDA iiiiillllllllll United States Department of Agriculture U.S. Produce Imports from Mexico Linda Calvin and Steven Zahniser U.S. Department of Agriculture Economic Research Service Presentation to the
Coffee: World Markets and Trade
 United States Department of Agriculture Foreign Agricultural Service Circular Series December 213 Coffee: World Markets and Trade 4 in Producing Countries to Continue Rising Million 6 Kilogram Bags 3 2
2017 BRITISH COLUMBIA AGRIFOOD AND SEAFOOD INTERNATIONAL EXPORT HIGHLIGHTS
 BRITISH COLUMBIA AGRIFOOD AND SEAFOOD INTERNATIONAL EXPORT HIGHLIGHTS Table of Contents B.C. AGRIFOOD AND SEAFOOD INTERNATIONAL EXPORT HIGHLIGHTS -... 3 B.C. AGRIFOOD AND SEAFOOD INTERNATIONAL EXPORTS...
Milk and Milk Products. Price and Trade Update. Weekly Newsletter. Milk and Milk Products. Price and Trade Update: April
 April Milk and Milk Products Price and Trade Update Weekly Newsletter Milk and Milk Products Price and Trade Update: April 1 PRICES: Remain depressed International dairy product prices began the year at
Overview of the Manganese Industry
 39th Annual Conference Istanbul, Turkey 2013 Overview of the Manganese Industry International Manganese Institute Alberto Saavedra Market Research Manager June, 2013 Introduction Global Production Supply,
THIS REPORT CONTAINS ASSESSMENTS OF COMMODITY AND TRADE ISSUES MADE BY USDA STAFF AND NOT NECESSARILY STATEMENTS OF OFFICIAL U.S.
 THIS REPORT CONTAINS ASSESSMENTS OF COMMODITY AND TRADE ISSUES MADE BY USDA STAFF AND NOT NECESSARILY STATEMENTS OF OFFICIAL U.S. GOVERNMENT POLICY Required Report - public distribution Date: GAIN Report
Commodity Profile of Edible Oil for November
 Commodity Profile of Edible Oil for November - 2017 As on 20.11.2017 Contents 1. Edible Oil estimates for India ( marketing year- November 2016- October 2017)... 2 2. Production Trend of Domestic Oilseeds...
Tuna Trade. Fatima Ferdouse
 Tuna Trade Fatima Ferdouse HIGHLIGHTS East Asia is the world s largest processing and exporting region for canned tuna. Producing countries in the region also depend on imported raw materials The fluctuating
2015 EXPORT HIGHLIGHTS BRITISH COLUMBIA AGRIFOOD & SEAFOOD
 2015 EXPORT HIGHLIGHTS BRITISH COLUMBIA AGRIFOOD & SEAFOOD Table of Contents BRITISH COLUMBIA AGRIFOOD & SEAFOOD EXPORT HIGHLIGHTS 2015...3 TOTAL VALUE OF B.C. AGRIFOOD & SEAFOOD EXPORTS ($ BILLIONS)...
LETTER FROM THE EXECUTIVE DIRECTOR
 E LETTER FROM THE EXECUTIVE DIRECTOR COFFEE MARKET REPORT January 2010 The upward trend in coffee prices recorded in December2009 continued during the first fortnight of 2010, with the monthly average
Asia Pacific Tuna Trade. Shirlene Maria Anthonysamy INFOFISH Pacific Tuna Forum 2017 Papua New Guinea
 Asia Pacific Tuna Trade Shirlene Maria Anthonysamy INFOFISH Pacific Tuna Forum 217 Papua New Guinea JAPANESE MARKET Demand for sashimi tuna remains highly seasonal strengthening during the spring festivals
WORLD OILSEEDS AND PRODUCTS
 WORLD OILSEEDS AND PRODUCTS 218 / World Oilseeds and Products: FAPRI 2004 Agricultural Outlook World Soybean and Soybean Products The world soybean price climbed strongly in 2003/04, driven by robust demand
World Agricultural Outlook Board Interagency Commodity Estimates Committee Forecasts. Lockup Briefing February 10, 2015
 World Agricultural Outlook Board Interagency Commodity Estimates Committee Forecasts Lockup Briefing World Wheat Production Country or Region Million Tons Percent Percent World 716.1 725.0 0.2 1.2 United
United States Is World Leader in Tree Nut Production and Trade
 Special Article United States Is World Leader in Tree Nut and Trade by Doyle C. Johnson Abstract: Crops of all major U.S. tree nuts will be larger in 997. However, beginning stocks of most tree nuts are
LETTER FROM THE EXECUTIVE DIRECTOR
 E LETTER FROM THE EXECUTIVE DIRECTOR COFFEE MARKET REPORT December 2008 Price levels in December confirmed the downward trend recorded in the coffee market since September 2008. The monthly average of
IANSA Seminar Presentation
 ENERGY UK Ltd. IANSA Seminar Presentation Thursday 22 nd August Raw Sugar Price - Spot Futures Month 2 000 mt Global Sugar Balance (May / Apr basis) 190 000 180 000 170 000 160 000 08/09-8.6 mmt 09/10-6.2
AGRI-FOOD TRADE STATISTICAL FACTSHEET. European Union - OECD (excl EU incl US Virgin Isl)
") European Commission Directorate-General for Agriculture and Rural Development AGRI-FOOD TRADE STATISTICAL FACTSHEET European Union - OECD (excl EU incl US Virgin Isl) Notes to the reader: The data used
European Commission Directorate-General for Agriculture and Rural Development AGRI-FOOD TRADE STATISTICAL FACTSHEET European Union - OECD (excl EU incl US Virgin Isl) Notes to the reader: The data used
LETTER FROM THE EXECUTIVE DIRECTOR
 E LETTER FROM THE EXECUTIVE DIRECTOR COFFEE MARKET REPORT August 2009 Although the monthly average of the ICO composite indicator price increased by 4% in August, from 112.90 US cents per lb in July to
and the World Market for Wine The Central Valley is a Central Part of the Competitive World of Wine What is happening in the world of wine?
 The Central Valley Winegrape Industry and the World Market for Wine Daniel A. Sumner University it of California i Agricultural l Issues Center January 5, 211 The Central Valley is a Central Part of the
much better than in As may be seen in Table 1, the futures market prices for the next 12 months
 Dairy Outlook December 2009 By Jim Dunn Professor of Agricultural Economics, Penn State University Market Psychology prices are higher than last month, especially Class IV. The outlook for dairy prices
EU Cereals Trade 2014/15 Marketing Year July - June. AGRI C 4 Committee for the Common Organisation of Agricultural Markets 27 August 2015
 EU Cereals Trade Marketing Year July - June AGRI C 4 Committee for the Common Organisation of Agricultural Markets 27 August 215 mio t 6 5 4 3 EU 28 - Cereals exports and imports from 2/1 to including
MONTHLY COFFEE MARKET REPORT
 E MONTHLY COFFEE MARKET REPORT December 2011 In December 2011 Arabica prices underwent significant downward corrections while Robusta prices increased slightly. The average of the 2 nd and 3 rd positions
EU28: Main exported Agricultural products (average in million Euro)
") EU28: Main exported Agricultural products (average 2011-2013 - in million Euro) Agricultural products Spirits and liqueurs Wine and vermouth Wheat Pork meat (fresh, chilled or frozen), w/o preparations
EU28: Main exported Agricultural products (average 2011-2013 - in million Euro) Agricultural products Spirits and liqueurs Wine and vermouth Wheat Pork meat (fresh, chilled or frozen), w/o preparations
GAIN Report Global Agriculture Information Network
 Foreign Agricultural Service GAIN Report Global Agriculture Information Network Voluntary Report - public distribution Date: 5/26/2000 China, Peoples Republic of GAIN Report #CH0612 Trade data - Multiple
World of sugar PAGE 54
 World of sugar More than 1 countries produce sugar, about 8% of which is made from sugar cane grown primarily in the tropical and sub-tropical zones of the southern hemisphere, and the balance from sugar
Opportunities for EU Sugar Post-2017
 Opportunities for EU Sugar Post-2017 Lindsay Jolly Senior Economist Structure of the Presentation - The possible impact of the EU quota abolition in 2017 - Price scenarios and changes to the EU sugar balance
AGRI-FOOD TRADE STATISTICAL FACTSHEET. European Union - Sub-Saharan Africa
 European Commission Directorate-General for Agriculture and Rural Development AGRI-FOOD TRADE STATISTICAL FACTSHEET European Union - Sub-Saharan Africa Notes to the reader: The data used in this factsheet
WORLD PISTACHIO TRADE
 WORLD PISTACHIO TRADE 2017 Schramm, Williams & Associates, Inc. October 2017, First Edition Copyright 2008 through 2017 Schramm, Williams & Associates, Inc. Printed in the United States of America. All
AGRI-FOOD TRADE STATISTICAL FACTSHEET. European Union - ASEAN (Association Of South-East Asian Nations)
") European Commission Directorate-General for Agriculture and Rural Development AGRI-FOOD TRADE STATISTICAL FACTSHEET European Union - ASEAN (Association Of South-East Asian Nations) Notes to the reader:
European Commission Directorate-General for Agriculture and Rural Development AGRI-FOOD TRADE STATISTICAL FACTSHEET European Union - ASEAN (Association Of South-East Asian Nations) Notes to the reader:
U.S. Share of World Soybean Exports Declines Despite Record Exports Expected in 2001/02
 United States Department of Agriculture Foreign Agricultural Service Circular Series FOP 12-01 December 2001 U.S. Share of World Soybean Exports Declines Despite Record Exports Expected in 2001/02 Percent
Consistently higher production and more exportable supplies from Thailand are major factors in the decline in world rice prices in 2014 and continued
 Rice Consistently higher production and more exportable supplies from Thailand are major factors in the decline in world rice prices in 2014 and continued lower levels over the next ten years. Part of
What Does Being a Global Player Mean to the U.S. Dairy Sector?
 What Does Being a Global Player Mean to the U.S. Dairy Sector? Global Considerations Copyright of Daily Dairy Report, Inc. 2 A Decade of Change $8,000 4,500 $7,000 4,000 (Million $) $6,000 $5,000 $4,000
For personal use only
 SEPTEMBER 216 GLOBAL DAIRY UPDATE European milk production has decreased for the first time since early 215, with volumes in June down 2 compared to last year. Last week we announced our annual results,
EU-28: Main imported Agricultural products (average in million Euro)
") EU-28: Main imported Agricultural products (average 2011-2013 - in million Euro) Oilcakes Soyabeans Cocoa Oilseeds, other than soyabeans Raw tobacco Cereals, other than wheat and rice Beet and cane sugar
EU-28: Main imported Agricultural products (average 2011-2013 - in million Euro) Oilcakes Soyabeans Cocoa Oilseeds, other than soyabeans Raw tobacco Cereals, other than wheat and rice Beet and cane sugar