23 25 th Nov., Dr. B. V. Mehta, Executive Director The Solvent Extractors Association of India
|
|
|
- Valerie Webster
- 5 years ago
- Views:
Transcription
1 India s Long Term Demand for Palm Oil at 12 th Indonesian Palm Oil Conference and 2017 Price Outlook By Dr. B. V. Mehta, Executive Director The Solvent Extractors Association of India (Premier Association of Vegetable Oil Industry & Trade) th Nov., 2016 Bali, Indonesia 1
2 SEA Profile Formed in 1963 to foster the development & growth of the Solvent Extraction Industry in India Largest and Premier Association in the Vegetable Oil Sector in India First Association in Vegetable Oil & Oilseed sector to receive ISO 9001 Certification in India (2004) and now upgraded to ISO 9001:2015. Recognised as NGO and TPO by Government of India 2
3 Presentation Roadmap 1. Indian Economy 2. Indian Agriculture Scenario 3. Indian Oilseed Sector 4. Consumption of Edible Oils in India 5. Demand Growth 6. Import of Edible Oils by India 7. Oil Palm & Palm Oil Production in India 8. Short Term and Long Term Projections 9. Conclusion 3
4 India Shining Growth Bumped Up (Projected Annual Growth in %) World Output Adv. Economies United States Euro Area China India
5 Indian General Economy & Recent Development 5
6 Demonitisation of Indian Currency (India s 9/11) Demonetization of high denomination Indian currency notes of Rs. 1,000 & Rs. 500 to control the black money and counterfeit currency notes in circulation 6

 16) Household")
7 Indian Macro-Economic Overview India a fast growing g significant economy in spite of global slowdown Strong Macro-economic fundamentals GDP Value: Over US$ 2.25 Trillion (Tn) Purchasing Power Parity (PPP): US$ 8.72 Tn Forex Reserve: US$ 368 Bn and growing FDI Flow US$ 40 Bn ( ) 16) Household Savings Rate 30.6% ( ) (world s highest) h 7
8 India's Overall GDP Growth e (%) rowth Rate GDP Gr The average GDP growth in last five years is registered at 6.8% For FY 16-17, GoI is projecting GDP growth at 7.6% Source : Economic Survey 8
9 Agriculture Sector GDP Growth ) iculture GDP Growth Rate (%) Agri Agriculture Sector Growth depends heavily on monsoon performance For the year , the GDP growth is pegged at 1.2% For , agri growth will be higher, thanks to good monsoon Source : Economic Survey 9
10 India s Oilseeds Production Scenario Demand - Supply and Import of Vegetable Oils 10
11 Oilseed Sector Area Under Oilseed Cultivation 26.9 Mn. Ha. Average yield * 757 kg Output of 9 cultivated Oilseeds * 20.3 MnT Output of Cottonseed & Copra * 11.5 MnT Total 31.8 MnT Production of Oilcake/meal 23.6 MnT Production Edible & Non-edible Veg. Oils 7.2 MnT Demand of Veg. Oils (Edible) 20.0 MnT Import of Veg. Oil (F)(Nov-Oct) (Edible) 15.8 MnT Per Capita consumption (2015) 15.8 kg Per capita consumption is rising by 5 to 5.5% per annum MnT = Million Tonnes * Trade Estimate 11
12 Oilseeds Production (Trade Estimate) ( to ) (Qty. in Million Tonnes) Crop (E) Major Oilseeds Groundnut Rape/Mustard Soybean Sesamum Sunflower Safflower Niger Linseed Castor Sub-Total Others Cottonseed Copra Grand Total Note : Government estimate for major nine oilseeds is higher than trade estimate. For the year , it was 25.3 Mnt. (20.3 Mnt.) and 27.5 Mnt (21.1 Mnt.) for the year


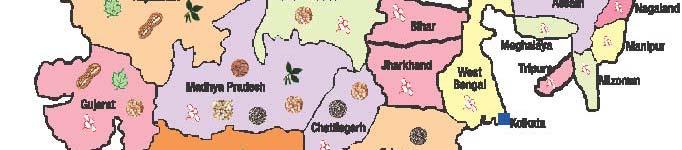

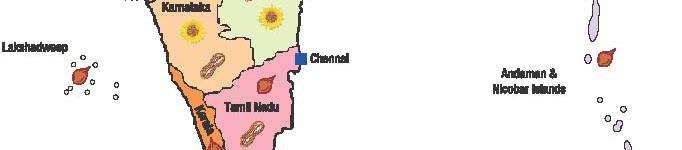
13 Major Oilseeds Producing States in India 13
14 Consumption 14
15 Per Capita (kg) Disappearance of Oils and Fats in Selected Countries and World Country EU U.S.A Argentina China India Pakistan Indonesia Bangladesh Turkey Thailand World Number shown includes consumption of oils and fats for Bio-energy / Nonedible purpose Source : Oil World
16 Change in Edible Oil Consumption in India Particulars Qty : 000 T Qty % Qty % Qty % Palm Oil Soy Oil Mustard Oil Sunflower Oil Cotton Oil Groundnut Oil RBO & Other Oils Total % % % Consumption of Palm oil in India is now nearly 45% of the total oil consumption followed by Soybean oil and Rapeseed oil Source : GGN Research 16
17 India has promising demand growth 17
18 India has Promising Demand Growth Demand Drivers in India are Average GDP growth rate for period FY09-10 to FY14-15 was 6.8% Big emerging Indian middle class Double digit growth of out of home consumption of edible oils Per capita consumption of Edible oils in India at 15.9 kg ( ) is still a lot below threshold level of consumption Even with a moderate population growth, the absolute increase in number of people p is quite higher Indian Edible Oils demand is both switchable and elastic: Switchable to other oils to quite an extent & is elastic to an extent 18
19 Demand / Consumption of Edible Oils in India Projections up to 2025 Consumption in MnT For Demand Scenario up to 2025 High growth in income levels, increasing trend in spending & better living standards High growth in consumption of edible oils and the consumption may reach 26.8 MnT by 2025 from present level of 20 MnT, ie, a 3% growth every year 19
20 Edible Oil Demand- Long Term Projection Year 1.76% Growth In Bn. Consumption Consumption 3% 4% 5% Growth Per Per Per Capita MnT Capita MnT Capita (In Kg) (In Kg) (In Kg) MnT Due to lower consumption base, demand could grow at 4% or 5% (Excluding Non-edible Oils) By 2025, India may consume 30 MnT (at 4% growth) or 34 MnT (at 5% growth) 20
21 Consumption & Characteristics of Indian Consumer for Palm Oil Palm is the main oil in Out-of-Home consumption like HORECA, chips - savory manufacturers etc., nearly 45% of total consumption Palm being the most economical edible oil which is lower by Rs per 10 kgs or$ per tonne from other edible oils and is also used in blending with other oils Palm Oil is consumed the most by lower income category of Indian society Also the Indian edible oil demand is quiet elastic and does reduce or increase to an extent with change in prices 21
22 Consumption & Characteristics of Indian Consumer Share of Average food budget is 47% v/s Total expenditure budget of an average middle class consumer, which justifies their sensitivity towards oil price Indian housewife prefer Sunflower oil being Golden Colour Oil Soft oil consumption and import is rising with their demand and fall in domestic production Consumption of Rice Bran Oil is increasing speedily on the health ground benefits it offers Cottonseed Oil is accepted as good cooking oil and its Consumption rising 22
23 Import of Edible Oils by India 23
24 India - Import Duty Structure on Edible Oils Oct., 2016 Item Description WTO Bound Rate Duty on Crude Edible Oils Duty on Refined Edible Oils Current Tariff Value US$/Ton (15-Nov-16) Soybean Oil 45% 12.5% 20% 866 RBD Palmolein 300% -- 15% 750 Crude Palm Oil (CPO) 300% 7.5% Sunflower Oil 100% 12.5% 20% - Rape/Mustard Oil 75% 12.5% 20% - Import duty is calculated on tariff value declared every forth night 24
25 India Country Wise Imports of Edible Oils (Figures in 000T) Country Jan.- Oct. Jan. Dec. Jan.-Dec. Jan.- Dec. Jan.- Dec Soybean Oil U.S.A Argentina Brazil Other Countries Total Sunflower Oil Ukraine Argentina Other Countries Total Palm Oil Indonesia Malaysia Thailand Other Countries Total Other Oils Grand Total Source: OILWORLD 25
26 Palm Oil Imports by India (Qty. in 000 Tons) 2016 (Jan.-Oct.) 2015 (Jan.-Dec.) 2014 (Jan.-Dec.) 2013 (Jan.-Dec.) Country Palm Oil Palm Kernel Oil Palm Oil Palm Kernel Oil Palm Oil Palm Kernel Oil Palm Oil Palm Kernel Oil Indonesia Malaysia Thailand Others Total Source : Oil World 26
27 Import of RBD Palmolein v/s Total Import of Palm Oil 35% 30% 32% 25% 27% 20% 15% 17% 21% 20% 18% 10% 5% 0%
28 Average Landed Cost of RBD Olein & CPO US S$/ T CIF India Year (Nov Oct) RBD Olein CPO Difference (-) Nov Jan Feb Mar Apr June No Difference July Aug Sept Oct th Nov., No Difference As on8 th Nov., 2016, the CPO CIF India werequotedatus$ 730/MT and RBD Palmolein was also quoted at US$ 730/MT. The diminishing difference is seriously affecting viability of Indian refiners 28
29 Major Indian Ports - Imports of Edible Oils 29
30 Port-wise Imports Of Edible Oils Ports Palm Oils Soft Total Palm Soft Oils Oils Oils (Qty. in 000 Tons) Total Kandla Haldia JNPT Mundra Chennai Krishanapattinam Kakinada Mangalore Budge-Budge Others Total Source: SEA Data Bank 30
31 Import of Palm Oils v/s. Soft Oils (Qty. in MT) Year Palm Oil Soft Oil Total (Nov-Oct) (RBD Palmolein + Soybean + Sunflower CPO + Crude Olein + + CPKO) Rape (Canola) ,809, % 798, % 5,608, ,535,448 80% 1,647,912 20% 8,183, ,499,255 74% 2,324,083 26% 8,823, ,547,086 78% 1,824,373 22% 8,371, ,669,424 77% 2,312,042 23% 9,981, ,292,433, 80% 2,092,306, 20% 10,384,739, ,957,960 68% 3,660,374 32% 11,618, ,536, % 4,884,367 34% 14,421, ,442,840 58% 6,128,498 42% 14,571,338 31
32 Indian Kharif (Summer) & Rabi (Winter) Oilseeds Production During and Estimate for (Qty. in Mn. Tons) Oilseeds (Est.) Kharif Rabi Total Kharif Rabi Total Y-o-Y Change Groundnut Soybean Rapeseed Sunflower Sesame Safflower Total Source : GGN Research 32
33 Domestic Edible Oil Production During and Estimate for (Qty. in Mn. Tons) Oils (Est.) Y-o-Y YChange Groundnut Oil Soybean Oil Rapeseed Oil Sunflower Oil Sesame Oil Cottonseed Oil RBO Edible Oil Others Oils Total Source : GGN Research 33
34 Import of Edible Oil - Projections for IMPORT BREAK-UP (Mn T) (Nov.- Oct.) Oils (F) Palm (Edible) Soybean Oil Sun Oil Rapeseed Oil TOTAL India needs additional over a million tons of edible oil every year to meet the growing requirements 34


35 OIL PALM IN INDIA 35
36 Indian Oil Palm Cultivation Map 36
37 Domestic CPO Production and Projection To Actual Projection Oil Year Domestic Oil Year Domestic (Nov - Oct) CPO Production (Nov - Oct) CPO Production , MT , MT ,000 MT ,000 MT ,000 MT ,000 MT ,000 MT ,000 MT ,000 MT ,000 MT ,000 MT 37
38 Whether India is ready to Embrace Sustainability? India s Domestic Oil Palm Plantation is environmentally sound as its grown on the land which were earlier under cultivation and not forest land India supports sustainability People in the EU & developed countries can afford to pay a higher price for certified Palm Oil but in India, where millions are struggling for food and to clothe themselves, will be reluctant to pay higher price for Certified Palm Oil 38
39 Way Forward to Promote Certified ed Palm Oil in India Average Indian buyer / consumer is looking solely at the cost. Onus is on the Exporting Countries to make sustainable attractive palm oil If Palm Oil producing countries wish to promote the export of sustainable palm oil, it must rectify its export tax structure. At the very least, it must reduce export taxes on Certified Sustainable Crude Palm oil to encourage its Import by India and other developing countries This will not only create demand but will also encourage palm oil planters in Indonesia and Malaysia to produce sustainable palm oil Nothing work like monetary benefit SEA supports usage of certified palm oil in India 39
40 Conclusion India has been an importer of edible oils for long years because of a mismatch between demand and domestic production. In recent years, the supply shortfall has widened rapidly, driven by rising incomes and population p pressure Every increase in income translates to a rise in demand for food products including cooking oil. Consumption-driven demand growth has outstripped domestic supply growth, increasing the country's import dependence to nearly 70% The latest mantra of the Indian Government is Make in India. It means value addition within the country Cont.. 40
41 Conclusion Cont.. Furtherance to this objective, Government of India is seriously considering i to reduce the Duty on some Oilseeds from present 30% to 5 or 10%, if this happens, it would encourage import of high content oilseeds like Rapeseed and Sunflower seeds. This will change the current level of Import of Vegetable Oil by India, as it happened in China few years back Inverted duty structure by Indonesia and Malaysia losing Indian market and all incremental growth is taking by soft oils. Palm Oil exporting countries may have to relook their export duty structure to maintain their share in Indian Market Lastly, there may be some drop in Imports by India due to recent demonitisation of Indian currency which has lead to reduced demand by end consumer arising from currency crunch. However, the import demandd will pick up once normalcy returns 41

 2202 1475. 2282 2979, Fax.")
42 Dr. B. V. Mehta Executive Director The Solvent Extractors Association of India A Premier Association of Vegetable Oil Industry & Trade in India ISO 9001:2015 Organisation 142, Jolly Maker Chambers No. II, 14 th Floor, 225, Nariman Point, Mumbai Tel: (+91-22) , Fax.: (+91-22) solvent@mtnl.net.in, Website: File : H:/word/Presentation /12 th Indonesian Palm Oil Conference and 2017 Price Outlook th Nov.,2016, Bali, Indonesia Date : 18 th Nov.,
World Scenario: Oilseed Production
 World Scenario: Oilseed Production Commodity 13/14 (Million Ton) 16/17 (Million Ton) Soybean 280.3 352 Sunflower seed 43.6 48.22 Rapeseed 69.6 63.13 Cotton Seed 44.4 39.52 Groundnuts 28.4 30.32 Palm-kernal
Commodity Profile of Edible Oil for July
 Commodity Profile of Edible Oil for July - 2018 As on 23.07.2018 Contents 1. Edible Oil estimates for India (marketing year- November 2017- October 2018)... 2 2. Production Trend of Domestic Oilseeds...
India. Oilseeds and Products Update. August 2012
 THIS REPORT CONTAINS ASSESSMENTS OF COMMODITY AND TRADE ISSUES MADE BY STAFF AND NOT NECESSARILY STATEMENTS OF OFFICIAL U.S. GOVERNMENT POLICY Required Report - public distribution Oilseeds and Products
MONTHLY REPORTS EDIBLE OIL JUNE - JULY 2016
 MONTHLY REPORTS EDIBLE OIL Monthly Prices Movement Edible Oil prices remained volatile in June month tracking movement in Indian Rupee and uncertain fundamentals. Soy Oil prices remained mixed with more
Commodity Profile of Edible Oil for May
 Commodity Profile of Edible Oil for May - 2017 As on 17.05.2017 Contents 1. Edible Oil estimates for India ( marketing year- November 2016- October 2017)... 2 2. Production Trend of Domestic Oilseeds...
GLOBOIL INTERNATIONAL Emerging Trends In The Edible Oil Sector A View From Pakistan.. Abdul Rasheed Janmohammed
 GLOBOIL INTERNATIONAL 2018 27-29 April, 2018 Hotel JW Marriott Marquis, Dubai, U.A.E. Emerging Trends In The Edible Oil Sector A View From Pakistan.. By Abdul Rasheed Janmohammed Chief Executive Chief
POC 2018 PALM & LAURIC OILS PRICE OUTLOOK CONFERENCE & EXHIBITION. Emerging Trends In The Edible Oil Sector A View From Pakistan..
 POC 2018 PALM & LAURIC OILS PRICE OUTLOOK CONFERENCE & EXHIBITION 5-7 March, 2018 Hotel Shangri-La, Kuala Lumpur Emerging Trends In The Edible Oil Sector A View From Pakistan.. By Abdul Rasheed Janmohammed
Commodity Profile of Edible Oil for November
 Commodity Profile of Edible Oil for November - 2017 As on 20.11.2017 Contents 1. Edible Oil estimates for India ( marketing year- November 2016- October 2017)... 2 2. Production Trend of Domestic Oilseeds...
Turkey... Growing Market for Vegoils & Fats
 Turkey... Growing Market for Vegoils & Fats Faik Genç AgriPro Limited Black Sea Grain, Kiev 13-14 April 2011 Main Topics 1. World Oils/Oilseeds& Sun Complex 2. Turkey 3. Turkish Oils & Oilseeds Balances
India. Oilseeds and Products Update
 THIS REPORT CONTAINS ASSESSMENTS OF COMMODITY AND TRADE ISSUES MADE BY USDA STAFF AND NOT NECESSARILY STATEMENTS OF OFFICIAL U.S. GOVERNMENT POLICY Required Report - public distribution Date: 11/28/2017
Outline. Long-term Outlook for Cotton Consumption. World End-Use Consumption of Textile Fibers. World Consumption of Textile Fibers
 World Cotton Supply and Use International Cotton Advisory Committee Secretariat Outline! Long-term Outlook for Consumption! Outlook for /! Developments in World Cotton Trade Fifth Open Session: Cotton
Monthly Report (May) Oil Seeds
 Oil Seeds") May 16, 2016 Monthly Report (May) Oil Seeds Subhranil Dey Sr. Research Analyst subhranildey@smcindiaonline.com Price movement of Oilseeds on NCDEX & MCX (April 2016) (% Change) 15.00 12.42 10.00 5.52 5.00
May 16, 2016 Monthly Report (May) Oil Seeds Subhranil Dey Sr. Research Analyst subhranildey@smcindiaonline.com Price movement of Oilseeds on NCDEX & MCX (April 2016) (% Change) 15.00 12.42 10.00 5.52 5.00
Overview of the Manganese Industry
 39th Annual Conference Istanbul, Turkey 2013 Overview of the Manganese Industry International Manganese Institute Alberto Saavedra Market Research Manager June, 2013 Introduction Global Production Supply,
Long-term Outlook. Soy Bean Outlook Reasons
 Long-term Outlook SOY The Golden Bean Losing Its Sheen The production of oil seeds for 2005/06 is forecasted at 384 MMT on the global front. The bumper yields of cotton seed and huge stocks of mustard
Commodity Profile of Edible Oil for March
 Commodity Profile of Edible Oil for March - 2017 As on 21.03.2017 Contents 1. Edible Oil estimates for India ( marketing year- November 2016- October 2017)... 2 2. Production Trend of Domestic Oilseeds...
Ukrainian Market for Fruits and Vegetables. Oksana Varodi International Finance Corporation Berlin, Fruit Logistica 2011
 Ukrainian Market for Fruits and Vegetables Oksana Varodi International Finance Corporation Berlin, Fruit Logistica 2011 Content of the Presentation Production Trade Current challenges and opportunities
India is the world s fourth
 By: Dr M. ThamaraiKannan, Dr G. Palaniappan and Dr A. Sengottiyan EDIBLE OILS: Demand soaring Vegetable oil consumption in India has increased following a considerable rise in household incomes. To meet
Aug 17, Monthly Report (August) Oil Seeds
 Oil Seeds") Aug 17, 2016 Monthly Report (August) Oil Seeds Price movement of Oilseeds on CBOT, BMD, NCDEX & MCX (July 2016) (% Change) 0.00-2.00-1.12-0.38-4.00-3.38-2.65-2.37-6.00-6.10-8.00-10.00-12.00-14.00-12.88
Aug 17, 2016 Monthly Report (August) Oil Seeds Price movement of Oilseeds on CBOT, BMD, NCDEX & MCX (July 2016) (% Change) 0.00-2.00-1.12-0.38-4.00-3.38-2.65-2.37-6.00-6.10-8.00-10.00-12.00-14.00-12.88
Food & Allied. Edible Oilseed & Oil Industry. Industry Profile Industry Structure Industry Performance Regulatory Structure Key Challenges
 Food & Allied Edible Oilseed & Oil Industry Industry Profile Industry Structure Industry Performance Regulatory Structure Key Challenges February 2018 Industry Process Flow Edible Oilseed & Oil Industry
Commodity Profile of Edible Oil for August
 Commodity Profile of Edible Oil for August - 2017 As on 21.08.2017 Contents 1. Edible Oil estimates for India ( marketing year- November 2016- October 2017)... 2 2. Production Trend of Domestic Oilseeds...
ICC September 2018 Original: English. Emerging coffee markets: South and East Asia
 ICC 122-6 7 September 2018 Original: English E International Coffee Council 122 st Session 17 21 September 2018 London, UK Emerging coffee markets: South and East Asia Background 1. In accordance with
The supply and demand for oilseeds in South Africa
 THIS REPORT CONTAINS ASSESSMENTS OF COMMODITY AND TRADE ISSUES MADE BY USDA STAFF AND NOT NECESSARILY STATEMENTS OF OFFICIAL U.S. GOVERNMENT POLICY Required Report - public distribution Date: GAIN Report
Soybean Oil and Palm Oil Account For An Increasing Share of World Vegetable Oil Consumption
 United States Department of Agriculture Foreign Agricultural Service Circular Series FOP 01-03 January 2003 Soybean Oil and Palm Oil Account For An Increasing Share of World Vegetable Oil Consumption Percent
Update on ASEAN Steel Industry Development Scenario
 2017 ASEAN Iron and Steel Sustainability Forum Update on ASEAN Steel Industry Development Scenario Presented by: TAN AH YONG Secretary General South East Asia Iron and Steel Institute (SEAISI) CONTENTS:
COMMITTEE ON COMMODITY PROBLEMS INTERGOVERNMENTAL GROUP ON TEA NINETEENTH SESSION. New Delhi, India, May 2010
 May 2010 CCP:TE 10/CRS 19 E COMMITTEE ON COMMODITY PROBLEMS INTERGOVERNMENTAL GROUP ON TEA NINETEENTH SESSION New Delhi, India, 12 14 May 2010 MARKET DEVELOPMENTS IN SELECTED COUNTRIES INDIA Indian Tea-
(As on ) Commodity Profile for Pulses-May, 2016
 Commodity Profile for Pulses-May, 2016") (As on 17.05.2016) Commodity Profile for -May, 2016 Contents 1. estimates for India (2015-16)... 2 2. Domestic Production of Major... 2 3. Production of in India... 3 4. India s export &import of... 3
(As on 17.05.2016) Commodity Profile for -May, 2016 Contents 1. estimates for India (2015-16)... 2 2. Domestic Production of Major... 2 3. Production of in India... 3 4. India s export &import of... 3
DEVELOPMENTS IN STEEL SCRAP IN 2009
 DEVELOPMENTS IN STEEL SCRAP IN 2009 AMERICAN SCRAP COALITION WASHINGTON, DC DEVELOPMENTS IN STEEL SCRAP 2009 The year 2009 demonstrated that the United States continues to experience a crisis with respect
OPPORTUNITIES FOR SRI LANKAN VIRGIN COCONUT OIL IN TURKEY
 OPPORTUNITIES FOR SRI LANKAN VIRGIN COCONUT OIL IN TURKEY Prepared by: Embassy of Sri Lanka, Turkey June 2017 CONTENTS 1. SUMMARY... 3 2. MARKET DESCRIPTION... 3 3. POSITION OF SRI LANKAN VIRGIN COCONUT
South American Soybean Stocks (Argentina and Brazil) Expected to Increase in 2001/02 to Record Level Despite Record Exports
 Expected to Increase in 2001/02 to Record Level Despite Record Exports") United States Department of Agriculture Foreign Agricultural Service Circular Series FOP 02-02 February 2002 South American Soybean Stocks (Argentina and Brazil) Expected to Increase in 2001/02 to Record
United States Department of Agriculture Foreign Agricultural Service Circular Series FOP 02-02 February 2002 South American Soybean Stocks (Argentina and Brazil) Expected to Increase in 2001/02 to Record
WORLD OILSEEDS AND PRODUCTS
 WORLD OILSEEDS AND PRODUCTS 218 / World Oilseeds and Products: FAPRI 2004 Agricultural Outlook World Soybean and Soybean Products The world soybean price climbed strongly in 2003/04, driven by robust demand
Fresh Deciduous Fruit (Apples, Grapes, & Pears): World Markets and Trade
: World Markets and Trade") Million MT United States Department of Agriculture Foreign Agricultural Service December 21 Fresh Deciduous Fruit (Apples, Grapes, & Pears): World Markets and Trade 21/11 Forecast: World Apple Trade Declines;
Million MT United States Department of Agriculture Foreign Agricultural Service December 21 Fresh Deciduous Fruit (Apples, Grapes, & Pears): World Markets and Trade 21/11 Forecast: World Apple Trade Declines;
Peanut. Peanut. Description
 Peanut Description Groundnut is an oilseed derived from the fruit of the groundnut plant. It is referred to as a nut in general terms but it is not a nut exactly in actual terms, it is a seed rather and
Commodity Profile for Sugar, March, 2017
 (As on 10.3.2017) Commodity Profile for Sugar, March, 2017 Contents 1. Sugar Estimates for India... 2. World Sugar Estimates... 2 3. Production, Area under cultivation and Yield of Sugarcane and Sugar...
W or ld Cocoa and CBE mar kets. Presentation to Global Shea 2013 By Richard Truscott, LMC International, Oxford, UK
 W or ld Cocoa and CBE mar kets Presentation to Global Shea 2013 By Richard Truscott, LMC International, Oxford, UK www.lmc.co.uk Outline The use of CBEs Chocolate and CBE demand trends Cocoa production
Consistently higher production and more exportable supplies from Thailand are major factors in the decline in world rice prices in 2014 and continued
 Rice Consistently higher production and more exportable supplies from Thailand are major factors in the decline in world rice prices in 2014 and continued lower levels over the next ten years. Part of
Monitoring EU Agri-Food Trade: Development until March 2018
 Monitoring EU Agri-Food Trade: Development until March 2018 14.000 EU28: Export to Extra-EU of Agri-Food Products 13.000 12.000 11.000 10.000 2018 2017 2015 2016 2014 9.000 8.000 7.000 6.000 Jan Feb Mar
M03/330/S(2) ECONOMICS STANDARD LEVEL PAPER 2. Wednesday 7 May 2003 (morning) 2 hours INSTRUCTIONS TO CANDIDATES
 ECONOMICS STANDARD LEVEL PAPER 2. Wednesday 7 May 2003 (morning) 2 hours INSTRUCTIONS TO CANDIDATES") c PROGRAMA IB DIPLOMA PROGRAMME PROGRAMME DU DIPLÔME DU BI DEL DIPLOMA DEL BI M03/330/S(2) ECONOMICS STANDARD LEVEL PAPER 2 Wednesday 7 May 2003 (morning) 2 hours INSTRUCTIONS TO CANDIDATES! Do not open
c PROGRAMA IB DIPLOMA PROGRAMME PROGRAMME DU DIPLÔME DU BI DEL DIPLOMA DEL BI M03/330/S(2) ECONOMICS STANDARD LEVEL PAPER 2 Wednesday 7 May 2003 (morning) 2 hours INSTRUCTIONS TO CANDIDATES! Do not open
The supply and demand for oilseeds in South Africa
 THIS REPORT CONTAINS ASSESSMENTS OF COMMODITY AND TRADE ISSUES MADE BY USDA STAFF AND NOT NECESSARILY STATEMENTS OF OFFICIAL U.S. GOVERNMENT POLICY Required Report - public distribution Date: GAIN Report
Sunflower & Soybean Forum
 Sunflower & Soybean Forum 28 November 2016 Nico Hawkins General Manager Sunflower Sunflower: Supply & Demand National vs. International Marketing season SAGIS NAMC (S&D) International (USDA) Mar - Feb
THIS REPORT CONTAINS ASSESSMENTS OF COMMODITY AND TRADE ISSUES MADE BY USDA STAFF AND NOT NECESSARILY STATEMENTS OF OFFICIAL U.S.
 THIS REPORT CONTAINS ASSESSMENTS OF COMMODITY AND TRADE ISSUES MADE BY USDA STAFF AND NOT NECESSARILY STATEMENTS OF OFFICIAL U.S. GOVERNMENT POLICY Required Report - public distribution Date: GAIN Report
The evolving future of the sugar industry. José Orive, Executive Director International Sugar Organization
 The evolving future of the sugar industry José Orive, Executive Director International Sugar Organization 21 st Century Tectonic Shifts in the World Sugar Economy inter alia since 2001 world production
Corn and Soybean CORN OUTLOOK SOYBEAN OUTLOOK STATISTICS AND ANALYSIS
 Corn and Soybean CORN OUTLOOK SOYBEAN OUTLOOK STATISTICS AND ANALYSIS CLAL (and its officers, employees and auxiliary persons) shall not be liable to clients, web users or anyone else for any loss or injury
World Cocoa and CBE markets. Presentation to Global Shea 2014 By Owen Wagner, LMC International, Raleigh, NC
 World Cocoa and CBE markets Presentation to Global Shea 214 By Owen Wagner, LMC International, Raleigh, NC www.lmc.co.uk Outline Background to the chocolate and CBE markets Chocolate and CBE demand trends
Opportunities for EU Sugar Post-2017
 Opportunities for EU Sugar Post-2017 Lindsay Jolly Senior Economist Structure of the Presentation - The possible impact of the EU quota abolition in 2017 - Price scenarios and changes to the EU sugar balance
(As on ) Commodity Profile for Pulses-August, 2017
 Commodity Profile for Pulses-August, 2017") P a g e 1 (As on 30.08.2017) Commodity Profile for Pulses-August, 2017 Contents 1. Pulses estimates for India (2016-17)... 2 2. Domestic Production of Major Pulses... 2 3. Production of Pulses in India...
P a g e 1 (As on 30.08.2017) Commodity Profile for Pulses-August, 2017 Contents 1. Pulses estimates for India (2016-17)... 2 2. Domestic Production of Major Pulses... 2 3. Production of Pulses in India...
Outlook for the. ASEAN INTERNATIONAL SEMINAR ON COFFEE June 2012 Kuta, Bali, Indonesia
 Outlook for the World Coffee Market ASEAN INTERNATIONAL SEMINAR ON COFFEE 12 13 June 212 Kuta, Bali, Indonesia José Sette Head of Operations ICO Composite Indicator Price (in current terms) Monthly averages:
Oilseeds and Protein Crops market situation. Committee for the Common Organisation of Agricultural Markets. 27 September 2018
 Oilseeds and Protein Crops market situation Committee for the Common Organisation of Agricultural Markets 27 September 2018 1. World Oilseeds Contents 2. EU Oilseeds & Protein crops: areas & production
Commodity Profile for Sugar, September, 2017
 (As on 15.9.2017) Commodity Profile for Sugar, September, 2017 Contents 1. Sugar Estimates for India... 2 2. World Sugar Estimates... 2 3. Production, Area under cultivation and Yield of Sugarcane and
TURKEY ICAC RESEARCH ASSOCIATE PROGRAM 6-16 APRIL 2009 WASHINGTON D.C./USA SOME FACTS ABOUT SOME FACTS ABOUT SOME FACTS ABOUT
 ICAC RESEARCH ASSOCIATE PROGRAM TURKEY - Geographically, Turkey straddles two continents, Europe in the west and Asia in the east. - The two continents are divided by Istanbul and Dardanelles straits.
Coffee prices maintain downward trend as 2015/16 production estimates show slight recovery
 Coffee prices maintain downward trend as 2015/16 production estimates show slight recovery The coffee market fell again in December 2015, reaching its second lowest monthly average of the year. This decrease
July marks another month of continuous low prices
 July marks another month of continuous low prices In July 2018, the ICO composite indicator price decreased by 2.9% to an average of 107.20 US cents/lb, which is the lowest monthly average for July since
Coffee market ends 2016/17 coffee year in deficit for the third consecutive year
 Coffee market ends 2016/17 coffee year in deficit for the third consecutive year The ICO composite indicator continued its downward trend that started at the end of August, averaging 124.46 US cents/lb.
THE GLOBAL PULSE MARKETS: recent trends and outlook
 THE GLOBAL PULSE MARKETS: recent trends and outlook CICILS/IPTIC 2004 CONVENTION 10-12 12 June 2004 Beijing, China Boubaker BENBELHASSEN Commodities and Trade Division United Nations Food and Agriculture
Exports to 193 countries
 2019 The world s 6 th biggest steel exporter Exports to 193 countries 37.3 million tons crude steel production in 2018 Official Name: Republic of Turkey Capital City: Ankara Currency: Turkish Lira (TRY)
Complex: The challenge of. incongruous markets. Jenkins Sugar Group, Inc. USDA Agricultural Outlook Forum February 19,2010
 The North American Sugar Complex: The challenge of managing incongruous markets USDA Agricultural Outlook Forum February 19,2010 Premise: World market has helpedsetthe the stage for the current US price
World Cocoa Prices. Commodity Prices Update: Coffee, Cocoa, and Cotton. Joelle Cook and Professor C. Leigh Anderson
 SDR per tonne Commodity Prices Update: Coffee, Cocoa, and Cotton Joelle Cook and Professor C. Leigh Anderson Prepared for the Agricultural Policy and Statistics Division of the Bill and Melinda Gates Foundation
Fresh Deciduous Fruit (Apples, Grapes, & Pears): World Markets and Trade
: World Markets and Trade") United States Department of Agriculture Foreign Agricultural Service Fresh Deciduous Fruit (Apples, Grapes, & Pears): World Markets and Trade 9 1, MT Deciduous Fruit on Seasonal Cycles 6 Northern Hemisphere
United States Department of Agriculture Foreign Agricultural Service Fresh Deciduous Fruit (Apples, Grapes, & Pears): World Markets and Trade 9 1, MT Deciduous Fruit on Seasonal Cycles 6 Northern Hemisphere
Market Overview Thailand
 MARKET ACCESS SECRETARIAT Global Analysis Report Market Overview Thailand July 2014 MARKET SNAPSHOT Thailand had a gross domestic product (GDP) of US$390.2 billion in 2013, which is expected to grow by
International Crops Summary
 International Crops Summary After peaking around 2012/13, prices of most grains and oilseeds have taken a similar, steady downward path. Prices are expected to bottom out in 2015/16 then stabilize in coming
Coffee market ends 2017/18 in surplus
 Coffee market ends 217/18 in surplus World coffee production in coffee year 217/18 is estimated 5.7% higher at 164.81 million bags as output of Arabica increased by 2.2% to 11.82, and Robusta grew 11.7%
WEEKLY MAIZE REPORT 28 NOVEMBER 2018
 WEEKLY MAIZE REPORT 28 NOVEMBER 2018 Unigrain (Pty) Ltd Tel. No. : +27 11 692 4400 Fax. No. : +27 11 412 1183 INTERNATIONAL MARKET Table 1: CME Maize prices and weekly changes (cents/bushel) Currently
Marketing Canola. Ian Dalgliesh General Manager Australian Grain Accumulation
 Marketing Canola Ian Dalgliesh General Manager Australian Grain Accumulation Global Area of Biotech Crops, 1996 to 2008: By Crop (Million Hectares, Million Acres) More Farmers choosing Biotech Crops
Outlook for Global Recovered Paper Markets. Global OCC Market. Global ONP Market RISI. Hannah Zhao, Economist, Recovered Paper October 2012
 Outlook for Global Recovered Paper Markets Hannah Zhao, Economist, Recovered Paper October 212 Global OCC Market $28 $24 $2 $16 US$ per Tonne % 6 55 5 $12 $8 US West Export (FAS) N. German Export (FAS)
MONTHLY COFFEE MARKET REPORT
 1 E MONTHLY COFFEE MARKET REPORT March 2014 Ongoing uncertainty over the Brazilian coffee crop has caused significant fluctuations in coffee prices during March, with monthly volatility of the International
World apple juice market production and consumption trends
 World apple juice market production and consumption trends Klaus Heitlinger Association of the German fruit juice industry In 2013 I asked you: Who will be the next world soccer champion? Germany is the
World Dairy Situation. IDF SC DPE, Paris April 11, 2013
 World Dairy Situation IDF SC DPE, Paris April 11, Current dairy situation Dairy production progressed in 2012 in supplying regions but is now stabilizing, even declining in some countries Export demand
World of sugar PAGE 54
 World of sugar More than 1 countries produce sugar, about 8% of which is made from sugar cane grown primarily in the tropical and sub-tropical zones of the southern hemisphere, and the balance from sugar
Coffee market settles lower amidst strong global exports
 Coffee market settles lower amidst strong global exports The ICO composite indicator price declined by 1.2% in February 2018 to an average of 114.19 US cents/lb. Indicator prices for all three Arabica
Coffee market remains volatile but lacks direction
 Coffee market remains volatile but lacks direction Prices fluctuated significantly during August, with the ICO composite indicator dropping by 10 cents before jumping back up another 12 cents by the end
Monthly Economic Letter
 Monthly Economic Letter Cotton Market Fundamentals & Price Outlook RECENT PRICE MOVEMENT After some upward movement in April, most benchmark prices turned lower in early May. After climbing to the upper
Performance of the ASEAN Iron and Steel Industry in 2017 and Outlook
 Performance of the ASEAN Iron and Steel Industry in 2017 and Outlook Presented by: Tan Ah Yong Secretary General South East Asia Iron and Steel Institute (SEAISI) 1 CONTENTS: Macroeconomic Scenario Steel
China: The Untapped Freighter Market
 China: The Untapped Freighter Market A China USA perspective Marco Bloemen, YDL Management Consultants E: marco@ydl.nl T:+31-3465-64244 Scope of this presentation Macro-economic figures China - USA Air
Long Term Bullish Outlook: Oil and Oilseeds
 Long Term Bullish Outlook: Oil and Oilseeds Technical Recommendations Commodity S2 S1 R1 R2 Recommendation CBOT Soybean (Cents/bushel) 880 950 1130 1300 Buy at 1000-1020 TP 1250 SL 930 NCDEX Soybean (`/Quintal)
Table grape. Horticulture trade intelligence. Quarter 1: January to March 2017
 Horticulture trade intelligence A custom report compiled for Hort Innovation by Euromonitor International Table grape Quarter 1: January to March 217 Horticulture trade intelligence: Table grape: 217:
Prices for all coffee groups increased in May
 Prices for all coffee groups increased in May In May 2018, the ICO composite indicator increased by 0.7% to an average of 113.34 US cents/lb, following three months of declines. Prices for all coffee groups
Chef And Team Derby Green Ooty
 Chef And Team Derby Green Ooty Sr. No. Name Token No./ ID 1. Chef Niraj Kumar Team Kitchen Awards 2017 Name of the Project :To reduce food cost and food wastage without affecting the customer dining exper
World coffee consumption increases but prices still low
 World coffee consumption increases but prices still low The coffee market stabilised slightly in February, but prices remain at very low levels. A lack of news regarding fundamentals with expectations
GLOBAL DAIRY UPDATE KEY DATES MARCH 2017
 MARCH 2017 GLOBAL DAIRY UPDATE European milk production decreased for the seventh consecutive month, while the US remains strong. The rate of decline in New Zealand production is easing. US exports continue
FCC Ag Economics. Trade Ranking Report: Agriculture
 FCC Ag Economics Trade Ranking Report: Agriculture Published November 7, 2017 1 Introduction There s good reason to be optimistic about the future of Canada s agri-food. Demand for agricultural commodities
Monthly Economic Letter
 Monthly Economic Letter Cotton Market Fundamentals & Price Outlook RECENT PRICE MOVEMENT NY futures experienced volatility recently, with the net effect being a slight increase in prices. The A Index also
Industry Report, 2009
 China Soybean and Soybean Processing Industry Report, 2009 Since mid-1990s, the demand for vegetable oil, plant and animal protein has been increasing rapidly in China, so does the demand for soybean.
January 2015 WORLD GRAPE MARKET SUPPLY, DEMAND AND FORECAST
 January 2015 WORLD GRAPE MARKET SUPPLY, DEMAND AND FORECAST Table of Contents Executive Summary... 4 1. VARIETIES OF GRAPES... 6 1.1. White table grapes... 6 1.2. Red table grapes... 6 2. WORLD DEMAND
PRESENTATION TO CACP ON PRICING POLICY FOR SUGARCANE FOR SS INDIAN SUGAR MILLS ASSOCIATION
 PRESENTATION TO CACP ON PRICING POLICY FOR SUGARCANE FOR 2018-19 SS INDIAN SUGAR MILLS ASSOCIATION 28.06.2017 Sugarcane price in 2016-17 SS 2 Central Government fixed FRP of Rs.230 per quintal, which was
Asian Bitumen Supply/Demand Update. Seah Siew Hua Argus Media November 2009, Singapore
 Asian Bitumen Supply/Demand Update Seah Siew Hua Argus Media November 2009, Singapore Contents Asian supply and demand balance High demand growth countries Key exporting countries Country by country balance
Export Essentials Pulse Trade Data
 Export Essentials Pulse Trade Data North America and Australia Q1 2013 Introduction There are many ways of telling stories. Words and pictures are the most common and easiest to understand. Our Export
Record exports in coffee year 2017/18
 Record exports in coffee year 2017/18 Total coffee exports increased each year since 2010/11 with a new record reached in 2017/18 at 121.86 million bags, 2% higher than 2016/17. In the twelve months ending
Fresh Produce Report. P13: 12 w/e 3rd January Kantar Worldpanel
 Fresh Produce Report P13: 12 w/e 3rd January 2016 1 HOW IS TOTAL PRODUCE PERFORMING? Total Produce is worth 2.1bn and is growing by 4.1% compared to the same period last year. Much of this is driven by
Tuna Trade. Fatima Ferdouse
 Tuna Trade Fatima Ferdouse HIGHLIGHTS East Asia is the world s largest processing and exporting region for canned tuna. Producing countries in the region also depend on imported raw materials The fluctuating
Chapter 3 PERFORMANCE OF SPICES TRADE IN INDIA AND KERALA
 Chapter 3 PERFORMANCE OF SPICES TRADE IN INDIA AND KERALA India occupies a prominent position in the world spice trade. In the estimated world trade of species of 8,50,000 tonnes valued at US$ 2,200 millions,
QUARTERLY REVIEW OF THE PERFORMANCE OF THE DAIRY INDUSTRY 1
 QUARTERLY REVIEW OF THE PERFORMANCE OF THE DAIRY INDUSTRY 1 The information in this document is from sources deemed to be correct. Milk SA, the MPO and SAMPRO are not responsible for the results of any
Dairy Outlook. December By Jim Dunn Professor of Agricultural Economics, Penn State University. Market Psychology
 Dairy Outlook December 2015 By Jim Dunn Professor of Agricultural Economics, Penn State University Market Psychology The Class III market has taken a beating lately as cheese prices have drifted down and
Corn grown is majorly of three types Grain or field corn, sweet corn used mainly as food Popcorn.
 1 Introduction Maize (Zea mays L) is one of the most important cereals of the world and provides more human food than any other cereal. Maize was introduced to South East Asia by the Portuguese from America
Sugar scenario in CIS countries:
 Sugar scenario in CIS countries: on the way to self-sufficiency Andrey Bodin Eurasian Sugar Association Commonwealth of Independent States (CIS) consists of 11 countries CIS Moldova Belarus Population
The Contribution made by Beer to the European Economy. Poland - January 2016
 The Contribution made by Beer to the European Economy Poland - January 2016 Europe Economics is registered in England No. 3477100. Registered offices at Chancery House, 53-64 Chancery Lane, London WC2A
Role of RussiaandCIS on the world sugar market
 IKAR Dmitry Rylko General director Role of RussiaandCIS on the world sugar market Growing self-sufficiency and/or growing efficiency of the world s biggest sugar import market Brazil, October, 009 IKAR
Monitoring EU Agri-Food Trade: Development until September 2018
 Monitoring EU Agri-Food Trade: Development until September 2018 September 2018: Slowdown in EU export performance; imports from Brazil and US still on the rise The monthly value of EU agri-food trade in
SINGAPORE. Summary Table: Import of Fresh fruits and Vegetables in Fresh fruit and Vegetables Market Value $000 Qty in Tons
 SINGAPORE A. MARKET FOR FRESH FRUIT AND VEGETABLES 1. Market Trend and Opportunities Summary Table: Import of Fresh fruits and Vegetables in Fresh fruit and Vegetables Market Products/ Other Info. Product
Thailand Packaging Machinery Market. Jorge Izquierdo VP Market Development PMMI
 Thailand Packaging Machinery Market Jorge Izquierdo VP Market Development PMMI jizquierdo@pmmi.org www.pmmi.org/global www.pmmi.org/research Today General Economic and Political Highlights Current Packaging
International Table Grape Symposium November 2014 Australian Table Grapes Jeff Scott Chief Executive Officer
 International Table Grape Symposium November 2014 Australian Table Grapes Jeff Scott Chief Executive Officer Australian Table Grape Industry - Snapshot There are approximately 900 table grape growers throughout
Coffee market continues downward trend
 Coffee market continues downward trend Since August 2017, the ICO composite indicator price has declined in each month except January 2018. The composite indicator decreased by 1.1% in March 2018 to an