Gabriel Balint, MoSco. A Thesis. submitted to the Department of Biological Sciences. in partial fulfillment of the requirements.
|
|
|
- Arron Phelps
- 5 years ago
- Views:
Transcription
1 Impact of different irrigation strategies on grapes and wine quality of four grapevine cultivars (Vitis sp.) in cool climate conditions. An investigation into the relationships among ABA, water status, grape cultivar and wine quality By Gabriel Balint, MoSco A Thesis submitted to the Department of Biological Sciences in partial fulfillment of the requirements for the degree of Doctor of Philosophy May, 2011 Brock University Sto Catharines, Ontario Gabriel Balint, 2011
2 Abstract. Niagara Peninsula of Ontario is the largest viticultural area in Canada. Although it is considered to be a cool and wet region, in the last decade many water stress events occurred during the growing seasons with negative effects on grape and wine quality. This study was initiated to understand and develop the best strategies for water management in vineyards and those that might contribute to grape maturity advancement. The irrigation trials investigated the impact of time of initiation (fruit set, lag phase and veraison), water replacement level based on theoretical loss through crop evapotranspiration (ETc; 100,50 and 25%) and different irrigation strategies [partial root zone drying (PRD) versus regulated deficit irrigation (RD!)] on grape composition and wine sensory profiles. The irrigation experiments were conducted in a commercial vineyard (Lambert Vineyards Inc.) located in Niagara-on-the-Lake, Ontario, from 2005 through The two experiments that tested the combination of different water regimes and irrigation time initiation were set up in a randomized block design as follows: Baco noir - three replicates x 10 treatments [(25%, 50% and 100% of ETc) x (initiation at fruit set, lag phase and veraison) + control]; Chardonnay - three replicates x seven treatments [(25%, 50% and 100% of ETc) x (initiation at fruit set and veraison) + control]. The experiments that tested different irrigation strategies were set up on two cultivars as follows: Sauvignon blanc - four replicates x four treatments [control, fully irrigated (100% ETc), PRD (100% ETc) and RDI (25% ETc)]; Cabemet Sauvignon - four replicates x five treatments [control, fully irrigated (100% ETc), PRD (100% ETc), RDI (50% ETc) and RDI (25% ETc)]. The controls in each experiment were nonirrigated. The irrigation treatments were compared for many variables related to soil water status, vine physiology, berry composition, wine sensory profile, and hormone composition [(abscisic acid (ABA) and its catabolites]. Soil moisture profile was mostly affected by irrigation treatments between 20 and 60 em depth depending on the grapevine cultivar and the regime of water applied. Overall soil moisture was consistently higher throughout the season in 100 and 50% ETc compare to the control. Transpiration rates and leaf temperature as well as shoot growth rate were the most sensitive variables to soil water status. Drip irrigation associated with RDI treatments (50% ETc and 25% ETc) had the most beneficial effects on vine physiology, fruit composition and wine varietal typicity, mainly by maintaining a balance between vegetative and reproductive parts of the vine. Neither the control nor the 100 ETc had overall a positive effect on grape composition and wine sensory typicity. The time of irrigation initiation affected the vine physiology and grape quality, the most positive effect was found in treatments initiated at lag phase and veraison. RDI treatments were overall more consistent in their positive effect on grape composition and wine
3 varietal typicity comparing to PRD treatment. The greatest difference between non-irrigated and irrigated vines in most of the variables studied was found in 2007, the driest and hottest season of the experimental period. Soil water status had a greater and more consistent effect on red grapevine cultivars rather than on white winegrape cultivars. To understand the relationships among soil and plant water status, plant physiology and the hormonal profiles associated with it, abscisic acid (ABA) and its catabolites [phaseic acid (PA), dihydrophaseic acid (DPA), 7-hydroxy-ABA (TOH-ABA), 8' -hydroxy-aba, neophaseic acid and abscisic acid glucose ester (ABA-GE)] were analyzed in leaves and berries from the Baco noir and Chardonnay irrigation trials over two growing seasons. ABA and some of its catabolites accurately described the water status in the vines. Endogenous ABA and some of its catabolites were strongly affected in Baco noir and Chardonnay by both the water regime (i.e. ET level) and timing of irrigation initiation. Chardonnay grapevines produced less ABA in both leaves and berries compared to Baco noir, which indicated that ABA synthesis is also cultivar dependant. ABA-GE was the main catabolite in treatments with high water deficits, while PA and DPA were higher in treatments with high water status, suggesting that the vine produced more ABA-GE under water deficits to maintain rapid control of the stomata. These differences between irrigation treatments with respect to ABA and catabolites were particularly noticeable in the dry 2007 season. Two trials using exogenous ABA investigated the effect of different concentrations of ABA and organs targeted for spraying, on grape maturation and berry composition of Cabemet Sauvignon grapevines, in two cool and wet seasons ( ). The first experiment consisted of three replicates x three treatments [(150 and 300 mg/l, both applications only on clusters) + untreated control] while the second experiment consisted in three replicates x four treatments [(full canopy, only clusters, and only leaves sprayed with 300 ppm ABA) + untreated control]. Exogenous ABA was effective in hastening veraison, and improving the composition of Cabemet Sauvignon. Ability of ABA to control the timing of grape berry maturation was dependant on both solution concentration and the target organ. ABA affected not only fruit composition but also yield components. Berries treated with ABA had lower weight and higher skin dry mass, which constitutes qualitative aspects desired in the wine grapes. Temporal advancement of ripening through hormonal control can lead to earlier fruit maturation, which is a distinct advantage in cooler areas or areas with a high risk of early frost occurrence. Exogenous ABA could provide considerable benefits to wine industry in terms of grape composition, wine style and schedule activities in the winery, particularly in wet and cool years. ii
4 These trials provide the ftrst comprehensive data in eastern North America on the response of important hybrid and Vitis vinifera winegrape cultivars to irrigation management. Results from this study additionally might be a forward step in understanding the ABA metabolism, and its relationship with water status. Future research should be focused on ftnding the ABA threshold required to trigger the ripening process, and how this process could be controlled in cool climates. iii
5 Acknowledgements I would like to thank my advisor, Dr Andrew Reynolds who gave me the opportunity to study and evolve my expertise in Viticulture and Oenology. His guidance, encouragement and patience throughout my graduate studies helped me to accomplish this great research project. My special thanks to Dr. Helen Fisher, for her patience to revise the manuscript of this thesis and her valuable advice during the writing process. I wish to acknowledge Drs. Pickering, DeLuca and Carlone, for their advice and constructive critical review of this thesis. I would also like to aknowledge the administrative and faculty staff of Biological Sciences and Graduate Studies Departments from Brock University, for their full support over the years. The author aknowledges Dr. Abrams from Plant Biotechnology Institute, Saskatchewan, and Tim Jones from Chemistry Department, Brock University, for initiating and helping me in the ABA studies. Many thanks to David Lambert, from Lambert Vineyards, Niagara-on-the-Lake, who allowed us to play with water and gave me full support during the long summers spent in the vineyard collecting data. Without his support this project would not have been possible. Financial support and scolarships from Natural Sciences and Engineering Research Council of Canada and Brock University were greatly appreciated. I would like to express my sincere gratitude to my colleagues from Viticulture Lab., especially Fred, Matthieu, David, Javad, and all the international internship students who helped out during the summer. Many thanks are also going to the numerous panelists, for their invaluable suport with my wine testing. Many thanks to my parents (Petrica and Lidia), who encouraged me and even helped out in one season to harvest my experimental Nines. A big hug and many thanks are going to my family. My wife Stela, who encouraged me and took the family responsabilities on her own throughout this long study period. Also, many thanks to my daughters Oana and Mara, who pushed me hard to finish this work and asked me to find a real job and not retire as a graduate student.
6 Table of Contents ABSTRACT... 1 ACKNOWLEDGEMENTS... 1 TABLE OF CONTENTS... II LIST OF TABLES... VI LIST OF FIGURES... IX CHAPTER 1: INTRODUCTION... 1 LITERATURE CfI'ED... 3 CHAPTER 2: LITERATURE REVIEW WATERUSEINVINEYARDS Water consumption by grapevines Water use efficiency (WUE) EFFECT OF WATER STATUS ON GRAPE VINE COMPONENTS Root system and rootstock Flower development and grape berry growth Grape composition Effects of elevated soil moisture on vine components MOLECULAR AND BIOCHEMICAL BASIS OF TIlE RESPONSE TO WATER DEFICIT Water status effects at the molecular level Water status and biochemical changes in vine WATER DEFICIT EFFECTS ON VINE PHySIOLOGy General physiological adaptation Transpiration Xylem conductance Photosynthesis APPROACHES TO MEASUREMENT OF WATER STATUS General comments Soil water content Soil water potential Plant water status measurements..., WATER STATUS AND ABSCISIC ACID Physiological roles of abscisic acid ii
7 Plant responses to ABA IRRIGATION STRATEGIES Deficit irrigation Partial root zone drying LITERATURE CITED CHAPTER 3A: EFFECT OF WATER STRESS LEVEL AND TIME IMPOSED IRRIGATION ON VINE PHYSIOLOGY, VIGOR, YIELD, FRUIT COMPOSITION, AND WINE QUALITY ON BACO NOIR GRAPEVINES IN A COOL CLIMATE AREA. I. VINE PHYSIOLOGY, VIGOR, AND yield INTRODUCTION MATERIALS AND METHODS REsULTS AND DISCUSSION CONCLUSIONS LITERATURE CITED LIST OF TABLES LIST OF FIGURES CHAPTER 3B: EFFECT OF WATER STRESS LEVEL AND TIME IMPOSED IRRIGATION ON FRUIT COMPOSITION, AND WINE QUALITY ON BACO NOIR IN A COOL CLIMATE AREA II. FRUIT COMPOSITION, AND WINE QUALITY. 89 INTRODUCTION MATERIALS AND METHODS RESULTS AND DISCUSSION CONCLUSIONS LITERATURE CITED LISTOFTABLES LIST OF FIGURES CHAPTER 4: IMPACTS OF IRRIGATION LEVEL AND TIME OF IMPOSITION ON VINE PHYSIOLOGY, YIELD COMPONENTS, FRUIT COMPOSITION AND WINE QUALITY ON CHARDONNAY (VITIS VINIFERA L.) IN A COO L CLIMATE AREA INTRODUCTION MATERIALS AND METHODS RESULTS AND DISCUSSION iii
8 CONCLUSIONS LITERATURE CITED LISTOFTABLES LIST OF FIGURES CHAPTER 5: EFFECT OF DIFFERENT IRRIGATION STRATEGIES ON VINE PHYSIOLOGY, YIELD, GRAPE COMPOSITION AND SENSORY PROFILE OF SAUVIGNON BLANC (VITIS VINIFERA L.) IN A COOL CLIMATE AREA INTRODUCTION MATERIAL AND METHODS RESULTS AND DISCUSSION CONCLUSIONS LITERATURE CITED LIST OF TABLES LIST OF FIGURES CHAPTER 6: EFFECT OF DIFFERENT IRRIGATION STRATEGIES ON VINE PHYSIOLOGY, YIELD, GRAPE COMPOSITION AND SENSORY PROFILES OF VITIS VINIFERA L. CABERNET SAUVIGNON IN A COOL CLIMATE AREA ABSTRACT INTRODUCTION MATERIAL AND METHODS RESULTS AND DISCUSSION LITERATURE CITED LIST OF TABLES LIST OF FIGURES CHAPTER 7: IMPACT OF WATER STATUS LEVEL ON ABSCISIC ACID AND ITS CATABOLITES PROFILES IN LEAVES AND BERRIES FROM TWO GRAPE CUL TIV ARS INTRODUCTION MATERIALS AND METHODS RESULTS DISCUSSION CONCLUSIONS LITERATURE CITED iv
9 LIST OF TABLES LIST OF FIGURES CHAPTER 8: EXOGENOUS ABA AND ITS IMPACT ON VINE PHYSIOLOGY AND GRAPE COMPOSITION OF VITIS VINIFERA L. CV. CABERNET SAUVIGNON IN A COOL CLIMATE AREA INTRODUCTION MATERIALS AND METHODS RESULTS AND DISCUSSION CONCLUSIONS LITERATURE CITED LISTOFTABLES LISTOFFIGURES CHAPTER 9: GENERAL DISCUSSION AND CONCLUSIONS LITERATURE CITED APPENDICES v
10 List of Tables Pages Chapter3a Table 3a-1 The weekly amount of irrigation water applied on a Baco noir block using ET 0 calculated with Penman-Monteith equation, Lambert Vineyards, Niagara-on-the Lake, ON, between ,..., Table 3a-2 Impact of irrigation treatments on yield components and vine size of Baco noir, Lambert Vineyards, Niagara-on-the-Lake, ON, Chapter3b Table 3b-1. Attributes and their standard references used for sensory evaluation of Baco noir wines, Lambert Vineyards, Niagara-on-the-Lake, ON, 2006 and 2007 vintages Table 3b-2. Impact of irrigation treatments on berry composition of Baco noir grapes, Lambert Vineyards, Niagara-on-the-Lake, ON, Table 3b-3. Impact of irrigation treatments on berry phenolic analyte composition of Baco noir grapes, Lambert Vineyards, Niagara-on-the-Lake, ON, Table 3b-4. Impact of irrigation treatments on must composition of Baco noir grapes, Lambert Vineyards, Niagara-on-the-Lake, ON, Table 3b-5. Impact of irrigation treatments on Baco noir wine composition, Lambert Vineyards, Niagara-on-the-Lake, ON, Table 3b-6. Impact of irrigation treatments on Baco noir wine color and phenolic composition, Lambert Vineyards, Niagara-on-the-Lake, ON, , 119 Table 3b-7. Comparison of mean sensory scores among irrigation treatments of Baco noir wines, Lambert Vineyards, Niagara-on-the Lake, ON, Table 3b-8. Comparison of mean sensory scores among irrigation treatments of Baco noir wines, Lambert Vineyards, Niagara-on-the Lake, ON, Chapter 4 Table 4.1 The weekly amount of irrigation water applied in a Chardonnay block using ET 0 calculated with Penman-Monteith equation, Lambert Farm, Niagara-on-the Lake, ON, between Table 4.2. Impact of irrigation treatments on yield components and vine size of Chardonnay grapevines, Lambert Vineyards, Niagara-on-the-Lake, ON, Table 4.3. Impact of irrigation treatments on berry composition of Chardonnay, Lambert Vineyards, Niagara-on-the-Lake, ON, Table 4.4. Impact of irrigation treatments on must composition of Chardonnay, Lambert Vineyards, Niagara-on-the-Lake, ON, Table 4.5. Impact of irrigation treatments on wine composition of Chardonnay, Lambert Vineyards, Niagara-on-the-Lake, ON, Table 4.6. Attributes and their standard references used for sensory evaluation of Chardonnay wines, Lambert Vineyards, Niagara-on-the-Lake, ON vi
11 Table 4.7. Comparison of mean sensory scores among the irrigation treatments of Chardonnay wines, Lambert Vineyards, Niagara-on-the-Lake, ON, Table 4.8. Comparison of mean sensory scores among the irrigation treatments of Chardonnay wines, Lambert Vineyards, Niagara-on-the-Lake, ON, ChapterS Table 5.1. Impact ofprd irrigation treatments on soil moisture (% volumetric content) of Sauvignon blanc measured using a Profile Probe type PR2 at five depths, Lambert Vineyards, Niagara-on-the-Lake, ON, Table 5.2. Impact of PRD irrigation treatments on soil moisture (% volumetric content) of Sauvignon blanc measured using a Profile Probe type PR2 at five depths, Lambert Vineyards, Niagara-on-the-Lake, ON, Table 5.3. Impact of irrigation treatments on yield components and vine size of Sauvignon blanc, Lambert Vineyards, Niagara-on-the-Lake, ON, Table 5.4. Impact of irrigation treatments on berry composition of Sauvignon blanc, Lambert Vineyards, Niagara-on-the-Lake, ON, Table 5.5. Impact of irrigation treatments on must composition of Sauvignon blanc, Lambert Vineyards, Niagara-on-the-Lake, ON, Table 5.6. Impact of irrigation treatments on wine composition of Sauvignon blanc, Lambert Vineyards, Niagara-on-the-Lake, ON, Table 5.7. Attributes and their standard references used for sensory evaluation of Sauvignon blanc wines Table 5.8. Comparison of mean sensory scores among the irrigation treatments of Sauvignon blanc wines, Lambert Vineyards, Niagara-on-the-Lake, ON, Table 6.1. Attributes and their standard references used for sensory evaluation of Cabemet Sauvignon wines Chapter 6 Table 6.2. Impact of irrigation treatments on yield components and vine size of Cabemet Sauvignon grapevines, Lambert Vineyards, Niagara-on-the-Lake, ON, Table 6.3. Impact of irrigation treatments on berry composition of Cabemet Sauvignon grapevines, Lambert Vineyards, Niagara-on-the-Lake, ON, Table 6.4. Impact of irrigation treatments on must composition Cabemet Sauvignon grapevines, Lambert Vineyards, Niagara-on-the-Lake, ON, Table 6.5. Impact of irrigation treatments on Cabemet Sauvignon wines, Lambert Vineyards, Niagara-on-the-Lake, ON, Table 6.6. Comparison of mean sensory scores among the irrigation treatments Cabemet Sauvignon wines Chapter 7 Table 7.1 Mobile phase solvent composition and gradient protocol Table 7.2. Multiple reaction monitoring transitions and retention time used for ion trap mass spectrometry conditions for ABA and its metabolites vii
12 ChapterS Table 8.1. Monthly mean temperature and rainfall during growing season, Virgil weather station, Niagara-on-the-Lake, ON Table 8.2. Impact of exogenous ABA on yield components and berry composition of Cabemet Sauvignon when different target organs were sprayed, Lambert Vineyards, Niagara-on-the-Lake, ON. ( ) Table 8.3. Impact of exogenous ABA concentration on yield components and berry composition of Cabernet Sauvignon, Lambert Vineyards, Niagara-on-the-Lake, ON ( ) Table 8.4. Impact of exogenous ABA concentration and target organ, on total anthocyanins and phenols in berries of Cabernet Sauvignon, Lambert Vineyards, Niagara-on-the-Lake, ON ( ) Table 8.5 Impact of exogenous ABA concentration and target organ, on anthocyanin composition in berry skin of Cabemet Sauvignon from Lambert Vineyards, Niagara-on-the-Lake, ON (2009) viii
13 Chapter3a List of Figures Figure 3a-1. A-Monthly rainfall (mm) June-August, at Virgil Station, Niagara-onthe-Lake, ON, Canada. Monthly average = 30 years mean. B- Monthly temperature June - August, , Virgil Weather Station, Niagara-on-the-Lake, ON, Canada ( 68 Figure 3a-2. Rainfall distribution (mm/day) during June-August, , at Virgil Weather Station, Niagara-on-the-Lake, ON, Canada ( 69 Figure 3a-3. Daily potential evapotranspiration ETo calculated using the Penman-Monteith equation during , Virgil Weather Station, Niagara-on-the-Lake, ON, Canada ( 70 Figure 3a-6. Impact of irrigation treatments on soil moisture (%) of a Baco noir vineyard measured using a Profile Probe type PR2 at 10 cm depth (A-C) and 20 cm depth (D-F), Lambert Vineyards, Niagara-on-the-Lake, ON, AID, BIE, and, CIF represent irrigation initiation time (fruit set, lag phase and veraison) while 100, 50, 25 represent the percentage of soil water replacement lost through evapotranspiration Figure 3a-8. Impact of irrigation treatments on soil moisture (%) of a Baco noir vineyard measured using a Profile Probe type PR2 at 60 cm depth (A-C) and 100 cm depth (D-F), Lambert Vineyards, Niagara-on-the-Lake, ON, AID, BIE, and CIF represent irrigation initiation time (fruit set, lag phase and veraison) while 100, 50, 25 represent the percentage of soil water replacement lost through evapotranspiration Figure 3a-9. Impact of irrigation treatments on soil moisture (%) of a Baco noir vineyard measured using a Profile Probe type PR2 at 10 cm depth (A-C) and 20 cm depth (D-F), Lambert Vineyards, Niagara-on-the-Lake, ON, AID, BIE, and CIF represent irrigation initiation time (fruit set, lag phase and veraison) while 100, 50, 25 represent the percentage of soil water replacement lost through evapotranspiration Figure 3a-1O. Impact of irrigation treatments on soil moisture (%) of a Baco noir vineyard measured using a Profile Probe type PR2 at 30 cm depth (A-C) and 40 cm depth (D-F), Lambert Vineyards, Niagara-on-the-Lake, ON, AID, BIE, and CIF represent irrigation initiation time (fruit set, lag phase and veraison) while 100, 50, 25 represent the percentage of soil water replacement lost through evapotranspiration Figure 3a-ll. Impact of irrigation treatments on soil moisture (%) of a Baco noir vineyard measured using a Profile Probe type PR2TM at 60 cm depth (A-C) and 100 cm depth (D-F), Lambert Vineyards, Niagara-on-the-Lake, ON, AID, BIE, and CIF represent irrigation initiation time (fruit set, lag phase and veraison) while 100, 50, 25 represent the percentage of soil water replacement lost through evapotranspiration Figure 3a-12. Impact of irrigation treatments on shoot growth rate (cm) of Baco noir grapevines, Lambert Vineyards, Niagara-on-the-Lake, ON, 2006 (A-C) and 2007 (D-F). AID, BIE, and CIF represent irrigation initiation time (fruit set, lag phase and veraison) while 100, 50, 25 represent the percentage of soil water replacement lost through evapotranspiration Figure 3a-13. Impact of irrigation treatments on transpiration of Baco noir grapevines, Lambert Vineyards, Niagara-on-the-Lake, ON, A, B, C represent irrigation initiation time (fruit set, lag phase and veraison) while 100,50,25 represent the percentage of soil water replacement lost through evapotranspiration ix
14 Figure 3a-14. Impact of irrigation treatments on transpiration of Baco noir grapevines, Lambert Vineyards, Niagara-on-the-Lake, ON, 2006 (A-C) and 2007 (D-F). AID, BIE, and CIF represent irrigation initiation time (fruit set, lag phase and veraison) while 100, 50, 25 represent the percentage of soil water replacement lost through evapotranspiration Figure 3a-15. Impact of irrigation treatments on midday leaf water potential of Baco noir grapevines, Lambert Vineyards, Niagara-on-the-Lake, ON, A, B, C represent irrigation initiation time (fruit set, lag phase and veraison) while 100, 50, 25 represent the percentage of soil water replacement lost through evapotranspiration Figure 3a-16. Impact of irrigation treatments on midday leaf water potential of Baco noir grapevines, Lambert Vineyards, Niagara-on-the-Lake, ON, 2006 (A-C) and 2007 (D-F). AID, BIE, and CIF represent irrigation initiation time (fruit set, lag phase and veraison) while 100, 50, 25 represent the percentage of soil water replacement lost through evapotranspiration Figure 3a-17. Principal component analysis biplot (Fl and F2) of soil water status and physiological data means (10 vines x three shoots x three leaves x three replicates) from ten irrigation treatments of Baco noir grapevines from Lambert Vineyards, Niagara-on-the-Lake, ON, Set (S), Lag (L) and Veraison (V) represent the time for irrigation imposition and 100 (F), 50 and 25 represent percentage of the water replaced in the soil through irrigation Figure 3a-18. Principal component analysis biplot (Fland F2) offield data and yield components means (10 vines x three shoots x three leaves x three replicates) from ten irrigation treatments of Baco noir grapevines from Lambert Vineyards, Niagara-on-the-Lake, ON, Set (S), Lag (L) and Veraison (V) represent the time for irrigation imposition and 100 (F), 50 and 25 represent percentage of the water replaced in the soil through irrigation Figure 3a-19. Principal component analysis biplot (Fland F2) of A: soil water status and yield components means, and B: soil water status and physiological data means (10 vines x three shoots x three leaves x three replicates) from ten irrigation treatments of Baco noir grapevines from Lambert Vineyards, Niagara-on-the-Lake, ON, Set (S), Lag (L) and Veraison (V) represent irrigation initiation time while 100 (F), 50, 25 represent the percentage of soil water replacement lost through evapotranspiration Figure 3a-20. Principal component analysis biplot (Fl&F2) ofthe soil water status and physiological data means (10 vines x three shoots x three leaves x three replicates) from ten irrigation treatments of Baco noir grapevines from Lambert Vineyards, Niagara-on-the-Lake, ON, Set (S), Lag (L) and Veraison (V) represent the time for irrigation imposition and 100 (F), 50 and 25 represent percentage of the water replaced in the soil through irrigation. ) Figure 3a-21. Principal component analysis biplot (Fl&F2) ofthe soil water status and physiological data means (10 vines x three shoots x three leaves x three replicates) from ten irrigation treatments of Baco noir grapevines from Lambert Vineyards, Niagara-on-the-Lake, ON, Set (S), Lag (L) and Veraison (V) are the time for irrigation imposition and 100 (F), 50 and 25 represent percentage of the water replaced in the soil through irrigation Chapter3b Figure 3b-l. Radar diagram of the mean intensity ratings of four Baco noir wines made from different irrigation treatments, Lambert Vineyards, Niagara~on-the-Lake, ON. (C-control, Setirrigation initiated at fruit set). 100, 50, and 25 represent percentage of water replaced. A and B represent 2006 and 2007 vintage, respectively. Aroma and flavor attributes are specified by lower and higher case letters respectively x
15 Figure 3b-2. Radar diagram of the mean intensity ratings of four Baco noir wines made from different irrigation treatments, Lambert Vineyards, Niagara-on-the-Lake, ON. (C-control, Lagirrigation initiated at lag phase). 100, 50, and 25 represent percentage of water replaced. A and B represent 2006 and 2007 vintages, respectively. Aroma and flavor attributes are specified by lower and higher case letters respectively Figure 3b-3. Radar diagram of the mean intensity ratings of four Baco noir wines made from differentirrigation treatments, Lambert Vineyards, Niagara-on-the-Lake, ON. (C-control, Ver. irrigation initiated at veraison). 100, 50, and 25 represent percentage of water replaced. A and B represent 2006 and 2007 vintages, respectively. Aroma and flavor attributes are specified by lower and higher case letters respectively Figure 3b-4. Principal component analysis (Fl&F2) of mean sensory data for wines from ten irrigation treatments imposed on Baco noir vines from Lambert Vineyards, Niagara-on-the-Lake, ON, Set, Lag and Ver. are the initiation times of irrigation (fruit set, lag phase and veraison). 100, 50 and 25 represent percentage of the water replaced in the soil through irrigation. Aroma and flavor attributes are specified by lower and higher case letters respectively Figure 3b-5. Principal component analysis (F1&F2) of mean sensory data for wines from ten irrigation treatments imposed on Baco noir vines from Lambert Vineyards, Niagara-on-the-Lake, ON, Set, Lag and Ver. are the time for irrigation imposition (fruit set, lag phase and veraison) and 100, 50 and 25 represent percentage of the water replaced in the soil through irrigation. Aroma and flavor attributes are specified by lower and higher case letters respectively Figure 3b-6. PLS analysis of soil water status, physiological data, yield components, berry and wine chemical composition means from ten irrigation treatments of Baco noir from Lambert Vineyards, Niagara-on-the-Lake, ON, Set (S), Lag (L) and Veraison (V) represent time for irrigation imposition and 100, 50 and 25 represent percentage of the water replaced in the soil through irrigation Figure 3b-7. Principal component analysis [A (F1&F2) and B (F2&F3)] of soil water status, vine physiological data, and berry/wine composition means (10 vines x three shoots x three leaves x three replicates) from ten irrigation treatments of Baco noir vines from Lambert Vineyards, Niagara-on-the-Lake, ON, C-control while Set (S), Lag (L) and Veraison (V) represent time for irrigation imposition. 100,50 and 25 represent percentage of the water replaced in the soil through irrigation Figure 3b-8. PLS analysis of soil water status, physiological data, yield components, berry and wine chemical composition means from ten irrigation treatments of Baco noir vines from Lambert Vineyards, Niagara-on-the-Lake, ON, Set (S), Lag (L) and Veraison (V) represent time for irrigation imposition and 100, 50 and 25 represent percentage of the water replaced in the soil through irrigation Figure 3b-9. Principal component analysis (Fl&F2) ofthe profile soilwater status and physiological data means (10 vines x three shoots x three leaves x three replicates) from ten irrigation treatments of Baco noir vines from Lambert Vineyards, Niagara..,on-the-Lake, ON, C-control while Set (S), Lag (L) and Veraison (V) represent time for irrigation imposition. F-100, 50 and 25 represent percentage ofthe water replaced in the soil through irrigation xi
16 Figure 3b-10. PLS analysis of soil water status, physiological data, yield components, berry and wine chemical composition means from ten irrigation treatments of Baco noir vines from Lambert Vineyards, Niagara-on-the-Lake, ON, Set (S), Lag (L) and Veraison (V) represent time for irrigation imposition and 100, 50 and 25 represent percentage of the water replaced in the soil through irrigation Chapter 4 Figure 4.1. Impact of irrigation treatments on soil moisture (% volumetric content) of Chardonnay grapevines measured by TDR, Lambert Vineyards, Niagara-on-the-Lake, ON, A: 2005; B: 2006; C: 2007; D: , 50, 25 represent the percentage of ETc at two irrigation initiation times: fruit set (Set) and veraison (Ver.) Figure 4.2. Impact of irrigation treatments on soil moisture (% volumetric content) of Chardonnay grapevines measured using a Profile Probe type PR2 10 cm (A), 20 cm (B), 30 cm (C), 40 cm (D), 60 cm (E), and 100 cm (F) depths, Lambert Vineyards, Niagara-on-the-Lake, ON, , 50, 25 represent the percentages of soil water replacement ETc at two irrigation initiation times: fruit set (Set) and veraison (Ver.) Figure 4.3. Impact of irrigation treatments on soil moisture (% volumetric content) of Chardonnay grapevines measured using a Profile Probe type PR2 10 cm (A), 20 cm (B), 30 cm (C), 40 cm (D), 60 cm (E), and 100 cm (F) depths, Lambert Vineyards, Niagara-on-the-Lake, ON, , 50, 25 represent the percentages of soil water replacement ETc at two irrigation initiation times: fruit set (Set) and veraison (Ver.) Figure 4.4. Impact of irrigation treatments on soil moisture (% volumetric content) of Chardonnay grapevines measured using a Profile Probe type PR2 10 cm (A), 20 cm (B), 30 cm (C), 40 cm (D), 60 cm (E), and 100 cm (F) depths, Lambert Vineyards, Niagara-on-the-Lake, ON, , 50, 25 represent the percentages of soil water replacement ETc at two irrigation initiation times: fruit set (Set) and veraison (Ver.) Figure 4.5. Impact of irrigation treatments on transpiration of Chardonnay grapevines, Lambert Vineyards, Niagara-on-the-Lake, ON, A: 2005; B: 2006; C: 2007; D: , 50, 25 represent the percentage of ETc at two irrigation initiation times: fruit set (Set) and veraison (Ver.) Figure 4.6. Impact of irrigation treatments on leaf", of Chardonnay grapevines, Lambert Vineyards, Niagara-on-the-Lake, ON, A: 2005; B: 2006; C: 2007; D: ,50, 25 represent the percentage of ETc at two irrigation initiation times: fruit set (Set) and veraison (Ver.) Figure 4.7. Impact of irrigation treatments on shoot growth rate (cm) of Chardonnay grapevines, Lambert Vineyards, Niagara-on-the-Lake, ON, A: 2006; B: , 50, 25 represent the percentage of ETc at two irrigation initiation times: fruit set (Set) and veraison (Ver.) Figure 4.8. Principal component analysis (F1&F2) of soil water status and physiological variables (A) and yield components (B) means from seven irrigation treatments in a Chardonnay vineyard, Lambert Vineyards, Niagara-on-the-Lake, ON, Fruit set (Set) and veraison (Ver.) were the imposition times of irrigation treatments while 100, 50 and 25 represent percentages of the water replaced in the soil through irrigation (ETc); xii
17 Figure 4.9. Principal component analysis (Fl&F2) of soil water status and physiological variables (A) and yield components (B) means from seven irrigation treatments in a Chardonnay vineyard, Lambert Vineyards, Niagara-on-the-Lake, ON, Fruit set (Set) and veraison (Ver.) were the imposition times of irrigation treatments while 100, 50 and 25 represent percentages of the water replaced in the soil through irrigation (ETc) Figure Radar diagram of the mean intensity ratings of Chardonnay wines made from different irrigation treatments, Lambert Vineyards, Niagara-on-the-Lake, ON. Irrigation initiation time: C-control, Set - fruit set, Ver. - veraison). 100,50, and 25 represent percentage of water replaced. A and B represent wine sensory profiles of the 2006 vintage. Aroma and flavor attributes are specified by lower and upper case letters respectively Figure Radar diagram of the mean intensity ratings of Chardonnay wines made from different irrigation treatments, Lambert Vineyards, Niagara-on-the-Lake, ON. Irrigation initiation time: C-control, Set - fruit set, Ver. - veraison). 100,50, and 25 represent percentage of water replaced. A and B represent wine sensory profiles of the 2007 vintage. Aroma and flavor attributes are specified by lower and upper case letters respectively Figure Principal component analysis (Fl&F2) of sensory means from seven irrigation treatments of Chardonnay wines from Lambert Vineyards, Niagara-on-the-Lake, ON, 2006 (A) and 2007 (B). Fruit set (Set) and veraison (Ver.) were the imposition times of irrigation treatments while 100, 50 and 25 represent percentages of the water replaced in the soil through irrigation (ETc) Figure PLS analysis of soil water status, physiological data, yield components, berry and wine chemical composition and sensory data means from seven irrigation treatments of Chardonnay grapevines from Lambert Vineyards, Niagara-on-the-Lake, ON, Figure PLS analysis of soil water status, physiological data, yield components, berry and wine chemical composition and sensory data means from seven irrigation treatments of Chardonnay grapevines from Lambert Vineyards, Niagara-on-the-Lake, ON, Figure PLS regression analysis of soil water status, physiological data, and yield components from seven irrigation treatments of Chardonnay grapevines from Lambert Vineyards, Niagara-on-the-Lake, ON, ChapterS Figure 5.1. Impact of irrigation treatments on soil moisture (%) of Sauvignon blanc vines measured by Fieldscout 300 TDR, Lambert Vineyards, Niagara-on-the-Lake, ON. A: 2006; B: 2007; C: C-control (non-irrigated); PRD-Partial root zone drying (100% ETc), Full (100% ETc), RDI-Regulated deficit irrigation (25% ETc). 100 and 25 % represent percentage of water replaced through irrigation. ETc - crop evapotranspiration Figure 5.2. Impact of irrigation treatments on transpiration of Sauvignon blanc vines, Lambert Vineyards, Niagara-on-the-Lake, ON. A: 2006; B: 2007; C: C~control (non-irrigated); PRD Partial root zone drying (100% ETc), Full (100% ETc), RDI-Regulated deficit irrigation (25% ETc). 100 and 25 % represent percentage of water replaced through irrigation. ETc-crop evapotranspiration Figure 5.3. Impact of irrigation treatments on leaf water potential of Sauvignon blanc vines, Lambert Vineyards, Niagara-on-the-Lake, ON. A: 2006; B: 2007; C: C-control (nonirrigated); PRD-Partial root zone drying (100% ETc), Full (100% ETc), RDI-Regulated deficit irrigation (25% ETc). 100 and 25 % represent percentage of water replaced through irrigation. ETc-crop evapotranspiration xiii
18 Figure 5.4. Impact of irrigation treatments on shoot growth rate (cm) of Sauvignon blanc vines, Lambert Vineyards, Niagara-on-the-Lake, ON, 2006 (A) and 2007 (B). C-control (non-irrigated); PRD-Partial root zone drying (100% ETc), Full (100% ETc), RDI-Regulated deficit irrigation (25% ETc). 100 and 25 % represent percentage of water replaced through irrigation. ETc-crop evapotranspiration Figure 5.5. PLS analysis of soil and vine water status, yield components, berry and wine chemical composition means from four irrigation treatments of Sauvignon blanc from Lambert Vineyards, Niagara-on-the-Lake, ON, Figure 5.6. Principal component analysis (F1&F2) of soil water status and physiological from four irrigation treatments of Sauvignon blanc from Lambert Vineyards, Niagara-on-the-Lake, ON, C-control (non-irrigated); PRD-Partial root zone drying (100% ETc), Full (100% ETc), RDI-Regulated deficit irrigation (25% ETc). 100 and 25 % represent percentage of water replaced through irrigation. ETc-crop evapotranspiration Figure 5.7. Principal component analysis (F1&F2) of mean sensory d(!.ta for four irrigation treatments wines of Sauvignon blanc from Lambert Vineyards, Niagara-on-the-Lake, ON, C-control (non-irrigated); PRD-Partial root zone drying (100% ETc), Full (100% ETc), RDI Regulated deficit irrigation (25% ETc). 100 and 25 % represent percentage of water replaced through irrigation. ETc-Crop evapotranspiration Figure 5.8. Radar diagram of the mean intensity ratings of four Sauvignon blanc wines made from different irrigation treatments Lambert Vineyards, Niagara-on-the-Lake, ON, Aroma and flavor attributes are specified by lower and higher case letters respectively. C-control (nonirrigated); PRD-Partial root zone drying (100% ETc), Full (100% ETc), RDI-Regulated deficit irrigation (25% ETc). 100 and 25 % represent percentage of water replaced through irrigation. ETc-crop evapotranspiration Figure 5.9. PLS regression analysis of soil and plant water status, yield components, berry and wine composition and sensory data from four irrigation treatments of Sauvignon blanc from Lambert Vineyards, Niagara-on-the-Lake, ON, Figure PLS regression analysis of soil and plant water status, yield components and berry composition from four irrigation treatments of Sauvignon blanc from Lambert Vineyards, Niagaraon-the-Lake, ON, Chapter 6 Figure 6.1. Impact of irrigation treatments on soil moisture (%) ofcabemet Sauvignon grapevines, Lambert Vineyards, Niagara-on-the-Lake, ON, 2006 (A), 2007 (B) and 2008 (C). Legend: C-control (non-irrigated); PRD-partial rootzone drying (100% ETc); Full-conventional drip irrigation (100% ETc); RDI-regulated deficit irrigation (25 and 50 % ETc); 25,50, 100 % are the percentages of water replaced in the soil Figure 6.2. Impact of irrigation treatments on transpiration rate of Cabemet Sauvignon grapevines, Lambert Vineyards, Niagara-on-the-Lake, ON, 2006 (A), 2007 (B) and 2008 (C). Legend: C-control (non-irrigated); PRD-partial rootzone drying (100% ETc); Full-conventional drip irrigation (100% ETc); RDI- regulated deficit irrigation (25 and 50 % ETc); 25, 50, 100 % are the percentages of water replaced in the soil xiv
19 Figure 6.3. Impact of irrigation treatments on leaf water potential of Cabernet Sauvignon grapevines, Lambert Vineyards, Niagara-on-the-Lake, ON, 2006 (A), 2007 (B) and 2008 (C). Legend: C-control (non-irrigated); PRD-partial rootzone drying (100% ETc); Full-conventional drip irrigation (100% ETc); RDI- regulated deficit irrigation (25 and 50 % ETc); 25, 50, 100 % are the percentages of water replaced in the soil Figure 6.4. Impact of irrigation treatments on shoot growth rate of Cabernet Sauvignon grapevines, Lambert Vineyards, Niagara-on-the-Lake, ON, 2006 (A), 2007 (B) and 2008 (C). Legend: C-control (non-irrigated); PRD -partial rootzone drying (100% ETc); Full--conventional drip irrigation (100% ETc); RDI- regulated deficit irrigation (25 and 50 % ETc); 25,50, 100% are the percentages of water replaced in the soil Figure 6.5. Principal component analysis (Fl&F2) of soil water status and physiological data means (10 vines x three shoots x three leaves x four replicates) from five irrigation treatments of Cabernet Sauvignon grapevines from Lambert Vineyards, Niagara-on-the-Lake, ON, Figure 6.6. PLS regression analysis of soil and plant water status and berry composition data from five irrigation treatments of Cabernet Sauvignon grapevines from Lambert Vineyards, Niagara-on-the-Lake, ON, Figure 6.7. Principal component analysis (Fl&F2) of soil water status and physiological data means (10 vines x three shoots x three leaves x four replicates) from five irrigation treatments of Cabernet Sauvignon grapevine from Lambert Vineyards, Niagara-on-the-Lake, ON, Figure 6.8. Principal component analysis (Fl&F2) of soil water status, physiological data, yield components and berry composition means (10 vines x three shoots x three leaves x four replicates) from five irrigation treatments of Cabernet Sauvignon grapevines from Lambert Vineyards, Niagara-on-the-Lake, ON, Figure 6.9. Principal component analysis (Fl&F2) of soil and vine water status from five irrigation treatments of Cabernet Sauvignon from Lambert Vineyards, Niagara-on-the-Lake, ON, Figure PLS regression analysis of soil and vine water status, yield components and berry composition data from five irrigation treatments of Cabernet Sauvignon grapevine from Lambert Vineyards, Niagara-on-the-Lake, ON, Figure Radar diagram the mean intensity ratings of five Cabernet Sauvignon wines made from different irrigation treatments Lambert Vineyards, Niagara-on-the-Lake, ON, Aroma and flavor attributes are specified by lower and higher case letters respectively. Legend: C-control (non-irrigated); PRD -partial rootzone'drying (100% ETc); Full--conventional drip irrigation (100% ETc); RDI- regulated deficit irrigation (25 and 50 % ETc); 25,50, 100 % are the percentages of water replaced in the soil Figure Principal component analysis (Fl&F2) of sensory data means from five irrigation treatments of Cabernet Sauvignon grapevine from Lambert Vineyards, Niagara-on-the-Lake, ON, Legend: C-control (non-irrigated); PRD -partial rootzone drying (100% ETc); Fullconventional drip irrigation (100% ETc); RDI- regulated deficit irrigation (25 and 50 % ETc); 25, 50, 100 % are the percentages of water replaced in the soil Figure PLS regression analysis of soil and plant water status, yield components, berry and wine composition and sensory data from five irrigation treatments of Cabernet Sauvignon grapevine from Lambert Vineyards, Niagara-on-the-Lake, ON, xv
20 Chapter 7 Figure 7.1. ABA and catabolite profiles of Baco noir leaves sampled from ten irrigation treatments over the growing season from Lambert Vineyards, Niagara-on-the-Lake, ON, 2006 (AI to A3: means first to third sampling time) and 2007 (B1 to B3: means first to third sampling time) Error bars indicate the standard error of the mean of three biological replicates. A1-6 July, A2-2OJuly, A3-3 August; B1-5 July, B2-19 July, B3-2 August); *Set, Lag, Ver. represent irrigation initiation times: fruit set, lag phase and veraison, respectively Figure 7.2. ABA and catabolite profiles of Baco noir leaves sampled from ten irrigation treatments over the growing season from Lambert Vineyards, Niagara-on-the-Lake, ON, 2006 (A4 and A5: means fourth and fifth sampling time) and 2007 (B4 to B5: means fourth and fifth sampling time). Error bars indicate the standard error of the mean of three biological replicates. (A4-17 August, A5-30August, B4-16 August, B5-29 August); *Set, Lag, Ver. represent irrigation initiation times: fruit set, lag phase and veraison, respectively; * 25, 50, 100 are percentage of water replaced based on ETc Figure 7.3. ABA and catabolite profiles of Baco noir berry skin sampled from ten irrigation treatments from Lambert Vineyards, Niagara-on-the-Lake, ON, 2006: A) at veraison and B) at harvest. Error bars indicate the standard error of the mean of three biological replicates. Set, Lag, Ver. are irrigation initiation times: fruit set, lag phase and veraison, respectively; * 25, 50, 100 are percentage of water replaced based on ETc Figure 7.4. ABA and catabolite profiles Baco noir berry pulp sampled from ten irrigation treatments from Lambert Vineyards, Niagara-on-the-Lake, ON, 2006: A) at veraison and B) at harvest). Error bars indicate the standard error of the mean of three biological replicates. Set, Lag, Ver. are irrigation initiation times: fruit set, lag phase and veraison, respectively; * 25, 50, 100 are percentage of water replaced based on ETc Figure 7.5. ABA and catabolite profiles of Baco noir berry skin sampled from ten irrigation treatments from Lambert Vineyards, Niagara-on-the-Lake, ON, 2007: A) at veraison and B) at harvest. Error bars indicate the standard error of the mean of three biological replicates. Set, Lag, Ver. are irrigation initiation times: fruit set, lag phase and veraison, respectively; * 25,50, 100 are percentage of water replaced based on ETc Figure 7.6. ABA and catabolite profiles of Baco noir berry pulp sampled from ten irrigation treatments from Lambert Vineyards, Niagara-on-the-Lake, ON, 2007: A) at veraison and B) at harvest. Error bars indicate the standard error of the mean of three biological replicates. Set, Lag, Ver. are irrigation initiation times: fruit set, lag phase and veraison, respectively; * 25, 50, 100 are percentage of water replaced based on ETc Figure 7.7. ABA and catabolite profiles of Chardonnay leaves sampled from seven irrigation treatments over the growing season from Lambert Vineyards, Niagara-on-the-Lake, ON, 2006 (AI to A3: means first to third sampling time) and 2007 (B 1 to B 3: means first to third sampling time). Error bars indicate the standard error of the mean of three biological replicates. (A1-6 July, A2-20 July, A3-3 August; B1-5 July, B2-19 July, B3-2 August); *Set and Ver. are irrigation initiation times fruit set and veraison, respectively; * 25, 50, 100 are percentage of water replaced based on ETc xvi
21 Figure 7.8. ABA and catabolite profiles of Chardonnay leaves sampled from seven irrigation treatments over the growing season from Lambert Vineyards, Niagara-on-the-Lake, ON, 2006 (A4 and A5: means fourth and fifth sampling time) and 2007 (B4 to B5: means fourth and fifth sampling time). Error bars indicate the standard error of the mean of three biological replicates. (A4-17 August, A5-30August, B4-16 August, B5-29 August); *Set and Ver. are irrigation initiation times: fruit set and veraison, respectively; * 25, 50, 100 are percentage of water replaced based on ETc Figure 7.9. ABA and catabolite profiles of Chardonnay berry skin sampled from seven irrigation treatments from Lambert Vineyards, Niagara-on-the-Lake, ON, 2006: A) at veraison and B) at harvest). Error bars indicate the standard error of the mean of three biological replicates. *Set and Ver. are irrigation initiation times: fruit set and veraison, respectively; * 25, 50, 100 are percentage of water replaced based on ETc Figure ABA and catabolite profiles of Chardonnay berry pulp sampled from seven irrigation treatments from Lambert Vineyards, Niagara-on-the-Lake, ON, 2006: A) at veraison and B) at harvest from. Error bars indicate the standard error of the mean of three biological replicates. *Set and Ver. are irrigation initiation times: fruit set and veraison, respectively; * 25, 50,100 are percentage of water replaced based on ETc Figure ABA and catabolite profiles of Chardonnay berry skin sampled from seven irrigation treatments from Lambert Vineyards, Niagara-on-the-Lake, ON, 2007: A) at veraison and B) at harvest). Error bars indicate the standard error of the mean of three biological replicates. *Set and Ver. are irrigation initiation times: fruit set and veraison, respectively; * 25, 50, 100 are percentage of water replaced based on ETc Figure ABA and catabolite profiles of Chardonnay berry pulp sampled from seven irrigation treatments from Lambert Vineyards, Niagara-on-the-Lake, ON, 2007: A) at veraison and B) at harvest). Error bars indicate the standard error of the mean of three biological replicates. *Set and Ver. are irrigation initiation times: fruit set and veraison, respectively; * 25, 50, 100 are percentage of water replaced based on ETc Figure Principal component analysis biplot (F1&F2) of soil and vine water status and water stress hormone composition from 10 irrigation treatments of Baco noir from Lambert Vineyards, Niagara-on-the-Lake, ON, Set, Lag and Veraison are the time for irrigation imposition and 100, 50 and 25 represent percentage of the water replaced in the soil through irrigation Figure Principal component analysis biplot (F1&F2) of soil and vine water status, and water stress hormone composition from 10 irrigation treatments of Baco noir from Lambert Vineyards, Niagara-on-the-Lake, ON, Set, Lag and Veraison are the time for irrigation imposition and 100, 50 and 25 represent percentage of the water replaced in the soil through irrigation Figure Principal component (F1&F2) of soil andvine water status, berry composition, and water stress hormone composition (skin-veraison) from ten irrigation treatments of Baco noir from Lambert Vineyards, Niagara-on-the-Lake, ON, Set, Lag and Veraison are the time for irrigation imposition and 100, 50 and 25 represent percentage of the water replaced in the soil through irrigation xvii
22 Figure Principal component analysis biplot (Fl&F2) of soil and vine water status, yield components and berry composition, and water stress hormone composition from seven irrigation treatments of Chardonnay vines from Lambert Vineyards, Niagara-on-the-Lake, ON, Set and Ver. are the time for irrigation imposition and 100, 50 and 25 represent percentage of the water replaced in the soil through irrigation Figure Principal component analysis biplot (Fl&F2) of soil and vine water status, yield components, berry composition, and water stress hormone composition from seven irrigation treatments of Chardonnay vines from Lambert Vineyards, Niagara-on-the-Lake, ON, Set and Veraison are the time for irrigation imposition and 100, 50 and 25 represent percentage of the water replaced in the soil through irrigation Chapter 8 Figure 8.1. Clusters of Vitis vinifera L. cv. Cabemet Sauvignon after two weeks following first ABA application: A) Control (non-treated), B) Only clusters sprayed, C) Only leaves sprayed, D) Whole canopy sprayed. Lambert Vineyards, Niagara-on-the-Lake, ON, Figure 8.2. Clusters of Vitis vinifera L. cv. Cabemet Sauvignon after four weeks following first ABA application: left to right, unsprayed, 150 and 300 mgil ABA. Lambert Vineyards, Niagaraon-the-Lake, ON, Figure 8.3. InfIltration rate of exogenous ABA in Cabemet Sauvignon vines after 2, 4, and 6 hours following treatment application. A) Berries B) Leaves. Lambert Vineyards, Niagara-on-the Lake, ON, Berry and leaf samples are from vines where whole canopy was treated with 300 mgil ABA solution. August 19, September 5 and September 19 are the sampling dates Figure 8.4. InfIltration rate of exogenous ABA in Cabemet Sauvignon vines after 2, 4, and 6 hours following treatment application. A) Berries B) Leaves. Lambert Vineyards, Niagara-on-the Lake, ON, Berry and leaf samples are from vines where whole canopy was treated with 300 mgil ABA solution. August 25, September 11 and September 25 are the sampling dates Figure 8.5. Hormone profile of ABA and its metabolites in Cabemet Sauvignon berries after.2 weeks following ABA application (wi) and harvest time (w3). Lambert Vineyards, Niagara-onthe-Lake, ON, Figure 8.6. Hormone profile of ABA and its metabolites in Cabemet Sauvignon berries after 2 weeks following ABA application (wi) and harvest time (w3). Lambert Vineyards, Niagara-onthe-Lake, ON, Figure 8.7. Principal component analysis (Fl&F2) of physiological data, yield components, berry composition and hormones concentration means from four ABA treatments of Cabemet Sauvignon grape vines from Lambert Vineyards, Niagara-on-the-Lake, ON, Acronyms used: B/C - number of berries per cluster, Total. Ph - total phenols, B.W.- berry weight, C.W. -cluster weight, S.F.M. - skin fresh mass, S.D.M.- skin dry mass, Ts-transpiration rate, 'I' -leaf water potential Figure Principal component analysis (Fl&F2) of physiological data, yield components and berry composition and hormones concentration means, from four ABA treatments of Cabemet Sauvignon from Lambert Vineyards, Niagara-on-the-Lake, ON, xviii
23 Chapter 1 Introduction A global increase in demand for high quality wine has prompted numerous researchers to find efficient and reliable ways to increase wine grape quality. Due to climate change, irrigation has become an integral feature of wine grape production in traditionally non-irrigated regions. The Niagara region of Ontario, where most of the Canadian wine grape industry is located, has become one of those regions. The frequency of dry weather during the growing season increased in the last decade; at least six of the last 10 vintages were subjected to prolonged droughts in southern Ontario and northeastern United States (Reynolds etal. 2007). Climate change predictions include an increase in summer temperature, frequent extreme weather, and altered rainfall patterns (an increased winter rainfall and decreased summer rainfall). The constraints posed by climate change require adaptive management, such as irrigation to stabilize yield and maintain or improve wine quality (Chaves et al. 2007, Medrano et al. 2003). This project was focused upon an important topic not only in Canada but also throughout eastern North America. Irrigation of woody perennial crops has heretofore not been a major concern in the humid east. However, numerous dry growing seasons have caused the eastern wine and tree fruit industries to reconsider use of irrigation. Several seasons of drought resulted in production problems including low yields, poor shoot growth and wine quality issues (low sugar, low ph and K, atypical aging). Irrigation may be a way of overcoming these problems, but there is a need to understand how physiological responses to water status affect vine performance and chemical composition of the fruit. The latter is the primary determinant of wine quality, and should provide the most accurate picture of how irrigation alleviates water stress. To understand the relationship among water deficit (soil and plant), plant physiology and fruit quality, it is necessary to understand how the water stress hormone profile [abscisic acid (ABA) and its catabolites] changes during the growing season under different levels of water status, and in different grape cultivars. ABA controls various processes in the plant including plant growth and fruit ripening (Dtiring et al. 1978, Matsushima et al. 1989). From a viticultural perspective, manipulation of ABA should be a useful tool in extreme weather conditions. Under low water status, ABA controls water balance in the plant, thus decreasing the irrigation needs. Under high water status and for high vigor cultivars, ABA could control growth and hasten ripening time. In the wine industry, producers are using this relationship as a management tool in 1
24 regulated deficit irrigation (RDI) in order to control canopy growth and berry size while improving wine quality (Goodwin and Macrae 1990). This research was focused on novel irrigation techniques that might be used with success in Niagara region to improve grape and wine quality. Partial root zone drying (PRD) and RDI are two irrigation methods that are based on controlling long - distance chemical signaling in plants. Consequently, it was expected that the use of PRD will be successful in simulating drought conditions, resulting in increased ABA and its subsequent outcome: stomatal closure and reduced shoot growth. RDI, whereby irrigation water is applied in volumes less than calculated potential evapotranspiration (ET 0)' might also have a similar effect to PRD in modifying vine growth, yield, fruit composition, and possibly winter hardiness. Conventional and novel methods used to measure grapevine water status (leaf water potential, transpiration and soil moisture) might be substituted by measurements of signature compounds, to more accurately provide physiological evidence of how irrigation alleviates water stress. Since ABA, which regulates stomata activity, is the most well documented compound produced during water stress in plants, it was hypothesized that monitoring the levels of ABA in grape vine leaves might give us an accurate indication of water stress levels. There is some evidence that this hormone is involved in many metabolic pathways at the cell level. A better understanding of the physiology and biochemistry of vine drought stress could presumably lead to a further optimization of wine quality. Objectives. The goal of this project was to provide irrigation recommendations for premium winegrape vineyards to improve yield, fruit composition and wine quality. Different irrigation regimes were imposed at fruit set, lag phase, and veraison on four wine grape cultivars: a French American hybrid (Vitis sp. cv. Baco noir) and three European cultivars (Vitis vinifera L. cvs. Cabernet Sauvignon, Chardonnay and Sauvignon blanc). Three different levels of water soil replacement (25%,50% and 100%) and two irrigation strategies (RDI and PRD) were used. The second objective of this study was to find the relationship between water stress hormone profile (ABA and its catabolites) and water status in leaves during the growing season and in berries at veraison and harvest time. The last objective was to find the beneficial effect of using exogenous ABA on grape quality under extreme weather conditions. 2
25 Literature Cited Chaves, M.e., C.R. Souza, T.P. Santos, M.L. Rodrigues, e.m. Lopes, J.P. Maroco, and J.S. Pereira Deficit irrigation in grapevine improves water-use efficiency while controlling vigour and production quality. Ann. App. BioI. 150: DUring, H., G. Alleweldt and R. Koch Studies on hormonal control of ripening in berries of grape vines. Acta Hort. 80: Goodwin, I., and I. Macrae Regulated deficit irrigation of Cabemet Sauvignon grapevines. Austral. New Zealand Wine Ind. J. 5: Matsushima, J., S. Hiratsuka, N. Taniguchi, R. Wada, and K. Suzaki Anthocyanin accumulation and sugar content in the skin of grape cultivar" Olympia" treated with ABA. J. Jpn. Soc. Hort. Sci. 58: Medrano, H., J.M. Escalona, J. Cifre, J. Bota, and J. Flexas A ten-year study on the physiology of two Spanish grapevine cultivars under field conditions: Effects of water availability from leaf photosynthesis to grape yield and quality. FUllCt. Plant BioI. 30: Reynolds, A.G., W. Lowrey, L. Tomek, J. Hakimi, e. de Savigny Influence of irrigation on vine performance, fruit composition, and wine quality of Chardonnay in a cool, humid climate. Am. J. Enol. Vitic. 58:
26 Chapter 2 Literature Review Drought is one of the main constraints that limit agricultural production worldwide (Boyer 1982). Water availability is a major factor, which affects both quality and quantity of wine grapes in hot, dry regions (Wample and Smithyman 2(02). Even in more moderate, temperate climates, grapevines often face some degree of drought stress during the growing season (Morlat et al. 1992). In a vineyard, irrigation management adds more challenges than in other crops since the link between water availability and fruit/wine quality is well recognized. Irrigation may affect grape quality via its effect on vegetative growth (Kliewer et al. 1983, Neja et al. 1977, Smart and Combe 1983), reproductive growth (Buttrose 1974b) or fundamental photosynthesis and assimilate partitioning (Hofacker 1977, Loveys and Kriedemann 1973) Water Use in Vineyards Water consumption by grapevines. A number of environmental and management variables such as temperature, humidity, water availability, vine nutrition, canopy architecture, genetic background of rootstocks and scions affect the amount of water consumed in the vineyard. There is still a lot of debate regarding the amount of water to be used in a vineyard. Numerous studies report the influence of irrigation on grapevines, but only a few report the quantity of water consumed with precision (Becker and Zimmermann 1984, Hardie and Considine 1976, Van Rooyen et al. 1980). Large differences in seasonal grapevine water consumption, from 250 mm (McCarthy et al. 1992) up to 800 mm (Prior and Grieve 1987) have been reported. Stevens (2002) reported values of 42 L{d per vine or the equivalent of 7 mmld for a vine spacing of 2 x 3 m. In a benchmark study, using several wine grape cultivars and irrigation systems in the Sunraysia area (Australia), values of water consumption in a range of 2-9 ML ha- 1 were found (Gidding et al. 2002). In another study on water balance using a flood irrigation method, Yunusa et al. (1997b) found that the evapotranspiration (ET) was 6.2 ML ha- 1 in a 50 year old Sultana block. The same authors also reported that from the total of water consumed in the vineyard, vine water use was only 1.1 ML ha- 1, while cover crop water use and soil evaporation were 2.1 ML ha- 1 and 3 ML ha- 1, respectively. In another study of water balance conducted in Murumbidgee (Australia), McCaffery and Tijs (2002) found water use in a vineyard between 1.5 and 4.0 ML ha- 1 Williams et al. (2003) stated that a direct comparison among studies on water consumption might be difficult 4
27 because of the differences in cultivars, training systems, agricultural practice, level of plant stress, and environmental conditions Water use efficiency (WUE). WUE of a species is defined as the amount of water taken into a plant in order to produce a unit of output (total biomass). Using lysimeters, Meyer et al. (1987) determined that between 715 and 750 L of water was necessary to produce a kilogram of dry wheat. Skewes and Meissner (1997) showed that the WUE varied tenfold (from 1.07 to tlml) for wine grape production in the Riverland area of South Australia. The same researchers showed that the efficiency of the water used (t/ml) depended on site, irrigation method and grape variety. Novel methods of irrigation scheduling based on concepts such as stress day indices and soil water balance modeling together with improved systems for applying water through sprinklers and drippers allow improvements in WUE. The own-rooted vines of V. vinifera L. cvs. Cabemet Sauvignon and Shiraz, grown near Adelaide (Australia), produced a crop of t ha- 1 with an irrigation input of less than 1ML ha- 1 by using partial root zone drying (PRD) technique (Loveys et al. 1998). The same authors reported that Riesling on Ramsey rootstock produced up to 30 t ha- 1 using half of the irrigation input compared to the same scion/rootstock combination used in the Riverland district (Australia). The physical factors important in determining the success of an irrigation management system include the soil water content, soil water potential, hydraulic conductivity ofthe soil, the amount of cover crop and the distribution ofthe roots (cover crop and grape vine), the quantity and temporal distribution of rain and the potential rate of evaporation (Gregory et al. 2000). Traditionally, estimates of water used in vineyard are based on measures of climate parameters. The water balance method is the established technique for estimating the full irrigation requirements when both the crop coefficients are well established and the reference evapotranspiration (ETo) information is available (Allen et al. 1998, Monteith and Unsworth 1990). The Food and Agriculture Organization of the United Nations (F.A.O.) recommend estimating crop evapotranspiration (ETc) from the equation: ET c=kc x ET 0, where Kc is the crop coefficient and ET 0 is the reference crop evaporation derived from measures of wind speed, temperature, relative humidity and solar radiation based on the Penman Monteith equation (Allen et al. 1998). ETo represents the evapotranspiration rate of a short green crop, completely shading the ground and having a uniform height. However, there is more uncertainty when the same approach is used to determine the ETc requirements of tree crops and vines (Dragoni et al. 2004, Fereres and Goldhamer 1990, Testi et al. 2006). 5
28 Wine grape growers have used irrigation to maximize the productivity by using the recommended crop coefficients (Allen et al. 1998, Doorenbos and Pruitt 1977). Such coefficients help predict the peak water requirement and therefore are useful in the design of the vineyard irrigation capacity. However, using these values results in water application rates in excess of those that may be optimal for keeping a balance between the vegetative and reproductive development required for the production of premium quality grapes. In order to calculate the Kc values, various techniques have been used such as lysimeters, water balance equations, changes in soil water content or deficit irrigation experiments have been used to calculate the Kc values (Evans 1993, Williams 1999, Yunusa et al. 1997a). In Australia, the ETc is usually estimated from US Class-A pan evaporation (Epan) and a crop factor (CF) where CF is equivalent to Kc adjusted by a pan factor (Kp). Some authors recommend different crop factors, which may be due to climatic conditions, foliage extent, leaf area density and method of irrigation (Goodwin 1995, McCarthy et al. 1992). In Australia, Irrigation Crop Management Services Agency (2000) derived its CF from Allen et al. (1998) while Goodwin (1995) reported CF values derived from drip irrigation experiments in the cooler climates of Victoria (Australia). Imposing a deficit irrigation strategy based on a water balance concept implies defining the plant water status based on water replacement as fractions of ETc. This aspect shows a large degree of uncertainty since the plant water stress development depends not only on the fraction of water consumption replaced to the soil but also on soil water holding capacity, growing conditions, climate and plant material (Reynolds and Naylor 1994). Soil evaporation and cover crop transpiration represent approximately 80% of total evapotranspiration (ET) in the vineyard. However, the same authors reported that water lost through cover crop and soil evaporation represent 49% and 62% of ETc in grafted and own rooted vines respectively, under drip irrigation. In experiments with vines grown in a semi-arid climate, there is a fourfold variation in the reported values of soil evaporation expressed as a percentage of total vineyard evapotranspiration, with values in a range of 13% to 60% (Yunusa et al. 1997a). Radiation intercepted by foliage is the major determinant of transpiration, and this explains some variation in Kc. Heilman et al. (1994) reported that both the canopy size and its shape changed the percentage of soil evaporation of ETc. Intrieri et al; (1998) studied the effect of row orientation on the diurnal and cumulative daily transpiration, and found that north-south oriented canopies transpired 50% less at noon than east-west oriented canopies. 6
29 2.2. Effect of Water Status on Grape Vine Components Root system and rootstock. One of the common responses to soil drying is that the roots show enhanced geotropism (Sharp and Davies 1985). As soil water potential decreases, roots have been observed to become thin, an adaptation to commit limited carbohydrate supply to extension growth, and allow thinner plants to explore deeper water reserves (Sharp et al. 1988). Along with physiological properties of the roots (e.g. hydraulic conductivity) and the root hair rhizosphere (Segal et al. 2008), root distribution and density are also critical to water uptake rates (Huang and Gao 2000). Rogiers et al. (2009) found that of the six cultivars (on own roots) that were compared, Chardonnay had the highest root biomass density and root length density, 5.9 g dm- 3 and 1682 cm dm- 3 respectively. Merlot, Flame Seedless, Semillon, and Shiraz had almost similar root biomass densities of about 2-3 g dm- 3 and root length densities ranging from 300 to 900 cm dm- 3 of soil (Rogiers et al. 2009). The relative proportion of shoot to root biomass affects the plant water status, too. Vigorous canopies on vines with smaller root systems may experience more water stress if water uptake rates are not adequate to meet the transpiration demands of the canopy (Dry and Loveys 1998). Root distribution is largely dependant on environmental conditions such as the physical and chemical properties of the soil and land management (Conradie 1988, Southey 1992, Van Zyl 1988) while the root density is genetically determined (Southey 1992, Williams and Smith 1991). Thus, selection of rootstocks with higher vigor will lead to a lower requirement for irrigation and higher efficiency for the water used. Rootstocks can affect both the vegetative growth and vine water status even under low water content in soil (Ezzahouani and Williams 1995). Studies conducted in various countries have characterized both commercial hybrid rootstocks and pure Vitis species with respect to their drought tolerance (Carbonneau 1985, Delas 1992, Galet 1979) Flower development and grape berry growth. Water deficits during specific stages of floral development can severely damage seed set, through pollen sterility or embryo abortion (Saini and Westgate 2000). There is also a metabolic disruption ofthecarbohydrate metabolism in the ovary, especially of acid invertase, that leads to the failure of the embryos to develop (Zinselmeier et al. 1995). Water stress must be avoided during flowering because of the adverse effect on yield, which is reduced up to 50% Goodwin (1995). Persistent waters stress also depresses the fruitfulness of latent buds (Alleweldt and Hofacker 1975, Buttrose 1974, Winkler et al. 1974). Soil moisture is one of the main factors influencing the inflorescence development in grapes (Alleweldt and Hofacker 1975). Studies on vines grown in controlled environments have 7
30 shown that the number and size of inflorescence primordia are reduced by water stress (Buttrose 1974). However, there are also contradictory reports where is stated that the water stress increases the fruitfulness of buds (Smart 1974, Smart et al. 1974). Improving the illumination within the canopy due to reduction in foliage density of water stressed vines leads to increasing the fertility of basal buds and fruitfulness of the vine as a whole (May 1965). Moreover, water stress causes a decrease in cytokinins in xylem sap (Livne and Vaadia 1972) and an increase in the ABA levelsin leaves and stems (DUring 1973, Loveys and Kriedemann 1973), both hormones having a great influence on fruit bud differentiation. Both size and number of berries are significantly reduced when water stress occur during flowering (Hardie and Considine 1976). Before veraison, at a moderate level of water stress, vegetative growth is significantly reduced with only a small decrease in yield, while the soluble solids and ph slightly increase and titratable acidity decrease (Goodwin and Macrae 1990). Water stress during the period from fruit set to veraison heavily reduced the fruit size (McCarthy 1997) because of the detrimental effect of soil water deficit on early fruit growth (Ojeda et al. 2001). This deficit cannot be recovered even if the water supplies return at full dosage later in the season (Poni et al. 1994). Although, there is strong evidence for advanced maturation due to water stress in the late stages of ripening (Smart and Combe 1983), there are also reports about delayed maturation (Hardie and Considine 1976). Severe water deficit during the ripening time causes delayed maturity which leads to grapes with wilted berries, dull fruit color and sunburn (Winkler et al. 1974) Grape composition. Physiological reactions to water deficit affect the growth and development of the shoots, leaves and fruits. Positive or negative effects of water status on grape quality are determined not only by the severity of water stress generated at various stages of vegetative and fruit development but also by the effect of irrigation on the balance between the vegetative and fruit development (Cawthon and Morris 1982, Hofacker 1977, Kliewer et al. 1983).Water stress occurs when the tissue moisture content, intracellular or extracellular deviates from the optimum, and the turgor pressure of the cell drops below its maximum value (Kays 1997). The extent and timing of mild water deficits have been shown to be a major factor in the 'terroir' effect (Koundouras et al. 1999, Seguin 1983). In grapes, field water deficit caused an increase of anthocyanin concentration in Cabernet franc (Matthews and Anderson 1988) and Shiraz (Ginestar et al. 1998) and sugar, anthocyanins and skin tannins in Cabernet Sauvignon grapes (Kennedy et al. 2002, Palejwala et al. 1985, Roby and Matthews 2004). Early season water deficits usually affect berry size, which due to a resulting higher surface to volume ratio, tends to intensify the color and flavor components in the skin. 8
31 Williams and Matthews (1990) observed differences in appearance, flavor, taste and aroma among wines made from grapes, which had experienced water deficits at different times during the vegetation period. Reynolds et al. (1996) reported increased monoterpene concentration in Gewtirztraminer berries and wines from vines that had undergone late season veraison water deficits compare to vines that experienced early season post-bloom or lag phase water deficits. Water stress also reduced shoot growth, which improved the berry composition by limiting the number of sinks for carbohydrates and/or by improving the microclimate inside the canopy (Smart et al. 1990). Berry size is smaller when the grapevines experience mild water deficits, especially those occurring between flowering and veraison (Becker and Zimmermann 1984, Hardie and Considine 1976, Van Leeuwen and Seguin 1994). Water deficit applied late in the season has a negative impact on the fruit quality due to the large canopy developed with an ample supply of water during the early part of the season, which reduces the ability of the crop to ripen due to shade (Wample and Smithyman 2002). A water deficit that occurs from veraison through the harvest also reduces berry cell enlargement and water accumulation (Becker and Zimmermann 1984, Smart and Coombe 1983). However, this has a less detrimental impact on final berry size than early season water stress (McCarthy 1997). The impact of water deficit on both vine development and berry composition enhances the oenological quality potential, especially for red wines (Williams and Matthews 1990). A sustained severe water stress might be detrimental to fruit quality because of poor canopy development and reduced leaf assimilation rate, and thus an inadequate vine capacity to ripen the crop (Hardie and Considine 1976), particularly under high yield levels (Freeman and Kliewer 1983). Severe water stress induces stomatal closure that causes reduced assimilation activity and shoots growth. It also has negative effects on both sugar content in berry and wood maturation (Escalona et al. 1999) Effects 0/ elevated soil moisture on vine components. Excessive soil moisture leads to increased vegetative growth and yield; however, the grape quality parameters, such as sugar content, pigment formation, acidity, aroma compounds and wood maturation of the vine are negatively affected (Van Leeuwen and Seguin 1994). Supplying irrigation in order to ensure the maximum potential evapotranspiration of the vine normally reduces wine quality because of an increase in berry size (Williams and Matthews 1990), leading to a lower skin to pulp ratio and a dilution of the main berry quality components that are localized in the skin. Excess water in the soil might also indirectly affect the berry quality because of an increased and prolonged period of vegetative growth. Following veraison, shoot growth competes for the 9
32 carbohydrates available for fruit ripening. Increased vegetative growth might also impair the cluster microclimate,particularly fruit light exposure. High vigor also increases the incidence for diseases of the fruit and leaves due to unfavorable microclimates in the dense canopy and inadequate spray penetration (Smart et al~ 1985). Excessive vegetative vigor has many consequences on the longterm management of grapevines such as poor floral differentiation and non-uniform bud break due to excess shade. In some cases, irrigation leads to a delay in obtaining desirable levels of sugar (Bravdo et al. 1984). Other irrigation studies have shown beneficial effect on fruit ripening, mainly on increasing sugar concentration in berry (Cline et al. 1985, Esteban et al. 1999). Relatively small water supplements increased both the grape production and quality (Dos Santos et al. 2003, Matthews and Anderson 1989, Reynolds and Naylor 1994), while full water replacement is seldom applied by wine grape growers due to its potential negative effect on grape quality (Peacock et al. 1998, Williams and Matthews 1990) Molecular and Biochemical Basis of the Response to Water Deficit Water status effects at the molecular level. Progress recently achieved in the profiling of the grapevine transcriptome, proteome and metabolome provides new opportunities and challenges to analyze changes in gene expression in response to water deficit (Vivier and Pretorius 2002). Cramer et al. (2007) analyzed the metabolite and mrna expression in Cabernet Sauvignon under water and salinity stress conditions. The relative abundance of a number of metabolites was substantially altered by water stress over time. Of the 12 organic acids, 19 amino acids, and 15 sugars analyzed, the concentrations of malate, proline and glucose increased the most under water deficit conditions. Water stress substantially increased the abundance of transcripts encoding a variety of ion, amino acid, nucleotide and peptide transporters (Cramer et al. 2007). Under water stress, the dissipation of excess absorbed light energy is critical to the prevention of photo oxidative damage to the photosynthetic apparatus (Niyogi et al. 1998). Cramer et al. (2007) observed the accumulation of transcripts encoding enzymes of the xanthophyll cycle, zeaxanthin epoxide and violaxanthin de-epoxidase, particularly under water-deficit stress conditions. Transcript abundance of genes involved in reactive oxygen species (ROS) detoxification (Mittler et al. 2004), such as phospholipid hydroperoxide glutathione peroxidase, gamma-glutamylcysteine synthetase, and NADPH glutathione reductase was also increased under water-deficit stress (Cramer et al. 2007). NCED (9-cis-epoxycarotenoid dioxygenase) gene, which 10
33 controls one step in abscisic acid biosynthesis, has been shown to be up-regulated when plant cells lose turgor in response to environmental stress or during the development of seeds and buds (Xiong and Zhu 2003) Water status and biochemical changes in vine. Alkalization of the xylem sap is a common response to various environmental stresses (Wilkinson and Davies 2002). The ph of grapevine xylem sap is quite acidic when compared with values for other species. Under water stress the ph of vine sap varied from 4.2 to 4.8 (Stoll et al. 2000) while values of 5.7 to 6.9 were found in Thompson Seedless grapevine (Roubelakis-Angelakis and Kliewer 1979). Because the ph of the grapevine sap is close to the pka value of ABA (4.8), small changes in sap ph (about 0.24 units under drought conditions) have large effects on the proportion of ABA present as its anion (Stoll et al. 2000). Ability of an alkaline artificial xylem (AX) solution to close stomata was ABA-dependant, since the leaves detached from an ABA-deficient mutant did not show decreased transpiration in response to alkaline ph unless a low concentration of ABA was applied in the solution (Wilkinson et al. 1998). Flavonoids are one of the most important determinants of quality in red grapes and wines (Kennedy et al. 2002). Anthocyanins, proanthocyanidins and flavonols are genetically determined. Their presence in plant leaves differs widely, according to species and cultivar ability to synthesize them. Drought, insects, potassium deficiency, extreme temperature, and excessive light (Steele et al. 2009) often initiate anthocyanins biosynthesis. This behavior allows these pigments to be used as an indicator of plant stress (Neill and Gould 1999). It is generally accepted that one key physiological function of anthocyanins in higher plants is its photo-protective role (Chalker-Scott 1999, Close and Beadle 2003). Liakopoulos et al. (2006) reported the photoprotective role of epidermal anthocyanins in young grapevine leaves. Water deficits accelerated anthocyanins accumulation in grape berries, particularly tri-hydroxylated anthocyanins (Castellarin et al. 2007). These deficits also increased the expression of many genes responsible for the biosynthesis of anthocyanins Water Deficit Effects on Vine Physiology General physiological adaptation. Water stress is a physiological reaction of a vine under water deficit caused by reduced soil water availability. Most important responses are closing the stomata, reducing photosynthesis, cell division and cell expansion. The vine becomes water stressed when the water lost from the leaf canopy exceeds the supply from the soil. This 11
34 demand is a function of the weather, canopy size and shape (Goodwin 1995). The supply of water to the vine depends on soil water content, root distribution and density, and soil physical properties. Plants have evolved various protective mechanisms that allow them to acclimate to unfavorable environments for continuing their survival and growth. At the cellular level, increasing osmoregulation (DUring 1984, Schultz and Matthews 1993) and diminishing water reserves in the apoplast to preserve metabolic functions (Schultz 1996) have been widely documented. Osmoregulation is a mechanism, which results in the accumulation of certain organic metabolites of low molecular weight that are known as compatible solutes (Bohnert et al. 1995). Metabolites that serve as compatible solutes differ among plant species and include polyhydroxylated sugar, alcohols, amino acids and their derivatives, tertiary sulphonium compounds and quaternary ammonium compounds (Bohnert and Jensen 1996). Such osmolytes accumulate in a higher concentration in cytoplasm (Serrano 1996). Since all subcellular structures must exist in an aqueous environment, tolerance to dehydration also depends on the ability of cells to maintain membrane integrity and prevent protein denaturation. No evidence exists yet, that osmolytes accumulate only at specific subcellular structures. They increase the ability of cells to retain water without disturbing normal cellular functions (Yancey et al. 1982). Grapevine cultivars sensitive to drought avoided water stress by using a range of physiological mechanisms while the drought tolerant cultivars did not undergo any kind of adaptation (Schultz 1996). Generally, wine grapes cultivars avoid drought by reducing leaf area (Winkel and RambalI993), lowering stomatal conductance (Flexas et al. 1998), increasing the leaf water storage capacity (DUring and Scienza 1980), and adjusting the stomatal density (DUring 1987) Transpiration. Transpiration is a physiological process, which is mainly driven by the proportion of radiant energy intercepted by the canopy, humidity of the air, turbulence, wind and availability of water in the soil (Hetherington and Woodward 2003). Daily rates of ETc between 0.8 and 2.2 mm have been reported for irrigated vines of different canopy size in North America (Heilman et al. 1994, Lascano et al. 1992). Transpiration is sensitive to the availability of soil water. Conductance of water vapors through the stomata (gs) is often restricted at low levels of soil water availability. The energy reflected fromthe soil surface exposed to solar radiation and transferred to the canopy exceeds compared to the radiant energy directly intercepted by the vine (Heilmann et al. 1994). Thus, the soil management could have a major impact on the water lost in the vineyard. 12
35 Water loss is restricted by stomatal closure more than the reduction in CO 2 uptake, due to differences between the vapor pressure gradients for water and CO 2 inside and outside of the leaves (Raven 2002). Jarvis and McNaughton (1986) pointed out that narrowing of the stomatal aperture may initially reduce water loss but this will result in an increase in temperature of the leaf which itself will drive transpiration harder to cancel out the impact of reduced conductance. Cuticular conductance of fully hydrated grape leaves has been estimated at about 5 mmol m- 2 S-1 and decreased to 1 mmol m- 2 S-1 in water stressed leaves (Boyer et al. 1997). Transpiration rates of fruit are typically much lower than transpiration rates in leaves (Lang 1990). In Sangiovese grapes at mid ripening, the bunch transpiration rates were generally less than 5% of leaf transpiration rates (Poni et al. 2001). Consistent with this observation, Mullins et al. (1992) stated that stomatal and lenticel densities on grape berries are low and become occluded with wax after fruit set. Stomatal movement is a result of interactions between the physiological factors and environmental conditions (Hetherington and Woodward 2003). Stomatal guard cells integrate signals from both the aerial environment and soil to control the stomatal aperture, which optimizes the water loss and carbon dioxide gained under a given set of environmental factors. In general, dry air has a greater drying capacity than moister air. Plants are generally sensitive to vapor pressure deficit (VPD). Therefore, grapevine leaves tend to shut their stomata, as air gets drier (Loveys 1984). This happens even though soil water may be readily available (Larsen et al. 1989) Xylem conductance. Reduced xylem conductance influences the water use efficiency (WUE) via effects on leaf water potential. Hydraulic conductance of roots and shoots is another parameter that influences vine transpiration (Lovisolo and Schubert 1998). Differences in stomatal control during the water stress are linked to the vulnerability of xylem vessels to cavitation (Jones and Sutherland 1991). In grapevine, the differences in hydraulic architecture within the petioles were attributed to near-isohydric and anisohydric behavior (Schultz 2003). The same author suggested that stomata could react to prevent embolism at different levels of leaf water potential. Specifically, a lower hydraulic conductance leads to lower rates of cavitation in the anisohydric variety, and therefore stomatal conductance and transpiration are not limited. Hydraulic conductance of roots was also found to affect the drought tolerance in grapes (Vandeleur et al. 2009).The same authors, using one-year-oldrooted cuttings of Chardonnay and Grenache, found that under water stress there was a greater reduction in root hydraulic conductance of Grenache compared with Chardonnay, which is an anisohydric cultivar. 13
36 Grape cultivars exhibit different stomatal sensitivity to water stress (DUring and Scienza 1980, Schultz 1996). These varietal differences in stomatal sensitivity to water stress are related to differences in ABA levels (Dilling and Broquedis 1980). However, the stomatal closure does not occur in response to hormonal signals from the roots in all cultivars (Schultz 1996). The importance of root sourced ABA in regulating the stomatal apertures of plant growing in dry soil has been re-examined with conflicting conclusions drawn (Borel et al. 2001, Holbrook et al. 2002). Studies using ABA deficient mutants revealed that the stomatal response to dry soil was strongly influenced by the capacity of the shoot to synthesize ABA (Holbrook et al. 2002). Their study suggested the existence of a multi-component signaling system to control the stomata activity. Different combinations of climatic and edaphic conditions generate different contributions to the signaling process trough different chemical compounds originated in different locations within the plant (Sauter et al. 2001). In a large survey of stress response variability (31 grapevine cultivars grafted on the same rootstock Fercal), Gaudillere et al. (2002) measured the photosynthetic carbon isotope composition (&13C) in sugar. Very different.i13c values were measured for Muscat de Hamburg, Chenin blanc, Carignane and Riesling, indicating significant variability of the stomatal control in V. vinifera cultivars and tolerance to water stress. Tempranillo, which is originally from the northern cool regions of Spain, is sensitive to water stress and prone to early leaf senescence (Gomez del Campo et al. 2000). In another study, Vincent et al. (2007) using two-year-old rooted cuttings in a greenhouse environment, found that Chardonnay was more resistant to both water deficits and salinity compared to Cabernet Sauvignon Photosynthesis. Decreases in the relative water content (RWC) in leaves, initially induces stomatal closure, thus imposing a decrease in the supply of CO 2 to the mesophyll cells. This leads to a decrease in the rate of leaf photosynthesis (Lawlor and Cornic 2002). Flexas et al. (2002) studied the effect of drought on photosynthesis in field-grown grapevine and they found that a 75% decrease in stomatal conductance resulted in a 54% decrease in CO 2 assimilation, and only a 19% decrease in the estimated electron transport rate. The intercellular CO 2 partial pressure tends to be constant in the leaves kept under wellwatered conditions (Faria et al. 1998). The same authors observed that under severe drought the morning period is the most favorable for carbon assimilation. In the afternoon, photosynthesis was restricted not only by the stomatal closure but also by the photochemical and biochemical limitations. 14
37 The discrepancy in photosynthesis data reflects the heterogeneous leaf environment of a grapevine canopy in which the single-leaf measurements may be influenced by temperature (Kriedemann 1968), vapor pressure deficit (Jacobs et al. 1996), proximity and size of sinks for photosynthates (Petrie et al. 2000), and the age and growth stage of the leaves (Kriedemann 1968). Synergistic effects of water stress on photoinhibition, high temperatures, and high light intensities have been reported for different species (Powles 1984), including grapevine (Correia et al. 1990, Medrano et al. 2003, Schultz 1996). However, the ratio of assimilation and transpiration remains constant with variations in air humidity and leaf temperature or even irradiance (Hall and Schulze 1980). The ability of Sangiovese leaves to avoid direct sunlight and excessive heat by changing their inclination acts as a protective mechanism, particularly under severe drought conditions (Palliotti et al. 2008). Lower leaf absorption (linked to low chlorophyll and carotenoid content), and greater leaf transmittance (associated with decreased lamina thickness) allow a vine to dissipate excessive light absorption and avoid chronic photoinhibition especially at the median leaves under water stress conditions (Palliotti et al. 2008). The chlorophylls a and b are essential pigments for the conversion of light energy to stored chemical energy. The amount of solar radiation absorbed by a leaf is a function of the photosynthetic pigment content (Foyer et al. 1982). Quantity of chlorophyll gives an indirect estimation ofthe nutrient status, senescence and plant stress (Merzlyak and Gitelson 1995, Merzlyak et al. 1999, Pefiuelas and Filella 1998). Since chlorophyll provides valuable information about the physiological status of plants, the measurement of leaf reflectance has been used for quickly and nondestructively assessing of the chlorophyll content in leaves and, indirectly, the water status (Steele et al. 2008) Approaches to Measurement of Water Status General comments. Precise definition of water status in different parts of the soil-plant system is required for the formulation and testing of hypotheses, such as those related to the mechanism of drought tolerance or adaptive responses in any plant. It is also essential that the method used to measure the water status to be relevant to the physiological process of interest. Reliable measures of water status provide powerful tools for irrigation scheduling. The available measures of soil or plant water status can be divided into those based either on the amount of water or on its energy status. Numerous techniques of water status evaluation 15
38 have been developed in the last years. Environmental water supply and actual grapevine water status can be assessed by measuring soil moisture status (soil water potential or soil water content), and physiological indicators (Boyer 1995, Kirkham 2004, Mullins 2001). However, no existing single method is convenient for assessing vine water uptake over the total growing season for a large number of plots and at a reasonable cost. Irrigation scheduling tools used by the industry vary widely with application decisions based on the calendar date, on some measurements of soil moisture or models of crop water use that rely on equations, such as Penman-Monteith and Priestley-Taylor. Ideally, irrigation scheduling should be based on some plant-based measure of water stress, such as pre-dawn water potential, stomatal conductance, midday leaf temperature, sap flow etc. but so far, none of these has reached a stage of development where it can be widely adopted practical Soil water content Soil moisture is a reasonable measure of plant stress since plant water status is closely linked to soil water status through the roots. There is a wide range of approaches and instruments for direct and indirect measurement of soil moisture content. These have been extensively reviewed elsewhere (Gardner et al. 2001, Kirkham 2004). They include neutron probes and a wide range of capacitance or electromagnetic sensors, including time-domain reflectometry, capacitance probes, resistance probes, etc. The majority of these instruments measure the dielectric constant of the soil, and the outcome is based on the relationship between this and soil moisture content. Resistance and voltaic probes are more dependent on the conductive capacity of the soil solution rather than dielectric constant. A basic measurement, which can be used to calibrate other methods or instruments, is to measure the soil moisture directly using gravimetric measurements. In addition, there are several indirect approaches for estimation the soil moisture content based on remote sensing using passive and active microwave or radar techniques (Gardner et al. 2001). A general problem with the estimation of both soil moisture content and potential arises because of the substantial heterogeneity within most of the soils. Single point measurements are rarely representative in irrigation scheduling (Townsend et al. 2001). An alternative approach that is widely adopted, especially for agronomic and irrigation purposes, is the indirect estimation of water status based on the calculation of the soil moisture balance (Allen et al. 1998) Soil water potential. A major issue with the measurement of the soil water content is that such measures do not necessarily relate to the ease with which that water can be extracted or to its effect on plant function. Methods that measure the energy status (e.g. soil 16
39 moisture tension) provide a rigorous indication of the water availability to plants. However, even the use of water potential as a measure of availability is somewhat oversimplified as this strictly refers only to the equilibrium situation. The capacity of the soil to release water also depends on the hydraulic conductivity of the soil (Kirkham 2004, Mullins 2001). The most common instruments that measure the energy status of soil water are the tensiometers and soil psychrometers (Mullins 2001). Many other indirect sensors of soil moisture tension, such as gypsum blocks depend on the water release characteristics of different porous materials (Mullins 2001) Plant water status measurements. Plant water status is preferably estimated by the direct measurement of plant water-stress variables such as the stem and leaf water potential and leaf conductance, rather than soil-based measurement approaches, which are prone to cumulative errors, require many sensors, and may not be representative due to the soil heterogeneity (Gruber and Schultz 2005, Jones 2004) Leaf water potential ('1'). For describing the plant water relations, Slatyer and Taylor (1960) introduced the term 'water potential' ('I') expressed in pressure units. Measurements of plant 'If are primarily done either by psychrometric or pressure chamber methods (Boyer 1995, Kirkham 2004, Jones 1992). Leaf 'If measured at pre-dawn ('P pd) approximates the soil water potential. According to Carbonneau (1998), 'Ppd values between -0.2 MPa and -0.4 MPa indicate that the vines are suffering slightly, while values between -0.4 and -0.6MPa indicate severe water stress. However, the critical leaf water potential at which stomata are dosing depends on various factors, e.g. environmental conditions, leaf position, age and vine prehistory (Smart and Combe 2003). A number of studies involving the vine responses to water have established general values of midday leaf water potential under adequate water status (Chone et al. 2001, Ojeda et al. 2002, Williams and Araujo 2002). Generally, -1.0 MPa was the preferred value at which the irrigation of vines is initiated in California, and -1.5 or -1.6 MPa were the lowest values achieved under dry conditions. According to the most recent literature, a reasonable value for a well-irrigated vine would be around -0.8 MPa (Girona et al. 2006). Schultz (1997) showed that these values could be misleading. He found that the nonirrigated Grenache vines reached a pre-dawn leaf 'If of MPa and that of Shiraz was much lower (apparently more water stressed) of -1.4 MPa. The Shiraz vines were able to successfully ripen their crop whereas the Grenache vines did not. The explanation was that Shiraz has the 17
40 ability to sustain photosynthesis at lower values of soil moisture due to the osmotic adjustment (Schultz and Matthews 1993). Vitis vinifera cultivars are particularly different in their drought tolerance, largely spread over the isohydric-anisohydric spectrum (Carbonneau 1985, Schultz 2003, Smart and Coombe 1983). For example, Grenache, of Mediterranean origin, was classified as near-isohydric, while Shiraz, of mesic origin, displayed anisohydric characteristics (Schultz 1996, 2003). Isohydry is generally attributed to a strong stomatal control of transpiration rate, which results in the observed similarity in midday leaf'll in drought and well-watered plants (Tardieu and Simonneau 1998). Anisohydric plants typically exhibit less stomatal control over evaporative demand and soil moisture, allowing large fluctuations in leaf'll (Franks et al. 2007). For most crops, the leaf conductance is very sensitive to actual crop water status, and therefore it could give a better indication of stress rather than tissue-based measures such as leaf and stem water potential (Jones 2004). However, leaf conductance is sensitive to other factors. The spatial coverage of spot leaf conductance measurements made with a porometer is very limited and the leaf-to-ieaf variations require much replication for reliable data. Therefore, the porometry method showed to be unsuitable for commercial applications (Hsiao 1990) Leaf temperature. As stomata close under water deficits, the leaf temperature rises. Leaf temperature is inversely correlated with the transpiration rate and stomatal conductance (Fuchs 1990, Jones 1992). The usefulness of the canopy temperature as a measure of the "crop water stress" was recognized in the 1960s (Gates 1964). Infrared thermometry (Idso et al. 1981) or thermography methods (Jones 2004) use the same principle of measuring canopy temperature. However, the leaf orientation and canopy geometry (row orientation, row spacing, and plant height) interact with both the environmental factors and stomatal conductance in order to determine the temperature of the plant canopy (Boissard et al. 1990, Fuchs 1990) Indirect measures of water status. In addition to the various methods for measuring either the water content or energy status of plant or soil water, there are a number of widely used indirect indicators of water status based on the analysis of plant growth or physiological responses known to be indicative ofthe water deficits (Jones 2004). These indicators range from visible expression of increasing plant water deficits such as wilting, growth rate, and morphometric changes (stem, leaf or fruit shrinkage) to physiological responses such as stomatal closure and reductions in photosynthesis rate (Fereres et al. 2003, Huguet et al. 1992, Naor and Cohen 2003). Although irrigation scheduling based on plant performance may be desirable, 18
41 constraints due to cost and lack of appropriate guidelines prevented any wide adoption of these methods. Among the various plant-based sensors that have been incorporated into irrigation systems, stem diameter gauges (Huguetet al. 1992), sap-flow sensors (Schmidt and Exarchou 2000) and acoustic emission sensors (Yang et al. 2003) are the most widely used. However, alternative methods such as the use of dendrometry (Goldhamer and Fereres 2001), showed a relatively high variability (Intrigliolo and Castel 2004). The use of the expert systems that integrate data from several sources (inputs from thermal or other crop response sensors and environmental data) appears to have a great potential in order to calculate an accurate water budget, and derive a robust irrigation schedule (Plant et al. 1992) Water Status and Abscisic Acid Physiological roles 0/ abscisic acid. When the soil water availability falls below a certain level, both the root", and turgor reach very low values and stimulate the synthesis of several plant growth regulators including ABA (Wright 1977). ABA can also be synthesized in leaves experiencing soil or air-drying. However, according to Cutler and Krochko (1999) almost all cells can synthesize ABA, which is transported through the plant via both xylem and phloem. Today, it is accepted that many plants regulate the stomatal aperture and leaf growth rates independently of hydraulic signals, in many cases this being a result of some chemical regulators generated by the interactions between the roots or leaves and drying soil or air (Zhang and Davies 1989). ABA is a key component of the signal transduction pathway for stomatal closure (Leung and Giraudat 1998). The concentration of the active forms of ABA in plant tissue depends not only on the relative rates of biosynthesis, catabolism, transport and redistribution of ABA within leaves, but also on the synthesis and transport from the roots (Zhang and Outlaw 2001). ABA should accumulate to a high concentration in order to act on its target cells to close stomata or reduce leaf growth (Dodd and Davies 1996, Loveys 1984). The strength of ABA signal perceived at its final site of action does not always reflect the coarser measurements of ABA concentration (Zhang and Outlaw 2001). Trejo et al. (1993) found a concentration of approximately M ABA in the xylem sap of a well-watered plant. If this entire amount reaches the guard cells,,the stomata would be permanently closed and the plant would not survive (Trejo et al. 1993). 19
42 Slovik and Hartung (1992), using a computer simulation, predicted that even well watered plants contain enough ABA to accumulate in the guard cells at a concentration high enough to close the stomata. This could happen if the sap ph is high enough to prevent the symplast from trapping the ABA when this passes through the leaf. The distribution of ABA between the cells and compartments of the leaves follows the "anion trap" concept (Wilkinson and Davies 2002). ABA accumulates in the most alkaline compartments to an extent determined by the steepness of the ph gradient across the membrane separating two compartments. The accumulation of ABA to physiologically active concentrations in the leaf apoplast adjacent to the guard cells is directly related to the ph value. Sauter et al. (2002) concluded that the basic ABA signal is influenced by the soil drying via synthesis of ABA conjugates such as glucose ester (ABA-GE). Unlike free ABA, ABA-GE is lipophobic and unable to cross the lipid cell membranes between the xylem and its surrounding tissues. ABA-GE following arrival in the leaf apoplast is cleaved by apoplastic esterases, hydrolases and ~- glucosidases, to release free ABA to the target cells (Dietz et al. 2000). Since under certain circumstances the ABA-GE from xylem could be the major translocation pathway of the ABA signal, simple measurements of ABA from xylem do not always reflect the amount of the anti-transpirant potentially present in the xylem stream. Changes in sap ph from xylem occur in response to the climatic fluctuations (light intensity, temperature and vapor pressure deficit), in the absence of leaf water deficits (Wilkinson and Davies 2002). ABA is catabolized via oxidation or conjugation with glucose, which might represent an inactive pool of ABA (Dietz et al. 2000, Nambara and Marion-Poll 2005). Lee et al. (2006) demonstrated that the cleavage of ABA-GE by an ABA-specific ~- glucosidase, AtBG1, is a new way to produce bioactive ABA in response to dehydration stress. Another theory stated that the production of ABA occurs in leaves and a different signal than ABA transmits the drought stress response from roots to leaves, and this unknown "root-to-ieaf' long distance signal in turn causes the production of ABA in leaves (Christmann et al. 2005) Plant responses to ABA. Abscisic acid plays primary regulatory roles in the initiation and maintenance of seed and bud dormancy and in response of plant to stress. In stressed roots, ABA not only maintains their growth rates (Munns and Sharp 1993) but it also increases the root hydraulic conductivity (Glinka and Reinhold 1971) by modifying the root membrane properties. Many studies have suggested that though the short-term effects of elevated ABA concentrations on stomatal function are reversible (Tardieu et al. 1996, Trejo et al. 1995), its longterm effects on developmental changes and functioning of stomata are permanent (Franks and 20
43 Farquhar 2001). Stomata of plants grown under water stress (which have higher ABA levels) are smaller than those of well-watered plants (Xia 1994). ABA also induces reductions in leaf and stem growth rates, reduces the leaf surface area and preserves water (Bacon 2004). Zacarias and Reid (1990) showed that ABA also accelerates the senescence of leaves, while ethylene induces their abscission. Changes in ABA content appear to trigger the final steps in the ripening process (Coombe 1976). Later, it was demonstrated that the ABA regulates the biosynthesis of primary and secondary metabolites during the grape berry ripening (Antolfn et al. 2003, Davies et al. 1997). Increases in ABA level during berry maturation have been correlated with increases in soluble solids, reducing sugars, and anthocyanins (Palejwala et al. 1985). ABA has also effect on the expression of genes involved in anthocyanin biosynthesis, invertase activity, and ASR (ABA, stress, and ripening) proteins involved in sugar metabolism and ripening (Ban et al. 2003, C;akir et al. 2003, Gagne et al. 2006, Pan et al. 2005). Several studies have found positive effects of ABA applications on grape berry development and production of components associated with maturation and ripening. ABA applied to Flame Seedless grapes led to increases in berry size, skin anthocyanins and reductions in juice acidity and berry firmness (Peppi et al. 2006, Peppi and Fidelibus 2008). The content of anthocyanins also increased in Cabernet Sauvignon berries where exogenous ABA was used (Gagne et al. 2006). Munns and King (1988) have presented some evidence for the presence of a root-sourced chemical signal other than ABA, which is responsive to soil water potential. Synthesis of the ethylene precursor 1-arninocyclgpropane-1carboxilic acid (ACC) increases in roots in response to stress (Gomez-Cadenas et al. 1996) and it is transported to shoots where the ethylene released from ACC induce the ABA synthesis (Hansen and Grossmann 2000) Irrigation Strategies In the humid and sub-humid zones, irrigation has been used for some time to supplement rainfall as a tactical measure to stabilize production during drought seasons. This practice has been called supplemental irrigation (Cabelguenne et al. 1995) and is used to achieve maximum yields and eliminate yield fluctuations caused by the water deficits. Furthermore, supplemental irrigation in humid climates has often been advocated as more efficient than irrigation practiced in the arid 21
44 zones because lower water vapor deficits of humid zones lead to higher transpiration efficiency than in arid zones (Tanner and Sinclair 1983) Deficit irrigation. From the standpoint of water conservation, less water supplied to trees and vine canopies is translated into a greater decrease in transpiration than in field crops, leading to more net water savings (Dilling et al. 1997, Turner 1997). However, a consequence of reducing irrigation water using a deficit irrigation strategy is the greater risk of increased soil salinity due to reduced leaching, and its impact on the sustainability of the irrigation (Schoups et al. 2005) Regulated deficit irrigation (RDI). The deliberate withholding of irrigation water is embodied in the technique known as regulated deficit irrigation (RDI). This technique is a strategy to reduce the possible negative impacts of irrigation on wine quality, where the irrigation input is removed or reduced for specific periods during the crop cycle (Alegre et al. 1999, Goodwin and Macrae 1990). This technique relies on precise knowledge of the phenology of vegetative and reproductive development of the vine. The concept of RDI was first proposed to control the vegetative growth in peach orchards (Chalmers et al. 1981). They found that savings in irrigation water were realized without reducing yield. The major impact of the imposed water deficit is to reduce the vegetative growth with little effect on fruit development (Goodwin and Boland 2002). However, RDI was not successful in every environment (Girona et al. 1993). The benefits of RDI to the yield and quality of wine grapes were clearly demonstrated relative to rainfed production (Bravdo and Naor 1996, Girona et al. 2006). RDI found extensive application in the production of wine grapes in Australia (McCarthy et al. 2002). Chalmers et al. (1981) and Girona et al. (1993) have studied the mechanisms responsible for the lack of yield decreasing under RDI. Their explanation is that the high sensitivity of the expansive growth of the aerial parts to water deficits must affect the partitioning of assimilated carbon, as photosynthesis is not affected by mild water deficits. Root growth is stimulated under water deficits (Hsiao and Xu 2000). The RDI response is very dependent on the timing and degree of severity of the water deficits, as well as on crop load (Marsal and Girona 1997). McCarthy et al. (2002) showed that by regulating the soil water tensions carefully. ius possible to achieve the desired balance between the vegetative and berry growth. RDI may also causes changes to specific characteristics such as the size of grape berries (McCarthy 1997). This is important because the flavor compounds that determine the wine quality are located principally in the berry skin, and an increase in ratio skin:pulp might improve the fruit quality. 22
45 Partial root zone drying. In order to manipulate WUE in the vineyard based on vine physiology behavior under water stress, another strategic irrigation management tool was developed. This is called partial root zone drying (PRD) (Dry and Loveys 1998, Loveys et al. 2000). The PRD technique has its origin in the observation that the root-derived abscisic acid is important in controlling the stomatal conductance (Davies and Zhang 1991, Loveys 1984). Splitroot plants were used to show that many of the effects of water stress can be explained in terms of the transport of chemical signals from root to shoot without changes in water relations (Gowing et al. 1990). The content of ABA in xylem sap from field grown Cabernet Sauvignon vines was significantly higher in PRD treatment than in fully irrigated control, proving that the root-sourced ABA is involved in the PRD response of the grapevine (Stoll et al. 2000). Although, large changes in the ABA content of the drying grapevine roots occur during PRD irrigation (Loveys et al. 2000), the changes of ABA content in leaves are relatively small (Stoll et al. 2000). Loveys (1991) stated that if both wet and dry root zones would be maintained alternatively, the vegetative development of the plant could be manipulated through an appropriate irrigation management. Experiments with potted and field-grown grapevines showed that shoot growth, leaf expansion and transpiration were significantly reduced by PRD (Dry and Loveys 1999, Dry et al. 1996, Passioura 1988). Loveys et al. (1998) used PRD to reduce the need for pruning, and showed that the pruning weights were reduced between 20 to 40% compared with normally irrigated vines. The reduction in canopy density caused a better penetration of the light to the cluster zone and consequently an improvement in grape quality (Dry et al. 1996). PRD does not alter the leaf '!', and this lack of reaction is explained by a mechanism based on a root derived chemical signal rather than a hydraulic one (Stoll etal. 2000). Most of the studies showed that water status.affects grape quality, both low and high water status being associated with negative changes in wine quality. Even if many studies have been done on optimization of water status in the vine in order to improve wine quality, confusion still persist among grape growers and winemakers about the necessity of using irrigation, not only in cool but also semiarid area. The contradictory data from different studies were a consequence of the different cultivars, cultural practices and climate conditions used. As a consequence of climate change, more vineyards will be affected in terms of their water status. The general trend in water balance studies is to understand how the biochemistry and molecular changes occurs in grapevine under extreme water status. Winegrape quality might be improved under extreme weather conditions through a manipulation of vine physiology. This could be done by using more efficient irrigation techniques or using exogenous plant hormones in vineyards. 23
46 Literature Cited Alegre, S., J. Girona, J. Marsal, A. Arbones, M. Mata, D. Montagut, F. Teixido, M.J. Motilva, and M.P. Romero Regulated deficit irrigation on olives trees. Acta Hort. 474: Allen, R.G., L.S. Pereira, D. Raesk, and M. Smith Crop evapotranspiration: guidelines for computing crop water requirements. FAO Irrigation and Drainage Paper No. 56 Rome, Italy. Alleweldt, G., and W. Hofacker Influence of environmental factors on bud burst, flowering fertility and shoot growth of vines. Vitis 14: Antolin, M., H. Baigorri, I. Luis, F. Aguirrezabal, L. Geny, M. Broquedis, and M. Sanchez-Diazo ABA during reproductive development in non-irrigated grapevines (Vitis vinifera L. cv. Tempranillo). Austral. J. Grape Wine Res. 9: Bacon, M.A Water use efficiency in plant biology. Blackwell Publishing Ltd, Oxford, 244 p Ban, T., M. Ishimaru, S. Kobayashi, S. Shiozaki, N. Goto-Yamamoto, and S. Horiuchi Abscisic acid and 2,4-dichlorophenoxyacetic acid affect the expression of anthocyanin biosynthetic pathway genes in 'Kyoho' grape berries. J. Hort. Sci. Biotechnol. 78: Becker, N., and H. Zimmermann Influence de divers apports d'eau sur des vignes en pots, sur la maturation des sarments, Ie developpement des baies et la qualite des vins. Bull. OIY 57: Bohnert, H.J., and R.G. Jensen Strategies for engineering water-stress tolerance in plants. Trends in Biotechnol. 14: Bohnert, H.J., D.E. Nelson, and R.G. Jensen Adaptations to environmental stresses. Plant Cell 7: Boissard, P., G. Guyot, and R.D. Jackson Factors affecting the radiative surface temperature of vegetative canopy. pp In: Application of Remote Sensing in Agriculture. Steven M.D., Clark J.A. (Eds.), Butterworths, London, UK. Borel, c., C. Audran, A. Frey, A. Marion-Poll, F. Tardieu, and T. Simonneau N. plumbaginifolia zeaxanthin epoxidase transgenic lines have unaltered baseline ABA accumulations in roots and xylem sap, but contrasting sensitivities of ABA accumulation to water deficit. J. Exp. Bot. 52: Boyer, J.S Plant productivity and environment. Science 218: Boyer, J.S Measuring the water status of plants and soils. Academic Press, San Diego. 178p. Boyer, J.S., C.S. Wong, and G.D. Farquar CO 2 and water vapor exchange across leaf cuticle (epidermis) at various water potentials. Plant Physiol. 114: Bravdo, B., Y. Hepner, C. Loinger, S. Cohen, and H. Tabacman Effect of crop level on growth, yield and wine quality of high yielding Carignane vineyard. Am. J. Enol. Vitic. 35: Bravdo, B., and A. Naor Effect of water regime on productivity and quality offruit and wine. Acta Hort. 427: Buttrose, M.S Fruitfulness in grapevines: Effects of water stress. Vitis 12: Cabelguenne, M., c.a. Jones, and J.R. Williams Strategies for limited irrigations of maize in southwestern France: a modelling approach. Transactions of the ASAE 38:
47 C;akir, B., A Agasse, C. Gaillard, A Saumonneau, S. Delrot, and R. Atanassova A grape ASR protein involved in sugar and abscisic acid signalling. Plant Cell 15: Carbonneau, A The early selection of grapevine rootstocks for resistance to drought conditions. Am. J. Enol. Vitic. 36: Carbonneau, A Irrigation, vignoble et produit de la vigne. pp In: Tiercelin J-R, coordinator. Traite d'irrigation. Chapitre IV. Aspects Qualitatifs. Lavoisier, Paris. Castellarin, S.D., A Pfeiffer, P. Sivilotti, M. Degan, E. Peterlunger, and G. Di Gaspero Transcriptional regulation of anthocyanin biosynthesis in ripening fruit of grapevine under seasonal water deficit. Plant Cell Envir. 30: Cawthon, D. L., and J.R. Morris Relationship of seed number and maturity to berry development, fruit maturation, hormonal changes, and uneven ripening of Concord (Vitis labrusca L.) grapes. J. Amer. Soc. Hortic. Sci. 107: Chalker-Scott, L Environmental significance of anthocyanins in plant stress responses. Photochem. Photobiol. 70:1-9. Chalmers, D.J., P.D. Mitchell, and L. Van Heek Control of peach tree growth and productivity by regulated water supply, tree density and summer pruning. J. Amer. Soc. Hortic. Sci. 106: Chone, X., C. Van Leeuwen, D. Dubourdieu, and J.P. Gaudillere Stem water potential is a sensitive indicator of grapevine water status. Ann. Bot. 87: Christmann, A, T. Hoffmann, I. Teplova, E. Grill, and A Millier Generation of active pools of abscisic acid revealed by in vivo imaging of water stressed Arabidopsis. Plant Physiol. 137: Cline, R.A., K.H. Fisher, and O.A Bradt The effects oftrickle irrigation and training system on the performance of Concord grapes. pp In: Proceedings of the 3rd International Dripffrickle Irrigation Congress. American Society of Agricultural Engineers, St. Joseph, MI. Close, D.e., and C.L. Beadle The ecophysiology offoliar anthocyanin. Botan. Rev. 69: Conradie, W.J Effect of soil acidity on grapevine root growth and the role of roots as a source of nutrient reserves, p In: The grapevine root and its environment. Van Zyl J.L. (Eds.). Dept. Agr. and Water Supply, Stellenbosch, South Africa. Coombe, B.G The development of flesh fruits. Ann. Rev. Plant Physiol. 27: Correia, M.J., M.M. Chaves, and J.S. Pereira Afternoon depression in photosynthesis: Evidence for a high light stress effect in grapevine leaves. J. Exp. Bot. 41: Cramer, G.R., A Ergul, J. Grimplet, R.L. Tillett, E.A Tattersall, M.e. Bohlman, D Vincent, J. Sonderegger, J. Evans, e. Osborne, D. Quilici, K.A Schlauch, D.A Schooley, and J.e. Cushman Water and salinity stress in grapevines: early and late changes in transcript and metabolite profiles. Funct. Integ. Genom. 7: Cutler, AJ., and J.E. Krochko Formation and breakdown of ABA Trends in Plant Sci. 4: Davies, C., P. Boss, and S. Robinson Treatment of grape berries, a nonc1imacteric fruit with a synthetic auxin, retards ripening and alters the expression of developmentally regulated genes. Plant Physiol. 115:
48 Davies, W.J., and J. Zhang Root signals and the regulation of growth and development of plants in drying soil. Ann. Rev. Plant Physiol. Plant Molec. BioI. 42: Delas, J Criteria used for rootstock selection in France. pp In: Proc. Rootstock Seminar: A worldwide Perspective. Reno, Nevada. Dietz, KJ., A Sauter, K. Wichert, D. Messdaghi, and W. Hartung Extracellular~glucosidase activity in barley involved in the hydrolysis of ABA glucose conjugate in leaves. J. Exp. Bot. 51: Dodd, I.C., and W.J. Davies The relationship between leaf growth and ABA accumulation in the grass leaf elongation zone. Plant Cell Envir. 19: Doorenbos, J., and W.O. Pruitt Crop water requirements. Irrigation and Drainage Paper No. 24, (rev.) FAO, Rome, Italy. 144 p. Dos Santos, T.P., C.M. Lopes, M.L. Rodrigues, C.R de Souza, J.P. Maroco, J.S. Pereira, J.R Silva, and M.M. Chaves Partial rootzone drying: effects on growth and fruit quality of field-grown grapevines (Vitis vinifera). Funct. Plant BioI. 30: Dragoni, D., AN. Lakso, and RM. Piccioni Transpiration of an apple orchard in a cool humid climate: measurement and modeling. Acta Hort. 664: Dry, P.R, and B.R Loveys Factors influencing grapevine vigour and the potential for control with partial rootzone drying. Austral. J. Grape Wine Res. 4: Dry, P.R, and B.R Loveys Grapevine shoot growth and stomatal conductance are reduced when part of the root system is dried. Vitis 38: Dry, P.R, B.R Loveys, D. Botting, and H. DUring Effects of partial root-zone drying on grapevine vigour, yield, composition of fruit and use of water. pp In: Proceedings of the 9th Australian Wine Industry Technical Conference. DUring, H Abscisinsaure in Vitis vinifera-friichten wahrend der Reife, Naturwissenschaften 60: DUring, H Evidence for osmotic adjustment to drought in grapevine (Vitis vinifera L.). Vitis 23:1-10. Diiring, H Stomatal responses to alterations of soil and air humidity in grapevines. Vitis. 26:9-18. Diiring, H., and M. Broquedis Effects of abscisic acid and benzyladenine on irrigated and non-irrigated grapevines. Sci. Hort. 13: DUring, H, B.R Loveys, and P.R Dry Root signals affect water use efficiency and shoot growth. Acta Hort. 427: Diiring, H., and A Scienza Drought resistance of some Vitis species and cultivars. pp In: Proc. Third Inter. Symp. Grape Breeding, University of California - Davis. Escalona, J.M., J. Flexas, and H. Medrano Stomatal and non'-stomatallimitations of photosynthesis under water stress in field-grown grapevines. Austral. J. Plant PhysioI.26: Esteban, M.A, M.J. Villanueva, and J.R Lissarrague Effect of irrigation on changes in berry composition of Tempranillo during maturation. sugars, organic acids, and mineral elements. Am. J. Enol. Vitic. 50: Evans, L.T Crop Evolution. Adaptation and Yield. Cambridge University Press. UK. 500 p. 26
49 Ezzahouani, A, and L.E. Williams The influence of rootstock on leaf water potential, yield, and berry composition of Ruby Seedless grapevines. Am. J. Enol. Vitic. 46: Faria, T., D. Silverio, E. Breia, R. Cabral, A Abadia, J. Abadia, J.S. Pereira, and M.M. Chaves Differences in the response of carbon assimilation to summer stress (water deficits, high light and temperature) in four Mediterranean tree species. Physiol. Plant. 102: Fereres, E., and D.A Goldhamer Deciduous fruit and nut trees. pp In: Stewart, B.A and Nielsen, D.R. (Eds.).lrrigation of agricultural crops, Agronomy 30 Madison, WI ASA, CSSA, SSSA Fereres, E., D.A. Goldhamer, and L.R. Parsons Irrigation water management of horticultural crops. Historical review compiled for the American Society of Horticultural Science's looth Anniversary. HortSci. 38: Flexas, J., J. Bota, J.M. Escalona, B. Sampol, and H. Medrano Effect of drought on photosynthesis in grapevines under field condition: an evaluation of stomatal and mesophyll limitations. FUllct. Plant BioI. 29: Flexas, J., J.M. Escalona, and H. Medrano Down regulation of photosynthesis by drought under field conditions in grapevine leaves. Austral. J. Plant. Physiol. 25: Foyer, C., R. Leegood, and D. Walker What limits photosynthesis? Nature 298:326. Franks, P.l, and G.D. Farquhar The effect of exogenous abscisic acid on stomatal development, stomatal mechanics and leaf gas exchange in Tradescantia virginiana. Plant Physiol. 125: Franks, P.J., P.L. Drake, and R.H. Froend Anisohydric but isohydrodynamic: seasonally constant plant water potential gradient explained by a stomatal control mechanism incorporating variable plant hydraulic conductance. Plant Cell Envir. 30: Freeman, B.M., and W.M. Kliewer Effects of irrigation, crop level and potassium fertilization on Carignane vines II Grape and wine quality. Am. J. Enol. Vitic 34: Fuchs, M Infrared measurement of canopy temperature and detection of plant water stress. Theor. Appl. Climatol. 42: Gagne, S., K. Esteve, C. Deytieux, C. Sauvier, and L. Geny Influence of abscisic acid in triggering veraison in grape berry skins of Vitis vinifera L. cv. Cabernet Sauvignon. Vitis 40:7-14. Galet, P A Practical Ampe1ography: Grapevine Identification. Cornell University Press, Ithaca, NY and London. 170 p. Gardner, C.M.K., D. Robinson, K. Blyth, and J.D. Cooper Soil water content. pp In: Soil and Environmental Analysis: Physical Methods. Smith, K.A. and Mullins, C. (Eds.), Marcel Dekker, New York, NY. Gates, D.M Leaf temperature and transpiration. Agr. J. 56: Gaudillere, J.P., C. Van Leeuwen, and N. Ollat Carbon isotope composition of sugars in grapevines, an integrated indicator of vineyard water status. J. Exp. Bot. 53: Gidding, J., S. Kelly, Y. Chalmers and H. Cook Winegrapeirrigation benchmarking, Murray Darling and Swan Hill pp In: Managing Water. Proceed. of Austral. Society of Viticulture and Oenology Seminar. Dundon, c., Hamilton, R., Johnstone, R., Partridge, S., (Eds.), Mildura Arts Centre, Victoria, Adelaide. 27
50 Ginestar, C., J. Esteban, S. Gray, and P. Hand Use of sap flow sensors to schedule vineyard irrigation. ll. Effects of postveraison water deficits on composition of Shiraz grapes. Am. J. Enol. Vitic. 49: Girona, J., M. Mata, J. del Campo, A Arbones, E. Bartra, and J. Marsal The use of midday leaf water potential for scheduling deficit irrigation in vineyards. Irrig. Sci. 24: Girona, J., M. Mata, D.A Goldhamer, RS. Johnson, and T.J. Dejong Patterns of soil and tree water status and leaf functioning during regulated deficit irrigation scheduling in peach. J. Amer. Soc. Hortic. Sci. 118: Glinka, Z., and L. Reinhold Abscisic acid raises the permeability of plant cells to water. Plant Physiol. 48: Goldhamer, D.A, and E. Fereres Irrigation scheduling protocols using continuously recorded trunk diameter measurements. Irrig. Sci. 20: Gomez-Cadenas, A, F.R Tadeo, M. Talon, and E. Primo-Millo Leaf abscission induced by ethylene in water-stressed intact seedlings of Cleopatra Mandarin requires previous abscisic acid accumulation in roots. Plant Physiol. 112: 1 : GOmez del Campo, M., C. Ruiz, V. Sotes, and R Lissarrague Water consumption, leaf area development, and production in four grapevine varieties. Acta Hort. 526: Goodwin, I Irrigation of vineyards - A grapegrowers guide to irrigation scheduling and regulated deficit irrigation. A V Handbook. Department of Natural Resources and Environment, Victoria, Australia. 75p. Goodwin, I., and AM. Boland Scheduling deficit irrigation of fruit trees for optimizing water use efficiency. In: Water Reports. Food and Agriculture Organization of the United Nations. Rome. Goodwin, I., and I. Macrae Regulated deficit irrigation of Vitis vinifera L. cv. Cabernet Sauvignon grapevines. Austral. New Zealand Wine Ind. J. 5: Gowing, D.J.G., W.J. Davies, and H.G. Jones A positive root-sourced signal as an indicator of soil drying in apple, Malus x domestica Borkh. J. Exp. Bot. 41: Gregory, P.J., L.P. Simmonds, and CJ. Pilbeam Soil type, climatic regime, and the response of water use efficiency to crop management. Agr. J. 92: Gruber, B.R, and H.R Schultz Coupling of plant to soil water status at different vineyard sites. Acta Hort. 689: Hall, A.E., and B.D. Schulze Stomatal response to environment and a possible interrelation between stomatal effects on transpiration and CO 2 assimilation. Plant Cell Envir. 3: Hansen, H., and K. Grossmann Auxin-induced ethylene triggers abscisic acid biosynthesis and growth inhibition. Plant Physiol. 124: Hardie, W.J. and J.A Considine Response of grapes to water-deficit stress in particular stages of development. Am. J. Enol. Vitic. 27: Heilman, J.L., KJ. McInnes, M.J. Savage, RW. Gesch, andrj. Lascano Soil and canopy energy balances ina west Texas vineyard. Agricult. Forest Meteorol. 71: Hetherington, A.M., and F.I. Woodward The role of stomata in sensing and driving environmental change. Nature 424:
51 Hofacker, W Investigation on the substances production of vines under the influence of changing soil water supply. Vitis 16: Holbrook, N.M., V.R Shashidnar, RA. James, and R Munss Stomatal control in tomato with ABA-deficient roots: response of grafted plants to soil drying. J. Exp. Bot. 53: Hsiao, T.e Measurements of plant water status. pp In: Irrigation of agricultural crops. Stewart, B.A and Nielsen, D.R (Eds.). Madison, WI American Society of Agronomy Inc. Hsiao, T.e., and L.K. Xu Sensitivity of growth of roots versus leaves to water stress: biophysical analysis and relation to water transport. J. Exp. Bot. 51: Huang, B., and H. Gao Root physiological characteristics associated with drought resistance in tall fescue cultivars. Crop Sci. 40: Huguet, J.G., S.H. Li, J.Y. Lorendeau, and G. Pelloux Specific micromorphometric reactions of fruit trees to water stress and irrigation scheduling automation. J. Hort. Sci. 67: ICMS Annual irrigation requirements for horticultural crops. Technological Report No.263. Primary Industries and Resources South Australia. Idso, S.B., R.D. Jackson, P.J. Jr Pinter, R.I. Reginato, and J.L. Hatfield Normalizing the stress-degree-day parameter for environmental variability. Agric. Meteorol. 24: Intrieri, C., S. Poni, B. Rebucci, and E. Magnanini Row orientation and whole-canopy gasexchange assayed on potted grapevines. pp GESCO - Groupe d'etude des systemes de conduite de la vigne. loemes journees, Changin, Suisse. Intrigliolo, D.S., and J.R. Castel Continuous measurement of plant and soil water status for irrigation scheduling in plum. Irrig. Sci. 23: Jacobs, C.M.J., B.J. Van den Hurk, and J.M. de Bruin Stomatal behaviour and photosynthetic rate of unstressed grapevines in semi-arid conditions. Agric. Forest Meteorol. 80: Jarvis, P.G., and K.G. McNaughton Stomatal control of transpiration: scaling up from leaf to region. Adv. Ecol. Res. 15:1-49. Jones, H.G Plants and Microclimate; 2nd Ed. Cambridge University Press, London, UK. 448p. Jones, H.G Irrigation scheduling: advantages and pitfalls of plant-based methods. J. Exp. Bot. 55: Jones, H.G, and RA. Sutherland Stomatal control of xylem embolism. Plant Cell Envir. 14: Kays, S.J Stress in harvested products. pp In: Postharvest Physiology in Perishable Plant Products. Kays, S.I. (Ed.), Exon Press, Athens, GA Kennedy, J.A, M.A Matthews, and AL. Waterhouse Effect of maturity and vine water status on grape skin and wine flavonoids. Am. J. Enol. Vitic. 53: Kirkham, M.B Principles of soil and plant water relations. Elsevier Academic Press Burlington, MA 29
52 Kliewer, W.M., B.M. Freeman, and C. Hosssom Effect of irrigation, crop level and potassium fertilization on Carignane vines. I. Degree of water stress and effect on growth and yield. Am. J. Enol. Vitic. 34: Koundouras, S., C. Van Leeuwen, G. Seguin, and Y. Glories Influence de l'alimentation en eau sur la croissance de la vigne, la maturation des raisins et les caracteristiques des vins en zone mediterraneenne (exemple de Nemee, Grece, cepage Saint-Georges, 1997). J. Int. Sciences Vigne et du Vin 33: Kriedemann, P.E Photosynthesis in vine leaves as a function oflight intensity, temperature and leaf age. Vitis 7: Lang, A Xylem, phloem and transpiration flows in developing apple fruits. J. Exp. Bot. 41: Larsen, F.E., S.S. Higgins, and A Alwir Diurnal water relations of apple, apricot, grape, live and peach in an arid environment (Jordan). Sci. Hort. 39: Lascano, R.J., R.L. Baumhardt, and W.N. Lipe Measurement of water flow in young grapevines using the stem heat balance method. Am. J. Enol. Vitic. 43: Lawlor, D.W., and G. Comic Photosynthetic carbon assimilation and associated metabolism in relation to water deficits in higher plants. Plant Cell Envir. 25: Lee, K.H., H.L. Piao, H.Y. Kim, S.M. Choi, F. Jiang, W. Hartung, I. Hwang I., J.M. Kwak, 1.1. Lee and I. Hwang Activation of glucosidase via stress-induced polymerization rapidly increases active pools of abscisic acid. Cell. 126: Leung, J., and J. Giraudat Abscisic acid signal transduction. Ann. Rev. Plant Physiol. and Plant Molec. BioI. 49: Liakopoulos, G., D. Nikolopoulos, A Klouvatou, K.A. Vekkos, Y. Manetas, and G. Karabourniotis The photoprotective role of epidermal anthocyanins and surface pubescence in young leaves of grapevine (Vitis vinifera). Ann. Bot. 98: Livne, A, and Y. Vaadia Water deficits and hormone relations. pp In: Water Deficits and Plant Growth. Vol. III. Kozlowski. T. T. (Ed.) Academic Press, New York, NY. Loveys, B.R Abscisic acid transport and metabolim in grapevine (Vitis vinifera L.). New Phytol. 98: Loveys, B.R What use is a knowledge of ABA physiology for crop improvement? pp In: Environmental Plant Biology. Physiology and Biochemistry of Abscisic Acid. Bios Scientific Publishers, Oxford, UK. Loveys, B.R., P.R. Dry, M. Stoll, and M.G. McCarthy Using plant physiology to improve the water use efficiency of horticultural crops. Acta Hort. 537: Loveys, B.R., and P.E. Kriedemann Rapid changes in abscisic acid-like inhibitors following alterations in vine leaf water potential. Physiol. Plant 28: Loveys, B.R., M. Stoll, P. Dry, and M. McCarthy Partial rootzone drying stimulates stress responses in grapevine to improve water use efficiency while maintaining crop yield and quality. Austral. Grape Grower Winemaker.AI4: Lovisolo, C. and A Schubert Effects of water stress on vessel size and xylem specific hydraulic conductivity in Vitis vinifera L. J. Exp. Bot. 49:
53 Marsal, J., and J. Girona Relationship between leaf water potential and gas exchange activity at different phonological stages and fruit loads in peach trees. J. Amer. Soc. Hortic. Sci. 122: Matthews, M.A, and M.M. Anderson Reproductive development in grape (Vitis vinifera L.): Responses to seasonal water deficits. Am. J. Enol. Vitic. 40: May, P Reducing inflorescence formation by shading individual Sultana buds. Austral. J. BioI. Sci. 18: McCaffrey, A, and S. Tijs, More crop per drop - how are you performing? IREC Farmers Newsletter, Horticulture Edition 186: McCarthy, M.G The effect of transient water deficit on berry development of cv. Shiraz (Vitis vinifera L.). Austral. J. Grape Wine Res. 3: McCarthy, M.G., D. Jones, and G. Due Irrigation principles and Practices. pp In: Viticulture, Vol. 2, Coombe, B.G. and Dry, P.R. (Eds.), Adelaide, Australia. McCarthy, M.G., B. Loveys, P. Dry, and M. Stoll Regulated deficit irrigation and partial rootzone drying as irrigation management techniques for grapevines. pp In: Deficit irrigation practices, FAO Water Reports No. 22 Rome, Italy. Medrano, H., J.M. Escalona, J. Cifre, J. Bota, and J. Flexas A ten-year study on the physiology of two Spanish grapevine cultivars under field conditions: Effects of water availability from leaf photosynthesis to grape yield and quality. Funct. Plant BioI. 30: Merzlyak, M.N., and AA Gitelson Why and what for the leaves are yellow in autumn on the interpretation of optical spectra of senescing leaves (Acer platanoides L.). J. Plant Physiol. 145: Merzlyak, M.N., AA Gitelson, O.B. Chivkunova, and V.Y. Rakitin Non-destructive optical detection ofleaf senescence and fruit ripening. Physiol Plant. 106: Meyer, W.S., F.x. Dunin, R.c.G. Smith, G.S.G. Shell, and N.S White Characterizing water use by irrigated wheat at Griffith, New South Wales. Austral. J. Soil Res. 4: Mittler, R., S. Vanderauwera, M. Gollery, and F. Van Breusegem Reactive oxygen gene network of plants. Trends Plant Sci. 9: Monteith, J.L., and M.H. Unsworth Principles of Environmental Physics. 2nd Ed. Edward Arnold, London, UK. 291p. MorIat, R., M. Penavayre, A Jaquet, C. Asselin, and C. Lemaitre Influences des terroirs sur Ie functionnement hydrique et Ie photosynthiese de la vigne en millesime exceptionnelment sec. (1990). Consequences sur Ie naturation du raisin. J. Int. Sci. Vigne et du Vin 26: Mullins, C.E Matric potential. pp In: Soil and environmental analysis: physical methods, Smith K.A, and Mullins, C. (Eds.) Marcel Dekker, NY, USA Mullins, M.G., A Bouquet, and L.E. Williams Biology of the Grapevine. Cambridge University Press, Cambridge, UK. 239p. Munns, R., and R.W. King Abscisic acid is not the only stomatalinhibitor in the transpiration stream. Plant Physiol. 88: Munns, R., and R.E. Sharp Involvement of abscisic acid in controlling plant growth in soils oflow water potential. Austral. J. Plant Physiol. 20:
54 Nambara, E., and A Marion-Poll Abscisic acid biosynthesis and catabolism. Annu. Rev. Plant BioI. 56: Naor, A, and S. Cohen Response of apple tree stem diameter, midday stem water potential and transpiration rate to a drying and recovery cycle. Hortsci. 38: Neill, S., and KS. Gould Optical properties of leaves in relation to anthocyanin concentration and distribution. Can. J. Bot. 77: Neja, R.A, W.E. Wildman, R.S. Ayers, and AN. Kasimatis Grapevine response to irrigation treatments and trellis levels in the Salinas Valley. Am. J. Enol. Vitic. 28: Niyogi, KK, AR. Grossman, and O. Bjorkman Arabidopsis mutants define a central role for the xanthophyll cycle in the regulation of photosynthetic energy conversion. Plant Cell 10: Ojeda, H., A Deloire, and A Carbonneau Influence of water deficits on grape berry growth. Vitis 40: Palejwala, V.A, H.R. Parikh, and V.V. Modi The role of abscisic acid in the ripening of grapes. Physiol. Plant. 65: Palliotti, A, O. Silvestroni, D. Petoumenou, S. Vignaroli, and J.B. Berrios Evaluation of low-energy demand adaptive mechanisms in Sangiovese grapevine during drought. J. Int. Sci. Vigne Vin 42: 1-7. Pan, Q.H., M.J Li, c.c. Peng, N. Zhang, X. Zou, KQ. Zou, X.L Wang, X.C.Yu, X.F Wang, and D.P Zhang Abscisic acid activates acid invertases in developing grape berry. Physiol. Plant. 125: Passioura, J.B Root signals control leaf expansion in wheat seedlings growing in drying soil. Austral. J. Plant Physiol. 15: Peacock, W.L., L.E. Williams, and L.P. Christensen Water management and irrigation scheduling. Raisin Production Manual Oakland, CA: ANR Pub p. Pefiuelas, J., and I. Filella Visible and near-infrared reflectance techniques for diagnosing plant physiological status. Trends Plant Sci. 3: Peppi, M.C., and M.W. Fidelibus Effects of forchlorfenuron and abscisic acid on the quality of 'Flame Seedless' grapes. HortSci. 43: Peppi, M.C., M.W. Fidelibus, and N. Dokoozlian Abscisic acid application timing and concentration affect firmness, pigmentation, and color of 'Flame Seedless' grapes. HortSci. 41: Petrie, P.R., M.C.T. Trought, and G.S. Howell Influence ofleaf ageing, leaf area and crop load on photosynthesis, stomatal conductance and senescence of grapevine (Vitis vinifera L. cv. 'Pinot noir') leaves. Vitis 39: Plant, R.E., R.D. Horrocks, D.W. Grimes, and L.J. Zelinski CALEXlCotton: an integrated expert system application for irrigation scheduling. Trans. Amer. Soc. Agricult. Engineers 35: Poni, S., C. Intreiri, B. Rebucci, E. Magnanini, and I. Filippetti A custom-built simple system for conditioning and measurement of in situ whole cluster transpiration. Vitis 40:
55 Poni, S., C. Intrieri, and o. Silvestroni Interactions of leaf age, fruiting, and exogenous cytokinins in Sangiovese grapevines under non-irrigated conditions. I. Gas exchange. Am. J. Enol. Vitic. 45: Powles, S.B Photoinhibition of photosynthesis induced by visible light. Ann. Rev. Plant Physiol. 35: Prior, L.D., and AM. Grieve Water use and irrigation requirements of grapevines. pp In: Proceedings Sixth Australian Wine Industry Technical Conference., Lee, T. (Ed.), Australian Industrial Publications, Adelaide, Australia. Raven, J.A Selection pressures on stomatal evolution. New Phytol. 153: Reynolds, AG., and AP. Naylor Pinot noir and Riesling grapevines respond to water stress duration and soil water-holding capacity. HortSci. 29: Reynolds, AG., D.A Wardle, and M. Dever Vine performance, fruit composition, and wine sensory attributes of Gewiirztraminer in response to vineyard location and canopy manipulation. Am. J. Enol. Vitic. 47: Roby, G., and M.A Matthews Relative proportions of seed, skin and flesh, in ripe berries from Vitis vinifera L. cv. Cabernet Sauvignon grapevines grown in a vineyard either well irrigated or under water deficit. Austral. 1. Grape Wine Res. 10: Rogiers, S.Y., D.H. Greer, RJ. Hutton, and J.J. Landsberg Does night-time transpiration contribute to anisohydric behaviour in a Vitis vinifera cultivar? J. Exp. Bot. 60: Roubelakis-Angelakis, K., and W.M. Kliewer The composition of bleeding sap from Thompson Seedless grapevines as affected by nitrogen fertilization. Am. J. Enol. Vitic. 30: Saini, H.S., and M.E. Westgate Reproductive development in grain crops during drought. Adv. Agronomy 68: Sauter, A, W.J. Davies, and W. Hartung The long-distance abscisic acid signal in the droughted plant: the fate of the hormone on its way from the root to shoot. J. Exp. Bot. 52: Sauter, A, K.J. Dietz,and W. Hartung A possible stress physiological role of abscisic acid conjugates in root to shoot signalling. Plant Cell Envir. 25: Schmidt, U., and E. Exarchou Controlling of irrigation systems of greenhouse plants by using measured transpiration sum. Acta Hort. 537: Schoups, G., J.W. Hopmans, C.A Young, J.A Vrugt, W.W. Wallender, K.K. Tanji, and S. Panday Sustainability of irrigated agriculture in the San Joaquin Valley, California. In: Proc. National Acad. Sci., USA 102: Schultz, H.R Water relation and photosynthetic responses of two grapevine cultivars of different geographical origins during water stress. Acta Hort. 427: Schultz, H.R Physiological mechanisms of water use efficiency in grapevine under drought conditions. pp In: Proceed. 5th International Symposium on Grapevine Physiology. Bravdo, B.A (Ed.) ISHS, Jerusalem, Israel. Schultz, H.R Differences in hydraulic architecture account for near-isohydric and anisohydric behaviour of two field-grown Vitis vinifera L. cultivars during drought. Plant Cell Envir.26:
56 Schultz, H.R, and M.A. Matthews Xylem development and hydraulic conductance in sun and shade shoots of grapevine (Vitis vinifera L.): evidence that low light uncouples water transport capacity from leaf area. Planta 190: Segal, E., T. Kushnir, Y. Mualem, and U. Shani Water uptake and hydraulics ofthe root hair rhizosphere. Vadose Zone J. 7: Seguin, G Influence des terroirs viticoles sur la constitution de la qualite des vendanges. Bull. ON 56:3-18. Serrano, R Salt tolerance in plants and microorganisms: toxicity targets and defence responses. Internat. Rev. Cytol. 165:1-52. Sharp, RE., and W.J. Davies Root growth and water uptake by maize plants in drying soil. J. Exp. Bot. 36: Sharp, RE., W.K. Silk, and T.C. Hsiao Growth of the maize primary root at low water potentials. I. Spatial distribution of expansive growth. Plant Physiol. 87: Skewes, M., and T. Meissner Irrigation benchmarks and best management practices for wine grapes, Technical Report, No.259, Primary Industries and Resources SA, Adelaide, South Australia. Slatyer, RO., and S.A. Taylor Terminology in plant-soil-water relationships. Nature 187 : Slovik, S., and W. Hartung Compartmental distribution and redistribution of abscisic acid in intact leaves. III. Analysis ofthe stress signal chain. Planta 187: Smart, RE Aspects of water relations of the grapevine (Vitis vinifera L.). Am. J. Enol. Vitic. 25: Smart, RE., and B.G. Coombe Water relations of grapevines. pp In: Water deficits and plant growth. Vol. 7. Additional Woody Crop Plants. Kozlowski, T.T. (Ed.), Academic Press, San Diego, USA. Smart, R.E, J.K. Dick, I.M. Gravett, and B.M. Fisher Canopy management to improve grape yield and wine quality-principles and practices. S. Afr. J. Enol. Vitic. 11: Smart, R.E., C.R Turkington, and c.j. Evans Grapevine response to furrow and trickle irrigation. Am. 1. Enol. Vitic. 25:62-6. Smart, R.E., J.B. Robinson, G.R. Due, and C.J. Brien Canopy microclimate modification for the cultivar Shiraz. 2. Effects on must and wine composition. Vitis 24: Southey, J.M Root distribution of different grapevine rootstocks on a relatively saline soil. S. Afr. J. Enol. Vitic. 13:1-9. Steele, M.R., A.A. Gitelson, and D.C. Rundquist Nondestructive estimation of leaf chlorophyll content in grapes. Am. J. Enol. Vitic. 59: Steele, M.R., A.A. Gitelson, D.C. Rundquist, and M.N. Merzlyak Nondestructive estimation of anthocyanin content in grapevine leaves. Am. J. Enol. Vitic. 60: Stevens, RM Interactions between irrigation, salinity, leaching efficiency, salinity tolerance and sustainability. Austral. Grapegrower and Winemaker 466: Stoll, M., B. Loveys, and P. Dry Hormonal changes induced by partial rootzone drying of irrigated grapevine. J. Exp. Bot. 51:
57 Tanner, CB., and T.R Sinclair Efficient water use in crop production: research or re-search? pp In: Limitations to Efficient Water Use in Crop Production. H.M. Taylor, C.B. Tanner, T.R. Sinclair (Eds.), ASA Inc., Madison, WI, USA. Tardieu, F., T. Lafarge, and T. Simonneau Stomatal control by fed or endogenous xylem ABA in sunflower: interpretation of correlations between leaf water potential and stomatal conductance in anisohydric species. Plant Cell Envir. 19: Tardieu, F., and T. Simonneau Variability among species of stomatal control under fluctuating soil water status and evaporative demand: modelling isohydric and anisohydric behaviours. J. Exp. Bot. 49: Testi, L., F.J. Villalobos, F. Orgaz, and E. Fereres Water requirements of olive orchards. I. Simulation of daily evapotranspiration for scenario analysis. Irrig. Sci. 24: Townsend, J., M.J. Reeve, and A. Carter Water release characteristics. pp In: Soil and Environmental Analysis: Physical Methods 2nd Edn. Smith, KA. and Mullins, C. (Eds.). Marcel Dekker, New York, NY. Trejo, C.L., A.L. Clephan, and W.J. Davies How do stomata read abscisic acid signals? Plant PhysioL 109: Trejo, C.L., W.J. Davies, and L.D.P. Ruiz Sensitivity of stomata to abscisic acid-an effect of the mesophyll. Plant Physiol. 102: Turner, N.C Further progress in crop water relations. Adv. in Agronomy 58: Van Leeuwen, C, and G. Seguin Incidences de l'alimentation en eau de la vigne, appreci6e par l'etat hydrique du feuillage, sur Ie developpement de l'appareil vegetatif et la maturation du raisin (Vitis vinifera variete Cabernet franc, Saint-Emilion, 1990). J. Int. Sci. Vigne et du Vin 28: Van Rooyen, F.C., H.W. Weber, and I. Levin The response of grapevine to a manipulation of the soil-plant-atmosphere continuum. I. Growth, yield and quality responses. Agrochemophysica. 12: Van Zyl, J.L The grapevine root and its environment. Technical comm. no Department of Agriculture and Water Supply, Pretoria. Vandeleur, RK, G. Mayo, M.C. Shelden, M. Gilliham, B.N. Kaiser, and S.D. Tyerman The role of plasma membrane intrinsic protein aquaporins in water transport through roots: diurnal and drought stress responses reveal different strategies between isohydric and anisohydric cultivars of grapevine. Plant Physiol. 149: Vincent, D., A. Ergtil, M.C. Bohlman, E.A.R Tattersall, RL Tillett, M.D. Wheatley, R.Woolsey, D.R Quilici, J. Joets, K Schlauch,D.A Schooley, J.C Cushman, and G.R Cramer Proteomic analysis reveals differences between Vitis vinifera L. cv. Chardonnay and cv. Cabernet Sauvignon and their responses to water deficit and salinity. J. Exp. Bot. 58: Vivier, M.A., and I.S. Pretorius Genetically tailored grapevines for the wine industry. Trends in Biotech. 20: Wample, RL., and R Smithyman Regulated deficit irrigation as a water management strategy in Vitis vinifera production. pp In: FAO Deficit Irrigation Practices: Water Reports 22. FAO, Rome, Italy. 35
58 Wilkinson, S., J.E. Corlett, L. Oger, and W.J. Davies Effects of xylem ph on transpiration from wild-type and flacca tomato leaves: a vital role for abscisic acid in preventing excessive water loss even from well-watered plants. Plant Physiol. 117: Wilkinson, S., and W.J. Davies ABA-based chemical signalling: the co-ordination of responses to stress in plants. Plant Cell Envir. 25: Williams, L.E Water use of Thompson Seedless grapevines measured with weighing lysimeter during late season dry down period. Acta Hort. 493: Williams, L.E., and P.J. Araujo Correlations among predawn leaf, midday leaf, and midday stem water potential and their correlations with other measures of soil and plant water status in Vitis vinifera. J. Amer. Soc. Hort. Sci. 127: Williams, L.E., and M.A Matthews Grapevine. pp In: Irrigation of agricultural crops. Stewart, B.A and Nielson, D.R (Eds.), Agronomy Monograph 30. ASA-CSSA-SSSA, Madison, WL Williams, L.E., C.J. Phene, D.W. Grimes, and T.J. Trout Water use of mature Thompson Seedless grapevines in California. Irrig. Sci. 22: Williams, L. E., and R J. Smith Partitioning of dry weight, nitrogen and potassium and root distribution of Vitis vinifera L. cv. Cabernet Sauvignon grapevines grafted on three different rootstocks. Am. J. Enol. Vitic. 42: Winkel, T., and S. Rambal Influence of water stress on grapevines growing in the field: from leafto whole-plant response. Austral. 1. Plant Physiol. 20: Winkler, AJ., J.A Cook, W.M. Kliewer, and L.A Lider General Viticulture: University of California Press, 710p. Wright, S.T.C The relationship between leaf water potential (leaf) and the levels of abscisic acid and ethylene in excised wheat leaves. Planta 134: Xia, M.Z Effects of soil drought during the generative development phase of faba been (Viciafaba) on photosynthetic characters and biomass production. J. Agric. Sci. 122: Xiong, L., and J.K. Zhu Regulation of abcisic acid biosynthesis. Plant Physiol. 133: Yancey, P.H., M. E. Clark, S. C. Hand, R D. Bowlus, and G. N. Somero Living with water stress: evolution of osmolyte systems. Science 217: Yang, S.P., D.P. Qian, x.j. Huo, L. Okushima; and S. Sase Computerized precision irrigation system based on estimation of crop water stress with acoustic emission technique. pp In: Water saving agriculture and sustainable use of water and land resources, Kang, S.Z., Davies, W.J., Shan, L., Cai, H.J. (Eds.) Shaanxi Science and Technology Press, Xian, PR China. Yunusa, LAM., R.R. Walker, and D.H. Blackmore. 1997a. Characterisation of water use by Sultana grapevines (Vitis vinifera L.) on their own roots or on Ramsey rootstock drip-irrigated with water of different salinities. Irrig. Sci. 17 : Yunusa, LAM., R.R. Walker, and J.RH. Guy. 1997b. Partitioning of seasonal evapotranspiration from commercial furrow-irrigated Sultana vineyard. Irrig. Sci. 18: Zacarias, L., and M. Reid Role of growth regulators in the senescence of Arabidopsis thaliana leaves. Physiol. Plant. 80:
59 Zhang, J., and W.J. Davies Abscisic acid produced in dehydrating roots may enable the plant to measure the water status of the soil. Plant Cell Envir. 12: Zhang, S.Q., and W.H. Jr. Outlaw Abscisic acid introduced into the transpiration stream accumulates in the guard-cell apoplast and causes stomatal closure. Plant Cell Envir. 24: Zinselmeier, C., M.E. Westgate, J.R. Schussler, and R.J. Jones Low water potential disrupts carbohydrate metabolism in maize (Zea mays L.) ovaries. Plant Physiol. 107:
60 Chapter3a Effect of Water Stress Level and Time Imposed Irrigation on Vine Physiology, Vigor, Yield, Fruit Composition, and Wine Quality on Baco noir Grapevines in a Cool Climate Area. I. Vine Physiology, Vigor, and Yield Abstract. Irrigation experiments were conducted on French-American hybrid Baco noir in a commercial vineyard, located on Niagara-on-the-Lake, Ontario, Canada, between 2005 and The reference evapotranspiration (ETc) was calculated using the Penman Monteith equation and further adjusted with a variable crop coefficient to obtain the crop evapotranspiration (ETc).The effect of three irrigation levels [two regulated deficit irrigation treatments (RDI) at 25% and 50% replacement of water loss through ETc and 100% ETc] combined with three timings of irrigation initiation (fruit set, lag phase, veraison) were studied. The control was non-irrigated. According to soil moisture data, the control and late deficits were under low water status in all seasons, even in 2006 when the total rainfall was the highest in the three years studied. In the soil profile, there were large differences among treatments up to the 50 cm. Transpiration rates were the highest in July and August and dropped by the end of August. Over the growing season, the control had the lowest transpiration rate while the 100% ETc initiated at fruit set the highest one. In 2005 and 2007, shoot growth rate had almost the same trend, 25 % ETc followed very close control. The 100% ETc imposed at fruit set had the highest growth rate. Leaf water potential (lj.i) was higher in 100% ETc and 50% ETc compare to the control throughout the growing season. Leaf lj.i had a downward trend to the end of August in all treatments and experimental years. The control had the lowest leaf lj.i value in The control and 100% ETc initiated at fruit set did not show significant difference in all yield components. The trends were not constant during the period studied for any irrigation treatment applied. RDI treatments showed an increase in some yield components compared to the control. RDI technique could be a profitable management tool in Ontario vineyards, with positive effects on vine physiology and yield. Introduction Grapevine irrigation is still a controversial subject worldwide. More debates arise between grape growers and winemakersabout the opportunity to use irrigation, mostly in regions with cool or moderate climate. The frequency of dry weather in the growing season has increased in the last decade in Niagara Region of Ontario, Canada; at least six of the last 10 vintages have been subject to prolonged drought in southern Ontario and northeastern United States (Lakso and Pool 2001, Reynolds et al. 2007). In recent years, water deficits have also occurred in other cool climate winegrowing regions (Reynolds et al. 2009, Van Leeuwen and Seguin 2006, Zs6fi et al. 2009). The constraints posed by climate change require adaptive management, such as irrigation to stabilize yield and maintainor improve wine quality (Chaves et al. 2007, Dry and Loveys 1998, Medrano et al. 2003). 38
61 The frequency of extreme weather events, such as prolonged heat or torrential rains is also predicted to increase, with negative effect on yield and quality of grapes. These changes will be also accompanied by altered rainfall patterns (an increase in winter rainfall and a decrease in summer rainfall; Houghton et al. 2001). Predictions on global climate change show a progressive shift towards hot and dry weather during the vegetation season in several viticultural areas (Schultz 2000). This underlines the need to know more about how different cultivars react under various water deficit levels, and how water use efficiency in the vineyard can be improved. In order to avoid a damaging imbalance between vine growth and yield, there is a need to optimize the use of natural resources, especially water and light, and to develop appropriate management strategies. Although grapevine (Vitis vinifera L.) is considered a species adapted to drought stress, under severe soil water deficits encountered during the vegetation season, leaf photosynthesis is impaired (Flexas et al. 1998). Signs of current season water stress are not clearly visible on grapevines (Jackson and Lombard 1993). Symptoms are typically observed after repeated episodes of water stress (Evans et al. 1993, Kliewer et al. 1983, Porter 1996, Wample 1997), in contrast with many other species under the same water stress conditions. This has a dominant and limiting role on vine growth, yield and fruit chemical composition (Bravdo and Hepner 1986, Matthews and Anderson 1988, Medrano et al. 2003, Poni et al. 1994, Schultz 1996b, Schultz and Matthews 1988). There is evidence that during the water stress in wine grapes, many physiological (Dry et al. 1996, Matthews and Anderson 1988, Van Leeuwen and Seguin 1994) and biochemical changes (Ban et al. 2003, Kennedy et al. 2002) occur. Grapevine sensitivity to seasonal water deficits and the consequences for vegetative and reproductive growth and wine quality are well known (Buttrose 1974, McCarthy 1997, Williams and Matthews 1990). Soil moisture below the plant availability threshold, high temperature, high radiation regimes and high water vapor pressure deficit (VPD) are factors that unbalanc~ water status in the vine (Evans et al. 1993, Wample 1997). General vine metabolism and physiology can be changed in a positive or negative way depending on the magnitude and time when the water stress occurs (Lakso and Pool 2001). If a water deficit occurs early in the season, the effects will generally be achieved mostly through a reduction of berry cell division (McCarthy et al. 2002), while water deficits imposed at later stages inhibit the berry cells growth (Williams and Matthews 1990). The following season's crop potential is also significantly reduced (Wample and Smithyman 2002). The quality of the fruit can be increased if a mild water stress is imposed to reduce vine vigor, thus reducing the competition of the growing tips for carbohydrates (Tregoat et al. 2002). There is some evidence that reducing irrigation leads to increased concentration of flavor compounds in the berries (Reynolds and Wardle 1997). 39
62 Some researchers pointed out that the effects of soil and environmental conditions on yield and grape composition is cultivar dependant (De Souza et at 2005, Medrano et al. 2003, Schultz 1996). Knowing how different grapevine cultivars perform in different environmental conditions and how they react at different levels of water stress is attracting an increasing interest (Williams 2001). Baco noir, a French-American hybrid (V. vinifera cv. FolIe blanche xv. riparia) is an extremely vigorous growing cultivar best grown on heavier, well-drained soils. Early budbreak and its shallow growing well-branched root system are two traits which Baco noir inherited from its V. riparia parent (Gloor 1983). Due to its disease resistance and high productivity (Byrne and Howell 1978), Baco noir is still a very popular grape wine cultivar in Niagara Region. Baco noir is also rich in several chemical compounds with health benefits. It had the highest resveratrol content (5711lg/100g) of 14 cultivars tested from Finger Lakes area of New York State (Yang et al. 2009). However, despite these positive characteristics, this cultivar suffers from some cold injury, which are be expressed as cane dieback, bud mortality and trunk cankering (Gloor 1983). In hot, dry years, water lost through transpiration by its large canopy generates different levels of water stress in the vine since its shallow root system is not able to replace the water lost at the same rate as that of transpiration. One major way that the wine industry is attempting to improve water use efficiency is through application of deficit irrigation. If it is managed properly, deficit irrigation can have a minimal impact on photosynthesis and subsequently improve grape quality (De Souza et al. 2005). The irrigation strategy known as regulated deficit irrigation (RDI), which has been widely evaluated around the world, is a viable practice in vineyards for controlling excess vigor, reducing pest populations and disease pressure, and improving wine quality (Jackson and Lombard 1993). Although many studies have investigated the effects of RDI, there is little information available to assist growers in determining optimum levels of water deficit at various times during the growing season, specifically in areas considered cool and humid. The rationale underlying this practice is to optimize berry number, fruit size and quality. This might be achieved by keeping grapevine vigor in balance with potential production. The objective of this research was to study the effect of different levels of water deficit and the timing of the imposed irrigation on vine physiology and grape quality in order to achieve consistent quality fruit style year after year. It was hypothesized that by controlling the vine water status at various vegetative stages, one could manipulate vine metabolism, increase yield and minimize the possible negative dilution effects of irrigation on grape quality. 40
63 Materials and Methods Experimental design and plant material. The trials were conducted at Lambert Vineyards, Niagara-on-the-Lake, ON (43 13' N, 79 08'W) between 2005 and 2007, inclusive. The experiment was set up in a Baco noir block (37 rows in total) planted in Vines were spaced 1.5 m (between vines) by 2.7 m (between rows), trained to a four-arm Kniffin system and pruned to 40 nodes per vine. Rows were 200 m long and oriented north to south. Soil type was Chinguacousy clay loam (gleyed brunisolic gray brown luvisol) with imperfect drainage (7 to 9 L/h). The wilting point of the Ap horizon (0 to 27 cm) was 13.3% moisture, and the field capacity was 27.3 % moisture by volume. Bulk density varied between 1.25 g cm- 3 in horizon A and 1.69 g cm- 3 in horizon C (Kingston and Presant 1989). The whole block had a subsurface drainage system, with tiles placed at a 60 cm depth in the middle of every row. Soil management consisted of mowed sod row middles with ~1.0 m herbicided strips under the vines. Vines were drip irrigated using RAM drip tubing. Each drip pipe was placed at 40 cm above the soil. Drippers with a flow rate of 1.5L1h were spaced at 0.6 m apart. A gasoline-powered pump supplied water to the vineyard block from Welland Canal. All water was passed through a sand filter and kept at a constant pressure of 275 kpa during irrigation. A randomized complete block design was used, and divided into three blocks where each treatment replicate corresponding to a row, with the outside rows used as buffers. Ten treatments were assigned randomly to each block, and 10 equally distributed vines were chosen for data collection in each row. Treatments were: control - no irrigation,and either 100%, 50% or 25% replacement of soil water lost through evapotranspiration (100% ETc, 50% ETc, and 25% ETc) combined with one of three irrigation initiation times (fruit set, lag phase, veraison). Water was applied weekly as prescribed through individual valves installed at the end of each row. Irrigation treatments were scheduled on Friday of each week. The volume of irrigation water to be applied was calculated each week according to the previous week's total potential evapotranspiration (ET o ). Daily ET o was calculated using the Penman-Monteith equation (Allen et al. 1998). ET o was adjusted to the crop evapotranspiration (ETc) value using a crop coefficient (Kc). The Kc was calculated based on percentage of the ground surface shaded by the vine canopy at the time when water was applied through irrigation (Williams and Ayars 2005). Precipitation in excess of 12 mmlweek was subtracted from the weeklycalculated ET 0. To calculate the actual amount of water required by the vines in Llvine/day, equations developed by Van der Gulik (1987) were used. The time for delivering the amount of 41
64 water needed for each treatment was calculated by dividing the total amount for each treatment row to the total amount of water supplied by all drippers from one row. The mathematical steps taken to schedule irrigation applications were described in detail by Reynolds (2008). Weather variables used in the Penman-Monteith equation (daily max, min and mean temperature, rain, relative humidity, solar radiation and wind speed) were provided by Weather Innovation Incorporated (WIN) website Cwww.weatherinnovations.com). The meteorological data needed was accessed from the nearest meteorological station (Virgil Station, Niagara-on-the-Lake, ON). Fruit set treatments was initiated on 24 June (2005),23 June (2006) and 22 June (2007). Lag phase treatments were initiated on 15 July (2005),21 July (2006) and 13 July (2007). Veraison treatments began on 29 July (2005), 7 August (2006) and 28 July (2007). Vine water status. Transpiration. Biweekly observations were conducted over the growing season to monitor vine water status. In each season, an U-I600 steady-state porometer (LICOR, Lincoln, NE) was used to measure both the transpiration rate (Ts) and temperature of the grapevine leaves. Photosynthetic photon flux density (PPFD) readings were also collected using the U-190S-1 quantum sensor. The porometer was acclimated to ambient conditions (temperature and humidity) between 15 to 30 minutes before starting to collect data, and the desiccant was replaced before each sampling date. Three leaf samples from three different shoots (close to the trunk and the two extremities) were chosen from three of the ten sentinel vines per each treatment replication. The first sampling date was one day before the ftrst irrigation treatment was imposed. Lea/water potential. Biweekly observations were conducted over the growing season to monitor vine water status. Midday leaf water potential ('I') data was collected from mature leaves, fully exposed to the sun, between 1030h and 1400h. Three sample leaves from three different shoots (close to the trunk and the two extremities) were chosen from three of the ten sentinel vines per each treatment replication. The time from excision to reading was between 15 to 20 seconds. After excision, the lamina was quickly introduced into a pressure chamber [Model 3005 Plant Water Status Console (Soil Moisture, Santa Barbara, CA)], and pressure was increased slowly at a rate no higher than 0.02 MPa per second in order to avoid errors in reading. The pressure readings were taken in negative units (MPa) when ftrst sign of sap emergence occurred. The first sampling date was one day before the ftrst irrigation treatment was imposed. Soil water status. Soil moisture was assessed over a period of 3 years between 2005 and Data was collected from soil adjacent to the 10 sentinel vines per each treatment replicate starting with one week before ftrst irrigation treatment was imposed and biweekly thereafter. Soil moisture data was collected using two different instruments. A Fieldscout-3oo soil moisture probe 42
65 (Spectrum Technologies Inc., East Plainfield, IL) was used to measure the volumetric water content. Measurements were taken in the row at 25 cm from the base of each trunk: and at 20 cm depth. Soil moisture readings were collected from a total of 300 vines between 0800h and 1600h. Starting with 2006 season, soil moisture was also collected by Profile Probe PR2 (Delta-T Devices Ltd., Cambridge, UK). One access tube was inserted in the ground at 25 cm from the trunk in the middle of each treatment replicate row. Soil moisture was collected from six depths (10,20,40,60,80, and 100 em). Data was stored on soil moisture meter HH2TM (Delta-T Devices Ltd, Cambridge, UK) and uploaded onto a computer for statistical analyses. Yield and vigor components. All recorded vines were hand harvested 2 to 4 days before the commercial harvest date (first week of September). Before harvesting, 100 berry samples were collected randomly from clusters of each recorded vine. They were stored at -25 C until analysis. These samples were used to determine the number of berries per cluster, cluster weight, soluble solids (OBrix), ph, titratable acidity, color intensity, hue, total anthocyanins, and total phenols. Yield and number of clusters for each experimental vine were also recorded. During the 2006 and 2007 season, growth shoot rate was recorded. Three readings were collected during the season (June-July) when shoot growth rate was most active. One day before the irrigation treatments were initiated, three shoots of approximately the same length from three recorded vines were flagged. The shoots were random selected in order to avoid any potential hormonal distribution effect on shoot growth rate. Overall, 27 shoots (three shoots x three vines x three replicates) per treatment were measured each growing season. All the shoots were measured before first irrigation treatments were imposed. The sampling dates were scheduled every other week, one day before the irrigation treatments were applied. Each recorded vine was pruned to 40 buds per vine during the dormant season (December to February), and the annual wood was weighed using an electronic fish scale (Rapala, China). Data analysis. All data ('I', Ts, soil moisture, and yield components) were analyzed using SAS statistical software (SAS Institute, Cary, NC), with the general linear models procedure (PROC GLM). Duncan's multiple range test was used for means separation. Dunnett's t test was used to determine if differences existed between the controls and individual treatments. Principal components analysis (PCA) was performed on the means of the field data ('1', Ts, soil moisture) and yield components for each year of the experiment. Partial least squares regression (PLS) was performed on the field and yield data in order to find out relationships among these variables. 43
66 Results and Discussion Weather summary. In the Niagara Region for the last decade, at least six out of 10 years were under water deficits during the growing season (Reynolds et al. 2007). The 2006 season was a wet year with a total rainfall of 220 mm during June to August; 2005 and 2007 were dry years. Analyzing rainfall data for a period of 4 years (2005 to 2008 helped for a better understanding of the necessity of this project (Fig. 3a-lA). The summer of 2007 was a challenging growing season, being the driest year during the experiment period. Rainfall was 56 mm from June to August, which was approximately 25 % of the same period in In 2007, the Niagara region fell much below the 30-year monthly average rainfall accumulation, from May through September. The lack of rainfall coincided with high daily temperatures (Fig. 3a-lB) consistently higher than the 30-year normals for the entire summer. However, July was below the normal temperature due to a short period with cool days. Rainfall followed the same trend in all 3 years, with a maximum in July and a minimum in August when most grape cultivars experience veraison (Fig. 3a-2). High temperatures (Fig. 3a-lB) and high solar radiation (data not shown) along with water shortage generated high ETo (Fig. 3a-3). Yearly variability in growing season conditions such as rainfall distribution (Fig. 3a-2) and wind speed generated a high variation in the ETo (Fig. 3a-3) with maximum values in 2007 and minimum values in The ETofollowed the same trend during summer season even in 2008, when the mean temperature for the summer months was lower than average (Fig. 3a-3). Soil moisture measured by TDR (Figs. 3a-4A-C; 3a-5A-F). The general soil moisture trends for all treatments as measured by TDR, followed the same trend as rainfal1-, with high values in July and lower values in August (Figs. 3a-4; 3a-5). The soil moisture trend in the control treatment reflected the air temperature and rainfall in all 3 years of the experiment, as would be expected, and was consistently lower than other irrigation treatments over the whole vegetation season (Figs. 3a-4; 3a-5). However, there were significant soil moisture differences among treatments. The 25% ETc and the late treatments were very close to the control treatment most of the season in each year of the experimental period (Figs. 3a-4; 3a-5). Except for early irrigation treatments, all mean soil moisture values were lower than the wilting point (13.3 %) throughout the season. In 2005, the soil moisture in the upper portion of the soil profile showed substantial differences among the irrigation treatments (Fig. 3a-4). However, the magnitude of difference among treatments was not as high as in 2006 and The treatments imposed at fruit set were 44
67 consistently higher all the season (Fig. 3a-4A), except the 25% ETc, while the treatments imposed at lag phase showed differences only at two sampling dates (Fig. 3a-4B). The readings recorded for 50% and 100% ETc treatments imposed at veraison had lower values than the control at three sampling dates (Fig. 3a-4C). The data collected showed that soil moisture in the top soil profile (10 cm) was below the wilting point (13.3%) throughout the season, even in the treatments imposed at fruit set. In 2006, the trends were consistent with those in 2005 (Figs. 3a-5; A to C). Except the readings collected on 18 July, which were very high for all treatments due to a heavy rainfall, all others followed the same general trend as the control being between wilting point (13.3%) and field capacity (27.3%) (Figs. 3a-5; A to C). In the upper portion of the soil profile (20 cm), moisture had values greater than wilting point but lower than field water capacity. Soil moisture was higher than the wilting point in all irrigated treatments compared to control, throughout the season (Figs. 3a-5; A to C). In 2007, there was a different trend than 2005 and 2006 (Figs. 3a-5; D to F). At the end of July, soil moisture reached a maximum in all treatments due to a heavy rain. At the beginning of August, soil moisture showed a decreasing trend with a minimum at the end of August. The highest magnitude of differences among the irrigation treatments was recorded in the first two weeks of July and the entire August (Figs. 3a-5; D to F). Soil moisture measured by Proide Probe PR2 (Figs. 3a-6 A-F to 3a-ll A-F). In 2006, the trends were similar among all treatments regarding the sampling depths (Figs. 3a-6 to 3a-8). However, the magnitudes of difference between treatments generally diminished with increasing depths. In 2006, the trends were almost similar for 10 to 30 cm depths (Figs. 3a-6 and 3a-7; A to F). There were generally low fluctuations in soil moisture during the season at the lowest depths. The highest fluctuation in soil moisture during the season was recorded at 30, 40 and 60 cm (Figs. 3a-7 A-F; 3a-8A-C). At the 100 cm depth, the highest values were found at beginning of the season followed by steadily downward trend with a minimum at the end of August (Figs. 3a-8D-F). At 100 cm there was very little fluctuation during the growing season. However, differences were observed at the end of July at the 100 cm depth between non-irrigated and the irrigation treatments imposed at fruit set (Figs. 3a-8D-F). There were different trends in soil moisture in 2007 compared to 2006 at all soil depths (Figs. 3a-9 to 3a-ll; A to F). The early-imposed treatments had values above wilting point (>13.3%) throughout the season. At 10 cm depth, soil moisture from the control was below wilting 45
68 point «13.3 %) throughout the season following the same trend as that recorded with the TDR (Fig. 3a-9A-C). There were large magnitudes of difference among treatments between the middle of July and the end of August. The highest magnitude of difference was found between control and the treatments imposed at fruit set. The magnitude of difference among treatments was lowest at the 100 cm depth, as it was in The highest soil moisture values were found at the end of June at the 100 cm depth (Fig. 3a-11D-F) following the same downward trend to the end of the season as in In each year of the experimental period the rain events decreased the magnitude of difference among the treatments, however even in these conditions irrigated treatments had higher soil moisture than the non-irrigated treatments. These trends are similar to those found by Reynolds et al. (2009). In one irrigation experiment using Colombard grafted on Ramsey it was found that the maximum root densities were 1.2 and 0.6 cm/cm 3, and the estimated total root lengths per vine were 32 and 26 Ian for drip and microjet irrigated vines, respectively (Stevens and Douglas 1994). Under drip irrigation, the grape root distribution was concentrated within the vine row, whereas under microjet sprinkler irrigation, roots were dispersed out between the rows, both patterns reflecting the wetted area. Soil moisture data from the Profile Probe showed that water depletion rate was higher between 20 and 60 cm depth, which might be explained by higher root density at this depth under the various deficit irrigation regimes. This is in agreement with the observation of Poni et al. (1994), who found the main rooting zone and water uptake at a soil depth of 40 to 60 cm. In the present experiment, vines of all treatments had the highest water demand in August, which coincided with berry development. The same findings were also reported in another study carried in Australia (Stevens and Harvey 1996). Furthermore, this data showed a degree of soil moisture variation under drip irrigation even at 100 cm. Stevens and Harvey (1996) reported the same finding but even at a higher depth (120 cm). Soil moisture varied with soil depth at almost every sampling time. The patterns of soil moisture distribution illustrate these results. The moisture in the top soil profile (10 cm) decreased in all treatments compared with the moisture at the other depths at the end of the growing season (Figs. 3a-6 and 3a-9 A to C). Davenport et al. (2008) suggested that for soil moisture monitoring in drip-irrigated wine grapes grown under RDI, a 0- to 45-cm sampling depth collected in a 20 to 40 cm radius either diagonal or perpendicular to the drip emitter reflected best the amount of plantavailable soil water. In order to avoid any error due to any under vine hills or other surface features, it was also suggested that soil moisture monitoring should be conducted on both sides of the row 46
69 around each emitter selected and then averaged in order to reflect accurately water distribution in the soil. Soil moisture data was constant at each recorded vine from the irrigated treatments. Soil moisture did not show significant difference among the ten recorded vines from one individual treatment, when readings were collected at at 30 em away from the experimental vine (data not shown). However, one study showed that water distribution under drip emitters varies both spatially and temporally (Rolston et al. 1991). Under drip irrigation, the wetting pattern has an onion shape, and its vertical and horizontal dimensions are determined by the hydraulic conductivity and water holding capacity of the soil (Bresler 1977). The width of the wetted "bulb" depends mainly on the hydraulic conductivity of the soil, whereas the depth is a function of both saturated hydraulic conductivity and gravity (Brouwer et al. 1996). For this reason, the vertical axis of the water distribution is usually longer than the horizontal axis. The horizontal/vertical length ratio is positively correlated with the hydraulic conductivity of the soil, and the ratio is higher in finer textured soils like the soil from this experiment. This explains why after each irrigation application in 100% ETc treatments, the visual observations of the wetting pattern indicated a wet strip along the row without dry gaps between the two successive emitters. Long irrigation intervals are not normally recommended because they do not maintain a constant volume of irrigated soil but rather flood the majority of the root system by swelling and shrinking the irrigated soil volume (Davenport et al. 2008). This recommendation is relevant for coarse textured soils in arid and semi-arid areas, but not for soils with fine textures (clay or clay loam) that have a high water storage capacity (Kingston and Presant 1989). This underscores the need in the treatments to apply a large-volume of water weekly. Small roots have a relatively high surface area per unit of cross-sectional area or per unit of root mass (Stevens and Douglas 1994). A large mass of small rootlets will, therefore, have a surface area that is a several orders of magnitude greater than an equivalent mass of large-diameter roots. Thus, a high concentration of small rootlets in the confined volume of irrigated soil under the dripper could have a tremendous capacity to supply water to the above-ground canopy. Due to increased root surface area, the vine would become less dependent on water movement in the soil. Moreover, the positive effect of drip irrigation is that it concentrates the roots in a relatively small volume of soil, thereby making them less affected by soil heterogeneity (Stevens and Douglas 1994). Drip irrigation (fertigation) conditions might create a dense root concentration composed of numerous small rootlets and root tips, with an increased root surface area that greatly enlarges the potential for mineral and water absorption. 47
70 Shoot growth and vine size (Figs. 3a-12A-F). In 2006, the shoot growth rate showed a decreasing trend for all treatments downward to the end of July (Figs. 3a-12A-C). The maximum magnitude of difference among treatments was found at beginning of July with values between 27 and 50 cm. Even in a wet year such as 2006, shoot growth rate decreased at the end of July or earlier. Early-imposed treatments had the highest shoot growth rate, the magnitude of difference among treatments being dependant on the water deficit level applied. In 2007, the maximum growth rate was found at the end of July. Treatments imposed at fruit set again showed the highest growth rate (Figs. 3a-12D-F). Treatments imposed at lag phase showed a slightly higher rate than the control and late-imposed treatments. One interesting observation was that vine size was not correlated with shoot growth rate in all treatments. Shoot growth rate had a high degree of correlation with the amount of water applied, but it was not the case for vine size. One explanation could be that both the wood (xylem density) and diameter size of the canes pruned from irrigated treatments were lower compared to the treatments under deficit irrigation, due to carbohydrates and minerals relocation. The results do not agree with previous studies that found reductions in shoot and fruit growth under deficit irrigation (Bravdo et al. 1985, Evans et al. 1993, McCarthy and Coombe 1984, Smart and Coombe 1983, Wample 1997). A moderate water stress reduced vegetative growth without affecting photosynthetic activity that could favour the partitioning of sugar to the fruit and perennial organs during the ripening process (Carbonneau and Deloire 2001). However, deficit irrigations of 20 and 40% ofet o led to no differences in vegetative growth (Centeno et al. 2005). A previous study has showed that visible differences in shoot growth reduction do not normally occur until after full bloom (Wample 1997). The results from the present study agree with these findings, since water deficits usually occur naturally in Niagara Peninsula after fruit set (end of June). Water-stressed plants had lower shoot growth and total cross-sectional xylem area, which affected hydraulic conductivity. In vines under water stress, a decreased diameter of xylem vessels might be linked to limited stem hydraulic conductivity, and consequently could limit transpiration flow (Searson et al. 2004). Vine size was higher in all treatments in 2006 compared to 2005 and 2007 season (Table 3a-2). The only differences relative to the control were found in 2005 in the 50% ETc at fruit set (lowest) and 100% ETc imposed at lag phase treatments (highest), while the 100% and 50% ET JIag phase treatments increased the number of berries per cluster. However, irrigation increased vegetative growth in most cases, results that come in agreement with other studies (Matthews and Anderson 1988, Williams and Matthews 1990). 48
71 Transpiration (Figs. 3a-13A-C to 3a-14A-F). All treatments imposed at fruit set (regardless of ETc level) showed high Ts values throughout the season, more than 100% ETc treatments imposed at lag phase or veraison (Figs. 3a-13A-C). The vines from 100% ETc showed the highest values (Fig. 3a-13A). At the first sampling date, values ranged from 6 to 9 Jlg H20 cm- 2S-1 while the Ts values varied from 4 to 17 Jlg H 2 0 cm -2S-1 in the first week of August (Figs. 3a- 13A-C). The magnitude of difference between full and RDI treatments was consistent throughout the season, with slight variation during August. In 2005, the data indicated that the Ts rate was correlated with both the amount of water applied and the initiation application timing (Fig. 3a-16). The Ts trend for 2006 followed the soil moisture trend very closely (Figs. 3a-5; 3a-14 A-C). The maximum transpiration values had been reached at the beginning of August, almost one week after soil moisture values reached a maximum. Data showed a decreasing trend for all treatments with a minimum at the end of August (Figs. 3a-14A-C). The trend for Ts rates was completely different in 2007 (Figs. 3a-14D-F). Transpiration decreased in all treatments beginning in June and reached a minimum at the end of August, with values between 2.6 Jlg H20 cm -2S-1 in the control treatment and 13 Jlg H20 cm -2S-1 in vines from 100% ETc treatment initiated at fruit set (Figs. 3a-14D-F). In the Central Valley of California, Ts rates for Sauvignon blanc ranged similarly, between 4 and 14 mmol H20 cm -2S-1(Gu et al. 2004). The highest Ts values were found in vines from early-imposed treatments (Fig. 3a-14A). The magnitude of difference among treatments was almost constant throughout the season. High temperature, high vapor pressure deficits and light intensity are characteristics for the end of the summer in Niagara Peninsula (Reynolds 2008). Stomatal closure is the dominant factor that changes water use efficiency during water deficit. Under drought conditions, vines control stomatal opening in order to conserve water resources via hydraulic or hormonal mechanism (Dilling 1990). An interesting observation was made on transpiration data on the last sampling date in all years of the experimental period. The trend of Ts rate was downward even in well-irrigated vines. This trend is explained in the 100% ETc treatment, as follows: the water applied weekly still generates some level of water stress since the larger canopy developed to veraison is not able to recover the whole amount of water transpired. Perhaps, by shortening the period between the irrigation applications towards the end of the season, water stress could be avoided and the Ts rate kept at a maximum. This phenomenon might also be explained by the fact that stomatal movement is not only dependant on soil moisture but also on light intensity and ambient temperature (Dilling 1988, Hofacker et al. 1976). This is in agreement with data showing that stomata appear to open 49
72 and close at a light threshold of about 1000 J.lE m S-1 (DUring and Loveys 1982). Kramer and Boyer (1995) reported that the relationship between leaf'll and stomatal conductance shifts twice per day (morning and afternoon), which indicates that the stomata are responding to other stimuli such as light, ambient CO 2, humidity, temperature or wind. High discrepancies in Ts rates values under different soil water status reported in the literature could be explained not only by different climatic conditions but also by grape cultivar (isohydric vs. non-isohydric), soil water availability to the plant, method used to calculate the amount of water applied, canopy size, and trellising system (Allen et al. 1998, Schultz 2003, Williams and Ayars 2005). Isohydry is generally attributed to the strong stomatal control of transpiration rate, and therefore, midday leaf'll does not differ greatly between dry and wellwatered plants (Tardieu and Simonneau 1998). Anisohydric cultivars typically exhibit less stomatal control over evaporative demand and soil moisture, allowing large fluctuations in leaf'll (Schultz 1996,2003). For example, Escalona et al. (1999) reported for Tempranillo vines under water stress very low Ts rates (15 g h- 1 m- 2 ) in contrast with irrigated ones with values around 250 g h- 1 m- 2 However, a high degree of difference can also appear (280 vs. 230 g h- 1 m- 2 ) when different instruments (LiCor or Dinamax) are used (Escalona et al. 2000). It is also difficult to extrapolate the relationship between single leaf gas exchange and total plant Ts rate (Smart 1974). Escalona et al. (2000) partly agreed with Smart's findings; the authors indicated that single leaf Ts rate changes is not representative for the whole plant transpiration under severe drought conditions but it could give a good estimation under irrigated conditions, which agreed with the present results. Porometry measurements in this study (Figs. 3a-13A-C; 3a-14A-F) clearly reflect the environmental effects, which are in agreement with data found in other studies (Chaves et al. 1987, Delgado et al. 1995). In New York State, Concord grapevines were considered under drought stress when stomatal conductance decreased to -50 mmol m -2S-1 in non-irrigated treatments (Poni et al. 1994), while transpiration rates <2.7 mmol m- 2 s- 1 indicated stress in V. vinifera leaves (Chone et al. 2001). Leaf water potential (Figs. 3a-15A-C; 3a-16A-F). In 2005, the control and late imposed treatments showed the highest absolute values. Data clearly showed a shift after each imposed time. The 100% ETc treatment imposed at fruit set did not show any apparent water stress, since it had values> -1.0 MPa throughout the season (Fig. 3a-15A). Late-imposed treatments showed a decreasing trend across the season, but once imposed, their readings did not drop to < -1.2 MPa (Fig. 3a-15B and C). The data indicated that in a dry season the vines from late imposed irrigation follow the non-irrigated trend being under high water stress until veraison and mild stress 50
73 thereafter. Water stress is generally recognized to occur when the leaf '" decreases to < -1.2 MPa for red cultivars and MPafor white cultivars (Smart and Coombe 1983). In the late imposed irrigation treatments, especially in 100% ETc, some competition for the carbohydrates pool might occur between vegetative and reproductive systems. In 2006, except for the early-imposed treatments, which had very low absolute values, all others had values close to -1.0 MPa, suggesting a low water stress level Since 2006 was a wet year, the trend did not show a high magnitude of difference between treatments (Figs. 3a-16A-C). Trends suggested an increase in water stress level at the end of August, when the amount of rainfall decreased considerably (Fig. 3a-2). The trend for 2007 showed an increase in the absolute values of", for all treatments. Even the early-imposed treatments show a low degree of water stress at the end of August (Figs. 3a-16 D). Treatments imposed at lag phase did not appear to relieve water stress (Fig. 3a-16 E). The highest magnitude of difference was found between early treatments and control The control had the highest absolute values at the end of August (1.5 MPa). Similar findings like those from 2007 were reported by Naor and Bravdo (1993) in one irrigation study conducted in Israel on Sauvignon blanc. The differences in midday leaf '" between well irrigated and non-irrigated vines were minimal, but they reported greater differences in the morning. The data showed a high correlation with soil moisture and other physiological variables (Figs. 3a-17, 3a-18). This is in agreement with one study from California, which showed that all methods to assess plant water status were comparable, as they all correlated well with the amount of applied water (Williams and Araujo 2002). In the present study there was also a different degree of correlation between midday", and soil moisture at different depths (Figs. 3a-19 and 3a-20). Low midday leaf", values between -1.2 to 2.0 MPa were recorded in Israel (Bravdo and Naor 1996), or even lower in some studies conducted in California and Australia. However, the present data did not show values < -1.5 MPa. However, leaf '" could be affected by leaf-to-leaf variations caused by other factors like light exposure or position on the shoot, possibly due to the variation in hydraulic conductivity. A greater number of small vessels would maintain xylem conductance even if the larger vessels were embolized, since vulnerability to cavitation has been shown to be negatively correlated with vessel diameter (Gullo et al. 1995). Some authors reported that leaf photosynthesis in grapevines is very sensitive to changes in leaf '" (Escalona et al. 2003, Kriedemann and Smart 1971, Liu et al. 1978). Zufferey et al. (2000) suggested that maximum photosynthesis could be reduced at a leaf '" of -1.0 MPa, while other studies indicated that leaf '" values between -1.2 and MPa are required to significantly reduce photosynthesis (Kriedemann and Smart 1971). 51
74 Yield components (Table 3a-2). There were large differences in yield per vine between 2005 and 2006 seasons (Table 3a-2). The same yield component had in 2007 values between those of 2005 and No differences were found among the control and irrigation treatments in terms of yield, the number of clusters per vine and vine size in However, in 2005, small differences were found among treatments in terms of cluster weight, number of berries per cluster and berry weight. This small variation in the parameters measured along the treatments could be explained by the particular weather conditions in 2005 (winter damage and hot-dry summer). Berry weights were reduced in 100% ETc initiated at lag phase and 25% ETc initiated at veraison treatments. In 2006, yield was almost four times higher than in 2005 (Table 3a-2). Almost all treatments were substantially different from the control. In 2007, the yield components values showed a better separation between control and the irrigated treatments. Small differences were also observed among the treatments in terms of berry weight. The findings from 2006 and 2007 contradict those of Baeza et al. (2004) and Collins et al. (2008) who reported that yield and yield components were not significantly affected by irrigation treatments. However, other studies showed that water availability had significant effect on yield when the vines received very different amounts of water (Ferreira et al. 2004, Medrano et al.' 2003). Other studies reported just little differences when different water management strategies were applied throughout the season (Reynolds and Naylor 1994, Salon et al. 2004) In 2006, the increase in the number of berries per clusters in some irrigated treatments (Table 3a-2) was explained by the increase in the size of anlagen and the percentage of berry set (Bravdo and Naor 1996). This is in accordance with some studies, which have shown the effect of water deficits on flower induction (Bartolome 1993, Matthews and Anderson 1988). The relative high yield in 2006 might be explained by particular weather conditions from 2005 season. It is likely that different level of water stress applied in 2005, reduced vigor and probably enhanced inflorescence differentiation (Winkler et al. 1974). Fruit bud differentiation was found to increase at moderate water stress during the early growth season (Hepner et al. 1985, Winkler et al. 1974). However, severe water stress was found to reduce flower differentiation (Buttrose 1974) whereas, increased irrigation frequency positively influenced the number of clusters formed in Cabernet franc (Matthews et al. 1987). Yield component data were similar to those of Hamman and Dami (2000). An irrigation rate of 96 Llweek yielded the same as a 192 Llweek and 44% more than 49 Llweek. Berry weight also increased in response to increased irrigation rate (Hamman and Dami 2000). The authors concluded that a moderate irrigation treatment conserved water without reducing yields. Another 52
75 irrigation study conducted on Muscadinia rotundifolia grapevines showed that vines irrigated at a rate of 15 L/day yielded more than non-irrigated vines, but they yielded less than vines from treatments were 22.5 L/day of water was applied (Nesmith 2005). These findings could suggest that a moderate reduction of irrigation do not affect the yields. Relationships among soil and plant water status, yield components and chemical data Principal component analysis (pea) was performed on field data. Midday leaf 'If was correlated with soil moisture, Ts rate, and vine size values (Fig. 3a-17). Only two irrigation treatments (100% and 50% ETc began at set) were positively associated with these parameters, while all others were clustered together on the other side of the plot. The first two factors explain 89.55% of the variability in the data, where F1 accounted for 77.6% of the variation in the data set and F2 just for 11.96%. The distribution of the irrigated treatments shows that the highest variability in field data exists between treatments imposed at fruit set (100 and 50% ETc) which are located on the right side, and RDI treatments imposed at veraison. When pea was performed on field data and yield components, only 65.96% of the variability was explained by the first two dimensions (Fig. 3a-18), respectively 37.96% on F1 and 28% on F2. The field data was positively loaded on F1 while yield and the number of clusters per vine are negatively loaded on F1. Berry weight was negatively loaded on F2 while the number of berries per cluster and cluster weight were positively loaded. The pea biplot on 2005 data (Fig. 3a-18) shows that yield and cluster number were negative correlated with physiological variables such as plant and soil water status. However, the length of eigenvectors indicated that the degree of correlation was not very strong which was explained by particular weather conditions in Variation in yield is also explained more by the cluster number rather than berry weight or the number of berries per cluster. The irrigated treatments imposed at fruit set are grouped on the right side of the plan, being highly associated with the soil moisture, vigor and Ts rate. Except 100% ETc imposed at lag phase, all other treatments were located on the left side of the plan. However, the cluster of RDI treatments was separated from the control treatment The pea plot of field and yield components data indicated that F1 and F2 explained 81.48% ofthetotal variability in the data set (Fig. 3a-19). Soil moisture at depths between 10 and 60 em was positively loaded on F1, along with 'If and Ts rate (Fig. 3a-19). Vigor was highly positively loaded on F2 being negatively correlated with soil moisture at 100 em depth (Fig. 3a- 19). Leaf temperature was highly negatively correlated with soil moisture at 20, 30, 40 and 60 em depth (Fig. 3a-19). The Ts rate was also highly correlated with the leaf temperature. Similar to 53
76 2005, there is a clear separation between treatments imposed at fruit set and the other treatments, the early irrigated treatments being highly associated with soil and plant water status (Figs 3a-18 A- B). The irrigated treatments imposed at veraison showed a high degree of correlation with vigor (Fig. 3a-18 A) The pea plot of soil and plant water status indicated that Fl and F2 accounted for 74.85% and % respectively, of the variability in the data set (Fig. 3a-20). Leaf,!" and soil moisture at 10, 30,40 and 60 cm were highly positively loaded on Fl, and negatively loaded with leaf temperature. The Ts rate was once again also highly correlated with the leaf temperature. By comparison with 2006, the irrigated treatments seem to be grouped based on the level of deficit applied rather than the time of imposition. Treatments irrigated at 100% ETc were grouped on the right side of the plane, 50% RDI in the middle while the control and 25% ETc were grouped close on the left side of the plane. However, in another study no relationship between variables affected by water stress such as shoot growth, leaf senescence, leaf '!', and stomatal resistance was reported (Fanizza et al. 1991). The pea plots of field data from 2006 and 2007 showed a clear separation among the treatments of the two vintages (Fig. 3a-21). Except the 100% ETc treatment imposed at fruit set, all other 2007 treatments were located on the left side of the plane while all 2006 treatments were located on the right side of the plane, being highly associated with soil moisture, yield and leaf '!'. Overall, the pea results showed a high degree of correlation among transpiration, vigor, leaf,!, and soil moisture. However, stomatal conductance (i.e. Ts rate) is better correlated with soil moisture rather than with leaf '!' (Gowing et al. 1990, Naor 1998). According to Tardieu and Davies (1993) model, a decrease in root'!' is accompanied by an increase in intensity of root signal (abscisic acid), which decreases stomatal conductance and thereby, Ts rate. Yield reductions in drought-stressed Thompson Seedless vines were associated with increased stomatal resistance (Grimes and Williams 1990). As water deficit duration increases, vapor filling of xylem vessels (i.e., cavitation) gradually leads to increased hydraulic resistance (Schultz and Matthews 1988). Hence, in the present experiment, despite continually applying small volumes of water to the stressed vines, stomatal resistance gradually increased as the plants grew. Moreover, under water stress, stomata open only in the morning (DUring and Loveys 1982). This behavior has been reported for grapevines under various conditions (Bartolome 1993, Poni et al. 1994), and allows minimizing the negative effects of water stress (Kriedemann and Smart 1971). 54
77 Conclusions In summary, it is possible to optimize production of grapes by controlling irrigation at various phenological stages. Baco noir vines responded not only to the amount of water used but also at the physiological stage when irrigation was applied. However, other studies conducted in arid climates reported that yield and vine physiology responded to volume water used rather than irrigation management method. Multivariate analysis suggested that water was a very important factor in controlling both the vine physiology and yield components. However, high variation in vine physiology and yield components from season to season suggested that besides soil water status, other factors such as solar radiation and wind might be significant because they both impact ET Q. Neither the control nor the 100% ETc treatment imposed at fruit set, improved the general plant physiology and yield components, especially in very dry and hot years. Based upon values of physiological variables, irrigation was definitely needed in the Niagara Peninsula in 2005 and RDI treatments increased most yield components relative to non-irrigated treatments. However, this effect was not observed at all treatments; time of treatment initiation had a significant effect on vine physiology and yield components. Despite many rain events in 2006, the irrigation treatments led to important changes in vine physiology and on yield components. This study revealed, therefore, that even in regions considered cool, vines undergo periods of water stress which could affect fruit composition. Although water stress is believed by some to increase grape quality, it is crucial to know the degree of water deficit that occurs in the vineyard at any physiological stage. These results are supported by other studies (Williams et al. 1994, Zufferey et al. 2000), which showed an increase of respiratory rates and photo inhibition in leaves from vines under some degree of water stress due to high temperature and light intensity. Despite requiring an initial high investment, drip irrigation is a very profitable management tool in the vineyard, and as expected, it influences soil and vine water status. Even in seasons with high precipitation that is distributed erratically, drip irrigation might have beneficial effects on vine physiology, yield components, and fruit composition. Moreover, through drip irrigation, reductions in vine size might lead to substantial decreases in cost of labour and materials associated with vineyard management practices such as irrigation, pesticide application, shoot and leaf removal, hedging, and pruning. Growers should nonetheless realize that irrigation rates could change at other sites with different soil characteristics and weather conditions. Rates of water should be modified according to the stage of development of grapevines and their seasonal water requirements. 55
78 Literature Cited Allen, R.G., L.S. Pereira, D. Raes, and M. Smith Crop evapo-transpiration: guidelines for computing crop water requirements. FAO Drainage Paper 56, Food and Agriculture Organization of the United Nations, Rome. 300p. Baeza, P., J.R. Conde, J.R. Lissarrague, and P. Junquera Agronomic and ecophysiological responses of field-grown 'Vitis vinifera L. cv. Cabernet Sauvignon' grapevines to three irrigation treatments. Acta Hort. 689: Ban, T., M. Ishimaru, S. Kobayashi, S.N. Goto-Yamamoto, and S. Horiuchi Abscisic acid and 2,4-dichlorophenoxyacetie acid affect the expression of anthocyanin biosynthetic pathway genes in 'Kyoho' grape berries. J. Hortie. Sci. Biotech. 78: Bartolome, M.e Respuestas de la vid (Vitis vinifera L.) a condiciones de estres hidrico: efectos sobre las relaciones agua-planta, el crecimiento, la produccion y la calidad, (cv. Tempranillo). Tesis Doctoral de la Universidad Politecnica de Madrid. 287p. Bravdo, B., and Y. Hepner Irrigation management and fertigation to optimize grape composition and vine performance. HortSci. 21: Bravdo, B., Y. Hepner, C. Loinger, S. Cohen, and H. Tabacman Effect of irrigation and crop level on growth, yield and wine quality of Vitis vinifera L. cv. Cabernet Sauvignon. Am. 1 Enol. Vitic. 136: Bravdo, B., and A Naor Effect of water regime on productivity and quality of fruit and wine. Acta Hort. 427: Bresler, E Trickle drip irrigation: Principles and application to soil water management. Adv. Agron. 29: Brouwer, C., K. Prins, M. Kay, and M. Heibloem Irrigation water management:irrigation methods. Training Manual No 5, FAO Land and Water Development Division. Buttrose, M.S Fruitfulness in grapevines: Effects of water stress. Vitis 12: Byrne, M.E., and G.S. Howell Initial response of Baco Noir grapevines to pruning severity, sucker removal, and weed control. Am. J. Enol. Vitic. 29: Carbonneau, A, and A Deloire Plant organization based on source-sink relationships: new finding on developmental, biochemical and molecular responses to environment. pp In: Kalliopi A Roubelakis-Angelakis, Molecular Biology &Biotechnology of the Grapevine. Kluwer Academic Publishers, 474p. Centeno, A, P. Sanchez-de-Miguel, R. Linares, and lr. Lissarrague Changes in must composition during ripening of 'Tempranillo' grapevines as a function of two irrigation treatments. Acta Hort. 689: Chaves, M.M, J.D. Tenhunen, P. Harley, and O.L. Lange Gas exchange studies in two Portuguese grapevine cultivars. Physiol. Plant. 70: Chone, X., e. Van Leewven, D. Dubourdeieu and J.P. Gaudillere Stem water potential as a sensitive indicator for grapevine water status. Ann. Bot. 87: Collins, M.J., E.W.R. Barlow, S. Fuentes, and G. Kelley Water use responses of Shiraz vines under partial root zone drying in a water-limiting environment. Acta Hort. 792:
79 Davenport, J.R, RG. Stevens, and K.M. Whitley Spatial and temporal distribution of soil moisture in drip-irrigated vineyards. HortSci. 43: Delgado, E., J. Vadell, F. Aguilo, J.M. Escalona, and H. Medrano Irrigation and grapevine photosynthesis, pp In: Photosynthesis: from light to biosphere. Mathis, P. (Ed.), Vol. IV, Kluwer Academic Publishers, The Netherlands. De Souza, C.R, J.P. Maroco, T.P. Dos Santos, M.L. Rodrigues, C. Lopes, J. S. Pereira, andm.m. Chaves Control of stomatal aperture and carbon uptake by deficit irrigation in two grapevine cultivars. Agric. Eco. Environ. 106: Dry, P.R, and B.R Loveys Factors influencing grapevine vigour and the potential for control with partial rootzone drying. Austral. J. Grape Wine Res. 4: Dry, P.R, B.R. Loveys, D. Botting, and H. DUring Effects of partial root-zone drying on grapevine vigour, yield, composition of fruit and use of water. pp In: Proceedings of the 9th Australian Wine Industry Technical Conference. Dilling, H CO 2 assmilation and photorespiration of grapevines leaves: responses to light and drought. Vitis 27: Dilling, H Stomatal adaptation of gravines leaves to water stress. pp In: Proc. 5th Intern. Symp. Grape Breeding Sept. 1989, St. MartinlPfalz, FRG. Vitis. Special Issue. Dilling, H., and B.R Loveys Diurnal changes in water relations and abscisic acid in field grown Vitis vinifera cvs. I. Leaf water potential components and leaf conductance under humid temperate and semiarid conditions. Vitis. 21: Escalona, J.M., J. Flexas, J. Bota, and H. Medrano Distribution ofleafphotosynthesis and transpiration within grapevine canopies under different drought conditions. Vitis 42: Escalona, J.M., J. Flexas, and H. Medrano Stomatal and non-stomatal limitations of photosynthesis under water stress in field-grown grapevines. Austral. J. Plant Physiol. 26: Escalona, L., J. Flexas, and H. Medrano Comparison of heat balance and gas exchange methods to measure transpiration in irrigated and water stressed grapevines. Acta Hort. 526: Evans, RG., S.E. Spayd, R.L. Wample, M.W. Kroeger, and M.O. Mahan Water use of Vitis vinifera grapes in Washington. Agr. Water Mgt. 23: Fanizza, G., L. Ricciardi, and C. Bagnulo Leaf greenness measurements to evaluate water stressed genotypes in Vitis vinifera. Euphytica. 55: Ferreira, R.E., E.G. Selles, J.A. Peralta, and J.B. Valenzuela Effects of water stress applied at different development periods of Vitis vinifera L. cv. Cabernet Sauvignon grapevine on production and wine quality. Acta Hort. 646: Flexas, J., J.M. Escalona, and H. Medrano Down regulation of photosynthesis by drought under field conditions in grapevine leaves. Austral. J. Plant. Physiol. 25: Gloor, R L A guide to American and French hybrid grape varieties. Foster Nursery Co., Fredonia, New York. 19p. Gowing, D.J.G., W.J. Davies, and H.G. Jones A positive root-sourced signal as an indicator of soil drying in apple, Malus x domestica Borkh. J. Exp. Bot. 41:
80 Grimes, D.W., and L.E. Williams Irrigation effects on plant water relations and productivity of Thompson seedless grapevines. Crop Sci. 30: Gu, S., G. Du, D. Zoldoske, A. Hakim, R. Cochran, K. Fugelsang, and J. Gorgensen Effects of irrigation amount on water relations, vegetative growth, yield and fruit composition of Vitis vinifera L. cv. Sauvignon blanc grapevines under partial root-zone drying and conventional irrigation in the San Joaquin Valley of California, USA. J. Hort. Sci. Biotechnol. 79: Gullo, L., S. Salleo, E.c. Piaceri, and R. Rosso Relations between vulnerability to xylem embolism and xylem conduit dimensions in young trees of Quercus cems. Plant Cell Envir. 18: Hamman Jr., R.A., and I.E. Dami Effects of irrigation on wine grape growth and fruit quality. HortTech. 10: Hepner, Y., B. Bravdo, C. Loinger, S. Cohen and H. Tabacman Effect of drip irrigation schedules on growth, yield, must composition and wine quality of Vitis vinifera L. cv. Cabernet Sauvignon, Am. J. Enol. Vitic. 36: Hofacker, W., G. Alleweldt, and S. Khader Einfluss der Umweltfaktoren auf Beerenwachstum und Mostqualitat bei der Rebe. Vitis 15: Houghton, J.T., Y. Ding, D.J. Griggs, M. Noguer, P.J. Van der Linden, and D. Xiaosu Climate Change: The Scientific Basis: Contributions of working group I to the Third Assessment Report of the Intergovernmental Panel on Climate Change. Cambridge University Press, Cambridge, UK. 881 p. Jackson, D.L, and P.B. Lombard Environmental and management practices affecting grape composition and wine quality-a review. Am. J. Enol. Vitic. 44:409~30. Kennedy, J.A., M.A. Matthews, and A.L. Waterhouse Effect of maturity and vine water status on grape skin and wine flavonoids. Am. J. Enol. Vitic. 53: Kingston, M.S., and E.W. Presant The Soils ofthe Regional Municipality of Niagara. Rept. No. 60. Ontario Institute of Pedology, Guelph, ON. Kliewer, W.M., B.M. Freeman, and C. Hossom Effect of irrigation, crop level and potassium fertilization on Carignane vines. I. Degree of water stress and effect on growth and yield. Am. J. Plant Physiol. 34: Kramer, P.J., and J.S. Boyer Water relations of plants and soils. Academic Press (San Diego). pp Kriedemann, P.E., and R.E. Smart Effects of irradiance, temperature, and leaf water potential on photosynthesis of vine leaves. Photosynthetica. 5:6-15. Lakso, A.N., and R.M. Pool The effect of water stress on vineyards and wine quality in Eastern climates. Wine East 29: Liu, W.T., W. Wenkert, L.H. Allen and E.R. Lemon Soil-plant water relations in a New York vineyard: resistances to water movement. J. Am. Soc. Hortic. Sci. 103: Matthews, M.A., and M.M. Anderson Fruit ripening in grapes (Vitis vinifera L.): responses to seasonal water deficits. Am. J. Enol. Vitic. 39: Matthews, M.A., M.M. Anderson, and H.R. Schultz Phenologic and growth responses to early and late season water deficits in Cabernet franc. Vitis 26:
81 McCarthy, M.G The effect of transient water deficit on berry development of cv. Shiraz (Vitis vinifera L.). Austral. J. Grape Wine Res. 3: McCarthy, M.G., and B.G. Coombe Water status and wine grape quality. Acta Hort. 171: McCarthy, M.G., B. Loveys, P. Dry, and M. Stoll Regulated deficit irrigation and partial rootzone drying as irrigation management techniques for grapevines. pp In: Deficit irrigation practices, FAO Water Reports No. 22 Rome, Italy, FAO. Medrano, H., J.M. Escalona, J. Cifre, J. Bota, and J. Flexas A ten-year study on the physiology of two Spanish grapevine cultivars under field conditions: Effects of water availability from leaf photosynthesis to grape yield and quality. Funct. Plant BioI. 30: Naor, A Relationships between leaf and stem water potentials and stomatal conductance in three field-grown woody species. J. Hort. Sci. Bioch. 73: Naor, A, and B. Bravdo Effect of post veraison irrigation level on Vitis vinifera L. cv. Sauvignon blanc yield, quality and water relations. S. Afr. J. Enol. Vitic.14: Nesmith, D.S Muscadine grape response to drip irrigation rate. HortSci. 40: Poni, S., AN. Lakso, J.R Turner, and RE. Melious Interactions of crop level and late season water stress on growth and physiology of field-grown Concord grapevines. Am. J. Enol. Vitic. 45: Porter, M Deficit irrigation in theory and practice. Practical Winery and Vineyard July/August. pp Reynolds, AG Irrigation management in the East: How much is enough? Wine East 35:53-49; Reynolds, AG., A Ehtaiwesh, and C. de Savigny Irrigation scheduling for 'Sovereign Coronation' table grapes based on evapotranspiration calculations and crop coefficients. HortTech. 19: Reynolds, AG., W. Lowrey, L. Tomek, J. Hakimi, C. de Savigny Influence of irrigation on vine performance, fruit composition, and wine quality of Vitis vinifera L. cv. Chardonnay in a Ccol, humid climate. Am. J.Enoi. Vitic. 58: Reynolds, AG., and AP. Naylor Pinot noir and Riesling grapevines respond to water stress duration and soil water-holding capacity. HortSci. 29: Reynolds, AG., and D.A Wardle Flavor development in the vineyard. S. Afr. J. Enol. Vitic. 18:3-18. Rolston, D.E., J.W. Biggar, and H.I. Nightingale Temporal persistence of spatial soil-water patterns under trickle irrigation. Irrig. Sci. 12: Salon, J.L., J.V. Mendez, C. Chirivella, and J.R Castell Irrigation and wine quality of Vitis vinifera cv. Bobal in Requena. Spain. Acta Hort. 646: Schultz, H.R Water relation and photosynthetic responses of two grapeville cultivars of different geographical origins during water stress. Acta Hort. 427: Schultz, H.R Climate changes in viticulture: A European perspective onc1imatology, carbon dioxide and UV effects. Austral. J. Grape Wine Res. 6:
82 Schultz, H.R Differences in hydraulic architecture account for near-isohydric and anisohydric behaviour of two field-grown Vitis vinifera L. cultivars during drought. Plant Cell Envir. 26: Schultz, H.R., and M.A. Matthews Vegetative growth distribution during water deficits in Vitis vinifera L. Austral. J. Plant Physiol. 15: Searson, MJ., S. Dane, T. Kelvin, D. Montagu and J.P. Conroy Wood density and anatomy of water-limited eucalypts. Tree Physiology 24, Smart, R.E Aspects of water relations ofthe grapevine (Vitis vinifera L.). Am. J. Enol. Vitie. 25: Smart, R.E., and B.G Coombe Water relations of grapevines. pp In: Additional Woody Crop Plants. Kozlowski, T.T. (Ed.), Academic Press, New York. Stevens, R.M. and T. Douglas Distribution of grapevine roots and salt under drip and fullground cover microjet irrigation systems. Irrig. Sci. 15: Stevens, R.M., and G. Harvey Soil water depletion rates under large grapevines. Austral. J. Grape Wine Res. 2: Tardieu, F., and W.J. Davies Integration of hydraulic and chemical signalling in the control of stomatal conductance and water status of droughted plants. Plant Cell Envir. 16: Tardieu, F., and T. Simonneau Variability among species of stomatal control under fluctuating soil water status and evaporative demand: modelling isohydric and anisohydric behaviours. J. Exp. Bot. 49: Tregoat, C., C.van Leeuwen, X. Chone and J.P. Gaudillere Etude du regime hydrique et de la nutrition azotee de la vigne par des indicateurs physiologiques. Influence sur Ie comportement de la vigne et la maturation du raisin (Vitis vinifera L. cv. Merlot, 2000, Bordeaux), J. Int. Sci. Vigne Vin. 36: Van der Gulik, T.W B.C. Trickle irrigation manual. Ministry of Agriculture and Fisheries, Agricultural Engineering Branch, Abbotsford, B.C p. Van Leeuwen, C., and G. Seguin Incidences de l'alimentation en eau de la vigne, appreciee par l'etat hydrique du feuillage, sur Ie developpement de l'appareil vegetatif et la maturation du raisin (Vitis vinifera variete Cabemet franc, Saint-Emilion, 1990). J. Int. Sci. Vigne Vin 28: Van Leeuwen, c., and G. Seguin The concept ofterroir in viticulture. J. Wine Res. 17:1-10. Wample., R.L When understanding irrigation-many things are to be considered. Vineyard Winery Mgt., Nov.lDec. pp Wample, R.L., and R. Smithyman Regulated deficit irrigation as a water management strategy in Vitis vinifera production. FAO Deficit Irrigation Practices: Water Reports 22. FAO, Rome. pp Williams, L.E Irrigation of winegrapes in California. Practic. Winery Vineyard. 23: 1 : Williams, L.E., and F. Araujo Correlations among predawn leaf, midday leaf, and midday stem water potential and their correlations with other measures of soil and plant water status in Vitis vinifera L. J. Am. Soc. Hortie. Sci. 127:
83 Williams, L.E., and J.E. Ayars Grapevine water use and the crop coefficient are linear functions of the shaded area measured beneath the canopy. Agric. Forest Meteorol. 132: Williams, L.E., and M.A Matthews Grapevine. pp In: Irrigation of Agricultural Crops. Stewart, B.A and Nielson, D.R. (Eds.), Agronomy monograph 30. ASA CSSA-SSSA, Madison, WI. Winkler, AJ., J.A Cook, W.M. Kliewer, and L.A Lider General Viticulture. University of California Press, Berkeley, CA 710p Yang, J., T. E. Martinson and R. H. Liu Phytochemical profiles and antioxidant activities of wine grapes. Food Chern. 116:1: Zs6fi Z, L. Gal, and Z. Szilagyi Use of stomatal conductance and pre-dawn water potential to classify terroir for the grape variety Kekfrankos. Austral. J. Grape Wine Res. 15: Zufferey, V., F. Murisier, and H.R. Schultz A model analysis of the photosynthetic response of Vitis vinifera L. cvs Riesling and Chasselas leaves in the field: I. Interaction of age, light and temperature. Vitis 39:
84 List of Tables Table 3a-1. The weekly amount of irrigation water applied on a Baco noir vineyard using ETo calculated with Penman-Monteith equation, Lambert Vineyards, Niagara-on-the-Lake, ON, between Table 3a-2. Impact of irrigation treatments on yield components and vine size of Baco noir grapevines, Lambert Vineyards, Niagara-on-the-Lake, ON,
85 Table 3a-l The weekly amount of irrigation water applied on a Baco noir block using ETo calculated with Penman-Monteith equation, Lambert Vineyards, Niagara-on-the Lake, ON, between Week I 100% ETc * 50%ETc 25%ETc 100% ETc 50%ETc 25%ETc 100% ETc 50%ETc 25%ETc mmiw LNIW LNIW LNIW mmiw LNIW LNIW LNIW mmiw LNIW LNIW LNIW ,25,50, 100 represent percentage of the water replaced in the soil; ETc- crop evapotranspiration; LNIW -liters/vine/week; mmlw - total amount of water applied in millimeters/week for full water replacement 63
86 Table 3a-2 Impact of irrigation treatments on yield components and vine size of Baco noir, Lambert Vineyards, Niagara-on-the-Lake, ON, Treat. Vine size (kg/vine) Yield (kg/vine) Clusters/vine Cluster wt. (g) Berries/cluster Berry wt.(g) Control be 0.96 a a 4.9 be a 75 be 39.6b 64.0 be 67.4 b 38 e 59 e 67b 1.05 ab 1.09 e 1.01 ab 25 Set be 0.87 ab ab 4.9 be be 69 be 42.4 ab 67.1 be 71.4 b 40 be 59 e 86ab 1.06 ab 1.15b 1.01 ab 50 Set be 1.00 a ab 6.8 a a 83 b 46.6 a 65.4 be 92.5 a 45 abe 58 e 95 a 1.04 abe 1.10ab 1.01 ab 100 Set e 0.79 be ab 4.8 e d 73 be 45.8 ab 70.4 b 65.7b 44 abc 67b 69b 1.06 ab 1.06 e 0.96 be 25 Lag e 0.84 be ab 4.0 e d 63 e 46.7 a 68.1 be 64.7b 49a 62 be 67b 0.99d 1.13 ab 0.98b 50 Lag be 0.70e b 5.4 be 61 los be 80 be 45.3 ab 66.1 be 67.9b 45 ab 58 e 70ab 1.03 bed 1.15 ab 0.94e 100 Lag ge 0.83 be ab 5.3 be 55 96d 78 be 42.2 ab SO.Oa 69.2b 42 be 76a 70 ab 1.02 bed 1.07 e 0.99a b 25 Ver a 0.70e ab 6.7ab b 101 a 43.7 ab 61.4 e 68.9b 41 be 55 e 70 ab 1.07 ab 1.49 a 0.99 ab 50 Ver ab 1.05 a b 5.0 be 61 los be 86ab 44.1 ab 64.0 be 57.7b 41 be 60e 58b 1.0Sa 1.07 e 1.01 ab 100 Ver a O.SS be ab 5.3 be be 78 be 44.1 ab 64.2 be 68.0b 44 abc 56e 66ab 1.00 cd 1.20b 1.03 a Signific. ns *** * ns * * ns *** ** * **** * ** **** * * * * *Control (non-irrigated); 100,50 and 25 means percentage of ETc Set- fruit set, Lag - Lag phase, Ver. - veraison are the irrigation initiation times. *,**,***,****, ns: Significant at p ,0.01,0.001,0.0001, or not significant, respectively. Letters within columns represent means separated at p , Duncan's multiple range test. Boldfaced data indicate those values significantly greater than the control using Dunnett's t-test; boldfaced and underlined data are significantly less than the control 64
87 List of Figures Figure 3a-1. A-Monthly rainfall (mm) June-August, at Virgil Station, Niagara-on-the Lake, ON, Canada. Monthly average = 30 years mean. B- Monthly temperature June - August, , Virgil Weather Station, Niagara-on-the-Lake, ON, Canada ( ) Figure 3a-2. Rainfall distribution (mm/day) during June-August, , at Virgil Weather Station, Niagara-on-the-Lake, ON, Canada ( Figure 3a-3. Daily potential evapotranspiration ETo calculated using the Penman-Monteith equation during , Virgil Weather Station, Niagara-on-the-Lake, ON, Canada ( Figure 3a-4. Impact of irrigation treatments on soil moisture (%) of a Baco noir vineyard measured using TDR, Lambert Vineyards, Niagara-on-the-Lake, ON A, B, C represent irrigation initiation time (fruit set, lag phase and veraison) while 100, 50, 25 represent the percentage of soil water replacement lost through evapotranspiration. Figure 3a-5. Impact of irrigation treatments on soil moisture (%) of a Baco noir vineyard measured using TDR, Lambert Vineyards, Niagara-on-the-Lake, ON. A, B, C (2006) and D, E, and F (2007) represent irrigation initiation time (fruit set, lag phase and veraison) while 100, 50, 25 represent the percentage of soil water replacement lost through evapotranspiration. Figure 3a-6. Impact of irrigation treatments on soil moisture (%) of a Baco noir vineyard measured using a Profile Probe type PR2 at 10 cm depth (A-C) and 20 cm depth (D-F), Lambert Vineyards, Niagara-on-the-Lake, ON, NO, BIE, and CIF represent irrigation initiation time (fruit set, lag phase and veraison) while 100, 50, 25 represent the percentage of soil water replacement lost through evapotranspiration. Figure 3a-7. Impact of irrigation treatments on soil moisture (%) of a Baco noir vineyard measured using a Profile Probe type PR2 at 30 cm depth (A-C) and 40 cm depth (D-F), Lambert Vineyards, Niagara-on-the-Lake, ON, NO, BIE, and CIF represent irrigation initiation time (fruit set, lag phase and veraison) while 100, 50, 25 represent the percentage of soil water replacement lost through evapotranspiration. Figure 3a-8. Impact of irrigation treatments on soil moisture (%) of a Baco noir vineyard measured using a Profile Probe type PR2 at 60 cm depth (A-C) and 100 cm depth (D-F), Lambert Vineyards, Niagara-on-the-Lake, ON, NO, BIE, and CIF represent irrigation initiation time (fruit set, lag phase and veraison) while 100, 50, 25 represent the percentage of soil water replacement lost through evapotranspiration. Figure 3a-9. Impact of irrigation treatments on soil moisture (%) of a Baco noir vineyard measured using a Profile Probe type PR2 at 10 cm depth (A-C) and 20 cm depth (D-F), Lambert Vineyards, Niagara-on-the-Lake, ON, NO, BIE, and CIF represent irrigation initiation time (fruit set, lag phase and veraison) while 100, 50, 25 represent the percentage of soil water replacement lost through evapotranspiration. Figure 3a-1O. Impact of irrigation treatments on soil moisture (%) of a Baco noir vineyard measured using a Profile Probe type PR2 at 30 cm depth (A-C) and 40 cm depth (D-F), Lambert Vineyards, Niagara-on-the-Lake, ON, NO, BIE, and CIF represent irrigation initiation time (fruit set, lag phase and veraison) while 100, 50, 25 represent the percentage of soil water replacement lost through evapotranspiration. 65
88 Figure 3a-11. Impact of irrigation treatments on soil moisture (%) of a Baco noir vineyard measured using a Profile Probe type PR2 at 60 cm depth (A-C) and 100 cm depth (D-F), Lambert Vineyards, Niagara-on-the-Lake, ON, ND, BIE, and CIF represent irrigation initiation time (fruit set, lag phase and veraison) while 100, 50, 25 represent the percentage of soil water replacement lost through evapotranspiration. Figure 3a-12. Impact of irrigation treatments on shoot growth rate (cm) of a Baco noir grapevines, Lambert Vineyards, Niagara-on-the-Lake, ON, 2006 (A-C) and 2007 (D-F). ND, BIE, and CIF represent irrigation initiation time (fruit set, lag phase and veraison) while 100, 50, 25 represent the percentage of soil water replacement lost through evapotranspiration. Figure 3a-13. Impact of irrigation treatments on transpiration of Baco noir grapevines, Lambert Vineyards, Niagara-on-the-Lake, ON, A, B, C represent irrigation initiation time (fruit set, lag phase and veraison) while 100, 50, 25 represent the percentage of soil water replacement lost through evapotranspiration. Figure 3a-14. Impact of irrigation treatments on transpiration of Baco noir grapevines, Lambert Vineyards, Niagara-on-the-Lake, ON, 2006 (A-C) and 2007 (D-F). ND, BIE, and CIF represent irrigation initiation time (fruit set, lag phase and veraison) while 100, 50,25 represent the percentage of soil water replacement lost through evapotranspiration. Figure 3a-15. Impact of irrigation treatments on midday leaf water potential of Baco noir grapevines, Lambert Vineyards, Niagara-on-the-Lake, ON, A, B, C represent irrigation initiation time (fruit set, lag phase and veraison) while 100, 50, 25 represent the percentage of soil water replacement lost through evapotranspiration. Figure 3a-16. Impact of irrigation treatments on midday leaf water potential of Baco noir grapevines, Lambert Vineyards, Niagara-on-the-Lake, ON, 2006 (A-C) and 2007 (D-F). ND, BIE, and CIF represent irrigation initiation time (fruit set, lag phase and veraison) while 100, 50, 25 represent the percentage of soil water replacement lost through evapotranspiration. Figure 3a-17. Principal component analysis biplot (F1and F2) of soil water status and physiological data means (10 vines x three shoots x three leaves x three replicates) from ten irrigation treatments of Baco noir grapevines from Lambert Vineyards, Niagara-on-the-Lake, ON, Set (S), Lag (L) and Veraison (V) represent time of are the time for irrigation imposition and 100 (F), 50 and 25 represent percentage of the water replaced in the soil through irrigation. Figure 3a-18. Principal component analysis biplot (F1and F2) of soil water status and physiological data means (10 vines x three shoots x three leaves x three replicates) from ten irrigation treatments of Baco noir grapevines from Lambert Vineyards, Niagara-on-the-Lake, ON, Set (S), Lag (L) and Veraison (V) represent time of are the time for irrigation imposition and 100 (F), 50 and 25 represent percentage of the water replaced in the soil through irrigation. Figure 3a-19. Principal component analysis biplot (Fland F2) of A: soil water status and yield components means, and B: soil water status and physiological data means (10 vines x three shoots x three leaves x three replicates) from ten irrigation treatments of Baco noir grapevines from Lambert Vineyards, Niagara-on-the-Lake, ON, Set (S), Lag (L) and Veraison (V) represent irrigation initiation time while 100 (F), 50, 25 represent the percentage of soil water replacement lost through evapotranspiration. 66
89 Figure 3a-20. Principal component analysis biplot (Fl&F2) of the soil water status and physiological data means (10 vines x three shoots x three leaves x three replicates) from ten irrigation treatments of Baco noir grapevines from Lambert Vineyards, Niagara-on-the-Lake, ON, Set (S), Lag (L) and Veraison (V) are the time for irrigation imposition and 100 (F), 50 and 25 represent percentage of the water replaced in the soil through irrigation. Figure 3a-21. Principal component analysis biplot (Fl&F2) ofthe soil water status and physiological data means (10 vines x three shoots x three leaves x three replicates) from ten irrigation treatments of Baco noir grapevines from Lambert Vineyards, Niagara-on-the-Lake, ON, Set (S), Lag (L) and Veraison (V) are the time for irrigation imposition and 100 (F), 50 and 25 represent percentage of the water replaced in the soil through irrigation. 67


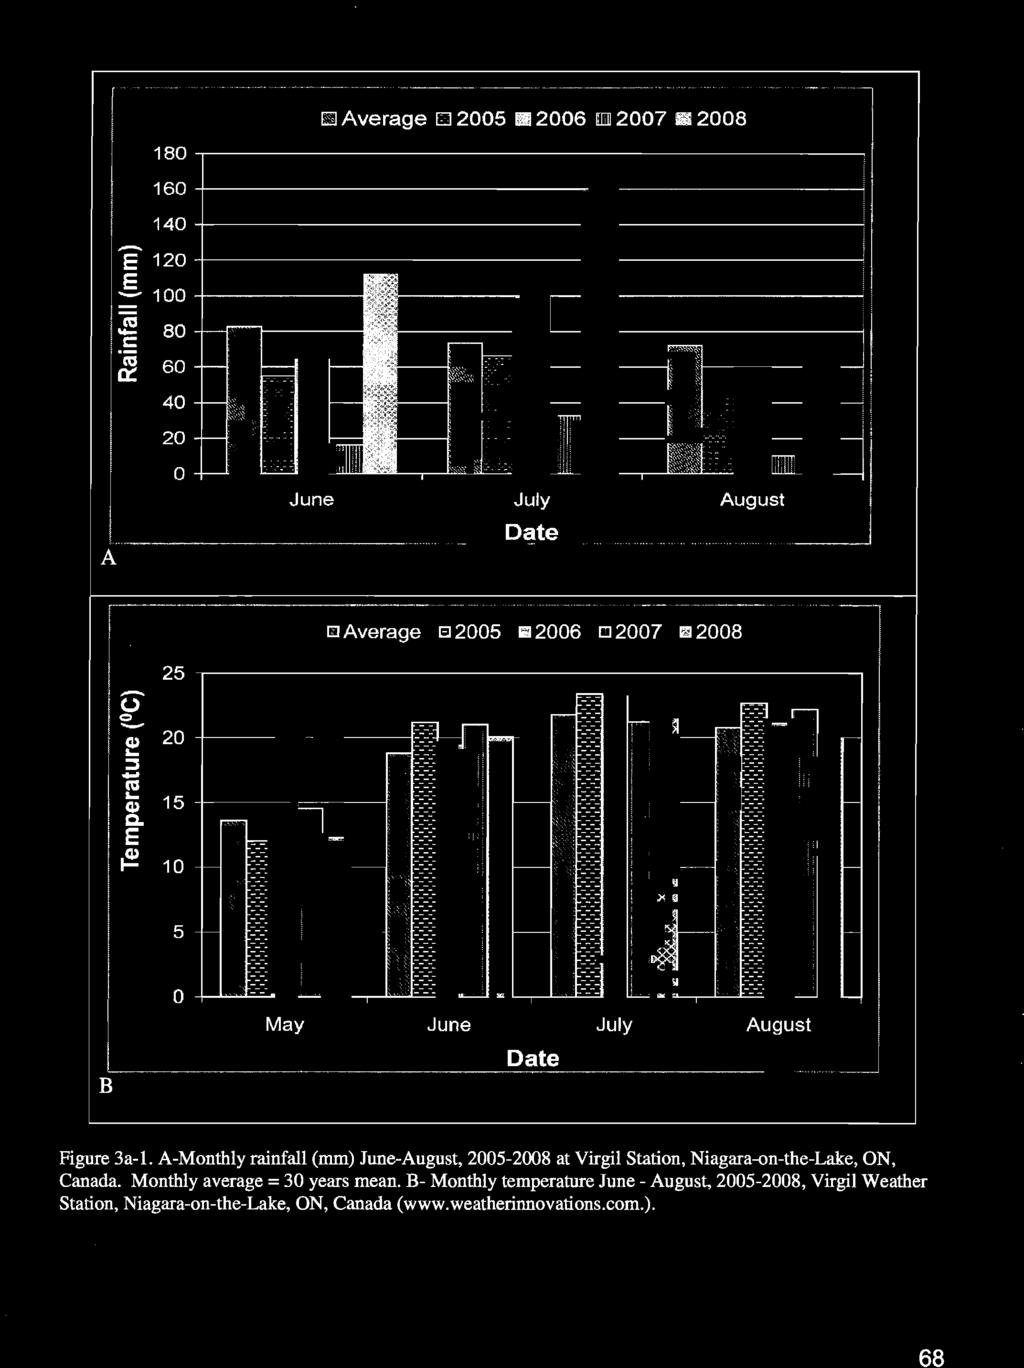
90 E ! 80 c: ll L I Average [] fill June July August A I J Average El2005 1i12006 [] 2007 II1II2008 -o CI - 25 ~ ~ B Figure 3a-1. A-Monthly rainfall (nun) June-August, at Virgil Station, Niagara-on-the-Lake, ON, Canada. Monthly average = 30 years mean. B- Monthly temperature June - August, , Virgil Weather Station, Niagara-on-the-Lake, ON, Canada ( 68
91 30 25 ~ I,, 20 lli d - ~ I!' E 15 I ~. E 1; I) p I ~ I ~ =10 ~~; ~. - z -'~ ~.l l" ~ ~ ~ I' ~ c i ~ I i fi om 5! ~ t, ~, ~ "- I 1 t - ~ ~. 0:: I ~ I II. 1 ~ I' ~ t,: ij I~ I ~ " { I I f:' ~ ~ i I! 1.1 I~ i l I ~II I ~,tl 0 1-Jun 15-Jun 29-Jun 13-Jul 27-Jul 10-Aug 24-Aug,;~ ~ 0 ', 0,II. Ii!! I.. I Date Figure 3a-2. Rainfall distribution (mm/day) during June-August, , at Virgil Weather Station, Niagara-on-the-Lake, ON, Canada ( 69
92 ------_._ I II-I t---l 8.0 I 9"=1' \~ Wlill ';L ffi1i!tlli,',j' ft IQ--liILlI 4 I Jf "....J'dl... U '; I T II UJ 4.0 1I11,.r\.. _ E 6.0 -{;J---- '~~""tl-i--- II;] I. ~ ollie I &J'-O U I 61'1,. 1.1 "'I: _ J~, HI.. I Wra'~I~}',~l\to'lITn~' ~,--trt-~~~~~_~~jjjl E I- UJ I II '" 0.0 I I~I r------~ , ~ 1-Jun 15-Jun 29-Jun 13-Jul 27-Jul 10-Aug 24-Aug Jun 15-Jun 29-Jun 13-Jul 27-Jul 10-Aug 24-Aug Date Date Figure 3a-3. Daily potential evapotranspiration ETo calculated using the Penman-Monteith equation during , Virgil Weather Station, Niagara-on-the-Lake, ON, Canada ( 70
93 15 -, , "Control +100/Set +50/Set -A-251Sel 6... **... A 15 "Control +100lLag +50llag -A-25!Lag,... t12 Q)... :::l (j) '0 E '0 9 en B Control +100Ner -e-50ner -lr-25ner ;e14 ~ 2:! :::l Cii 11 '0 E '5 en 8 r b 5,**** 23-Jun 7-Jul 21-Jul 4-Aug 18-Au Sampling Date (2005) c Figure 3a-4. Impact of irrigation treatments on soil moisture (%) of a Baco noir vineyard measured using TDR, Lambert Vineyards, Niagara-on-the"Lake, ON A, B, C represent irrigation initiation time (fruit set, lag phase and veraison) while 100, 50, 25 represent the percentage of soil water replacement lost through evapotranspiration. *,**,***,****, ns: Significant at p < 0.05,0.01,0.001, , or not significant, respectively. Letters represent means separated at p < 0.05, Duncan's multiple range test. 71
94 "Control +loo/gel -e-50iset *251Set 24 -~ _, ---Conlrol /Sel -e-50/se! iSe! A 33 ~ 30 -; 27,3 24 I/J '0 21 E '5 18 (/) os 6 ns D "Conlrol +;ooll.ag -& It-251Lag 21 B ~ 21 ::J ~ 18 E ~ 15, os ~ 15 :J iii ~ 12 '5 (/) 9 6 os E c Control +100lVer -e-soner -It-25Ner ~27 ~ 24 ~ 21 ~ 18 ~~~V ~ os 2l-Juo 5-Jul IS-Jul 2-Aug l6 Aug Sampling date (2006) c 3O-Aug 24 -~ "Control... looner -e-soner -fr25ner 6 ns 2a Jun 12-Jul 26-Jul 9-Aug Sampling date (2007) 23 Aug F Figure 3a-5, Impact of irrigation treatments on soil moisture (%) of a Baco noir vineyard measured using TDR, Lambert Vineyards, Niagara-on-the-Lake, ON. A, B, C (2006) and D, E, and F (2007) represent irrigation initiation time (fruit set, lag phase and veraison) while 100, 50, 25 represent the percentage of soil water replacement lost through evapotranspiration.*,**,***,****, ns: Significant at p < 0.05, 0.01, 0.001, , or not significant, respectively. Letters represent means separated at p < 0.05, Duncan's multiple range test. 72
95 24 "Control +l00isel -i'l"50isei ~25ISeI ; 24 "Control +l00/set -&-50/Set -.a-251set :5 21 c. Ol "'021 "'0 E (J E 18 C- Ol (J 0... ~ 18 ~ ;"15. ~ ~15. ~ ~ ~ 12 ::J.a Cil12 (/l "5 "(5 E 9 E "5 '(5 9 II) CIJ 5 A 6 OS 6 D 24 ' "Control +100llag -&-SOILag -tr-25/lag 24.. Control +loo1lag -&-50lLag +251Lag :5 21 c..g 21 Ol '0 E (J E 18 (J 018 N 0 I... ;"15 ~ 15 ~!!! ~ 12 ' ~ 12 ~ "(5 '0 ~ :::a: 9 9 '5 "5 II) BII) f1 " ~-.-" :.~ '" ~: :;. 6 E J: a Controt +100Ner -&-50Ner *25Ner 24.. Control +100Ner -&-50Ner -tr-25ner J: :5 21 a. 0. ~ 21 Ql "0 E E 18 " (.l (.l N I :! ~ t15 - ~ ~ 12 ~ ~ 12 "0 '0 :::a: 9 :::a: 9 '0 '0 (f) II) 6 6 n 6 21-Jun 5-Jul 19-Jul 2-Aug l6-aug 21-Jun 5-Jul 19-Jul 2-Aug 16-Aug C Sampling dale (2006) Sampling date (2006) F Figure 3a-6. Impact of irrigation treatments on soil moisture (%) of a Baco noir vineyard measured using a Profile Probe type PR2 at 10 cm depth (A-C) and 20 cm depth (D"F), Lambert Vineyards, Niagaracon-the-Lake, ON, AID, BIE, and, elf represent irrigation initiation time (fruit set, lag phase and veraison) while 100, 50, 25 represent the percentage of soil water replacement lost through evapotranspiration. *, **, ***, ****, ns: Significant at p < 0.05, 0.01, 0.001, , or not significant, respectively. Letters represent means separated at p < 0.05, Duncan's multiple range test. 73
96 A.s::; E.. (I) 18 "0 5 0 C") 15. C f!: :::l iii '0 :i: 9 '0 (J) 21.. Conlrol ISeI Set -.!r251set ns 6 a "Control +100/Set -&-SOISet -.!r251set ~21 (I) u l3 18 o <t A15 t l!! 12 :;I If) '0 :2 9 '0 (J) 6~ns~ ~ D B.s::; 18 c.. (I) "0 E (J "#. ~ 12- ~ :::l Ui '0 E 9 S ns 6 "Centrol +100JLag - -50/Lag -.!r251lag 21 "Control +l00!lag +50/lag -.!r25/lag.s:... Co Q) 0 "C 18 E c.j ~ 15 A e 2: ::J U; '0 :2 9 '0 (f) 6 ns b E C : Q) u C') A ~ 12 ~ :::l Ui '0 E '0 (J) s "Centrol +100Ner - -5ONer -.!r25ner 21-Jun 5-Jul 19-Jul 2-Aug l6-aug Sampling date (2006) ~ ~ 18 E c.j ~ 15 A ::.I! ~ ~ 12 ::J 1ii '0 :2 9 '0 (J) 6 21 "Control Ner +50Ner *25Ner ns 21-Jun 5-Jul 19-Jul 2-Aug 16-Aug Sampling date (2006) F Figure 3a-7. Impact of irrigation treatments on soil moisture (%) of a Baco noir vineyard measured using a Profile Probe typepr2 at 30 cm depth (A-C) and 40 cm depth (D-F), Lambert Vineyards, Niagara-on-the-Lake, ON, AID, BIE, and elf represent irrigation initiation time (fruit set, lag phase and veraison) while 100, 50, 25 represent the percentage of soil water replacement lost through evapotranspiration. *, **, ***, ****, ns: Significant at p < 0.05, 0.01, 0.001, , or not significant, respectively. Letters represent means separated at p < 0.05, Duncan's multiple range test. 74
97 .= Cl Q) '0 1B.. C4lntml... 1Ii!ll$eI -o-ml'bel *25.'Sel 27 <.c. Control JSe!... 50JSel ~251Sei i24 'P '-18 <I) ;, A * 12 ~15...".; P! (!! :J :a ti 12 jq!l " '5 0 ::i :i 9 A ~ ns 6 6 ~ D B " Contml +loo1l.ag -O-501Lag -ir251lag 18.s ab ) 0.. 'P (I) '0 21. Control +loo1lag -lir5q.i1..ag... 2M.ag.t::. i24 Ihi E 15 b' ""'18 <0.l...l.. 12 ~ ~15 2! :J.vi 12 Ul 9 '0 ~ :2 9 '0 (f) 6 ns ~ P! :J 6 E C :5 18 Co OJ "0 +Contml + l00ner -O-5iJNer -ir25ner 27 "Control... l00lver +5OIVer +25Ner.t: g.24 ' "0 E 15 tl < l.. ~12 ~ a 0 ~15- OJ e... b :::J <3 u; 12 b til 0 9 ' '0 '0 s (/) (/) 6 os Jun 5-Jul 19-Jul 2-Aug l6-aug 2l-Jun 5-Jul 19-Jul 2-Aug 16-Aug Sampling dale (200B) Sampling date (2006) 521 F Figure 3a-S. Impact of irrigation treatments on soil moisture (%) of a Baco noir vineyard measured using a Profile Probe type PR2 at 60 cm depth (A-C) and 100 cm depth (D-F), Lambert Vineyards, Niagara-on-the-Lake, ON, AID, BIE, and elf represent irrigation initiation time (fruit set, lag phase and veraison) while 100, 50, 25 represent the percentage of soil water replacement lost through evapotranspiration. *, **, ***, ****, ns: Significant at p < 0.05, 0.01, 0.001, , or not significant, respectively. Letters represent means separated at p < 0.05, Duncan's multiple range test. 75
98 24... Conlrol Set -e-5disel SeI.t: g.18.e21 a. "0 (I) E "0 (.) E 18.. ~ 15 () 0 ;"'15 ~ 12 ~ ti ~ '0 12 ::2 ti '0 '0 9 (/) ::2 '5 (/) ~ 6 - "'Control +100Ner -e-soner... 25Ner A 6 D "Control... 10D/Lag -e-sollag * Z5ILag "Control ILag -e-so/lag Lag 21.c % 18 Q) a. Q) " "018 E E () 15 (.) 0 0 N I ";"15 ~ ~ ~12 ~ 12 ~.;3 ~.!!l 0 '0 9 :::E 9 ' c :::E 'a '5 (5 (/) (/).. ~ s B 6 6 E ~ (I) "Control Ner -e-soner... 25Ner.. Control +100Ner -e-soner... 25Ner 21..r::: C " 18 E () ~ 15 0 ~ '715 ~ ~ ~ ~12 ~ 2112 i!!.~ ~ 0 '0 9 ' ::2 9 :::E '15 '0 (/) (/).==r-~. 6 ~ '.--r. 6 ab.. 28-Jun 12-Jul 26.Jul 9-Aug 23-Aug 28-Jun 12.Jul 26 Jul 9-Aug 23-Au~ C Sampling date (2007) Q) " E Sampling date (2007) F Figure 3a~9. Impact of irrigation treatments on soil moisture (%) of a Baco noir vineyard measured using a Profile Probe type PR2TM at 10 cm depth (A-C) and 20 cm depth (D-F), Lambert Vineyards, Niagara-on-the Lake, ON, AID, BIE, and elf represent irrigation initiation time (fruit set, lag phase and veraison) while 100, 50, 25 represent the percentage of soil water replacement lost through evapotranspiration. *, **, ***, ****, ns: Significant at p < 0.05, 0.01, 0.001, , or not significant, respectively. Letters represent means separated at p < 0.05, Duncan's multiple range test. 76
99 24, ,... Conlrol -<>- 100lSet... SOISet "1!r251Set a 21..c: C. (j) "0 18 E (.l o,. 15 " Control +100lSet -&-50lSet -t.-251set A ~ 12 ::l iii '0 ~ 9 '0 (J) 6 ns 6 ns D :5 18 a. w " o (") A ~ e: ~ ~ '0 (f) 12 -Control Lag... 50/Lag -<>-25/Lag B 6.."s"-- ~ ,.J 1 a r 21.c: C. ~ 18 E (.l ~ 15 I ~ ~!!... 2! 12 ::l iii '0 ~ Conlrol +100llag -&-50ILag "1!r251Lag ~ 6 ~n~s ~.. E c 21.c: 0...g 18 E CJ ~ Conlrol -<>- 1ooNer + 50lVer "1l>-25Ner a a 21 :5 0. ~ 18 E CJ ~ 15 'f"-"-'::s::---.:l I ' ~ e:. 2! 12 ::l iii '0 ~ 9 " Conlrol + l00ner -&-50Ner -Ir25Ner c 6 n s 28-Jun 12-Jul 26-Jul 9-Aug 23-Aug Sampling date (2007) ~ 6 ns 28-Jun 12"')ul 26-Jul 9-Aug Sampling date (2007) 23-Aug F Figure 3a-1O. Impact of irrigation treatments on soil moisture (%) of a Baco noir vineyard measured using a Profile Probe type PR2TM at 30 cm depth (A-C) and 40 cm depth (D-F), Lambert Vineyards, Niagara-on-the Lake, ON, 2007_ AID, BIE, and elf represent irrigation initiation time (fruit set, lag phase and veraison) while 100, 50, 25 represent the percentage of soil water replacement lost through evapotranspiration. *, **, ***, ****, ns: Significant at p < 0.05, 0.01, 0.001, , or not significant, respectively. Letters represent means separated at p < 0.05, Duncan's multiple range test. 77
100 A Control -e-loolset -e-5015el -tr-251sel 21 "Control -e-l00iset -&-50/Set SeI.s::.s:: Q) Q) "C "C 18 E u E 18 (.) 0 (') :a 0,.!... a 1 15 ~,a,-.. e Q)... : b ~ ::J ]i ~ 12 I b :J 0... :E!Ii, c '0 '0 :E 9 (f) '15 (f) ns ns 6 6 D B "Control Lag -e-501lag *251Lag 21 "Conuol... l00llag -&-501Lag lag.r::. 18 li 15. ~ 18 Q) "C E a () U T o I 0 M iab '" 15 - i I,.!... #. ;? ~ 12 e... ~ ~ 12 ::J ::J iii "0 iii ~ 9 '15 ::?: 9 '6 (f) '0 (f) E ns E C Conlrol... 1ooNe, -e-soner + 25Ner 21 "" ---Conlrol +100Ner -e-soner... 25Ner..c: :E a 0..:g 16 -.:g 18 a E E tj a tj 7 15 ~. 15 :.'i!. e... ~ ~ -- ~ 12 ~ 12"" ::J ::J j! iii 0 '5 :2 9 - ~ 9 '5 CIJ '5 ns CIJ ns 6 6 2~Jun 12..Jul 26..Jul 9 Aug 23-Aug 28-Jun 12 Jul 26-Jul 9-Aug 23 Aug Sampling dale (2007) Sampling date (2007) a = F Figure 3a-ll. Impact of irrigation treatments on soil moisture (%) of a Baco noir vineyard measured using a Profile Probe type PR2 at 60 cm depth (A-C) and 100 em depth (D-F), Lambert Vineyards, Niagara-on-the Lake, ON, AID, BIE, and elf represent irrigation initiation time (fruit set, lag phase and veraison) while 100, 50, 25 represent the percentage of soil water replacement lost through evapotranspiration. *, **, ***, ****, ns: Significant at p < 0.05, 0.01, 0.001, , or not significant, respectively. Letters represent means separated at p < 0.05, Duncan's multiple range test 78
101 A ~ 55..J <l +loolsel -o-5oisel -6-25!Set 85 ~ 75 E El 45 ~65 ~ ;d.s::::.2l 55 ~ ~ 35 CD j 45 g 25 E 35.s:::: Cf) 15 5 CD g 25 ~d.s:::: Cf) lr251sei E 55 4-Control +1001Leg -o-50/lag -6-25/Lag 85 ~ 75 E ~45 ~65..J..J <I <l.s El 55 i!! 35 ~.I:;.s:::: 45 ~ j 0,25 E I:; g 25 (j) 15 B 5 CD.s:::: Cf) Control -o-1ooilag -e-50ilag -lr251lag Control +100Ner -o-50ner -I!c25Ner ~ ~ 75 E ~ E..J 45.s 65..J <l.2l ~ 55 ~ 35 ro.s:::: j ~ 45 0 t» b==-==-:- ~ 25 ~ J d c. OJ 0 '025.s:::: Cf) 15 0 c! c7j ConlTol -<>-100Nar -e-50nllr -lr25ner c C Jul 21-Jul 10-Jul 24-Jul 07-Aug Sampling date (2006) Sampling date (2007) F Figure 3a-12. Impact of irrigation treatments on shoot growth rate (cm) of Baco noir grapevines, Lambert Vineyards, Niagara-on-the-Lake, ON, 2006 (A-C) and 2007 (D-F). AID, BIE, and elf represent irrigation initiation time (fruit set, lag phase and veraison) while 100, 50, 25 represent the percentage of soil water replacement lost through evapotranspiration. *, **, ***, ****, ns: Significant at p < 0.05, 0.01, 0.001, , or not significant, respectively. Letters represent means separated at p < 0.05, Duncan's multiple range test. 79
102 22 en 20 N- E o Control ~100/Set -o-50/set -6-25/Set ~ 12 c: 10 o ~ 8!... '0.. 6 en c: ~ 4 ~ _ 2 ~~ , , ra g2. 18 ~ 16 - q.14 J: 0) ::l.. c: 10 o :;= 8 ~ ' g Control ~1001Lag -o-50/lag Lag c d en c: 4 ~ 2 ~ns~ ~ ~ ~ ~ -r B ---Control +100Ner -o-50ner +-25Ner q.14 J: -- 0) 12 ::l.. c: 10 - o :;= 8 -.~ ~~-...:::::ff.======~~::::::::: n 6 e ----~-- fj) c: ~ 4 e ~ 2... ~~------~**-* ~**~** ~~ *~*-* *-*~. 23-Jun 7-Jul 21-Jul 4-Aug 18-Aug 1-Sep Figure 3a-13. Impact of irrigation treatments on transpiration of Baco noir grapevines, Lambert Vineyards, Niagara-on-the-Lake, ON, A, B, C represent irrigation initiation time (fruit set, lag phase and veraison) while 100, 50, 25 represent the percentage of soil water replacement lost through evapotranspiration. *,**,***,****, ns: Significant at p ~ 0.05,0.01,0.001,0.0001, or not significant, respectively. Letters represent means separated at p ~ 0.05, Duncan's multiple range test ab 80
103 A (i) 26r , 24 "Control +l00lset Set -c-25jset E u 20 q, 18 :r: 0) 16 :J. -;; 14,g 12 e! 'a 10 U) c 8 ~ 6 4 ' ns 2 ~----~----~----_r----~------~ ~12 ~ 10 N ::t: 0) 2: c.12 ~ 6 c. rj) c 4 ~ 14 r , -a-control +100lSel -<>-50/SeI *251Sel a ---""-----<l! C D B 'r ,.---., @ 20 q, 18 :r: ~ 16 26r ;; 14 lr':~~~:.:::::::_1 o ~ 12 'a 10 U) c: 8 ~ 6 "Control +1001Lag -9-50/Lag -c-251lag 4 ns 2 ~ ~ (i) E (.) 0 10 ::t: '" OJ 2: 8 ~ 6 '~ c 4 ~ -a-conlrol +1001Lag -<>-501Lag *25!Lag --;~-_-=~c , r------, ,.-...je a b c 26~ "Control +l00ner -9-S0Ner -c-25ner 24,... W'22 E 20 a ~ 14 -;; 12 ~ 10.!:: 8 c. ~ 6 ~ 4 r ns ~----~----~----~----~ 21-Jun 5-Jul 19-Jul 2 Aug 16-Aug 3D-Aug Sampling date (2006) 14, , -fl-control +100Ner -<>-50Ner -tr2sner W'12,... E ~10 o N I 0) 8 2- c g 6.. ro c. ~ 4 ~ f ,------, , ,~ 28 Jun 12 Jul 26-Jul D9-Aug 23-Aug Sampling date (2007) F Figure 3a-14. Impact of irrigation treatments on transpiration of Baco noir grapevines, Lambert Vineyards, Niagara-on-the-Lake, ON, 2006 (A-C) and 2007 (D-F). AID, B/E, and elf represent irrigation initiation time (fruit set, lag phase and veraison) while 100, 50, 25 represent the percentage of soil water replacement lost through evapotranspiration. *, **, ***, ****, ns: Significant at p ~ 0.05, 0.01, 0.001, , or not significant, respectively. Letters represent means separated at p ~ 0.05, Duncan's multiple range test. 81
104 A _-0.1 n1 c.. :2-0.4 ~ co :g ~0.7 Q) m n1 3: Q)...J ns ---Control +100/Sel -o-50/set -tr-25/sel a ':'c ***'" ct B n1 c.. :2 --.:: ct1 :g -0.7 ~ 0. $ -1 ct1 ~ 'tii I&- II ns ---Control +100/Lag -o-50/lag -tr-25/lag ~b --.::::::: " ~.r. b be T e......*** * _-0.1 ct1 a.. :2 --.:: ro.~ '- -1 Q) -ct1 ~ '(ij -1 3 a>....j ---Control +1001Ver -o-50iver -I:r251Ver,c C Jun 07-Jul 21-Jul 04-Aug Figure 3a-15. Impact of irrigation treatments on midday leaf water potential of Baco noir grapevines, Lambert Vineyards, Niagara-on-the-Lake, ON, 2005, A, B, C represent irrigation initiation time (fruit set, lag phase and veraison) while 100, 50, 25 represent the percentage of soil water replacement lost through evapotranspiration. *,**,***,****, ns: Significant at p ~ 0.05,0.01,0.001,0.0001, or not significant, respectively. Letters represent means separated at p ~ 0.05, Duncan's multiple range test. 82
105 A (Q ~! c !II -1.3 :=...!II ttl..j -1 A "Control +1OOISel Sel +25/Set ~..Q.1 t1l 0.. :: ~-D.4 ] ~..Q.7 "0 C.....l!l -1 ~ 1U ~ ns "Cootrol +1oolSet -e-501set +251Set B (Q 0.. :: 0.7' ~ :f ] C cti -1.3 :=... cti (l)..j Conlrol +1oo/Lag -e-50llag +251Lag ~..Q.l "Control +-100/Lag -e-501lag +25/Lag!II 0.. :: 0 '::.04-3-' ro ~-O.7 " ~... * -1 ~-1.3..J -1.6 os C (Q "Control +-100Ner -e-50ner ~ :f ] C -1.l!l 0 c. '- (l) m -1.3 ~... t1l (l)..j Jun OS-Jul 19-Jul 02-Aug Sampling date (2006) -tr25ner 16-Aug.. Control +100Ner -&'50Ner -tr25ner -1.6 JmSL ---! ---=~...,,'...!!!c.j 28-Jun 23-Aug F Figure 3a-16. hnpact of irrigation treatments on midday leaf water potential of Baco noir grapevines, Lambert Vineyards, Niagara-on-the-Lake, ON, 2006 (A-C) and 2007 (D-F). AID, BIE, and elf represent irrigation initiation time (fruit set, lag phase and veraison) while 100, 50, 25 represent the percentage of soil water replacement lost through evapotranspiration.*,**,***,****, ns: Significant at p S 0.05,0.01,0.001,0.0001, or not significant, respectively. Letters represent means separated at p S 0.05, Duncan's multiple range test. 83
106 1 Variables (axes F1 and F2: %) ~ ID O! 0 -N u o F1 (77.60 %) Observations (axes Fl and F2: %) _ _.- ~ 1 c ID O'! VSO-... VF- V2S- 0 N ow LL. L2S LSO LF o Fl (77.60%) Figure 3a-17. Principal component analysis biplot (PI and F2) of soil water status and physiological data means (10 vines x three shoots x three leaves x three replicates) from ten irrigation treatments of Baco noir grapevines from Lambert Vineyards, Niagara-on-the-Lake, ON, Set (S), Lag (L) and Veraison (V) represent the time for irrigation imposition and 100 (F), 50 and 25 represent percentage of the water replaced inthesoil through irrigation. Abbreviations: SM-soil moisture; LWP-Ieaf water potential; Ts-transpiration; V-vine size. 84
107 8 Biplot (axes Fl and F2: %) 6 - '*' 2 c co N -N LL LF f1 B/C /~ c.w. L50 A LWP V25 ~~"" 525 Vie --T5 L25~~,,,,,,,"'"H''' H VFAS~~A ~~, ::: ~M 'J B.w. CA A 550.5F o F1 (37.96 %) Figure 3a-18. Principal component analysis biplot (Fland F2) of field data and yield components means (10 vines x three shoots x three leaves x three replicates) from ten irrigation treatments of Baco nair grapevines from Lambert Vineyards, Niagara-on-the-Lake, ON, Set (S), Lag (L) and Veraison (V) representthe time for irrigation imposition and 100 (F), 50 and 25 represent percentage of the water replaced in the soil through irrigation. Abbreviations: SM-soil moisture; L WP-Ieaf water potential; Ts-transpiration; V -vine size; CN -number of clusters per vine; C.W.-cluster weight, B/C-number of berries per cluster; B.W.-berry weight. 85
 of A: soil water status and yield components means, and B: soil water status and physiological data means (10 vines x three shoots x three leaves x")
108 Biplot (axes Fl and F2: %) 5.. VF V - '#. In r"'!...t ~O N u.. V2S" VSO.. LSO L2S.. C.. Tleaf "5i\ SMlOO '\ \ " '\ SM30 T.. F Fl (60.24 %) Figure 3a-19. Principal component analysis biplot (Fland F2) of A: soil water status and yield components means, and B: soil water status and physiological data means (10 vines x three shoots x three leaves x three replicates) from ten irrigation treatments of Baco noir grapevines from Lambert Vineyards, Niagara-on-the-Lake, ON, Set (S), Lag (L) and Veraison (V) represent irrigation initiation time while 100 (F), 50, 25 represent the percentage of soil water replacement lost through evapotranspiration. ). Abbreviations used: SM-soil moisture (depths 10 to 100 cm); TDR- soil moisture at 20 cmdepth measured by TDR, BlC-berries no. per cluster; CNcluster per vine; BW-berry weight; CW-cluster weight; SM-soil moisture; T1eaf"" leaf temperature; Ts-transpiration,,!,-leaf water potential. 86
109 Variables (axes Fl and F2: %) ~ 00 li'i c:i.-i... N u o Fl (74.85 %) 4 Observations (axes Fl and F2: %) -'$ II'! 0 0.-i... N u.. V25 A CA A LF L50 LLj'& - '>1 VSO.6. ~2.6. VF o Fl (74.85 %) Figure 3a-20. Principal component analysis biplot (Fl&F2) ofthe soil water status and physiological data means (10 vines x three shoots x three leaves x three replicates) from ten irrigation treatments of Baco noir grapevines from Lambert Vineyards, Niagara-on-the-Lake, ON, Set (S), Lag (L) and Veraison (V) represent the time for irrigation imposition and 100 (F), 50 and 25 represent percentage of the water replaced in the soil through irrigation. ). Abbreviations used: B/C-berries no. per cluster; CN -cluster per vine; BW -berry weight; CW -cluster weight; SM-soil moisture (depths 10 to 100 cm); TIcal leaf temperature; Ts-transpiration,,!,-leaf water potential. 87
 A V25 A VF 2 V50 ~ 00 co o:i... -N u.. 0-2 A( V2S-2007 A (-2007 A VS0-:2007 A t.")
110 1 Variables (axes F1 and F2: %) "#. co co o:i... -N u o Fl (66.60 %) 4 Observations (axes Fl and F2: %) A V25 A VF 2 V50 ~ 00 co o:i... -N u A( V2S-2007 A (-2007 A VS0-:2007 A t.;,5 A,L50 S50 S A L A A A A LF LSO-2007 VF-2007 A S25 S A LF~2007 A SF-2007 A SF o Fl (66.60 %) Figure 3a-21. Principal component analysis biplot (FI&F2) of the soil water status and physiological data means (10 vines x three shoots x three leaves x three replicates) from ten irrigation treatments of Baco noir grapevines from Lambert Vineyards, Niagara-on-the-Lake, ON, Set (S), Lag (L) and Veraison (V) are the time for irrigation imposition and 100 (F), 50 and 25 represent percentage of the water replaced in the soil through irrigation. Abbreviations: SM-soil moisture (depths 10 to 100 cm); T leaf -leaf temperature; LWP-Ieafwater potential; Ts-transpiration; V-vine size; Y -yield. 88
111 Chapter3b Effect of Water Stress Level and Time Imposed Irrigation on Fruit Composition, and Wine Quality on Baco noir in a Cool Climate Area II. Fruit Composition, and Wine Quality Abstract. Irrigation experiments were conducted on the French-American hybrid Baco noir in a commercial vineyard located on Niagara-on-the-Lake, Ontario, Canada, between 2005 and The reference evapotranspiration (ETo) was calculated using the Penman Monteith equation and further adjusted with a variable crop coefficient to obtain the crop evapotranspiration (ETc).The effect of three irrigation levels [two regulated deficit irrigation treatments (RDI) at 25% and 50% replacement of water loss through.etc) and 100% ETc] combined with three timings of irrigation initiation (fruit set, lag phase, veraison) were studied. The control was non-irrigated. Berry composition varied from vintage to vintage. The highest soluble solids concentrations were found in 2005 and In 2005, RDI treatments applied at lag phase increased Brix, while in 2007 similar results were obtained in treatments applied at veraison. Total acidity (TA) values were almost similar in 2005 and 2007 and higher in The TA increased slightly in irrigated treatments when compared to control in each year of the experimental period. ph had the lowest values in 2005 and highest in 2006 and Berries from RDI treatments applied at lag phase showed higher ph values or close to those from the control while berries from RDI treatments applied at veraison showed lower values. Anthocyanins and total phenols in berries increased in almost all irrigated treatments in 2005, while in 2006 and 2007 the highest concentration was found in berries from treatments imposed at lag phase. Multivariate analyses showed that soil and plant water status were very well correlated with the typical descriptors for Baco noir wines. According to the sensory data the highest intensity of flavor and aroma attributes were associated with 50% and 25% ETc levels applied at lag phase or veraison. PCA analysis indicated that severe water deficit could negatively affect the varietal aroma profile. The sensory profiles showed that wines could be manipulated by regulated deficit irrigation strategy. However, vintage variation indicated that some other factors related to the grape microclimate could be involved as well. Introduction In the previous Chapter (3a), an extended introduction was provided in order to understand the need for this study. Water deficit during the vegetative period affects not only the physiology of the vine but also the yield and fruit quality, which finally are reflected in the wine sensory profile (Chapman et al. 2005). The fruit and wine quality are the most important aspects when using irrigation in the vineyard is discussed (Chaves et al. 2007, Dry and Loveys 1998, Medrano et al. 2003). However, grape quality is a complex concept, and most of the time is defined by the winemaker and measured in different ways; Quality in grapes is referred most often to the concentration of sugar and acidity (Morris and Cawthon 1982, Ough 1980), color (Tesic et al. 2002) or polyphenols concentration (Fu1crand et al. 2006). Keeping a balance between quantity and quality of the grapes generates a debate between growers and winemakers regarding the 89
112 irrigation necessity and its impact on wine quality. Although, many studies investigated the effect on wine sensory profile of different cultural practices, such as cluster thinning (Bravdo et al. 1984, Reynolds et al. 1996) and pruning (Freeman et al. 1980, Zamboni et al. 1996), there are just a few studies which investigated the irrigation effect on wine sensory characteristics (Chapman et al. 2005, Matthews et al. 1990, Reynolds et al. 2007). Some authors found that water deficit during the growing season had a beneficial effect on grape and quality (Bravdo et al. 2004, Williams and Matthews 1990). Significant differences in the sensory profile were found among wines made from grapes grown under different irrigation treatments (Matthews et al. 1990). Wines made from vines grown under minimal irrigation had the intensity of aroma and flavor descriptors significantly higher than that one found in wines made from vines grown under standard irrigation (Chapman et al. 2005). However, no studies have examined the effect of water stress level and time of imposed irrigation on fruit composition and sensory profile in a cool region. Also, no irrigation studies have been performed on French American hybrids. The objective of the present research was to study the effect of different levels of water deficit and time imposed irrigation on grape quality and wine sensory profile, in a cool area in order to achieve consistent quality fruit style. It was hypothesized that by controlling the vine water status at various phenological stages one could alter fruit and wine quality. Materials and Methods Experimental design and plant material. The trials were conducted at Lambert Vineyards, Niagara-on-the-Lake, ON (43 13' N, 79 08'W). The experiment was set up in 2005 on a Baco noir block (2 ha) planted in Vines were spaced at 1.5 m (between vines) by 2.7 m (between rows), trained to a four-cane Kniffin system and pruned to 40 nodes per vine. Rows were 200 m long, and oriented north to south. A randomized complete block design was used and divided into three blocks where each treatment replicate corresponded to a row, with the outside rows used as buffers. Treatments were as follows: control- no irrigation, and either 100 %, 50 % or 25 % replacement of soil water lost through evapotranspiration (ETc) combined with one of three times of initiation of irrigation (fruit set, lag phase, veraison). This sub-section was described in detail in Chapter 3a. Berry sampling and harvest. Before harvesting, 100 berry samples were collected randomly from the clusters of each record vine (300 in total) to determine the mean berry weight, 90
113 Brix, TA, ph, color intensity (A12o + A52o), color hue (AuolA52o), anthocyanins, and total phenols. The samples were stored at -25 C until analysis. Berry sample collection occurred between 0-3 days prior of the commercial harvest date. All clusters from each recorded vine were hand harvested. The number of clusters and yield was recorded for each experimental vine. Winemaking. At harvest, about 30 kg of fruit, hand harvested only from the recorded vines, were pooled per each treatment replicate (row). They were transported to Brock University's winery. Over 900 kg of grapes were processed into wines in each year of the experiment (2005 to 2007). Grapes from each treatment replicate were de-stemmed, crushed and treated with S02 solution at 20 mgil. Must samples (;::::250 ml) were collected prior to inoculation and stored at - 25 C for analyses. The must from each treatment replicate was fermented individually. Each treatment replicate was fermented in duplicate in 20-L food grade plastic pails each fitted with a lid and an airlock. They were inoculated with 0.2g/L of commercial yeast (Saccharomyces cerevisiae) Lalvin Selection ICV 254 (Lallemand Inc., Montreal, QB). All fermentations were conducted in an insulated room maintained at 26 C. The caps were submerged three times daily. Fermentation lasted between 4 to 7 days. When the caps fell, each fermentation replicate was pressed off individually in a basket bladder press (Enoagricola Rossi s.r.1, Calzolaro, PG, Italy) at maximum 2 bars pressure and transferred to a 20-L carboy. All carboys were sealed with an airlock, and they were left another 10 days at room temperature (;::::20 0c) to complete the fermentation. Mterwards, all wines were racked and inoculated immediately with malolactic bacteria Oenococcusoeni at the rate of 0.01 gil (Lalvin VP41, St. Simon, France). The wines underwent malolactic fermentation at 23 C under a carbon dioxide atmosphere and completion was confirmed by paper chromatography. Replicate wine samples (;::::250 ml) were taken for wine composition analyses (ethanol, TA, ph, color, anthocyanins, and total phenols). Upon completion of malolactic fermentation, all wines were racked a second time and kept for 10 days at - 2 C for cold stabilization. At bottling, the wines were sulfited at 30 mgil and filtered using l pad and 0.2-1l cartridge filters. The experimental wines bottled under cork between December and January, were stored at 12 C in the wine cellar. Berry and wine composition. Berry samples were removed from-25 C storage, counted, weighed, placed into 250-mL beakers, and allowed to thaw. The berry and must samples were heated at 80 C in a water bath (Fisher Scientific Isotemp 228) for one hour to dissolve precipitated tartrates and to facilitate extraction of anthocyaninsfromthe skins. Berry samples were cooled to room temperature (20 C) and juiced in a commercial fruit and vegetable juicer (Omega 500, Denver, U.S.A.). The settled juice was centrifuged at 4500 rpm for 10 minutes in an IEC Centra 91
114 CL2 (International Equipment Company, Needham Heights, MA) in order to remove any debris (pulp tissue). The clear juice was used for soluble solids ('13rix) measurement using an Abbe refractometer (model 10450; American Optical, Buffalo, NY), ph measurement via an Accumet ph meter (model 25; Denver Instrument Company, Denver, CO), and titratable acidity (TA) with a PC-Titrate autotitrator (ManTech Associates, Guelph, ON). About 20 ml of the juice left from sample of each recorded vine was stored at -25 C for further analysis of total phenols and anthocyanins. Berries, musts and wine samples were analyzed for color intensity, hue, anthocyanins and total phenols. Total anthocyanins in berries and wines were quantified using the ph shift method by measuring the absorbance at 520 nm at ph 1.0 and ph 4.5 (Fuleki and Francis 1968). Details of buffer solution and sample preparation are found in Balint and Reynolds (2010). Absorbance was measured at 520 nm wavelength against blank (the appropriate buffer solution) using a Biochrom Ultrospec 2100 pro UVNis spectrophotometer (Biochrom Ltd., Cambridge, UK). Total anthocyanins concentration was calculated as malvidin 3, 5-diglucoside using the following formula: Total anthocyanins (mgil) = (A;;l.o - A;;4.5) X Color intensity was determined according to a method provided by Mazza et al. (1999). Intensity and hue were calculated from absorbance values measured at 420nm and 520nm on an Ultrospec 2100 Pro UVNIS spectrophotometer. Color intensity and hue were calculated as follows: Color intensity = A520 + ~20; Hue: ~2rJA52o. Total phenols analysis was done on all prepared samples using the colorimetric method of Slinkard and Singleton (1977). Wine samples were analyzed for TA and ph as described above. Ethanol concentration was measured by gas chromatography. The wine samples were filtered through a 0.45f.lII1 Durapore membrane filters (Millipore, Ireland), and 1 ml of wine was diluted in 9 ml of distilled water. Diluted samples and nine calibration standards (% EtOH = 0.6%; 0.8%; 0.9%; 1 %; 1.1 %; 1.2%; 1.3%, 1.4% and 1.5%) were combined with lojll of 100% I-butanol in 5 ml volumetric flasks, as an internal standard. Samples and standards were analyzed on an Agilent 6890 series GC system (Agilent Technologies, Mississauga, Canada) running on ChemStation software and equipped with a Supelco capillary column (Supelco Canada, Mississauga, ON). The column dimensions were 30.0 m x mm i.d. x 0.25 f.lii1 film thickness. The carrier gas was Helium passed through an in-line Chromospec hydrocarbon and moisture trap (Chromatographic Specialties Inc., 92
115 Brockville, ON). Other conditions of operation included: oven initial temperature 60 C, injection temperature 230 C, and detector temperature 225 C. Sensory analysis. Only wines from 2006 and 2007 vintage were subjected to sensory analysis, as the 2005 vintage was rejected due to high volatile acidity. The same sensory protocol was used for both 2006 and 2007 vintages. Each vintage was assessed following 18 months of ageing in the bottle. Sensory sessions occurred from February to May. Over 25 judges were involved in the sensory work over the 2 year period. The group was composed of Brock University faculty, staff, students from the viticulture and oenology program and two sommeliers. They were selected based on their availability and motivation. All were volunteers and underwent previous sensory training. A core of seven judges participated in both vintage assessments. For discrimination tests, 16 panelists were used for both vintages studied. The final panel used for descriptive analysis in each vintage consisted of 11 judges with ages ranging from 23 to 58. Discrimination test. A modified alternative forced choice test (n-afc) was used to compare a control wine (non-irrigated) to each irrigation treatment to determine if irrigation treatments differ from control (O'Mahoney 1986). This was intended as a preliminary exercise to determine whether differences existed between treatments, what the basis for those differences might be, and whether the panelists were dependable. The test was conducted over a period of three weeks, with two sessions per day and two days per week. Each wine sample was assessed in six replicates by each panelist. The replicates consisted of a flight of five wine samples [a sample identified to panelists as the control (non-irrigated) plus four irrigation treatments]. One of the four irrigation treatment wines was a "blind control" inserted into each flight to test the consistency of the panelists. Each testing session consisted of all ET levels within single irrigation timing. The panelists were instructed to compare all four samples in each flight with the control. They were requested to determine whether each wine sample was different from the control, and to assess the overall intensity (orthonasal and retronasal) of each sample relative to the control. They were also asked to write down any flavor or aroma attributes in which they thought the control and other wines differed. This question was added in order to find if the wines have any off flavor. A oneway 15 cm scale was used with verbal description anchors at the ends as follows: far left (no difference) and far right (very different-highest). They were asked to anchor the three digit codes of each wine assessed based on the intensity of difference relative to the control, as follows: on the left end if no difference was perceived or far right if one sample was very different than the control. Data were thereafter digitized and subjected to analysis of variance. A questionnaire used during this test was presented in Appendix A. Ten wines were evaluated by 16 judges (t = 12, k = 93
116 4, r = 6, j = 16) where t, k, r, j were the number of wines per session, number of wines per flight/replicate, number of wine replicates, and number of set samples-judges. Data was collected on paper. A three way ANOVA (site, judge, and replicate) was performed to ascertain main effects as well as interactions. The reproducibility of the panel was assessed through the effect of replication (JxR and WxR). Judges who consistently were outliers from the panel mean were rejected from the descriptive analysis. Descriptive analysis. Six training sessions were run over a period of three weeks. For sensory training, the panelists tasted wines from all irrigation treatments. Samples used for training purposes came only from two field replicates. In each session, they tested four wines (nonirrigated, 100%,50% and 25% ETc from one particular irrigation initiation time). They were asked to note any flavor or aroma attributes that could describe the variability among them. The list with the descriptors was adjusted until all panelists agreed with definitions (Table 3b-l). After the first two sessions, the panelists were asked to compare all the wines with the control for each attribute collected. Reference standards were created to help the panelist understand how to define and rate each attributes (Table 3b-l). The control (non-irrigated) was assessed individually for each of the aroma!flavor descriptors for the last three training sessions. The intensity was evaluated using a 15 cm scale. The references were also adjusted during the training session until everyone agreed that the reference was representative for that particular attribute (Table 3b-l). Following discussions with the panelists on the appropriate scale to be used for data collection, and with technical advice from Compusense Inc. (the software provider for Brock University sensory laboratory), a two-way unstructured scale was selected and verbal descriptions at the end points were used to collect sensory data. The control wine (non-irrigated) was anchored in the middle of the 15-cm scale. The ends of the scale were anchored with verbal descriptions: left (lowest) and right (highest). In each session, the control wine was assessed for each attribute. Panelists were instructed in the use of the line scale in order to aid in improving reliability and reproducibility in assessing attribute intensity. During the training session the panelists were asked to rate each coded wine on the left side of the scale if the intensity was lower than the control (nonirrigated) or on right side if it was higher than the control. A scale was used for each descriptor developed. They were also instructed to rate the wine samples in the same place as the control ifno difference between control and the wine sample was perceived for each attribute. All descriptors were assessed using the same scale. A print screen from the program was used in data collection; the type of scale and indications provided to panelists is shown in Appendix B. 94
117 Data collection. Data collection took place in the sensory laboratory at CCOVI (Brock University) using a computerized sensory software program (Compusense c5v4, Guelph, ON). Samples were evaluated in individual sensory booths using ISO glasses, and under red light to mask wine hue. The 10 wines [nine treatments plus the control from two field (fermentation) replicates] were assessed in four replicates (sessions). In each session, all 10 wines were evaluated in a randomized order according to the Williams block design. Each session had three flights. Each flight included four wine samples (the control-non-irrigated + 100%, 50% and 25% ETc from one particular irrigation initiation time). Panelists rated the samples based on the list of attributes on a two-way unstructured scale. They were asked to move the cursor left or right of the control's anchor, in order to record not only the intensity but also the direction (lower or higher) in which each variable explained the difference. Although, Baco noir wines are not very tannic, panelists were asked to rinse their palate with a solution of pectin after each sample followed by two water rinses in order to prevent any carry over effect. In order to rest the palate and avoid any bias, a 1 minute rest between each sample and 5 minutes rest after each group of four wines was included as part of the computerized evaluation session. Evaluations were started in the morning at 1100 h and continued until 1300 h. All wines were presented as 25-mL samples served in ISO tasting glasses and coded with a three-digit random number. Each glass was covered with a Petri dish to prevent volatile loss. For color intensity, 10 ml of each wine sample were presented in 5 cm diameter Petri dish under the different codes. They were assessed against a white background under natural light. Aroma standards developed during the training sessions were prepared fresh and available for judges as reference prior each session. Panelists were asked to assess the color during the 5 minutes breaks allowed between each flight. The sensory data was analyzed for significance using the real values (positive or negative values compared to control). To depict the sensory profile of the control and all irrigation treatments on cobweb plots, the mean intensity score for each attribute (irrigation sample) was subtracted or added to the corresponding descriptor score of the control wine (non-irrigated). A blind control was assessed during these descriptive analysis sessions for all the sensory descriptors to generate values for the non-irrigated treatment for the cobweb plots. Data analysis. All statistical procedures were performed using XLSTAT version (Addinsoft, Paris, France). Analysis of variance was conducted on the intensity ratings with irrigation treatment, panelist, and replication and three-way interactions in the model. Fruit and wine chemical data were analyzed using the SAS statistical package (SAS Institute; Cary, NC, USA). Using GLM, analysis of variance was performed. Duncan's multiple range test was used for mean separation for all data sets (chemical and sensory data), and Dunnett's t-test was used to 95
118 determine those treatment means that were different from the control at a significance level of u::;0.05. Sensory data were analyzed using XLSTAT (Addinsoft, Paris, France). Principal components analysis (PCA) was performed on the means of field data, yield components, chemical data, and sensory scores of aroma and flavor descriptors for each year of the experiment. Partial least squares regression (PLS) was performed on the field, chemical and sensory data in order to find the relationships among these variables. Results and Discussion Berry composition (Tables 3b-2, 3b-3). Soluble solids were consistently lower in all treatments in 2006 compared to those from 2005 and 2007 (Table 3b-2). Except for the 2006 season, the RDI treatments imposed at lag phase in 2005 and veraison in 2007 had higher Brix than the control. Grape yields and dry matter production generally responds non-linearly to water consumption (Grimes and Williams 1990, Williams et al. 1994). This is in agreement with data from this study, which showed neither consistency from vintage to vintage, nor a linear accumulation of Brix according to the amount of water applied (Table 3b-2). However, the data partially confirmed other findings that fruit quality is dependant on the berry developmental stage at which irrigation is initiated (Riihl and Alleweldt 1985). These authors found that sugar concentration increased when irrigation was applied during the fruit maturation stage, while irrigation in the early stages of berry development led to an increase in yield along with a delay in sugar accumulation. Brix can be reduced when dilution caused by berry growth is faster than the increase in sugar transport into the berry (Bravdo et al. 1985). The observations from 2005 and 2007 are in agreement with this. The Brix was lower in the 100% water replacement initiated at fruit set than the control (Table 3b-2). However, sugar accumulation in the berry remains unimpaired when high leaf 'I' is maintained by irrigation (Hepner et al. 1985). Some studies reported an increase in Brix under irrigated conditions, which was explained by the enhanced leaf area and higher photosynthetic activity (Bartolome 1993, Kriedemann 1977). Consequently, under similar conditions, grapes from irrigated treatments accumulated higher Brix than non-irrigated vines (Ginestar et al. 1998, Hamman and Dami 2000, Reynoldset al. 2007, 2009). In some RDI treatments, Brix was found higher compared to the control and this might be explained by the fact that under severe water deficits, stomatal closure could compromise photosynthesis (Reynolds et al. 2009). During fruit maturation, moderate water stress retards secondary shoot growth without affecting photosynthetic activity, thus favoring the redistribution of sugar into the berries and the 96
119 perennial organs (Carbonneau and Deloire 2001). Berries from irrigated vines had lower Brix than smaller berries from non-irrigated vines, due to a dilution effect (Bravdo et al. 1985, Esteban et al 1999). In the present experiments, the complexity of the responses found on physiological variables, yield components (described in Chapter 3a) and berry composition (Tables 3b-2, 3b-3) might be explained not mlly by the water status level in the soil but also by different weather conditions (Chapter 3a). No consistency in the fruit composition data was observed. Another two factors which should not be neglected when interpretation of data is made are the frequency and the volume of water delivered to the plant (Bravdo et al. 1985). The frequency of irrigation treatments was weekly, while the amount of water used was estimated by using theoretical equations. Both high water stress and high soil moisture had a negative effect on the fruit maturation process (Table 3b-2). It seems that both of them delay the fruit maturation process through different ways (the decrease in photosynthesis and increase competition for carbohydrates) (Quick et al. 1992, Rogiers et al. 2004, Smith 2004). In the present study the results suggest that irrigation initiation time affected the fruit composition. Although, no consistency was found over the trial, 25% and 50 % RDI initiated at lag phase or veraison appeared to improve berry composition. These findings are in agreement with other studies which indicated that post-veraison water deficits slightly reduced berry size and improved fruit composition (Kennedy et al. 2002, Ojeda et al. 2002). However, because all berry samples were collected at the same date, variation in the berry composition data might also be explained by the length of the fruit maturation period, which could be extended under both severe water stress and high water status. Since the phenology of the fruit maturation process was not assessed in this trial, it is possible that the irrigation treatments affected the onset time of veraison, which subsequently affected the length of the fruit maturation period. This is supported by data suggesting that water deficits might also alter the onset or duration of the fruit maturation period (Matthews and Anderson 1988). Another common response to low water status is the control of leaf area (Schultz 2000, Winkel and RambalI993). Stressed vines have a lower leaf area and therefore both photosynthetic source and carbon sink capacity are lower. In addition, photosynthesis is affected indirectly by transpiration (Ts) rate, which protects the plant of overheating. Optimum temperature for photosynthesis in vine leaves is between 25 and 30 C (Alleweldt et al. 1982, Chaves et al. 2003, 2007, Kriedemann and Smart 1971). In the present study the values of leaf temperature were> 30 C in non-irrigated treatments, especially in August, which coincided with the fruit maturation process of Baco noir. This could be a reasonable explanation of the variation in Brix between 97
120 treatments, since the PCA showed highly negatively correlations among leaf temperature and the other physiological leaf measurements such as leaf'l' and Ts rate (Chapter 3a: Figs 3a-17, 3a-20). Titratable acidity varied little (with some exceptions) among the treatments on each season but the TA values showed highly differed between seasons (Table 3b-2). The highest TA value (22.6 gil) was recorded in berries from 100% ETc treatment imposed at fruit set in After malolactic fermentation, as expected the TA decreased substantially in all wines. In this study the T A results are partially in agreement with those from other studies where no difference was found in TA among different irrigation treatments (Ginestar et al. 1998, Hardie and Considine 1976). Berry ph was lower in 2005 than in 2006 and 2007 (Table 3b-2). In 2006 and 2007, the ph was lower in the irrigated vines than in the control. The lowest values were found in the 50% and 25 % RDI treatments imposed at veraison, in both 2005 (3.33 to 3.34) and 2007 (Table 3b-2). The ph response to water deficits was not consistent over the course of the trial. However, the ph slightly decreased in the fully irrigated and many of the RDI treatments. This agrees with other studies where non-irrigated treatments had slightly higher ph than irrigated ones (Ginestar et al. 1998, Ligetvari 1986, Reynolds et al. 2007, 2009). The ph variation due to the irrigation treatments can be explained by either greater exposure of clusters in non-irrigated treatments, and concomitant increased malic acid catabolism (Kliewer and Lider 1968), or greater translocation of potassium from stressed leaves to the berries (Boulton 1980). The most noteworthy difference between the treatments and the control was with respect to concentration of anthocyanins and total phenols. Berries accumulated the most anthocyanins when they were under slight water stress (Table 3b-3). Both 50% and 25% ETc treatments contained a higher concentration of anthocyanins in the berries in 2005 and 2007 than 2006 vintages (Table 3b-3). However, the time of irrigation initiation was as important as the amount of water used. Although no consistent pattern was found over the entire trial, some irrigation treatments had much higher concentrations of anthocyanins than the control. Despite the belief that irrigation has a dilution effect on chemical composition, the data showed that even the grapes from 100% ETc treatments in some seasons had higher anthocyanins concentrations than those from the nonirrigated treatment (Table 3b-3). This might be explained by the fact that the enzymatic systems involved in the biosynthetic pathway were not adversely impacted in the irrigated vines, while in vines under severe water stress they could have been affected. For example, wines obtained from moderate water stress treatments contained double the amount of anthocyanins than non-irrigated treatments (Peterlunger et al. 2000). However, berry Brix, ph and color were not affected by either amount or type of irrigation, which was explained by the fact that the vines had reached 98
121 some balance between fruit load and leaf area (Collins et al. 2005, Esteban et al. 1999). In the berries, anthocyanins increase until a maximum is reached, after which there is a slight decrease due to their degradation, which is highly affected by elevated temperatures (Jackson and Lombard 1993). According to the same authors, when average night time temperatures are> 15 C, the concentration of polyphenols and anthocyanins are low. This is a plausible explanation since Baco noir is an early maturing cultivar, and the period from veraison to harvest is dominated by nights that consistently have temperatures> 15 C. This might also explain the different patterns found from vintage to vintage in the present study. In general, total phenols had the same trend as anthocyanins, with the highest concentrations found in the treatments initiated at lag phase (Table 3b-3). In 2006, the phenol pattern was almost opposite that of 2007 (Table 3b-3). The control had the highest total phenols concentration. One plausible explanation could be the dilution process, since 2006 season was cooler and wetter than 2005 and 2007 (Chapter 3a: Fig. 3a-l).1t was also possible that the equations used to calculate water needs overestimated the actual water required. In 2007, almost all the irrigation treatments showed higher concentration of total phenols than the control (Table 3b-3). However, no consistent response to irrigation was found from one vintage to the other. Several authors have shown that water stress increased phenol synthesis (Esteban et al. 2001, Hardie and Considine 1976, Ojeda 2001). This is in agreement with the results of this study, which showed that total phenols increased proportionally to water stress. However, other studies reported that water stress decreased (Chapman et al. 2005) or did not affect (Ginestar et al. 1998, Sipiora and Gutierrez-Granda 1998) the total phenols and anthocyanins concentration in berries. Must composition (Table 3b-4). In 2005, the must from most of the treatments had almost the same Brix as the control except 100% ETc imposed at fruit set that had the highest Brix. This finding showed that minimal dilution effect occurred in must due to irrigation. In 2006, due to high precipitation throughout the season, the Brix values were almost the same and much lower than the values found in 2005 and The most substantial difference among treatments was observed in The highest Brix values were found in the deficit irrigation treatments imposed at veraison. They were higher than the control and much higher than 100% ETc imposed at fruit set. This data therefore showed that irrigation improved must quality in dry years. In 2005, must TA was lower in all treatments compared to those from 2006 and 2007 seasons. The highest TA values in 2006 and 2007 were found in 100% ETc imposed at fruit set, while in 2005 the same treatment had the lowest TA values. However, the magnitude of difference among treatments was lowest in Overall, the must ph was highest in 2006 and the lowest in In each year of 99
122 the experimental period ph from treatments initiated at veraison was much lower than those imposed at fruit set or lag phase. Wine composition (Tables 3b-S, 3b-6). In 2005, most of the irrigation treatments had wines higher in ethanol than the control. In 2006, the ethanol concentration was lower compare to 2005 and 2007 (Table 3b-5). The highest values (different than the control) were found in the RDI treatments. In 2007, the wines had overall the highest ethanol concentration compared with 2005 and 2006 (Table 3b-5). Again, the control did not have the highest ethanol concentration, contrary to the expectation. In 2005, wine ph showed higher values than the control in treatments imposed at fruit set and veraison. In 2006, wine ph was lower than the control only at 25% ETc imposed at lag phase. In 2007, the wine ph from irrigated treatments did not significantly differ from the control except two treatments (100% ETc and 25% ETc lag phase). Overall, the anthocyanins values in all treatments from 2005 were lower compare to 2006 and 2007 (Table 3b-6). This might be explained by the sparse canopies in 2005 that resulted from 2004/2005 winter damage. These relatively small canopies could have increased cluster exposure to sunlight, which would have concomitantly increased berry temperatures. High temperatures inhibit the enzymes that control the biosynthesis of anthocyanins (Mori et al. 2005, Spayd et al. 2002, Yamane et al. 2006). Moreover, the temperature affects not only the synthesis but also their stability (Shaked-Sachray et al. 2002). Therefore, a decrease in anthocyanins concentration at elevated temperatures might result from both a decrease in synthesis and an increase in degradation. In 2006, the anthocyanins concentration pattern was different of that one from Wines from 50% RDI treatments showed consistently higher anthocyanins concentration than the control, while wines from 25% RDI treatments showed higher concentrations than the control only when applied at lag phase. Total phenols showed the same trend as the anthocyanins concentration in The highest concentration was found in the irrigation treatments applied at lag phase. In 2006, the highest total phenols concentration was recorded in both the berries and wines from the control treatment. In 2007, except wines from early imposed treatments, all others had higher concentrations of total phenols than the control. In 2007, the highest total phenols concentrations were found in the irrigated treatments imposed at lag phase. Hue had the lowest values in 2005 while those from 2006 were slightly lower than No differences were found between the control and 100% ETc treatments in 2005 and In 2007, the control had higher hue value than the 100% ETc initiated at fruit set, and was lower than RDI treatments initiated at lag phase. Overall, wines from irrigation treatments initiated at lag phase had higher hue values, indicating a lower ratio of red colored to yellow brown pigments. 100
123 However, no consistency was found over the trial. Hue values suggested that this variable could be a good indicator of the water status during dry vintages when the red and yellow-brown pigments ratio in the wine is highly affected. In 2006, color density was lowest, perhaps due to a dilution effect. The general pattern showed higher color density values in 25% RDI treatments in all vintages. This suggests that by increasing the water status until a threshold, the anthocyanins metabolic process is positively affected. However, this threshold should not be considered an absolute value, since it could be highly affected by the climatic conditions. Sensory analysis (Tables 3b-7 to 3b-8). The 2006 vintage was assessed for seven aroma and nine flavor descriptors. As expected, the largest differences occurred between the control and the 100% ETc treatments (Table 3b-7). The descriptors that showed substantial variation among all treatments were red and dark fruits, cooked vegetable and bell pepper (Table 3b-7). The irrigation treatments mostly affected color, fruit and vegetal characteristics. By plotting the mean sensory scores on radar diagrams for each treatment imposition time, data clearly showed that not only the time and regime of irrigation but also the vintage affected the sensory profile of the wine (Figs. 3b- 1 to 3b-3). The intensity scores for these two categories of descriptors (fruity and vegetal) were strongly related to the water deficit level (Fig. 3b-4). Generally, vegetal descriptors were associated with 100 ETc while fruity descriptors were associated with 25 and 50% ETc. treatments. The 25% ETc treatment imposed at veraison showed the least difference for all descriptors compared to the control. Cooked vegetable and bell pepper descriptors had the highest scores in 100% ETc wines at all irrigation initiation times. The irrigation initiation time had less effect on these two descriptors than the percentage of water deficit. The flavor descriptors, except red fruit, showed high variance among the treatments. The highest difference in terms of color intensity was perceived between the control and 100% ETc imposed at fruit set. The RDI treatments applied at lag phase or veraison varied a little compared to the control. These results are in agreement with those from a study conducted in California,where fruity wines were associated with soils with low water holding capacities, while vegetal wines were associated with soils with high water holding capacities (Noble et al. 1995). Although Niagara soils are considered to have relative high water holding capacities (Kingston and Presant 1989), there were differences in both fruity and vegetal characters, due presumably to the amount of water applied. The water deficit treatments had higher scores than the full irrigated treatments (100% ETc) for almost all the descriptors, vegetal attributes excepted. Wines from 2006 vintage had higher T A than those of the 2007 vintage, and the panelists were able to detect few wines that were different than the control in terms of perceived 101
124 acidity. In fact, in 2006, the perceived acidity was consistently high in all irrigation treatments but it was not strongly associated with vegetal character (Fig. 3b-4). Usually, in red grapes, acidity is highly correlated with vegetal notes associated with unripe fruit (Balint and Reynolds 2010). The wines from 2007 vintage showed a different sensory profile than in 2006 (Table 3b-8; Fig. 3b-l, 2, 3). Jammy fruit, sour cherry and tobacco were the three descriptors in 2007 wines that were not found in the wines from 2006 vintage. Green pepper was also missing from the 2007 sensory profile. In 2006, bitterness and astringency did not account for much of the variation of the wines due to irrigation treatments. In 2007, not all the attributes were different in the control wine compared to wines from the irrigated treatments (Table 3b-8). The greatest differences were found when the control was compared to wines from 100% ETc treatments. Both the amount of water applied and initiation time greatly affected the intensity of the attributes. With a few exceptions, the control had lower scores for most of the attributes compared to the other treatments. Although, wine TA was lower in 2007 vs. 2006, the 2007 wines were inexplicably scored higher for perceived acidity. In 2006, the first two factors of pea mean sensory scores explained 52.36% of the variability in the data set (Figure 3b-4). The first factor accounted for 32.93% of the variability and was most heavily loaded in the negative direction with color, prune and red fruit flavor, dark fruit and black pepper aroma. The second factor explained 19.43% of the variation in the data set, and was positively loaded with astringency, prune aroma and black pepper flavor. Dark fruit aroma and flavor were negatively correlated, which suggests that the odor-active compounds responsible for these descriptors in the wines from high water status treatments were mostly in bound forms such as glycosides, but were released upon contact with salivary enzymes. The pea plot illustrated that 100% ETc imposed at fruit set and lag phase were located in the right and upper part of the plot, being dominated by black pepper flavor and bitterness, while 100% ETc at fruit set was highly associated with green pepper and cooked vegetable and flavor and black pepper aroma. However, the 100% ETc treatments were grouped in a loose cluster on the right side of the plot, which indicated that not only the amount of water but also the initiation time were responsible for changes in the wine sensory profile. The positive direction (to the right of pe2) was associated with 100 % ETc treatments, and the negative direction with deficit water treatments. In other words, 100% ETc treatments were associated with the unripe sensory characteristics while deficit irrigation treatments were associated with the ripe ones. Moreover, 100% ETc applied at veraison was not correlated with color intensity, which suggests that full water replacement at veraison did not have either a negative or a positive effect on both color intensity and anthocyanins 102
125 accumulation. The 100% ETc treatments initiated at fruit set and lag phase were strongly negatively associated with color intensity and positively with bitterness (Fig. 3b-4). Except 50% ETc imposed at fruit set, all RDI treatments were located on the right side of the plot. The distribution of wines from 25% RDI showed a clear separation based on initiation time (Fig. 3b-4). All the RDI treatments were associated with dark fruit, red fruit and black pepper flavor. Color intensity was associated mostly with 25% ETc imposed at lag phase and veraison. In 2007, the PCA diagram showed that the first two factors explained 73.1 % of the variability (Fig. 3b-5). FI explained 52.72% while F2 explained 20.29%. The first component was positively loaded with sour cherry and cooked vegetable aroma, cooked vegetable and red fruit flavor, acidity and astringency. The same component was heavily negatively loaded with color, dark fruit, chocolate, tobacco, and prune aromas, jarnmy fruit, chocolate, dark fruit and tobacco flavors, and color intensity. The second factor was positively loaded with sour cherry flavor and bitterness. The distribution of the 2007 wines on the PCA plot showed a better discrimination among the treatments than in 2006 (Fig. 3b-5). Similar to 2006,100% ETc treatments were grouped together but the cluster was tighter in 2007 compare to The same treatments were highly associated with the variables positively loaded on PCl. However, the 100% ETc initiated at fruit set was located farther than those initiated later in the season, which suggests that initiation time still could play an important role in irrigation management from a sensory prospective. In 2007, the 100% ETc treatment initiated at fruit set had a negative effect on wine quality, mainly due to a larger canopy and extended vegetative period, which translated into postponing the onset of veraison and extending the fruit maturation period. Moreover, the other 100% ETc treatments were dominated by the same descriptors related to the unripe profile. The RDI treatments were located on the left side of the PCA plot. The 25% ETc wines were located very close to each other and to PCl. This indicates that in very dry years, the initiation time does not have an impact on the sensory profile for 25% RDI treatments. They were highly associated with the attributes negatively loaded on first factor (dark fruit, jammy fruit, chocolate). The 25% ETc wines showed higher color intensity than 50% ETc and 100% ETc as well as the control. In 2006, the 50% ETc imposed at lag phase and veraison were located close to the control and were highly associated with the attributes loaded on factor 1, whereas in 2007 they were grouped differently, showing a better discrimination. The control wines were negatively associated with sour cherry, red fruit and bitterness. The 50% ETc imposed at lag phase and veraison were positively associated with many fruit aroma and flavor descriptors. However, the 50% RDI treatments were grouped in a looser cluster, with the late initiated treatments grouped together on the left side of the plot, while early- 103
126 initiated treatments were located on the right side of the plot, close to the 100% ETc treatments. RDI treatments clearly had a positive effect on the wine quality. An interesting observation was that the control treatment was located on the left lower quadrant, and it was not dominated by any of the positive descriptors related to fruit maturity, which suggest that high water stress negatively affected the sensory varietal profile. In the current study most of the variability in wine sensory perception was explained by differences in the vegetal and fruity notes. These two categories of descriptors are related to fruit maturity. However the sensory pattern varied from vintage to vintage which suggest that besides soil moisture other climatic factors affect the sensory profile and its intensity. Differences in the sensory profiles of the wines due to the irrigation strategy used, led to two possible explanations. The responses of specific metabolic pathways in the yeast might have been affected by the must composition, which is directly related to the vine water status. Since the must was not adjusted with any nutrients before fermentation, it is speculated that the variation in nitrogen availability to the vine due to the various water deficits was translated in less assimilable nitrogen available to the yeast. Some studies showed that many aroma odorants are produced by the yeasts during alcoholic fermentation (Varela et al. 2009). Among the various yeast metabolic pathways that are influenced by the composition of the juice, those leading to volatile compounds are of particular importance due to the primary role played by fermentation-derived volatiles in the aroma character of wine (Smyth et al. 2005). Water deficit affects both the total available nitrogen and the ratio of amino acids and ammonia (Lohnertz et al. 2000, Van Heeswijcket al. 2001, Wade et al. 2004). As a consequence, it could affect the production of different groups of fermentation-derived volatile esters and other aliphatic compounds. The concentration of esters in wines is positively correlated with the concentration of some or all amino acids in the fruit (Guitart et al. 1999, Webster et al. 1993). This aspect has interesting impli~ations for wine flavor as fatty acids ethyl esters and acetates which are generally responsible for the fruity character of wine (Ebeler 2001, Guth and Sies 2002). The second theory which supports the sensory results is that vines under low or medium water deficits produced more aroma precursors. The concentration of carotenoids increases under high water deficit and light intensity, since they are involved in the photoprotection process (Cramer et al. 2007). Carotenoids are also precursors for abscisic acid, which controls water balance through stomatal opening (Koornneet 1986)~ Furthermore, the concentration of C 13 - norisoprenoids (~-damascenone, ~-ionone and 1,1,6- trimethyl-1,2-dihydronaphthalene) responsible for some aroma descriptors in red wines are dependant on the carotenoids 104
127 concentration in the berries and their subsequent breakdown (Crupi et al. 2010). In berries of vines that were exposed to water deficits, the concentration of the carotenoids precursors to norisoprenoids was increased compared to control (fully irrigated) (Oliveira et al. 2003). Relationships among soil and plant water status, yield components and chemical data Partial least squares analysis (PLS) was performed on the entire data sets in order to have a bigger picture on the relationship among soil and plant water status, yield components, berry and wine chemistry (Fig. 3b-6). The PLS plot illustrates that leaf 'I' was very strongly positively correlated with soil moisture, Ts rate and vigor, but negatively correlated with color intensity in the wine. The variability among the irrigated treatments was not well explained by ph and yield. On the other hand, berry weight and TA were negatively correlated with the concentrations of ethanol, anthocyanins and total phenols. This indicates that most of the chemical variables associated with fruit maturity were negatively correlated with the soil water levels. However, yield and the number of clusters per vine were close to the center of the figure, showing low correlations with physiological variables. This might indicate that in the previous year, the climatic conditions did not strongly affect cluster differentiation. It might also suggest that soil moisture, leaf '1', Ts rate, and vigor variables, if measured in the previous year, could partially predict the number of inflorescences and yield. Cluster weight was highly correlated with the number of berries per cluster and negatively correlated with berry weight PCA was first performed on physiological data, yield components and berry composition (Figure 3b-7). In this case, PCI and PC2 explained % of the variability in the data set while PC3 only 18.6%. The PCA plots (3b-7 A and B) showed that the first three factors still did not give a good representation of the initial variability, since the next two to three factors carried important variability. In 2006, the soil and plant water status variables were heavily positively loaded on PCl as in 2005 (Fig. 3b-7 A). Berry weight was highly positively loaded on PC3 along with soil moisture measured by TDR. They were negatively correlated with leaf temperature. In the wine, the ethanol, anthocyanins, Brix and hue were negatively correlated with color density in grapes and wine, vigor and number of clusters per vine. There was a clear separation among the irrigated treatments based on irrigation imposition time (Fig 3b-7 A). The treatments imposed at fruit set were grouped in the lower right plane; the treatments started at lag phase were grouped in the upper plane, while the treatments applied at veraison were located in the lower-left plane; In 2006, PLS analysis was performed on the whole data set including the sensory data (Fig. 3b-8). The PLS diagram illustrated a strong negative correlation between leaf '1', Ts rate, color 105
128 intensity, red fruit and total phenols. The latter variables were also negatively correlated with soil moisture (measured by Profile Probe) at the 10,20 and 100 cm depths. This suggests that high soil moisture at these depths, where possibly most of the active root system is concentrated, might have a negative effect on color intensity on both grape and wine, respectively. Berry weight was positively correlated with '13rix, anthocyanins and TA and negatively with berry and wine ph. This suggests that overall berry size did not have a negative effect on Brix and anthocyanins through a dilution effect, contrary to the expectations. Moreover, these two variables which reflect maturity level in red grapes did not show high correlations with soil moisture at any of the depths measured. Yield was located very close to the center of the PLS figure, and indicated no correlation with the other variables measured. The vegetal characters (e.g. green pepper and cooked vegetable) were positively correlated with soil moisture at the 30, 40 and 60 cm depths, and negatively correlated with red and dark fruit flavor, black pepper and leaf temperature. The relationships among variables showed that most of the typical sensory characteristics for this cultivar were negatively associated with the irrigation treatments imposed early in the season and less with volume of water applied The PCA plot of field, yield components and berry composition showed that PC 1 and PC2 explained 55.93%, while PC3 explained 15.74% of the total variability in the data set (Fig. 3b-9A and B). Soil moisture at the 10, 20, 30 and 100 cm depths were highly positively loaded on PC1, while leaf temperature and color density of grapes were negatively loaded. Soil moisture at 40 and 60 cm depths were highly correlated withobrix, color intensity and ethanol in the wine. This relationship was different compare to Anthocyanins, hue and ph were heavily positively loaded on PC3 while negatively loaded with vigor, berries per cluster and berry weight. The grapes from irrigated treatments imposed at lag phase were highly associated with anthocyanins, hue and ph, while the control andrdi treatments imposed at veraison were highly associated with color intensity, Brix and ethanol. PLS analysis on 2007 data set showed different relationships than in 2005 and 2006 (Fig. 3b-1O). Soil moisture at 20 and 100 cm depths were highly associated with berries per cluster and cluster weight but negatively correlated with Brix, ethanol, prune and tobacco aroma and dark fruit flavor. This might suggest that the root system activity was subdivided in the soil profile into different depths based on the relative soil moisture levels. Soil moisture at the 10, 30, 40, and 60 cm depths were positively correlated with sour cherry and cooked vegetable aroma and red fruit flavor and negatively correlated with jammy fruit, tobacco, chocolate and dark fruit aromas. This suggests that the soil moisture at different depths could impact berry composition and/or aroma profile. 106
129 Conclusions This study revealed that even in regions considered cool, vines undergo periods of water stress that affect both the fruit composition and wine sensory profiles. The effects of various irrigation regimes on vine water status varied depending on season, and as a consequence the effect on fruit composition and sensory profile was positive, negative, or nil. Patterns of both chemical composition and sensory profiles varied over the trial. It is likely that other climatic factors such as precipitation, temperature, light and relative humidity have overridden impacts of water status in terms of their effects on fruit composition in some seasons. DJ3rix, ph, and TA are the most commonly measured components of fruit maturity but they are not consistently associated with sensory varietal typicity. Therefore, it is essential, to carry out vineyard experiments through to sensory analysis of wines if the ultimate objective is to manipulate wine sensory attributes through vineyard management, particularly irrigation. Since these experiments were conducted over a three-year period and each vintage had different weather conditions, it was not found entirely consistent trends. However, even in years considered cool, berry composition and wine sensory profiles were affected by soil water levels and these trends were consistent among water deficit treatments. This study showed that soil and plant water status, based on their relationships with the sensory descriptors could predict the flavor profile of the wines. Future research should be directed toward chemical analyses of the odor-active compounds that might be impacted by irrigation. Knowing the vine water needs at any phenological stage, the grape grower and winemaker can manipulate through irrigation the grape composition and finally the wine quality. Full 100% water replacement is not recommended at any phenological stage, although in some seasons it had no negative effects on fruit composition. However, 50% and 25 % water replacement had overall positive effects on fruit composition and varietal typicity. If the water is applied without precision, deficit irrigation might have negative effects on fruit composition and wine sensory profiles. Consequently, low water status resulting from lack of precision in calculation of irrigation needs might have as negative impact as high water status on both the chemical composition and wine sensory profiles. 107
130 Literature Cited A1leweldt, G., R Eibach, and E. RUhl Investigations on gas-exchange in grapevine. 1. Influence of temperature, leaf age and daytime on net photosynthesis and transpiration. Vitis 21: Balint, G., and AG. Reynolds Effect of different irrigation strategies on vine physiology and grape quality of Cabernet Sauvignon and Sauvignon blanc in a cool-climate area. Prog. Agric. Vitic. 127(11): Bartolome, M.C Respuestas de la vid (Vitis vinifera L.) a condiciones de estres hidrico: efectos sobre las relaciones agua-planta, el crecimiento, la produccion y la calidad, (cv Tempranillo). Tesis Doctoral de la Universidad Politecnica de Madrid. 330 p. Boulton, RB The general relationship between potassium, sodium and ph in grape juice and wine. Am. J. Enol. Vitic. 31: Bravdo, B., Y. Hepner, C. Loinger, S. Cohen, and H. Tabacman Effect of crop level on growth, yield and wine quality of a high-yielding Carignane vineyard. Am. J. Enol. Vitic. 35: Bravdo, B., Y. Hepner, C. Loinger, S. Cohen, and H. Tabacman Effect of irrigation and crop level growth, yield and wine quality of Carbernet Sauvignon. Am. J. Enol. Vitic. 36: Bravdo, B., A Naor, T. Zahavi, and Y. Gal The effects of water stress applied alternatively to part of the wetting zone along the season (PRD-partial rootzone drying) on wine quality, yield, and water relations of reed wine grapes. Acta Hort. 664: Carbonneau, A, and A Deloire Plant organization based on source-sink relationships: new fmding on developmental, biochemical and molecular responses to environment. pp In:. Roubelakis-Angelakis, K.A (Ed.), Molecular Biology & Biotechnology of the Grapevine. Kluwer Academic Publishers, Netherland. 474p. Chapman, D.M., G. Roby, S.E. Ebeler, JX. Guinard, and M. Matthews Sensory attributes of Cabernet Sauvignon wines made from vines with different water status. Austral. J. Grape Wine Res. 11: Chaves, M.M., J.S. Pereira, and J. Maroco Understanding plant response to drought - from genes to the whole plant. Funct. Plant BioI. 30: Chaves, M.e., C.R Souza, T.P. Santos, M.L. Rodrigues, e.m. Lopes, J.P. Maroco, and J.S. Pereira Deficit irrigation in grapevine improves water-use efficiency while controlling vigor and production quality. Ann. Appl. BioI. 150: Collins, M.J., E.W.R Barlow, R Wood, G. Kelley. and S. Fuentes Physiological, growth, yield and quality responses of 'Sbiraz' berries manipulated using PRD and drip irrigation. Acta Hort. 689: Cramer, G.R, A Ergul, J. Grimplet, RL. Tillett, E.A Tattersall, M.e. Bohlman, D. Vincent, J. Sonderegger, J. Evans, e. Osborne, D. Quilici, K.A Schlauch, D.A Schooley, and J.e. Cushman Water and salinity stress in grapevines: early and late changes in transcript and metabolite profiles. Funct. Integ. Genom. 7: Crupi, P., A Coletta, and D. Antonacci Analysis of carotenoids in grapes to predict norisoprenoid varietal aroma of wines from Apulia. J. Agric. Food Chern. 58:
131 Dry, P.R., and B.R. Loveys Factors influencing grapevine vigour and the potential for control with partial rootzone drying. Austral. J. Grape and Wine Res. 4: Ebeler, S.E Analytical chemistry: Unlocking the secrets of wine flavour. Food Rev. Internat. 17: Esteban, M.A, MJ. Villanueva, and J.R. Lissarrague Effect of irrigation on changes in berry composition of Tempranillo during maturation. Sugars, organic acids and mineral elements. Am. J. EnoL Vitic. 50: Esteban, M.A, M.J. Villanueva, and J.R. Lissarrague Effect of irrigation on changes in the anthocyanin composition of the skin of cv Tempranillo (Vitis vinifera L.) grape berries during ripening, J. Sci. Food Agric. 81: Freeman, B.M., T.H. Lee, and C.R. Turkington Interaction of irrigation and pruning level on grape and wine quality of Shiraz vines. Am. J. EnoL Vitic. 31: Fuleki, T., and F.J. Francis Quantitative methods for anthocyanins. 1. Extraction and determination oftotal anthocyanin in cranberries. J. Food Sci. 33: Fulcrand, H., M. Duenas, E. Salas, and V. Cheynier Phenolic reactions during winemaking and aging. Am. J. EnoL Vitic. 57: Ginestar, c., J. Easteban, S. Gray, and P. Iland Use of sap flow sensors to schedule vineyard irrigation. II. Effects of postveraison water deficits on composition of Shiraz grapes. Am. J. EnoL Vitic. 49: Grimes, D.W., and L.E. Williams Irrigation effects on plant water relations and productivity of Thompson seedless grapevines. Crop Sci. 30: Guitart, A, P.H. Orte, V. Ferreira, C. Pena, and J. Cacho Some observations about the correlation between the amino acid content of musts and wines of the Chardonnay variety and their fermentation aromas. Am. J. EnoL Vitic. 50: Guth, H., and A Sies Flavour of wines: Towards an understanding by reconstitution experiments and an analysis of ethanol's effect on odour activity of key compounds. pp In: Proceedings of the eleventh Australian Wine Industry Technical Conference, Blair, R.J., Williams, PJ., Hoj, P.B. (Eds.) October 2001, Adelaide, SA Hamman, R.A Jr., and I.E. Dami Effects of Irrigation on Wine Grape Growth and Fruit Quality. HortTech. 10: Hardie, W.J., and J.A Considine Response of Grapes to Water-Deficit Stress in Particular Stages of Development. Am. J. Enol. Vitic. 27: Hepner, Y., B. Bravdo, C. Loinger, S. Cohen and H. Tabacman Effect of drip irrigation schedules on growth, yield, must composition and wine quality of Vitis vinifera L. cv. Cabemet Sauvignon. Am. J. Enol. Vitic. 36: Jackson, D.I., and P.B. Lombard Environmental and management practices affecting grape composition and wine quality-a review. Am. J. Enol. Vitic. 44: Kennedy, J.A, M.A Matthews, and AL. Waterhouse Effect of maturity and vine water status on grape skin and wine flavonoids. Am. J. EnoL Vitic. 53: Kingston, M.S., and B.W. Pres ant The Soils of the Regional Municipality of Niagara. Rept. No. 60. Ontario Institute of Pedology, Guelph, ON. 109
132 Kliewer, M.W., and L.A Lider Influence of cluster exposure to the sun on the composition of Thompson seedless fruit. Am. J. Enol. Vitic. 19: Koomneet, M Genetic aspects of abscisic acid. pp In: A Genetic Approach to Plant Biochemistry, Blonstein, AD. and King P.J., (Eds), Springer-Verlag, New York, NY. Kriedemann, P.E Vine leaf photosynthesis. pp In: Proc. Int. Simp. on the quality of the Vintage February. Capetown, South Africa. Kriedemann, P.E., and RE. Smart Effects of irradiance, temperature, and leaf water potential on photosynthesis of vine leaves. Photosynthetica. 5:6-15. Ligetvari, F Irrigation may improve wine quality. Austral. Grapegrower Winemaker. 271: Lohnertz, 0., B. Prior, M. Bleser, and A Linsenmeier Influence of N-supply and soil management on the nitrogen composition of grapes. Acta Hort. 512: Matthews, M.A, and M.M. Anderson Fruit ripening in grapes (Vitis vinifera L.): responses to seasonal water deficits. Am. J. Enol. Vitic. 39: Matthews, M.A, R. Ishii, M.M. Anderson, and M. O'Mahony Dependence of wine sensory attributes on vine water status. J. Sci. Food Agric. 51: Mazza, G., L. Fukumoto, P. Delaquis, B. Girard, and B. Ewart Anthocyanins, phenolics, and color of Cabemet Franc, Merlot, and Pinot noir wines from British Columbia. J. Agric. Food Chern. 47: Medrano, H., J.M. Escalona, J. Cifre, J. Bota, and J. Flexas A ten-year study on the physiology of two Spanish grapevine cultivars under field conditions: Effects of water availability from leaf photosynthesis to grape yield and quality. Funct. Plant BioI. 30: Mori, K., S. Sugaya, and H. Gemma Decreased anthocyanin biosynthesis in grape berries grown under elevated night temperature condition. Sci. Hort. 105: Morris, J.R and D.L. Cawthon Effect of irrigation, fruit load, and potassium fertilization on yield, quality, and petiole analysis of Concord (Vitis labrusca L.) grapes. Am. J. Enol. Vitic. 33: Noble, AC., D.L. Elliot-Fisk, and M.S. Allen Vegetative flavor and methoxypyrazines ip Cabemet Sauvignon. pp In: Fruit Flavors: Biogenesis, Characterization, and Authentication. RL. Rousoff and M.M. Leahy (Eds.), American Chemical Society, Washington, DC. Ojeda, H., C. Andary, E. Kraeva, A Carbonneau, and A. Deloire Influence of pre- and postveraison water deficit on synthesis and concentration of skin phenolic compounds during berry growth of Vitis vinifera cv. Shiraz. Am. J. Enol. Vitic. 53: Ojeda, H., A Deloire, and A Carbonneau Influence of water deficits on grape berry growth. Vitis 40: Oliveira, c., AC. Ferreira, M. Pinto, T. Hogg, F. Alves, and P. Guedes de Pinho Carotenoid compounds in grapes and their relationship to plant water status. J. Agric. Food Chern. 51: O'Mahoney, M Sensory Evaluation of Food. Statistical Methods and Procedures. Marcel Dekker, New York, NY. 110
133 Ough, C.S Vineyard and fermentation practices affecting wine. California Agriculture 34: Peterlunger, E., A Buccella, F. Iacono, and B.A Bravdo Physiological changes in grapevine during adjustment to water stress: ABA, leaf gas exchanges and root hydraulic conductivity. Acta Hort. 526: Quick, W.P., M.M. Chaves, R. Wendler, M. David, M.L. Rodrigues, J.A Passaharinho, J.S. Pereira, M.D. Adcock, R.e. Leegood, and M. Stitt The effect of water stress on photosynthetic carbon metabolism in four species grown under field conditions. Plant Cell Envir. 15: Reynolds, AG., A Ehtaiwesh, and C. de Savigny Irrigation scheduling for 'Sovereign Coronation' table grapes based on evapotranspiration calculations and crop coefficients. HortTech. 19: Reynolds, AG., W. Lowrey, L. Tomek, J. Hakimi, and C. de Savigny Influence of irrigation on vine performance, fruit composition, and wine quality of Vi tis vinifera L. cv. Chardonnay in a cool, humid climate. Am. J. Enol. Vitic. 58: Reynolds, AG., S. Yerle, B. Watson, S.F. Price, and D.A Wardle Fruit environment and crop level effects on Pinot noir. III. Composition and descriptive analysis of Oregon and British Columbia wines. Am. J. Enol. Vitic. 47: Rogiers, S.Y., J.M. Hatfield, and M. Keller Irrigation, nitrogen, and rootstock effects on volume loss of berries from potted Shiraz vines. Vitis 43: 1-6. Rtihl, E.H., and G. Alleweldt Investigations into the influence of time of irrigation on yield and quality of grapevines. Acta Hort. 171: Schultz H.R Climate change and viticulture: A European perspective on climatology, carbon dioxide and UV-B effects. Austral. J. Grape Wine Res. 6:2-12. Shaked-Sachray, L., D. Weiss, M. Reuveni, A Nissim-Levi, and M. Oren-Shamir Increased anthocyanin accumulation in aster flowers at elevated temperatures due to magnesium treatment. Physiol. Plant.114: Sipiora, M.J., and M.J. Gutierrez-Granda Effect of pre-veraison irrigation cutoff and skin contact time on composition, color, and phenolic content of young Vitis vinifera L. cv. Cabemet Sauvignon wines in Spain. Am. J. Enol. Vitic. 49: Slinkard, K., and V. Singleton Tptal phenol analysis: automation and comparison with manual methods. Am. J. Enol. Vitic. 28: Smith, J.P Investigations into the mechanisms underlying grapevine rootstock effects on scion vigor and yield. Ph.D. thesis, Charles Sturt University, NSW, Australia. Smyth, H., D. Cozzolino, M.J. Herderich, M.A. Sefton, and I.L. Franci Relating volatile composition to wine aroma: identification of key aroma compounds in Australian white wines. pp In: Proceedings of the Twelfth Australian Wine Industry Technical Conference, Blair, R.J., Williams, P.J., Pretorius, I.S. (Eds.), Melbourne, Vic, July Australian Wine Industry Technical Conference Inc., Adelaide, SA Spayd, S.E., J.M. Tarara, D.L. Mee, and J.e. Ferguson Separation of sunlight and temperature effects on the composition of Vitis vinifera cv. 'Merlot' berries. Am. J. Enol. Vitic. 53:
134 Tesic, D., D.J. Woolley, E.W. Hewett, and D.J. Martin Environmental effects on Cabernet Sauvignon (Vitis vinifera L.) grown in Hawke's Bay, New Zealand. 2. Development of a site index. Austral. J. Grape Wine Res. 8: Van Heeswijck, A.P. Stines, J. Grubb, I. Skrumsager M!1lller, and P.B. H!1lj Molecular biology and biochemistry of proline accumulation in developing grape berries. pp In: Molecular Biology and Biotechnology of the Grapevine. Roubelakis-Angelakis KA (Ed.), Kluwer Academic Publishers, Dordrecht, The Neatherlands. Varela, C., T. Siebert, D. Cozzolino, L. Rose, H. Mclean, and P.A. Henschke Discovering a chemical basis for differentiating wines made by fermentation with 'wild' indigenous and inoculated yeasts: role of yeast volatile compounds. Austral. J. Grape Wine Res. 15: Wade, J., B. Holzapfel, K DeGaris, M. Keller, and D. Williams Nitrogen and water management strategies for wine-grape quality. Acta Hort. 640: Webster, D.R, CG. Edwards, S.E. Spayd, J.C. Peterson, and B.J. Seymour Influence of vineyard nitrogen fertilization on the concentrations of monoterpenes, higher alchohols, and esters in aged Riesling wines. Am. J. Enol. Vitic. 44: Williams, L.E., N.K Dokoozlian, and RL. Wample Grape. pp In: Handbook of Environmental Physiology of Fruit Crops. Vol. 1. Temperate Crops. Shaffer B. and Anderson P.C. (Eds.), CRC Press, Orlando, Florida. Winkel, T., and S. Rambal Influence of water stress on grapevines growing in the field: from leaf to whole-plant response. Austral. J. Plant Physiol. 20: Zamboni, M., L. Bavaresco, and R Komjanc Influence of bud number on growth, yield, grape and wine quality of 'Pinot gris,' 'Pinot noir' and 'Sauvignon' (Vitis vinifera L.). In: IHS Workshop on strategies to optimize wine grape quality, Conegliano, Italy, July S. Poni et al. (Eds.). Acta Hort. 427: Yamane, T., S.T. Jeong, N. Goto-Yamamoto, Y. Koshita, and S. Kobayashi Effects of temperature on anthocyanin biosynthesis in grape berry skins. Am. J. Enol. Vitic. 57:
135 List of Tables Table 3b-l. Attributes and their standard references used for sensory evaluation of Baco noir wines, Lambert Vineyards, Niagara-on-the-Lake, ON, 2006 and 2007 vintages. Table 3b-2. Impact of irrigation treatments on berry composition of Baco noir grapes, Lambert Vineyards, Niagara-on-the-Lake, ON, Table 3b-3. Impact of irrigation treatments on berry phenolic analyte composition of Baco noir grapes, Lambert Vineyards, Niagara-on-the-Lake, ON, Table 3b-4. Impact of irrigation treatments on must composition of Baco noir grapes, Lambert Vineyards, Niagara-on-the-Lake, ON, Table 3b-5. Impact of irrigation treatments on Baco noir wine composition, Lambert Vineyards, Niagara-on-the-Lake, ON, Table 3b-6. Impact of irrigation treatments on Baco noir wine color and phenolic composition, Lambert Vineyards, Niagara-on-the-Lake, ON, Table 3b-7. Comparison of mean sensory scores among irrigation treatments of Baco noir wines, Lambert Vineyards, Niagara-on-the Lake, ON 2006 Table 3b-8. Comparison of mean sensory scores among irrigation treatments of Baco noir wines, Lambert Vineyards, Niagara-on-the Lake, ON,
136 Table 3b-l. Attributes and their standard references used for sensory evaluation of Baco noir wines, Lambert Vineyards, Niagara-on-the-Lake, ON, 2006 and 2007 vintages. Sensory attribute Dark fruit Red fruit Sour cherry Prune Chocolate Black pepper Cooked vegetable Bell pepper Tobacco Acidity Bitterness Astringency Reference standard (prepared in 100 ml of base wine Kressmann -France) 10 ml black currant concentrate (Ribena), 20 g of jam (blueberry and blackberry)(e.d. Smith) 20 g mixture of fresh strawberry and raspberry fruit (California, USA) 10 g of pulp sour cherries (canned) (Del Monte) 20 g of fresh prune puree (Chile) 5 g of cooking chocolate-no Name (No Frills) 0.2 g of ground black pepper Mixture of fresh green beans (10 g) and asparagus (15 g)- cooked for 30 sec in microwave and left 24h in 100 ml of base wine Cut pieces of fresh green pepper (log) 1 g of processed tobacco leaves - cigar tobacco (24h maceration in 100 ml base wine) 1.5g tartaric acid (Sigma) IL distillate water 0.03g quinine sulfate (Sigma) IL distillate water 0.3 g aluminum sulfate (Sigma) IL distillate water 114
137 Table 3b-2. Impact of irrigation treatments on berry composition of Baco noir grapes, Lambert Vineyards, Niagara-on-the-Lake, ON, Treatment Soluble solids ebrix) Titratable acidity (gil) ph C 22.6c 19.3 b 23.5b 12.2b 16.8 c 12.8 b 3.36b 3.56 a 3.51 b Tl 22.5 c 19.7 ab 22.4c 12.4 b 22.6 a 13.3 b 3.42 ab 3.52 b 3.48 bc T2 23.0b 19.6 ab 23.0bc 12.3 b 18.1 b 12.1 b 3.44 ab 3.S3b 3.53 ab T c 19.5 ab 23.2 bc 1l.Oc 17.2c 18.1 a 3.55 a 3.S2b 3.56 a T4 23.0b 19.7 ab 23.6b 14.1 a 16.9 c 12.3 b 3.40 ab 3.57 a 3.50b T b 19.7 ab 21.9c 12.2 b 16.0d 12.5 b 3.37b 3.59 a 3.49b T a 20.0 a 23.1 bc 12.4 b 17.2 c 13.1 b 3.54 a 3.49c 3.51 b T c 19.8 ab 23.7b 12.4 b 16.0 d 12.3 b 3.36b 3.S3b 3.44c T8 22.6c 19.5 ab 24.1 a 12.8 b 16.0 d 12.8 b 3.34c 3.56 a 3.46 c T b 19.7 ab 24.0 a 14.3 a 17.1 c 12.0b 3.33 c 3.56 a 3.44c Significance **** * *** **** * * ** *** **** *C-contro1 (non-irrigated); Tl-T3 - irrigation treatments applied at fruit set (100,50 and 25% of ETc); T4-T6 irrigation treatments applied at lag phase (100, 50 and 25% of ETc); and TI-T9 irrigation treatments applied at veraison (100,50 and 25% of ETc). *,**,***,****, ns: Significant at p.::; 0.05,0.01,0.001, , or not significant, respectively. Letters within columns represent means separated at p.::; 0.05, Duncan's multiple range test. Boldfaced data indicate those values significantly greater than the control using Dunnett's t-test; boldfaced and underlined data are significantly less than the control 115
138 Table 3b-3. Impact of irrigation treatments on berry phenolic analyte composition of Baco noir grapes, Lambert Vineyards, Niagara-onthe-Lake, ON, Hue (fu.2o/a520) Color density Anthocyanins (mgil) Total phenols Treatement (fu.20+a520) (mgil gallic acid equiv.) C O.Slb 0.S6b O.77a 17.1b 12.6b 21.9a c c 2087b 1935b 2717a 1897c T1 0.51b 0.56b 0.69ab 15.2e 11.8e 16.5e b 1773,4bc 1716ed 1808e 2374b 1796 cd T2 O.72a 0.71a 0.61e 16.1e 12.2e 17.9be a ab 1567d 1933b 2301b 1676d T3 0.56b 0.48e O.72ab 17,4b 13.1b 20.1b ab d 1933b 1926b 2206e 2063bc T4 0.62ab 0.76a 0.79 a 14.6b 9.1d 18.2be ab 1775.Sbc 2147a 2087ab 2672ab 2712 a T5 0.52b 0.78a O.72ab 16.7b 12.1b 17.9be bc ab 1965b 2091ab 2373be 2746 a T6 0.58ab 0.79a 0.78 a 20.2a 14.4a 22.6a ab a 2211a 2oo3ab 2790a 2370b T a 0.75a 0.71ab 14.3d 13.6b 15.1e a b 1956b 1989ab 2305b 2805 a T8 0,49b 0.52b 0.73ab 16.6c 13.1b 18.9bc d d 202Sb 191O.7b 2S23ab 2173 be T a 0.46e 0.69ab 19.3a 14.4a 22.1a a e 1863 e a 2287e 2722 a Significance. * * * *** * * **** **** **** * *** * *C-control (non-irrigated); T1-T3 - irrigation treatments applied at fruit set (100,50 and 25% of ETc); T4-T6 irrigation treatments applied at lag phase (100,50 and 25% of ETc); and T7-T9 irrigation treatments applied at veraison (100,50 and 25% of ETc). *,**, ***,****, ns: Significant at p.$ 0.05,0.01, 0.001,0.0001, or not significant, respectively. Letters within columns represent means separated at p.s 0.05, Duncan's multiple range test. Boldfaced data indicate those values significantly greater than the control using Dunnett's t-test; boldfaced and underlined data are significantly less than the control. 116
139 Table 3b-4. Impact of irrigation treatments on must composition of Baco noir grapes, Lambert Vineyards, Niagara-on-the- Lake, ON, Treatment Soluble solids (Brix) Titratable acidity (gil) ph C 21.6 a b 11.4 b 14.2b 14.2 ab 3.13 c 3.31 a 3.09bc T a bc 10.3 e 16.5a 15.3 a 3.24 b 3.36 a 3.08 bc T b b 11.3 b 16.2a 13.1 b 3.26 ab 3.31 a 3.05 c T e b 10.ge 15.3ab 14.9 ab 3.35 a 3.28 ab 3.12 b T b ab 12.1 a 14.3b 12.3 bc 3.20 b 3.36 a 3.15 b T b ge 11.2 b 13.8bc 12.5 be 3.18 b 3.35 a 3.21 a T b b 11.2 b 14.5b 13.1 b 3.35 a 3.22b 3.11 b T7 20.2e a 11.3 b 12.2e 10.3e 3.12 c 3.20b 3.04c T a a 10.Se 13.6bc 13.8 b 3.13 c 3.18b 3.06c T e a 12.5 a 13.2bc 10.2e 3.16 c 3.20b 3.08 bc Significance *** ns *** *** * * * * **** *C-control (no-irrigated); T1-T3 - irrigation treatments applied at fruit set (100,50 and 25% of ETc); T4-T6 irrigation treatments applied at lag phase (l00, 50 and 25% of ETc); and T7-T9 irrigation treatments applied at veraison (100,50 and 25% of ETc). *,**,***, ****, ns: Significant at p ~ 0.05, 0.01,0.001,0.0001, or not significant, respectively. Letters within columns represent means separated at p ~ 0.05, Duncan's multiple range test. Boldfaced data indicate those values significantly greater than the control using Dunnett's t-test; boldfaced and underlined data are significantly less than the control 117
140 Table 3b-5. Impact of irrigation treatments on Baco noir wine composition, Lambert Vineyards, Niagara-on-the-Lake, ON, Treatment ph TA (gil) Ethanol (%v/v) C 3.46c 3.56 ab 3.49b 7.3 b 7.8b 7.2 b c b b T1 3.53b 3.52b 3.56 ab 7.4 b 8.3 b 7.7ab c a c T ab 3.53 b 3.51 b 7.1 b 9.1 a 6.9b a ab bc T a 3.52 b 3.54 ab 8.6 a 8.1 b 9.1 a c c be T4 3.48c 3".57 ab 3.65 a 6.8c 6.9c 7.3 b b ab bc T5 3.42c 3.59 a 3.56 ab 7.5 b 6.9c 7.5 b b a c T ab 3.49c 3.62 a 7.2ab 7.2c 7.6b a ab bc T7 3.54b 3.53b 3.50b 7.6ab 7.1 be 6.9b c ab a T ab 3.56 ab 3.48b 7.9ab 7.3c 7.5 b b ab a T9 3.53b 3.56 ab 3.51 b 6.7 c 8.3b 6.8 b b 1O.60b a Significance * * * * * * * * * *C-control (no-irrigated); Tl-T3 - irrigation treatments applied at fruit set (100,50 and 25% of ETc); T4-T6 irrigation treatments applied at lag phase (100,50 and 25% of ETc); and T7-T9 irrigation treatments applied at veraison (100,50 and 25% of ETc). *,**,***,****, ns: Significant at p ~ 0.05, 0.01,0.001,0.0001, or not significant, respectively. Letters within columns represent means separated at p ~ 0.05, Duncan's multiple range test. Boldfaced data indicate those values significantly greater than the control using Dunnett's t-test; boldfaced and underlined data are significantly less than the control 118
141 Table 3b-6. Impact of irrigation treatments on Baco noir wine color and phenolic composition, Lambert Vineyards, Niagara-onthe-Lake, ON, Total phenols Hue Color density Anthocyanins (mgil) (mgil ~allic acid eguiv.) Treatment C 0.51 b 0.56 b 0.77 a 13.1 c 1O.6c 17.9a c b c bc a c T b 0.56b 0.69b 10.2 e 9.8c 14.5c b b d c b d T a 0.71 a 0.61 c 13.1 c 11.2b 15.9bc a ab e b b d T3 0.56b 0.48 c 0.72 ab 14.4 b 1O.1c 14.1b ab d c b c c T ab 0.76 a 0.79 a 12.5 d 7.1d 13.5bc ab ab a a b ab T5 0.52b 0.78 a 0.72 ab 14.7 b 1O.1c 14.9bc ab ab b a b a T ab 0.79 a 0.78 a 15.2 ab 11.4b 18.6a ab a a ab a b T a 0.75 a 0.71 b 17.3 a 12.6a 13.1c a a b b b ab T8 0.49b 0.52b 0.73 ab 15.6 ab 11.1b 12.9c d c b be ab e T a 0.46c 0.69 b 14.3b 12.4a 16.5b a d b ab ab a Significance * * * *** * * *** *** *** *** *** *** *C-control (no-irrigated); Tl-T3 - irrigation treatments applied at fruit set (100,50 and 25% of ETc); T4-T6 irrigation treatments applied at lag phase (100,50 and 25% of ETc); and T7-T9 irrigation treatments applied at veraison (100,50 and 25% of ETc). *,**,***,****, ns: Significant at P.$ 0.05, 0.01,0.001,0.0001, or not significant, respectively. Letters within columns represent means separated at P.$ 0.05, Duncan's multiple range test. Boldfaced data indicate those values significantly greater than the control using Dunnett's t-test; boldfaced and underlined data are significantly less. 119
142 Table 3b-7. Comparison of mean sensory scores among irrigation treatments of Baco noir wines, Lambert Vineyards, Niagara-on-the Lake, ON, Variable Aroma T2 T3 T4 TS T6 T7 T8 T9 PDF Dark fruit 3.8a 0.ge l.sb 2.lab 1.7b 2.9ab 0.8e 1.8b 1.6b 2.6ab Red fruit 2.3b 2.1b 1.9b l.1e l.1e 2.9a 2.8a 1.9b 2.1b 2.6ab Prune 1.8b l.1e l.5be 1.9b 1.3e 2.3a 1.9b 1.4be 2.1a 1.6be Chocolate 0.9b 0.8b 0.6e 0.7e l.1ab 1.2ab 1.6a 1.9a 0.7e 1.6a O.OSI Black pepper 1.8ab l.1e l.sb 1.9ab 1.3e 2.3a 1.9ab 1.4be 2.1a 1.6b Cooked vegetable O.Se 2Aab 0.9be OAe 1.8b 0.6e 0.8be 2.9a 0.8be 0.6e Green pepper 0.9be 3.2a 2.9a 0.8be 1.2be 0.6e 0.Se2 2.8a 2.1b OAe Flavor/mouthfeel DARK FRUIT 2.1b 1.9b 1.7b 0.6e 1.4be 2.Sa 0.7e 1.6be l.sbe OAe <0.001 RED FRUIT 2.6b 2.6b 2.9b 2.9b 3.7a 2.9b 2.8b 2.7b 2.9b 3.1ab PRUNE 2Aa 2.1a 2.Sa 2.3a 2.6a 2.Sa 2.6a 2Aa 2.Sa 2.6a 0.S21 BLACK PEPPER 1.9a 1.6b 1.8ab 1.9a 1.7b 1.6b 1.9a 2.1a 2.2a 2.0a 0.OS3 COOKED VEGETABLE O.Se O.3e 1.6b 0.2e 0.9be 1.2be 0.8be 2.1a 0.8e 0.6e GREEN PEPPER 1.2e 3.1a 2.9a l.se 2.9a 1.9b 1.8b 1.9b l.sbe 1.4be ACIDITY 2.2b 2.6a 2.1b 2Aab 2.6a 2.8a 2.4ab 2.6a 2.3ab 1.8e BITTERNESS 0.9a 0.8a O.Sa 0.6a 0.6a 0.6a 0.6a O.Sb O.Sb O.3b ASTRINGENCY 0.7b OAe 0.6b 0.6a 1.7a OAe OAe 0.6b 0.8b 0.6b COLOR 3.Sa l.1e 1.2e 2Ab 0.ge 1.3e 2.9a 2.Sab 2.9a 3.2a *C-control (non-irrigated); Tl-T3 - irrigation treatments applied at fruit set (100, 50 and 25% of ETc); T4-T6 irrigation treatments applied at lag phase (100,50 and 25% of ETc); and T7-T9 irrigation treatments applied at veraison (100,50 and 25% of ETc). Means within rows with different letters are significantly different, Duncan's multiple range test. 120
143 Table 3b-8. Comparison of mean sensory scores among irrigation treatments of Baco noir wines, Lambert Vineyards, Niagara-onthe Lake, ON, Irrigation Treatments Variable I Tl T2 T3 T4 T5 T6 T7 T8 T9 C Pr>F Aroma Dark fruit 2.9a 1.7c 1.3c 2.4b 1.7b 2.lb 3.2a 2.4b 2.8a 3.2a Red fruit 2.1c 1.9c 3.3ab 3.6a 2.6b 3.9a 2.7ab 2.8ab 3ab 2.5b Jammy 3.6ab 2.5b 3.8a 3.4ab 2.1b 3.8a 4.1a 2.7b 2.5b 2.3b Prune 3.1c 2.9c 3.5b 3.7b 2.5c 4.0ab 4.7a 4.2ab 4.8a 4.5a Chocolate 2.3bc 1.3c 1.lc 3.9a 2.9b 3.4ab 3.8a 1.5c 3.2ab 3.4ab Sour cherry 1.7c 4.3a 4.2a 2.8b 3.8a 3.6a 2.6b 3.6a 3.4ab 2.3c <0.001 Cooked vegetable 0.9c 2.7a 1.8b 1.lc 2.3a 1.8b l.5bc 2.6a l.8b l.2c Tobacco l.4b O.4c O.4c 2.6a 0.5c 2.6a 2.7a 2.3a 2.6a l.9b Flavor/mouthfeel DARK FRUIT 2.1b lbc 0.6c 2.6ab l.2bc 3.7a 2.7ab 3.0ab 3.3ab 3.7a <0.001 RED FRUIT 1.3c 3.4a 3.2a 2.1b 3.2a 2.4b 1.6c 3.2a 2.2b 2.3b JAMMY 2.6b 1c 3.9a 3.0ab 1.3c 3.5ab 3.3ab l.4c 3.9a 4a PRUNE 2.1b 0.7c 0.9c 2.5ab 0.7c 2.9a 3a 0.8c 3.7a 2.9a CHOCOLATE 1.8b 1.5b 0.7c 2.6a 1.9b 2.9a 2.7a 0.9c 2.9a 3.2a SOUR CHERRY 2.1c 2.6b 3.5a 3.0a 2.6b 3.4a 2.5b 2.9a 3.2a 2.5b COOKED VEGETABLE 0.9c 3.2a 2.0bc 1.3c 2.7b 1.3c 1.lc 2.8b 1.8bc 1.0c TOBACCO 1.9bc l.4c 2.8b 2.5b 2.3bc 3.5a 2.8b l.4c 3.1a 3.4a ACIDITY 4.1b 5.7a 4.9ab 4.3b 5.6a 5.2ab 4.5b 6.0a 5.2ab 4.4b BITTERNESS 1.6b 2.0ab 1.9ab 2.0a 2.7a 2.7a l.9a 2.5ab 2.8a 1.8ab ASTRINGENCY 0.9b 1.8ab 1.2ab l.ob 2.0a 1.3ba 0.9b l.8a 1.6ba 1.lb COLOR 4.2a 1.2c 1.8bc 3.8a 1.5c 2.8b 3.6a 1.6c 2.4b 4.1a <0.001 *C-control (non-irrigated); Tl-T3 - irrigation treatments applied at fruit set (l00, 50 and 25% of ETc); T4-T6 irrigation treatments applied at lag phase (100, 50 and 25% of ETc); and T7-T9 irrigation treatments applied at veraison (100,50 and 25% of ETc). Means within rows with different letters are significantly different, Duncan's multiple range test. 121
144 List of Figures Figure 3b-l. Radar diagram of the mean intensity ratings of four Baco noir wines made from different irrigation treatments, Lambert Vineyards, Niagara-on-the-Lake, ON. (C-control, Setirrigation initiated at fruit set). 100, 50, and 25 represent percentage of water replaced. A and B represent 2006 and 2007 vintages, respectively. Aroma and flavor attributes are specified by lower and higher case letters respectively. Figure 3b-2. Radar diagram of the mean intensity ratings of four Baco noir wines made from different irrigation treatments, Lambert Vineyards, Niagara-on-the-Lake, ON. (C-control, Lagirrigation initiated at lag phase). 100, 50, and 25 represent percentage of water replaced. A and B represent 2006 and 2007 vintages, respectively. Aroma and flavor attributes are specified by lower and higher case letters respectively Figure 3b-3. Radar diagram of the mean intensity ratings of four Baco noir wines made from different irrigation treatments, Lambert Vineyards, Niagara-on-the-Lake, ON. (C-control, Ver. irrigation initiated at veraison). 100, 50, and 25 represent percentage of water replaced. A and B represent 2006 and 2007 vintages, respectively. Aroma and flavor attributes are specified by lower and higher case letters respectively Figure 3b-4. Principal component analysis (Fl&F2) of mean sensory data for wines from ten irrigation treatments imposed on Baco noir vines from Lambert Vineyards, Niagara-on-the Lake, ON, Set, Lag and Ver. are the initiation times of irrigation (fruit set, lag phase and veraison). 100, 50 and 25 represent percentage ofthe water replaced in the soil through irrigation. Aroma and flavor attributes are specified by lower and higher case letters respectively. Figure 3b-5. Principal component analysis (Fl&F2) of mean sensory data for wines from ten irrigation treatments imposed on Baco noir vines from Lambert Vineyards, Niagara-on-the Lake, ON, Set, Lag and Veraison are the time for irrigation imposition and 100,50 and 25 represent percentage of the water replaced in the soil through irrigation. Aroma and flavor attributes are specified by lower and higher case letters respectively Figure 3b-6. PLS analysis of soil water status, physiological data, yield components, berry and wine chemical composition means from ten irrigation treatments on Baco noir vines from Lambert Vineyards, Niagara-on-the-Lake, ON, Set, Lag and Veraison are the time for irrigation imposition and 100,50 and 25 represent percentage of the water replaced in the soil through irrigation. Figure 3b-7. Principal component analysis [A (Fl&F2) and B (F2&F3)] of the profile soil water status, vine physiological data, and berry/wine composition means (10 vines x three shoots x three leaves x three replicates) frornten irrigation treatments on Baco noir vines from Lambert Vineyards, Niagara-on-the-Lake, ON, C-control while S, L and V are irrigation imposition times (fruit set, lag phase and veraison).100, 50 and 25 represent percentage of the water replaced in the soil through irrigation. Figure 3b-S. PLS analysis of soil water status, physiological data, yield components, berry and wine chemical composition means for ten irrigation treatments on Baco noir vines from Lambert Vineyards, Niagara-on-the-Lake, ON, Set, Lag and Veraison are the time for irrigation imposition and 100,50 and 25 represent percentage of the water replaced in the.soil through irrigation. 122
145 Figure 3b-9. Principal component analysis (Fl&F2) of the soil water status and physiological data means (10 vines x three shoots x three leaves x three replicates) from ten irrigation treatments of Baco noir vines from Lambert Vineyards, Niagara-on-the-Lake, ON, C-control while S, L and V are irrigation imposition times (fruit set, lag phase and veraison).100, 50 and 25 represent percentage of the water replaced in the soil through irrigation. Figure 3b-1O. PLS analysis of soil water status, physiological data, yield components, berry and wine chemical composition means from ten irrigation treatments of Baco noir vines from Lambert Vineyards, Niagara-on-the-Lake, ON, Set, Lag and Veraison are the time for irrigation imposition and 100,50 and 25 represent percentage of the water replaced in the soil through irrigation. 123
146 Dark Fruit** COLOR** _- ACIDITY ~~~.~ \ COOKED VEGI* ~~~~;:tj11l Chocolate Green pepper** -C -+- looset... SOSet SSet _._._._---_.._ _... _....._..._ A..._ _....._._ _._ Jammy fruit** COLOR**** _ _ Dark Fruit* TOBACCO** CHOCOLATE** Sour cherry*** Cooked vegi* Chocolate** -C -.-looset... SOSet... 2SSet PRUNE* DARK FRUIT*** RED FRUIT* ~ ~B Figure 3b-l. Radar diagram of the mean intensity ratings of four Baco noir wines made from different irrigation treatments, Lambert Vineyards, Niagara-on-the-Lake, ON. (C-control, Set- irrigation initiated at fruit set). 100, 50, and 25 represent percentage of water replaced. A and B represent2006 and 2007 vintage, respectively. Aroma and flavor attributes are specified by lower and higher case letters respectively. 124
147 Dark Fruit** _~ Red Fruit* BITIERNESS ACIDITY i"!'... COOKED VEGI* I ~~I4+-t-Tln Chocolate I Green pepper** -C Lag... SOLag SLag RED FRUIT A Sour cherry*** TOBACCO* *!--+-f-'4l:-1ti~-+~~~lil4l'--t-r----t-----i Cooked vegi* CHOCOLATE** Chocolate** -C Lag -. SOLag --.a.-- 2SLag... B Figure 3b-2. Radar diagram of the mean intensity ratings of four Baco noir wines made from different irrigation treatments, Lambert Vineyards, Niagara-on-the-Lake, ON. (C-control, Lag- irrigation initiated at lag phase). 100, 50, and 25 represent percentage of water replaced. A and B represent 2006 and 2007 vintages, respectively. Aroma and flavor attributes are specified by lower and higher case letters respectively. 125
148 Jammy fruit** COLOR**** - Dark Fruit* Sour cherry*** TOBACCO** Cooked vegi * -C -+-loover... SOVer CHOCOLATE** Chocolate** SVer RED FRUIT* L ~A Dark Fruit** ACIDITY H~.. aiil,; COOKED VEGI* ~~~~~rir-rn Chocolate Green pepper** -C -+-loover... SOVer SVer BLACK PEPPER RED FRUIT DARK FRUIT** B Figure 3b-3. Radar diagram of the mean intensity ratings of four Baco noir wines made from different irrigation treatments, Lambert Vineyards, Niagara-on-the-Lake, ON. (C-control, Ver.- irrigation initiated at veraison). 100, 50, and 25 represent percentage of water replaced. A and B represent 2006 and 2007 vintages, respectively. Aroma and flavor attributes are specified by lower and higher case letters respectively. 126
 looset 4 100Ver 5 'i M o:t ai 1 0.75 0.5 0.25 0 -... I'll u.. -0.2S\E -0.5 Variables (axes F1 and F2: 52.36 %) ASTRIN ENCY per egi -0.75-1 -1-0.75-0.5-0.25 o 0.25 0.5 Fl (32.93 %) 0.")
149 Observations (axes F1 and F2: %) 4 3 2SSet.1Oolag -?fi. 1 M ~ en N u , 2SVer SOVer.. C SOSet SOlag 2Slag F1 (32.93 %) looset 4 100Ver 5 'i M o:t ai I'll u S\E -0.5 Variables (axes F1 and F2: %) ASTRIN ENCY per egi o Fl (32.93 %) Figure 3b-4. Principal component analysis (FI&F2) of mean sensory data for wines from ten irrigation treatments imposed on Baco noir vines from Lambert Vineyards, Niagara-oncthe-Lake, ON, Set, Lag and Ver. are the initiation times of irrigation (fruit set, lag phase and veraison). 100, 50 and 25 represent percentage oithe water replaced in the soil through irrigation. Aroma and flavor attributes are specified by lower and higher case letters respectively. 127
 C 50L~~ 50Ver -2-1 0 1 Fl (52.72 %) L.")
 of mean sensory data for wines from ten irrigation treatments imposed on Baco noir vines from Lambert Vineyards; Niagara-on-the-Lake; ON, 2007. Set, Lag and Ver.")
150 _._ , ~ 0'1 0 f"! 0!::! N u Variables (axes F1 and F2: %) F1 (52.72 %) ~ ~ 0 0'1 N ci -1!::!. N LL Lag. 25Ver 4-3 Observations (axes F1 and F2: %) C 50L~~ 50Ver Fl (52.72 %) L. 50Set Ver...100Lag 4 100Set 5 6 Figure 3b-5. Principal component analysis (Fl&F2) of mean sensory data for wines from ten irrigation treatments imposed on Baco noir vines from Lambert Vineyards; Niagara-on-the-Lake; ON, Set, Lag and Ver. are the time for irrigation imposition (fruit set, lag phase and veraison) and 100, 50 and25 represent percentage of the water replaced in the soil through irrigation. Aroma and flavor attributes are specified by lower and higher case letters respectively. 128

, C.W.(cluster weight), Anth-G and -W(anthocyanins concentration in berries and wine, respectively), B/C (number of berries per cluster), C.")
151 Correlations with t on axes t1 and t N t1 Figure 3b-6. PLS analysis of soil water status, physiological data, yield components, berry and wine chemical composition means from ten irrigation treatments of Baco noir from Lambert Vineyards, Niagara-on-the-Lake, ON, Set (5), Lag (L) and Veraison (V) represent time for irrigation imposition and 100, 50 and 25 represent percentage of the water replaced in the soil through irrigation. Abbreviations used: T.Ph.-G and -W (total phenols in berries and wine, respectively), C.W.(cluster weight), Anth-G and -W(anthocyanins concentration in berries and wine, respectively), B/C (number of berries per cluster), C.D.-G and -W (color intensity of juice and wine, respectively), TA-G and -W (titratable acidity in berries and wine, respectively), V (vine size), Ts (transpiration), LWP (leaf water potential), S.M. (soil moisture). 129
 B Figure 3b-7.")
![Principal component analysis [A (Fl &F2) and B (F2&F3)] of soil water status, vine physiological data, and berry/wine composition means (10 vines x three shoots x three leaves x three replicates)](/docs-images/91/106101215/images/152-1.jpg "from ten irrigation treatments of Baco noir vines from Lambert Vineyards, Niagara-on-the-Lake, ON, 2006. C-control while Set (S), Lag (L) and Veraison (V) represent time for irrigation imposition.")
, Anth~G and -W( anthocyanins concentration in berries and wine, respectively), B/C (number of berries per cluster), C.D.")
152 10 Biplot (axes F1 and F2: %) L2S. Anth.-W 5 ~ an.-i CXI 0.-i -N u.. -5 F VZS Fl (30.21 %) A Biplot (axes F2 and F3: %) 8 B.W. 3 V25& - '#. & \0 "'! an!:!. -2 m u & & LF o 5 10 F2 (18.15 %) B Figure 3b-7. Principal component analysis [A (Fl &F2) and B (F2&F3)] of soil water status, vine physiological data, and berry/wine composition means (10 vines x three shoots x three leaves x three replicates) from ten irrigation treatments of Baco noir vines from Lambert Vineyards, Niagara-on-the-Lake, ON, C-control while Set (S), Lag (L) and Veraison (V) represent time for irrigation imposition. 100,50 and 25 represent percentage of the water replaced in the soil through irrigation. Abbreviations used: T.Ph.-G and -W (total phenols in berries and wine, respectively), C.W.(cluster.weight), Anth~G and -W( anthocyanins concentration in berries and wine, respectively), B/C (number of berries per cluster), C.D.-G and -W ( color intensity of juice and wine, respectively), TA-G and -W (titratable acidity in berries and wine, respectively), V (vigor), T (transpiration), LWP (leaf water potential), S.M. (soil moisture). 130

, C.W.")
153 Correlations with t on axes t1 and t2 ASTRINGENCY ~ 0.25 N 0 +'" o t1 Figure 3b-8. PLS analysis of soil water status, physiological data, yield components, berry and wine chemical composition means from ten irrigation treatments of Baco noir vines from Lambert Vineyards, Niagara-on-the Lake, ON, Set (S), Lag (L) and Veraison (V) represent time for irrigation imposition and 100,50 and 25 represent percentage of the water replaced in the soil through irrigation. Abbreviations used: T.Ph.-G and-w (total phenols in berries and wine, respectively), C.W.(cluster weight), Anth-G and -W( anthocyanins concentration in berries and wine, respectively), B/C (number of berries per cluster), C.D.-G and -W (color intensity of juice and wine, respectively), TA-G and -W (titratable acidity in berries and wine, respectively), V (vine size), T (transpiration), LWP (leaf water potential), S.M. (soil moisture at 10,20,30,40,60, 100 cm), ETOH (ethanol), Y (yield), Tleaf (leaf temperature). 131
 14 19 Figure 3b-9.")
154 Biplot (axes F2 and F3: %) 8 ~ ~ ID iii ~ M LL 3-2 S VF o F2 (20.22 %) Biplot (axes F1 and F2: %) 10 5 Anth.-W Hue-Will". Anth.-G III \\ T.Ph.-W.. II\\ L25. T. Ph.-G ~ N N c:i 0 ~ N LL -5 V2 ETOH Fl (35.71 %) Figure 3b-9. Principal component analysis (F1&F2) of the profile soil water status and physiological data means (10 vines x three shoots x three leaves x three replicates) from ten irrigation treatments of Baco noir vines from Lambert Vineyards, Niagara-on-the-Lake, ON, C-control while Set (S), Lag (L) and Veraison (V) represent time for irrigation imposition. F-100, 50 and 25 represent percentage of the water replaced in the soil through irrigation. Abbreviations used: T.Ph.-G and -W (total phenols in berries and wine, respectively), C.W.(cluster weight), Anth -G and -We anthocyanins concentration in berries and wine, respectively), B/C (number of berries per cluster), C.D.-G and -W (color intensity of juice and wine,respectively), TA-G and -W (titratable acidity in berries and wine, respectively), V (vine size), T (transpiration), LWP (leaf water potential), S.M. (soil moisture at 10,20,30, 40,60, 100 cm), ETOH (ethanol),y (yield), T1eaf(leaftemperature). 132

, Lag (L) and Veraison (V) represent time for irrigation imposition and 100,50 and 25 represent percentage of the water")
, CN (number of clusters per vine), Anth - G and -W( anthocyanins concentration in berries and wine, respectively),")
, TA-G and -W (titratable acidity in berries and wine, respectively), V")
155 1 Correlations with t on axes t1 and t ~ o t1 Figure 3b-1O. PLS analysis of soil water status, physiological data, yield components, berry and wine chemical composition means from ten irrigation treatments of Baco noir vines from Lambert Vineyards, Niagara-on-the Lake, ON, Set (S), Lag (L) and Veraison (V) represent time for irrigation imposition and 100,50 and 25 represent percentage of the water replaced in the soil through irrigation. Abbreviations used: T.Ph.-G and-w (total phenols in berries and wine, respectively), C.W.(cluster weight), CN (number of clusters per vine), Anth - G and -W( anthocyanins concentration in berries and wine, respectively), B/C (number of berries per cluster), C.D.-G and -W (color intensity of juice and wine, respectively), TA-G and -W (titratable acidity in berries and wine, respectively), V (vine size), T (transpiration), LWP (leaf water potential), S.M. (soil moisture at 10,20, 30, 40,60,100 cm), ETOH (ethanol), Y (yield), T1eaf(leaftemperature). 133
156 Chapter 4 Impacts of Irrigation Level and Time of Imposition on Vine Physiology, Yield Components, Fruit Composition and Wine Quality on Chardonnay (Vitis vinifera L.) in a Cool Climate Area Abstract. An irrigation trial was carried out in a commercial vineyard block located in Niagara-on-the-Lake, Ontario, Canada, between 2005 and The response of Chardonnay vines to three irrigation levels based on % of crop evapotranspiration (ETc) [two deficit water regimes (50% ETc and 25% ETc) plus 100% ETc] combined with two times of irrigation imposition (fruit set and veraison) was studied. The control was non-irrigated. Volume of water applied at each irrigation time was calculated based on ETa values derived by the FAO Penman-Monteith equation. In 2006, in treatments imposed veraison soil moisture followed the same trend as those imposed at fruit set, while In 2007 the treatments imposed at veraison showed lower moisture than those imposed at fruit set. Plant water status was assessed by measuring transpiration (Ts) rate and leaf water potential (41). Ts followed the same trend as soil moisture in 2006, with the greatest difference between treatments in July and early August, but minimal differences by the end of August. In 2007, Ts declined until the end of August, which coincided with the highest daily temperature and light intensity. The 25% ETc treatments imposed at fruit set did not differ from the control in all aspects of soil and plant water status, while the 1 00% ETc had consistently higher soil and vine water status compare to the control. In terms of yield components, almost all treatments showed variation compared to the control in The irrigated treatments had higher values compare to the control for most of the variable measured in Shoot growth rate showed the same trend in all years. The irrigated treatments had constantly higher growth rates compare to the control, however these were lower in RDI treatments compare to 100% ETc. Variation was also found on vine vigor, mostly in The multivariate analysis showed that soil and plant water status were well correlated. Medium water deficits in the soil were highly correlated with positive sensory attributes (varietal typicity) in the wines. Intensity of flavor and aroma attributes was highly associated with the degree of water deficit. The 50% ETc and 25% ETc treatments improved vine physiology overall, even in years when only short periods of drought occurred in the vineyard, while sensory profiles were impacted in a positive way. Due to high variability in weather conditions over the study period, no trends between irrigation and grape composition were consistently found. Introduction Wateris a major factor affecting both yield and composition of wine grapes in hot and dry regions (Wample and Smithyman 2002). In recent years, water deficits have occurred in cool climate wine regions as well (Reynolds et al. 2009, VanLeeuwen and Seguin 2006, Zs6fi et al. 2009). In moderate temperate climates, grapevines often face some degree of drought stress during the growing season (Morlat et al. 1992). Applying water to table grapes is not a topic of debate among the grape growers, but applying irrigation to winegrapes is still controversial among not only winemakers but also grape growers. 134
157 Some studies on climatic data generated different scenarios regarding the potential impact of climate change on viticulture. Moderate global temperature increases of 1.6 C between 2000 and 2050 and 3.4 C between 2000 and 2100 have been predicted (Dai et al. 2001). Regional climate models show poor reliability with respect to different climate trends (storms, flood, and hail) but high in respect of future temperature trends and precipitation. However, since most of the climate assessment models generate scenarios rather than prediction, the global warming phenomenon could increase the frequency of extreme meteorological events (dry and hot seasons alternating with wet and cool seasons). This phenomenon has been seen often in the last decade in Niagara Peninsula, Ontario, where dry and hot seasons occurred in three out of the past five vintages. This phenomenon is accompanied by a change in rainfall distribution over the year. In some years, even if the annual rainfall remains constant, the vineyards are subjected to prolonged drought during the growing season because of changing of its pattern distribution. These facts have caused the wine industry to reconsider using irrigation in the Niagara Peninsula vineyards. Too much water has the same negative effect on grape quality as lack of moisture in the soil profile (Van Leeuwen and Seguin 1994). This fact raised some questions about when to apply and how much water to use in order to obtain premium wines. This requires knowledge on cultivar, water requirements, yield and quality responses to water, the constraints specific to each irrigation method and equipment, the limitations relative to the water supply system, and the financial and economic implications of the irrigation practice. Severe water stress applied to container-grown vines of Cabernet franc reduced yield by 94% because of lower berries per cluster and reduced berry weight (Hardie and Considine 1976). Greater yield losses occur as a result of water deficit during early stages of berry development compared with deficits later in the season (Hardie and Considine 1976, Myburgh 2003). Yield losses occurred due to water deficits in Cabernet Sauvignon, and this was explained by the changes in berry growth patterns (Matthews and Anderson 1989). Vine water status also influences the bud fertility either directly by the amount of water available for biosynthetic processes occurring during cell division and cell enlargement or indirectly via its effect on vine photosynthesis (Loveys and Kriedemann 1973, Smithyman et al. 2001), nutrient uptake, and microclimate surrounding the bud (Dry and Loveys 1998). Periodic measurements of soil water status are usually conducted for detection of vine water stress (Martin et al. 1990). However, under drip irrigation, one point measurement of soil water content is not representative, and many measurements are needed to be done in order to interpret soil moisture of the wettest zone beneath the dripper (Myburgh 1996). To determine the 135
158 influence of environmental and cultural conditions on vine water status, a sensitive physiological indicator that integrates both soil and climatic conditions is required in the application of regulated deficit irrigatien (RDI) (Chone et al. 2001). Therefore, physiological indicators of plant water status showed potential as accurate water stress indicators (Goldhammer et al. 1999, Selles and Berger 1990). Leaf water potential ('!'), and most recently, stem '!', measured at midday with a pressure chamber, have been proposed as standard parameters to determine the plant water status for irrigation scheduling of fruit trees (Fereres and Goldhammer 2003, Naor 2001, Shackel et al. 1997). Water deficits impaire shoot growth (Vaadia and Kasimatis 1961) to a point where differentiation of inflorescence primordia is affected (Buttrose 1974a). Excess irrigation promotes unwanted shoot growth to a point where light levels in the renewal zone limit bud differentiation (Carbonneau and Casteran 1979). Bud fruitfulness or yield per bud depends on the number of clusters initiated during the previous season, the number of flowers developed early in the spring, the number of berries set, and the size of individual berries. Most studies indicate that early water deficits have more inhibitory effect on bud fruitfulness than late season deficits (Matthews and Anderson 1989, Myburgh 2003). Early-season water stress affects both cell division and cell enlargement in the developing berry, thus decreasing berry size (Matthews and Anderson 1989). Persistent water stress depresses the fruitfulness of latent buds through a reduction of the number and size of inflorescence primordia (A11eweldt and Hofacker 1975, Buttrose 1974b, Winkler et al. 1974). Critical stages of flower formation are the induction, initiation, early differentiation during season one, and differentiation at budburst during season two. An inadequate water supply at any stage of the productive cycle of grape limits the production and the quality of the fruit, particularly between flowering and veraison (Peacock et al. 2000). A combination of warm temperatures, sufficient illumination of the bud, and absence of water stress are required for optimum initiation (Buttrose 1970, Dunn and Martin 2000, Kliewer 1975, Moncur et al. 1989, Petrie and Clingeleffer 2005, Zelleke and Kliewer 1979). Environmental factors exert their influence on flowering by modifying the internal chemical composition of the plant, particularly the balance of endogenous hormones, and also via their impact on vine photosynthesis (Vasconcelos et al. 2009). Berry size reduction enhances the skin/pulp ratio, which provides a more abundant polyphenolic source (Peterlunger et al. 2002). This could be also true for white aromatic cultivars, which have most of their volatiles in the skin. Monoterpene concentration increased in Gewfuztraminer vines with deficits irrigation imposed late during veraison compared to vines with deficit irrigation regimes imposed early at post bloom or lag phase (Reynolds and Wardle 1997). 136
159 Aroma is one of the most important attributes for wine quality. The volatile compositional differences in grapes induced bywater status directly affected the aroma composition of the wines (Matthews et al. 1990, Qian et al. 2009). Under non-drought conditions, slight water stress seems to improve wine quality. Vine water stress has been reported to increase the concentration of aroma glycosides of grapes (Bravdo and Shoseyov 2000, Koundouras et al. 2006). The glycoside bound aroma compounds are released during fermentation or aging, and contribute to varietal aroma and wine quality. C 13 norisoprenoids contribute to complex aromas, including berry, honey, and fruity in many white and red wines. The total concentration of all measured C 13 norisoprenoids in wines is highly related to vine irrigation condition and vintage (Qian et al. 2009). Chardonnay is the most widely planted white Vitis vinifera L. winegrape cultivar in Ontario, exceeding Riesling, with a production of 6292 tonnes in 2009 ( Chardonnay is a cultivar with a short growth cycle and small clusters, originating from the humid and temperate region of Burgundy (France). Applying irrigation to Chardonnay in the Niagara Peninsula early in the season but ceasing it at different phenological stages showed an overall benefit on fruit composition, especially in very dry seasons (Reynolds et al. 2007). In the Niagara Peninsula, grapevines are usually confronted with drought conditions between fruit set and veraison, but often these conditions extend into the ripening process (Reynolds et al. 2007). The purpose of this research was to study the effect of different irrigation regimes and time of imposed irrigation on general vine physiology, yield components, fruit composition and the sensory attributes of Chardonnay. It was hypothesized that applying deficit irrigation at fruit set or not until veraison would improve fruit composition Without a significant change in yield, and with additional benefits of increasing the intensity of positive aroma and flavor attributes (varietal typicity). This study also endeavored to find out how variations in soil moisture at various depths affect yield and fruit composition of irrigated grapes in a geographical area which is considered to be cool and humid. Materials and Methods Experimental design and plant material. The trials were conducted at Lambert Vineyards, Niagara-on-the-Lake, ON, (43 13' N, 79 08' W). The experiment was set up in 2005, in 13 year old Chardonnay grafted to C3309 (V. riparia xv. rupestris) rootstock. Vines were 137
160 spaced 1.5 m (between vines) by 2.4 m (between rows) and trained to a Scott Henry system. Rows were 198 m long, and oriented north to south. Vines were drip irrigated using ~ drip (Netafim Inc., Fresno, California, USA). Each drip pipe was placed on the ground. Drippers with a flow rate of 1.5 Uh were spaced at 0.6 m. Water source was the municipal water network. A randomized complete block design was used and divided into three blocks where each treatment replicate corresponded to a row, with the outside rows used as buffers. Seven treatments were assigned randomly to each block, and 10 equally distributed vines were chosen for data collection in each row. Treatments were as follows: control-no irrigation, 100 %, 50 % or 25 % ETc (replacement water lost through evapotranspiration) combined with an early start (irrigation began at fruit set) and late start (irrigation began at veraison). The soil series was Chinguacousy clay loam where generalized characteristics were as follows: a gleyed brunisolic gray brown luvisol with imperfect drainage (7 to 9 L/h); wilting point of the Ap horizon (0 to 27 cm) was 13.3% moisture; field capacity was 27.3 % moisture; bulk density ranged from 1.25 glcm 2 in horizon A to 1.69 glcm 2 in horizon C (Kingston and Presant 1989). The whole block had a tile drainage system, with tiles placed at a 60 cm depth in the middle of each inter-row space (2.4 m). Soil management consisted of mowed sod row middles with ~ 1.0 m herbicided strips under the vines. Water was applied weekly as prescribed through individual valves installed at the end of each row. First treatments included 100% ETc, and the two RDI (50% ETc and 25% ETc) were initiated at fruit set, which for the period studied occurred in the last week of June - frrst week of July. Due to inconsistent peak water consumption during July-August, the irrigation treatments were scheduled on 1 to 2 day intervals and at different times during the day in order to ensure a constant pressure. The volume of irrigation water to be applied was determined each week according to the previous week's total ETo that was calculated based on the Penman-Monteith equation (Allen et al. 1998). ETo was adjusted to ETc value using a crop coefficient that variedover the season (0.23 to 0.71), and was calculated based on canopy volume (peacock et al.1987, Williams 2001). Precipitation> 12 mmlweek was subtracted from ETc, each week. In order to calculate the actual amount of water required by the vines in Llvine/day, equations developed by Vander Gulik (1987) were used. The time required to refill the soil with the amount of water needed for each treatment was determined by dividing the total amount calculated for each treatment row to the total amount of water supplied by all drippers from one row. The mathematical steps taken to schedule irrigation applications were described in detail by Reynolds (2008). The meteorological data used in the Penman-Monteith equation (daily maximum, minimum and mean temperature; rainfall; relative humidity; solar radiation; wind speed) were 138
161 provided by Weather Innovation Network Inc. ( These data were downloaded from the nearest weather station (Virgil station, Niagara-on-the-Lake, ON). Fruit set irrigation treatments were initiated on 24 June (2005), 30 June (2006) and 21 June (2007). Veraison treatments started on 29 July (2005), 7 August (2006) and 28 July (2007). Soil water status. Soil moisture was assessed over a period of 4 years between 2005 and Data was collected from 10 vines per each-treatment replicate starting with one week before first irrigation treatment was imposed and biweekly thereafter. Data collection protocol and the equipment used were described in detail in Chapter 3a, as well as in Balint and Reynolds (2010). Vine water status. Biweekly observations were conducted over the growing season to monitor vine water status. Midday leaf water potential ('I') data were collected::::: 2 h each side of solar noon (between llooh and 1400h) from mature leaves that were fully exposed to the sun. The sampling and collecting data protocols were described in detail in Chapter 3a and in Balint and Reynolds (2010). Yield and vigor components. The experimental vines were harvested 1 to 2 days before of the commercial harvest date (the second or third week of September). The protocol for data collection was similar with that one described in detail in Chapter 3a. Winemaking. At harvest, 30 kg of fruit per treatment replicate (row) were transported at Brock University's winery facility. The grapes used for wine were harvest only from the recorded vines. Over 630 kg of grapes were processed into wines in two of four years of the experiment (2006 and 2007). Due to 2005 winter damage, there were insufficient volumes of grapes to process into wine. All wines were produced according to the following standard procedures. Grapes from each treatment replicate were de-stemmed, crushed and treated with S02 at 20mg/L, and then allowed 24 hr skin contact at 8 C. Each treatment replicate was pressed off individually in a basket bladder press (Enoagricola Rossi s.r.1, Calzolaro, PG, Italy)-at maximum 2 bars pressure and transferred to a 20-L carboy. All musts were transferred to 20-L glass carboys and sulfited to 40 mgll. Each treatment replicate was fermented in duplicate in 20-L glass carboys. Each treatment replicate was inoculated with Lalvin Bourgoblanc CY0379 (Saccharomyces cerevisiae) yeast (Lallemand Inc., Montreal, QB). During fermentation, all carboys were kept in one room where temperature was set at 17 C. Fermentation lasted between 10 and 14 days. When fermentation was completed in all the carboys, wines were racked and sulfited to 40 mg/l. After another 10 days at - 2 C for cold stabilization, all the wines were racked and stored at 6 C until bottling. All wines were bottled between January and February of the following year (::::: 3 to 4 months after 139
162 fermentation). Before bottling, they were racked one more time, free S02 was adjusted for each wine, and filtration took place using 0.45-)l pad and 0.2-')l cartridge filters. The experimental wines were bottled under cork and stored at 12 C in the CCOVI- Brock University wine cellar. Fruit and wine composition. Berry, must and wine samples were analyzed using similar protocols as those used for Baco noir cultivar. The aforementioned methods were described in Chapter 3b and in Balint and Reynolds (2010). Sensory analysis. Only wines from 2006 and 2007 vintages were subjected to sensory analysis, since in the 2005 vintage grapes were not collected due to the previous winter damage. The same sensory protocol was used for both 2006 and 2007 vintages. Each vintage was assessed after 18 months of ageing in the bottle. Sensory sessions occurred from April to June. Over 25 judges were involved in the sensory work over the 2 year period. The group was composed of Brock University faculty, staff, students from the viticulture and oenology program and two sommeliers. They were selected based on their availability and motivation. All of them were volunteers and had previously sensory training. A core of seven judges participated in both vintage assessments. The final panel used for descriptive analysis in each vintage consisted of 11 judges with ages ranging from 23 to 58. Discrimination test. A modified alternative forced choice test (5-AFC) was used to compare a control wine (non-irrigated) to each irrigation treatment to find differences between control and all others (O'Mahoney 1986). This was intended as a preliminary exercise to determine whether differences existed between treatments, what the basis for those differences might be, and whether the panelists were dependable. The protocol used in this test was similar with that one described in detail in Chapter 3b. Descriptive analysis. Six training sessions were run over a period of three weeks. For sensory training, the panelists tasted wines from all irrigation treatments. For training purpose, wines only from two field replicates were used. In each session, they tested four wines (nonirrigated, 100%,50% and 25% ETc from one particular irrigation initiation time). They were asked to find out any flavor or aroma attributes that describe the variability among them. The list with the descriptors was adjusted until all panelists agreed with definitions (Table 4.6). Following the first two sessions, the panelists were asked to compare all the wines with the control for each attribute collected. Reference standards were created to help the panelist understand how, to define and rate each attributes (Table 4.6). The references were also adjusted during the training session until everyone agreed that the reference was representative for that particular attribute (Table 4.6). 140
163 Following discussions with the panelists on the appropriate scale which should be used for data collection and with technical advice from Compusense Inc. (the software provider for the sensory laboratory) an unstructured scale with double way and verbal descriptions at the end points was used in order to collect sensory data. The control wine (non-irrigated) was anchored in the middle of a 15-cm long scale. The ends ofthe scale were anchored with verbal description: left (lowest) and right (highest). In each session, the control wine was assessed for each attribute. Panelists were instructed to use the line scale in order to aid in improving reliability and reproducibility in assessing attribute intensity. The panelists were asked during the training session to anchor each coded wine, on the left side of the scale if the intensity is lower than the control or right side if it is higher than the control A scale was used for each descriptor developed. They were also instructed to anchor the wine samples on the same place as the control, if no difference between control and the wine sample for one particular attribute will be found. All descriptors developed were assessed using the same scale. Data collection. Before starting data collection, each panelist had opportunity to run all the questions of the project, at one of the collection data station from the sensory laboratory. Data collection took place in the sensory laboratory at CCOVI (Brock University) using a computerized sensory software program (Compusense 5, Guelph, ON, Canada). Samples were evaluated in individual sensory booths under red light in order to mask wine hue. The seven wines [six treatments plus the control-non-irrigated from two field (fermentation) replicates] were assessed in four replicate sessions. In each session, all seven wines were evaluated in a randomized order. Each session had two flights. Each flight included four wine samples (the control-non-irrigated + 100%,50% and 25% ETc from one particular irrigation initiation time). Panelists rated the samples based on the list of attributes on an unstructured two way scale. They were asked to move the cursor left or right of the control anchor, in order to find out not only the intensity but also the direction (lower or higher) in which one variable explains the difference than the control. Panelists were asked to clean the palate with tap water after each sample, in order to prevent any carry over effect. In order to rest the palate and avoid any bias, 1 minute rest between each sample and 5 minutes rest after each group of four wines were included as part of the computerized evaluation session. Evaluations were started in the morning at 1100 h and continued until 1300 h. All wines were presented as 25-mL sample served in ISO tasting glasses, and coded with a three-digit random number. Each glass was covered with a Petri dish to prevent volatiles loss. Aroma. standards developed during the training session were prepared fresh and available for judges as reference prior each session. 141
164 Data analysis. Fruit and wine chemical data were analyzed using the SAS statistical package (SAS Institute; Cary, NC, USA). Using GLM, analysis of variance was performed. Duncan's multiple range test was used for means separation of all data sets (chemical and sensory data), and Dunnett's t-test was used to determine those treatment means that were different from the control at a significance level of a::;0.05. Sensory data were analyzed using XLSTAT version (Addinsoft, Paris, France). Analysis of variance was conducted on the intensity ratings with irrigation treatment, panelist, and replication with two-way interactions in the model. Principal components analysis (PCA) was performed on the means of field data, yield components, chemical data, and sensory scores of aroma and flavor descriptors for each year of the experiment. Partial least squares regression (PLS) was performed on the field, chemical, and sensory data in order to find out the relationship among these variables. Results and Discussion Weather summary. Climate data during the experimental period was described in detail in Chapter 3a. In 2005 due to a severe winter, the Chardonnay block had a high percentage of bud damage. As a result, no yield data was collected during the first year of the experiment. In this particular year only field data (plant and soil water status) was collected. The amount of water applied over the growing season in all four years of the experimental period was calculated using ETo derived from the Penman-Monteith equation. The amount of water applied clearly reflected the particular weather conditions of each year ofthe period studied (Table 4.1). In 2008, due to a high frequency of rainfall (Fig. 3A-2), irrigation was applied for only 2 weeks at the end of August (data not shown). Soil moisture measured by TDR (Fig. 4.1A to D). In 2005, soil moisture had values below wilting point throughout almost all the growing season (Fig. 4.1A). The highest magnitude of difference was found between 100% ETc and control. The small canopies due to the high winter damage coupled with high solar radiation caused the soil below the drip line being exposed longer to direct solar radiation. Thus, soil evaporation increased much more than usual. In 2006, soil moisture had overall higher values than in 2005, and the water content in the soil was between wilting point and field capacity throughout almost all the growing season. Early treatments irrigated at 100 and 50% ETc were higher than other treatments throughout almost the entire season. Soil moisture in late-imposed irrigation treatments followed the control trend throughout the period studied (Fig. 4.1B). The trend showed a peak at the end of July, and then slowly decreased reaching a minimum at the end of August. The peak in July was associated with the 142
165 highest frequency of rainfall in the period. Although, 2006 season was considered a wet year, irrigation treatments were applied throughout the season since the ET 0 calculated using Penman Monteith equation had high values, mainly due to high daily temperature and solar radiation. Although the soil moisture trend followed the rainfall frequency, the magnitude of difference between treatments was caused by the water applied through the irrigation. In 2007, the highest soil moisture values were found in the 100 and 50% ETc early-imposed treatments. All other treatments showed the same trend as the control but lower than this. Soil moisture values were often below wilting point for most treatments during the growing season (Fig. 4.1C). The 2008 season was very wet and cold. Since calculated ETo values were lower than average, soil moisture in the top 20 cm never dropped below the wilting point throughout the season. The soil moisture followed the same trend in all treatments with no differences among them, even in the last 3 weeks of August when irrigation was applied. Overall, soil moisture trend showed slightly decreasing values during the ripening period (Fig. 4.1D). The soil moisture data showed clear separation between irrigated treatments even in 2006 when the rainfall was higher than the normal. However, in 2008 when the amount of rainfall and its frequency was higher compare to the previous seasons, no separation between treatments was found. Soil moisture by Profile Probe (Fig. 4.2 to 4.4) 2006 (Fig. 4.2A to F). In 2006, all treatments had values above wilting point at the 10 cm depth (Fig. 4.2A). The trend was upward throughout the season with a maximum at beginning of August. At 20 cm depth, soil moisture showed little difference among the irrigated treatments. However, the highest magnitude of difference was found between full-irrigated early start treatment and the others (Fig. 4.2B). At 30 cm depth, soil moisture showed lower values for the control and late imposed treatments throughout the season than the early-imposed treatments. The irrigated treatments showed higher values for early-irrigated treatments except 25 % ETc (Fig. 4.2C). At 40 cm depth, soil moisture followed the same trend, and showed less variation than that one found at 30 cm. Differences among treatments were recorded at the end of July and beginning of August (Fig. 4.2D). At 60 cm depth, soil moisture showed values between 15 to 21 %. The trend was close to that one from 40 cm depth but the magnitude among treatments was lower (Fig. 4.2E). In 2006, soil moisture had values between 13.2 to 21.3%. There was a downward trend towards the beginning of August and then steady until the end of August. A clear separation between early treatment full water replacement (100% ETc) and all other irrigation treatments was recorded (Fig. 4.2F) (Fig. 4.3A to F). In 2007, there was a clear separation between early-irrigated full water replacement (100% ETc- fruit set) and the other treatments at 10 cm depth (Fig. 4.3A). At
166 cm depth, soil moisture showed lower values with a better separation among different irrigated treatments (Fig. 4.3B). The soil moisture at 30 cm depth had almost the same values for the nonirrigated treatments. The separation between early-irrigated treatments and the others was better reflected in the soil moisture (Fig. 4.3C). At 40 cm depth, the soil moisture showed lower values than in The magnitude between the early-imposed treatments and the others was higher than in 2006 following close to the trend at 30 cm depth (Fig. 4.3D). At 60 cm depth, soil moisture had lower values than those found in 2006, but the magnitude between treatments was higher showing a better separation between early-imposed treatments and the others (Fig. 4.3E).1n 2007, soil moisture at 100 cm depth showed a higher magnitude among all treatments when comparing to that one measured at the other depths. The trend was downward with a minimum at the end of August (Fig. 4.3F) (Fig. 4.4A to F). In 2008, soil moisture at 10 cm was highly correlated with the amount of rainfall. Slight differences between early full-irrigated treatment and others were found in the middle and end of August (Fig. 4.4A). The trend at 20 cm depth showed higher values over all the season. The soil moisture did not drop below 16% (Fig. 4.4B). At 30 cm depth the soil moisture trend followed almost the same trend as that one from 20 cm depth, with little separation between treatments at the end of August (Fig.4.4C). At 40 cm depth, the soil moisture values were overall close to those at 30 cm depth. However, differences among the irrigated treatments still occurred at this depth (Fig. 4.4D). Soil moisture at 60 cm depth showed the same trend at that one found at the other depths but much higher than that one found at the same depth for the other years of the period studied (Fig. 4.4E). At 100 cm depth, soil moisture had the highest values. The trend was steady throughout the season with slightly upward at the end of August (Fig. 4.4F). Taking all three seasons into account, the greatest magnitude of difference was between the early-imposed treatments and the others, at the four upper depths (10, 20, 30 and 40 cm). At 60 and 100 cm, there was more moisture, and the magnitude of difference between treatments was smaller. In 2007, most of the treatments followed the control trend. The most variation among treatments was observed up until the 40 cm depth. After this, the trend was similar to the control, but the magnitude of difference between treatments was lower compare to depths closer to the soil surface. At 100 cm depth, soil moisture surprisingly showed high variation throughout the period studied. Water availability depends not only on how much rainfall a vineyard receives but also on when the rain falls and how rapidly it evaporates. Due to differences in water holding capacity and effective root zone, variation in soil moisture had a pronounced impact on vine performance both 144
167 between and within the Australian vineyards (Hall et al. 2002). However, since the soil moisture had little variation with no effect on water holding capacity it could be speculated that differences in soil moisture among the irrigation treatments occurred due to the depth of the effective root zone. In 2008, observations from two pits dug in one full-irrigated and the control showed that irrigation affected the depth of the root density (data not shown). The highest percentage of the root density in the full-irrigated treatment was located in the upper soil depths (20 to 40 cm) and was concentrated on a strip along the irrigation pipe. The control vines, that were only rain fed, showed a very different pattern. The root density was not concentrated at any depth. The root system was dispersed not only on the row but also between the rows and roots were found even deeper than 1.2 m. A study with six grapevine cultivars grown on their own roots in Australia indicated that Chardonnay had the highest root biomass density (5.9 g drri- 3 ) and root length density (1628 cm dm- 3 ). The other cultivars, Merlot, Flame Seedless, Semillon, and Shiraz had similar root densities but twofold less than Chardonnay (Rogiers et al. 2009). This could indicate a better adaptation of Chardonnay to cope with periods under water deficits. Transpiration (Fig. 4.SA to C). Leaf Ts rate followed the same trend as soil moisture in 2005 (Fig. 4.5A). The highest values were found in the early-imposed treatments. Immediately after the fruit set and veraison treatments were imposed, Ts increased. The 100% ETc imposed at fruit set had consistently the highest Ts rate throughout the season. The treatments imposed at veraison had higher Ts rates than the control but much lower than those imposed at fruit set. In 2006, Ts reached a maximum at the end of July (26.2Ilg H20 cm- 2 s- 1 ), followed by a minimum in the middle of August (2.9Ilg H20 cm- 2 s- 1 ; Fig 4.5B). Due to rain, all treatments followed the same trend, and generally, no differences were found except the ftrst two readings and the last one. In 2007, Ts followed a decreasing trend for all treatments from mid-june to late August (Fig. 4.5C). The highest Ts values were recorded in the early imposed treatments in the middle ofjuly (16.9 Ilg H20 cm- 2 s- 1 ), whereas the lowest ones were recorded at the end of August. The Ts rates decreased in all treatments at the last reading time, being recorded no differences among the irrigated treatments. In 2008, Ts followed a steady trend until mid of August when it began to decrease because of slight increased temperature and diminished rain frequency (Fig. 4.5.D). The Ts values were lower in 2008 comparing to other years despite higher soil moisture. This could be explained by lower vapor pressure deficit and lower daily temperatures (data not shown). In an Italian study on irrigation of Lambrusco grapevines, canopy Ts rates varied from to mmol m- 2 S-1 for the non-stressed vines (daily recharged at fteld capacity), and from 0.63 to mmol m- 2 S-1 in PRD treatments (34.2% less compare to well-watered) (Poni et al. 145
168 2009). The daily vine water loss was around 4.36 L in well-watered plants as compared to 2.6 L in the stressed vines, for a canopy size of 5.49 m 2 in the ftrst case and 5.00 m 2 for the stressed vines. In another study conducted on Concord grapevines in the arid, warm climate of eastern Washington State, Ts rates were estimated around 30 L day-1 per vine, or::::: 1.0 to 1.4 L day-1 m- 2 leaf area (Tarara et al. 2002; unpublished data cited by Dragoni et al. 2006). One study conducted in a cool region from Australia on 10 grape cultivars grown on soil with a constant moisture reported that Chardonnay grapes had the highest Ts rate along with other three cultivars (Semillon, Pinot noir and Sultana) of 4.3 mmol H 2 0 m- 2 S-1 (Rogiers et al. 2009). Direct comparison among studies is difficult because of the differences in cultivars, training systems, agricultural practice, level of plant stress, and environmental conditions (Williams et al. 2003). Although, many scientists consider that stomatal conductance reflects better the water status in the vine than transpiration rate, Rogiers et al. (2009) indicated that a high degree of correlation exists between the Ts and stomatal conductance. Ts is determined by the availability of latent heat of evaporation, by vapor pressure gradient and by the resistances to water movement in the plant system. Stomatal movement is a result of interactions between the physiological factors and environmental conditions (Hetherington and Woodward 2003). Stomatal guard cells integrate environmental signals from both the aerial environment and soil in order to control the stomatal aperture, which optimizes the water loss and CO 2 gained. In general, dry air has a greater drying capacity than moist one. Plants are generally sensitive to vapor pressure deftcit. Consequently, grapevines tend to shut their stomata as air gets drier (Loveys 1984). Ts values fluctuated widely during the present study, but were very close to those found previously in seasons with similar rainfall patterns (Reynolds et al. 2007). The highest Ts values were recorded in The maximum Ts values coincided also with high air temperature and solar radiation (data not shown). These values might be explained due to a luxuriant canopy which received a high percent of the solar radiation, and which caused an increased of the temperature leaf. The vine regulates leaf temperature by losing more water. Presumably, the chemical signal that controls stomata is very weak under high water status, thus the vine is trying to control the overheating process rather than to avoid losing water Air humidity, temperature and light intensity were similar for all the irrigation treatments. Since the Ts rate followed almost the same trend as that one of the soil moisture, Ts rate might be an easy tool to assess the vine and soil water status. However, stomata respond to a number of environmental variables such as: temperature, photosynthetic photon flux density, vapor pressure deftcit, CO 2 concentration, and water stress, (Kaufmann 1982). Studies on stomatal response to 146
169 temperature have often reported contradictory results. Stomatal closure occurs with increasing temperature (Heath and Meidner 1957, Heath and Orchard 1957), while others found that stomata opened with increasing temperature (Rogers et al. 1981). Grapevine is generally considered a "drought-avoiding" species, with efficient stomatal control over Ts (Chaves et al. 1987, Schultz 2003). However, some genotypes have shown a better control of stomata than others in response to water deficits, and accordingly have been classified as isohydric (drought avoiders or "pessimistic"); others, showing less control over stomatal aperture under water stress, were considered anisohydric, with an "optimistic" response (Schultz 2003, Soar et al. 2006). Leaf water potential (Fig. 4.6A to D). Leaf '" followed almost the same trend as soil moisture in 2005 (Fig. 4.6A). Leaf '" of control decreased gradually, and reached a minimum on 16 August. All other treatments followed the same trend as the control until each treatment was imposed. In the middle of August, all treatments except the control had values around -1.0 MPa. A clear separation between all treatments and the control was observed on August 16. The difference between well irrigated and non-irrigated was almost 0.5 MPa, with a minimum of -1.3 MPa and maximum of -0.7 MPa. In 2006, all treatments had values> -1.0 MPa (Fig. 4.6B). At beginning of August, the control followed a decreasing trend, and reached a minimum of -1.2 MPa. However, the control did not reach a value that would have been considered a high water stress event. Even in a year considered wet and cooler than usual, a separation between irrigated and non-irrigated treatments was observed. In 2007, except for the control, all treatments followed the same trend (Fig. 4.6C). All treatments reached a maximum at the end of July, and then decreased slowly until the end of August. Control had values < -1.0 MPa almost the entire season, while all other treatments had lower values than this threshold by the end of August. The leaf '" trend was almost the same as that one for Ts rate. The leaf '" values reached a minimum for all treatments at the end of August, which ranged between -1.1 to -1.3 MPa. In 2008, leaf '" followed almost the same trend as soil moisture (Fig. 4.6D). The lowest values were recorded at the beginning of July (-0.8 to -0.9 MPa). This coincided with a short period of lack of rain and slightly increased air temperature. The values never dropped below MPa, and did not show any sign of water stress during the season. RDI treatments caused yield reductions and decreased photosynthetic rates (Stevens et al. 2008). Soil water deficit has been associated with declining values of leaf '" (Smart and Coombe 1983, Williams and Matthews 1990). However, no differences were reported among deficit irrigation treatments in one study (Stevens et al 2008). The yield losses associated with water stress are avoided when irrigations are scheduled in way which keep leaf '" higher than -1.0 MPa 147
170 would avoid (Williams 2001). In grapevines two patterns of response to water stress have been distinguished: isohydric and anisohydric (Schultz 2003). A study, conducted on Syrah and Grenache, showed that the latter cultivar had isohydric behavior which is characterized by a lack of response in leaf 'I' and decline in stomatal conductance (Schultz 2003). Contradictory findings have been reported regarding Chardonnay behavior under water deficit. Chardonnay had the same isohydric behavior as Grenache (Stevens et al. 2008). However, according to other studies, Chardonnay is an "optimistic" cultivar, consistent with an anisohydric behavior (Vandeleur et al. 2009). In Chardonnay, reduction in root conductance under water stress seems to be correlated with an increase in the expression of VvPIP 1 (the gene controlling the content of the aquaporinswhich are the proteins involved in water transportation). This caused a switch in water transport pathway, resulting in an increased contribution of the cell-to-cell pathway to the radial transport of water during the day (Vandeleur et al. 2009). Chardonnay appears to be an "optimistic" cultivar, reducing only root conductivity in the middle ofthe day by 2- to 3-fold (Vandeleur et al. 2009). The smaller reduction in root hydraulic conductance is also important in maintaining a small 'I' gradient between the xylem and the soil, and which could be associated with the lower vulnerability of Chardonnay to embolisms compared to Grenache (Alsina et al. 2007). Shoot growth (Fig. 4.7). Shoot growth rate had an increasing trend for all treatments until the end of July, followed by a slowly decreasing trend. The highest values were in the earlyimposed treatments. In the middle of July 2006, there was almost 40 cm difference in shoot growth rate between early-irrigated treatments and the others (Fig. 4.7A). Early irrigated treatments irrigated at 25% ETc were not substantially different to the late applied treatments or the control. In 2007, the trend was different, whereby except for the early-imposed treatments, all others had decreasing trends until the irrigation was imposed (Fig. 4.7B). Immediately thereafter, the growth rate increased. Both shoot growth and early berry development are very sensitive to water stress, whereas the drought is detrimental because of decreased vegetative growth (Reynolds and Naylor 1994, Schultz and Matthews 1988, Smart 1974). In a comparative study between Chardonnay and Cabernet Sauvignon examining their responses to both water stress and salinity it was reported similar results as those in the present study (Vincent et al. 2007). Chardonnay shoot elongation was slowed down by water deficits, and not by salinity, whereas Cabernet Sauvignon shoot length was significantly reduced by both salinity and water deficit, as compared to control. Leaves that were developed before the treatment onset (leaves 1 to 3) coped better with water stress than the younger 148
171 ones, indicating that cell production and elongation were affected in the young leaves (Vincent et al.2007). Drought causes the reduction of CO 2 assimilation and the enhancement of O 2 uptake, due to stomatal closure, along with a decrease in the activity of various enzymes of the Calvin cycle (Flexas et al. 1999, Maroco et al. 2002). Grapevine shoot organogenesis was shown to be under the influence of soil water deficit, and not related to competition for assimilates among various other sinks (Lebon et al. 2006). However, the highly developed shoots take advantage of their higher sink strength, and absorb more nutrients (Miller et al. 1996, Williams and Grimes 1987). Trophic competition also depends on the number of clusters per shoot. The shoots with strong fruiting development display a low level of vegetative development (Edson et al. 1993). A1leweldt and Rtihl (1982) pointed out that there is not a linear correlation between dry matter accumulation and photosynthesis. The same authors observed a reduction of 51 to 61 % in dry matter production due to water stress, while the photosynthesis was 33 to 48 % lower in water-stressed grapevines, which might be explained through the effect of water stress on shoot growth and canopy size. The results from the present study are in agreement with those of Stevens et al. (1995) who found in one irrigation experiment on Colombard grafted on Ramsey rootstock that declining of vegetative growth was linearly correlated with increasing in water stress level. In one study from Spain on V. vinifera L. Airen and Chardonnay grapevine, it was reported that water stress reduced the leaf number by 45% and the leaf area by 33%, with Chardonnay being more sensitive to water stress than Airen (Gomez del Campo et al. 2(02). This finding was explained by a modification in the relationship between growth inhibitors and stimulants (Meriaux et al. 1974). The downward orientation of the shoots induces accumulation of auxins in the apex, which in turn affects the density and the size of the xylem vessels, causing a reduction of hydraulic conductivity, and therefore slowing down shoot growth (Lovisoloet al. 2002). Yield components and berry composition (Tables 4.2. and 4.3). During the winter, the low temperatures severely damaged the Chardonnay vines. For this reason, no yield or berry composition data were collected from this variety in Vine size. Data collected did not show consistent trends throughout the period studied with respect to vine size, perhaps due to variation in climatic conditions from one vintage to the other (Table 4.2.). However, vine size had overall the highest values in 2008, followed by 2006 and These values reflected the weather conditions for these years, especially the rainfall. There were differences among the irrigated treatments in each year of the experimental period. In 2006, 149
172 the highest value for vine size was found in 100% ETc initiated at fruit while in 2007 and 2008 the highest values were found in 100% ETc initiated at veraison. One interesting observation, which could explain the results, is that Chardonnay has an unique pattern in terms of dry matter accumulation. Under water stress conditions, Chardonnay accumulated all its dry matter between fruit set and veraison while under non-stressed conditions it accumulated 74% of its dry matter between veraison to harvest period (Gomes del Campo 2(02). This might be a plausible explanation for the variation found in vine vigor not only between treatments but also from vintage to vintage. Cane vigor is an important factor in bud fertility. In a multi-year survey of Pinot noir grown in the Willamette Valley, Oregon, an average can weight of 45 g at pruning maximized the number of flowers per node (number of inflorescences per node multiplied by the number of flowers per inflorescence) the following season (Vasconcelos 2009). A similar relationship was found in Sauvignon blanc, where inflorescence number per shoot decreased as cane diameter decreased under ~1O mm (M. Trought, unpublished data, 2006 cited by Vasconcelos et al. 2009). Excess vigor has been associated with poor bud fertility (Carbonneau and Casteran 1979). In almost all the treatments, the highest yields were recorded in 2008 and the lowest in 2006 (Table 4.2). Contrary to the expectations, the yield was slightly lower in the wet 2006 season than in 2007, considered the driest year of the period studied. In 2008, despite few irrigation events, 25% ETc and 50% ETc treatments imposed at fruit set showed differences compared to the control for almost all yield components. This could be explained by a carryover effect from the driest year (2007). However, the full water replacement initiated either at fruit set or veraison showed higher values than the control over the entire period studied. The response of Chardonnay vines to deficit irrigation treatment is modified by the rootstock genotype (Stevens et al. 2008). Reducing irrigation by 35% decreased the yield by 9% from 29.3 to 26.7 kg/vine. The same authors, found that the deficit irrigation treatment had an effect only on berry weight, which decreased from 1.04 (well irrigated) to 0.98 glberry while reducing irrigation had no effect on the percentage of dry matter of pruning wood, number of shoots and inflorescences per vine. The number of clusters per vine showed slightly differences in 2006 and 2007 while in 2008 more differences among treatments were recorded (Table 4.2). In 2007, no difference between the control and 100% ETc early-imposed treatment was found in terms of number of clusters per vine. In 2008, the highest number of clusters was recorded in 50 and 25% ETc. The 150
173 effect of water stress in 2007 was better reflected in 2008 values when almost all the irrigated treatments had a higher number of clusters per vine. The present data is very well explained by previous studies on ecological factors which affect inflorescence and flower differentiation. As it was expected, since inflorescence differentiation occurred in the previous season, the number of clusters in 2008 clearly showed the effect of water stress from 2007 season. Many studies have shown that light is also involved in determining bud fruitfulness (Buttrose 1969, Dry 2000, Petrie and Clingeleffer 2005, Sommer et al. 2000). Studies on different irrigation regimes, in order to change canopy permeability to light (Carbonneau and Casteran 1979, Greven et al. 2005, Loveys et al. 2000) or canopy management (Reynolds et al. 1995, 1996, Shaulis and Smart 1974) often reported parallel changes in fruit yield. Inflorescence induction is very sensitive to water stress, which is affected indirectly by changing the plant hormonal balance (Srinivasan and Mullins 1978, 1979,1980). Mainly, two hormones are affected by water stress: from roots (Livne and Vaadia 1972) and abscisic acid level in leaves and stems (Diiring and Alleweldt 1973, Loveys and Kriedemann 1973). The environmental factors such as short-term exposure to high temperature, high light intensity, and optimum levels of soil moisture and macronutrients promote not only flowering in grapes but also cytokinin biosynthesis in plants (Jako 1976, Menary and Staden 1976). Conversely, factors that depress flower formation, such as low light intensity, low temperature, and water stress, have an inhibitory effect on endogenous cytokinin production (ltai and Vaadia 1965, Livne and Vaadia 1972). All these factors which are strongly affected by the canopy size might explain the variation among the irrigated treatments in the present study. The most noteworthy treatment effect was on cluster weight and the number of berries per cluster (Table 4.2). These two yield components are affected mostly by the irrigation treatments applied during the season, and not by treatments applied in the previous season. In 2006, berry weight showed no differences among treatments and this was probably due to the high frequency of rainfall during the season which interferes with the irrigation treatments (Table 4.2). Early and late treatments generated the same effect in each year studied. However, berry weight values were much higher in 100% ETc initiated at fruit set than in the full replacement initiated at veraison. This might suggest that full water replacement initiated at fruit set influenced not only cell size but also cell division in the berry. In 2007, which was a drier year than 2006, there was a greater magnitude of difference among treatments. Some studies showed that reducing the irrigation volumes had a negative effect on yield, mostly due to lowering the cluster number and berry weight (Girona et al. 2006, Van ZyI1984). In one broad study where various medium- and long-term yield data sets for a wide range of cultivars 151
174 grown in a diverse range of climates (from cool to hot) were analyzed, it has been shown that the number of clusters per vine explained consistently 60 to 70% of the seasonal variation in vine yield (Clingeleffer et al. 2001). The same authors showed that yield fluctuations were explained only;:::: 30% by the variation in the number of berries per cluster and just 10% by berry size In some studies, irrigation substantially increased not only the photosynthetic rate, but also the grape yield by 1.5 to 4- fold, depending on the irrigation timing, the amount of water applied, the cultivar, the environmental conditions and other cultural practices (Bravdo et al. 1985, Escalona et al. 2003, Hepner et al. 1985, Matthews et al. 1987, Schultz 1996, Williams 1996). In one study, it was indicated that the cultivars Sultana, Muscat of Alexandria, Riesling, Shiraz and Ohanez performed well in a controlled environment with high temperature and high light intensity, but only a few cultivars (e.g. Riesling) performed satisfactorily under low temperatures and low light intensities (Buttrose 1970). However, in another study it was reported large differences in terms of light sensitivity between different grapevine cultivars, with Sultana and Cabemet Sauvignon reaching maximum fruitfulness at just one-third of full sunlight, while in Flame Seedless and Chardonnay fruitfulness increased with increasing available light (Sanchez and Dokoozlian 2005).The variation in yield data between irrigated treatments could be explain partially by this fact, since the irrigation treatments especially 100% ETc showed the highest shoot growth, which possibly generated excessive shading, and affected the fruitfulness in the subsequent years. Temperature is considered the dominant factor for inflorescence primordia formation, with the critical period for susceptibility to the high temperature response being three weeks before the formation of anlagen (Buttrose 1969, 1970, 1974a). In one study conducted on Chardonnay vines over 8 year period, it was indicated a strong linear relationship between temperature at initiation and the number of clusters per shoot in the following season. The cluster number increased by 0.22 clusters per shoot per degree centigrade over an average initiation temperature range of 13.8 to 17.5 C (MacGregor 2000). Temperature at budburst might also influence the flower size, and subsequently berry weight. The high variation in weather conditions during the experimental period could explain part of the yield components variation in present data. However, other studies showed that the effects of deficit irrigation on berry and wine quality are dependent on the climatic characteristics during the growing season, soil type, grapevine variety and timing of application (Dry and Loveys 1998, Santos etal. 2003, 2005).. Irrigation led to differences in berry composition for almost all variables compare to the control. Brix was consistently lower in all treatments in 2008 comparing to 2007 and 2006 (Table 152
175 4.3). Except for 25% ETc treatments imposed at both fruit set and veraison, all other treatments had lower values in 2007 than 2006, but higher than in Little differences among the irrigated treatments were found even in 2008 considered the coolest and wettest year of the period studied. However, in one study it was not found any difference in OSrix between fully irrigated and six deficit irrigation treatments (Stevens et al. 2(08), while in another study it was reported that 25% RDI increased the Brix in Colombard grapevine (Van ZyI1984). RDI treatments increased Brix and decreased the berry weight by 25% in another study on Pinot noir (Girona et al. 2006). In several grapevine cultivars, photosynthesis was not affected in the same way by water stress under different experimental conditions such as greenhouse and field (Chaves et al. 2009, Flexas et al. 2002, Souza et al. 2003, 2005a). Photosynthetic rates generally decline at lower predawn leaf 'I' than stomatal conductance when grapevines are subjected to moderate water deficits. This is reflected in higher water use efficiency by the crop, which is an important aim of deficit irrigation strategies in vineyards (Chaves et al. 2007, Gaudillere et al. 2002, Souza et al. 2005b). Increases in berry sugar concentration under water deficits were observed in Cabernet Sauvignon but not in Chardonnay (Deluc et al. 2009). This might be explained either by differences in vigor, and therefore source/sink equilibrium between cultivars, or by different mechanisms underlying the response of grape berry development to water limitation according to the timing and intensity of water stress imposition. On the other hand, it seems that, up to a certain amount of added water, no effects are observed on grape and wine quality, even when the grape yield is increased (Bravdo et al. 1985, Hepneret al. 1985, Medrano et al. 2003). Irrigation treatments produced little variation in TA in all years (Table 4.3). Contrary to the expectations, the highest TA was found in the control and 50% ETc applied at veraison in Juice acidity showed little variation among the treatments on each season but it varied highly from one season to the other. The minimum value was found in 2007 on the late irrigated treatment, and the maximum in 2008 at the control and 50% ETc late imposed treatment. In many irrigation studies, no TA changes have been observed in the must from moderately water-stressed vines (Esteban et al. 1999, Matthews and Anderson 1989). However, some studies reported a reduction of TA due to deficit irrigation as compared with full irrigation (Santos et al. 2007). In an irrigation study on Chardonnay grapevine, Brix and ph were not affected by reduced irrigation, but it lowered the juice TA from 8.3 to 8.1 gil (Stevens et al. 2008). No effect of RDI on ph juice was in agreement with findings from another study (Girona et al. 2006). Overall, the irrigation treatments had no effects on juice ph when compared with the control. 153
176 Must composition (Table 4.4). Overall, musts had higher Brix in 2007 compare to those from Contrary to the expectations the control did not have the highest Brix in either of the years studied. In 2006, the highest Brix value was found in 25 % ETc initiated at veraison, while in 2007 the 25 % ETc initiated at fruit set had the highest value. However, the full water replacement treatments had the lowest ~rix values, perhaps due to a dilution effect. Titratable acidity was lower in all musts when comparing with those from In terms of acidity the magnitude of difference among musts was low in both years 2006 and The 100 % ETc initiated either at fruit set or veraison had lower acidity values than the other treatments in both years. Irrigation also affected the must ph in both years studied. However, a consistent pattern was not found in the irrigation treatments from year to year, except for the 25 and 50 % deficit irrigation applied at fruit set which were higher than the control in both seasons (Table 4.4.). This suggests that under particular weather conditions the irrigation initiation time can affect positively or negatively the must ph. This aspect is very important from a winemaking point of view since juice ph affects the fermentation rates (Ough et al. 1968). ph levels> 3.6 are detrimental to wine quality because above this level there is an increased likelihood of microbial spoilage, the production of hydrogen sulfide (H 2 S), and lower color intensity in the wine (Jackson and Lombard 1993). Water stress, on the other hand, is contradictory in its effects on wine quality and is influenced by the time at which water stress occurs within a season and by the degree of severity. For example, no relationship was found between water stress and the onset of veraison or the timing of ripening and harvest (Matthew and Anderson 1989). However, yield, berry composition, ph, organic acids and total soluble solids were affected by water stress in other studies (Bindon et al. 2008, Jackson and Lombard 1993, Robyet al. 2004, Van Leeuwen et al. 2004). It has been stated that when water stress becomes too severe, sugar accumulation is depressed as photosynthesis is reduced, and thus carbon assimilation by the plant becomes limited (Van Leeuwen et al. 2004). However, time when water deficit occurs is important, early and severe water deficits being more detrimental to wine quality than post veraison deficits (Jackson and Lombard 1993). Wine composition (Table 4.5). In both years 2006 and 2007, wines from irrigation treatments initiated at veraison had ph values slightly higher than those found in must. In 2006, the ph values of wines from treatments initiated at fruit set were almost similar 'with those found in must, while in 2007 the wine ph had slightly lower values than those found in must. In both years 50 and 100 % ETc treatments applied either at fruit set or veraison had higher TA values than the 154
177 control. In both vintages 25 % ETc treatments applied either at fruit set or veraison were slightly lower than the control. The control did not have the highest ethanol concentration in any of the vintages studied. In 2006 vintage, except for 25% ETc applied at veraison, all other treatments had values slightly lower than the control. The wines made from irrigated treatments had lower ethanol than the control. In 2007, the pattern was almost similar to that one from 2006 except that the highest value of ethanol was found in 100 % ETc applied at veraison. However, contrary to the expectation, the magnitude of the difference was low not only among treatments but also from one vintage to the other. This suggests that the irrigation treatments do not have a great and consistent effect on the wine basic chemistry. Relationships among field variables. Because of the particular weather conditions in 2005 which generated abnormal growth and lack of yield, relationships among soil moisture and physiological variables were not established. However, it is worth re-iterating that despite minimal yields, differences occurred between treatments in terms of soil and plant water status on some sampling dates. In 2006, PCA was performed on different data sets. There was a high degree of correlation between soil and plant water status (Fig. 4.8A). Leaf temperature was negatively correlated with soil moisture at 20, 30, and 40 cm depths, and positively correlated with Ts. The first two factors explained 92.15% of the variability in the data, while F1 accounted for % of the variation in the data set and F2 for 41.65% (Fig. 4.8A). The distribution of the treatments on the plot shows that leaf temperature was highly associated with the control late-imposed treatments (veraison). Ts and leaf 'If were highly associated with the irrigation treatments applied at fruit set, being also highly correlated with soil moisture at 10, 30 and 40 cm depths. Jarvis and McNaughton (1986) pointed out that narrowing of the stomatal aperture due to low soil moisture reduces water loss but this could lead to an increase in the leaf temperature. Since the highest degree of correlation among physiological variables and soil moisture was found at 10, 30 and 40 em, this suggests that the active root system is located in this zone of the soil profile. This is explained by the highest water depletion rate due to its absorption trough the roots. However, soil moisture depletion at 10 cm depth might be affected mostly by evaporation due to the solar radiation. Another PCA was run on 2006 soil water status data and yield components (Fig. 4.8B). The ftrst two factors explained 75.16% of the variability in the data set, where F1 accounted for 40.64% of the variation in the data, and F2 just for %. Cluster weight and yield was 155
178 positively loaded on Fl, while Brix was positively and berry weight negatively loaded on F2 (Fig. 4.8B). The PCA graph showed that vigor was mostly associated with soil moisture at 40 cm depth, which validates the results from Fig. 4.8A. A possible high root density at this depth could be a plausible explanation for why vigor showed the highest correlation with soil moisture at 40 cm depth. The number of berries per cluster and cluster weight were positively correlated while yield was negatively correlated with the number of clusters per vine. Berry weight was highly associated with the control treatment, while yield was mostly associated with 100% ETc applied at veraison. The number of clusters per vine was highly associated with the deficit irrigation treatments. Yield in 100 % ETc treatment initiated at veraison was best explained by the clusters weight and the number of berry per cluster (Fig. 4.8B). This suggests that the yield was not affected by the climatic conditions from the previous year.lnflorescence differentiation occurs in the previous season while flower differentiation occurs before or at budburst (Vasconcelos et al. 2009). Variation of climatic conditions at budburst highly affects the number of flower per inflorescence (cluster). Due to the dry conditions and low canopy size in 2005, it was expected that in 2006 the yield to be better explained by the number of the clusters per vine. However, the results from 2006 could not be explained by the flowering physiology. Yield components in 2006 were highly dependent on soil moisture from the current year and less explained by the climatic conditions from the previous year. The PCA was performed in 2007, on soil water status and physiological data (Fig. 4.9A). The PCA biplot diagram shows that the first two factors explained 69.14% of the total variability in the data set; 50.67% by Fl and 18.47% by F2. Soil water status at 20 and 60 cm depth was highly negatively correlated with leaf 'I',and highly associated with 100% ETc applied at fruit set and veraison (Fig. 4.9A). An interesting observation was that leaf 'I' was not correlated with soil moisture from other depths other than 20 and 60 cm depth. Contrary to 2006 pattern, leaf 'I' was not correlated with the transpiration rate in 2007 season. The lack of relationship between these two variables suggests that the signal causing partial stomatal closure is chemical rather than hydraulic. This is in agreement with the results found in other studies (Dry and Loveys 1999,2000, Vandeleur 2007). Ts and leaf temperature were positively correlated with soil moisture at 10, 30, 40 and 100 cm depths (Fig 4.9A). This relationship is opposite than that one found in from 2006, and indicates that in very dry and hot years, although there is enough moisture in the soil, the transpiration rate cannot sustain the thermoregulatory process, and as a consequence it leads to overheating the leaf. The same diagram showed a better separation of the irrigated treatments 156
179 based on the amount of water applied (Fig. 4.9A). The full-irrigated treatments were located on the right lower plot while the control and the RDI treatments were located on the left side of the plot. Another PCA was performed on 2007 field and berry composition data (Fig. 4.9B). The PCA plot on yield components and soil water status showed that the first two components explained 77.57% of the variability in the data set. Berry ph was positively correlated with Brix but negatively with the number of clusters and TA. This indicates that the climatic conditions in 2006 were favorable for a good differentiation of the inflorescence primordia in treatments with high water status. In these treatments low ~rix might be explained by a delay in fruit maturation due to a low ratio source: sink of the carbohydrates. However, soil moisture at 10, 20 and 60 cm depths was negatively correlated with Brix, and highly positively correlated with yield and berry weight. Brix was positively associated with 25% ETc and negatively associated with the number of clusters per vine. As it was expected berry weight and vigor were highly correlated and associated with high water status. Cluster weight was highly correlated with the number of berries per cluster rather than berry weight. This indicates that in hot years berry weight is highly negatively affected by water stress. Overwinter precipitation recharges the crop root zone to field capacity and along with warm weather at budburstcould increase the flower differentiation on inflorescence. The PCA plot of 2007 data (Fig. 4.9B) showed that the irrigation treatments were mostly grouped according to the amount of water applied through irrigation rather than the imposition time. Sensory analysis (Tables 4.7 to 4.10; Figs to 4.15). In 2005, high percentage of bud damage occurred due to very low temperatures from previous winter. Therefore, no wine was made in the first year of the experimental period. In 2006, wines were assessed for seven aroma and flavor descriptors (Table 4.7). Musty was a descriptor found with less or more intensity in all treatments from 2006 vintage (Fig 4.IOA, B). Since its intensity varied among the irrigation treatments it is assumed that this occurred in the experimental wines somehow due to the particular weather condition of 2006 vintage. Citrus is one descriptor often found to describe the Chardonnay sensory profile and mostly is associated with linalool and a-terpineol (Arrhenius et al. 1996). Apple and pear aroma were found at the highest intensity in the control wines. Nutty, butterscotch and banana aroma descriptors had the highest intensity in 100 ETc treatments (Fig. 4.IOA,B). They have been previously reported in the sensory profiles of Chardonnay wines (Smith 2005). However, these descriptors in Chardonnay are frequently associated with particular winemaking techniques or weather conditions (Iland and Gago 1997). Studies on effect of irrigation and terroir factor on sensory profile of Chardonnay from Niagara Peninsula were conducted before (Reynolds 157
180 et al. 2007, Schlosser et al. 2005). Reynolds et al. (2007) studied the effect on fruit quality of different cessation times of irrigation and found that the irrigation treatments produced wines with more fruity aromas and less earthy notes than the non irrigated ones. They also suggested that the wines from non-irrigated treatments have less intensity due to a lower ability to produce aromatic compounds. Their results are in agreement with the present results (Fig and 4.13). The PCA plots showed that the sensory attributes had overall a higher intensity in wines from the deficit irrigation treatments than the control (Fig. 4.12A,B). This suggests that the sensory profile could be associated with the soil moisture level during the vegetation season. However, wines from the deficit irrigation treatments showed more complexity than the control ones which had the highest intensity just for a couple of attributes. In terms of the mouthfeel, acidity was the only one attribute, which made the difference among the experimental wines in both vintages. The panelists were able to make the difference among the wines even if it was not found a very high magnitude among different treatments from a chemical point of view. The PCA of the 2006 sensory data showed that 68.24% of the variability in the data was explained by the first two dimensions (Fig. 4.12A). Fl accounted for 44.94% ofthe variability being heavily loaded in positive direction with fruit tree and raisin flavor and aroma, and negatively loaded with musty, acidity and nutty aroma attributes. F2 explained 23.3% of the variation of the data set, and was positively loaded with citrus flavor. The PCA graph illustrated that the 25% ETc applied at fruit set and veraison were located on the right lower part of the plot while fully irrigated treatments were grouped together on the left side of the plot. The control and 25% ETc were mostly associated with fruit tree and raisin while the 100% ETc water treatments were associated with musty, nutty and high acidity attributes. There was a clear separation of treatments based on the amount of water applied rather than the time of treatment imposition, although 50 and 100% ETc treatments initiated at fruit set and veraison were not clustered too close to each other. The wines from 2007 vintage showed a different sensory profile thanin2006 (Table4.8, Fig ). All the panelists were able to pick more attributes because the sensory profile showed overall much more complexity in wines from 2007 compare to Rhubarb, fresh grass, honey and stony fruits were the new descriptors found in the 2007 wines. The irrigation treatments showed a higher intensity in some of the sensory attributes characteristic for Chardonnay cultivar. The PCA of 2007 sensory data showed that the two factors explained 61.44% of the variability (Fig. 4.12B). Fl explained 33.06% ofthe variability in the data set while F2 only 28.38%. The first component was heavily negatively loaded with banana aroma and raisin flavor attributes. The 158
181 second factor was positively loaded with fresh grass aroma and flavor attributes. Stony fruit and fruit tree were positively correlated with each other but negatively correlated with rhubarb, raisin, honey and butterscotch aroma. Citrus aroma and flavor, honey, rhubarb, nutty aroma and acidity were positively correlated with each other and negatively correlated with fruit tree aroma. Contrary to 2006, the distribution of 2007 wines on the PCA plot indicated a better discrimination among treatments based on the time of the irrigation imposition. Wines made from the treatments imposed at fruit set were located on the upper left plot while those imposed at veraison were located in the lower left plot. The wines from treatments applied at fruit set were associated with citrus aroma and flavor, rhubarb, honey, and acidity while the control wines were located in the upper right plot being mostly positively associated with fruit tree, stony fruit aroma and flavor attributes and negatively associated with honey, raisin and rhubarb. The 50% and 25% ETc treatments applied at veraison were highly associated with raisin, rhubarb, honey and butterscotch attributes. This suggests that the sensory profile is affected not only by the amount of water in soil but also by the general weather conditions in one particular year. As a conclusion the weather conditions affect the complexity (varietal typicity) in the wine while the soil moisture level affects the intensity of one or the other attribute. Chardonnay is an international variety grown in most of the viticultural areas. Its sensory profile showed a huge variation which most of the time is associated with the terroir aspect. Chardonnay wines have been linked to fruity, apple, or citric aromas (Ferreira et al. 1999, Sefton et al. 1993) and have been shown to be favored by prolonged harvest dates and cooler longer ripening periods (Callo et al. 1991, Reynolds et al. 1995). In one study in Australia, the primary fruit characters of a young Chardonnay wine included grapefruit, lemon, melon, stone fruit, and tropical fruit, whereas more developed wines exhibited characteristics such as toast, honey, fig and nuts (Smith 2005). However, the same study mentioned more descriptors with different impact on Chardonnay wine profile like passion fruit, herbaceous, sweaty, spicy, estery, stewed apple/pear, floral or lychee. Wine aroma profiles are complex and influenced by many variables (Lee and Noble 2003). Although, many studies on sensory profile of Chardonnay wine had been published, most of them focused on commercial wines which often were manipulated by the winemakers. Just a few studies showed the effect of cultural practices including irrigation on the sensory profile of Chardonnay wines (Reynolds et al. 2007). The complexity of the aroma profile in Chardonnay along with the fact that many of the volatiles involved in it are produced during fermentation, allowed most of the 159
182 time just to speculate on influence of different environmental factors on the final sensory profile of wines. The most important white wine aroma volatiles produced during fermentation belong to three chemical classes such as: ethyl esters of medium chain fatty acids (ethyl butyrate, hexanoate, octanoate, decanoate and dodecanoate) which are fruity and wine-like; acetate esters that are responsible for tropical fruit and banana-like aromas, and a third group of higher alcohols such as isobutanol, isoamyl alcohol and hexanol, which are harsh and unpleasant (Simpson 1979). Ethyl esters of fatty acids, based upon their concentration in the wine and subsequent flavor thresholds, are important contributors to Chardonnay aroma (Simpson and Miller 1984). Ammonia levels, yeast strain, and level of non-soluble solids are directly related to the formation of esters important in the wine aroma (Bertrand 1983). This could explain part of the sensory results since it is well known the effect of water deficit on nitrogen accumulation (Keller 2(05). Among the 45 aroma compounds measured in the Chardonnay wines, -16 were always above the threshold (Smith 2005). Water deficits have an effect on the transcript abundance of enzymes and as consequence they affect the composition aromas and their concentrations (Cramer et al. 2007). Deluc et al. (2009) studied the effect of water stress on Chardonnay and Cabemet Sauvignon cultivars at molecular level. Transcriptomic analysis of genes encoding enzymes involved in the biosynthesis of volatile compounds revealed an increase in the transcript abundance of one terpenoid synthase, one carotenoid cleavage dioxygenase and severallipoxygenases under conditions of water deficits (Deluc et al. 2009). Water deficits also increased the transcript abundance of a carotenoid cleavage dioxygenase in another study on Chardonnay grapes (Mathieu et al. 2005). In Chardonnay, the specific effects of water deficit on the carotenoid pathway are probably related to volatile production and photoprotection (Terrier et al 2005). Grape-derived C l3 norisoprenoids are very importantto the aroma of both white and red wines (Sefton et al. 1989). C 13 norisoprenoids arise from carotenoid degradation and are present in grapes in the free or glycoside form. Although the glycoside precursors cannot be hydrolyzed by grape and yeastglycosidases, they are hydrolyzed under acidic conditions, directly incorporated or converted into other more powerful aroma-active compounds, and contribute to the wine aroma (Skouroumounis and Winterhalter 1994). C l3 norisoprenoids contribute to complex aromas, including berry, honey, and fruity in many wines. ~-Damascenone has a complex smell of flowers, tropical fruit and stewed apple, and a very low olfactory perception threshold of 0.05 J.l.g/L in ethanol. In one irrigation study, it was found that wines from 35% ETc treatments had substantially 160
183 higher concentrations of ~-damascenone in all vintages compared to wines from 100% ETc (Qian et al. 2009). The transcript abundance of several different lipoxygenases was also increased significantly by water deficit in Chardonnay grapes (Deluc et al. 2009). These lipoxygenases convert the fatty acid and linolenic acid to hydroperoxides, which through several other enzymatic steps lead to the formation of volatile esters in wines (Feussner and Wasternack 2002). In the next step of this pathway, the hydroperoxides are converted to grassy-flavored volatile aldehydes like hexenal and hexenal-3-al by hydroperoxide lyase (Duan et al. 2005). Hexenal can be converted to hexanol, another grassy aroma, by alcohol dehydrogenases (Tesniere et al. 2006). Three-fold increases were detected in a fruity aroma compound (hexyl acetate) in water deficit Chardonnay wines (Deluc et al. 2009). Under drought conditions, vines could experience both poor shoot growth and fruit composition development. Irrigation is necessary to improve the water status of the vine. Irrigation resulted in wines with greater intensities of apple, citrus, and floral aromas and reduced earthy aroma in Chardonnay wines (Reynolds et al. 2007). Deficit irrigation induces an increased level of synthesis of volatile and volatile precursors in the grapes. Limited water availability also reduces vine vigor, and thus increases berry sun exposure and berry temperature, which accelerates degradation of carotenoids, and enhances the formation of some volatile compounds (Qian et al. 2009). In addition, deficit irrigation might affect grape maturity, resulting in difference in volatile concentration. The sensory profiles of the wines depicted by radar diagrams showed that many variables were strongly affected by both the amount of water in the soil and the initiation time (Figs and 4.12). However, the sensory profile varied from vintage to vintage. Temperature and light intensity showed high variation in both years studied (data not shown). It was speculated that along with soil moisture, these two factors have also a great effect on the wine sensory profile. In agreement with the present results, other two studies suggested that deficit irrigation alters several sensory attributes of the wine as well as the concentration of carotenoids and their derivatives in berries, as compared to standard irrigation grapevines (Bindon et al. 2007, Chapman et al. 2005). Water deficits led to wine with more fruity and less vegetal aromas than those from vines withhigh water status (Chapman et al. 2005). According to these authors, water deficits led to a greater flux of carbon through alternative biosynthetic pathways leading to an increase in amino acids (precursors of esters in wines) and in carotenoids, and resulting in a more fruity aromas. Deficit irrigation leads also to an increase in the concentration of hydrolytically released Cn- 161
184 norisoprenoids (B-damascenone, B-ionone and 1,l,6-trimethyl-1,2-dihydronaphthalene) in Vitis vinifera grapes (Bindon et al. 2007). Relationships among soil and plant water status, yield components, berry composition, and sensory data. The PLS regression petfonned on the full data set of 2006 illustrates the relationship established among data sets collected (Fig. 4.13). Vine size was negatively correlated with fruittree and raisin, and positively correlated with banana. This suggests that these aroma descriptors are related to high water status in the vine. Cluster weights, acidity, butterscotch, nutty and musty were very well correlated with soil moisture. At moderate intensity, these attributes could bring complexity into the wine while at high intensity they are associated with some degree of oxidation and subsequently having a negative effect on the quality. Citrus character showed moderate correlation with the number of clusters per vine and berry weight, and no correlation with the number of berries per cluster. This suggests that the weather conditions from the previous season might accentuate the negative effect of high water status through the high number of clusters per vine. Shading due to high canopy in well irrigated treatments or competition for carbohydrates might have a negative effect on grape quality. The same negative effect could occur due to low canopy and high exposure to solar radiation, which increases catabolic pathway of the aroma compounds in water deficits treatments. Banana, butterscotch and nutty were highly correlated with acidity and moisture at 10 and 60 em depth. In order to have a bigger picture of the relationships among different variables, a PLS regression was perfonned on the completely 2007 data set (Fig. 4.14). The PLS plot illustrated that in wine the ethanol concentration and stony fruit aroma were positively correlated with each other but negatively correlated with banana, nutty, fresh grass, raisin and wine ph. Fruit tree was positively correlated with leaf temperature and Brix, and negatively correlated with the number of clusters per vine, honey and banana attributes. Physiological variables like Ts and leaf 'I' were positively associated with soil water status. However, butterscotch, rhubarb and raisin aroma were negatively correlated with water status level suggesting that under particular climatic conditions perhaps more volatile precursors are produced and released into the wine during the fermentation (Fig. 4.14) Field and yield component data were also analyzed by PLS regression analysis in 2008 (Fig. 4.15). The PLS plot illustrated that vine size was positive associated with soil moisture at 20, 30 and 40 em, and negatively correlated with leaf '1'. Berry weight was positively correlated with onrix, and negatively correlated with the number of clusters per vine and yield. This suggests that 162
185 general climatic conditions can have a great effect on vine performance. Contrary to the results from 2006 and 2007, data from 2008 indicated overall no dilution effect due to high moisture in the soil (Fig. 4.15). This suggested that a balance was established between vegetative and fruit growth. However, vigor cannot be considered a strong predictor for grape quality for this particular year (2008). The PLS data showed different relationships among leaf '!', Ts rate and soil moisture on the soil profile over the period studied. In 2006, it was found the highest correlation between Ts and leaf,!" the latter being highly associated with soil moisture at 20 and 40 cm depth (Fig. 4.13). In 2007, Ts and leaf '!' were less correlated, being associated with soil moisture at 30 and 100 cm (Fig. 4.14). However, in 2008 the two physiological variables measured were not correlated (Fig. 4.15). These different relationship patterns found over the period studied indicate that the Chardonnay's anisohydric behavior is relative and might be affected by other factors rather than soil moisture. Conclusions All the vine physiological variables (e.g. leaf,!" Ts rate) responded to the % ETc treatments and irrigation timings. In dry and hot years like 2007, irrigation treatments, especially the 50% and 25% ETc treatments applied at veraison, particularly improved the general vine physiology and wine sensory profiles (varietal typicity). Even in years considered wet but warm with erratic rainfall distribution, wine sensory profiles could be manipulated by deficit irrigation. The 100% ETc cannot be recommended either at fruit set or at veraison, because of its direct or indirect negative effect on wine quality. Therefore, full irrigation applied either at fruit set or veraison is not recommended. Deficit irrigation treatments, on the other hand, showed overall positive effects not only on general vine physiology but also on yield and wine sensory profiles, especially in very hot and dry years such as These results supported findings of others who found that irrigation affects red winegrapes more than white cultivars suffering from water stress. However, this should not be generalized for all years and cultivars. Another outcome from this research, which is partially confmned, is that the root distribution can be manipulated by drip irrigation. Although root distribution was not measured, soil moisture was measured at several depths in the soil profile. These data suggested that the root system might be stimulated to develop in the upper portion of the soil profile (20 to 40 cm). It therefore appears reasonable that grape growers could control the active root zone by using deficit 163
186 irrigation, and by closely monitoring and controlling soil moisture at different soil depths, they can control vine vigor as well. However, future research should be undertaken to find the relationship among soil water status, root system development and rootstock. More research should be done to add greater precision to the calculation method for the vine water needs in cool regions. However, due to the high variability in climatic conditions in Niagara Peninsula it is suggested that long-term studies are needed to improve the understanding of the effect of different irrigation regimes, scheduling times on various cultivars and under various climatic conditions in order to validate different trends. Also, more research should be focused on understanding which aroma volatiles are mostly affected by vine water status, and how and when their metabolic pathways are affected by the soil water deficits. Although large differences in vine physiological activity were observed in response to irrigation, they were not necessarily translated into changes in yield, berry composition and wine sensory profiles. Water status effects varied with respect to vintage and might vary according to cultivar as well. A better understanding of how drought affects vine physiology and the ripening process at the molecular level will lead to approaching techniques of vine manipulation that minimize the negative effects of weather variation. The adoption of appropriate irrigation scheduling practices could lead to increased yields and greater profit for grape growers, significant water savings, reduced environmental impact of irrigation, and improved sustainability of irrigated agriculture. Since the level of vine water status determines multiple and complex reactions that are dependable on the interactions among soil, vine and climate conditions, irrigation experiments should be conducted for a longer period of time in order to validate the beneficial effects of the irrigation strategies used in the present research. Literature Cited Allen, R.G., L.S. Pereira, D. Raes, and M. Smith Crop evapotranspiration: Guidelines for computing crop water requirements. FAO Irrigation and Drainage Paper 56, Rome. 300p Alleweldt, G., and E. Ruhl Untersuchungen zum Gaswechsel der Rebe.ll. Einfluss langanhaltender Budentrockenheit auf die Leistungsfahigkeit verschieldener Rebsorten. Vitis 21: Alleweldt, G., and W. Hofacker Influence of environmental factors on sprouting, flowering, fruitfulness and shoot growth in vines. Vitis 14: Alsina, M.M., F. de Herralde, X. Aranda, R. Save and C. Biel Water relations and vulnerability to embolism are not related: experiments with eight grapevine cultivars. Vitis 46:
187 Arrhenius, S.P., L.P. McCloskey, and M. Sylvan Chemical markers for aroma of Vitis vinifera var. Chardonnay regional wines. J. Agric. Food Chern. 44: Balint, G. and AG. Reynolds Effect of different irrigation strategies on vine physiology and grape quality of Cabemet Sauvignon and Sauvignon blanc in a cool-climate area. Prog. Agric. Vitic. 127(11): Bertrand, A Volatiles from grape must fermentation. pp In: Flavour of Distilled Beverages: Origin and Development. Piggot J.R. (Ed.), E. Horwood Ltd, Chichester, West Sussex. Bindon, K.A, P.R. Dry, and B.R. Loveys Influence of plant water status on the production of C13-norisoprenoid precursors in Vitis vinifera L. cv. Cabemet Sauvignon grape berries. J. Agric. Food Chern. 55: Bindon, K.A, P.R. Dry, and B.R. Loveys Influence of partial rootzone drying on the composition and accumulation of anthocyanins in grape berries (Vitis vinifera cv. Cabemet Sauvignon). Austral. J. Grape Wine Res 14: Bravdo, B., Y. Hepner, C. Loinger, and H. Tabacman Effect of irrigation and crop level on growth, yield and wine quality ofcabemet Sauvignon. Am. J. Enol. Vitic. 36: Bravdo, B., and O. Shoseyov Aroma studies of wines and fruits in Israel. Acta Hort. 526: Buttrose, M.S Fruitfulness in grapevines: Effects of changes in temperature and light regimes. Bot. Gaz. 130: Buttrose, M.S Fruitfulness in grapevines: the response of different cultivars to light, temperature and day length. Vitis 9: Buttrose, M.S. 1974a. Climatic factors and fruitfulness in grapevines. Hort. Abstr. 44: Buttrose, M.S. 1974b. Fruitfulness in grapevines: Effects of water stress. Vitis 12: Callo, M.P., J.P. Borras, AJ. Lopez and F.X. Rius Influence of the state of ripeness of Chardonnay grapes on wine composition. II. Terpenes and carboxylic acids, Acta Aliment. 20: Carbonneau, A, and P. Casteran Irrigation-depressing effect on floral initiation of Vitis vinifera L. cv. Cabemet Sauvignon grapevines in Bordeaux area. Am. J. Enol. Vitic. 30:3-7. Chapman, D.M., G., Roby, S.E. Ebeler, JX. Guinard, and M.A Matthews Sensory attributes of Vitis vinifera L. cv. Cabemet Sauvignon wines made from vines with different water status. Austral. J. Grape Wine Res. 11: Chaves, M.M., J. Flexas, and C. Pinheiro Photosynthesis under drought and salt stress: regulation mechanisms from whole plant to cell. Ann. Bot.103: Chaves, M.M., P.C. Harley, J.D. Tenhunen, and O.L. Lange Gas exchange studies in two Portuguese grapevine cultivars. Physiol. Plant. 70: Chaves, M.C., c.r. Souza, T.P. Santos,M.F. Ortuno, M.L. Rodrigues, C.M. Lopes, J.P. Maroco, and J.S. Pereira Deficit irrigation in grapevine improves water-use efficiency while controlling vigour and production quality. Ann. Appl. BioI. 150: Chone, X., C. Van Leeuwen, D. Dubourdieu and J. P. Gaudillere Stem water potential is a sensitive indicator of grapevine water status. Ann. Bot. 87:
188 Clingeleffer, P.R., S. Martin, M. Krstic, and G.M. Dunn Crop development, crop estimation and crop control to secure quality and production of major wine grape varieties: A national approach. Final report to grape and wine research and development corporation. GWRCD, Wayville, SA, Australia. Cramer, G.R, A Ergul, and J. Grimpler Water and salinity stress in grapevines: early and late changes in transcript and metabolite profiles. Funct. Integ. Genomics 7: Dai, A, T.M.L. Wigley, B.A Boville, J.T. Kiehl, and L.E. Buja Climates ofthe twentieth and twenty-first centuries simulated by the NCAR climate system model. 1. Climate 14: Deluc, L.G., D.R Quilici, and A Decendit Water deficit alters differentially metabolic pathways affecting important flavour and quality traits in grape berries of Cabernet Sauvignon and Chardonnay. BMC Genomics 10: Dragoni, D., AN. Lakso, RM. Piccioni, and 1.M. Tarara Transpiration of grapevines in the humid Northeastern United States. Am. J. Enol. Vitic. 57: Dry, P.R Canopy management for fruitfulness. Austral. J. Grape Wine Res. 6: Dry, P.R, and B.R Loveys Factors influencing grapevine vigour and the potential for control with partial rootzone drying. Austral. J. Grape Wine Res. 4: Dry, P.R, and B.R Loveys Grapevine shoot growth and stomatal conductance are reduced when part of the root system is dried. Vitis. 38: Dry, P.R, and B.R Loveys Partial drying of the rootzone of grape. I. Transient changes in shoot growth and gas exchange. Vitis 39:3-7. Dry, P.R, B.R Loveys, M.G. McCarthy, and M. Stoll Strategic irrigation management in Australian vineyards. J. Int. Sci. Vigne Vin 35: Duan, H., M.Y. Huang, K. Palacio, and M.A. Schuler Variations in CYP74B2 (Hydroperoxide Lyase) gene expression differentially affect hexenal signaling in the Columbia and Landsberg erecta ecotypes of Arabidopsis. Plant Physiol. 139: Dunn, G.M., and S.R Martin A functional association in Vitis vinifera L. cv. Cabernet Sauvignon between the extent of primary branching and the number of flowers formed per inflorescence. Austral. J. Grape Wine Res. 13: During, H., and G. Alleweldt Der Jahresgang der Abscisinsaure in vegetativen organen von reben. Vitis 12: Edson, C.E., G.S. Howell, and J.A Flore Influence of crop load on photosynthesis and dry matter partitioning of Seyval grapevines. I. Single leaf and whole vine response pre- and postharvest. Am. J. Enol. Vitic. 44: Escalona, J.M., 1. Flexas, J. Bota, and H. Medrano Distribution of leaf photosynthesis and transpiration within grapevine canopies under different drought conditions. Vitis 42: Esteban, M.A, M.J. Villanueva and J.R. Lissarrague Effect of irrigation on changes in berry composition of Tempranillo during maturation. Sugars, organic acids and mineral elements. Am. J. Enol. Vitic. 50: Ferreira, V.P., P. Hernandez-Orte, A Escudero, R Lopez and 1. Cacho Semipreparative reversed-phase liquid chromatographic fractionation of aroma extracts from wine and other alcoholic beverages, J. Chromat. A. 864:
189 Fereres, E., and D. Goldhamer Suitability of stem diameter variation and water potential as indicator for irrigation scheduling of almond trees. J. Hort. Sci. Biotech. 78: Feussner, I., and C. Wasternack The lipoxygenase pathway. Ann. Rev. Plant BioI. 53: Flexas, J., M. Badger, W.S. Chow, H. Medrano, and C.B. Osmond Analysis of the relative increase in photosynthetic O 2 uptake when photosynthesis in grapevine leaves is inhibited following low night temperatures and/or water stress. Plant Physiol. 121: Flexas J., J. Bota, J.M. Escalona, B. Sampol, and H. Medrano Effects of drought on photosynthesis in grapevines under field conditions: an evaluation of stomatal and mesophyll limitations. Funct. Plant BioI. 29: GaudilIere, J.P., C. Van Leeuwen, and N. OlIat Carbon isotope composition of sugars in grapevine, an integrated indicator of vineyard status. J. Exp. Bot. 53: Girona, J., M. Mata, J. del Campo, A Arbones, E. Bartra, and J. Marsal The use of midday leaf water potential for scheduling deficit irrigation in vineyards. Irrig. Sci. 24: Goldhamer, D., E. Fereres, M. Mata, J. Girona, and M. Cohen Sensitivity of continuous and discrete plant and soil water status monitoring in peach trees subject to deficit irrigation. J. Amer. Soc. Hort. Sci. 4: Gomez-del-Campo, M., C. Ruiz, and J.R. Lissarrague Effect of water stress on leaf area development, photosynthesis, and productivity in Vitis vinifera L. cv. Chardonnay and Airen grapevines. Am. J. Enol. Vitic. 53: Greven, M., S. Green, S. Neal, B. Clothier, M. Neal, G. Dryden, and P. Davidson Regulated deficit irrigation (RDI) to save water and improve Sauvignon Blanc quality? Water Sci. Technol. 51:9-17. Guth, H Quantification and sensory studies of character impact odorants of different white wine varieties. J. Agric. Food Chern. 45: Hall, A., D.W. Lamb, B. Holzapfel, and J. Louis Optical remote sensing applications in viticulture: A review. Austral. J. Grape Wine Res. 8: Hardie, W.J., and J.A Considine Response of grapes to water-deficit stress in particular stages of development. Am. J. Enol. Vitic. 27: Heath, O.V.S., and B. Orchard Midday closure of stomata. Nature 180: Heath, O.V.S., and H. Meidner Effects of carbon dioxide and temperature on stomata of Allium cepa L. Nature 180: Hepner,Y., B. Bravdo, C. Loinger, S. Cohen, and H. Tabacman Effect of drip irrigation schedules on growth, yield, must composition and wine quality of Cabernet Sauvignon. Am. J. Enol. Vitic. 36: Hetherington, AM., and F.I. Woodward The role of stomata in sensing and driving environmental change. Nature 424: nand, P.G., and P. Gago Australian wine from the vine to the glass, Patrick nand Wine Promotions, Adelaide, Australia. 206p. Itai, Y., and Y. Vaadia Kinetin-like activity in root exudate of water stressed sunflower plants. Physiol. Plant. 18:
190 Jackson, D., and P. Lombard Environmental and management practices affecting grape composition and wine quality-a review. Am. 1. Enol. Vitic. 44: Jako, N The relationship between nitrogen phosphorus, potassium and magnesium nutrition and growth of grapevines and cytokinin production by the roots. Szoleszet Borazet 1: Jarvis, P.G., and K.G. McNaughton Stomatal control of transpiration: scaling up from leaf to region. Adv. Ecol. Res. 15:1-49. Kauffman, M Leaf conductance as a function of photosynthetic photon flux density and absolute humidity difference from leaf to air. Plant Physiol. 69: Keller, M Deficit irrigation and vine mineral nutrition. Am. J. Enol. Vitic. 56: Kingston, M.S., and E.W. Presant The Soils of the Regional Municipality of Niagara. Report of the Ontario Institute of Pedology, Guelph, ON. Kliewer, W.M Effect of root temperature on budbreak, shoot growth, and fruit-set of Vitis vinifera L. cv. Cabernet Sauvignon grapevines. Am. J. Enol. Vitic. 26: Koundouras, S., V. Marinos, A. Gkoulioti, Y. Kotseridis, and C. Van Leeuwen Influence of vineyard location and vine water status on fruit maturationof non-irrigated cv. Agiorgitiko (Vitis vinifera L.). Effects on wine phenolics and aroma components. J. Agric. Food Chern. 54: Lebon, E., A. Pellegrino, G. Louarn, and J. Lecoeur Branch development controls leaf area dynamics in grapevine (Vitis vinifera) growing in drying soil. Ann. Botan. 98: Lee, S.J., and A. Noble Characterization of odor-active compounds in Californian Chardonnay wines using GC-olfactometry and GC-mass spectrometry. J. Agric. Food Chern. 51 : Livne, A. and Y. Vaadia Water deficits and hormone relations. pp In: Water Deficits and Plant Growth. Vol. 3. Kozlowski, T.T. (Ed.) Academic Press, New York. Loveys, B.R Diurnal changes in water relations and abscisic acid in field grown Vitis vinifera cultivars. III. The influence of xylem-derived abscisic acid on leaf gas exchange. New Phytol. 98: Loveys, B., P. Dry, M. Stoll, and C. McCarthy Using plant physiology to improve the water use efficiency of horticultural crops. pp In: Proc. 3rd International Symposium on Irrigation of Horticultural Crops, Ferreira and Jones (Eds.), Estoril, Portugal Acta Hort. Loveys, B.R., and P.E. Kriedemann Rapid changes in abscisic acid-like inhibitors following alterations in vine leaf water potential. Physiol. Plant. 28: Lovisolo, c., W. Hartung, and A. Schubert Whole-plant hydraulic conductance and root-toshoot flow of abscisic acid are independently affected by water stress in grapevines. Funct. Plant BioI. 29: MacGregor, C.A Cool climate crop estimation: site specific. pp In: Proc. of Fifth International Symposium on Cool Climate Viticulture and Oenology, 16-20th January, 2000, Melbourne, Australia. Maroco, J.P., M.L. Rodrigues, C. Lopes, and M.M. Chaves Limitations to leaf photosynthesis in field-grown grapevine under drought - metabolic andrnodelling approaches. Funct. Plant BioI. 29:
191 Martin, D.L., E.C. Stegman, and E. Fereres Irrigation scheduling principles. pp In: Management on farm irrigation systems. American Society of Agricultural Engineers, Hoffman, G.J., Howell, T.A. and Solomon, K.H. (Eds.), Madison, Wisconsin. Mathieu, S., N. Terrier, J. Procureur, F. Bigey, and Z. Giinata A carotenoid cleavage dioxygenase from Vilis vinifera L.: functional characterization and expression during grape berry development in relation to C13-norisoprenoid accumulation. J. Exp. Bot.56: Matthews, M.A. and M.M. Anderson Fruit ripening in Vilis vinifera L.: Responses to seasonal water deficits. Am. J. EnoL Vitic. 39: Matthews, M.A., G. Cheng, and S.A. Weinbaum Changes in water potential and dermal extensibility during grape berry development. J. Amer. Soc. Hortic. Sci. 112: Matthews, M.A., R Ishii, M.M. Anderson, and M. O'Mahony Dependence of wine sensory attributes on vine water status. J. Sci. Food and Agri. 51: Medrano, H., J.M. Escalona, J. Cifre, J. Bota, and J. Flexas A ten-year study on the physiology of two Spanish grapevine cultivars under field conditions: Effects of water availability from leaf photosynthesis to grape yield and quality. Funct. Plant BioI. 30: Menary, RC., and J.v. Staden Effect of phosphorus nutrition and cytokinins on flowering in the tomato, Lycopersicum esculenlum Mill. Austral. J. Plant Physiol. 3: Meriaux, S., H. Rollin, and P. Rutten Effets de la secheresse sur quelques phenomenes de croissance de l'appareil vegetatif de la vigne. Conn. Vigne Yin 2: Miller, D.P., G.S. Howell, and J.A. Flore Effect of shoot number on potted grapevines. I. Canopy development and morphology. Am. J. Enol. Vitic. 47: Moncur, M.W., K. Rattingan., D.H. Mackenzie, and G.N. McIntyre Base temperatures for budbreak and leaf appearance of grapevines. Am. J. Enol. Vitic. 40: Morlat, R, M. Penavayre, A. Jacquet, C. Asselin, and C. Lemaitre fufluence des terroirs sur Ie fonctionnement hydrique et al photosynthese de la vigne en millesime exceptionnellement sec (1990). Consequence sur la maturation du raisin. Intern. J. Vine and Wine Sci. 26: Myburgh, P.A Response of Vilis vinifera L. cv. BarlinkaJRamsey to soil water depletion levels with particular references to trunk growth parameters. S. Afr. J. Enol. Vitic. 17:3-14. Myburgh, P.A Responses of Vilis vinifera L. cv. Sultanina to water deficits during various pre- and post-harvest phases under semi-arid conditions. S. Afr. J. Enol. Vitic. 24: Naor, A Irrigation and crop load influence fruit size and water relations in field grown "Spadona" Pear. J. Amer. Soc. Hort. Sci. 126: O'Mahoney, M Sensory evaluation of food. Statistical methods and procedures. Marcel Dekker Inc., New York. 487p. Ough, C. S., L.A. Lider, and J.A. Cook Rootstock-Scion interactions concerning wine making. I. Juice composition changes and effects on fermentation rate with St. George and 99- R rootstocks at two nitrogen fertilizer levels. Am. J. Enol. Vitic. 19: Peacock, B., P. Christensen, and L. Williams Water management and irrigation scheduling. pp In: Raisin Production in California. University of California Division of Agricultural and Natural Resources. 169
192 Peacock, W.L., L.P. Christensen, and H.L. Andris Development of a drip irrigation schedule for average-canopy vineyards in the San Joaquin Valley. Am. J. Enol. Vitic. 38: Peterlunger, E., P. Sivilotti, C. Bonetto, and M. Paladin Water stress induces changes in polyphenol concentration in Merlot grapes and wines. Riv. Vitic. Enol. 1: Petrie, P.R and P.R Clingeleffer Effects of temperature and light (before and after budburst) on inflorescence morphology and flower number of Chardonnay grapevines (Vitis vinifera L.). Austral. J. Grape Wine Res. 11 : Poni, S., F. Bernizzoni, S. Civardi, M. Gatti, D. Porro and F. Camino Performance and wateruse efficiency (single-leaf vs. whole-canopy) of well-watered and half-stressed split-root Lambrusco grapevines grown in Po Valley (Italy). Agric. Eco. Envir. 129: Qian, M.C., Y. Fang, and K. Shellie Volatile composition of Merlot wine from different vine water status. J. Agric. Food Chern. 57: Reynolds, A.G Irrigation management in the East: How much is enough? Wine East 35(5): Reynolds, AG., A Ehtaiwesh, and C. de Savigny Irrigation scheduling for 'Sovereign Coronation' table grapes based on evapotranspiration calculations and crop coefficients. HortTech.19: Reynolds, AG., W. Lowrey, L. Tomek, J. Hakimi, and C. de Savigny Influence of irrigation on vine performance, fruit composition, and wine quality of Vitis vinifera L. cv. Chardonnay in a cool, humid climate. Am. J. Enol. Vitic. 58: Reynolds, AG. and AP. Naylor Pinot noir and Riesling grapevines respond to water stress duration and soil water-holding capacity. HortScL 29: Reynolds, AG., and D.A Wardle Flavour development in the vineyard. S. Afr. J. Enol. Vitic. 18:3-18. Reynolds, AG., D.A Wardle, and AP. Naylor Impact of training system and vine spacing on vine performance and berry composition of Chancellor. Am. J. Enol. Vitic. 46: Reynolds, AG, D.A Wardle, and AP. Naylor, Impact of training system, vine spacing, and basal leaf removal on Riesling vine performance, berry composition, canopy microclimate and vineyard labour requirements. Am. J. Enol. Vitic. 47: Roby, G., J.F. Harbertson, D.O. Adams, and M.A Matthews Berry size and vine water deficits as factors in winegrape composition: Anthocyanins and tannins. Austral. J. Grape Wine Res. 10: Rogers, C.A, P.J.H. Sharpe, and RD. Powell High temperature disruption of guard cells of Vicia/aha. Effect on stomatal aperture. Plant Physiol. 67: Rogiers, S.Y., D.H. Greer, RJ. Hutton, and J.1. Landsberg Does night-time transpiration contribute to anisohydric behaviour in a Vitis vinifera cultivar? J. Exp. Bot. 60: Sanchez, L.A, and N.K. Dokoozlian Bud microclimate and fruitfulness in Vitis vinifera L. Amer. J. Enol. Vitic. 56: Santos, T.P., C.M. Lopes, M.L. Rodrigues, C.R de Souza, J.P. Maroco; J.S. Pereira, J.R. Silva, and M.M. Chaves Partial rootzone drying: effects on growth and fruit quality of fieldgrown grapevines (Vitis vinifera). Funct. Plant BioI. 30:
193 Santos, T.P., C.M. Lopes, M.L. Rodrigues, c.r. de Souza, J.P. Maroco, J.S. Pereira, J.R. Silva, and M.M. Chaves Effects of partial root-zone drying irrigation on cluster microclimate and fruit composition of field-grown Castelao grapevines. Vitis 44: Santos, T.P., M. Lopes, M.L. Rodrigues, C.R. de Souza, J.M. Ricardoda- Silva, J.P. Maroco, J.S. Pereira and M.M. Chaves Effect of deficit irrigation strategies on cluster microclimate for improving fruit composition of Moscatel field-grown grapevines. Sci. Hort. 112: Schlosser, J., A.G. Reynolds, M. King, and M. Cliff Canadian terroir: Sensory characterization of Chardonnay in the Niagara Peninsula. Food Res. Int. 38: Schultz, H.R Water relation and photosynthetic responses of two grapevine cultivars of different geographical origins during water stress. Acta Hort. 427: Schultz, H.R Differences in hydraulic architecture account for near-isohydric and anisohydric behaviour of two field-grown Vitis vinifera L. cultivars during drought. Plant Cell Envir. 26: Schultz, H.R., and M.A. Matthews Resistance to water transport in shoots of Vitis vinifera L. Relation to growth at low water potential. Plant Physiol. 88: Sefton, M., I.L. Francis, and P.Winterhalter The volatile composition of Chardonnay juices: a study by flavour precursors analysis. Am. J. Enol. Vitic. 44: Sefton, M.A., G.K Skouroumounis, R.A. Massy-Westropp, and P.J. Williams, Norisoprenoids in Vitis vinifera white wine grapes and the identification of a precursor of damascenone in these fruits. Austral. J. Chern. 42: Selles, G., and A. Berger Physiological indicator of plant water status as criteria for irrigation scheduling. Acta Hort. 278: Shackel, KA., H. Ahmadi, W. Biasi, R. Buchner, D. Goldhamer, S. GUfUsinghe, J. Hasey, D. Kester, B. Krueger, B.B. Lampinen, G. McGourty, W. Micke, E. Mitcham, B. Olsen, K Pelletrau, H. Philips, D. Ramos, L. Scheankl, S. Sibbert, R. Snyder, S. Southwick, M. Stevenson, M. Thorpe, S. Weinbaum, and J. Yeager Plant water status as an index of irrigation need in deciduous fruit trees. HortTech. 7: Shaulis, N.J., and R.E Smart Grapevine canopies: management, microclimate and yield responses. pp In: Proceedings XIX International Horticultural Congress, Warsaw, Poland. Vol. III. R. Antoszewski et al. (Eds.), Soc. of Horticultural Science, Polish Academy of Science, Warsaw. Skouroumounis, G.K, and P. Winterhalter Glycosidically bound norisoprenoids from Vitis Vinifera Cv. Riesling leaves. J. Agric. Food Chern. 42: Simpson, R.F Some important aroma components of white wines. Food Tech. Australia 31: Simpson, R.F., and G.c. Miller Aroma composition of Chardonnay wine. Vitis 23: Smart, R.E Aspects of water relations of the grapevine (Vitis vinifera). Am. J. Enol. Vitic. 25: Smart, R.E., and B.G. Coombe Water relations of grapevines. pp In: Water Deficits and Plant Growth. Vol. VII. Additional Woody Crop Plants. Kozlowski, T.T. (Ed.), Academic Press, New York. 171
194 Smith, H.E The compositional basis of the aroma of Riesling and unwooded Chardonnay wine. PhD Thesis. School of Agriculture and Wine, Faculty of Science, University of Adelaide. 220p. Smithyman, RP., RL. Wample, and N.S. Lang Water deficit and crop level influences on photosynthetic strain and blackleaf symptom development in Concord grapevines. Am. J. Enol. Vitic. 52: Soar, C.J., J. Speirs, S.M. Maffei, AB. Penrose, M.G. McCarthy, and B.R Loveys Grape vine varieties Shiraz and Grenache differ in their stomatal response to VPD: apparent links with ABA physiology and gene expression in leaf tissue. Austral. J. Grape Wine Res. 12:2-12. Sommer, KJ., M.T. Islam, and P.R. Clingeleffer Light and temperature effects on shoot fruitfulness in Vitis vinifera L. cv. Sultana: Influence of trellis type and grafting. Austral. J. Grape Wine Res. 6: Souza, e.r., J.P. Maroco, and T.P. Santos Partial rootzone-drying: regulation of stomatal aperture and carbon assimilation in field grown grapevines (Vitis vinifera cv Moscatel). Funct. Plant BioI. 30: Souza, e.r., J.P. Maroco, and T.P. Santos. 2005a. Impact of deficit irrigation on water use efficiency and carbon isotope composition (&13C) of field-grown grapevines under Mediterranean climate. J. Exp. Bot. 56: Souza, C.R., J.P. Maroco, T.P.Santos, M.L. Rodrigues, C. Lopes, J.S. Pereira and M.M. Chaves. 2005b. Control of stomatal aperture and carbon uptake by deficit irrigation in two grapevine cultivars. Agric. Ecosys. Envir. 106: Srinivasan, C., and M.G. Mullins Control of flowering in the grapevine (Vitis vinifera L.). Formation of inflorescences in vitro by isolated tendrils. Plant Physiol. 61: Srinivasan, c., and M.G. Mullins Flowering in Vitis: Conversion of tendrils into inflorescences and bunches of grapes. Planta 145: Srinivasan, C., and M.G. Mullins Flowering in the grapevine (Vitis vinifera L.): Histochemical changes in apices during the formation of the anlagen and its derivatives. Z. Pflanzenphysiol. 97: Stevens, RM., G. Harvey and D. Aspinall Grapevine growth of shoots and fruit linearly correlate with water stress indices based on root-weighted soil matric potential. Austral. J. Grape Wine Res. 1 : Stevens, R.M., J.M. Pech, M.R Gibberd, RR Walker, J.A Jones, J. Taylor, and P.R Nicholas Effect of reduced irrigation on growth, yield, ripening rates and water relations of. Vitis vinifera L. cv. Chardonnay vines grafted to five rootstocks. Austral. J. Grape Wine Res. 14: Terrier, N., D. Glissant, and J. Grimplet Isogene oligo arrays revealed multifaceted changes in gene expression during grape berry (Vitis vinifera L.) development. Planta 222: Tesniere, c., L. Torregrosa, M. Pradal, J.M. Souquet, e. Gilles, K. Dos Santos, P. Chatelet, and Z. Gunata Effects of genetic manipulation of alcohol dehydrogenase levels on the response to stress and the synthesis of secondary metabolites in grapevine leaves. J. Exp. Bot.57 : Vaadia, Y., and AN. Kasimatis Vineyard irrigation trials. Am. J. Enol. Vitic. 12: Van der Gulik, T B.C. Trickle Irrigation Manual. Engineering Branch, British Columbia Ministry of Agriculture and Fisheries, Abbotsford, Be. 172
195 Van Leeuwen, C., P. Friant, Philippe, X. Chone, Xavier, 0. Tregoat, S. Koundouras, and D. Dubourdieu Influence of climate, soil, and cultivar on terroir. Am. J. Enol. Vitic : Van Leeuwen, e., and G. Seguin Incidences de 1'alimentation en eau de la vigne, apprecie par l' etat hydrique du feuillage, sur Ie developpement de l' appareil vegetatife la maturation du raisin (Vitis vinifera variete Cabemet franc, Saint-Emilion, 1990). J. Int. Sci. Vigne et du Yin 28: VanLeeuwen, e., and G. Seguin The concept of terroir in viticulture. J. Wine Res. 17: Van Zyl, J.L Response of Col om bar grapevines to irrigation as regards quality aspects and growth. S. Afr. J. Enol. Vitic. 5: Vandeleur, RK Grapevine roots hydraulics. The role of aquaporins. PhD thesis. School of Aghriculture, Food and Wine, University of Adelaide, Australia. 195p. Vandeleur, RK., G. Mayo, M.C. Shelden, M. Gillihamn, B.N. Kaiser, and S.D. Tyerman The role of plasma membrane intrinsic protein aquaporins in water transport through roots: diurnal and drought stress responses reveal different strategies between isohydric and anysohydric cultivars of grapevine. Plant Physiol. 149: Vasconcelos, M.C., M. Greven, e. Winefield, M.e.T. Trought, and V. Raw The flowering process of Vitis vinifera: A review. Am. J. Enol. Vitic. 60: Vincent, D, A. Erglil, A, M.C. Bohlman, E.A. Tattersall, R.L. Tillett, M.D. Wheatley, R. Woolsey, D.R Quilici, J. Joets, K. Schlauch, D. Shooley, J.e. Cushman, and G.C. Cramer Proteomic analysis reveals differences between Vitis vinifera L. cv. Chardonnay and cv. Cabemet Sauvignon and their responses to water deficit and salinity. J. Exp. Bot. 58: Wample, R.L., and R Smithyman Regulated deficit irrigation as a water management strategy in Vitis vinifera production. FAO Deficit Irrigation Practices: Water Reports 22. Pgs FAO, Rome. Williams, L.E Grape. pp In: Photoassimilate Distribution in Plants and Crops: Source-Sink Relationships. Zamski, E. (Ed.): Marcel Dekker, New York. NY. Williams, L.E Irrigation of grapevines in California. pp In: Proceedings J oumee Professionelle (Gestion de 1'eau dans Ie vignobles) XII GESCO, Montpellier, Groupe Europeen d'etude des Systemes de Conduite de la Vigne. Williams, L.E Irrigation of winegrapes in California. Practical Winery, Nov-Dec. Williams, L.E., and D.W. Grimes Modelling vine growth: Development of a data set for a water balance subroutine. pp In: Proceedings of the Sixth Australian Wine Industrial and Technical Conference. T. Lee (ed.), Austral. Ind. Publishers, Adelaide, Australia. Williams, L.E., and M.A. Matthews Grapevine. pp In: Irrigation of Agricultural Crops. Agronomy Monograph No. 30. Stewart, B.A. and Nielson, N.R (Eds.), ASA-CSSA-SSSA, Madison, WI. Williams, L.E., C.J. Phene, D.W. Grimes, and TJ. Trout Water use of mature Thompson Seedless grapevines in California. Irrig. Sci. 22: Winkler, A.J., J.A. Cook, W.M. Kliewer, and L.A. Lider General Viticulture. University of California Press, Berkeley. 710p. 173
196 Zelleke, A., and W.M. Kliewer Influence of root temperature and rootstock on budbreak, shoot growth, and fruit composition of Vitis vinifera L. cv. Cabernet Sauvignon grapevines grown under controlled conditions. Am. J. Enol. Vitic. 30: Zs6fi Z., L. Gal, and Z. Szilagyi Use of stomatal conductance and pre-dawn water potential to classify terroir for the grape variety Kekfrankos. Austral. J. Grape Wine Res. 15:
197 List of Tables Table 4.1. The weekly amount of irrigation water applied on a Chardonnay block using ETo calculated with Penman-Monteith equation, Lambert Vineyards, Niagara-on-the Lake, ON, between Table 4.2. Impact of irrigation treatments on yield components and vine size of Chardonnay grapevines, Lambert Vineyards, Niagara-on-the-Lake, ON, Table 4.3. Impact of irrigation treatments on berry composition of Chardonnay, Lambert Vineyards, Niagara-on-the-Lake, ON, Table 4.4. Impact of irrigation treatments on must composition of Chardonnay, Lambert Vineyards, Niagara-on-the-Lake, ON, Table 4.5. Impact of irrigation treatments on wine composition of Chardonnay, Lambert Vineyards, Niagara-on-the-Lake, ON, Table 4.6. Attributes and their standard references used for sensory evaluation of Chardonnay wines, Lambert Vineyards, Niagara-on-the-Lake, ON. Table 4.7. Comparison of mean sensory scores among the irrigation treatments of Chardonnay wines, Lambert Vineyards, Niagara-on-the-Lake, ON, Table 4.8. Comparison of mean sensory scores among the irrigation treatments of Chardonnay wines, Lambert Vineyards, Niagara-on-the-Lake, ON,
198 Table 4.1 The weeldy amount of irrigation water applied in a Chardonnay block using ETo calculated with Penman-Monteith. Lambert Farm. Niae:ara-on-the Lake. ON. between Week 100% ETc 50% ETc 25% ETc 100% ETc 50% ETc 25% ETc 100% ETc 50% ETc 25% ETc mmiw LNIW LNIW LNIW mmiw LNIW LNIW LNIW mmiw LNIW LNIW LNIW *25,50, 100 represent percentage of the water replaced in the soil; ETc- crop evapotranspiration; LNIW -liters/vine/week; mrn/w - total amount of water applied in millimeters/week for full water replacement. 176
199 Table 4.2. Impact of irrigation treatments on yield components and vine size of Chardonnay grapevines, Lambert Vineyards, Niagara-onthe-Lake, ON, Treat. Control 25 Set 50 Set 100 Set 25 Ver. 50 Ver. 100 Ver. Signific. Vine size (kg/vine) Yield (kg/vine) Clusters/vine Cluster wt. (g) Berries/cluster Berry wt.(g) c 0.72 b 1.29 b 5.63 c 6.65 be 6.86 b 40 c 55 a 48c 140b 122c 142b 94b 89b 84b b 1.71 b 1.06 b 0.79 a 1.35 a 7.08 a 7.59a 7.81 ab 42 bc 55 a 54b 172 a 141 a 144 ab 118 a 90b 87 ab a 1.97 a 0.98 c 0.77 a 1.28 b 5.36 c 7.09 b 8.56 a 41 c 53 a 60a 137 b 138 ab 140 b 91 b 87b 83 b a 1.69 bc 1.09 b 0.71 b 1.26 c 5.86 c 6.33 bc 8.44 a 43 b 45b 55b 134 b 144 a 154 a 91 b 104a 92a b 1.67 bc 1.13 a 0.69 b 1.31 b 6.65 ab 7.14 b 7.30 b 41 c 56 a 49 c 165 a 129 b 148 a 109 ab 92 b 85 b b 1.75 b 1.05 b 0.64 c 1.29 b 6.14 b 6.55 bc 6.79 b 46a 55 a 48 c 135 b 123 be 140 b 91b 89b 81 bc b 1.75 b 0.94 c 0.61 c 1.28 b 7.08 a 5.86 c 7.62 ab 43 b 50 ab 52 bc 142 b 118 c 145 ab 94b 83c 76c b 1.66 c * * * * ** ** * * *** * *** * * ** *** ns *** *** *C-control (non-irrigated); Set- irrigation treatments applied at fruit set (100,50 and 25% of ETc); Vet. - irrigation treatments applied at veraison (100,50 and 25% of ETc); *, **, ***, ****, ns: Significant at p ~ 0.05, 0.01, 0.001, , or not significant, respectively. Letters within columns represent means separated at p ~ 0.05, Duncan's multiple range test. Boldfaced data indicate those values significantly greater than the control using Dunnett's t-test; boldfaced and underlined data are significantly less than the control 177
200 Table 4.3. Impact of irri~ation treatments on berry comeosition of Chardonna~, Lambert Vineyards, Nia~ara-on-the-Lak:e, ON, Treatment Soluble solids (Brix) Titratable acidity (gil) ph Control 21.7 b 21.3c 20.7 a 10.0 ab 7.2a 10.8 a 3.62 a 3.68 ab 3.52 ab 25 Set 22.1 a 21.2c 20.1 b 10.3 a 7.2a 9.7b 3.57b 3.68 ab 3.53 a 50 Set 21.8b 21.1c 20.1 b 10.3 a 6.5 ab 9.7b 3.63 a 3.66 ab 3.52 ab 100 Set 22.2 a 22.6 a 20.0b 9.9ab 6.5 ab 9.9b 3.61 a 3.69 ab 3.51 ab 25 Ver b 21.3c 20.3 ab 10.1 ab 6.2 b 9.S b 3.59 ab 3.67 ab 3.39b 50 Ver a 21.2c 19.9b 10.0 ab 6.6ab 10.8 a 3.63 a 3.64 b 3.51 ab 100 Ver. 21.4c 21.9b 20.5 ab 9.3 b 6.7 ab 9.S b 3.62 a 3.72 a 3.50 ab Significance * * * * *** * *** * * *C-control (non-irrigated); Set- irrigation treatments applied at fruit set (100, 50 and 25% of ETc); Ver. - irrigation treatments applied at veraison (100, 50 and 25% of ETc); *,**,***,****, ns: Significant at P.:5 0.05,0.01,0.001,0.0001, or not significant, respectively. Letters within columns represent means separated at P.:5 0.05, Duncan's multiple range test. Boldfaced data indicate those values significantly greater than the control using Dunnett's t- test; boldfaced and underlined data are significantly less than the control 178
201 Table 4.4. Impact of irrigation treatments on must composition of Chardonnay, Lambert Vineyards, Niagara-on-the-Lake, ON, Soluble solids (Brix) Titratable acidity (gil) ph Treatment Control 25 Set 50 Set 100 Set 25 Ver. 50 Ver. 100 Ver b ab 7.2ab 3.43 ab 19.3c ab 7.9 a 3.47 a 19.5 c a 7.8 a 3.45 a 20.1 bc b 7.0ab 3.45 a 19.5 c a 7.4ab 3.39b 20.4 b ab 6.5 b 3.41 ab 20.9 a a 7.8 a 3.43 ab Significance * ns * * * ns *C-control (non-irrigated); Set- irrigation treatments applied at fruit set (100,50 and 25% of ETc); Ver. - irrigation treatments applied at veraison (100, 50 and 25% ofetc);*,**,***,****, ns: Significant at p::; 0.05, 0.01, 0.001, , or not significant, respectively. Letters within columns represent means separated at p::; 0.05, Duncan's multiple range test. Boldfaced data indicate those values significantly greater than the control using Dunnett's t-test; boldfaced and underlined data are significantly less than the control 3.43b 3.43b 3.50 a 3.50 a 3.43b 3.42b 3.42b 179
202 Table 4.5. Impact of irrigation treatments on wine composition of Chardonnay, Lambert Vineyards, Niagara-on-the-Lake, ON, Treatment ph Titratable acidity (g L-1) Ethanol (% v/v) Control 25 Set 50 Set 100 Set 25 Ver. 50Ver. 100 Ver. Significance 3.44 a 3.46b 5.2 b 5.2 b a a 3.47 a 3.44b 5.6 a 6.2 a b a 3.43 a 3.56 a 5.3 ab 5.8 ab b b 3.45 a 3.52 a 5.1 b 5.1 b ab a 3.35b 3.46b 5.8 a 6.0 a b a 3.38 ab 3.40b 5.4 ab 5.4 b ab a 3.41 ab 3.41b 5.5 ab 5.3 b a a * * * * * * *C-control (non-irrigated); Set- irrigation treatments applied at fruit set (100, 50 and 25% of ETc); Ver. - irrigation treatments applied at veraison (100, 50 and 25% of ETc);. *, **,***, ****, ns: Significant at p.:s; 0.05, 0.01, 0.001, , or not significant, respectively. Letters within columns represent means separated at p.:s; 0.05, Duncan's multiple range test. Boldfaced data indicate those values significantly greater than the control using Dunnett's t-test; boldfaced and underlined data are significantly less than the control 180
203 Table 4.6. Attributes and their standard references used for sensory evaluation of Chardonnay wines, Lambert Vineyards, Niagara-on-the-Lake, ON. Sensory attribute Reference standard (prepared in 100 ml base wine-kressmann -France) Fresh grass Banana Butterscotch Citrus Pome fruit (pear + apple) Honey Rhubarb Stone fruit Raisin Nutty Acidity 10 g of fresh cut and ground grass macerated 24 h 10 g of fresh banana One crushed butterscotch candy (No name) Two pieces of fresh lemon and grapefruit (::::: 15g) 10 g mix of pear (Bartlett cv.) and apple (Empire cv.) 1 ml of raw honey (Bulk store) 109 of fresh pureed Rhubarb petiole 10 ml (apricot and peach canned) - No Name 5 g of dry raisin 5 g (walnut) and 5 g cashew 1.5g tartaric acid IL water 181
204 Table 4.7. Comparison of mean sensory scores among the irrigation treatments of Chardonnay wines, Lambert Vineyards, Niagara-on-the-Lake, ON, Variable C T1 T2 T3 T4 T5 T6 Pr>F Aroma Citrus 2.1 b 1.9 b 1.9b 2.4 ab 2.4 ab 2.8 a 2.4ab Tree fruit (pear + apple) 3.1 a 1.2 e 1.6b 1.9b 1.8b 1.7 b 3.1 a Butterscotch 2.3 b 2.6ab 2.8ab 1.9b 2.9 a 1.5 c 1.9b Banana 2.8 ab 3.1 ab 1.9 b 2.2 b 2.9ab 3.2 a 2.7 ab Raisin 3.5 a 1.9b 2.1 b 1.7 c 1.6 c 3.1 ab 2.8 ab Nutty 1.9b 3.4 a 2.8ab 1.6b 3.4 a 3.1 ab 2.9ab Musty 2.1 b 3.9ab 3.5 ab 2.3 b 4.1 a 3.5 ab 1.9b Flavor CITRUS 4.1a 3.6ab 2.9b 2.8b 3.1 b 2.3 e 2.8b TREE FRUIT (PEAR + APPLE) 3.8 a 1.9bc 2.3 bc 2.8 b 1.1c 2.6 b 3.1 ab BUTTERSCOTCH 2.3 ab 3.1 a 1.8b 1.1c 2.1 b 0.9 c 2.7 ab BANANA 1.5 ab 2.1 a 0.9 c 1.3 ab LIb 0.8 c 0.7 c RAISIN 2.5 ab 0.9 e 1.3 be 1.7 bc 0.6e 2.1 b 2.6a NUTTY 0.8 c 1.4 b 1.9 ab 0.6e 1.4 b 2.1 a 1.9 ab MUSTY LIb 2.9a 1.5 b 1.3b 2.1 ab 1.5 b 1.3b ACIDITY 2.1 c 4.3 a 3.1 b 2.5 c 3.1 c 3.3 b 2.2c *C-control (no-irrigated); T1-T3 - irrigation treatments applied at fruit set (100,50 and 25% of ETc); T4-T6 irrigation treatments applied at veraison (100, 50 and 25% of ETc). Means within rows with different letters are significantly different, Duncan's multiple range test. 182
205 Table 4.8. Comparison of mean sensory scores among the irrigation treatments of Chardonnay wines, Lambert Vineyards, Niagara-onthe-Lake, ON, Variable C T1 T2 T3 T4 T5 T6 Pr>F Aroma Fresh grass 2.1 b 3.5 ab 4.1 a 1.4 c 1.9b 1.3c 1.2c Citrus 2.1 c 4.6 a 3.2 b 1.9 c 2.9b 2.6b 1.4 d Honey 1.0c 2.6ab 2.8 ab 1.9 b 2.1 b 3.1 a 0.9c Rhubarb 0.3 c 2.1 bc 1.4 bc 4.1 a 3.2 b 2.6bc 3.1 b Tree fruit (pear + apple) 2.6a 1.9b 1.1c 2.2b 1.1c 0.8 c 0.9c Stone fruit 2.8 a 1.2c 1.8b 1.9b 2.2 b 1.1c 0.9 c Butterscotch 2.3 c 3.2 b 3.0b 4.1 a 3.6ab 3.2 b 3.7 ab Banana 2.6c 3.7 a 4.1 a 3.4 b 2.9b 2.8b 3.9ab Raisin 1.8c 2.6b 2.3 bc 3.1 a 1.9c 2.9ab 2.7 ab Nutty 1.5 c 2.6 a 2.4 ab 1.9b 1.2c 1.8b 1.9 b Flavor (mouthfeel) FRESH GRASS 2.8b 2.6b 4.3 a 2.1 c 1.9c 1.3 d 1.9 c CITRUS 1.6 c 4.6 a 3.2ab 1.9b 3.2ab 2.6ab l.4c HONEY 1.2c 3.2ab 1.9b 2.6b 3.9 a 2.6b 3.1 ab RHUBARB 2.1 c 4.2 a 3.8 ab 2.9b 3.2 b 3.1 b 0.9 d TREE FRUIT (PEAR + APPLE) 3.1 a 1.8b 1.9b 2.2b 1.1c 2.1 b 2.8 ab STONY FRUIT 2.8 a 1.2 c 1.8b 1.6b 2.2 b 1.1c 1.3c BUTTERSCOTCH 2.3 b 3.2ab 3.0ab 4.1 a 3.6ab 3.2ab 3.7 a BANANA 1.2 c 3.1 ab 1.7b 1.3 be 3.6a 0.9c 0.8 c RAISIN 1.8c 3.2 a 2.8 b 2.5b 1.6c 2.9ab 3.1 ab NUTTY 1.5 c 2.6 a 2.4 ab 1.9b 1.2 c 1.8b 1.9b ACIDITY 2.1 b 4.2 a 3.2 b 2.9b 2.6b 1.4 c 1.3c *C-control (non-irrigated); TI-T3 - irrigation treatments applied at fruit set (100,50 and 25% of ETc); T4-T6 irrigation treatments applied at veraison (100,50 and 25% of ETc). Means within rows with different letters are significantly different, Duncan's multiple range test. 183
206 List of Figures Figure 4.1. Impact of irrigation treatments on soil moisture (%volumetric content) of Chardonnay grapevines measured by TDR, Lambert Vineyards, Niagara-on-the-Lake, ON, A: 2005; B: 2006; C: 2007; D: , 50, 25 represent the percentage of ETc at two irrigation initiation times: fruit set (Set) and veraison (Ver.). Figure Impact of irrigation treatments on soil moisture (% volumetric content) of Chardonnay grapevines measured using a Profile Probe type PR2 10 cm (A), 20 cm (B), 30 cm (C), 40 cm (D), 60 cm (E), and 100 cm (F) depths, Lambert Vineyards, Niagara-on-the-Lake, ON, ,50,25 represent the percentages of soil water replacement ETc at two irrigation initiation times: fruit set (Set) and veraison (Ver.). Figure 4.3. Impact of irrigation treatments on soil moisture (% volumetric content) of Chardonnay grapevines measured using a Profile Probe type PR2 10 cm (A), 20 cm (B), 30 cm (C), 40 cm (D), 60 cm (E), and 100 cm (F) depths, Lambert Vineyards, Niagara-on-the-Lake, ON, , 50, 25 represent the percentages of soil water replacement ETc at two irrigation initiation times: fruit set (Set) and veraison (Ver.). Figure 4.4. Impact of irrigation treatments on soil moisture (% volumetric content) of Chardonnay grapevines measured using a Profile Probe type PR2 10 cm (A), 20 cm (B), 30 cm (C), 40 cm (D), 60 cm (E), and 100 cm (F) depths, Lambert Vineyards, Niagara-on-the-Lake, ON, ,50,25 represent the percentage of soil water replacement ETc at two irrigation initiation times: fruit set (Set) and veraison (Ver.). Figure 4.5. Impact of irrigation treatments on transpiration of Chardonnay grapevines, Lambert Vineyards, Niagara-on-the-Lake, ON, A: 2005; B: 2006; C: 2007; D: , 50,25 represent the percentage of ETc at two irrigation initiation times: fruit set (Set) and veraison (Ver.). Figure 4.6. Impact of irrigation treatments on leaf \ji of Chardonnay grapevines, Lambert Vineyards, Niagara-on-the-Lake, ON, A: 2005; B: 2006; C: 2007; D: , 50, 25 represent the percentage of ETc at two irrigation initiation times: fruit set (Set) and veraison (Ver.). Figure 4.7. Impact of irrigation treatments on shoot growth rate (cm) of Chardonnay grapevines, Niagara-on-the-Lake, ON, A: 2006; B: ,50,25 represent the percentage of ETc at two irrigation initiation times: fruit set (Set) and veraison (Ver.). Figure 4.8. Principal component analysis (F1&F2) of soil water status and physiological variables (A) and yield components (B) means from seven irrigation treatments in a Chardonnay vineyard from Lambert Vineyards, Niagara-on-the-Lake, ON, Fruit set (Set) andveraison. (Ver.) were the imposition times of irrigation treatments while 100,50 and 25 represent percentages of the water replaced in the soil through irrigation (ETc). Figure 4.9. Principal component analysis (F1&F2) of soil water status and physiological variables (A) and yield components (B) means from seven irrigation treatments in a Chardonnay vineyard from Lambert Vineyards, Niagara-on-the-Lake, ON, Fruit set (Set) and veraison (Ver.) were the imposition times of irrigation treatments while 100,50 and 25 represent percentages of the water replaced in the soil through irrigation (ETc). Figure Radar diagram of the mean intensity ratings of Chardonnay wines made from different irrigation treatments, Lambert Vineyards, Niagara-on-the-Lake, ON. Irrigation initiation time: C-control, Set - fruit set, Ver. - veraison). 100,50, and 25 represent percentage 184
207 of water replaced. A and B represent wine sensory profiles of 2006 vintage. Aroma and flavor attributes are specified by lower and higher case letters respectively Figure Radar diagram of the mean intensity ratings of Chardonnay wines made from different irrigation treatments, Lambert Vineyards, Niagara-on-the-Lake, ON. Irrigation initiation time: C-control, Set - fruit set, Ver. - veraison). 100,50, and 25 represent percentage of water replaced. A and B represent wine sensory profiles of 2007 vintage. Aroma and flavor attributes are specified by lower and higher case letters respectively Figure Principal component analysis (Fl&F2) of sensory means from seven irrigation treatments of Chardonnay wines from Lambert Vineyards, Niagara-on-the-Lake, ON, 2006 (A) and 2007 (B). Fruit set (Set) and veraison (Ver.) were the imposition times of irrigation treatments while 100, 50 and 25 represent percentage of the water replaced. Figure PLS analysis of soil water status, physiological data, yield components, berry and wine chemical composition and sensory data means from seven irrigation treatments in a Chardonnay vineyard, Lambert Vineyards, Niagara-on-the-Lake, ON,2006. Figure PLS analysis of soil water status, physiological data, yield components, berry and wine chemical composition and sensory data means from seven irrigation treatments in a Chardonnay vineyard, Lambert Vineyards, Niagara-on-the-Lake, ON, Figure PLS regression analysis of soil water status, physiological data, and yield components from seven irrigation treatments in a Chardonnay vineyard, Lambert Vineyards, Niagara-onthe-Lake, ON,
208 ~ ~ 12 ::::J v.; '0 E '0 8 (J) Control Ner /Set...50Ner.... SO/Set...2SNer.... 2S/Set ~20 ~ ~.a 16.~ 0 E = 12 0 en 8 ---Control Ner /Set...SONer.... SO/Set...25Ner et A Jun 29-Jun 13-Jul 27-Jul 10-Aug Sampling date (2005) Control Ner /Set... 50Ner.... SO/Set...2SNer.... 2S/Set Ins Jun ns Control Ner. 6-Jul 20-Jul 3-Aug 17-Aug Sampling date (2006) fSet...sOlVer.... SO/Set * 2SNer... 25/Sel 31-Aug B ~20 ~ ~ :::I v.; '0 E = 12 0 (J) ~ ~ H3 ~ ~ 12 ~ 8 - Ins 4 22-Jun ns 6-Jul 20-J u I 3-Aug 17 -Aug Sampling date (2006) 31-Aug 4~ 23-Jun ns 7-Jul ns ns ns ns 21-Jul 4-Aug 18-Au.g 1-Sep Sampling date (2008) C D Figure 4.1. Impact of irrigation treatments on soil moisture (% volumetric content) of Chardonnay grapevines measured by TDR, Lambert Vineyards, Niagara-on-the-Lake, ON, A: 2005; B: 2006; C: 2007; D: ,50,25 represent the percentage of ETc at two irrigation initiation times: fruit set (Set) and veraison (Ver.). *,**,***,****, ns: Significant at p < 0.05, 0.01, 0.001, , or not significant, respectively. Letters represent means separated at p < 0.05, Duncan's multiple range test. 186
209 Control Ner, +100/ SONer. -.50/Sol +25iVer *251S01 ~'r ~ -+'100l5el "SOISeI... Z5ISet... SONer... 25Ner A ns 4.~------~------~------~ ~ 22,Jun 06,Jul 20-Jul 03'Aug SlimplingDate (2006)!!: E.!!l 0 E ;g os 22,Jun 06,Jul20,Jul 03.Aug 17.Aug Sampling date (2006) B C.s a. (]) "0 E CJ 0 (') ~ 16!!1 12 ~ '0 E B '0 (f).. Control +100/501.. SOISel Set 4 22-Jun 06,Jul 2O-Jul 03-Aug Sampling date (2006).s 28 g.24 '0 E CJ 20 0 v, ~ 16 e... Control IS"1.. SOISeI +z5lset... lnoner....son Ner. :> tii 12 '0 E '0 8 (,I) ns 4 22-Jun 06-Jul 20-Jul O~Aug 17-Au9 Sampling date (2006) D E a 24 Q) "0 E 20 CJ 0 (0 I ~ ::<: a;;.. 16 e- 12 i '5 E '0 (/) 8 Control lSeI ---SOISe t Set... 10ON.r....SONer. -4-2,Ner Jun 06,Jul 20..Jul 03-Aug 17-Aug Sampling date (200fl) ~ ~----~--~ Conlr<)1 +looisot "'SO/Set +Z5ISeI.r: E. ~ t. 16 IE.212.!!1. o 2 ~ ONer... 5ONer ", 25Ner ns ~ ~------~ 22-Jun Off..Jul 2(}'JUI 03-Au9 Sampling date (2006) F Figure 4.2. Impact of irrigation treatments on soil moisture (% volumetric content) of Chardonnay grapevines measured using a Profile Probe type PR2TM 10 cm (A), 20 cm (B), 30 em (C), 40 cm (D), 60cm (E), and 100 cm (F) depths, Lambert Vineyards, Niagara-on-the-Lake, ON, , 50, 25 represent the percentages of soil water replacement ETc at two irrigation initiation times: fruit set (Set) and veraison (Ver.). *, **, ***, ****, ns: Significant at p ,0.01,0.001,0.0001, or ns-not significant, respectively. Letters represent means separated at p , Duncan's multiple range test. 187
210 ... Control N"' /Set -"-SONer. a SOISet.-r25Ner * Control... :100Ner" +-100ISet -+-SOIS.! -..25/Se! "'SOlVer....25Ner a a A ~ 12 ]2 '" 0 E '5 (f) 8 ns 4 28-Jun 12 Jul 26-Jul 09-Aug Sampling Date (2007) 23-AuQ ~.i 12 ~ '0 (f) 8 ns 4 2B-JUn 12 Jul 26-Jul 09 Aug Sampling Date (2007) 23-Aug B C -Coi)trol -o-100/se!..-50/sel ~25/Set -<>-l00ner. "SON"" ~25Ner. 4.L- ~------_.~------~------~ 28-Jun 12-.JUI 26;.JUI D9-Aug 23-Aug Sampling date (2007) J::. 24 g. "C E o '16 ~ ~ :::J 12 ti '~ ~ 8 "Control /Set +-SOIS,,! el Ner. SONer....25Ner , , , ,J 2B-Jun 12-Jul 26-Jul 09-Aug 23-Aug SampUng date (2007) D a -'-Control +100/Sel *SOiS<>t *251Sel Ner... SONer... 25Ner "Control "'1001Set "'SOlSe! +25/Set Ver... 50IVer... 25Ner 8 E os , ,.1 28 Jun 12-Jul 26-Jul OS-Aug 23-Aug Sampling Date (2007) 12;.Jul 26;.Jul 09.Aug Sampling date (200.7) 23-AlJ~ F Figure 4.3. Impact of irrigation treatments on soil moisture (% volumetric content) of Chardonnay grapevines measured using a Profile Probe type PR2TM 10 cm (A), 20 cm (B), 30 cm (C), 40 cm (D), 60 cm (E), and 100 cm (F) depths, Lambert Vineyards, Niagara-on-the-Lake, ON, , 50, 25 represent the percentages of soil water replacement ETc at two irrigation initiation times: fruit set (Set) and veraison (Ver.). *, **, ***, ****, ns: Significant at p S 0.05,0.01,0.001,0.0001, or ns-not significant, respectively. Letters represent means separated at p S 0.05, Duncan's multiple range test. 188
211 32 ---Control +1001SeI +501Sel ~251Set -o-100ner. + SONer Ver. 32 "'Control +100ISet +SOlSe! Set Ner.. SONer. * 25Ner. A c ns ns ns 4 ~------, ~------,-----~ Jul 2l Jul 4-Aug Sampling Oate(2008) "'Control ->-- l00ner. +100/801 -""SONar, +50lSo\ ~25Ner -"251Sel la-aug 'ij,16! ~. 1.2 '0 E 8 '0 (J) ns 4 '~------~------~------~ ~ ns ns 4~------~----~------~------~ 23,Jun 7 Jul 21.Jul 4-Aug 1a.Aug Sampling Date (2008) ns ~----_r r-----~ 23-JUri 7-Jul 21-Jul 4-Aug 23,Jun 7-Jul 21-Jul 4 Aug 18 Au~ Sampling Date (200S) Sampling Date (2008) 32 '5. 2B Q) +CIlnIIOI + 100Ner Set + SONer. +5OISe! *251Ver....25/S01 "0 g ~24"~~~~~~~~J "t 20 t16 - ~.a 12 '6 E 8 ~ B D E 32 ~2a OJ ' Conltol'+'l00ETISel +SO ETSeI * 25ET1Sel + 100ETVer. +50ETNer, + 25ETNer. o ~ 20 i"'~:=--":::::==---di=:';;:::z:"":>""":'-1..t 'ij ';16 " ::J 1!i 12 o E ~-----_r_ Jun 7 Jul 21 Jul 4,Aug la-aug Samolina Date (2008) 44 - li 40 ~ Canltol +100 ETlsat _50 ETSet ETV.r....SO ETN ErN.r ETISi>t o 5 32i~;~~~~~~~;;l;~=::~t.::;::~ ~ 28 ;., 24. -~- ~ 20!!1.a 16 <Il ' E ~ 8 - M (J) ~------~ ~ 23cJun 7 cjui 21.Jul 4-'AUg 18,Aug Sampling Date (2008) F Figure 4.4. Impact of irrigation treatments on soil moisture (% volumetric content) of Chardonnay grapevines measured using a Profile Probe type PR2TM 10 cm (A), 20 cm (B), 30 cm.(c), 40 cm (D), 60 cm (E), and 100 cm (F) depths, Lambert Vineyards, Niagara-on-the-Lake, ON, , 50, 25 represent the percentages of soil water replacement ETc at two irrigation initiation times: fruit set (Set) and veraison (Ver.). *, **, ***, ****, ns: Significant at p ~ 0.05,0.01,0.001,0.0001, or ns-not significant, respectively. Letters represent means separated at p ~ 0.05, Duncan's multiple range test. 189
212 A ~ ~ (511 '" :c Ol 9 2: c: 'a en c ttl 3.= 1... ~ 21-J.un Control fSet -<>- tooner.. 50Ne r. 5-Jul... 50/Set...25Ner... 25/Sel 19-JuI2~Aug1S-Aug Sampling Oate (2008)._~b c _...,_.-.,..." d b' 30-Aug 33 til 31 N o 25 '" 23 ::r: 21.~1..9 c: Control... "OONer.,g 15 -;... 7">---:=:;:i?f' ~ 13 -g. 11 c:: 9 ~ 7 I Jun 6-Jul ISet...50Ner. ns... 50/Set...25Ner. ns ns... 25/Set 20-Jul 3cAug 17-Aug Sampling date (200S) b 31-Aug B C 21 _19 en N-. E 17 c5 15 :c'" 13 Ol 2: 11 c:: 9 4~ '0.. 7 en c:: 5 l!! I- 3 t: 26-Jun... Control Ner. a '+-IOO/8el...SONer /8el...25IVer. 10-Jul 24-Jul 07-Aug Sampling date (2007) --Z5/Sel ,.,... en N. E 9 ~ q" :r 7 Ol 2: c:: 5 ~ ~. '5.. en 3 c ctl.=. In.s 1 23-Jul'l... Control...100Ner. 10-Jul /5"t -+-50Ner. ns... 50/8et...25Ner /8el 25..Jul Aug 7 18-Aug Sampling Date (2008) ns 02-Sep D Figure 4.5. Impact of irrigation treatments on transpiration of Chardonnay grapevines, Lambert Vineyards, Niagara-on-the-Lake, ON, A: 2005; B: 2006; C: 2007; D: ,50,25 represent the percentage of ETc at two irrigation initiation times: fruit set (Set) and veraison (Ver.). *,**,***,****, ns: Significant at p < 0.05,0.01,0.001, , or not significant, respectively. Letters represent means separated at p < 0.05, Duncan's multiple range test. 190
213 -0.1 co ~ -0.3 :si! -0.5 C Q) _Control Ner. ~ -D.9~ :s: 1li.t.1 ~ /Set... SO/Set... 2S/Set...SONer. a,*,2sner....,-0.1 (II c...5-0~3. til 'E.;0.5 * ~.~. 0,9 1li ~ Control Ner /Set...5ONer. -+'50/Set,*,25Ner.... 2slSet A ns ' ' 21-Jun D5-Jul 19-Jul D2-Atlg 16-Aug Sampling date (2005) -1.5.LI ' 22-Jun 6-Jul 2D-Jul 3-Atlg 17 -Aug 31-Aug Sampling date (2006) B C til -0.3 c.. ::!E :::' -0.5.(11.lj -0.7 R t-0.9 Cii :s: -1.1 ill...j_1.3 _Control Ner /S.et... SONer.... SO/Sel...2SNer.... 2S/Set c ns ' ' 27-Jun l1-jul 2S-Jul DB-Aug 22-Au~ Sampling date (2007) -0.1 til -0.3 ~ ""!:-!'" -0.5 ~ 53 -D.7 15 c...sa ~ li ~ -1.3 Control 'b- 100Ner. b -+-loa/set ":SONer. ""SO/Set -r25ner a b '*'2.51Set.1.5.I ns ns ns ns I 23-Jun 7 ~Jul 21.Jul 4-Aug i8-aug Sampling Date (2008) t-sep D Figure 4.6. Impact of irrigation treatments on leaf", of Chardonnay grapevines, Lambert Vineyards, Niagara-on-the-Lake, ON, A: 2005; B: 2006; C: 2007; D: ,50,25 represent the percentage of ETc at two irrigation initiation times: fruit set (Set) and veraison (Ver.). *,**,***,****, ns: Significant at p ~ 0.05, 0.01,0.001,0.0001, or not significant, respectively. Letters represent means separated at p ~ 0.05, Duncan's multiple range test. 191
214 A '-'.9:1 ---Control +100 ET/Set +50 ET Set +25 ET/Set ETVer ETNer ETNer. a a I'! 55 b ~ ~. 4.5~... ~~ t.~ ab "-35 ~..... '~ Ie (5. T.r:::. o 25! b (J) 15 ns 5 +I r ~----~ 01-Jul 15~Jul 29-Jul Sampling date (2006) 55 E45 u....9:1 ~ 35 :5 ~ a, 25 "8.r:::. C/) 15 - a ~Control Ner /Set...50Ner /Set -.-25Ner /Set 5 +I ~ ~ 11-Jul 25-Jul Sampling date (2007) 08-Au~ B Figure 4.7. Impact of irrigation treatments on shoot growth rate (cm) of Chardonnay grapevines, Lambert Vineyards, Niagara-on-the-Lake, ON, A: 2006; B: ,50,25 represent the percentage of ETc at two irrigation initiation times: fruit set (Set) and veraison (Ver.). *,**,***,****, ns: Significant at p ~ 0.05,0.01,0.001,0.0001, or not significant, respectively. Letters represent means separated at p ~ 0.05, Duncan's multiple range test. 192
215 ~ Lrl SSet IjJ - Biplot (axes F1 and F2: %).-i 0 r. ~ N u.. Tleaf 25Ver. - c- 100St;I: F1 (50.51 %) Biplot (axes F1 and F2: %) A 2SSet SOVer. ~ m.-i..ri 0.-I N c u.. 25Ver B.W. 100Ver. loose F1 (60.03 %) B Figure 4.8. Principal component analysis (Fl&F2) of soil water status and physiological variables (A) and yield components (B) means from seven irrigation treatments in a Chardonnay vineyard, Lambert Vineyards, Niagaraon-the-Lake, ON, Fruit set (Set) and veraison (Ver.) were the imposition times of irrigation treatments while 100,50 and 25 represent percentages of the water replaced in the soil through irrigation (ETc). Abbreviations used: B/C-berries number. per cluster; en-clusters per vine; BW-berry weight; CW-cluster weight; SM-soil moisture; T 1eaI leaf temperature; Ts-transpiration, \jf-ieaf water potential. 193
 7 '* 2 g o :::!.. N u... -3 2SVer. c l en -8-15 -10 25Set -5 o 5 10 15 Fl (S7.ST%) Figure 4.9.")
216 6 Biplot (axes F1 and F2: %) 4 SOSet r-- '* 2 <:t oci..-i -N 0 u b O 30 e~l--.ioover; "... ;- SM o Fl(SO.67 %) A Biplot (axes F1 and F2: %) 7 '* 2 g o :::!.. N u SVer. c l en Set -5 o Fl (S7.ST%) Figure 4.9. Principal component analysis (Fl&F2) of soil water status and physiological variables (A) and yield components (B) means from seven irrigation treatments in a Chardonnay vineyard, Lambert Vineyards, Niagaraon-the-Lake, ON, Fruit set (Set) and veraison (Ver.) were the imposition times of irrigation treatments while 100, 50 and 25 represent percentages of the water replaced in the soil through irrigation (ETc). Abbreviations used: BlC-berries number. per cluster; CN-clusters per vine; BW-berry weight; CW-cluster weight; SM-soil moisture; T 1ear leaf temperature; Ts-transpiration, 'I'-leaf water potential, ph-b-juice ph, TA-B - juice titratable acidity. B 194
217 A Citrus NUTTY RAISIN Banana -C -.. 1QOSet --SOSet -. 2SSet BUTIERSCOTCH FRUITTRE (APPLE AN D PEAR) B Citrus Banana -C -.. 1QOVer. RAISI N UJ--+"~~~l?tj-r~4llfSJ.J Raisin --SOVer.... 2SVer. Figure Radar diagram of the mean intensity ratings of Chardonnay wines made from different irrigation treatments, Lambert Vineyards, Niagara-on-the-Lake, ON. Irrigation initiation time: C-control, Set - fruit set, Ver. - veraison). 100,50, and 25 represent percentage of water replaced. A and B represent wine sensory profiles of the 2006 vintage. Aroma and flavor attributes are specified by lower and upper case letters respectively. 195
218 Fresh Grass A BUTTERSCOTCH H-~~~ STONY FRUIT ~~I.d:*",-Hr-tl Stony Fruits Butterscotch -C Set ""'-SOSet - Jr 2SSet Fresh Grass ACIDITY Citrus NUTTY B BUTTERSCOTCH f'"a ; ~W~~~~~~~»i-+/ -11 Stony Fruits STONY FRUIT. \ \ I. Butterscotch -C Ver Ver. -., 2SVer. Figure Radar diagram of the mean intensity ratings of Chardonnay wines made from different irrigation treatments, Lambert Vineyards, Niagara-on-the-Lake, ON. Irrigation initiation time: C-control, Set - fruit set, Ver. - veraison). 100, 50, and 25 represent percentage of water replaced. A and B represent wine sensory profiles of the 2007 vintage. Aroma and flavor attributes are specified by lower and upper case letters respectively. 196
 L- ~ A Biplot (axes Fl and F2: 61.")
 15 B Figure 4.12.")
 and 2007 (B). Fruit set (Set) and veraison (Ver.")
219 Biplot (axes Fl and F2: %) ~ o IV1 m N ~ -3 OOSet CITRUS BANANA II1II BUTTE RSCOTCPJ,iII! Butterscotch Fruit tree FRUIT TREE lsi RAISIN 25ver. SaVer Fl (44.94 %) L- ~ A Biplot (axes Fl and F2: %) 10 ~ 00 m 00 N N u STONY FRUIT Fruit tree>,~tony Fruits,P.. ~ppie) Ver o 5 10 Fl (33.06 %) 15 B Figure Principal component analysis (F1&F2) of sensory means from seven irrigation treatments of Chardonnay wines from Lambert Vineyards, Niagara-on-the-Lake, ON, 2006 (A) and 2007 (B). Fruit set (Set) and veraison (Ver.) were the imposition times of irrigation treatments while 100,50 and 25 represent percentages ofthe water replaced in the soil through irrigation (ETc). 197


220 Correlations with t on axes t1 and t N o t1 Figure PLS analysis of soil water status, physiological data, yield components, berry and wine chemical composition and sensory data means from seven irrigation treatments of Chardonnay grapevines from Lambert Vineyards, Niagara-on-the-Lake, ON, Abbreviations used: B/C-berries number. per cluster; CN-clusters per vine; BW-berry weight; CW-cluster weight; SM-soil moisture; Tle"I leaf temperature; Ts-transpiration, ",-leaf water potential, ph-g-juice ph, TA-G -juice titratable acidity; ph-w- ph wine; TA-W-wine titratable acidity. 198


221 1 Correlations with t on axes t1 and t STONY FRUIT Stony Fruits ~ o t Figure PLS analysis of soil water status, physiological data, yield components, berry and wine chemical composition and sensory data means from seven irrigation treatments of Chardonnay grapevines from Lambert Vineyards, Niagara-on-the-Lake, ON, Abbreviations used: B/C-berries number. per cluster; CN-clusters per vine; BW-berry weight; CW-cluster weight; SM-soil moisture; T leai leaf temperature; Ts-transpiration, 'I'-leaf water potential, ph-b-juice ph, TA-B -juice titratable acidity. 199


222 1 Correlations with t on axes t1 and t N 0.j../ t1 Figure PLS regression analysis of soil water status, physiological data, and yield components from seven irrigation treatments of Chardonnay grapevines from Lambert Vineyards, Niagara-on-the-Lake, ON, Abbreviations used: B/C-berries number per cluster; CN -cluster per vine; BW -berry weight; CW -cluster weight; SM-soil moisture; Tlcaf' leaf temperature; Ts-transpiration, ",-leaf water potential, ph-b-juice ph, TA-B -juice titratable acidity. 200
223 Chapter 5 Effect of Different Irrigation Strategies on Vine Physiology, Yield, Grape Composition and Sensory Profile of Sauvignon blanc (Vitis vinifera L.) in a Cool Climate Area Abstract. Irrigation experiments testing the efficacy of partial root zone drying (PRO) and regulated deficit irrigation (ROI) were conducted in a commercial vineyard block of Sauvignon blanc, Lambert Vineyards, Niagara-on-the-Lake, Ontario, Canada, between The experimental design had four treatments: non-irrigated control, PRO, full irrigation [100% water replacement of crop evapotranspiration (ETc)] and one level of ROI (25% ETc). The irrigation treatments started immediately after fruit set and continued until the beginning of September. The amount of water needed was calculated based on reference evapotranspiration (ET 0), using the Penman-Monteith equation. Soil moisture and vine physiology (leaf water potential and transpiration rate) in the PRO treatments were generally less than 100% ETc vines but higher than non-irrigated treatments and 25% ETc vines. Almost all treatments were different than non-irrigated vines in terms of fruit composition and wine sensory attributes. ROI strategies were more consistent than the PRO treatments in terms of their effect on general physiology, grape composition and sensory profile. Overall, use of ROI or PRO in cool climates during dry and warm years can improve grape quality. Oue to high climatic variation over the period studied no consistency pattern was found in terms of irrigation effects, which indicates that plant water status is not the only factor which control fruit and wine quality. Key words: Soil moisture, leaf water potential, regulated deficit irrigation, partial root zone drying, sensory profile Introduction Vine development and fruit composition are highly dependant on environmental conditions, and particularly on vine water and nitrogen status (Jackson and Lombard 1993). Until recently vineyards were irrigated mostly in the "New World" while in the "Old World" irrigation was prohibited by law. In areas where irrigation was not allowed or not needed, drip irrigation has been steadily increasing. In the last decade more wine regions including some from cool climate area have faced some degree of water stress during the vegetation period (Reynolds et al. 2009, Van Leeuwen and Seguin 2006, Zs6fi et al. 2009). Niagara Peninsula, the most important grape growing region in Canada became one of these regions (Reynolds 2008). Many studies showed that plant water status is the main factor by which the terroir affects wine style and quality (Conradie et al. 2002, Seguin 1983). In wine production neither deficit nor excess of water status is desired for an optimum balance of yield and wine quality (Seguin 1983). 201
224 According to Lakso and Pool (2000, 2001), excessive water stress inhibits many late season flavor development processes, and leads to dull, less complex wines with little fruit characteristics. Some of the physiological responses of grapevines to prolonged water deficits include reduced cell division and expansion, closing of leaf stomata, reduced photosynthesis and, eventually, cell desiccation and death (Goodwin 2002). Mild water deficit is known to have positive effects on reducing cell size if applied at frqit set, and thus can enhance the concentration of aroma extracts in berry as long as other metabolic processes are not negatively affected (Smart 1974). This moderate water deficit also reduces shoot vigor, resulting in more favorable partitioning of carbohydrates to the clusters (Keller 2005). Some studies focused on the influence of water deficits on vine development and yield (Dry et al. 1996, Hardie and Considine 1976) and on fruit composition (Dry et al. 2001, Matthews and Anderson 1988). However, most of these studies were carried out on red grape cultivars, and just few of them focused on the effect of water status on both vine performance and wine quality. Grapevine sensitivity to seasonal water deficits and the consequences for vegetative and reproductive growth, must and wine quality are well known (McCarthy 1997, Ojeda et al. 2002, Williams and Matthews 1990). Very few data has been published on the influence of environmental conditions on quality potential in white grapes, especially in regions with cool climate. In one study on Sauvignon blanc from Pessac-Uognan and Graves appellations, it was found that grape aroma potential was highest in vines under mild water deficit and moderate nitrogen supply (Peyrot des Gachons et al. 2005). The same authors showed that severe water deficit stress limited aroma potential, as did nitrogen deficiency. Sauvignon blanc is a popular white cultivar in the Niagara Peninsula, being on third place after Chardonnay and Riesling ( with a yield of 1256 t in Despite the controversial debate on the necessity of using irrigation in order to obtain premium wines, and due to increasing the frequency of the dry periods during the vegetation period, growers have reconsidered using irrigation in their vineyards. The effects of applying irrigation are related to the level of vine water status, which in turn is a result of interactions among soil, vine and climate conditions. One major way in which the wine industry is attempting to improve water use efficiency is through application of deficit irrigation. If managed properly, deficit irrigation can have minimal impact on carbon assimilation or stomatal conductance, despite lowering the total amount of water applied than in full irrigation (De Souza et al. 2003). The irrigation strategy known as regulated 202
225 deficit irrigation (RDI), which has been widely evaluated around the world, is a viable practice in vineyards for controlling excess vigor, reducing pest populations and disease pressure, and improving wine quality (Dry et al. 1996, Smart and Coombe 1983, Van Zy11984, Williams and Matthews 1990). Deficit irrigation applied by partial root zone drying (PRD) involves application of a reduced amount of irrigation to alternate sides of the vine (Dry and Loveys 1998, Dry et al a, b, 2001). ill PRD, the root zone is simultaneously wetted and dried, maintaining a relatively high leaf water potential ('I') close to values obtained in full irrigation treatments. However, the water use efficiency is improved through increases in xylem abscisic acid (ABA) concentration, and concomitant effects on stomatal conductance (Stoll et al. 2000a). PRD strategy was developed from observations that an increase in ABA concentration produced in the drying roots reduced stomatal conductance and vegetative growth (Dry and Loveys 1999, Dry et al a, b, Loveys 1984 a, b, Stoll et al b, Zhang et al. 1987). Less data is available from field studies (Dry and Loveys 1998, Dry et al a, b, 2001), and recent results suggest some discrepancies between container and field experiments (Pudney and McCarthy 2004). However, there is still debate on PRD strategy and its effects on grape quality. ill most of the studies the amount of water used in the PRD treatment was a fraction of the full irrigation treatment, and confusion persists on this strategy. Does the PRD treatment affect the grapes through the alternating dry and wet root zones or through the deficit water status deliberately created in the wet zone? The objectives of this research was to study the effect of different levels of water status imposed by various RDI and PRD irrigation strategies on vine physiology, yield components, grape composition, and wine sensory profile of Sauvignon blanc in a cool climate area. Material and Methods Site description and experimental design. The experiments were carried out over three seasons (2006 to 2008) in a commercial vineyard (Lambert Vineyards Ltd.) in the Niagara Peninsula Appellation of Ontario (43 13' N, 79 08' W, elevation 98 m), Canada. The trials were set up in one Sauvignon blanc block (23 rows in total), grafted on S04. Vines were spaced at 1.2 m X 2.7 m (density = 3086 vines ha- 1 ), trained to a double Guyot system, and vertically-shoot positioned. Row orientation was north-to-south. Soil management consisted of fertilization annually with 25 t ha- 1 fresh dairy manure, with floor management of alternate rows of annual 203
226 ryegrass and clean cultivation. Pest control was in accordance with local recommendations from Ontario Ministry of Agriculture, Food & Rural Affairs (OMAFRA, 2007). The soil type was Chinguacousy clay loam with generalized characteristics as follows: a gleyedbrunisolic gray brown luvisol with imperfect drainage (7 to 9 L/h); wilting point of the Ap horizon (0 to 27 cm) was 13.3% moisture; field capacity was 27.3 % moisture; bulk density increased from 1.25 glcm 3 in horizon A to 1.69 glcm 3 in horizon C (Kingston and Presant 1989). The whole block had a tile drainage system, with tiles placed at a 60 cm depth in the middle of each inter-row space (2.4 m). The experimental design was a randomized complete block arrangement, with four irrigation treatments and four replicates, with two rows on each side of the plot as a buffer. The irrigation was initiated in each year of the experiment immediately after fruit set. Treatments were: non-irrigated control, PRD (100% ETc), full irrigation (100% ETc) and one RDI (25% ETc). Within each row treatment replicate, 10 equally-spaced vines were chosen for data collection. Irrigation was provided trough a trickle system using RAM drip-tubing (Netafim, Fresno, CA) with 1.70 LIh emitters spaced 0.6 m apart in all irrigation treatments except PRD. Each row drip line was suspended at 40 cm and had its own valve that allowed switching off the irrigation individually for each treatment based on the calculated water needs. The PRD treatment consisted of two irrigation lines placed in parallel in the same row, each of which had its own valve at the end of the rows. Drippers (1.5 Llhour) were installed alternatively on each irrigation line at 1.2 m in In order to distribute the same amount of water as in 100% ETc treatment, but in a shorter period than in 2006, a second emitter was installed at 10 cm distance from the first one, in The volume of water used was calculated based on the reference evapotranspiration (ET 0), using the Penman-Monteith equation (Allen et al. 1998). Weather Innovations Inc. (WIN) supplied daily weather information such as: temperature (maximum, minimum, and average), relative humidity (both maximum and minimum), net radiation, precipitation, and wind speed required for calculation of ET 0 ( Irrigation was scheduled one day per week. To calculate the amount of water required weekly by the vine from the value ET 0, the methodology of VanDer Gulik (1987) was used and described in detail therein and elsewhere (Reynolds 2008). Throughout the season, the crop coefficients were calculated based on the procedure of Williams and Ayars (2005). The drip lines of the PRD treatments were switched alternatively biweekly in order to have just half of the root system irrigated. Vine and soil water status. Over the growing season, biweekly observations were conducted in order to monitor vine and soil water status. Data was collected in 1-2 days before the irrigation treatments were applied. A LI-1600 steady-state porometer (LICOR, Lincoln, NE) was 204
227 used each season to measure leaf transpiration rate (Ts; Ilg H 2 0 cm- 2 / S-l) and leaf temperature. Photosynthetic photon flux density (PPFD) readings were also collected by the Li-190S-1 quantum sensor. Measurements were taken between 1l00h and 1400h, on three recently-expanded exposed leaves (one from three different shoots) from three vines per treatment replicate of ten previously marked. Midday leaf water potential ('I') was measured between 1100h and 1400h throughout the season, using a Scholander-type pressure chamber (Soil Moisture Corp., Santa Barbara, CA). Data was recorded on three exposed leaves from the same vines used to measure the transpiration rate. Soil water content was measured with FieldScout (TDR) 300 time domain reflectometer (Spectrum Technologies, IL). Using 200 mm long rods, the instrument was used to measure the volumetric water content. Soil moisture was measured for each treatment replicate from all ten recorded vines. Soil moisture was also collected in the PRD treatment replicates by Profile Probe PR2 (Delta-T Devices Ltd Cambridge, UK). Two access tubes were inserted in the ground at 30 cm from the trunk in the middle of each treatment replicate row, one tube on each side of the recorded vines. Soil moisture was collected from 6 depths (10, 20, 2040,60 and 100 cm). Data was stored on the soil moisture meter HH2 and uploaded on computer for analysis. Yield and vine vigor components. The experimental vines were harvested 1 to 2 days before of the commercial harvest date (the second or third week of September). The protocol for data collection was similar to that described in detail in Chapter 3a. Winemaking. The winemaking protocol was similar to that described for Chardonnay grapes in Chapter 4, except the fermentation stage where different yeast was used. All must were inoculated with ZymafIore VL3 (Saccharomyces cerevisiae) yeast (Lallemand Inc., Montreal, QB). Fruit and wine composition. Berry, must and wine samples were analyzed using similar protocols as those used for Baco noir cultivar. The aforementioned methods were described in Chapter 3b and in Balint and Reynolds (2010). Sensory analysis. Wines from 2007 vintage were subjected to sensory analysis. Due to an off flavor found in most of the 2006 vintage wines, all the experimental wines were excluded from the sensory work. A total of 11 judges with ages ranging from 23 to 58 were involved in the sensory work on 2007 wines over the three months period. The group was composed of Brock University faculty, staff, and students from the viticulture and oenology program. They were selected based on their availability and motivation. All of them were volunteers and had previously sensory training. 205
228 Discrimination test. A modified alternative forced choice test (5-AFC) was used to compare a control wine (non-irrigated) to each irrigation treatment to find differences between control and all others (O'Mahoney 1986). This was intended as a preliminary exercise to determine whether differences existed between treatments, what the basis for those differences might be, and whether the panelists were dependable. With few changes, the protocol was similar as that described in detail in Chapter 3b. The test ran over three weeks, testing three field replicates. In each week was was tested just one field replicate. Each flight had five wines. Two control (field) wine samples were included in each flight replicate. Descriptive analysis. The training protocol, scale and descriptive analysis methodology used were similar with those described in Chapter 3b. Six training sessions were run over a period of three weeks. During the first two sessions, the panelists tasted all the samples from one field replicate in order to become familiar with the wines. Reference standards were created to help the panelist understand how to define and rate each attribute. The references were also adjusted during the training session until everyone agreed that the reference was representative for that particular attribute (Table 5.7). On each session the control wine was assessed for each sensory attribute identified. In each session, they tasted four wines (field treatments). A blind control was included in each training session. Data collection followed the same protocol as that presented in Chapter 3b. Data analysis. Field data ('P, Ts, soil moisture), fruit and wine chemical data were analyzed using SAS statistical package (SAS Institute; Cary, NC, USA). Using GLM, analysis of variance was performed on physiological and chemical data. Duncan's multiple range test was used for means separation for all data sets (field, chemical and sensory), and Dunnett's t-test was used to determine those treatment means that were statistically different from the control at a significance level of a:::;0.05. Sensory data were analyzed using XLSTAT (Addinsoft, Paris, France). Principal components analysis (PCA) was performed on the means of field data, chemical data, and sensory scores of aroma and flavor descriptors for each year of the experiment. Partial least squares regression (PLS) was performed on the field, chemical and sensory data in order to find the relationship among these data. Results and Discussion General meteorology. Meteorological data was described in detail in Chapter 3. The 2006 and 2008 years were wet seasons with a total rainfall of 220 and 345 mm, respectively, from June 206
229 to August. The 2007 season was the driest with a total rainfall of only 56 mm, which was approximately 25% of the same period in In 2007, particularly in May and July, temperatures were considerably higher than average. Soil moisture (Tables 5.1. and 5.2; Figs A to C.). Soil moisture measured by TDR at 20 cm depth had a different trend each year during the period studied. A clear separation among the treatments was observed at beginning of July and August PRD and fully irrigated (100% ETc) were the most effective in increasing soil water content (Fig 5.lA). However, on 2 August, soil moisture in the PRD treatment showed a higher value compare to that found in the other treatments. The minimum soil moisture value was below the wilting point (13.3%) likewise found on 2 August in all treatments except the PRD (Fig. 5.lA). This period (end of July) was characterized by a lack of precipitation, high temperatures and high solar radiation (Chapter 3a; Fig. 3a-l and 2). Trends were similar in 2007 for PRD and 100% ETc (fully irrigated), having slightly higher values at the end of July (Fig. 5.lB). Soil moisture in non-irrigated and RDI treatments was consistently lower than the PRD and fully irrigated treatments. However, soil moisture in PRD treatment was lower than the fully irrigated treatment and higher than the nonirrigated and RDI vines. This finding can be explained better in this particular dry and hot season. ABA produced in the drying roots has an impact on root growth (Dry et al. 2000). The same authors indicated that vines subjected to PRD irrigation increased root development in deeper soil layers when compare to a fully irrigated control In 2007, soil moisture was different among treatments throughout the season (Fig. 5.lB). In 2008, soil moisture followed the same trend as precipitation, with a maximum at the end of July corresponding to the maximum amount of precipitation (Fig. 5.lC). Soil moisture pattern was different than in the previous two seasons. Soil moisture did not drop below wilting point in 2008 (13.3% v/v -Kingston and Pres ant 1989) at any sampling date (Fig. 5.lC). Soil moisture measured by the Profile Probe in the PRD treatment clearly showed the difference between dry and wet sides in 2006 and 2007 (Tables 5.1 and 5.2). Due to consistently high soil moisture throughout the season in 2008, data was not shown. The soil moisture showed a maximum difference of 20% between wet and dry sides in 2006 (Table 5.1), while in 2007 the difference between wet and dry was almost 50% (Table 5.2). Soil moisture varied in both years in PRD treatments not only between wet and dry zones but also with depth. In 2006, the difference between wet and dry zone at the first sampling date was low at all depths. The soil moisture at the same depth did not show high fluctuation over the season in either wet or dry zones. This might be explained by the fact that these vines had a well established root system by the time the experiment 207
230 was initiated, and consequently it did not allowed the development of the root zones necessary to accurately implement and demonstrate effects of these irrigation strategies. At the 30 cm depth, soil moisture was much lower in the dry zone compared to the other depths (Table 5.1). One could speculate that the water depletion rate was higher due to higher root density at that depth. Overall, in 2007, soil moisture had lower values in both zones compare to those found in 2006 (Table 5.2). The lowest difference between dry and wet zone was recorded at 100 cm depth. Moreover, the soil moisture at the same depth was consistently higher than that found at the other depths (Table 5.2). However, the first and last seasons were wetter than normal, and the excess rainfall made it difficult to achieve a clear separation among treatments. Soil water depletion patterns were similar and more stable in 2006 and 2007 than in 2008, when excess rainfall and cool temperatures during the growing season occurred. High amplitude in soil water depletion levels between treatments during dry and hot years is explained by oscillatory transpiration during the day (Rose and Rose 1994) and high soil evaporation. This might be a consequence of low canopy developed under low water status and less soil shading. Soil moisture can be a reasonable measure of the plant stress. However, although determination of soil moisture is commonly performed and relatively easy to do, there are several drawbacks that limit its use in water management decisions in viticulture. First, the same level of plant water status can occur at very different soil water availabilities and second, there are still uncertainties where the actual zone of active water uptake is located (Davenport et al. 2008). There is evidence that the type of irrigation applied affects the lateral (horizontal) spread of roots through the soil moisture pattern. A study in South Africa showed that drip irrigation reduced the lateral spread of root systems, and resulted in higher root densities within the drip zone as compared to microsprinkler irrigation (Van ZyI1988). Transpiration (Figures S.2A to C). In 2006, all treatments followed a decreasing trend in Ts between the beginning of July and late August (Fig. 5.2A). Despite the fact that the same amount of water was applied in the PRD treatment as in the fully irrigated treatment, Ts values were close to control in the PRD treatment. This reduction in Ts in PRD treatment might have been due to ABA produced in both the roots and leaves. As expected, the Ts rate was lower in PRD than in fully irrigated treatment. However, PRD closely followed the non-irrigated and RDI treatments in August. This was due to the fact that vine water status is not only one factor that controls the stomatal opening. Other factors such as temperature, solar radiation and vapor pressure deficit affect stomatal opening and consequently Ts rate (Hetherington and Woodward 2003). The results from this study are in agreement with others who showed that PRD treatment 208
231 reduced Ts rate per unit of leaf area, relative to full irrigation (Dry and Loveys 1999, Sto1l2000a). In 2007, Ts was much lower than in 2006, and responded better to irrigation treatments (Fig. 5.2B). The trend in Ts rate was downward until the beginning of July. Afterwards, the Ts values showed a steady trend throughout the season. However, the highest magnitude of difference was between full irrigation treatment and the other treatments. In 2008, contrary to expectations, the Ts trend was very different from previous years (Fig. 5.2C). Despite high soil moisture throughout the season, Ts showed a steady downward trend in all treatments, having almost similar values like those from 2007 (Fig. 5.2B). The lowest values were recorded in the ftrst week of July. Small differences between treatments appeared at the end of July, even though no irrigation treatments had been applied up to that point. Due to the high amount of precipitation in 2008, irrigation treatments were applied only in the last three weeks of August, coinciding with veraison. The average values for Ts in 2008 were less than the values of 2006 and 2007 despite higher soil moisture, which can be explained by lower temperature and solar intensity, two major factors that drive vine transpiration. Effects of PRD on both potted and fteld-grown grapevines include a reduction in stomatal conductance and Ts rate (Dry and Loveys 1999, Dry et al a, b). Chemical signals such as ABA produced in the dry roots reduce stomatal conductance and vegetative growth while the fully hydrated roots maintain a favorable water status in the aerial parts of the plant (Dry and Loveys 1999, Zhang et al. 1987). However, most of the irrigation studies conducted on effect of PRD strategy, calculated the amount of water needed in PRD treatments as a percentage of crop evapotranspiration. The results from this work cannot be compared with those found in most of the studies where PRD strategy was used since in the present trials full water replacement was applied. Moreover, this data showed that PRD treatment affected the transpiration process even in a region which is considered cool and humid. Leaf water potential (Figures. S.3A to C). Leaf '" had a different pattern in each year of the study. In 2006, leaf", showed a different trend than that one found in transpiration (Fig 5.3.A). PRD and full irrigation treatments had the highest leaf", (less negative) while non-irrigated and RDI treatments had much lower values (more negative). The highest magnitude of difference among treatments was recorded at beginning of August, during which the leaf", varied from MPa in fully irrigated treatment to MPa in the non-irrigated treatment (Fig. 5.3A). However, in some studies, leaf '" in non-irrigated vines was reported as high as -1.6 MPa (Dundon and Smart 1984, During and Loveys 1982). The greatest separation of treatments based on leaf '" occurred in 2007 (Fig. 5.3B). Leaf", reached the minimum value (-1.4 MPa) in the non-irrigated treatment, at the end of August (Fig. 209
232 5.3B). The PRD treatment displayed lower water status than the full irrigation treatment on all sampling dates but much higher than the control and 25% ETc RDI. The leaf '" values were> -1.0 MPa in PRD and full irrigation treatments throughout the season (Fig. 5.3B). This suggests that vines under these two treatments did not undergo any water stress period, since -1.0 MPa is considered as the threshold point from which vines can suffer from different levels of water stress. Leaf 'I' values between -1.4 MPa in well-irrigated post-veraison treatments (3.5 mmdaily) and -1.9 MPa in low irrigated treatments (1 mm daily) were reported for Sauvignon blanc in Israel (Naor et al. 1993). Their values were much lower, even in the well irrigated treatment, than those in the present trial. Since their experiment was in a semi-arid region (Golan Heights), it is difficult to compare responses to treatments, even though they used the same cultivar. Moreover, they stated that the low leaf '" was attributed to the relatively high vapor pressure deficit, wind speed and solar radiation. In general, variations in leaf 'I' are not a result of changes in soil water availability but rather due to temporal variations in meteorological conditions (Naor etal. 1993). In 2008, leaf '" had the lowest values in the first week of July, when all treatments fell to < MPa (Fig. 5.3C). The high amount of precipitation thereafter alleviated the water stress during the season, and the leaf 'I' values were between -0.8 and -0.9 MPa. These data suggest that Sauvignon blanc is an anisohydric cultivar, showing high variation due to soil moisture content, especially in Generally, as a soil dries out a decrease in stomatal conductance is associated with a reduction in leaf '1'. In brief, isohydric plants tend to maintain a more constant water status by controlling stomatal conductance from an interaction between hydraulic and chemical signals, whereas anisohydric species tend to have less rigid stomatal control, which allows a greater fluctuation in leaf", with decreasing soil '" (Lambers et al. 1998, Tardieu and Simonneau 1998) or increasing evaporative demand (Soar et al. 2006). Shoot growth and vine size (Figs. 5.4A, B; Table 5.3). In 2006, vine size was highest in fully irrigated and RDI treatments (Table 5.3). Contrary to the expectation, PRD treatments, that received 100% ETc, had a lower vine size than 25% ETc. This might be explained by the higher production of ABA in the PRD treatment, which affects the shoot growth rate. In 2006, the shoot growth rate showed an increasing trend for 100% ETc treatment with a maximum in the first week of July (Fig. 5.4A). The maximum magnitude of difference among treatments was found at beginning of July with values between 5 and 43 cm. Even in a wet year such as 2006, shoot growth rate showed a steadily decreasing trend, reaching a minimum at the end of July. The 100% ETc treatment had the highest shoot growth rate in both years studied. The vegetation in 2006 was more advanced at the time that data collection began compared to In 2007, vine size was highest 210
233 in 100% ETc, while the vine size in the PRD treatment did not differ from non-irrigated vines. The maximum growth rate reached a peak in 2007 almost one week later compare to 2006 (Fig. 5.4B). This can be explained by the higher amount of precipitation that accelerated shoot growth in irrigation treatments. The PRD treatment had an intermediate shoot growth rate between the control and full irrigation treatments. In the 2008 season, vine size was not different among treatments, which is not surprising in view of the consistently high soil moisture throughout the season (Table 5.3). In 2008, shoot growth data were collected just once, and because of the high amounts of precipitation, no treatment differences occurred (data not shown). Winter pruning weights provided an assessment of vine size. One interesting observation was that not in all treatments the vine size was correlated with shoot growth rate. The results do not totally agree with previous studies where reduction in shoot and fruit growth was found in vines under water stress (Bravdo et al. 1985, Evans et al. 1993, McCarthy and Coombe 1984). However, many studies showed conflicting results in the PRD experiments, probably because many studies used a combination of PRD and deficit water strategy. A study comparing PRD and conventional irrigation methods, using two different water regimes, showed that most of the effects were due to the volume of water applied and not due to the method used (Gu et al. 2004). This data showed that both the method and the water regime can affect vine performance. However, the pattern is also affected by the climatic conditions from one particular year. A moderate stress can reduce vegetative growth without affecting photosynthetic activity, which favors the partitioning of the carbohydrates (Carbonneau and Deloire 2001). However, deficit irrigation treatments of 20 and 40% of ETc led to no differences in vegetative growth (Centeno et al. 2005). Findings from present study are similar to results of RDI trials on Sauvignon blanc in Marlborough, New Zealand which indicated that RDI strategy decreases vine size (Greven et al. 2005). Yield components (Table 5.3). Very few yield variables were affected by irrigation in No differences were recorded in terms of yield between non-irrigated and the other treatments,although RDI and PRD had yields slightly lower than the control. PRD and fully irrigated treatments had lower numbers of clusters per vine. This variation is not well explained by the treatments since it is well known that cluster differentiation occurred in the previous year when no treatments were applied. However, the full irrigation treatment was different than the control in terms of cluster weight and berry weight. Surprisingly, although PRD got 100% ETc replacement, it was different only in terms of berry weight (Table 5.3). In 2007, yield components responded better to irrigation treatments. Yield had the highest value in 100% ETc and was different from non-irrigated, while PRD and RDI were slightly higher than the non-irrigated vines. Contrary to 211
234 the 2006 season, in 2007, the highest number of clusters per vine was found in RDI treatment, while PRD and full irrigation treatments showed intermediary values. This situation occcured due to the irrigation treatments, which were initiated in 2006, or due to the climatic conditions during the previous season. However, the cluster and berry weights had the highest values in 100% ETc. The number of clusters from the PRD treatment were not significantly different compare to control, although they were 10 % heavier (Table 5.3). In 2008, the PRD treatment had the lowest yield, mainly due to the lowest number of clusters per vine. This might be explained by some changes in hormonal balance in the previous season during the cluster initiation (perhaps due to carryover effects of the sunny and dry 2007 season). However, no differences were observed among treatments in terms of cluster weight and berries per cluster (Table 5.3.). In 2008, yield components had the highest values in all four treatments compared with 2006 and Evaluation of PRD and RDI strategies on Sauvignon blanc in California found that Ts rate, pruning weights, number of lateral shoots and fruit TA were affected only by irrigation volume and not by method of irrigation used (Gu et al. 2004). Vines from PRD treatments compensate for the loss of available water on the dry side by a relative increase in root development in moist soil layers, and in the deeper part of the dry side (Dry et al. 2000c). In one study on water use by Sauvignon blanc vines in Marlborough, New Zealand, reducing water by 40% did not lead to differences in yield or quality variables (Greven et al. 2005). In an area like Marlborough where irrigation is normally supplemental rather than essential and which is similar to the climatic conditions during the growing season, seasonal differences are likely to be greater than irrigation treatment differences (Greven et al. 2005). In this study the results do not clarify the beneficial effect of PRD versus RDI, even if some variables were affected by them. This might be also explained by the climatic variation throughout the period studied over which were not under control. One study conducted on Thompson Seedless indicated that a 50% reduction in irrigation volume resulted in only a 26% yield loss while a 70% reduction in irrigation volume resulted in only a 35% yield loss (Grimes and Williams 1990). Lack of yield reductions in RDI treatments was explained by the fact that the vines did not reach the critical leaf area to fruit weight ratio (Gu et al. 2004). Berry composition (Table 5.4). All measured constituents were affected by the irrigation treatments. In 2006, full irrigation and RDI treatments had higher Brix than PRD and nonirrigated treatments contrary to the expectations, while TA was higher in all irrigated treatments.. compare to the control. Berry ph was higher than non-irrigated only in PRD and full irrigation treatments. The most noteworthy observation was that Brix values were much lower in
235 compare to 2006 and 2008 seasons (Table 5.4). However, the full irrigation treatment had the lowest Brix while PRD had the highest one. Berry TA was the lowest in the control. Contrary to the expectations, TA had higher values in RDI than PRD, although more water was applied in the latter treatment. All irrigated treatments displayed small increases in berry TA, but only the 100% ETc displayed other differences relative to the control (lower Brix, higher ph). In 2008, Brix did not show differences among treatments but they had overall slightly higher values than in However, in 2008 TA had higher values in PRD and full irrigation, while ph was higher in nonirrigated and PRD treatments. In terms of berry composition, there was no consistent pattern among irrigation treatments from year to year, which suggests that other climatic factors might affect the berry chemistry. Some studies showed that irrigation increased the total Brix per berry. However, total soluble solids levels were reduced either due to a dilution effect (Bravdo et al. 1985) or competitive vegetative sinks (Bravdo and Hepner 1987). Because of high climatic variation over the period studied, both explanations are plausible to justify the variation in ~rix data. In Bordeaux, a TA of 7.5 gil is considered optimum for the production of well-balanced white wines (Ribereau-Gayon et al. 1998). In this study, a TA of7.5 gil was only found in the 100% ETc in However, contrary to the expectations, the TA values were the highest in 2006 despite more rainfall in 2008, as well as lower temperatures and lower solar radiation intensity. The results are not totally in agreement with other studies conducted in Israel, where moderate reduction in TA was observed under water deficits (Bravdo et al. 1985). In contrast, an Australian study reported no effect of water stress on berry TA (McCarthy et al. 2000). However, most studies have shown that TA increased and Brix decreased under excessive irrigation, resulting in delayed fruit maturation (Freeman et al1980, Hepner et al. 1985). An irrigation study on Tempranillo grapevine suggested that higher yields in irrigated vines did not have any adverse effect on grape must composition and hence on grape juice quality, because the whole synthesis and accumulation processes were able to offset any dilution effects (Esteban et al. 1999). Severe water deficit stress determined low berry sugar concentration, low TA and high ph, because oflow malic acid concentration (Goodwin 2002). The berry composition affected by deficit or excess water is not favorable for producing high-quality white wines (Peyrot des Gachons et al. 2005). In general, the response of berry ph to soil moisture varies. Berry ph increased with irrigation for Carignane (Freeman and Kliewer 1983), but not for Cabernet franc (Matthews and Anderson 1988), or Cabernet Sauvignon (Bravdo et al. 1985, Neja et al. 1977). In another study on Shiraz, no berry ph response to irrigation was reported (McCarthy et al. 2000). However, a 213
236 reduction in ph was noted in PRD irrigated fruit compared to control vines, and this was due to the reduced canopy density (Dry et al. 2000c). In Bordeaux, berry composition of Sauvignon blanc at harvest was more influenced by vine water status rather than by vine nitrogen status (Peyrot des Gachons et al. 2005). The grape juice from water deficit-stressed vines contained more nitrogen, contrary to many other studies that showed that water deficit decreased the nitrogen level in berries (Peyrot des Gachons et al. 2005). It is likely that high nitrogen status increases the susceptibility of vines to water stress. The same authors explained that high nitrogen uptake promotes shoot growth early in the season and consequently results in high leaf area. High leaf area increases vine water use and favors depletion of soil water reserves (Peyrot des Gachons et al. 2005). PRD is associated overall with an increase in berry quality, due to increased control over vegetative growth leading to increased light penetration into the fruiting zone (De Souza et al. 2005). The same authors found that PRD maintained yield, but berry quality was not improved compared to fully irrigated vines (De Souza et al. 2005). In this study PRD treatment did not show a consistent effect on yield components and berry composition over the period studied. This might be explained by the climatic variation from year to year or through the amount of water used. Since in most of the experiments, PRD treatment replaced just a fraction of ETc, it is possible that the real effect of PRD treatment to be determined by water deficit and not by the irrigation strategy used (Gu et al. 2004). Must and wine composition (Table 5.5 and 5.6). In 2006, the highest must Brix was found in the PRD treatment and the lowest one in the full irrigation (Table 5.5). This pattern was different than that one found in berry composition. A possible higher ABA production in the PRD treatment could explain this finding. ABA could control the stomatal opening which in tum it controls the hydraulic conductivity in the xylem vessels. Less water accumulated in the berries due to controlling the water flux could maximize soluble solids accumulation in the berry without a dilution effect. Must TA was lowest in the control but slightly higher in the irrigated treatments. Must ph was highest in the fully irrigated treatment and lowest in the RDI treatment (Table 5.5). One interesting observation was that must from PRD and RDI treatments had the same TA but different ph values. The ph was much lower in the RDI. This is partially explained by treatment effect on potassium uptake (Boulton 1980). In 2007, contrary to the expectation, must Brix was much lower in all treatments than in 2006 (Table 5.5). The lowest Brix was found in the fully irrigated treatment. Moreover, ph values 214
237 were much lower in all treatments compared to This indicates that metabolism of the main acids in the vine and also potassium uptake could be disturbed in hot and dry years. This is in agreement with one study which showed a strong relationship between potassium, acids and ph (Boulton 1980). In 2006, the alcohol concentration in the wines followed the same pattern as Brix in the corresponding must. Wine TA decreased in all treatments following the same pattern as in the musts. Wine ph showed a slightly decreasing trend in all wines (Table 5.6). In 2007, all the wines had lower alcohol concentration compare to those from The difference among treatments was slightly lower in 2007 than in The ph in 2007 was not different in any wine from that found in the corresponding must. An irrigation experiment in South Africa showed that the wine quality of Colombar was insensitive to irrigation (Van ZyI1984). Other irrigation studies on white cultivars such as Chenin blanc (Marais et al. 2005) and Sauvignon blanc (Myburgh 2006) suggest that smaller berries as a result of reduced irrigation would not dramatically increase the quality of white wine. Sensory analysis (Table 5.8; Fig. 5.7, 5.8). The 2006 vintage was rejected from the sensory analysis due to an off flavor found in most of the experimental wines after a preliminary bench tasting. The 2007 vintage was assessed for seven aroma descriptors and eight flavors and mouthfeel descriptors. As expected, substantial differences occurred between the control and the irrigated treatments. The PRD wines despite having higher intensity of some aroma and flavor descriptors when compared with the control, they were not different from those from the full or 25 % ETc irrigation treatments. Despite applying the same amount of water alternately in the PRD or on both sides in the fully irrigated treatment, there were differences between them for most of the aroma descriptors. The 25% ETc treatment showed the greatest difference from the control for all descriptors except honey and melon flavor (Table 5.8). Honey and melon aroma showed the highest score in PRD wines. The control showed the highest intensity of the honey descriptor, although the intensity score for stone fruit was very close to that one found in wines fromprd. The PRD wines had the highest score for melon and stone fruit. Lemon grass and acidity were higher in irrigated treatments compare to the control. Overall, the 25 % ETc showed higher intensities for most of the typical descriptors for this cultivar (Table 5.8). However, boxwood and hay are common descriptors for Sauvignon blanc wines from cool regions. These two descriptors, which generally describe the "green" character of Sauvignon blanc, had higher scores in irrigated treatments compare to the control (Table 5.8). 215
238 Different studies (Darriet et al. 1995) showed that the thioi4-mercapto-4-methylpentan-2- one is responsible for the box tree and hay aromas in Sauvignon blanc wines, while 4-mercapto-4- methylpentan-2-01 smells of citrus zest, and 3-mercaptohexan-l-01 (3MH) correspond to grapefruit and passion fruit flavor (Tominaga et al. 1998). The concentration of volatile thiols responsible for most of the flavor and aroma in Sauvignon blanc wine is directly related to the concentration of their precursors, but only a small percentage of the precursors are effectively transformed into aroma during vinification (Peyrot des Gachons et al. 2000). Moreover, thiols had a higher degree of correlation with the sensory attributes when comparing them to methoxypyrazines (Lund et al. 2009). The latter chemical compounds are responsible for green- capsicum characteristics (Allen and Lacey 1999). This sensory data did not show an increase in intensity of any attribute related to the fresh green vegetable characteristics even in wines from the full irrigated treatments. This might be explained by the relative high temperature and solar radiation during the 2007 growing season (Chapter 3a), which can affect the metabolism of methoxypyrazines in berries. The typical Sauvignon blanc aroma profile is affected by origin/climate where the grapevines are grown (Allen and Lacey 1993). Methoxypyrazines are also light sensitive and easily degradable to other components (Heymann et al. 1986). This might be a reasonable explanation of the results in 2007, when besides a higher solar intensity during the season, high temperatures might enhance the catabolism ofmethoxypyrazine (Marais 1994). Moreover, "herbaceous-vegetative" aroma of Sauvignon blanc is known to decrease progressively as grape maturity increases (Augustyn et al. 1982). According to previous findings, it has been expected to see more vegetal character in the full irrigation treatment where the canopy size was larger and more clusters shade possible occurred. Overall, few research on the relationship among vine and soil water status, irrigation strategies and the sensory profile of Sauvignon blanc has been done. Dry (2004) reported that PRD has the potential to improve wine quality by increasing secondary metabolites such as phenolics and isoprenoids, including carotenoids and C norisoprenoids that could also affect wine quality 13 (color, astringency, mouth feel, aroma/flavor). This data also showed an increase in intensity of some of the aroma descriptors, which might be reasonably explained by changing the enzymatic activity under different water status level in the vine. The role of light in mechanisms of flavor biosynthesis appears to be of particular importance. Water status might have an indirect effect on flavor accumulation through its effect on the canopy size. Changes in flavor compounds as a result of leaf and cluster shading was more related to the effect of light rather than the temperature (Morrison and Noble 1990). Although, the sensory data was not accompanied by chemical aroma 216
239 and flavor compounds analysis, the Sauvignon blanc wine sensory profile had many of the distinctive characteristics for this cultivar, both fruity (citrus, tropical, gooseberry, passion fruit) and green (grassy, leafy, capsicum, asparagus) characteristics (Cooper 2002). However, their intensity seems to be affected by different irrigation strategies used (Table 5.8). The PCA on 2007 sensory data showed that the first two factors explained 78.63% of variability (Fig. 5.7). PCI explained 44.88% while PC2 explained 33.75% ofthe variability in the data set. PCI was positively loaded with lemon grass, tropical fruit, boxwood aroma and acidity, and negatively loaded with honey aroma. PC2 was positively loaded with melon aroma and flavor. The distribution of 2007 wines on the PCA plot showed a good discrimination among the treatments. Contrary to the expectations PRD (100% ETc) located in the upper right plane, and the fully irrigated treatment located in the lower right plane were not associated with the same aroma and flavor descriptors. The PRD and RDI treatments were located in the same plane, being associated with stone fruit, tropical fruit, honey, melon, and honey descriptors. By plotting the mean sensory scores on radar diagrams for each treatment, data clearly showed that not only the water status affected the wine sensory profile but also the strategy used (Fig. 5.8). Unfortunately, having wines just from one season did not allow to draw conclusions of the vintage effect on the wine sensory profile. In the present study data is nonetheless in agreement with Peyrot des Gachons et al. (2005) who found that in dry vintages, the highest aroma potential was achieved on the plots with the greatest water reserves while in wet vintages, the highest aroma potential was achieved on the plots with the lowest water reserves. Moreover, the same authors found that water deficit stress reduced berry size but it was not observed any relationship between berry size and berry aroma precursor concentration in Sauvignon blanc, which is consistent with data from 2007 (Tables 5.3 and 5.8). Relationships among soil and plant water status, yield components and chemical data PLS regression was performed on field, yield components and berry composition data from 2006 (Fig. 5.5). The diagram illustrated a high degree of correlation between Ts rate, leaf \ji and juice ph. This suggests that Ts rate might be a good predictor for juice ph. However, this is not the case all the time since it is well known that under particular climatic condition both Ts rate and leaf \ji could be affected by other factors than soil moisture. However,since ph in berry was not correlated with TA, it suggested that the ph variation was due to potassium uptake rather than the acid metabolism. All these variables were negatively correlated with leaf temperature. Leaf temperature is often above the air temperature mainly due to solar radiation. Leaf temperature decreases when the transpiration rate is high. However, a high Ts rate could not be possible 217
240 without consistently high soil moisture. Vine size was highly positively correlated with ~rix and TA in berry and wine and negatively correlated with alcohol concentration. Overall, these relationships indicate that irrigation treatments that control the canopy size did not have a negative effect on ~rix accumulation. Although soil moisture might increase the vine canopy, a good ratio between total leaf area and crop load would not affect negatively the sugar accumulation in berries. Yield was highly positively correlated with berries per cluster, and negatively correlated with the ph in wine. This relationship could not be explained very well by the treatments since flower differentiation occurs at budburst or immediately after The pea plot of field data indicated that FI and F2 explained for 99.97% of the total variability in the data set (Fig. 5.6). This suggests that in very hot and dry seasons, in areas normally considered cool, soil and plant water status variables react differently to the strategy and volume of water applied through irrigation. Soil moisture was highly positively correlated with leaf'll, and negatively correlated with leaf temperature. Despite the fact that leaf'll is affected more by the vapor pressure deficit and less by the soil moisture, in this study data indicated a good correlation between'll and soil moisture. Vine size did not explain the variability on the frrst two components. All four irrigation treatments were well separated by their effects on physiological variables. The fully irrigated treatment was located in the upper right plane, PRD in the lower right plane, and the control and RDI treatment was located in the upper left plane. This indicates that the control and RDI treatment have almost the same effect on the field data. This data corroborate findings showing that vines are more responsive to volume of water applied through irrigation and less to the strategy used to deliver it (Gu et al. 2004). In 2007, PLS analysis was performed on whole data set including sensory ones (Fig. 5.9). The PLS diagram illustrated a strong negative correlation among leaf temperature and Ts rate, leaf '1', soil moisture, yield, clusters per vine and boxwood aroma. This indicates that leaf temperature could be a good predictor for soil water status and yield components. Due to the fact that 2007 season was characterized by high temperature and low precipitation, the vines conserved water by stomatal closure. This could have led to overheating the leaves and inhabiting the enzymatic activity. Lemon grass was strong negatively correlated with honey and tropical fruit aroma descriptors. Soluble solids concentration was highly positively correlated with the alcohol concentration, stone fruit flavor and melon aroma, and negatively correlated with tropical fruit aroma and boxwood flavor. In other studies, tropical fruit and boxwood (green) aroma were associated with cool-wet region style of Sauvignon blanc, while stone fruits and melon were associated with warm-dry climates (Myburgh 2006, Peyrot des Gachons et al2005). 218
241 In 2008, PLS analysis performed on field, yield components and berry composition data showed different relationships among the variables (Fig. 5.10). Leaf temperature was highly negatively correlated with leaf,!" berry TA, berry weight and soil moisture. Low leaf temperature indicates that soil had enough water reserves, and minimal water lost though transpiration. Therefore, high canopy size develops, which in turn extends the ripening process and delays the harvest time. This aspect was seen in low berry Brix and high TA. Vine size was highly positively correlated with cluster weight, while juice ph was highly negatively correlated with yield, Ts, and clusters per vine. This indicates that high water status, negatively affects the fruit quality, particularly if the other two climatic factors (temperature and solar radiation) are low throughout the season. Soil moisture, soluble solids and the number of berries per cluster showed no relationship with any other variable studied. PRD irrigation strategy applied at deficit rates, have generated various responses in vines in different experiments. Some studies showed that vines are more affected by irrigation volume rather than method of application (Chalmers et al. 2004, Pudney and McCarthy 2004). Other studies concluded that PRD applied at different levels of ETc had no effect on physiology in peaches (Goldhamer et al. 2002) and grapes (Gu et al. 2004). The response of plants to PRD might be strongly influenced by environmental and management factors such as soil type, cultivar, vapor pressure deficit, irrigation frequency and level of deficit applied (Chalmers et al. 2004, De Souza et al. 2003). In the present trials, PRD effect might be altered especially in 2006 and 2007 by natural rainfall, and also by substantial horizontal movement of water through the soil profile due to the relatively high clay content. PRD irrigation strategy used in vineyards generates a unique physiological response distinct from conventional irrigation. By controlling water loss under high and low vapor pressure deficit, PRD improves water use efficiency (Collins et al. 2008). Data from the present study partially agrees with this finding. PRD grapes had higher Brix than grapes from full irrigation in one of three years studied. Conclusions Using RDI or PRD in dry and warm years improved grape composition in the Niagara Region. Water status altered canopy characteristics, affecting vine physiology, which was not necessary translated into changes in grape composition. Irrigation did not have consistent effects on yield components and berry composition. This lack of consistency might be because soil moisture was relatively high during the growing season, since the irrigation treatments were initiated at fruit set. This is supported by results from previous studies on Baco noir (Chapters 3a 219
242 and 3b) and Chardonnay (Chapter 4), showing that high moisture during the entire growing season did not have a positive effect on grape composition. In very dry and hot seasons, like that of 2007, irrigation improved grape composition and wine aroma typicity. The balance between vegetative and fruity character of the Sauvignon blanc sensory profile was manipulated by soil moisture level. RDI strategy was more consistent in its effect on growth and yield compared to PRD, fully irrigated and non-irrigated treatments. RDI enhanced fruity aroma attributes, which suggests that this could be a viable strategy to improve grape and wine quality in cool areas. These findings are in agreement with others (Peyrot des Gachons et al. 2006) who suggested maintaining a mild water deficit to improve grape quality, not only in Sauvignon blanc but also for a number of other white Vitis vinifera grape cultivars such as GewUrztraminer, Petit Manseng, Gros Manseng, and Semillon. Despite improving the general vine physiology and fruit quality in dry years, more research should be conducted on PRD before a strong recommendation can be made. The results of this study clearly showed that both ends of plant water status spectrum had a negative effect on vine performance, while moderate water stress, 25 % RDI in this case, had a positive effect on fruit quality. This contradicts a common belief among winemakers that irrigation affects fruit and wine quality negatively every time when it is used. More work is also required to find out whether the quality improvement found in red grapes might also be achieved in white grapes in different seasons and different regions. PRD offers significant advantages over RDI in achieving these quality improvements. Certainly, the sensory profile for Sauvignon blanc could be manipulated through irrigation. More research should nonetheless be done regarding the relationship of soil and vine water status, and their effects on the chemical compounds responsible for the sensory profile of this cultivar. Literature Cited Allen, M.S. and M.1. Lacey Methoxypyrazine grape flavour: Influence of climate, cultivar and viticulture. Wein-Wiss. 48: Allen, M.S., and M.1. Lacey Methoxypyrazines of grapes and wines. pp In: Chemistry of Wine Flavor. A.L. Waterhouse and S.E. Ebeler (Eds.), Oxford University Press, Oxford, UK. Allen, R., L. Pereira, D. Raes, and M. Smith Crop evapotranspiration-guidelines for computing crop water requirements. FAO Drainage Paper 56,Food and Agriculture Organization of the United Nations, Rome, Italy. 300p Augustyn, O.P.H., A. Rapp, and C.J. Van Wyk Some volatile aroma compounds in Vitis vinifera L. cv. Sauvignon blanc. S. Afr. J. Enol. Vitic. 3:
243 Balint, G. and AG. Reynolds Effect of different irrigation strategies on vine physiology and grape quality of Cabemet Sauvignon and Sauvignon blanc in a cool-climate area. Prog. Agri. Vitic. 127(11): Boulton, RB The general relationship between potassium, sodium and ph in grape juice and wine. Amer. J. Enol. Vitic. 31: Bravdo, B. and Y. Hepner Irrigation management and fertigation to optimize grape composition and vine performance. In: Grapevine canopy and vigour management. Acta Hort. 206: Bravdo, B., Y. Hepner, C. Loinger, S. Cohen, and H. Tabacman Effect of irrigation and crop level on growth, yield and wine quality of Vitis vinifera L. cv. Cabemet Sauvignon. Am. J. Enol. Vitic. 36: Carbonneau, A, and A Deloire Plant organization based on source-sink relationships: New findings on developmental, biochemical and molecular responses to environment. pp In: Molecular Biology and Biotechnology of the Grapevine. K.A Rouhelakis-Angelakis (Ed.), Kluwer Academic, Dordrecht, Netherlands. 474p. Centeno, A, P. Sanchez-de-Miguel, R Linares, and J.R Lissarrague Changes in must composition during ripening of 'Tempranillo' grapevines as a function of two irrigation treatments. Acta Hort. 689: Chalmers, Y., G. Kelly, and M. Kristic Partial rootzone drying of Vitis vinifera cv. 'Shiraz' winegrapes in a semi-arid climate. Acta Hort. 664: Collins, M., E. Barlow, S. Fuentes, and G. Kelley Water use responses of Shiraz vines under partial root zone drying in a water-limiting environment. Acta Hort. 792: Conradie, W.J., V.A Carey, V. Bonnardot, D. Saayman, and L.H. Van Schoor Effect of different environmental factors on the performance of Vitis vinifera L. cv. Sauvignon blanc grapevines in the StellenboschlDurbanville districts of South Africa. I. Geology, soil, climate, phenology and grape composition. S. Afr. 1. Enol. Vitic. 3: Cooper, M The Wine Atlas of New Zealand. Hodder Moa Beckett Pbs., Auckland, NZ. 288p. Darciet, P., T. Tominaga,V. Lavigne, J. Boidron, and D. Dubourdieu Identification of a powerful aromatic component of Vitis vinifera L var. Sauvignon wines: 4-mercapto-4- methylpentan-2-one. Flav. Fragr. J. 10: Davenport, J., R Stevens, and K. Whitley Spatial and temporal distribution of soil moisture in drip-irrigated vineyards. HortSci. 43: De Souza C.R,J.P. Maroco, T.P. Dos Santos, M.L. Rodrigues, C. Lopes, J. Pereira, J. Silva, and M.M. Chaves Partial root zone drying: regulation of stomatal aperture and carbon assimilation in field grown grapevines (Vitis vinifera cv. Moscatel). Funct. Plant BioI. 30: De Souza, C.R, J.P. Maroco, T.P. Dos Santos, M.L. Rodrigues, C. Lopes, J. S. Pereira, M.M. Chaves Control of stomatal aperture and carbon uptake by deficit irrigation in two grapevine cultivars. Agric. Eco. Envir. 106: Dry, P.R Optimizing winegrape quality with partial rootzone drying. Final Report. Cooperative Research Center for Viticulture. Grape and Wine Research and Development Corporation. Australia. 221
244 Dry, P.R, and B.R. Loveys Factors influencing grapevine vigour and the potential for control with partial root zone drying. Austral. J. Grape Wine Res. 4: Dry, P.R., and B.R. Loveys Grapevine shoot growth and stomatal conductance are reduced when part of the root system is dried. Vitis. 38: Dry, P.R., B.R. Loveys, and H. DUring. 2000a. Partial drying of the rootzone of grape. I. Transient changes in shoot growth and gas exchange. Vitis. 39:3-7. Dry, P.R., B.R. Loveys, and H. DUring. 2000b. Partial drying of the rootzone of grape. II. Changes in the pattern of root development. Vitis. 39:9-12. Dry, P.R., B.R. Loveys, H. DUring, and B.G. Botting Effects of partial root-zone drying on grapevine vigour, yield composition of fruit and use of water. pp In: Proceedings 9th Australian Wine Industry Technical Conference, C.S. Stockley, AN. Sas, R.S. Johnstone and T.H. Lee (Eds.) Winetitles, Adelaide, Australia. Dry, P.R., B.R. Loveys, M.G. McCarthy, and M. Stoll Strategic irrigation management in Australian vineyards. J. Int. Sci. Vigne Vin. 35: Dry, P.R., B.R. Loveys, M. Stoll, D. Stewart, and M.G. McCarthy. 2000c. Partial rootzone dryingan update. Austral. GrapegrowerWinemaker. 438: Dundon, C.G., and R.E. Smart Effect of water relations on the potassium status of Shlraz vines. Am. J. Enol. Vitic. 35: DUring, H., and B.R. Loveys Diurnal changes in water relations and abscisic acid in fieldgrown Vitis vinifera cvs. 1. Leaf water potential components and leaf conductance under humid temperate and semi-arid conditions. Vitis. 21: Esteban, M.A, M.J. Villanueva, and J.R. Lissarrague Effect of irrigation on changes in berry composition of Tempranillo during maturation. Sugars, Organic Acids, and Mineral Elements. Am. 1. Enol. Vitic. 50: Evans, R.G., S.E. Spayd, R.L. Wample, M.W. Kroeger and M.O. Mahan Water use of Vitis vinifera grapes in Washington. Agr. Water Mgt. 23: Freeman, B.M., and W.M. Kliewer Effect of irrigation, crop level and potassium Fertigation on Carignane vines. II. Grape and wine quality. Am. J. Enol. Vitic. 34: Freeman, B.M., T.H. Lee, and C.R. Turkington Interaction of irrigation and pruning levels on grape and wine quality of Shiraz vines. Am. J. Enol. Vitic. 31: Goldhamer, D.A., M. Salinas, C. Crisosto, K.R. Day, M. Soler, and A Moriana Effects of regulated deficit irrigation and partial root zone drying on late harvest peach tree performance. Acta Hort. 592: Goodwin, I Managing water stress in grape vines in Greater Victoria. pp In: Agriculture Notes AG1074, Department of Primary Industries, State of Victoria, Australia. Greven, M., S. Green, S. Neal, B. Clothier, M. Neal, G. Dryden, and P. Davidson Regulated deficit irrigation (RDI) to save water and improve Vitis vinifera L. cv. Sauvignon blanc quality? Water Sci. Technol. 51 :9-17. Grimes, D.W., and L.E. Williams Irrigation effects on plant water relations and productivity of 'Thompson Seedless'grapevines. Crop Sci. 30: Gu, S., G. Du, D. Zoldoske, A Hakim, R. Cochran, K. Fugelsang, and 1. Gorgensen Effects of irrigation amount on water relations, vegetative growth, yield and fruit composition of Vitis 222
245 vinifera L. cv. Sauvignon blanc grapevines under partial root-zone drying and conventional irrigation in the San Joaquin Valley of California, USA J. Hort. Sci. Biotech. 79: Hardie, W., and J. Considine Responses of grapes to water-deficit stress in particular stages of development. Am. J. Enol. Vitic. 27: Hepner, Y., B. Bravdo, C. Loinger, S. Cohen and H. Tabacman Effect of drip irrigation schedules on growth, yield, must composition and wine quality of Cabernet Sauvignon. Am. J. Enol. Vitic. 36: Hetherington, AM., and F.I. Woodward The role of stomata in sensing and driving environmental change. Nature 424: Heymann, H., AC. Noble, and RB. Boulton Analysis of methoxypyrazines in wines. I. Development of quantitative procedure. J. Agric. Food. Chern. 34: Jackson, D. and P. Lombard Environmental and management practices affecting grape composition and wine quality-a review. Am. J. Enol. Vitic. 44: Jarvis, P.G., and K.G. McNaughton Stomatal control of transpiration: scaling up from leaf to region. Adv. Ecol. Res. 15:1-19. Keller, M Deficit Irrigation and Vine Mineral Nutrition. Am. J. Enol. Vitic. 56: Kingston, M.S., and E.W. Presant The Soils of the Regional Municipality of Niagara. Report 60 of the Ontario Institute of Pedology, Guelph, ON. Lakso, AN., and RM. Pool Drought stress effects on vine growth, function, ripening and implications for wine quality. pp In: Proc. 29th NY Wine Industry Workshop, NYS Agric. Exper. Sta. Lakso, AN., and RM. Pool The effects of water stress on vineyards and wine quality in Eastern vineyards. Wine East 29:4: Lambers, H., F.S. Chapin, and T.L. Pons Plant physiological ecology. Springer-Verlag, New York, USA Loveys, B.R 1984a. Abscisic acid transport and metabolism in grapevine (Vitis vinifera L.). New Phytol. 98: Loveys, B.R 1984b. Diurnal changes in water relations and abscisic acid in field-grown Vitis vinifera cultivars: III. The influence of xylem-derived abscisic acid on leaf gas exchange. New Phytol. 98: Lund, C.M., M.K. Thompson, F. Benkwitz, M. Wohler, C.M. Triggs, R Gardner, H. Heymann, and L. Nicolau New Zealand Vitis vinifera L. cv. Sauvignon blanc distinct flavor characteristics: sensory, chemical, and consumer aspects. Am. J. Enol. Vitic. 60:1-12. Marais, J Sauvignon blanc cultivar aroma - A review. S. Afr. J. Enol. Vitic. 15: Marais, J., D. Van Schalkwyk, and F. October Effek Van korrelgrootte, sonligblootstelling en rypheid op Chenin blanc wynkwaliteit. Wynboer 92: Matthews, M., and M. Anderson Fruit ripening in Vitis vinifera L.: responses to seasonal water deficits. Amer. J. Enol. Vitic. 39: McCarthy; M.G The effect of transient water deficit on berry development of cv. Shiraz (Vitis vinifera L.). Austral. J. Grape Wine Res. 3:
246 McCarthy, M.G., and B.G., Coombe Water status and wine grape quality. Acta Hort. 171: McCarthy, M.G., B.R. Loveys, P.R. Dry, and M. Stoll Regulated deficit irrigation and partial root zone drying as irrigation management techniques for grapevines. Deficit irrigation practices. pp Water Reports No. 22. FAO Rome, Italy. Morrison, J.e., and A.C. Noble The effects ofleaf and cluster shading on the composition of Cabernet Sauvignon grapes and on fruit and wine sensory properties. Am. J. Enol. Vitic. 41: Myburgh, P.A Water status, vegetative growth and yield of Vitis vinifera L. cvs. Sauvignon blanc and Chenin blanc in response to timing of irrigation during berry ripening in the Coastal region of South Africa. S. Afr. J. Enol. Vitic. 26: Myburgh, P.A Juice and wine quality response of Vitis vinifera L. cvs. Sauvignon blanc and Chenin blanc to timing of irrigation during berry ripening in the Coastal region of South Africa. S. Afr. J. Enol. Vitic. 27:1-7. Naor, A, B. Bravdo, and Y. Hepner Effect ofpost-veraison irrigation level on Sauvignon blank yield, juice quality and water relations. S. Afr. J. Enol. Vitic. 14: Neja, R.A, W.E. Wildman, R.S. Ayers, and AN. Kasimatis Grapevine response to irrigation treatments and trellis levels in the Salinas Valley. Am. J. Enol. Vitic. 28: O'Mahoney, M Sensory Evaluation of Food. Statistical Methods and Procedures. Marcel Dekker, New York. 486p. Ojeda, H., E. Kraeva, A Deloire, A Carbonneau, and e. Andary Influence of pre- and postveraison water deficits on synthesis and concentration of skin phenolic compounds during the berry growth of Shiraz grapes (Vitis vinifera L.). Am. J. Enol. Vitic. 53: Ontario Grape Growers Marketing Board Ontario Ministry of Agriculture, Food & Rural Mfairs (OMAFRA) Fruit production recommendations. Publication 360, Ontario Ministry of Agriculture, Food and Rural Affairs, Toronto, ON. Peyrot des Gachons, C., T. Tominaga, and D. Dubourdieu Measuring the aromatic potential of Vitis vinifera L. cv. Sauvignon blanc grapes by assaying S-cysteine conjugate compounds, precursors of the volatile thiols responsible for the varietal aroma of wines. J. Agric. Food Chern. 48: l. Peyrot des Gachons, e., e. Van Leeuwen, T. Tominaga, J.P. Soyer, J.P. Gaudillere, D. Dubourdieu Influence of water and nitrogen deficit on fruit ripening and aroma potential of Vitis vinifera L. cv. Sauvignon blanc in field conditions. J. Sci. Food Agric. 85: Pudney, S. and M.G. McCarthy Water use efficiency of field grown Vitis vinifera L. cv. Chardonnay grapevines subjected to partial rootzone drying and deficit irrigation. Acta Hort. 664: Reynolds, A Irrigation management in the East: How much is enough? Wine East 35:38~ 49, Reynolds, A.G., A Ehtaiwesh, and e. de Savigny Irrigation scheduling for 'Sovereign Coronation' table grapes based on evapotranspiration calculations and crop coefficients. HortTech. 19:
247 Ribereau-Gayon, P., D. Dubourdieu, B. Doneche, and A. Lonvaud Traite d'oenologie. Tome 1: Microbiologie du Vin, Vinifications. Dunod, Paris. Rose, M.A. and M.A. Rose Oscillatory transpiration may complicate stomatal conductance and gas-exchange measurements. HortScL 29: Seguin, G The influence of vineyard soils on the composition and quality of harvested grapes. Bull. DIY, 56:3-18. Smart, R.L Grapevine responses to furrow and trickle irrigation. Am. J. Enol. Vitic. 25: Smart, R.E., and B.G. Coombe Water relations of grapevines. pp In: Additional Woody Crop Plants. T. T. Kozlowski (Ed.), Academic Press, New York (T.T. Kozlowski (Ed.). Water Deficit and Plant growth. Vol. VII. Soar, C.J., J. Spiers, S.M. Maffei, A.B. Penrose, M.G. McCarthy, and B.R. Loveys Grape vine varieties Shiraz and Grenache differ in their stomatal response to VPD: apparent links with ABA physiology and gene expression in leaf tissue. Austral. J. Grape Wine Res. 12:2-12. Stoll, M., P.R. Dry, B.P Loveys, D. Stewart, and M.G. McCarthy. 2000a. Partial rootzone drying, effects on root distribution and commercial application of a new irrigation technique. Austral. New Zealand Wine Ind. J. 15:74-7. Stoll, M., B.R. Loveys, and P. Dry. 2000b. Hormonal changes induced by partial rootzone drying of irrigated grapevine. J. Exp. Bot. 51: Tardieu, F., and T. Simonneau Variability among species of stomatal control under fluctuating soil water status and evaporative demand: modelling isohydric and anisohydric behaviours. J. Exp. Bot. 49: Tominaga, T., A. Furrer, R. Henry and D. Dubourdieu Identification of new volatile thiols in the aroma of Vitis vinifera L cv. Sauvignon blanc wines. Flav. Fragr. J. 13: Van der Gulik, T B.C. Trickle Irrigation Manual. B.c. Ministry of Agriculture and Fisheries, Abbotsford. Van Leeuwen, c., and G. Seguin. 2006: The Concept of Terroir in Viticulture. J. Wine Res. 17: Van Zyl, J.L Response of Colombar grapevines to irrigation as regards quality aspects and growth. S. Mr. J. Enol. Vitic. 5: Van Zyl, J.L Response of grapevine roots to soil water regimes and irrigation systems. pp In: The Grapevine Root and its Environment. Van Zyl ll (Ed.) Department of Agriculture and Water Supply, No Pretoria, South Africa: DA WS. Weather Innovations Inc. - Williams, L.E., and J. Ayars Grapevine water use and the crop coefficient are linear functions of the shaded area measured beneath the canopy. Agr. For. Meteorol. 135: Williams, L.E., and M.A. Matthews Grapevine. pp In: Irrigation of Agricultural Crops. B.A. Stewart and D.R. Nelson (Eds.), Am. Society of Agronomy, Madison, WI. Zhang, J., U. Schurr, and W.J. Davies Control of stomatal behaviour by abscisic acid which apparently originates in the roots. J. Exp. Bot. 37:
248 Zs6fi, Z., L. Gal, and Z. Szilagyi Use of stomatal conductance and pre-dawn water potential to classify terroir for the grape variety Kekfrankos. Austral. J. Grape Wine Res. 15:
249 List of Tables Table 5.1. Impact ofprd irrigation treatment on soil moisture (% volumetric content) of Sauvignon blanc measured using a Profile Probe type PR2 at five depths, Lambert Vineyards, Niagara-on-the-Lake, ON, Table 5.2. Impact ofprd irrigation treatment on soil moisture (% volumetric content) of Sauvignon blanc measured using a Profile Probe type PR2 at five depths, Lambert Vineyards, Niagara-on-the-Lake, ON, Table 5.3. Impact of irrigation treatments on yield components and vine size of Sauvignon blanc, Lambert Vineyards, Niagara-on-the-Lake, ON, Table 5.4. Impact of irrigation treatments on berry composition of Sauvignon blanc, Lambert Vineyards, Niagara-on-the-Lake, ON, Table 5.5. Impact of irrigation treatments on must composition of Sauvignon blanc, Lambert Vineyards, Niagara-on-the-Lake, ON, Table 5.6. Impact of irrigation treatments on wine composition of Sauvignon blanc, Lambert Vineyards, Niagara-on-the-Lake, ON, Table 5.7. Attributes and their standard references used for sensory evaluation of Sauvignon blanc wines from Table 5.8. Comparison of mean sensory scores among the irrigation treatments of Sauvignon. blanc wines, Lambert Vineyards, Niagara-on-the-Lake, ON,
250 Table 5.1. Impact ofprd irrigation treatments on soil moisture (% volumetric content) of Sauvignon blanc measured using a Profile Probe type PR2 at five depths, Lambert Vineyards, Niagara-on-the-Lake, ON, Depth Side 21-Jun 04-Jul 18-Jul Ol-Aug 15-Aug 30-Aug Wet Wcm Dry cm 30cm 40cm 60cm WOcm Wet Dry Wet Dry Wet Dry Wet Dry Wet Dry *Each value is a mean of the four PRO replicates reading. *Wet and Dry are the half sides in the row from one vine of the PRO treatment. 228
251 Table 5.2. Impact of PRD irrigation treatments on soil moisture (% volumetric content) of Sauvignon blanc measured using a Profile Probe type PR2 at five depths, Lambert Vineyards, Niagara-on-the-Lake, ON, DeEth Side 27-Jun. 11-Jul 25-Jul 08-Aug 21-Aug Wet locm Dry cm 30cm 40cm 60cm 100cm Wet Dry Wet Dry Wet Dry Wet Dry Wet Dry *Each value is a mean of the four PRD replicates reading. *Wet and Dry are the half sides in the row from one vine of the PRD treatment. 229
252 Table 5.3. Impact of irrigation treatments on yield components and vine size of Sauvignon blanc, Lambert Vineyards, Niagaraon-the-Lake, ON, Treatment Vine size (kg/vine) Yield (kg/vine) Clusters/vine Cluster wt. (g) Berries/cluster Berry wt. (g) 2006 C 0.71 b 7.95 ab 65 a b 89 ab 1.38 b PRD 0.69b 7.44b 59b b 84 b 1.46 a Full 0.86 a 8.16 a 59b a 93 a 1.49 a RDI 0.84 a 7.88 ab 62ab ab 85b 1.47 a Significance * * * * * ** 2007 C 0.60b 6.45 b 53 b b b PRD 0.61 b 7.97 ab 60ab ab b Full 0.76 a 8.61 a 59 ab a a RDI 0.65 ab 8.12 ab 65a b b Significance ** ** * *** ns *** 2008 C b 61 b b PRD c 56c a Full a 70a a RDI ab 67 ab b Significance ns * * ns ns * C-control (non-irrigated); PRD-Partial root zone drying (100% ETc), Full (100% ETc), RDI-Regulated deficit irrigation (25% ETc); *,**,***,****, ns: Significant at P.:5 0.05,0.01,0.001,0.0001, or not significant, respectively. Letters within columns represent means separated at P.:5 0.05, Duncan's multiple range test. Boldfaced data indicate those values significantly greater than the control using Dunnett's t-test; boldfaced and underlined data are significantly less than the control 230,,
253 Table 5.4. Impact of irrigation treatments on berry composition of Sauvignon blanc, Lambert Vineyards, Niagara-on-the-Lake, ON, Treatment Brix Titratable acidity (gil) ph 2006 C 19.5 b 9.1 c 3.49b PRD 19.6b 9.4 b 3.56 a Full 20.2 a 9.6 a 3.57 a RDI 20.3 a 9.3 b 3.53 ab Significance * *** * 2007 C 18.3 ab 6.8 b 3.54 b PRD 18.9 a 7.2ab 3.58 ab Full 17.6 c 7.5 a 3.63 a RDI 18.1 b 7.4 a 3.57 ab Significance * *** *** 2008 C b 3.65 a PRD a 3.66 a Full a 3.60b RDI b 3.59 b Significance ns * * *C-control (non-irrigated); PRD-Partial root zone drying (100% ETc), Full (100% ETc), RDI Regulated deficit irrigation (25% ETc). 100 and 25 % represent percentage of water replaced through irrigation. ETc - crop evapotranspiration. *,**,***,****, ns: Significant at P.$ 0.05,0.01,0.001,0.0001, or not significant, respectively. Letters within columns represent means separated at P.$ 0.05, Duncan's multiple range test. Boldfaced data indicate those values significantly greater than the control using Dunnett's t-test; boldfaced and underlined data are significantly less than the control 231
254 Table 5.5. Impact of irrigation treatments on must composition of Sauvignon blanc, Lambert Vineyards, Niagara-on-the-Lake, ON, Treatment Brix Titratable acidity (gil) ph 2006 C 18.2 b 8.3 b 3..46b PRD 19.2 a 9.0ab 3.56 ab Full 17.6 c 9.3 a 3.60 a RDI 18.9 ab 9.0ab 3.36 c Significance * *** ** 2007 C 17.6 ab 7.9b 3.23 b PRD 17.8 a 7.6c 3.26 ab Full 16.8 c 8.5 a 3.25 ab RDI 17.1 b 8.0b 3.29 a Significance * *** *** *C-control (non-irrigated); PRD-Partial root zone drying (100% ETc), Full (100% ETc), RDI Regulated deficit irrigation (25% ETc). 100 and 25 % represent percentage of water replaced through irrigation. ETc - crop evapotranspiration. *,**, ***,****, ns: Significant at p ~ 0.05,0.01,0.001,0.0001, or not significant, respectively. Letters within columns represent means separated at p ~ 0.05, Duncan's multiple range test. Boldfaced data indicate those values significantly greater than the control using Dunnett's t-test; boldfaced and underlined data are significantly less than the control 232
255 Table 5.6. Impact of irrigation treatments on wine composition of Sauvignon blanc, Lambert Vineyards, Niagara-on-the-Lake, ON, Treatment Ethanol (% (v/v) Titratable acidity (gil) ph 2006 C ab 5.6 b 3.51 b PRD a 6.0ab 3.53 ab Full 9.63 b 6.2 a 3.59 a RDI 9.88 ab 5.8 ab 3.38 c Significance * *** ** 2007 C 9.65b 5.0c 3.26 b PRD 9.78 a 5.2 c 3.26 b Full 9.17 c 5.8 a 3.25 b RDI 9.50bc 5.5 b 3.29 a Significance * **** *** *C-control (non-irrigated); PRD-Partial root zone drying (100% ETc), Full (100% ETc), RDI Regulated deficit irrigation (25% ETc). 100 and 25 % represent percentage of water replaced through irrigation. ETc - crop evapotranspiration. *, **, ***, ****, ns: Significant at p ~ 0.05,0.01,0.001,0.0001, or not significant, respectively. Letters within columns represent means separated at p ~ 0.05, Duncan's multiple range test. Boldfaced data indicate those values significantly greater than the control using Dunnett's t-test; boldfaced and underlined data are significantly less than the control. 233
256 Table 5.7. Attributes and their standard references used for sensory evaluation of Sauvignon blanc wines 2007 Sensory attribute Reference standard (prepared in 100 ml base white wine Kressmann -France) Honey Tropical fruit Boxwood Melon Hay Stone fruit Lemon grass Acidity 1 ml of buckwheat honey (Bulk store) Two pieces of fresh passion fruit and grapefruit (approx. 15g) Ten crushed leaves of boxwood Honeydew melon (20-25 g) 5 g of hay 10 ml (apricot and peach canned) - No Name brand (No Frills) 5 g of lemon grass leaves 1.5g tartaric acid IL water 234
257 Table 5.8. Comparison of mean sensory scores among the irrigation treatments of Sauvignon blanc wines, Lambert Vineyards, Niagara-on-the-Lake, ON, 2007 Variablerrreatment C PRD Full RDI Pr>F Aroma honey 2.3 c 4.1 a 2.6 c 3.3 b <0.001 tropical fruit 1.8c 2.1 c 2.9b 3.5 a boxwood 2.1 c 2.7 ab 2.9 a 2.5 b melon 3.2 b 3.7 a 2.9 b 3.6 ab hay 1.8c 2.3 b 1.7 c 2.9 a stone fruit 2.1 c 2.8 ab 2.6 b. 3.6a lemon grass 1.4 c 2.3 b 2.9ab 3.2 a Flavor/mouthfeel HONEY 3.1 a 2.1 b 2.3 b 2.9ab TROPICAL FRUIT 2.1 b 1.8b 1.8b 3.1 a BOXWOOD 2.3 bc 2.1 c 3.1 a 2.8 b MELON 2.9b 3.6a 2.8 b 3.2ab HAY 1.5 c 2.5 b 3.8 a 2.9b STONE FRUIT 2.9ab 3.1 a 1.1c 2.6 b <0.001 LEMON GRASS 2.1 c 3.4 b 3.1 b 3.8 a ACIDITY 1.5c 3.1 ab 3.6 a 2.7 b * C-control (non-irrigated); PRD-Partial root zone drying (100% ETc), Full (100% ETc), RDI- Regulated deficit irrigation (25% ETc). 100 and 25 % represent percentage of water replaced through irrigation. ETc - crop evapotranspiration. Means within rows with different letters are significantly different, Duncan' s multiple range test. 235
258 List of Figures Figure 5.1. Impact of irrigation treatments on soil moisture (%) of Sauvignon blanc vines measured by Fieldscout 300 TDR, Lambert Vineyards, Niagara-on-the-Lake, ON. A: 2006; B: 2007; C: C-control (non-irrigated); PRD-Partial root zone drying (100% ETc); Full (100% ETc); RDI-Regulated deficit irrigation (25% ETc); 100 and 25 % represent percentage of water replaced through irrigation; ETc - crop evapotranspiration. Figure 5.2. Impact of irrigation treatments on transpiration of Sauvignon blanc vines, Lambert Vineyards, Niagara-on-the-Lake, ON. A: 2006; B: 2007; C: C-control (non-irrigated); PRD-Partial root zone drying (100% ETc); Full (100% ETc ); RDI-Regulated deficit irrigation (25% ETc); 100 and 25 % represent percentage of water replaced through irrigation; ETc-crop evapotranspiration. Figure 5.3. Impact of irrigation treatments on leaf water potential of Sauvignon blanc, Lambert Vineyards, Niagara-on-the-Lake, ON. A: 2006; B: 2007; C: C-control (non-irrigated); PRD-Partial root zone drying (100% ETc); Full (100% ETc ); RDI-Regulated deficit irrigation (25% ETc); 100 and 25 % represent percentage of water replaced through irrigation; ETc-crop evapotranspiration. Figure 5.4. Impact of irrigation treatments on shoot growth rate (cm) of Sauvignon blanc vines, Lambert Vineyards, Niagara-on-the-Lake, ON, 2006 (A) and 2007 (B). C-control (nonirrigated); PRD-Partial root zone drying (100% ETc); Full (100% ETc ); RDI-Regulated deficit irrigation (25% ETc);; 100 and 25 % represent percentage of water replaced through irrigation; ETc -crop evapotranspiration. Figure 5.5. PLS analysis of soil and vine water status, yield components, berry and wine chemical composition means from four irrigation treatments of Sauvignon blanc from Lambert Vineyards, Niagara-on-the-Lake, ON, Figure 5.6. Principal component analysis (Fl&F2) of soil water status and physiological from four irrigation treatments of Sauvignon blanc from Lambert Vineyards, Niagara-on-the-Lake, ON, C-control (non-irrigated); PRD-Partial root zone drying (100% ETc); Full (100% ETc); RDI-Regulated deficit irrigation (25% ETc); 100 and 25 % represent percentage of water replaced through irrigation; ETc-crop evapotranspiration. Figure 5.7. Principal component analysis (Fl&F2) of mean sensory data for four irrigation treatments wines of Sauvignon blanc from Lambert Vineyards, Niagara-on-the-Lake, ON, C-control (non-irrigated); PRD-Partial root zone drying (100% ETc); Full (100% ETc); RDI-Regulated deficit irrigation (25% ETc); PRD-Partial root zone drying (100% ETc); Full (100% ETc); RDI-Regulated deficit irrigation (25% ETc); 100 and 25 % represent percentage of water replaced through irrigation; ETc-crop evapotranspiration. Figure 5-8. Radar diagram of the mean intensity ratings of four Sauvignon blanc wines made from different irrigation treatments Lambert Vineyards, Niagara-on-the-Lake, ON, Aroma and flavor attributes are specified by lower and higher case letters respectively. C-control (nonirrigated); PRO-Partial root zone drying (100% ETc); Full (100% ETc); RDI-Regulated deficit irrigation (25% ETc); 100 and 25 % represent percentage of water replaced through irrigation; ETc -crop evapotranspiration. Figure 5-9. PLS regression analysis of soil and plant water status, yield components, berry and wine composition and sensory data from four irrigation treatments of Sauvignon blanc from Lambert Vineyards, Niagara-on-the-Lake, ON,
259 Figure PLS regression analysis of soil and plant water status, yield components and berry composition from four irrigation treatments of Sauvignon blanc from Lambert Vineyards, Niagara-on-the-Lake, ON,
260 26... Control %PRD 100% Full... 25%RDI 21 - ~ ~ ::::l en '0 11 E '0 (/) 6 1 ns ns 21-Jun 05-Jul 19-Jul 02-Aug 16-Aug 30-Aug Sampling date (2006) A Control... 1OO%PRD % Full -<>-25%RDI "~ --?-- b In ~ ;d... a b Ie I ~a Th ~ T.d,(, 1." 1 ns.-. *111_"".,..-** 2?-Jun 11-Jul 25-Jul 8-Aug Sampling date (2007) Control %PRD 100%Full... 25%RDI B 26. -~ 0 ";i; ::::l ~ 16 E '0 11 (/) 6 ns ns ns ns 23-Jun 10-Jul 25-Jul Aug? 18-Aug 02-Sep Sampling Date (2008) C Figure 5.1. Impact of irrigation treatments on soil moisture (%) of Sauvignon blanc vines measured by Fieldscout 300 TDR, Lambert Vineyards, Niagara-on-the-Lake, ON. A: 2006; B: 2007; C: C-control (non-irrigated); PRD-Partial root zone drying (100% ETc), Full (100% ETc), RDI-Regulated deficit irrigation (25% ETc). 100 and 25 % represent percentage of water replaced through irrigation. ETc - crop evapotranspiration. *, **, ***, ****, ns: Significant at p < 0.05, 0.01, 0.001, , or not significant, respectively. Letters represent means separated at p < 0.05, Duncan's multiple range test. 238
261 Jf!.. N E 15 u <5 N 13 :r: Cl 11 2:: c: 9 0 :.;:::; ~ en 5 c: to.= 3 19 a 1 06-Jul _Control "*:100.%PRD --100% Full... 25%ROI a b c 20-Jul 03-Aug 17~Aug 31-Aug Sampling Date (2006) A... Contro1 "*'"100%PRO % Full %ROI a a a d 26-J.ul 09-Aug Sampling Date (2007) B Control %PRD "'100%Fuli... 25%RDI _1.7 rn "-15 E ~13 o N :r: 11 Cl 2::9 c: 0 ~ '-' rn c: ~ 3 I- 1 ~~. b b ns ns 10-Jul 25-Jul Aug 7 18-Aug Sampling Date (2008) Figure 5.2. Impact of irrigation treatments on transpiration of Sauvignon blanc vines, Lambert Vineyards, Niagara-on-the-Lake, ONo A: 2006; B: 2007; C: C-control (non-irrigated); PRD-Partial root zone drying (100% ETc), Full (100% ETc), RDI-Regulated deficit irrigation (25% ETc). 100 and 25 % represent percentage of water replaced through irrigation. ETc-crop evapotranspiration. *, **, ***, ****, ns: Significant at p < 0.05, 0.01, 0.001,0.0001, or not significant, respectively. Letters represent means separated at p < 0.05, Duncan's multiple range test c 239
262 Control %PRD ""'100% Full... 25%RDI ro e "ffi -0.7 :g a 2 a ~ 3: -1.1 d 15 CD...J ns r0- o e ~ -0.7 ~ c CD 0 c CD ro 21-Jun 05-Jul 19-Jul 02-Aug 16-Aug 3D-Aug..- 3: -1.1 co d' CD...J -1.3 Sampling date (2006)... Control -.lir100%prd % Full... 25%RDI d d c A ns Jun 5-Jul 19-Jul 2-Aug 16-Aug 3D-Aug Sampling date (2007) B l.-100%prd +100%Full + 25%RDI ro :2 i- O.7 'E CD ' c ~-1.1 co ~ L- ---l ns ns ns ns * ns 23-Jun 10-Jul 25"Jul Aug 7 is.aug Sampling Date (2008) c Figure 5.3. Impact of irrigation treatments on leaf water potential of Sauvignon blanc vines, Lambert Vineyards, Niagara-on-the-Lake, ON. A: 2006; B: 2007; C: C-control (non-irrigated); PRD-Partial root zone drying (100% ETc), Full (100% ETc), RDI-Regulated deficit irrigation (25% ETc). 100 and 25 % represent percentage of water replaced through irrigation. ETc-crop evapotranspiration. *,**, ***, ****, ns: Significant at p < 0.05, 0.01,0.001,0.0001, or not significant, respectively. Letters represent means separated at p ~ 0.05, Duncan's multiple range test. 240
263 100, ,... Control %PRD % Full %RDI 90 - ~ BO ~ 70 2 ~ 60 ~ j 50 e OJ ~ 30 (f) 20 ns , ~ r 2Q..Jun 04..Jul 1B-Jul 01-Aug Sampling date (2006) A 80 - _ 70 E (,J ::; 60 - <I Q) ~ c: ~ OJ c: (f) 20 --Control %PRD % Full a b c %RDI ns Jun 11 -Jul 25-Jul Sampling date (2007) DB-Aug B Figure 5.4. Impact of irrigation treatments on shoot growth rate (cm) of Sauvignon blanc vines, Lambert Vineyards, Niagara-on-the-Lake, ON, 2006 (A) and 2007 (B). C-control (non-irrigated); PRD-Partial root zone drying (100% ETc), Full (100% ETc), RDI-Regulated deficit irrigation (25% ETc). 100 and 25 % represent percentage of water replaced through irrigation. ETc-crop evapotranspiration. *, **, ***, ****, ns: Significant at p < 0.05, 0.01, 0.001, , or not significant, respectively. Letters represent means separated at p < 0.05, Duncan's multiple range test. 241

264 1 Correlations with t on axes tl and t N 0 +-' WP ~=::;;::=~==:r ph tl Figure 5.5. PLS analysis of soil and vine water status, yield components, berry and wine chemical composition means from four irrigation treatments of Sauvignon blanc from Lambert Vineyards, Niagara-on-the-Lake, ON, Abbreviations: SM-soil moisture; Leaf T -leaf temperature; L WP-leaf water potential; Ts-transpiration; V vine size; CN-number of clusters per vine; C.W.-cluster weight, B/C-number of berries per cluster; B.W.-berry weight; TA-W- titratable acidity in wine, TA-G- titratable acidity in juice berries; ETOH-volumetric alcoholic content. 242
265 2 Biplot(axes Fl and F2: %) *.-I e N u... c. LeafT. li:vts FII 25RDI "'" N LWP SM PRO F1 (91.35 %) Figure 5.6. Principal component analysis (Fl&F2) of soil water status and physiological from four irrigation treatments of Sauvignon blanc from Lambert Vineyards, Niagara-on-the-Lake, ON, C-control (nonirrigated); PRD-Partial root zone drying (100% ETc), Full (100% ETc), RDI-Regulated deficit irrigation (25% ETc). 100 and 25 % represent percentage of water replaced through irrigation. ETc-crop evapotranspiration. Abbreviations: SM -soil moisture; Leaf T -leaf temperature; L WP-Ieaf water potential; Ts-transpiration; V-vine size. 243
; PRD Partial root zone drying (100% ETc), Full (100% ETc), RDI-Regulated deficit irrigation (25% ETc). 100 and 25 % represent percentage of water replaced through irrigation.")
266 10 Biplot (axes Fland F2: %) 6 STONE FRUIT stone fruit ~ 2 Lt'I,... HONEY m c. -N -2 u Full Fl (44.88 %) Figure 5.7. Principal component analysis (Fl&F2) of mean sensory data for four irrigation treatments wines of Sauvignon blanc from Lambert Vineyards, Niagara-on-the-Lake, ON, C-control (non-irrigated); PRD Partial root zone drying (100% ETc), Full (100% ETc), RDI-Regulated deficit irrigation (25% ETc). 100 and 25 % represent percentage of water replaced through irrigation. ETc-crop evapotranspiration. 244
267 honey STONE FRUIT HAY melon hay c..,.. - PRD... Full -e-25rdi Figure 5.8. Radar diagram of the mean intensity ratings of four Sauvignon blanc wines made from different irrigation treatments Lambert Vineyards, Niagara-on-the-Lake, ON, Aroma and flavor attributes are specified by lower and higher case letters respectively. C-control (non-irrigated); PRD-Partial root zone drying (100% ETc), Full (100% ETc), RDI-Regulated deficit irrigation (25% ETc). 100 and 25 % represent percentage of water replaced through irrigation. ETc-crop evapotranspiration. 245

268 1 Correlations with t on axes tl and t !;j o t1 Figure 5.9. PLS regression analysis of soil and plant water status, yield components, berry and wine composition and sensory data from four irrigation treatments of Sauvignon blanc from Lambert Vineyards, Niagara-on-the Lake, ON, Abbreviations: SM-soil moisture; Leaf T -leaf temperature; L WP-Ieaf water potential; Tstranspiration; V-vine size; CN-number of clusters per vine; C.W.-cluster weight, B/C-number of berries per cluster; B.W.-berry weight; TA-W- titratable acidity in wine, TA-G- titratable acidity in juice berries; ETOHvolumetric alcoholic content. 246

269 1 Correlations with t on axes t1 and t !"J 0 +-' o t1 Figure PLS regression analysis of soil and plant water status, yield components and berry composition from four irrigation treatments of Sauvignon blanc from Lambert Vineyards, Niagara-on-the-Lake, ON, Abbreviations: SM-soil moisture; Leaf T -leaf temperature; LWP-Ieaf water potential; Ts-transpiration; V-vine size; CN-number of clusters per vine; C.W.-cluster weight, BlC-number of berries per cluster;b.w.-berry weight; TA-W- titratable acidity in wine, TA-G- titratable acidity in juice berries; ETOH-volumetric alcoholic content. 247
270 Chapter 6 Effect of Different Irrigation Strategies on Vine Physiology, Yield, Grape Composition and Sensory Profiles of Vitis vinifera L. Cabernet Sauvignon in a Cool Climate Area ABSTRACT Irrigation experiments testing the efficacy of partial root zone drying (PRO) and regulated deficit irrigation (ROI) were conducted in a commercial vineyard block of Cabernet Sauvignon at Lambert Vineyards, Niagara-on-the-Lake, ON from 2006 to The experiment had five treatments: non-irrigated control (C), PRO, Full irrigation [100% crop evapotranspiration (ETc)] and two levels of ROI (50 and 25% ETc). Irrigation treatments started at fruit set and continued until post veraison. Water needs were calculated based on reference evapotranspiration (ET 0), using the Penman-Monteith equation. In the PRO treatments, soil moisture and vine physiology (leaf water potential and transpiration rate) were generally less than 1 00% ETc vines but higher than non-irrigated and ROI treatments. The general vine physiology was controlled not only by the amount of water but also the by irrigation strategy used. Almost all treatments were different than non-irrigated vines in terms of fruit composition and wine sensory attributes. ROlstrategies were more consistent than the PRO treatments in terms of their effect on general physiology, grape composition and sensory profile. Inconsistent patterns from season to seasons in some variables, indicated that besides water status level of soil and plant, there are some other climatic factors which affect vine physiology, yield components and berry composition. Sensory profile was highly changed by the amount of water applied through irrigation in ROI treatments improved the wine quality when compared with full or either non-irrigated treatments. Overall, use of ROI irrigation or PRO during dry and warm years can improve grape composition in cool climates. Key words: Soil moisture, leaf water potential, regulated deficit irrigation, partial root zone drying, sensory profile, Cabernet Sauvignon. Introduction Irrigated vineyards are located mostly in "The New World", in area where there is low rainfall during the growing season, and the moisture in the soil profile is not enough to provide healthy vine growth (McCarthy et al. 2002). California, Australia and Chile are using irrigation in the vineyard in order to supply the necessary water requirements for healthy vines. Despite using irrigation, "The New World" consistently produces very high quality wine, which would not be possible under natural conditions. Drought is not normally an issue in the Northeastem of North America. However, in the last decade, the frequency of water shortages during the vegetation period has increased. Exposure of vines to some degree of water stress during vegetation period has been reported in cool wine 248
271 regions (Reynolds et al. 2009, Van Leeuwen and Seguin 2006, Zs6fi et al. 2009). In wine production, both drought and excess water should be avoided due to their negative effect on wine quality (Lakso and Pool 2000, Seguin 1983). Vilis vinifera L. is considered a species adapted to drought stress. However, when water deficit is combined with other climatic factors such as high light intensity, temperature and vapor pressure deficit, it could become a major constraint for leaf photosynthesis (Flexas et al. 1998). It has been demonstrated that water stress determines changes in leaf physiology including a reduction in stomatal conductance, photosynthesis and transpiration (Ginestar et al. 1998, Matthews and Anderson 1989, Naor et al. 1993, Smart 1974). Vegetative growth is the first process affected by water restriction (Hardie and Martin 2000, Matthews et al. 1987, Smart and Coombe 1983, Stevens et al. 1995). Water deficit in vine reduces shoot growth, yield, fruit size, and as a consequence of all of these physiological changes, fruit composition and wine sensory attributes are altered too (Roby and Matthews 2004). Few studies conducted in California revealed that different levels of water deficits generated significant differences in appearance, flavor, taste, and aroma among Cabernet Sauvignon wines (Chapman et al. 2004, Matthews et al. 1990). Water restriction favors the polymerization of tannins, and subsequently decreases astringency and bitter flavors related to tannin monomers (Ojeda et al. 2002). Drought stress might be an issue in the vineyard that leads to economic losses if it is extended to a longer period of time. Severe water stress applied to container-grown vines of Cabernet franc decreased yield by 94% due to reducing the number of berries per cluster and berry weight (Hardie and Considine 1976). Matthews and Anderson (1989) found yield losses in their water deficit trials on Cabernet Sauvignon, and they suggested that the large differences in yield occurred due to alterations in berry growth pattern. Bowever, yield losses as a result of prolonged water deficit depended on the berry stage when drought occurred (Hardie and Considine 1976). For red wine grapes, some degree of water deficit during the growing season is beneficial for quality (Bravdo et al. 1985, Williams and Matthews 1990). However, there are contradictory studies suggesting that fruit composition andwine quality of Cabernet Sauvignon are more related to variations in the yield (Bravdo et al. 1985, Keller and Hrazdina 1998, Keller et al. 1998,2005, Ough and N agaoka 1984), and this response could depend on how and when the yield variation is established (Chapman et al 2004). In general, irrigation determines an increase in vine size and yields (Bartolome 1993). In berries, sugar concentration was affected by irrigation, which in some cases it increased (Bartolome 1993), or it was reduced (Williams and Matthews 1990). Irrigation 249
272 indirectly affects berry composition due to higher photosynthesis rates (Lopez et al. 1999) and higher stomatal conductance (Yuste 1995). Cabernet Sauvignon is on the third place behind Cabernet franc and Merlot in terms of red wine grape production in Ontario, with a total yield of 3527 tonnes in 2007 ( Although, Niagara lies on the 43rd parallel and shares the same latitude with Bordeaux (France), there is still debate concerning the potential for consistent wine quality of Cabernet Sauvignon, mostly due to high variation of weather from vintage to vintage. In Ontario, the wine industry might improve water use efficiency, and keep consistency in wine quality through application of deficit irrigation strategies. If it is managed properly, deficit irrigation might have a minimal impact on carbon assimilation compare to full irrigation (De Souza et al. 2003). The irrigation strategy known as regulated deficit irrigation (RDI) has been proven to be a viable practice in the vineyard for controlling excess vigor, reducing pest and disease pressure, and improving wine quality (McCarthy et al. 2002). Partial root zone drying (PRD) is another irrigation strategy successfully used in some wine regions, and which involves application of a reduced amount of irrigation to alternate sides of the vine root system (Dry and Loveys 1998, Dry et al a, b). PRD strategy was developed based on observations that abscisic acid (ABA) originated in the drying roots reduces stomatal conductance, photosynthesis, and vegetative growth (Dry and Loveys 1999, Loveys 1984 a,b, Zhang et al. 1987). Coombe (1976) found that changes in ABA content triggered the final steps in the ripening process. Later on, it was demonstrated that ABA regulates the biosynthesis of the primary and secondary metabolites during the grape berry ripening (Antolfn et al. 2003, Davies et al. 1997). Increases in ABA levels during the berry maturation have been correlated with increases in soluble solids and anthocyanins (Palejwala et al. 1985). ABA also controls the expression of genes involved in anthocyanins biosynthesis, invertase activity, and proteins involved in sugar metabolism and ripening (Ban et al. 2003, C;akir et ai. 2003, Gagne et ai. 2006, Pan et al. 2(05). Some studies reported no significant differences between PRD and RDI in terms of grapevine performance (Bravdo et al. 2004, Gu et ai. 2004, Pudney and McCarthy 2004). Most of the studies related to the effect of water stress and irrigation strategies on fruit composition and wine quality have been conducted in areas located in hot and dry regions. However, just few studies focused on the effect of water deficit on grape cultivars grown in cool climates. Therefore, there is a need for a better understanding of how irrigation affects the grape quality in a cool area. The objective of this research was to study the effect of different levels of water status on vine physiology, yield components, grape composition, and the wine sensory 250
273 profile of Cabernet Sauvignon imposed through various RDI and PRD irrigation strategies in a cool area. Material and Methods Site description and experimental design. The trials were carried out in a commercial vineyard (Lambert Vineyards Ltd.) in the Niagara Peninsula of Ontario (43 13' N, 79 08' W, elevation 98 m), Canada, from 2006 to The experiment was set up in one Cabernet Sauvignon block, grafted to S04 (V. berlandieri x V. riparia) rootstock. Vines were spaced at 1.2 m (between vines) by 2.7 m (between rows), and trained to a double Guyot system, and verticallyshoot positioned. Row orientation was north-to-south. Soil management consisted of fertilization annually with 25 t ha- 1 fresh dairy manure, with floor management of alternate rows of annual ryegrass and cl~an cultivation. Pest control was in accordance with local recommendations [Ontario Ministry of Agriculture, Food & Rural Mfairs (OMAFRA) 2007]. Soil type was a combination of different phases of Chinguacousy clay loam soil series, and a gleyed bruni solie gray brown luvisol (Kingston and Presant 1989). Soil generalized characteristics were described in detail in previous Chapters (3a, 4, 5). The experimental design was a randomized complete block arrangement, with five irrigation treatments and four replicates, with two rows on each side as a buffer. The irrigation was initiated at fruit set. The treatments were represented by non-irrigated-control (C), PRD (100% ETc), full irrigation (100% ETc) and two RDI (50 and 25% ETc). Within each row treatment replicate, 10 equally-spaced vines were chosen for data collection. Irrigation was provided through a trickle system using RAM drip-tubing (Netafnn, Fresno, CA) with 1.70 LIh emitters spaced 0.6 m apart. The irrigation system's characteristics were similar to those described in detail in Chapter 5. The volume of water used was calculated based on the reference evapotranspiration (ET o ), using the Penman-Monteith equation (Allen et al. 1998), and adjusted to ETc using a crop coefficient (Ke). The methodology used to calculate the amount of water needed at each physiological stage was similar to that one described in Chapter 5. Soil water status. Soil moisture was assessed over a period of 3 years between 2006 and Data was collected from 10 vines per each treatment replicate starting with one week before first irrigation treatment was imposed and biweekly thereafter. Data collection protocol and the equipment used were described in detail in Chapter 5 as well as in a study of Balint and Reynolds 251
274 (2010). Soil moisture from all treatment replicates was collected only by Fieldscout 300- TDR at 20 cm depth. Vine water status. Biweekly observations were recorded over the growing season in order to monitor vine water status. Midday leaf water potential ('I') data was collected from mature leaves fully exposed to the sun between 1100h and 1400h. The sampling and collecting data protocols were described in detail in Chapter 3a, and in a study of Balint and Reynolds (2010); Yield and vigor components. The experimental vines were harvested 1 to 2 days before the the commercial harvest date (the second or third week of September). The protocol for data collection was similar to that one described in detail in Chapter 3a. Winemaking. In 2006, due to accidentally harvesting of the experimental block by the grower, no grapes were available to process into wine. In 2008 (wet and cool year), due to high vegetal character in the grapes from all treatments, no experimental wines were made. Grapes were processed into the wines only in the warm 2007 vintage. After harvest, 30 kg of grapes from each treatment replicate were processed into wine following the internal winemaking protocol described elsewhere (Reynolds et al. 2007). Grapes from each treatment replicate were de-stemmed, crushed and treated with S02 solution at 20 mgil. Each treatment replicate was fermented in duplicate in food grade 20 L plastic pails. They were inoculated with Lalvin Selection ICV 254 (Saccharomyces cerevisiae) yeast (Lallemand Inc., Montreal, QB). During the fermentation, all pails were kept in a controlled temperature room where temperature was set up to 24 C. Fermentation lasted between 4 to 7 days. The caps were punched down manually three times daily (morning, noon and evening). After the caps fell, each fermentation treatment replicate was pressed off individually in a basket bladder press (Enoagricola Rossi s.r.1, Calzolaro, PG, Italy) at a maximum of 2 bars pressure, and then transferred to a 20-L carboy. After 10 days, when fermentation was completed in all the carboys, the wines were racked and inoculated immediately with malolactic bacteria Oenococcus oeni (Lalvin VP41, S1. Simon, France). The wines underwent malo-lactic fermentation at 23 C under a carbon dioxide atmosphere, and completion was conftrmed by paper chromatography. Replicate wine samples of 250 ml were taken for wine composition analyses (ethanol, TA, ph, color, anthocyanins, and total phenolics). Upon completion of malo-lactic fermentation, all wines were racked second time, and kept for 10 days at - 2 C for cold stabilization. At bottling, the wines were sulftted at 30 mgil and filtered using 0.45-~ pad and 0.2-~ cartridge filters. In January, the experimental wines were bottled under cork, and then stored at 12 C in the wine cellar until sensory analysis. 252
275 Berry, must, and wine composition. Berry, must and wine samples were analyzed using similar protocols as those used for Baco noir cultivar. The aforementioned methods were described in Chapter 3b and in a study of Balint and Reynolds (2010) Sensory analysis. Wines from 2007 vintage were subjected to sensory analysis. A total of 10 judges with ages ranging from 23 to 58 were involved in the sensory work over a 3-month period. The group was composed of Brock University faculty, staff, and students from the viticulture and oenology program. They were selected based on their availability and motivation. All of them were volunteers and underwent sensory training before. Discrimination test. A modified alternative forced choice test (5-AFC) was used to compare a control wine (non-irrigated) to each irrigation treatment to find differences between control and all others (O'Mahoney 1986). This was intended as a preliminary exercise to determine whether differences existed between treatments, what the basis for those differences might be, and whether the panelists were reliable. The test ran over a period of 2 weeks, with two sessions per day and two days per week. The protocol used in this test was similar with that described in detail in Chapter 3b. Data were thereafter digitized and subjected to analysis of variance. Descriptive analysis. In each session, they tasted five wine samples (non-irrigated, PRD (100%, ETc), Full (100%, ETc) and two RDI (50% and 25% ETc). Six training sessions were run over a period of three weeks. For sensory training, the panelists tasted wines from all irrigation treatments. Samples used for training purpose came only from two field replicates. The list with the descriptors was adjusted until all panelists agreed with definitions (Table 6.1). The protocol used for training and data collection was similar with that presented in Chapter 3b. Following discussions with the panelists on the scale that should be used for data collection, along with technical advice from Compusense Inc. (Guelph, ON), the software provider for the sensory laboratory), it was decided that a two-way unstructured scale with verbal descriptions at the end points would be most appropriate (Ledahudec and Pokorny 1994).. Data analysis. Field ('I', Ts, soil moisture), fruit and wine chemical data were analyzed using SAS statistical package (SAS Institute; Cary, NC). Using generalized linear model, analysis of variance was performed on physiological and chemical data. Duncan's multiple range test was used for means separation for all data sets (field, chemical and sensory). Dunnett's t-test was used to determine those treatment means that were statistically different from the control at a significance level of a~0.05. Sensory data were analyzed using XLSTAT (Addinsoft, Paris, France). Three ways ANOVA (irrigation treatment, judge, and replicate) were also performed on 253
276 sensory attributes to find out the main effects as well as interactions. Principal components analysis (PCA) was performed on the means of field data, yield components, chemical data, and sensory scores of aroma and flavor descriptors for each year of the experiment. Partial least squares regression (PLS) was performed on the field, chemical and sensory data in order to find out the relationships among these data. Results and Discussion General meteorology. Meteorological data was described in detail in Chapter 3. The 2006 and 2008 seasons were wet years with a total rainfall of 220 and 345 respectively, from June to August. Compare to the other years of the experimental period, 2007 was the driest one with a total rainfall of 56 mm for the growing period studied, which was approximately fourfold less than the same period in In 2007, particularly in May and July, temperatures were considerably higher than average. Analyzing rainfall data for the three-year period (between 2006 and 2008) helped for a better understanding of the necessity of this project. In the Niagara Region for the last decade, at least 6 years were under water shortages during the growing season (Reynolds 2008). Soil moisture (Figs. 6.1 A to C). Soil moisture had a different trend in each year of the period studied. In 2006, although rainfall was close to a normal year, a distinct separation was observed among the irrigation treatments. The PRD and full irrigation treatments had higher soil moisture values compared to control throughout the season, except for inexplicably very low values in the full irrigation treatment, on 12 July (Fig. 6.1A). However, soil moisture had lower values in PRD than fully irrigated treatment at the last two sampling dates. Overall, the PRD treatment had values very close to the fully-irrigated treatment. In the 50% RDI treatment, soil moisture had higher values than both control and 25% RDI, only at two sampling dates. The 25% RDI treatment closely followed the same trend as the control. The soil moisture did not drop below wilting point at any sampling date. The lowest value (13.6%) was found in control at the last sampling date, and the highest one in PRD treatment (22.3%) at the second-sampling date in July. In 2007, there was a better separation between treatments. PRD and fully-irrigated treatments followed the same trend having higher values than control and RDI treatments throughout the season (Fig. 6.1B). The control and 25% RDI had values close to wilting point most of the growing season. They had a downward trend throughout the season; reaching a minimum on the last sampling date (12.2%). The 50% RDI treatment had almost no fluctuation, and its soil moisture value was around 18% throughout the season. Although 2007 was a hot and dry year, soil 254
277 moisture in PRD and full irrigation treatments had a steady trend, which indicated that the theoretical calculation for water needs was accurate, and the water applied weekly through irrigation was almost all lost through transpiration and evaporation. The soil moisture in 25% RDI indicated that the amount of water supplied was not enough to keep consistent high moisture in the soil. Since the water demand was much higher at the end of the season because of both the ripening process and high vapor pressure deficit, 25% RDI had almost no effect on soil moisture (Fig. 6.1B). In 2008, differences between treatments occurred on the last sampling date because irrigation treatments were not applied until veraison due to sufficient water reserve in the soil prior to that point (Fig. 6.1C). Soil moisture followed the same trend as in Sauvignon blanc (Chapter 5), with a minimum in the first week of July and at the end of August (Fig. 6.1C). However, during most of the 2008 season, soil moisture values were close to field capacity (27.3% soil moisture, 33 KPa; Kingston and Presant 1989), and did not drop below the wilting point at any sampling date. In 2008, soil moisture followed the rainfall distribution with little variation among treatments. It was expected much more differences among the treatments even in such a wet year. However, it was possible that more variation in soil moisture to occur at higher depths due to previous irrigation history. It was assumed that the irrigation treatments made a difference on root system development in the previous seasons. Therefore, it was expected the soil moisture to be depleted at different rates because of the effect of soil moisture on the root distribution and density from the previous year. However, none of the expectations on soil moisture trend was observed in Perhaps, an obvious effect of the irrigation treatments might be seen in a long time trial. Also, consistent moisture on the whole soil profile in all treatments accompanied with low transpiration rate did not have a distinct effect on the canopy development, and as a consequence no effect on water moisture depletion rate between treatments was observed in Veihmeyer and Hendrickson (1950) stated that is more important to know the occurrence or absence of periods with dry soil during the growing season when the soil moisture data is interpreted rather than the tabulation of the amount of water applied. Since irrigation was applied and the measurements were taken biweekly, the daily water depletion rate could not be assessed. Also, information about how long the vines were under water stress was not available, especially in RDI treatments, during one week period. Another interesting observation was that in PRD treatment soil moisture had slightly lower values than in full irrigation treatment in 2006 and 2007, although in both treatments it was applied water at 100% ETc replacement. This might be explained by the fact that the vines compensate for 255
278 the loss of available water on the drying side by a relative increase in root development in moist soil layers, not only in the wet side but also in the deeper part of the drying side (Dry et al b). Pellegrino et al. (2005) stated that indicators of vine water status based on soil water measurements (soil water potential or soil water content) are not only time consuming but also they have questionable value in those vineyards with considerable spatial variation in depth and lateral spread of roots. This was not the case in the present research since the irrigation treatments affected the soil water status in all years studied except 2008, the wettest year of the experimental period. However, the best discrimination between treatments was observed in very dry and hot seasons. Soar and Loveys (2007) showed that conversion of one vineyard from sprinkler to drip irrigation resulted in a significant increase in total root mass (volume) under the drip line, particularly at cm below the surface. The same authors indicated that root distribution is not influenced only by soil texture but also by irrigation history according to root diameter class. The largest increase in root-length density under drip irrigation occurred at roots with diameter between 1 and 4 mm. Grapevines under sprinklers, and later converted to drip irrigation, had significantly larger root systems compare to the vines maintained only under sprinklers. Soar and Loveys (2007) concluded that vines established under sprinkler irrigation and then converted to drip system cope better with drought due to these additional roots. Although, root distribution or density was not measured, Soar and Loveys' fmdings support the soil moisture data, especially from PRD treatment, which did not show significant difference than classic full irrigation treatment. Transpiration (Figs 6.2A to C). In 2006, Ts was highest in full irrigated and PRD treatments (Fig. 6.2A). This pattern was consistent throughout the season. Ts rates reached a maximum in the first week of August, with a peak of 13.6 Jlg H 2 0 cm- 2 s- 1 found in the full irrigated treatment. The pattern showed a decreasing trend until the end of August for all treatments. In 2007, all the treatments followed the same trend, with the lowest values occurring in the control and the 25% ETc (Fig. 6.2B). Since little rain occurred, data showed little variation in this trend at sampling dates during the growing season. In 2008, Ts showed the same trend as soil moisture (Fig. 6.2C). The minimum Ts value was recorded at the end of August. Even with so much moisture in the soil, Ts was lower in 2008 than in 2006 in all treatments, possibly due to low temperature and solar radiation (data not shown). In the present study Ts values were almost similar with those of Reynolds.et al. (2005, 2007) who found high Ts variation among the irrigated treatments in the same cool area. The same authors found that Ts responded different not only due to the irrigation strategy but also due to the cultivar used. Ts values varied between 0.73 to 5.07 Jlg 256
279 H 2 0 cm- 2 s- 1 in Niagara grapevines and reached a maximum (around 13 flg H 2 0 cm- 2 s- 1 ) in fully irrigated vines of Chardonnay (Reynolds et al. 2005, 2007). However, following a testing of the effect of PRD and RDI treatments on Sauvignon blanc grapevines, in one experiment conducted in California,,it was found Ts values ranging from 3 to 25 Jlg H 2 0 cm- 2 s- 1 (Gu et al. 2004). PRD irrigation strategy used in vineyards generates a unique physiological response distinct from conventional irrigation by controlling water loss under high and low vapor pressure deficit, and thus, improving water use efficiency (Collins et al. 2008). Although, in 2006 and 2007 vines from PRD treatment had lower transpiration rates than those from full irrigated treatment, the treatments were significantly different just at few sampling dates. This might be explained by differences in the ABA concentration of sap xylem due to a hormonal dilution effect or inhibition of its biosynthesis. In these circumstances, PRD could have been interrupted by natural rainfall and any substantial horizontal movement of water through the soil profile due to the relatively high clay content. Consequently, RDI treatments generally produced a higher magnitude of response in terms of vine water status. Drip irrigation and PRD particularly, applied at deficit rates, have generated various responses in vines from different experiments. Pudney and McCarthy (2004) showed that vines were more affected by irrigation volume rather than the method of application. Other studies concluded that PRD applied at different water levels had no effect on physiology and vine growth (Goldhamer et al. 2002, Gu et al. 2004). These apparent contradictions might be related to differences in the intensity of the chemical signaling under PRD irrigation. This seems to be dictated by the type of soil, the prevalent rainfall and evaporative demand in the region, as well as the frequency of switching irrigation from one side of the root zone to the other (Chalmers et al. 2004, Chaves et al. 2007, Dry et al. 2001) which supports the data variability from the present research. The role of the plant hormone ABA in regulating stomatal aperture and consequently water loss has been studied widely in grapevines, both in pot and field experiments (Correia et al. 1995, Loveys 1984 a, Stoll et al. 2000). Some studies showed that the environmental factors along with leaf water status and xylem signals (e.g. cytokinins, ABA) actdirectiy or indirectly on stomatal aperture, and thus, a particular stomatal aperture is a result of combination of these factors (Bacon 2004, Webb and Hetherington 1997). Jones (1992) showed that maximum stomata aperture occurred under irradiances larger than 400 flidol m -2 S-l (PAR). In general, maximum transpiration rate is achieved at C and is restricted by temperatures <5 C or >45 C. The effects of temperature on stomatal behavior are closely related not only to metabolism, enzymatic activity 257
280 and hormones but also to external plant factors such as air vapor pressure (Jarvis 1976). Part of the transpiration results might be explained by this complex interaction, especially in the 2007 and 2008 seasons. Leaf water potential (Figs. 6.3A to C). Leaf 'I' followed a different trend in each year of the period studied. In 2006, the control decreased from -1.0 to -1.2 MPa through the season, while the irrigated treatments fluctuated between -0.8 and -1.0 MPa, with the highest values found in the full and PRD treatments (Fig. 6.3A). In 2007, the control decreased from ca to -1.3 MPa throughout the season, with the lowest value reached at the end of August (Fig. 6.3B). The RDI treatments had lower values than PRD and full irrigated treatments, and higher than control. Except control, all other treatments showed a steadily trend throughout the season but different than each other (Fig. 6.3B). This indicates that the vine hydraulic conductivity responds not only at vapor pressure deficit (data not shown) but also to the soil water status. In 2008, full and PRD treatments had values> -1.0 MPa, with little fluctuation during the season (Fig. 6.3C). All treatments had an upward trend throughout the season, except for the last sampling date when leaf 'I' decreased in all of them. However, all treatments had higher values than -0.8 MPa on the last sampling date. The highest value was observed at pre-veraison in 50% RDI (-0.5 MPa) while the lowest leaf 'I' was found in 25 % RDI on the second sampling date. Surprisingly, in 2008 although only three irrigation treatments had been applied post-veraison, it was found significant difference among treatments for leaf 'I' which indicates some carryover effect from the previous season. Williams and Matthews (1990) found that leaf 'I' decreased throughout the season even for vines that were well watered which supports the present results (Figs. 6.3A to C). Some studies indicated that leaf 'I' of well-watered grapevines is a linear function of both ambient temperature and vapor pressure deficit, which means that leaf 'I' decreases as both environmental variables increase (Williams and Baeza 2007, Williams and Trout 2005). Williams and Araujo (2002) reported that all methods of estimating grapevine water status (predawn '1', stem '1', and leaf '1') in Chardonnay and Cabernet Sauvignon were satisfactory, since they correlated well with the amount of applied water and leaf gas exchange parameters, which is in agreement with the present results (Figs 6.2, 6.3A to C). Hsiao (1973) defined mild plant water stress for leaf 'I' values between -1.0 to -1.5 MPa, and severe water stress for leaf 'I' values below >-1.5 MPa. According to his classification the experimental vines were not under severe water stress, even in 2007 when precipitation was very low. This finding might be partially explained by the type of soil that had a moderate to high holding water capacity. 258
281 Species and cultivars with isohydric behavior are able to maintain a tight control on leaf 'I' over a range of environmental conditions, while leaf 'I' in anisohydric plants oscillates in response to environmental changes (Tardieu and Simonneau 1998). Anisohydric plants typically exhibit less stomatal control over evaporative demand and soil moisture, allowing large fluctuations in leaf water potential (Franks et al. 2007). Despite having a behavior as anisohydric plants (Rogiers et ai. 2009), Cabernet Sauvignon grapevines did not show a strong anisohydric behavior under experimental conditions in any of the years studied. Some studies indicated that stomata regulate transpiration in order to gain sufficient carbon while leaf '" is prevented from becoming too negative and breaking-down the hydraulic system of plants (Jones and Sutherland 1991, Schultz and Matthews 1997, Tyree and Sperry 1989). This indicates that under particular climatic conditions and soil moisture, leaf '" would not give an accurate measure of the soil water status. Shoot growth and vine size (Figs. 6.4A and B, Table 6.2). In 2006, the shoot growth rate decreased in RDI and control treatments (Fig. 6AA). The fully-irrigated treatment showed an upward trend until the end of July and steadily decreased thereafter, as it was found in all treatments. The growth rate in PRD treatment decreased between first and second sampling date, followed by a steadily flat rate between the second and third reading, and ending with a downward trend (Fig. 6AA). This indicates that PRD treatment had enough soil moisture to sustain shoot growing compared to RDI treatments which had a downward trend throughout the season. Despite showing higher growth rate than the control, the RDI treatments followed the same downward trend as the control. Although the same amount of water was applied in both treatments, a lower growth rate in PRD than in fully irrigated treatment was recorded, results that could be supported by the hormonal theory behind the PRD irrigation strategy (Dry and Loveys 1998). In 2007, the growth pattern was different compare to The PRD treatment had lower or the same growth rate as the RDI treatments (Fig. 6AB). The RDI treatments had a steadily downward trend. In control and PRD treatments, the growth rate decreased in the middle of July, then the trend went up to the end of July followed by a downward trend. The highest growth rate was found in fully irrigated treatment. The highest magnitude among treatments was found at the end of July and beginning of August. On the last sampling date, the fully irrigated treatment still had a high growth rate when compared to the other treatments (Fig. 6AB) which might suggest that high water status has a negative impact on the canopy size even in dry years. In 2008, the shoot growth rate showed a different pattern than in 2006 and 2007, which reflected the very wet weather conditions for this particular year (Fig.6AC). Treatments were not significantly different at any of the three sampling dates. An interesting observation in 2008 was 259
282 that the shoot growth rate was lower in fully irrigated treatment compare to This indicates that soil moisture is not the only one factor that affects the vine vigor. Lower temperature and solar radiation could affect the carbon assimilation process and carbohydrates distribution in vine. Growth is extremely sensitive to water stress. Schultz and Matthews (1988) reported that growth of Riesling shoots ceased at midday", MPa. In the present study, the lowest leaf", value was found in control in 2007 season (-1.4 MPa), which might have put leaf", well below the "stop-growth" threshold (Chone et al. 2001, Williams and Araujo 2002). However, this was not the case in the present study, which suggests that different grapevine cultivars have different capacity to cope with drought. Various authors have suggested that controlling of shoot growth by soil water status involves transfer of chemical information from roots to shoots via xylem (Davies et al. 1994, Davies and Zhang 1991, Gowing et al. 1993). This type of control of both shoot growth rate and gas exchange has been termed 'non-hydraulic' or 'chemical' signalling to distinguish it from 'hydraulic' signalling, which represents the transmission of reduced soil water availability via changes in xylem sap tension (Dodd et al. 1996). Some studies on woody species showed that drying half of the root system typically resulted in reductions of shoot growth in range of 10%- 25%, relative to control plants (with both containers watered) following several weeks of treatment (Poni et al. 1992, Turner et al. 1996). These findings could also support the present data from PRD treatment. Overall, data from this research showed that PRD treatment consistently had higher growth rate than the RDI treatments during the most active growing period, and lower rate than the fullirrigated treatment. This suggests that the abscisic acid (ABA) produced in the dry roots of vines from PRD treatment had a lower effect on the shoot growth rate due to a dilution effect or perhaps due to other hormonal interactions or factors which controls the activity of the apical tissue. This is in contradiction with what most of the studies on PRD treatment reported. This could be explained by the amount of water supplied in the PRD treatments used in the present study. However, data from the present study is partially supported by findings of Gu et al. (2004), who concluded that the effect of PRD treatment was determine by the water deficit applied and not by the irrigation strategy used. Vine size determined by pruning weights (Table 6.2) is not very well correlated with the shoot growth rate, which might be explained by different partitioning of the dry matter under different water deficit levels (Williams and Biscay 1991, Williams and Grimes 1987), presumably 260
283 due to disequilibrium among different classes of hormones. For instance, cytokinins are known to alter assimilates distribution in plants to either promoting or inhibiting flowering (Ogawa and King 1979).Results of this research are in contradiction with those found by Williams et al. (201Oa) who showed in one irrigation experiment on Thompson Seedless, that pruning weights were a linear function of applied water amounts. The lack of correlation between shoot growth and pruning weights might also be explained by the fact that radial shoot growth is less affected by water deficits than apical growth (Matthews et al. 1987, Williams and Matthews 1990). Moreover, this lack of relationship is explained by the competition between the reproductive and vegetative apparatus, since the data showed that irrigation treatments affected both crop load and yield. Yield components (Table 6.2). The Cabemet Sauvignon plots were harvested in 2006 prior to any yield data collection. In 2007, yield was different compare to control in all treatments. The highest yield was observed in the fully irrigated treatment (6.2 kg/vine). However, PRD treatment had values between those found in RDI and fully irrigated treatments. The highest number of clusters per vine was observed in PRD treatment, perhaps due to a balance reached between vegetative and reproductive apparatus in the previous year. As it was expected, both control and fully irrigated treatments had lower number of clusters than PRD and RDI treatments. Since cluster initiation occurred in the previous season, it was possible that the differentiation process to be affected either by the canopy size in fully irrigated treatments or competition for carbohydrates in the control. Overall, all treatments had heavier clusters than control. The fully irrigated treatments had the highest yield because of both high numbers of berries per cluster and berry weight. Berry weight increased in irrigated treatments compared to the control treatments (Table 6.2). In 2008, yield in control was different only when compared to fully irrigated treatment, which had the highest number of clusters, results that could be explained by weather conditions from previous year. Since 2007 season was the driest and hottest from the period studied, it seems that replacing 100% ETc had a positive effect on cluster differentiation. However, the cluster weight and the number of berries per cluster are not very well explained by the irrigation treatments in 2008 (Table 6.2). In many studies, water deficits decreased yield through their effect not only on cluster initiation and differentiation, but also on berry set and growth (Becker and Zimmermann 1984, De la Hera et al. 2007, Hardie and Considine 1976, Matthews and Anderson 1988, 1989, Ojeda et al. 2001). These [mdings are in agreement with the results of the present study only for Some reports showed that PRD caused a smaller reduction in berry weight and yield, within a range lower than that reported in the current study (Dos Santos et al. 2003, Dry et al a, b, 261
284 Kriedemann and Goodwin 2003). However, previous studies on using water deficit strategies in field-grown experimental grapevines (Du Toit et al. 2003, Stoll 2000), potted vines (Antolin et al. 2006) and commercial trials (Dry et al a, b) showed no change in berry size or yield as a result of PRD strategy. Overall, in 2007, the number of clusters was higher in vines under some level of water deficit compare to full irrigated vines, with an opposite pattern in Srinivasan and Mullin (1980) suggested that the branching of the anlagen is more sensitive to vine water status prior to veraison and less throughout the season, which partially explains the results from the present study. Irrigation affects the weight of berries both directly and indirectly (Esteban et al. 1999, Freeman and Kliewer 1983, Matthews and Anderson 1988). The direct effect is materialized in a large number of cells (when there is no water restrictions during stage I of fruit growth) or by a larger cell size (when there is no water restriction during stage III). Berry composition (Table 6.3). In 2006, all irrigated treatments reduced '13rix when compared to control. However, 25% RDI was just slightly lower than control. TA increased slightly in all treatments, and only fully irrigated vines had higher values than control (Table 6.3). Berry ph increased slightly in fully irrigated and 50% RDI, and not in PRD. The absorbance at 520 nm, which is a measure of the red pigment, increased more in fully irrigated and 25% RDI than in the other treatments. Anthocyanins were found in the lowest amount in grapes from fully irrigated treatments, and the highest in 25 % RDI. However, all irrigated treatments had higher anthocyanins content than control, except for fully irrigated treatment. RDI treatments had higher amount of phenolics than control, while PRD and fully irrigated treatments showed lower phenolics than control. In 2007, PRD reduced slightly Brix while 25% RDI increased it when compared to control. The lowest Brix value was found in fully irrigated treatment. Except for the PRD and fully irrigated treatments, which increased slightly the TA, all other treatments had lower TA values (Table 6.3). Additionally, all treatments except for PRD increased in ph when compared to control. Overall,A520 increased in all treatments when compared to 2006 season. However, in 2007, A520 increased only in RDI treatments, and decreased in others when compared to control. The RDI treatments increased in anthocyanins compare to control, while PRD and fully irrigated treatments had lower values. Total phenolics were higher in PRD and 25% RDI, and lower in fully irrigated and 50% RDI when compared to control. In 2008, the control and 50% RDI tended to have higher Brix than the other treatments. However, no significant differences were found between treatments. TA was higher in 2008 vintage compare to the other years of the trial. This might be an effect of the maturation delay due 262
285 to low temperatures and solar radiation. The TA values were slightly lower in PRD and 50% RDI. Fully irrigated treatment reduced both anthocyanins and total phenolics in 2008 (Table 6.3). Vintage had a significant effect on fruit composition. Anthocyanins and phenols varied between 100 to 130% from vintage to vintage and just 5 to 40% due to the irrigation treatment. Esteban et al. (2002) observed that ph increased linearly with berry ripening while titratable acidity decreased exponentially. The increase of must TA is a common response to irrigation (Williams and Matthews 1990), and it is considered beneficial for wines produced in hot areas, as they usually present a low acidity. Interestingly, increased juice ph and decreased juice T A were observed in response to the PRD treatment in 2008 and not in This observation most likely indicates a water-deficit-induced decrease in total acidity, which is known to result primarily from an accelerated decrease in malic acid during berry ripening under these conditions (Esteban et al. 1999). However, contradictory results regarding the effect of water deficit on ph and TA of berry grapes were found in previous studies (Antolin et al. 2006, Bindon et al. 2007, Du Toit et al. 2003). The primary mechanism by which water deficits increased the concentrations of skin tannin and anthocyanins is probably the differential growth responses of skin and inner mesocarp tissue to water deficits (Roby and Matthews 2004), although it could be a direct stimulation of their biosynthesis by water deficit (Roby et al. 2004). Their assumption was supported later on by molecular studies that showed that water deficit enhances accumulation of anthocyanins by stimulating the expression of genes encoding their biosynthesis enzymes (Castellarin et al. 2007). However, solar heating of grape berries increases cellular respiration and water loss, and both heat and light affect the accumulation of anthocyanins and other phenolic compounds (Haselgrove et al. 2000, Kliewer and Lider 1968, Mori et al. 2007, Smart et al. 1988). Hardie and Considine (1976) reported a decreased color with water deficits, and in most cases the fruit with low color was harvested at lower Brix than the control. Furthermore, one study indicated that the effect of vine water status on anthocyanins concentration for each berry size was higher than the effect of fruit size (Roby et ai2004). However, Spayd et al. (2002) found that higher temperature and incident light values measured during ripening increased anthocyanins and total phenols in PRD treatment compared to fully irrigated or deficit irrigation. In contrast, Keller and Hrazdina (1998) showed that for Cabemet Sauvignon, the anthocyaninsconcentration in berries was similar at 20 % and 100 % sunlight interception, which suggests that canopy size due to irrigation treatments might not have any effect on anthocyanins accumulation. 263
286 Downey et al. (2004) showed that vine vigor and light exposure have the most significant impact on tannin accumulation. Some studies have reported higher concentrations of tannin at harvest in the skin of fruit from low vigor vines (Cortell et al. 2005, Ristic et al. 2007). Mori et al. (2007) showed that the response of different anthocyanins types was variable, with malvidin-glucosides being more resistant to degradation under elevated temperature than nonmalvidin derivatives of which degradation was enhanced. Moreover, some studies showed that PRD treatment caused an increase in delphinidin-based anthocyanins, indicating a possible shift in the regulation of the anthocyanins pathway (Boss et al. 1996). The authors argued that the shift in the anthocyanins profile towards non-malvidin anthocyanins is due to methyltransferase enzyme resulting in a relative decrease in the proportion of methoxylated anthocyanins. In this study the visual observations did not indicate an obvious change in the hue color, which could suggest no shift among different anthocyanins due to irrigation treatments. However, this possibility cannot be excluded since small changes between different anthocyanins are not necessary reflected in changes in hue color. In the present trials, anthocyanins and total phenolics varied significantly from season to season. It was not found a linear relationship between anthocyanins and total phenolics, or either a consistent pattern from year to year, which suggests that besides soil water status other factors might affect the phenolics biosynthesis. However, RDIand PRD treatments showed a positive effect under particular weather conditions. Must and wine composition (Tables 6.4 and 6.5). Must and wine composition data was collected and analyzed only for 2007 vintage. Data showed that in a dry and hot year the nonirrigated vines did not accumulate more Brix than treatments under water deficit. The 25% RDI treatment had higher Brix compare to other treatments. PRD had slightly lower OSrix than the control. Alternating the wet zone on each half of the root system but still replace in full the water lost through evapotranspiration did not seem to improve the must and wine quality. One explanation could be that berry composition is diluted by the high amount of water used through irrigation. The must TA was lowest in control, while the irrigated treatments had higher values but close to each other. Must ph showed the highest magnitude difference among the treatments. The 25% RDI had the lowest ph value in the must while the fully irrigated the highest (Table 6.4). In 2007, the wine composition of the irrigated treatments had almost the same pattern as that from the must composition (Table 6.5). The control had the highest alcohol concentration while wine from fully irrigated vines the lowest. Wine ph had the lowest values in the PRD wines, while in the other treatments the ph was higher but close to each other. TA was the highest in the wines from fully irrigated treatment. Total anthocyanins concentration was highly affected by irrigation 264
287 treatments. The fully irrigated treatment had the lowest amount of anthocyanins and phenolics (Table 6.5). A ph level above 3.60 is not a positive characteristic in must and wines since it increases the activity of spoilage microorganisms, lowers the color intensity of red wines, binds more S02 and reduces free S02, and adversely affects the ability of wine to age (De La Hera-arts et al. 2005). Trials investigating the effects of PRD on Cabernet Sauvignon showed significantly higher wine color density and red pigment coloration in PRD wines after 6 months of ageing (Bindon et al. 2008). They suggested that the increase in red pigments of the PRD wines was caused by an increase in co-pigmented or polymeric forms of the anthocyanins, rather than a change in anthocyanins concentration alone. This is consistent with other work suggesting that increases in red wine color could be caused by a change in chemical properties of the anthocyanins to polymeric forms during the winemaking or ageing process (Levengood 1996, Levengood and Boulton 2004). Since the aged wine composition was not measured, it is not excluded the possibility that deficit irrigation could have a beneficial effect on color stability during the ageing process. Relationships among soil and plant water status, yield components and berry and wine chemical data The PCA of field data indicated that factor 1 and factor 2 explained 94.94% of the variability in the data set (Fig. 6.5). Soil moisture was highly positively correlated with transpiration rate and leaf water potential, and negatively correlated with leaf temperature. Vine size showed less correlation with soil moisture at 20 cm depth. The irrigated treatments were well separated, the highest variation in terms of soil and vine water status being among control, fully irrigated and PRD treatments. The PLS regression performed on field and berry composition data illustrated a strong positive relationship between 0 Brix and leaf temperature, and negative correlation with leaf water potential, transpiration and soil moisture (Fig. 6.6). Vine size showed a strong positive correlation with juice ph, and negative correlation with the anthocyanins concentration. This suggests that the negative effect of high canopy onanthocyanins is due to poor microclimate created in the fruit zone The PCA plot of field data indicated that PC 1 and PC2 explained % of the variability in the data set (Fig. 6.7). First component explained 83.86% of the variability, while the second one just 9.26%. The first component was positively loaded with leaf '1', and negatively loaded with leaf temperature. The second component was positively loaded with vigor. The PCA pattern was different than in 2006 showing different relationship among field variables, which could be explained mostly by different weather pattern. The PCA plot showed a better 265
288 discrimination among treatments in 2007 compare to PRD treatment showed to be highly associated with transpiration and soil moisture. Control and 25 % RDI were located on the left side of the plot being highly associated with the leaf temperature. All other irrigated treatments were located on the right side of the plot. Soil and plant water status showed a better relationship in the PRD and RDI than in fully irrigated treatments. In 2007, PCA was also performed on physiological, yield components and berry composition data. The PCA diagram indicated that the first two components explained 83.96% of the variability (Fig. 6.8). First component explained 60.03% while the second factor only % of the variability in the data set. First component was heavy loaded with leaf'l', yield and cluster weight, and negatively loaded with leaf temperature and Brix. The second component was positively loaded with TA and clusters number, and negatively with juice ph. Total phenols and anthocyanins were negatively correlated with vine size while the number of clusters per vine was negatively correlated with berry weight and juice ph. Brix was negative correlated with berries per cluster, soil moisture, cluster weight and yield. The control and RDI treatments were located on the left side of the plot being highly associated with higher Brix, phenolics and anthocyanins The PCA plot of soil and plant water status data indicated that PCI and PC2 explained % of the variability in the data set (Fig. 6.9). Vine size, leaf'l' and soil moisture was positively loaded on factor I while Ts was positively loaded on factor 2. Leaf temperature data did not explain very well the variability on the first two components. Control and RDI (25%) were grouped on the left upper plan of the plot, full irrigated in the upper right plan while PRD and RDI (50%) on the lower left plane. The PLS regression was performed on field, yield components and berry composition data in 2008 (Fig. 6.10). The PLS diagram illustrated a strong positive correlation between vine size and juice ph, and a negative correlation with total phenolics, anthocyanins and berries per clusters. Transpiration was negatively correlated with yield, the number of berries per cluster and Brix. Soil moisture was highly positive correlated with berry weight, and negatively with leaf temperature and TA. No strong relationship was observed between soil moisture at 20 em and the variables studied. Sensory analysis (Table 6.6; Fig to 6.13). From the entire period studied only wines from 2007 were subjected to sensory evaluation. This season was charact~rized as the hottest and driest from the period studied. The 2007 vintage was assessed for seven aroma descriptors and nine flavor and mouthfeel descriptors. Data showed significant differences in the 266
289 sensory profile of wine made from vines under different levels of water status (Table 6.6, Fig. 6.11). In the present study data showed that the control had the highest scores for tobacco aroma, chocolate and cooked vegetable while for a few attributes it had lower or the same intensity as the 25% RDI. The control did not have highest scores for the fruity attributes. Fully irrigated treatment had highest scores for vegetal aroma, sour cherry, acidity (sourness), astringency, and tobacco flavor. PRD treatment had a higher score than the other treatments only for red fruit aroma and chocolate flavor while most of the attributes were lower than other treatments. Deficit treatments, especially 25% RDI, showed consistently high scores for most of the positive sensory characteristics in Cabernet wines. Despite applying the same amount of water in full and PRD treatments, the sensory profile varied between these treatments. The PRD treatments did not show the negative attributes as extreme acidity and vegetal characters, but had better scores than control and fully irrigated treatments for some typical descriptors for Cabernet sauvignon wines. The highest magnitude among treatments was found for red fruit, chocolate, tobacco, astringency and acidity attributes. The PCA on the 2007 sensory data showed that the first two factors explained 78.63% of the variability (Fig. 6.12). First component explain 50.05% while the second one just 28.55%. The first component was positively loaded with dark fruit aroma and chocolate flavor, and negatively loaded with tobacco and cooked vegetal flavor, cooked vegetal and chocolate aroma. The second factor is positively loaded with sour cherry flavor. The distribution of 2007 wines on the PCA plot showed a good separation between treatments. The fully irrigated treatment is located on the upper left plane being associated mostly with acidity and cooked vegetal flavor descriptors while the control is located on the left lower plane being associated with chocolate and cooked vegetal aroma. PRD and RDltreatments are located on the right side being associated with the most descriptors desired for a typical sensory profile of Cabernet Sauvignon wines. Despite having just one vintage for sensory evaluation, data clearly showed that in dry and hot years, neither full water replacement in the soil nor control treatment had a positive effect on the wine sensory profile. A PLS regression was performed on the full data set in 2007 (Fig. 6.13). The diagram illustrated a high degree of correlation among soil moisture, vigor, Ts rate, yield and total phenolics, anthocyanins, and ethanol. Dark fruit, chocolate and the number of clusters per vine were positive correlated to each other and negatively correlated with cooked vegetal, tobacco and acidity. Red and dark fruit aromas were negatively correlated with leaf temperature, which suggests that leaf temperature might control different enzymatic reactions related to aroma precursor synthesis. 267
290 Vegetative aromas such as bell pepper or asparagus contribute to the distinctive varietal aromas of Cabemet Sauvignon, Merlot and Sauvignon blanc wines. However, at high level, these vegetal notes could be considered undesirable. The bell pepper aroma in Cabernet Sauvignon wines has been correlated with the concentration of 3-isobutyl-2-methoxypyrazine (IBMP) (Chapman et al. 2004). Several studies showed that mmp concentrations and bell pepper aroma decreased when light exposure (Morrison and Noble 1990, Noble et al. 1995) or temperature increased (Boubee et al. 2000). Some studies showed that the term "vegetal" can also be applied to some other aroma notes likes asparagus and cooked vegetable which are produces by another group of volatiles which contain sulfur (Darriet et al. 1993, Preston et al. 2008, Swiegers et al. 2005, Tominaga et al. 1998). This explains easily why the panelists were not able to make a clear distinction between green pepper and asparagus aroma, and preferred to use cooked vegetal attribute in describing Cabemet Sauvignon wines made from grapes grown under different water status. Since in 2007 the low precipitation was accompanied by high temperature and solar radiation, this could be a reasonable explanation for the present findings that showed less vegetal and more fruity characters in the RDI treatments. Some studies showed that light and temperature control the norisoprenoid concentrations which are directly correlated with the high concentration of carotenoids found in grapes under moderate water stress (Gerdes et al. 2002, Lee et al. 2007, Marais et al a, b, Oliveira et al. 2003). Carotenoids function as light-harvesters and quenchers of excess light in order to protect the photosynthetic system (Vanden Berg et al. 2000). Some studies comparing sun-exposed and shaded grape bunches showed that variation in the level of light incident on a grape cluster had an effect on berry carotenoids (Bindon 2007, Oliveira et al. 2004, Razungles et al. 1998). Numerous studies showed that in grapevines with dense canopies light and temperature conditions of the bunch zone were altered. In grapevines, water stress indirectly affects the light environment of developing fruit, through a reduction in shoot growth rate and vine leaf area (Dry and Loveys 1998). As a consequence, carotenoid synthesis and its breakdown could be affected, and thus precursors of the C13- norisoprenoids are affected as well. However, some studies have shown that water deficit in grapevines can elevate the level of carotenoids in grapes (Bindon et al. 2007, Oliveira et al. 2004). Oliviera et al. (2003) reported that the berry-derived carotenoids lutein, a-carotene, neoxanthin, violaxanthin, and luteoxanthin increased up to 60% in a non-irrigated treatment compare to an irrigated treatment only when the soil had a low water-holding capacity. Moreover, Bindon et al. (2007) showed in one irrigation trial on Cabemet Sauvignon that PRD treatment 268
291 increased the carotenoids concentration and C13 - norisoprenoids ~-damascenone, ~-ionone and 1,1,6-trimethyl-1,2-dihydronaphtalene relative to the control (both sides of the root system irrigated). The same authors found that this increase was not related to the berry size or the altered surface area to volume ratio. This suggests that water status could have a great impact on the wine sensory profile through the concentration of the aroma volatiles. The present data is partially supported by another study on effect of water status on Cabernet Sauvignon sensory profile. Chapman et al. (2004) found in a standard irrigation treatment (32 Uvine/week) the highest ratings in vegetal aroma, bell pepper aroma, astringency, and bitterness while in a minimum irrigation treatment «-1.6 MPa) and double irrigation treatment (64 Uv/w) astringency was much lower than in standard treatments. The same authors showed that minimum irrigation (water deficit treatment) led to the fruitiest wines, which is in agreement with the present research (Table 6.6). Fresh cherry, redlblack berry, jam/cooked berry, and dried fruit/raisin aromas, as well as acidic and fruity by mouth were rated highest in the minimum irrigated treatments. This is in contradiction with most of the irrigation studies where irrigation showed to decrease acidity. However, double irrigated treatments had highest ratings for fresh cherry which it is in agreement with the findings in full irrigated treatments. Conclusions This study showed that water deficits controlled most of the physiological and metabolic processes in the grapes. Increasing '13rix in non-irrigated vines did not necessary lead to an improvement in wine quality because this process is due mostly to the desiccation process rather than improving water use efficiency. A moderate water status might increase the overall yield Brix and improve the sensory varietal typicity of the wine. Certainly, in dry and hot years the sensory profile of Cabernet Sauvignon wines could be manipulated in the vineyard by the winemaker in a positive way through water deficit strategies. However, if the basic wine composition can be adjusted in the winery, the wine sensory profile cannot be manipulated too much because this depends on the volatiles of which precursors are made in the vineyard. Regulated deficit irrigation strategies were more consistent, and had a greater magnitude of effect than PRD treatments in terms of general vine physiology, yield components, and fruit composition; Water depletion patterns in the soil showed that there was a high magnitude of difference between irrigation strategies in terms of physiological responses (Ts, leaf 'If), soil moisture, yield components, and fruit composition in warm vs. cool years. Despite improving vine performance, and in some cases the grape quality, PRD treatment is not recommended yet in this 269
292 area due to high cost involved, and less beneficial effect than RDI treatments. However, more research should be conducted on PRD strategy in order to validate the biochemical process behind of this strategy. Perhaps, by tuning up this strategy and lowering down the price for installing it in the vineyard this might be a good irrigation strategy in the future in cool regions. Perhaps the results from PRD treatment did not show an obvious improvement on any variables due to fact that 100% of the water was replaced and not just a fraction of the water lost through evapotranspiration. There is no doubt about the positive effect of using deficit irrigation strategy in the vineyard, especially in very hot and dry years. However, it is essential to carry out vineyard experiments on irrigation strategies in combination with other cultural practices if the ultimate objective is to manipulate wine sensory attributes through vineyard management. Moreover, if irrigation experiments are carried out in one vineyard well established, the trials should be extended over a longer period of time in order to have a better control on the root system. To accurately interpret the irrigation effect, one should focus more on the relationships among scion, rootstock and root system architecture. By using RDI strategies, one could keep the root zone near the top of the soil profile, and in this way vine vigor might be more easily controlled. Even if irrigation is not recommended every year due to high weather variability, in hot and dry years, RDI strategies using drip irrigation are highly recommended in order to improve grape composition. However, more research should be done regarding the relationship between soil and vine water status, and their effect on the chemical compounds responsible for the sensory profile of this cultivar. Grape and wine quality can nonetheless be improved by using regulated deficit irrigation or PRD in warm and dry years in the Niagara Region. Contrary to what many winemakers believe, by using RDI strategies the quality of Cabernet Sauvignon wines could be improved. Overall, improving the vine performance helps to keep consistency not only in yield (fruitfulness) but also in berry composition and wine sensory profile. Literature Cited Allen, R., L. Pereira, D. Raes, and M. Smith Crop evapotranspiration guidelines for computing crop water requirements. FAO Drainage Paper 56, Food and Agriculture Organization of the United Nations. 300p. Antolin, M., M. Ayari, and M. Sanchez-Diazo Effects of partial rootzone drying on yield, ripening and berry ABA in potted Tempranillo grapevines with split roots. Austral. J. Grape Wine Res. 12:
293 Antolin, M., H. Baigorri, I. Luis, F.Aguirrezabal, L. Geny, M. Broquedis, and M. Sanchez-Diazo ABA during reproductive development in non-irrigated grapevines (Vitis vinifera L. cv. Tempranillo). Austral. J. Grape Wine Res. 9: Bacon, M.A Water use efficiency in plant biology. pp In: Water Use Efficiency in Plant Biology, Bacon, M.A (Ed.) Blackwell Publishing, UK. Ban, T., M. Ishimaru, S. Kobayashi, S. Shiozaki, N. Goto-Yamamoto, and S. Horiuchi Abscisic acid and 2,4-dichlorophenoxyacetic acid affect the expression of anthocyanin biosynthetic pathway genes in 'Kyoho' grape berries. J. Hort. Sci. Biotechnol. 78: Balint, G., and A.G. Reynolds Effect of different irrigation strategies on vine physiology and grape quality of Cabernet Sauvignon and Sauvignon blanc in a cool-climate area. Prog. Agric. Vitic. 127: Bartolome, M.C Respuestas de la vid (Vitis vinifera L.) a condiciones de estres hfdrico: efectos sobre las relaciones agua-planta, el crecimiento, la producci6n y la calidad (cv. TempraniIl6). Tesis doctoral. Departamento de Producci6n Vegetal: Fitotecnia. Universidad Politecnica de Madrid. 443 p. Becker, N., and H. Zimmermann Influence de divers apports d'eau sur des vignes en pots, sur la maturation des sarments, de developpement des baies et la qualite des vins. Bulletin de. l'office International de la Vigne et du Vin 57: Bindon, K.A., P.R Dry, and B.R Loveys Influence of plant water status on the production of C13-norisoprenoid precursors in Vitis vinifera L. cv. Cabernet Sauvignon grape berries. J. Agric. Food Chern. 55: Bindon, K.A., P.R Dry, and B.R Loveys The interactive effect of pruning level and irrigation strategy on grape berry ripening and composition in Vitis vinifera L. Cv. Shiraz. S. Afr. J. Enol. Vitic. 29: Boss, P.K., C. Davies, and S.P. Robinson Analysis of the expression of anthocyanin pathway genes in developing Vitis vinifera L. cv. Shiraz grape berries and the implications for pathway regulation. Plant Physiol. 111: BouMe, R, D. Van Leeuwen, and C. Dubourdieu. D Organoleptic impact of 2-methoxy-3- isobutylpyrazine on red Bordeaux and Loire wines. Effect of environmental conditions on concentrations in grapes during ripening. 1. Agric. Food Chern. 48: Bravdo, B., Y. Hepner, C. Loinger, S.Cohen, and H. Tabacman Effect of irrigation and crop level on growth, yield and wine quality of Vitis vinifera L. cv. Cabernet Sauvignon. Am. J. Enol. Vitic. 36: Bravdo, B., A. Naor, T. Zahavi, and Y. Gal The effects of water stress applied alternatively to part of the wetting zone along the season (PRD-partial rootzone drying) on wine quality, yield, and water relations of reed wine grapes. Acta Hort. 664: <;akir, B., A. Agasse, C. Gaillard, A. Saumonneau, S. Delrot, and R Atanassova A grape ASR protein involved in sugar and abscisic acid signalling. Plant Cell 15: Castellarin, S.D., A. Pfeiffer, P. Sivilotti, M. Degan, E. Peterlunger, and G. Di Gaspero Transcriptional regulation of anthocyanin biosynthesis in ripening fruit of grapevine under seasonal water deficit. Plant Cell Envir. 30: Chalmers, Y., G. Kelly, and M. Kristic Partial rootzone drying of Vitis vinifera cv. 'Shiraz' winegrapes in a semi-arid climate. Acta Hort. 664:
294 Chapman, D.M., M.A Matthews, and 1.X. Guinard Sensory attributes of Vitis vinifera L. cv. Cabemet Sauvignon wines made from vines with different crop yields. Am. J. Enol.Vitic. 55: Chaves, M.e., C.R. Souza, T.P. Santos, M.L. Rodrigues, e.m. Lopes, J.P. Maroco, and J.S. Pereira Deficit irrigation in grapevine improves water-use efficiency while controlling vigour and production quality. Ann. App. BioI. 150: Chone, X., e. Van Leeuwen, D. Dubourdieu, and J.P. Gaudillere Stem water potential is a sensitive indicator of grapevine water status. Ann. Bot. 87: Collins, M., E. Barlow, S. Fuentes, and G. Kelley Water use responses of Shiraz vines under partial root zone drying in a water-limiting environment. Acta Hort. 792: Coombe, B.G The development of flesh fruits. Ann. Rev. Plant PhysioI. 27: Correia, M.J., J.S. Pereira, M.M. Chaves, M.L. Rodrigues, and e.a Pacheco ABA xylem concentrations determine maximum daily leaf conductance of field-grown Vitis vinifera L. plants. Plant Cell Envir. 18: Cortell, J.M., M. Halbleib, AV. Gallagher, T. Righetti, and J.A Kennedy Influence of vine vigor on grape (Vitis vinifera L. cv. Pinot noir) and wine proanthocyanidins. 1. Agric. Food Chern. 53: Darriet, P., T. Tominaga, E. Demole, and D. Dubourdieu Mise en evidence dans Ie raisin de Vitis vinifera (var. Sauvignon) d'un precurseur de la 4-mercapto-4-methylpentan-2-one. e. R. Acad. Sci. Paris, BioI. Pathol. Vegetale. 316: Davies, e., P. Boss, and S. Robinson Treatment of grape berries, a nonclimacteric fruit with a synthetic auxin, retards ripening and alters the expression of developmentally regulated genes. Plant Physiol. 115: Davies, W.J., and J. Zhang Root signals and the regulation of growth and development of plants in drying soil. Ann. Rev. Plant PhysioI. Plant Mol. BioI. 42: Davies, W.J., F. Tardieu, and C.L. Trejo How do chemical signals work in plants that grow in drying soil? Plant Physiol. 104: De La Hera-Orts, M.L., A Martinez-Cutillas, J.M. L6pez-Roca and E. G6mez-Plaza Effect of moderate irrigation on grape composition during ripening. Spanish J. Agric. Res. 3: De la Hera, M.L., P. Romero, E. Gomez-Plaza, and A. Martinez Is partial root-zone drying an effective irrigation technique to improve water use efficiency and fruit quality in field-grown wine grapes under semiarid conditions? Agric. Water Manag. 87: De Souza C., J. Maroco, T.P. Dos Santos, M.L. Rodrigues, C. Lopes, J. Pereira, J. Silva, and M.M. Chaves Partial rootzone drying: regulation of stomatal aperture and carbon assimilation in field grown grapevines (Vitis vinifera cv. Moscatel). Funct. Plant BioI. 30: Dodd, I. S., R. Stikic, and W.J. Davies Chemical regulation of gas exchange and growth of plants in drying soil in the field. J. Exp. Bot. 47: ' Dos Santos, T.P., e.m. Lopez, M.L. Rodrigues, C.R. De Souza, J.P. Maroco, J.S. Pereira, J.R. Silva, and M.M. Chaves Partial rootzone drying: effects on growth and fruit quality of field-grown grapevines (Vitis vinifera). Funct. Plant BioI. 30: Downey, M.D., J.S. Harvey, and S.P. Robinson The effect of bunch shading on berry development and flavonoid accumulation in Shiraz grapes. Austral. J. Grape Wine Res. 10:
295 Dry, P.R, and B.R. Loveys Factors influencing grapevine vigour and the potential for control with partial rootzone drying. Austral. J. Grape Wine Res. 4: Dry, P.R., and B.R. Loveys Grapevine shoot growth and stomatal conductance are reduced when part ofthe root system is dried. Vitis 38: Dry, P.R., B.R. Loveys, and H. Diiring. 2000a. Partial drying of the rootzone of grape. I. Transient changes in shoot growth and gas exchange. Vitis. 39:3-7. Dry, P.R., B.R. Loveys, and H. DUring. 2oo0b. Partial drying of the rootzone of grape. ll. Changes in the pattern of root development. Vitis. 39: Dry, P.R., B.R. Loveys, M.G. McCarthy, and M. Stoll Strategic irrigation management in Australian vineyards. J. Int. Sci. Vigne Vin. 35: Du Toit, P.G., P.R. Dry, and B.R. Loveys A preliminary investigation on partial rootzone drying (PRD) effects on grapevine performance, nitrogen assimilation and berry composition. S. Mric. J. Enol. Vitic. 24: Esteban, M.A., M.J. Villanueva and J.R. Lissarrague Effect of irrigation on changes in berry composition of Tempranillo during maturation. Sugars, organic acids and mineral elements. Am. J. Enol. Vitic. 50: Esteban, M.A., M.J. Villanueva and J.R. Lissarrague Relationships between different berry components in Tempranillo (Vitis vinifera L.) grapes from irrigated and non-irrigated vines during ripening. J. Sci. Food. Agric., 82: Flexas, J., M. Escalona and H. Medrano Down regulation of photosynthesis by drought under field conditions in grapevine leaves. Austral. J. Plant. Physiol. 25: Franks, P.J., P.L. Drake, R.H. Froend Anisohydric but isohydrodynamic: seasonally constant plant water potential gradient explained by a stomatal control mechanism incorporating variable plant hydraulic conductance. Plant Cell Envir. 30: Freeman, B.M. and W.M. Kliewer Effect of irrigation, crop level and potassium fertigation on Carnigane vines. ll. Grape and wine quality. Am. J. Enol. Vitic. 34: Gagne, S., C. Saucier, and L. Geny Composition and cellular localization of tannins in Vitis vinifera L. cv. Cabernet Sauvignon skins during growth. 1. Agric. Food Chern. 54: Gerdes, S.M., P. Winterhalter, and S.E. Ebeler Effect of sunlight exposure on norisoprenoid formation in white Riesling grapes. pp In: Carotenoid-Derived Aroma Compounds. Winterhalter P. and RouseffR.L. (Eds.), Am. Chemical Society, Washington, DC. Ginestar, C., J. Esteban, S. Gray, and P. Lland Use of sap flow sensor to schedule vineyard irrigation. ll. Effect of post-verasion water deficit on composition of Shiraz grapes. Am. J. Enol. Vitic. 49: Goldhamer, D.A., M. Salinas, C. Crisosto, K.R. Day, M. Soler, and A. Moriana Effects of regulated deficit irrigation and partial root-zone drying on late harvest peach tree performance. Acta Hort. 592: Gowing, DJ.G., H.G. Jones, and W.J. Davies Xylem transported abscisic acid: The relative importance of its mass and its concentration in the control of stomatal aperture. Plant Cell Envir. 16: Gu, S., G. Du, D. Zoldoske, A. Hakim, R. Cochran, K. Fugelsang, and J. Gorgensen Effects of irrigation amount on water relations, vegetative growth, yield and fruit composition of Vitis 273
296 vinifera L. cv. Sauvignon blanc grapevines under partial root-zone drying and conventional irrigation in the San Joaquin Valley of California, USA. J. Hort.Sci. Biotechnol. 79: Hardie, W. and J. Considine Responses of grapes to water-deficit stress in particular stages of development. Am. J. Enol. Vitic. 27: Hardie, W.J, and S.R Martin Shoot growth on de-fruited grapevines: a physiological indicator for irrigation scheduling. Austral. J. Grape Wine Res. 6: Haselgrove, L., D. Botting, R van Heeswijck, P.B. Hoj, P.R Dry, C. Ford and P.G. nand Canopy microclimate and berry composition: The effect of bunch exposure on the phenolic composition of Vitis vinifera L cv. Shiraz grape berries. Austral. J. Grape Wine Res. 6: Hsiao, T.C Plant responses to water stress. Ann. Rev. Plant Physiol. 24: Jarvis, P.G The interpretation of the variations in leaf water potential and stomatal conductance found in canopies in the field, Philos. Trans. Royal Soc. London 273: Jones, H.G Plants and Microclimate, 2nd ed. Cambridge University Press, Cambridge, 428p. Jones, H.G. and R.A. Sutherland Stomatal control of xylem embolism. Plant Cell Envir. 14: Keller, M., KJ. Arnink, and G. Hrazdina Interaction of nitrogen availability during bloom and light intensity during veraison: I. Effects on grapevine growth, fruit development, and ripening. Am. J. Enol. Vitic. 49: Keller, M., and G. Hrazdina Interaction of nitrogen availability during bloom and light intensity during veraison: II. Effects on anthocyanin and phenolic development during grape ripening. Am. J. Enol. Vitic. 49: Keller, M., L. J. Mills, R L. Wample, and S.E. Spayd Cluster thinning effects on three deficit-irrigated Vitis vinifera cultivars. Am. J. Enol. Vitic. 56: Kingston, M.S., and E.W. Presant TheSoils of the Regional Municipality of Niagara. Report 60 of the Ontario Institute of Pedology, Guelph, ON. Kliewer, W.M., and L.A. Lider Influence of cluster exposure to the sun on the composition of Thompson Seedless fruit. Am. J. Enol. Vitic. 19: Kriedemann, P.E., and I. Goodwin Regulated deficit irrigation and partial rootzone drying: an overview of principles and applications. Irrigation insights no. 4. (Land and Water Australia: Canberra). Lakso, A.N., and RM. Pool Drought stress effects on vine growth, function, ripening and implications for wine quality. pp In: Proc. 29th NY Wine Industry Workshop, NYS Agric. Exper. Sta., NY. Ledahudec, J., and J. Pokorny Structuration of graphical scales in the sensory difference testing affects the distribution of results. Food Nahrung (Weinheim). 38:2: Lee, S.H., M.J. Seo, M. Riu, J. Cotta, P. Block, E. David, N. Dokoozlian, and S.E. Ebeler Vine microclimate and norisoprenoid concentration in Vitis vinifera L. cv. Cabernet Sauvignon grapes and wines. Am. J. Enol. Vitic. 58: Levengood, J Copigmentation in Vitis vinifera L. cv. Cabernet Sauvignon Master's Thesis, University of California, Davis. USA. 274
297 Levengood, J., and R. Boulton The variation in the color due to copigmentation in young Vitis vinifera L. cv. Cabernet Sauvignon wines. pp In: Red Wine Color. Revealing the Mysteries. Waterhouse A and J. Kennedy (Eds.), Am. Chemical Society, Washington, DC. Lopez, R, V. Ferreira, P. Hernandez, and J.P. Cacho, Identification of impact odorants of young red wines made with Merlot, Vitis vinifera L. cv. Cabernet Sauvignon and Grenache grape varieties: a comparative study. J. Sci. Food Agric. 79: Loveys, B.R. 1984a. Abscisic acid transport and metabolism in grapevine (Vitis vinifera L.). New Phytol. 98: Loveys, B.R 1984b. Diurnal changes in water relations and abscisic acid in field-grown Vitis vinifera cultivars: 1lI. The infuence of xylem-derived abscisic acid on leaf gas exchange. New Phytol. 98: Marais, J., C.J. Van Wyk, and A Rapp. 1992a. Effect of sunlight and shade on norisoprenoid levels in maturing Weisser Riesling and Chenin blanc grapes and Weisser Riesling wines. S. Afr. J. Enol. Vitic. 13: Marais, J., G. Versini, C.J. Van Wyk, and A Rapp. 1992b. Effect of region on free and bound monoterpene and C13-norisoprenoid concentrations in Weisser Riesling wines. S. Afr. J. Enol. Vitic.13: Matthews, M.A, and M.M. Anderson Fruit ripening in Vitis vinifera L.: responses to seasonal water deficits. Am. J. Enol. Vitic. 39: Matthews, M.A and M.M. Anderson Reproductive development in grape (Vitis vinifera L.): response to seasonal water deficits. Am. J. Enol. Vitic. 40: Matthews, M.A, M.M. Anderson, and H.R Schultz Phenological and growth responses to early and late season water deficit in Cabernet franc. Vitis 26: Matthews, M.A, G. Cheng, and S.AWeinbaum Changes in water potential and dermal extensibility during grape berry development. J. Am. Soc. Hort. Sci. 112: Mattews, M.A, R. Ishii, M. Anderson, and M. O'Mahony Dependence of wine sensory atributes on vine water status. J. Sci. Food. Agric. 51: McCarthy, M.G., B.R. Loveys, P.R Dry and M. Stoll Regulated deficit irrigation and partial rootzone drying as irrigation management techniques for grapevines. F AO Deficit Irrigation Practices: Water Reports 22. pp FAO, Rome. Mori, K., N. Goto-Yamamoto, M. Kiyatama, and K. Hashizume Loss of anthocyanins in red-wine grape under high temperature. J. Exp. Bot. 58: Morrison, J.C., and A.C. Noble The effects ofleaf and cluster shading on the composition of Vitis vinifera L. cv. Cabernet Sauvignon grapes and on fruit and wine sensory properties. Am. J. Enol. Vitic. 41: Naor, A, B. Bravdo and Y. Hepner Effect ofpost-veraison irrigation level on Sauvignon blank yield, juice quality and water relations. S. Afr. J. Enol. Vitis. 14: Noble, AC., D.L. Elliott-Fisk, and M.S. Allen Vegetative flavor and methoxypyrazines in Cabernet Sauvignon: Effect of soil, vine growth and light on wine flavor and methoxypyrazines. pp In: Fruit Flavors: Biogenesis, Characterization, and Authentication. Rouseff R.L. and Leahy M.M. (Eds.), ACS Symp. Ser Am. Chemical Society, Washington, DC. 275
298 O'Mahoney, M Sensory evaluation offood. Statistical methods and procedures. Marcel Dekker, New York, 487p. Ogawa, Y. and RW. King Indirect action of benzyl-adenine and other chemicals on flowering of Pharbitis nil Chois: action by interference with assimilate translocation from induced cotyledons. Plant Physiol. 63: Ojeda, H., A Deloire, and A Carbonneau Influence of water deficits on grape berry growth. Vitis 40: Ojeda, H., E. Kraeva, A Deloire, A Carbonneau, and C. Andary Influence of pre and postveraison water deficits on synthesis and concentration of skins phenolic compounds during the berry growth of Shiraz grapes (Vitis vinifera L.). Am. J. Enol. Vitic. 53: Oliveira, c., AC. Ferreira, A Costa, J. Guerra, and P.G. De Pinho Effect of some viticultural parameters on the grape carotenoids profile. J. Agric. Food Chern. 52: Oliveira, c., AC. Silva Ferreira, M. Pinto, T. Hogg, F. Alves, and P. Guedes de Pinho Carotenoid compounds in grapes and their relationship to plant water status. J. Agric. Food Chern. 51: O.M.AF.RA Fruit production recommendations. Publication 360, Ontario Ministry of Agriculture, Food and Rural Affairs, Toronto, ON. Ough, C.S., and R Nagaoka Effect of cluster thinning and vineyard yields on grape and ine composition and wine quality of Vitis vinifera L. cv. Cabemet Sauvignon. Am. J. Enol. Vitic. 35: Palejwala, V.A, H.R Parikh, and V.V. Modi The role of abscisic acid in the ripening of grapes. Physiol. Plant. 65: Pan, Q. H., M.J. Li, c.c. Peng, N. Zhang, X. Zou, K.Q. Zou, X.L. Wang, x.c. Yu, X.F Wang, and D.P Zhang Abscisic acid activates acid invertases in developing grape berry. Physiol. Plant. 125: Pellegrino, A, E. Lebon, T. Simonneau, and J. Wery Toward a simple indicator of water stress in grapevine (Vitis vinifera L.) based on the differential sensitivities of vegetative growth components. Austral. J. Grape Wine Res. 11: Poni, S., M. Tagliavini, D. Neri, D. Scudellari, and M. Toselli Influence of root pruning and water stress on growth and physiological factors of potted apple, grape, peach and pear trees. Sci. Hort. 52: Preston, L., D.E. Block, H. Heymann, G. Soleas, AC. Noble, and S.E. Ebeler Defining vegetal aromas in Cabemet Sauvignon using sensory and chemical evaluations. Am. J. Enol. Vitic.59: Pudney, S. and M.G. Mccarthy Water use efficiency of field grown Vitis vinifera L. cv. Chardonnay grapevines subjected to partial rootzone drying and deficit irrigation. Acta Hort. 664: Razungles, AJ., R.L. Baumes, C. Dufour, C.N. Sznaper, and c.l. Bayonove Effect of sun exposure on carotenoids and C13-norisoprenoid glycosides in Syrah berries (Vitis vinifera L.). Sci. Aliment. 18: Reynolds, AG Irrigation management in the East: How much is enough? Wine East 35:38-49;
299 Reynolds, AG., A Ehtaiwesh, and e. de Savigny Irrigation scheduling for 'Sovereign Coronation' table grapes based on evapotranspiration calculations and crop coefficients. HortTech.19: Reynolds, AG., W.D. Lowrey, and C. De Savigny Influence of irrigation and fertigation on fruit composition, vine performance, and water relations of Concord and Niagara grapevines. Am. J. Enol. Vitic. 56: Reynolds, AG., W.D. Lowrey, L. Tomek, J. Hakimi, and C. De Savigny Influence of irrigation on vine performance, fruit composition, and wine quality of Vitis vinifera L. cv. Chardonnay in a cool, humid climate. Am. J. Enol. Vitic. 58: Ristic, R, M.a. Downey, P.G. nand, K. Bindon, LL. Francis, M. Herderich, and S.P. Robinson Exclusion of sunlight from Shiraz grapes alters wine colour, tannin and sensory properties. Austral. J. Grape Wine Res. 13: Roby, G., and M.A Matthews Relative proportions of seed, skin and flesh, in ripe berries from Vitis vinifera L. cv. Cabernet Sauvignon grapevines grown in a Vineyard either well irrigated or under water deficit. Austral. J. Grape Wine Res. 10: Roby, G., J.F. Harbertson, D.A Adams, and M.A. Matthews Berry size and vine water deficits as factors in winegrape composition: Anthocyanins and tannins. Austral. J. Grape Wine Res. 10: Rogiers, S.Y., H.D. Greer, RJ. Hutton, and J.J. Landsberg Does night-time transpiration contribute to anisohydric behaviour in a Vitis vinifera cultivar? J. Exp. Bot. 60: Schultz, H.R, and M.A Matthews High vapour pressure deficit exacerbates xylem cavitation and photoinhibition in shade-grown Piper auritum H.B. & K. during prolonged sunflecks. L Dynamics of plant water relations. Oecologia 110: Schultz, H.R, and M.A Matthews Resistance to water transport in shoots of Vitis vinifera. Plant Physiol. 88: Seguin, G The influence of vineyard soils on the composition and quality of harvested grapes. Bulletin de roiv, 56:3-18. Smart, RE Aspects of water relations of the grapevine (Vitis vinifera). Am. J. Enol. Vitic. 25: Smart, RE., and B.G. Coombe Water relations of grapevines. pp In: Additional Woody Crop Plants. Kozlowski T.T. (Ed.), Academic Press, New York. Smart, RE., M.S. Stephen, and RV. Winchester Light quality and quantity effects on fruit ripening for Cabernet Sauvignon. Am. J. Enol. Vitic. 39: Soar, C.J., and B.R Loveys The effect of changing patterns in soil-moisture availability on grapevine root distribution, and viticultural implications for converting full-cover irrigation into a point-source irrigation system. Austral. J. Grape Wine Res. 13:1-13. Spayd, S.E., J.M. Tarara, D.L. Mee and J.e. Ferguson Separation of sunlight and temperature effects on the composition of Vi tis vinifera cv. Merlot berries. Am. J. Enol. Vitic. 53: Srinivasan,e., and M.G. Mullins Flowering in the grapevine (Vitis vinifera L.): Histochemical changes in apices during the formation of the anlagen and its derivatives. Z. Pflanzenphysiol. 97 :
300 Stevens, R.M., G. Harvey, and D. Aspinall Grapevine growth of shoots and fruit linearly correlate with water stress indices based on root-weighted soil matric potential. Austral. J. Grape Wine Res. 1 :2: Stoll, M Effects of partial rootzone drying on grapevine physiology and fruit quality. PhD Thesis, University of Adelaide, Adelaide, SA, Australia. 229p. Stoll, M., P.R. Dry, B.P. Loveys, D. Stewart, and M. G., McCarthy Partial rootzone drying, effects on root distribution and commercial application of a new irrigation technique. Austral. N.Z. Wine Ind. J. 15:74-7. Swiegers J.H., R. Willmott, A Hill-Ling, D.L. Capone, K.H. Pardon, G.M. Elsey, K.S. Howell, M.A de Barros Lopes, M.A Sefton, M. Lilly, and I.S. Pretorius Modulation of volatile thiol and ester aromas in wine by modified wine yeast. pp In: Proceedings ofthe Weurman Flavour Research Symposium, June 21-26, Roskilde, Denmark. Tardieu, F., and T. Simonneau Variability among species of stomatal control under fluctuating soil water status and evaporative demand: modelling isohydric and anisohydric behaviours. J. Exp. Bot. 49: Tominaga, T., A Furrer, R. Henry and D. Dubourdieu Identification of new volatile thiols in the aroma of Vitis vinifera L. cv. Sauvignon blanc wines. Flav. Fragr. J. 13: Turner, D.W., C.M. Menzel, and D.R. Simpson Short term drying of half the root system reduces growth but not water status or photosynthesis in leaves of passion fruit. Sci. Hort. 65: Tyree, M.T., and S. Sperry Vulnerability of xylem to cavitation and embolism. Annu. Rev. Plant Physiol. Mol. BioI. 40: Van den Berg, H., R. Faulks, H. Fernando Granado, O. Hirschberg, B. Olmedilla, G. Sandmann, S. Southon, and W. Stahl The potential for the improvement of carotenoid levels in food and the likely systemic effects. J. Sci. Food Agric. 80: Van Leeuwen, c., and G. Seguin. 2006: The concept of Terroir in viticulture. J. Wine Res. 17:1-10. Veihmeyer, FJ., and AH. Hendrickson Soil moisture in relation to plant growth. Ann. Rev. Plant Physiol. 1: Webb, AAR., and AM. Hetherington Convergence of the ABA, C02 and extracellular calcium signal transduction pathways in stomatal guard cells. Plant Physiol. 114: Williams, L.E., and F. Araujo Correlations among predawn leaf, midday leaf, and midday stem water potential and their correlations with other measures of soil and plant water status in Vitis vinifera L. J. Am. Soc. Hort. Sci. 127: Williams, L.E., and P.E. Baeza Relationships among ambient temperature and vapor pressure deficit and leaf and stem water potentials of fully irrigated, field-grown grapevines. Am. J. Enol. Vitic. 58: Williams, L.E., and P.J.Biscay Partitioning of dry weight, nitrogen, and potassium in Cabernet Sauvignon grapevines from anthesis until harvest. Am. J. Enol. Vitic. 42: Williams, L.E. and D.W. Grimes Modelling vine growth-development of a data set fora water balance subroutine, pp In: Proc. of the sixth Australian wine industry technical Conference. T. Lee (ed.), Adelaide, July Industrial Publishers, Adelaide, Australia. 278
301 Williams, L.E., D.W. Grimes, and C.J. Phene. 201Oa. The effects of applied water at various fractions of measured evapotranspiration on water relations and vegetative growth of Thompson Seedless grapevines. Irrig. Sci. 28: Williams, L.E., and M.A. Matthews Grapevine. pp In: Irrigation of agricultural crops. Stewart B.A. and D.R. Nelson (Eds.), Am. Society of Agronomy, Madison, WI. Williams, L.E., and T.J. Trout Relationships among vineand soil-based measures of water status in a Thompson Seedless vineyard in response to high-frequency drip irrigation. Am. J. Enol. Vitic. 56: Yuste, J Comportamiento fisiologico y agronomico de la vid (Vitis vinifera L.) en diferentes sistemas de conduccion en secano y regadio. Tesis Doctoral. Departamento de Produccion Vegetal: Fitotecnia. Universidad Politecnica de Madrid. 395 p. Zhang, J., U. Schurr, and W.J. Davies Control of stomatal behaviour by abscisic acid which apparently originates in the roots. J. Exp. Bot. 38: ZsOfi, Z, L. Gal, and Z. Szilagyi Use of stomatal conductance and pre-dawn water potential to classify terroir for the grape variety Kekfrankos. Austral. J. Grape Wine Res. 15:
302 List of Tables Table 6.1. Attributes and, their standard references used for sensory evaluation of Cabemet Sauvignon wines. Table 6.2. Impact of irrigation treatments on yield components and vine size of Cabemet Sauvignon grapevines, Lambert Vineyards, Niagara-on-the-Lake, ON, Table 6.3. Impact of irrigation treatments on berry composition of Cabemet Sauvignon grapevines, Lambert Vineyards, Niagara-on-the-Lake, ON, Table 6.4. Impact of irrigation treatments on must composition of Cabemet Sauvignon grapevines, Lambert Vineyards, Niagara-on-the-Lake, ON, Table 6.S. Impact of irrigation treatments on Cabemet Sauvignon wines, Lambert Vineyards, Niagara-on-the-Lake, ON, Table 6.6. Comparison of mean sensory scores among the irrigation treatments of Cabemet Sauvignon wines
303 Table 6.1. Attributes and their standard references used for sensory evaluation of Cabemet Sauvignon wines. Sensory Attribute Reference standard (prepared in 100 ml base red wine Kressmann -France) Dark fruit Red fruit Sour cherry Prune Chocolate Cooked vegetable Tobacco Acidity Astringency 10 ml black currant concentrate (Ribena), 20 g of ED Smith wild fruit jam -blueberry and blackberry) 20 g mixture of fresh strawberry and raspberry (California) 109 of pulp sour cherries (canned) 20 g of fresh prune puree (Mexico) No name (No Frills) - 5 g of cooking chocolate Mixture of fresh green pepper (4g) and asparagus (5g) Del Monte- cooked for 30s in microwave and left 24h in 100mL of base wine 1 g of processed tobacco leaves (24 h maceration in 100 ml base wine) 1.5 g tartaric acid IL water 0.3 g aluminum sulfate (Sigma) IL water 281
304 Table 6.2. bnpact of irrigation treatments on yield components and vine size of Cabemet Sauvignon grapevines, Lambert Vineyards, Niagara-on-the-Lake, ON, Treatment 2007 Vine size Yield Clusters/ Cluster wt. Berries/ Berrywt. (kg/vine) (kg/vine) vine (g) cluster (g) Control 0.37 e 4.91 ab 48a ab 105 ab 1.26b PRD 0.48 a 6.32 a 39b a 116 a 1.33 a Full 0.44 b 4.29 b 43 ab 99.7 ab 89c 1.28 ab 50RDI 0.35c 4.40b 45 ab 97.7 ab 98b 1.29 ab 25RDI O.35c 4.40b 45 ab 97.7 ab 98b 1.29 ab Significance ** **** *** **** * * 2008 Control b 42b e 93 e 1.36 b PRD ab 44b ab l09b 1.41ab Full a 49a 134.6c 116 a 1.43 a 50RDI ab 46ab b 110b 1.41 ab 25RDI ab 42b a 100 be 1.39 ab Significance ns * * * * * Legend: Control (non-irrigated); PRD -partial root zone drying (100% ETc); Full-conventional drip irrigation (100% ETc); RDI- regulated deficit irrigation (25 and 50 % ETc); 25, 50,100 % are the percentages of water replaced in the soil. *,**,***,****, ns: Significant at p ~ 0.05,0.01, 0.001, , or not significant, respectively. Letters within columns represent means separated at p ~ 0.05, Duncan's multiple range test. Boldfaced data indicate those values significantly greater than the control using Dunnett's t-test; boldfaced and underlined data are significantly less than the control 282
305 Table 6.3. Impact of irrigation treatments on berry composition of Cabemet Sauvignon grapevines, Lambert Vineyards, Niagara-on-the-Lake, ON, Total Treatment Brix TA (gil) ph A520 Anthocyanins Phenols (AU) (mgil) (mg/l) 2006 Control 21.7 a 6.8 b 3.82 b 6.60c 413.4b b PRD 21.3 ab 7.5 ab 3.81 b 6.61 c ab e Full 21.1 b 7.8 a 3.85 a 7.67 ab e bc 50RDI 20.9b 7.0b 3.84ab 7.11 b ab a 25RDI 21.6 ab 7.0b 3.82b 7.90 a a ab Significance **** **** **** *** ** **** Control 23.2 a 7.1 b 3.63 b 8.20b 839b b PRD 22.6b 7.4 ab 3.4ge 7.60 ab 820bc ab Full 21.8e 7.8 a 3.73 a 7.11 e 65ge e 50RDI 23.0 a 7.0b 3.69 ab 8.56 a 860ab be 25RDI 23.3 a 6.9b 3.67 ab 8.46 a 871 a a Significance **** **** *** **** ** **** 2008 Control a 3.66b 6.39 a 438 a 1560 a PRD ab 3.69 a 5.99 ab 421 ab 1523 ab Full ab 3.68 ab 5.81 b 396b 1321 b 50RDI b 3.65b 6.31 ab 415 ab 1489 ab 25RDI ab 3.66b 6.21 ab 426ab 1509 ab Significance ns * * * * * *Legend: Control (non-irrigated); PRD -partial rootzone drying (100% ETc); Full-conventional drip irrigation (100% ETc); RDI- regulated deficit irrigation (25 and 50 % ETc); 25, 50, 100 % are the percentages of water replaced in the soil. TA-titratable acidity; *, **, ***, ****, ns: Significant at p ~ 0.05,0.01,0.001, , or not significant, respectively. Letters represent means separated at p ~ 0.05, Duncan's multiple range test. Boldfaced data indicate those values significantly greater than the control, Dunnett's t-test; boldfaced and underlined data are significantly less than the control. 283
306 Table 6.4. Impact of irrigation treatments on must composition Cabemet Sauvignon grapevines, Lambert Vineyards, Niagara-on-the-Lake, ON, Treatment Brix TA (gil) ph Control 22.2b 8.3 b 3.46b PRD 21.4c 9.1 ab 3.56 ab Full 21.1 c 9.3 a 3.60 a 50RDI 22.1 b 9.1 ab 3.49b 25RDI 22.4 a 9.0ab 3.36c Significance * *** ** *Legend: Control (non-irrigated); PRD -partial rootzone drying (100% ETc); Full--conventional drip irrigation (100% ETc); RDI- regulated deficit irrigation (25 and 50 % ETc); 25, 50, 100 % are the percentages of water replaced in the soil. TA-titratable acidity; *,**,***,****, ns: Significant at P.$ 0.05,0.01,0.001,0.0001, or not significant, respectively. Letters represent means separated at P.$ 0.05, Duncan's multiple range test. Boldfaced data indicate those values significantly greater than the control, Dunnett's t-test; boldfaced and underlined data are significantly less than the control. 284
307 Table 6.5. Impact of irrigation treatments on Cabernet Sauvignon wines, Lambert Vineyards, Niagara-on-the-Lake, ON, EtOH% Hue Anthocyanins Phenolics Treatment ph TA(gIL) (v/v) (OD42010D520) (mgil) (mgil) 2007 Control a 3.59b 5.1 b 0.68 a 759 a a PRD b 3.46e 5.6ab O.64ab 711 b b Full b 3.67 a 5.8 a 0.60b 546e e 50RDI ab 3.65 a 5.5 ab 0.63 ab 638 be be 25RDI ab 3.64 a 5.3 b 0.65 ab 727b b Significance * * * * ** *** *Legend: Control (non-irrigated); PRD -partial rootzone drying (100% ETc); Full-conventional drip irrigation (100% ETc); RDI- regulated deficit irrigation (25 and 50 % ETc); 25, 50,100 % are the percentages of water replaced in the soil. EtOH (%)-ethanol (% by volume); TA-titratable acidity. *, **, ***, ****, ns: Significant at p ~ 0.05,0.01, 0.001, , or not significant, respectively. Letters represent means separated at p ~ 0.05, Duncan's multiple range test. Boldfaced data indicate those values significantly greater than the control, Dunnett's t-test; boldfaced and underlined data are significantly less than the control. 285
308 Table 6.6. Comparison of mean sensory scores among the irrigation treatments Cabemet SauviBnon wines Treatment Control PRD Full 50RDI 25RDI Pr>F Aroma Red fruit 2.5 c 4.2 a 3.1 b 3.7 ab 3.8 ab Dark fruit 3.1 b 3.5 ab 2.5 c 3.3 b 4.1 a Sour cherry 3.5 ab 3.1 b 3.2 b 3.4 ab 3.6a Tobacco aroma 3.6 a 3.1 b 2.1 c 3.2 b 3.4 ab Chocolate 2.5 a 2.1 b 2.3 ab 2.5 a 1.4 c Cooked vegetable 2.1 b 1.5c 2.7 a 1.5 c 1.6c Flavor RED FRUIT 3.6 c 4.2 ab 4.3 ab 4.1 b 5.2 a DARK FRUIT 2.6 b 3.7 ab 3.8 ab 3.9ab 4.1 a SOUR CHERRY 2.8 c 3.8 ab 3.9 a 3.2 b 3.8 ab TOBACCO 1.6 bc 2.6ab 2.8 a. 1.9 b 1.1c CHOCOLATE 2.1 ab 2.3 a 1.9 ab 1.2 b 1.3b COOKED VEGETABLE 1.8 a 0.9b 0.7 b 0.5 b 0.6 b ASTRINGENCY 2.9b 3.2 b 3.9 a 3.1 b 2.8 b ACIDITY 2.8 b 2.9 b 3.9 a 1.9 c 2.1 c *Legend: Control (non-irrigated); PRD -partial rootzone drying (100% ETc); Fullconventional drip irrigation (100% ETc); RDI- regulated deficit irrigation (25 and 50 % ETc); 25, 50, 100 % are the percentages of water replaced in the soil. Means in the rows with different letters represent means separated at p ~ 0.05, Duncan's multiple range test. 286
309 List of Figures Figure 6.1. Impact of irrigation treatments on soil moisture (%) of Cabernet Sauvignon grapevines, Lambert Vineyards, Niagara-on-the-Lake, ON, 2006 (A), 2007 (B) and 2008 (C). Legend: C control (non-irrigated); PRD -partial rootzone drying (100% ETc); Full-conventional drip irrigation (100% ETc); RDI- regulated deficit irrigation (25 and 50 % ETc); 25, 50, 100 % are the percentages of water replaced in the soil. Figure 6.2. Impact of irrigation treatments on transpiration rate of Cabernet Sauvignon grapevines, Lambert Vineyards, Niagara-on-the-Lake, ON, 2006 (A), 2007 (B) and 2008 (C). Legend: C control (non-irrigated); PRD -partial rootzone drying (100% ETc); Full-conventional drip irrigation (100% ETc); RDI- regulated deficit irrigation (25 and 50 % ETc); 25, 50, 100 % are the percentages of water replaced in the soil. Figure 6.3. Impact of irrigation treatments on leaf water potential of Cabernet Sauvignon grapevines, Lambert Vineyards, Niagara-on-the-Lake, ON, 2006 (A), 2007 (B) and 2008 (C). Legend: C-control (non-irrigated); PRD -partial rootzone drying (100% ETc); Fullconventional drip irrigation (100% ETc); RDI- regulated deficit irrigation (25 and 50 % ETc); 25,50, 100 % are the percentages of water replaced in the soil. Figure 6.4. Impact of irrigation treatments on shoot growth rate of Cabernet Sauvignon grapevines, Lambert Vineyards, Niagara-on-the-Lake, ON, 2006 (A), 2007 (B) and 2008 (C). Legend: C control (non-irrigated); PRD -partial rootzone drying (100% ETc); Full-conventional drip irrigation (100% ETc); RDI- regulated deficit irrigation (25 and 50 % ETc); 25, 50, 100 % are the percentages of water replaced in the soil. Figure 6.5. Principal component analysis (F1&F2) of soil water status and physiological data means (10 vines x three shoots x three leaves x four replicates) from five irrigation treatments of Cabernet Sauvignon grapevines from Lambert Vineyards, Niagara-on-the-Lake, ON, Figure 6.6. PLS regression analysis of soil and plant water status and berry composition data from five irrigation treatments of Cabernet Sauvignon grapevines from Lambert Vineyards, Niagaraon-the-Lake, ON, Figure 6.7. Principal component analysis (F1&F2) of soil water status and physiological data means (10 vines x three shoots x three leaves x four replicates) from five irrigation treatments of Cabernet Sauvignon grapevine from Lambert Vineyards, Niagara-on-the-Lake, ON, Legend: C-control (non-irrigated); PRD -partial rootzone drying (100% ETc); Fullconventional drip irrigation (100% ETc); RDI- regulated deficit irrigation (25 and 50 % ETc). Figure 6.8. Principal component analysis (F1&F2) of soil water status, physiological data, yield components and berry composition means (10 vines x three shoots x three leaves x four replicates) from five irrigation treatments of Cabernet Sauvignon grapevines from Lambert Vineyards, Niagara-on-the-Lake, ON, Legend: C-control (non-irrigated ); PRD -partial rootzone drying (100% ETc); Full-conventional drip irrigation (100% ETc); RDI- regulated deficit irrigation (25 and 50 % ETc). Figure 6.9. Principal component analysis (F1&F2) of soil and vine water status from five irrigation treatments of Cabernet Sauvignon from Lambert Vineyards, Niagara-on-the-Lake, ON, Legend: C-control (non-irrigated); PRD -partial rootzone drying (100% ETc); Fullconventional drip irrigation (100% ETc); RDI- regulated deficit irrigation (25 and 50 % ETc). 287
310 Figure PLS regression analysis of soil and vine water status, yield components and berry composition data from five irrigation treatments of Cabernet Sauvignon grapevine from Lambert Vineyards, Niagara-on-the-Lake, ON, Figure Radar diagram the mean intensity ratings of five Cabernet Sauvignon wines made from different irrigation treatments Lambert Vineyards, Niagara-on-the-Lake, ON, Aroma and flavor attributes are specified by lower and higher case letters respectively. Figure Principal component analysis (Fl&F2) of sensory data means from five irrigation treatments of Cabemet Sauvignongrapevine from Lambert Vineyards, Niagara-on-the-Lake, ON,2007. Figure PLS regression analysis of soil and plant water status, yield components, berry and wine composition and sensory data from five irrigation treatments of Cabemet Sauvignon grapevine from Lambert Vineyards, Niagara-on-the-Lake, ON,
311 25... COntrol ETIPRD "'Full ETiRDI - 25ETlROI n$ ~------r_----_,------~----~ 25-Jun 9-Jul 23-Jul 6.Aug 2o-Aug Sampling date (2006) A ContrOl +1QOET/PRD "Full... 50ET/RDI -+-,25ET/RDI 22 a r-----r ~---' 28-Jun 12-Jul 26-Jul 9-Aug Sampling date (2007) 40.., , -e-control ET/PRD... Full -50 ETJRDI ET/RDI B ~ 28 ~ ~ 25 :::> Ui22 '0 E 19 ~ ns 25-Jun ns ns ns 9-Jul 23-Jul 6-Aug 20-Aug Sampling Date (2008) c Figure 6.1. Impact of irrigation treatments on soil moisture (%) of Cabemet Sauvignon grapevines, Lambert Vineyards, Niagara-on-the-Lake, ON, 2006 (A), 2007 (B) and 2008 (C). Legend: C-control (non-irrigated); PRDpartial rootzone drying (100% ETc); Full-conventional drip irrigation (100% ETc); RDI- regulated deficit irrigation (25 and 50 % ETc); 25, 50, 100 % are the percentages of water replaced in the soil *,**,***,****, ns: Significant at p $ 0.05,0.01,0.001,0.0001, or not significant, respectively. Letters represent means separated at p $ 0.05, Duncan's multiple range test. 289
312 19 'c , 17 f 15 q, 13. In 0) ~ 9 o ~ ~ 5 ~... 3 ns... Control.,.,..100 ETIPRD... Full ET/RDI ET/RDI b 26-Jun fo-jul 24-Jul 07-Aug 21-Aug Sampling Date (2006) A 19 ~ 17 -!J. E 15 ~ q, f 13 I 0) 11..:;... Conlful ETIPRD... Full +50 ETIRDI + 25ETlRDI 09 9 "'~~:::::::::::::::L~o ~ ~ 5 ~ 3 28-Jun 12-Jul 26-Jul 09-Aug 23-Aug Sampling Date (2007) B 19.Control"""100 ETIPRD "Full... 5QETIRDI ETiROI 25-Jun 9-Jul 23-JuI 6-Aug 20-Aug Sampling Date (2008) 3-Sep C Figure 6.2. Impact of irrigation treatments on transpiration rate of Cabemet Sauvignon grapevines, Lambert Vineyards, Niagara-on-the-Lake, ON, 2006 (A), 2007 (B) and 2008 (C). Legend: C-control (non-irrigated); PRDpartial rootzone drying (100% ETc); Full-conventional drip irrigation (100% ETc); RDI- regulated deficit irrigation (25 and 50 % ETc); 25, 50, 100 % are the percentages of water replaced in the soil. *,**,***,****, ns: Significant at p < 0.05, 0.01, 0.001, , or not significant, respectively. Letters represent means separated at p < 0.05, Duncan's multiple range test. 290
313 -0.3,------,-----,------, ,----, m e "ffi -0.7 E QJ <t! ~ -1.1 b c -<t! QJ...J Control -.lr100 ET/PRO ---Full -.50 ETiROI ETiROI a c Jun 10-Jul 24-Jul 07-Aug 21-Aug Sampling date (2006) A -0.3.r ;----~----_r_----.,...,... COntrol -.lr1qo ETIP.RD... Full... WET/ROI... 2sE'rIRDI '- ~.::t: CD ~ -1,3 os " ' 28-Jun 12-Jul 26~ul 09-Aug 23-Aug Sampling dale (2007) -0.3.,..._----., , ,.-----n... Con\rol -.lr100 ET/PRD... Full ET/RDI ETIRDI B ns ns rls _1.5 L ' 25-Jun 9-Jul 23-Jul 6-Aug 20-Aug Sampling Date (2008) Figure 6.3. Impact of irrigation treatments on leaf water potential of Cabemet Sauvignon grapevines, Lambert Vineyards, Niagara-on-the-Lake, ON, 2006 (A), 2007 (B) and 2008 (C). Legend: C-control (non-irrigated); PRDpartial rootzone drying (100% ETc); Full-conventional drip irrigation (100% ETc); RDI- regulated deficit irrigation (25 and 50 % ETc); 25, 50,100 % are the percentages of water replaced in the soil. *,**,***,****, ns: Significant at p S 0.05,0.01,0.001, , or not significant, respectively. Letters represent means separated at p S 0.05, Duncan's multiple range test. c 291
314 70... Control-*-100%PRD ---WO%Full... 50%RDI---25%RDI o ~ ~----~ 26.Jun 10-Jul 24-Jul Sampling date (2006) A 60 -Control %PRO.. 100%Full - 50%RDI... 25%RDI a s J 28-Jun 12-.Jul 26-Jul 09-Aug Sampling date (2007) 70 ~ _, "'Control %PRD %Full - 50%RDI -+-25%RDI B ns ns os o r------~------_,----~ 7-Jul 21-Jul Sampling date (2008) c Figure 6.4. Impact of irrigation treatments on shoot growth rate of Cabernet Sauvignon grapevines, Lambert Vineyards, Niagara-on-the-Lake, ON, 2006 (A), 2007 (B) and 2008 (C). Legend: C-control (non-irrigated); PRD -partial rootzone drying (100% ETc); Full--conventional drip irrigation (100% ETc); RDI- regulated deficit irrigation (25 and 50 % ETc); 25,50,100 % are the percentages of water replaced in the soil. *,**,***,****, ns: Significant at p ~ 0.05,0.01,0.001,0.0001, or not significant, respectively. Letters represent means separated at p ~ 0.05, Duncan's multiple range test. 292
315 2 Biplot(axes Fl and F2: %) Vine size loo%fuli ~ CTI o 0 ~ N u.. Control. SO%RDI Tleaf iii' 2S%RDI TSSM20 4-1, loo%pr o F1 (58.84 %) 2 4 Figure 6.5. Principal component analysis (F1&F2) of soil water status and physiological data means (10 vines x three shoots x three leaves x four replicates) from five irrigation treatments of Cabemet Sauvignon grapevines from Lambert Vineyards, Niagara-on-the-Lake, ON, Legend: C-control (non-irrigated); PRD -partial rootzone drying (100% ETc); Full-conventional drip irrigation (100% ETc); RDI- regulated deficit irrigation (25 and 50 % ETc); 25, 50, 100 % are the percentages of water replaced in the soil. Tleaf-Ieaf temperature; SM2O-soil moisture at 20 cm depth, ",,-leaf water potential; Ts-transpiration. 293

316 1 Correlations witht on axes tland t N o t1 Figure 6.6. PLS regression analysis of soil and plant water status and berry composition data from five irrigation treatments of Cabemet Sauvignon grapevines from Lambert Vineyards, Niagara-on-the-Lake, ON, Legend: Tleaf-Ieaftemperature; SM20-soil moisture at 20 cm depth, 'I'rleaf water potential; Ts-transpiration; TA-titratable acidity; A520-absorbance at 520 nm ; V - vine size; Anth.- anthocyanin content; T.Ph-total phenolics. 294

317 1 Biplot (axes F1 and F2: %) SO%RDI el0q%prd F1 (83.86 %) Figure 6.7. Principal component analysis (Fl&F2) of soil water status and physiological data means (10 vines x three shoots x three leaves x four replicates) from five irrigation treatments of Cabemet Sauvignon grapevine from Lambert Vineyards, Niagara-on-the-Lake, ON, Legend: C-control (non-irrigated); PRD -partial rootzone drying (100% ETc); Full-conventional drip irrigation (100% ETc); RDI- regulated deficit irrigation (25 and 50 % ETc); 25, 50,100 % are the percentages of water replaced in the soil. V-vine size; Tleaf-Ieaf temperature; SM20-soil moisture at 20 cm depth, ",-leaf water potential; Ts-transpiration. 295
318 7 5 Biplot (axes Fl and F2: %) el00%prd TA 3 - '* Control 1.O 1 e CJ) c::i ~ -1 N LL Brix 2S%RDI ~520 SO%RDle 10~%Ful o Fl (63.03 %) Figure 6.8. Principal component analysis (Fl&F2) of soil water status, physiological data, yield components and berry composition means (10 vines x three shoots x three leaves x four replicates) from five irrigation treatments ofcabemet Sauvignon grapevines from Lambert Vineyards, Niagara-on-the-Lake, ON, Legend: C-control (non-irrigated); PRD -partial rootzone drying (100% ETc); Full-conventional drip irrigation (100% ETc); RDIregulated deficit irrigation (25 and 50 % ETc); 25, 50,100 % are the percentages of water replaced in the soil. V vine size, V-yield; CN- number of clusters per vine; C.W.-cluster weight; B/C-number of berries per cluster; B.W.- berry weight; neaf-ieaf temperature; SM20-soil moisture at 20 cm depth; 'l'l-leaf water potential; Tstranspiration; TA-titratable acidity; A520-absorbance at 520 nm; Anth.- anthocyanin content; T.Ph-total phenolics. 296
319 3 Biplot (axes Fl and F2: %) 2-1 q- 5%RDI. '* 00 lo N N IJ antral. Tleaf L v, ljj 50%RDISM20 100%Full %PRD F1 (55.19 %) Figure 6.9. Principal component analysis (Fl&F2) of soil and vine water status from five irrigation treatments of Cabemet Sauvignon from Lambert Vineyards, Niagara-on-the-Lake, ON, Legend: C-control (nonirrigated); PRD -partial rootzone drying (100% ETc); Full-conventional drip irrigation (100% ETc); RDIregulated deficit irrigation (25 and 50 % ETc); 25, 50, 100 % are the percentages of water replaced in the soil. Tleaf-Ieaf temperature; SM20-soil moisture at 20 cm depth, 'l'1-leaf water potential; Ts-transpiration. 297

320 1 Correlations with t on axes t1 and t o o t1 Figure PLS regression analysis of soil and vine water status, yield components and berry composition data from five irrigation treatments of Cabemet Sauvignon grapevine from Lambert Vineyards, Niagara-on-the-Lake, ON, V- vine size, Y-yield; CN- number of clusters per vine; C.wt.-cluster weight; B/C-number of berries per cluster; B.wt.- berry weight, Tleaf-Ieaftemperature; SM20-soil moisture at 20 cm depth, 'IIJ-Ieafwater potential; Ts-transpiration, TA-titratable acidity; A520-absorbance at 520 nm ;Anthoc.- anthocyanin content; T.Ph-total phenolics. 298

321 Red Fruit ASTRINGENCY, COOKED VEGI / CHOCOLATE " Tobacco / Chocolate! -. Control -+-loo%prd ---loo%full -+-SO%RDI... 2S%RDI i,/ icooked vegi /. Dark Fruit RED FRUIT Figure Radar diagram the mean intensity ratings of five Cabernet Sauvignon wines made from different irrigation treatments Lambert Vineyards, Niagara-on-the-Lake, ON, Aroma and flavor attributes are specified by lower and higher case letters respectively. Legend: C-control (non-irrigated); PRD -partial rootzone drying (100% ETc); Full-conventional drip irrigation (100% ETc); RDI- regulated deficit irrigation (25 and 50 % ETc); 25,50, 100 % are the percentages of water replaced in the soil. 299

 of sensory data means from five irrigation treatments of Cabernet")
; PRD -partial rootzone drying (100% ETc); Full-conventional drip")
322 10 Biplot (axes Fl and F2: %) SOUR CHERRY - 'or. LI1 LI1 00 N N LL A,Fuli. a Chocolate. Dark Fruit our Cherry -5 l!i ASTRINGENCY Tobacco Control..25%RDI a F1 (50.05 %) Figure Principal component analysis (F1&F2) of sensory data means from five irrigation treatments of Cabernet Sauvignon grapevine from Lambert Vineyards, Niagara-on-the-Lake, ON, Legend: C-control (non-irrigated); PRD -partial rootzone drying (100% ETc); Full-conventional drip irrigation (100% ETc); RDI~ regulated deficit irrigation (25 and 50 % ETc); 25, 50, 100 % are the percentages of water replaced in the soil. 300

323 1 Correlations with t on axes t1 and t ~=~~..w o tl Figure PLS regression analysis of soil and plant water status, yield components, berry and wine composition and sensory data from five irrigation treatments of Cabemet Sauvignon grapevine from Lambert Vineyards, Niagara-on-the-Lake, ON, V- vine size, V-yield; CN- number of clusters per vine; C.wt.-cluster weight; B/C-number of berries per cluster; B.wt.- berry weight; Tleaf-Ieaftemperature; SM20-soil moisture at 20 cm depth, 'l'l-leaf water potential; Ts-transpiration, V-vine size; EtOH- ethanol; TA-titratable acidity; A520- absorbance at 520 nm; Anthoc.- anthocyanin content; T. Ph-total phenolics. 301
324 Chapter 7 Impact of Water Status Level on Abscisic Acid and its Catabolites Profiles in Leaves and Berries from Two Grape Cultivars Abstract. To understand the relationship among soil and plant water status, plant physiology and the hormonal profiles associated with it, abscisic acid (ABA) and its catabolites [phaseic acid (PA), dihydrophaseic acid (OPA), 7-hydroxy-ABA (TOH-ABA), 8' hydroxy-aba, neophaseic acid and abscisic acid glucose ester (ABA-GE)] were analyzed in leaves and berries from two different grapevine cultivars (Baco noir and Chardonnay) during the growing seasons 2006 to 2007 using liquid chromatography with ion trap combined with electrospray ionization-mass spectrometry. An irrigation trial was set up in one commercial vineyard, located in Niagara-on-the-Lake, ON, Canada. Baco noirtrial consisted of 10 treatments: control (non-irrigated), plus three water levels (100,50 and 25% replacement of crop evapotranspiration), factorially combined with three timings of irrigation imposition (fruit set, lag phase and veraison). Chardonnay field trial consisted in seven treatments: control (non-irrigated), plus three water levels (100,50 and 25% of crop evapotranspiration) combined with two timings of irrigation imposition (fruit set and veraison). ABA, ABA-GE, OPA and 7-0H-ABA were found in amounts enough to be detectable at all sampling dates, while phaseic acid (PA) was found in small amounts only at some sampling dates. The hormonal - profile indicated a direct relationship between ABA and climatic factors. The hormonal profiles were different under the same climatic conditions for the two cultivars. The ABA varied between 582 to 4026 ng/g dry matter (OM), OPA between 417 to 562 ng/g, and ABA-GE between 337 to 2764 ng/g OM. PA at many sampling times was undetectable in the leaves, and its highest concentration (260 ng/g OM) was found at beginning of July in In Chardonnay, the hormonal profile showed less temporal variation in 2006 than in The trend for ABA and its catabolites in Chardonnay was almost the same as Baco noir in both years, but the magnitude among the treatments was different. ABA followed different catabolic pathways depending on the plant water status. ABA was likely catabolized by conjugation to form ABA-GE in treatments under higher levels of water deficit, while in treatments with high water status, the oxidation pathway leading to OPA or PA was likely preferred. The ABA and ABA-GE concentrations in the berries at harvest showed high correlation with soil and plant water status. Introduction When soil water availability falls below a certain level, both the root water potential and turgor reach very low values, stimulating the synthesis of several plant growth regulators including abscisic acid (ABA) (Wright 1977). Many plants regulate stomatal aperture and leaf growth rates independently of hydraulic signals (Comstock 2002), this being the result of some chemical regulators generated by the interactions between the root (or the leaves) and the drying soil (or air) (Zhang and Davies 1989). Other theories state that the production of ABA occurs in leaves and another signal than ABA transmits the drought stress response from roots to leaves. This unknown "root-to-ieaf' long distance signal in turn causes the production of ABA in leaves (Christmann et al. 2005). However, almost all cells can synthesize ABA and transport it through the plant via both xylem and phloem (Cutler and Krochko 1999). ABA must accumulate to a high concentration in 302
325 order to act on its target cells to close stomata or to reduce the leaf growth (Dodd and Davies 1996, Loveys 1984). However, the strength of ABA signal perceived at its final site of action does not always reflect the coarser measurements of ABA concentration (Zhang and Outlaw 2001). Approximately 0.1 ~M ABA occurs in the xylem sap of a well watered plant (Trejo et al. 1993). Moreover, the same author indicated that if this entire amount reaches the guard cells, the stomata would be permanently closed and the plant would not survive. Computer simulation predicts that even well watered plants contain enough ABA to accumulate at the guard cells to a concentration high enough to close the stomata (Slovik and Hartung 1992). This prediction is supported by the physico-chemical properties of ABA. ABA is a weak acid with a pka of 4.8, and it exists in two forms (lipophilic free acid and the lipophobic anion) depending on the proton concentration. While the free acid permeates biomembranes easily, ABA is almost completely non-permeant (Heilmann et al. 1980, Kaiser and Hartung 1981). This leads to an intracellular ABA distribution according to the anion trap concept (Wilkinson and Davies 2002). Consequently, alterations of ph gradients cause changes in the intracellular distribution of ABA, as follow: ABA concentrations increases in alkaline compartments, e.g. the cytosol and the stroma of chloroplasts, while ABA depletes in compartments of low ph such as the vacuole and apoplastic compartments (Hartung et al. 1982). The accumulation of ABA to physiologically active concentrations in the leaf apoplast (adjacent to the guard cells) is directly related to the ph of apoplast (Hartung et al. 1998). ABA plays primary regulatory roles in the initiation and maintenance of seed and bud dormancy, and in the plant response to stress (Koussa et al. 1994). In water stressed plants, ABA not only maintains root growth rates (Munns and Sharp 1993), but it also increases the root hydraulic conductivity by modifying the root membrane properties (Glinka and Reinhold 1971). ABA also affects leaf morphology. The stomata of the plants grown under water stress (that have high ABA concentrations) are smaller than those of well-watered plants (Xia 1994). ABA also induces reductions in leaf and stem growth rates, reduces the leaf surface area, and preserves the water by closing stomata (Zhang and Davies 1990). ABA also accelerates senescence of leaves, while ethylene induces their abscission (Zacarias and Reid 1990). ABA operates at molecular level by regulating gene transcription, protein synthesis, signaling pathways, ion and organic molecules transport, and the production of metabolites important in drought stress tolerance such as: sucrose, trehalose, sorbitol, mannitol, proline, glycine, betaine, and polyamines (DeLuc et al. 2009, Sauter et al. 2001). These metabolites accumulate under drought stress, and function as osmolytes, antioxidants or scavengers that help plants to avoid and/or tolerate stresses (Bartels and Sunkar 303
326 2005). The changes in these metabolites at cellular level are thought to be associated with protecting the cellular function or with maintaining structure of cellular components (Seki et al. 2007, Yang et al. 2006). ABA is a key component of the signal transduction pathway for the stomatal closure (Leung and Giraudat 1998). The concentration of the active forms of ABA in plant tissue is a complex process, and depends not only on the relative rates of biosynthesis, catabolism, transport and redistribution of ABA within leaves, but also on the synthesis and transport from the roots (Zhang and Outlaw 2001). Measurements of extracted ABA usually reflect only a 'snapshot' of the effect of these processes, and provide little information about flux, cellular or subcellular distribution and/or the potential for rapid change (Cutler and Krochko 1999). By perturbing either ABA synthesis or its degradation, it has been possible to gain some sense of the relative contribution of each of these processes in maintaining ABA concentrations, and consequently in the downstream physiological processes in plant tissues (Cutler and Krochko 1999). Many studies showed that ABA is rapidly turned over in plants (Feurtado et al. 2004, Huang et al. 2008). Therefore'measurement of ABA concentration alone is not enough, giving limited information on the total amount of ABA produced over time, and on the potentially active products resulting from ABA catabolism, especially under stress conditions (Owen et al. 2009). There are several metabolic pathways by which ABA can either be removed or degraded in plant tissues (Cutler and Krochko 1999). ABA is rapidly turned over by plant enzymes (Huang et al. 2008), either by oxidation or by conjugation to abscisic acid glucose ester (ABA-GE) that represents an inactive pool of ABA (Dietz et al. 2000, Nambara and Marion-Poll 2005). The principal catabolic pathway of ABA is by oxidation of the 8'-carbon atom leading to an unstable intermediate 8' -hydroxy ABA (8'OH ABA), which is reversibly cyclized to phaseic acid (PA) or farther reduced to dihydrophaseic acid (DP A) (Zeevaart and Creelman 1988). Either PA or DPA are the main metabolites of ABA which accumulate in different plant cells and tissues (Walton and Li 1995). The early oxidation products [8'OH ABA, (-)-PA and (+)-7'OH ABA] retain and exert significant ABA-like activity (Zou et al. 1995). However, in contrast with the activities of these initial ABA-metabolites, DPA does not exhibit ABA-like activity in any of the standard protocols, and DPA seems to be the fully inactivated form of ABA (Walton and Li 1995). Oxidation at different ring methyl groups of the ABA molecule led to more ABA catabolites: TOH ABA and 9'OH ABA. The latter can cyclize reversibly to neophaseic acid (neopa) (Zaharia et al. 2005). For a long time, the conjugation pathway was not considered an important catabolic pathway of ABA. ABA-GEcould act as a reservoir of ABA in grape berries (Kondo and Kawai 1998). Unlike free 304
327 ABA, ABA-GE is lipophobic and unable to cross the lipid cell membranes between the xylem and its surrounding tissues. The cleavage of glucose-conjugated ABA by an ABA-specific J3- glucosidase, AtBGl, is a new way to produce bioactive ABA in response to dehydration stress. Thus, ABA-GE could represent an inactive storage form of ABA in plants (Lee et al. 2006). Since under certain circumstances the ABA-GE from xylem could be the major method of translocation of the ABA signal, simple measurements of ABA from xylem do not always reflect the amount of the antitranspirant potentially present in the xylem stream. Evidence exists for the presence of a root-sourced chemical signal other than ABA, which is responsive to soil water potential (Munns and King 1988). Synthesis of the ethylene precursor 1- aminocyclopropane-l-carboxylic acid (ACC) increases in roots in response to stress (Gomez Cadenas et al. 1996), and it is transported to shoots where the ethylene released from ACC can induce the ABA synthesis (Grossmann and Hansen 2001). Different experimental conditions, species and cultivars used in ABA studies led to contradictory results in some cases (Coombe and Hale 1973, Davies et al. 1997, Inaba et al. 1976, Scienza et al. 1978, Wheeleret al. 2009). The techniques used to measure ABA in plant tissues have been improved greatly over the years. Earlier methods employed ethanol extraction followed by thin layer chromatography (Coombe and Hale 1973) and ethyl-acetate-methanol extraction followed by gas-liquid chromatography (GLC) (Downton and Loveys 1978), GC-mass spectrometry (MS) or LC/MS-MS techniques (Owen et. al. 2009, Soar et al. 2006). This study, which profiled ABA and catabolites in leaves and berries under different water status levels, over the vegetation period, was undertaken to understand the relationship between vine water status and ABA metabolism. In this study, the response of Baco noir and Chardonnay grapevines to water deficit was evaluated. Since they have different genetic background, tolerances to water deficits, and short vegetation periods, it was expected that there would be distinct differences in their metabolic responses to water status as well. It was hypothesized that the ABA and its catabolites profiles would vary in leaves and berries during the vegetation period, and could accurately reflect the water status level. Materials and Methods Experimental design and plant material. The field trials were conducted at Lambert Vineyards, Niagara-on-the-Lake, ON, Canada(43 13'N, 79 08'W). The experimental design and the irrigation protocols used were described in detail for both cultivars in Chapters 3a and
328 Vine water status. To monitor vine water status, biweekly observations were conducted over the growing season. Midday leaf water potential ('P), transpiration (Ts), and leaf temperature data were collected from mature leaves that were fully exposed to the sun between 1030h and 1400h. The instruments and protocols used to collect vine water status were described in detail in Chapters 3a and 4. Soil water status. Soil moisture data was collected over a period of two years 2006 and 2007, respectively. The instruments and protocol used for data collection were described in detail in Chapters 3a and 4. Fruit composition and yield components. Yield components were recorded from each experimental vine for both cultivars studied. The protocol used was described in detail in Chapters 3a and 4. Fruit composition was determined using methods described in the previous chapters. ABA and catabolites analyses. Sample preparation. Leaf samples for ABA analysis were collected during 2006 and 2007 seasons. A total of nine leaves from each treatment replicate were collected from three vines. The leaves were collected biweekly before irrigation treatments were initiated, from the same vines from which vine water status data were collected. In 2006, leaf sampling was performed on the following dates: 6 July, 20 July, 3 August, 17 August and 31 August, while in 2007 sampling occurred on 5 July, 19 July, 2 August, 16 August and 30 August. In both seasons, the first sampling date was two weeks after the irrigation treatments were initiated (fruit set). The leaves were immediately introduced into cryogenic vials (pre-weighed), kept in liquid nitrogen, and transported tothe Brock University, Viticulture Laboratory, where they were prepared for future analysis. The contents of each vial were weighed, grounded under liquid nitrogen into powder, and lyophilized. The dry material was kept in sealed vials, in the dark and at -30 C. Berry samples for hormone analyses were collected in both years at veraison and at harvest. A total of 25 berries were collected randomly from each treatment replicate. Berry samples collected for ABA and catabolites analysis were weighed and peeled, while frozen, and separated into skin and pulp plus seed fraction. All sample fractions were grounded using a mortar and pestle under liquid nitrogen. The powdered samples were lyophilized and then kept at -30 C and dark, until extraction was performed. A mixture of deuterium-labeled internal standards (IS) was added to approximately 0.1 g of each dried fraction, together with 3 ml of extraction solvent (isopropanol: water: acetic acid; 80:19:1). The solution was vortexed and allowed to extract for 24 hr while shaken at 380 rpm on an 306
329 orbital shaker placed in a 4 C refrigerator. After extraction, the samples were vortexed again, centrifuged, and then the supernatant was transferred to a 15-mL glass tube. Thls extract was dried on a BUchi MultivapoiM (BUchi, Flawil, Switzerland) at 30 C and 280 rpm, and under vacuum reduced from 900 to 25 mbar over 1 hr, after which it was held at 25 mbar until dry. The dried extract was subjected to clean-up by mixed-mode cation exchange solid-phase extraction using two different type of cartridges Oasis MCX and lll..b (Waters Corporation Canada, Mississauga, ON). The dried extracts were re-dissolved in 100 J.1L methanol (MeOH): acetic acid (AcOH) (99:1) and made up to 1 ml in H 2 0: AcOH (99: 1). The cartridges were first prepared by washing and equilibrating with 1 ml MeOH: AcOH (99:1) and 1 ml H 2 0: AcOH (99:1), respectively, before loading the sample. The drip rate was kept to approximately one drop every 1 to 2 seconds. The sample was washed with 1 ml H 2 0: AcOH (99:1) and eluted into a second microcentrifuge tube using 1 ml H 2 0: Acetonitrile (CAN): AcOH (69:30:1). This final extract was dried down in a BUchi MultivaporTM (BUchl, Flawil, Switzerland) at 25 C and 280 rpm, and redissolved in 100 of the reconstitution solvent before high performance liquid chromatography-mass spectrometry (HPLC-MS) analysis was performed. The analyte was moved into 200-IlL glass insertion placed in chromatographic vials. Sample analysis. To process and analyze the ABA hormone and its catabolites in the berry and leaf samples, an existing HPLC-MSIMS method was used for analyzing ABA and its metabolites in Brassica, Arabidopsis and conifer seeds (Feurtado et al. 2004, Ross et al. 2004, Zhou et al. 2003), and adapted for use with grape berries (Owen and Abrams 2009). All samples were analyzed using an Agilent 1100 series LC system, diode array detector coupled with LC-MS HCT (High Capacity Trap) Ultra (Bruker Daltonics, Bremen, Germany) equipped with a Z-spray electro spray (ES) ion-source. The MS was controlled by Compass QuantAnalysis v.2.0 software (Bruker Daltonics, Bremen, Germany). HPLC conditions included a Genesis C18 analytical column (2.1 x 100mm, 4 11m; Chromatographic Specialties, Brockville, ON) with an Opti-Guard C18 guard column (1 mm, Optimize Technologies, Oregon City, OR), a column temperature of 25 C, an injection volume of 5 ill, and solvents acetonitrile/ milli-q water/ 0.1 % aqueous formic acid in order to create a gradient as shown (Table 7.1). For equipment optimization a full scan MS run on the mix of deuterated standards. Mass spectrometry was carried out using negative electrospray ionization (ESI) and multiple reactions monitoring (MRM). For calibration purposes deuterated standards were used (Plant Biotechnology Institute, Saskatoon, SK). Injections of 5 and were performed in order to check linearity and component sensitivity. The ion trap mass spectrometer was operated in negative ion mode with MRM 307
330 scanning from125 to 440 Daltons. The ESI (negative) parameters were as follows: capillary +4000V; end plate offset -500V; nebulizer: 40.0 psi; dry gas 10.0 Llmin.; dry temp: 350 C; nebulizer and drying gas: dry nitrogen; collision gas: Helium; trap drive ; skimmer: -40.0V; cap exit: V, MRM transitions and time retention as shown (Table 7.2). Data analysis. Chemical data were analyzed using SAS statistical package (SAS Institute; Cary, NC, USA). Using GLM, analysis of variance was performed on physiological and chemical data. Principal components analysis (PCA) was performed on the means of field data and chemical data, using XLSTAT 2008 (paris, France). Duncan's multiple range test was used for means separation for all data sets (field and chemical), and Dunnett's t-test was used to determine those treatment means that were statistically different from the control at a significance level of (1::;0.05. Results ABA and catabolites prof"des. Baco noir leaves (Figs. 7.1A1 to A3: 7.2A4. AS). On the first sampling date, there was a clear separation between treatments initiated at fruit set and the other treatments based on the ABA concentration (Fig. 7.1A1). The ABA was almost double in the non-irrigated treatments than 50 and 100% ETc initiated at fruit set. However, in 25% ETc, ABA concentration was not different than non-irrigated treatments (Fig. 7.lA1). PA was higher in 100% ETc initiated at fruit set compared with the non-irrigated and the other irrigation treatments initiated at fruit set. The ABA catabolites did not show a constant pattern among the treatments at first sampling date. However, 7'OH-ABA was the lowest in all treatments compared to the other catabolites. PA, DPA and ABA-GE showed little variation among treatments, being found almost in the same range across the treatments. DPA and PA were found in higher amounts than ABA-GE across the treatments with some exceptions. On the second sampling date, ABA followed almost the same pattern as that in the first sampling date; however the amount of ABA increased significantly compared to that found at first sampling date (Fig. 7.1A2). The ABA concentration increased slightly in all treatments. ABA-GE increased in all treatments except those where water was applied. Except for 100% ETc started at fruit set, DPA and PA showed a switch in all other treatments, being found at lower concentrations than ABA-GE. 7'OH-ABA showed little variation between treatments. On the third sampling date, the accumulation pattern of ABA and its catabolites was very different from previous sampling time, the amount of ABA dropped below of that found at the fitst sampling date (Fig. 7.1A3). This apparent change coincided with high rainfall from the previous week. The magnitude of difference between treatments in terms of ABA concentration decreased, 308
331 while DP A and P A concentration increased substantially in some irrigated treatments, being almost double than the ABA-GE (Fig. 7.1A3). TOH-ABA also increased, and reached in some cases the ABA-GE concentration level. On the fourth and fifth sampling dates, there was a clear separation of the irrigated treatments based on the ABA and its catabolites profile (Figs. 7.2A4 and AS). The ABA concentration decreased in 100% ETc treatments compare to the control. However, 2S% ETc treatments had almost the same content of ABA as the control. ABA-GE decreased slightly in the irrigated treatments compared to control. At the last two sampling dates the lowest concentration of ABA-GE was recorded in 100% ETc treatments. An interesting observation was found at the last two sampling dates in 100% ETc treatment applied at veraison, where ABA, PA and DP A were found almost at the same concentration. DPA and PA increased in the 100% ETc treatments, their concentration almost doubled than the ABA-GE (Figs. 7.1A4, AS) 2007 (Figs. 7.1Bl to B3; 7.2B4, BS). The 2007 season was the hottest and driest year in the experiment, and subsequently the pattern of ABA and its catabolites did not show much variation throughout the growing season compared to 2006 season. At the first sampling date the ABA concentration in the control was almost 4.S-fold higher than in the similar treatment at the same sampling date in 2006, which was considered a wet year (Fig. 7.1Al, Bl). Slightly higher or lower variation was observed in the other treatments, except for those initiated at fruit set (Fig. 7.1Bl). Compared to 2006 at the same sampling date, the difference between ABA concentration and the other catabolites was far more impressive. The DPA and TOH-ABA concentration was almost 7.5-fold lower than the ABA concentration and consistent in all the treatments (Fig. 7.1Bl). From all the catabolites analyzed, ABA-GE was present in the highest amount and close to the ABA concentration. Contrary to the results found in 2006, P A was not found in the leaves at a detectable level, at the first sampling date (Fig. 7.1Bl). On the fust sampling date the profile of ABA and its catabolites in the irrigation treatments imposed at fruit set was different than control and all other treatments. The ABA concentration in 100% ETc and SO% ETc initiated at fruit set was approximately fivefold lower than that one found in the control in 2007, and very close to that one found in the control in 2006 at the same sampling date. An interesting observation was that all catabolites were low in the irrigated treatments, which suggests that translocation rather than different catabolic pathway was predominant. On the second sampling date, the profile was almost identical with that one found at the first sampling date (Fig. 7.1B2). However, ABA-GE had a slightly decreasing trend in all treatments. ABA and ABA-GE continued to be predominant in the profile, with slight variation across the treatments. On the third sampling date, the ABA profile pattern was similar to the previous sampling dates (Fig. 7.1B3). However, both ABA and ABA-GE 309
332 concentrations decreased by almost 30% in all treatments. In contrast with the previous sampling date, there was a slight increase in DPA and TOH-ABA. PA was found for the first time at a detectable level and higher even than DP A concentrations in On the fourth sampling date, there was a good separation of all irrigation treatments based on the hormone profile, not only between the treatments with different regimes of water applied but also between times of initiation (Fig. 7.2B4). ABA and ABA-GE concentrations showed slightly higher values at 25% ETc compare to both 50 and 100% ETc in all treatments. In the 100% ETc treatment initiated at fruit set there was a higher DPA concentration than ABA. However, DPA was overall higher than TOH-ABA and PA across the treatments. On the fifth sampling date, which coincided with the highest water deficit in the soil, the ABA and ABA-GE showed higher values in all treatments than those found at previous dates (Fig. 7.2B5). The highest magnitude difference in the hormonal profile was observed between 100% ETc initiated at fruit set and the control. At this stage, P A and neopa were non-detectable. Baeo noir berries (Figs. 7.3 to 7.6.). The ABA and its metabolites profile were determined in skin and pulp at veraison and harvest time in both years of the experiment. In 2006, all the ABA catabolites found in leaves were detected in both berry fractions. At veraison, the highest concentration of ABA was found in the skin, in the non-irrigated berries (Fig. 7.3A). However, 25 and 50% ETc treatments had consistently higher ABA concentration than 100% ETc, with the highest values on treatments initiated at veraison. The lowest concentration was that of TOH ABA, which was consistent across the treatments. ABA-GE had almost the same pattern as ABA across the treatments. The 100% ETc treatment had lower concentration at all irrigation initiation times compared to the control, 50 and 25 % ETc treatments. Unlike the hormonal profile in leaves, PA and DPA were found at higher concentrations and consistent across the treatments. In 2006, at harvest the ABA concentration decreased significantly in the berry skin (Fig. 7.3B). In nonirrigated berries, the ABA amount was 3-fold less than that one found at veraison. However, ABA showed little variation in skin among treatments at harvest, with one exception in 25% ETc treatment initiated at veraison when its concentration was abnormally low (Fig. 7.3B). At harvest, the ABA pattern in the skin was not similar to that one at veraison. In contrast with the skin profile at veraison, there were high concentrations ofpa, and DPA in all treatments at harvest; DPA concentration was much higher than PA, and in some treatments almost double than ABA-GE (Fig.7.3B). At veraison, the ABA profile in the pulp showed almost the same profile as in the skin, but the concentration was much lower (Fig. 7.4A). ABA was consistently higher across the treatments than the other catabolites, except 100% ETc initiated at lag and veraison. DPA was constantly 310
333 higher than ABA-GE in most of the irrigated treatments, except for control and 2S% ETc treatments. At harvest, ABA decreased in pulp almost 3-fold relative to veraison time sampling (Fig. 7.4B). At this stage, the DPA increased consistently, having the highest values in the 100% ETc treatments. ABA-GE was consistent in the pulp across the treatments but lower than ABA and DP A. Although, ABA was much lower in the pulp across the treatments at veraison, the control and all the deficit irrigation treatments still had higher concentrations than 100% ETc (Fig. 7.4B). In 2007, the ABA concentration in the skin at veraison was the highest in the control and 2S% ETc initiated at veraison (Fig. 7.SA). However, 100% ETc treatments had the lowest ABA concentration across the treatments. ABA concentration did not show much variation among the treatments. The ABA-GE was found at the highest concentration in the control treatment while in the other treatments the concentration was much lower. A distinct pattern was seen between the treatments, with ABA-GE increased slightly from 100% ETc to 2S% ETc, while DPA decreased in the same order. No PA or neo PA was found in the skin. At harvest, ABA and ABA-GE had almost the same pattern (Fig. 7.SB). However, ABA-GE had lower concentrations than ABA. An interesting observation was that DP A increased in the skin at harvest time in almost all treatments when compared to the other catabolites studied. In some treatments, DP A concentration was.much higher than ABA. ABA showed a steadily increasing trend from 100% ETc treatment initiated at fruit set to 2S% ETc treatment initiated at veraison. ABA-GE had the same pattern as the veraison treatments but the concentrations were slightly lower (Fig. 7.SB). In the pulp, all catabolites were found at lower concentrations than in the skin (Fig. 7.6A). The pattern found in the pulp in 2007 was different than that one found in 2006 (Fig. 7.6A, B). ABA concentration in non-irrigated berries at veraison was almost 2.2-fold higher than in nonirrigated berries at harvest time. The ABA and its catabolites profiles in the pulp had a different pattern than that one found in the skin. Characteristic for this fraction was the high concentration of ABA-GE in almost all the treatments at both stages veraison and harvest, and in some treatments more even than ABA (Figs. 7.6A, B). However, ABA-GE pattern was not consistent based on the irrigation initiation time. DPA was much lower than ABA and ABA-GE across the treatments and at both sampling times. Another interesting observation was the highest variation among pulp samples for ABA and ABA-GE, observation that was not found previously. Chardonnay leaves (Figs. 7.7Al to A3: 7.8A4. AS). As a general pattern, ABA and its catabolites were found at lower concentrations than in Baco noir leaves at similar sampling dates. At the first sampling date ABA was highest in the control and lowest in the 100% ETc initiated at veraison, and increased slightly in the SO and 2S% ETc (Fig. 7.7Al). This was contrary to the expectations, since no irrigation was applied at first sampling date in treatments scheduled to 311
334 be applied at veraison. Unlike of the profiles in Baco noir, DPA and PA were found at higher concentrations than ABA-GE in almost all the treatments. ABA-GE was consistent across the treatments. On the second sampling date, ABA increased slightly (Fig. 7.7A2). The same pattern as at first sampling date was observed for all other catabolites. DPA and PA concentrations were lower than ABA in 25 and 50% ETc while in 100 % ETc PA and DPA were consistently higher than ABA and ABA-GE. On the third sampling date the pattern showed little variation than at the previous sampling date. The most changes occurred in treatments initiated at veraison. ABA concentration decreased in all treatments initiated at veraison (Fig. 7.7A3). On the fourth sampling date, the hormonal profile was different than those from previous sampling dates (Fig. 7.8A4). The ABA concentration was the highest in the control followed by treatments where deficit irrigation was applied, with one exception in 25 % ETc applied at fruit set where ABA concentration was abnormally low. ABA-GE concentration had the same pattern in treatments initiated at fruit set and veraison, with an upward trend from 100% ETc to 25% ETc. DPA was consistently higher than ABA across the treatments with few exceptions. The trend was steadily increasing in treatments where deficit irrigation was applied, and it was almost in the same range as that one found in the control. On the fifth sampling date, ABA was still found at high concentrations in the control and 25% ETc (Fig. 7.8A5). The pattern found was more consistent across the treatments. Except for 25% ETc initiated at veraison, where ABA-GE was still higher than both the DPA and PA, the ratio among these catabolites switched in all other treatments. Interestingly, DPA concentration was found in 100% ETc treatments much higher than ABA and the other compounds studied at both initiation times (Figs. 7.7BI to B3: 7.8B4. B5). In 2007, the hormonal profile in Chardonnay leaves looked different than that one from At first sampling date, ABA concentration was lower compare to that one found in Baco noir leaves at the same sampling date. The highest ABA concentration was found in non-irrigated leaves, almost 2.5-fold higher than that one found in the same treatment in 2006 (Fig. 7.7BI). The hormonal profile pattern was almost similar in treatments initiated at fruit set and veraison. Interestingly, ABA and ABA-GE were predominantly in the profile across the treatments; PA, DPA and TOH-ABA had consistently low concentrations across the treatments. However, the ABA profile showed the same trend, lowest in 100% ETc and slightly higher in 50% ETc and 25% ETc (Fig. 7.7B1). On the second sampling date PA increased in almost all treatments. However, it was found at a lower concentration than ABA-GE, except in 100 % ETc treatments (Fig. 7.7B2). The ABA concentration in the 25% ETc was slightly higher than the control. DPA and TOH-ABA showed just a little variation among treatments. On the third 312
335 sampling date ABA showed a downward trend in all treatments except 25% ETc initiated at veraison (Fig. 7.7B3). ABA-GE showed little variation than at previous sampling date. However, the pattern was similar to that one found in Baco noir, showing a distinct separation between 100% ETc imposed at both fruit set and veraison, and the control. On the fourth sampling date ABA and ABA-GE increased considerably, both of them being found at the highest concentration in 2007 season (Fig. 7.8B4). PA was not detectable in any treatment while DPA was found slightly higher in the irrigated treatments initiated at veraison. However, the hormonal profile pattern was not consistent across the treatments. On the last two sampling dates, ABA concentration followed the same trend as that one found on the other sampling dates, being highest in the control and 25% ETc, and much lower in 100% ETc (Fig. 7.8B5). Chardonnay berries (Figs to 7.12A and B). The hormonal profile found in the skin was different at veraison than that one found at the harvest time (Fig. 7.9A, B). The highest magnitude of difference in terms of ABA concentration was found between the control and 100% ETc initiated at fruit set. Irrigated treatments initiated at veraison had a consistent ABA pattern. ABA-GE was almost 2-fold less than ABA across the treatments with few exceptions (Fig.7.9A). DPA concentration was close to that of ABA-GE in almost all the treatments, except for the nonirrigated and 25% ETc treatments. PA and 7'OH-ABA were found in small amounts, and were consistent across all treatments. At harvest, the ABA concentration in the skin decreased compare to that one at veraison (Fig. 7.9B). The amount of ABA found in the non-irrigated berries was 3- fold lower than at veraison. The same trend was also found in the ABA-GE which was almost 5- fold less in non-irrigated compare to the same treatment at veraison. An important observation was the impressive amount ofpa found in the skin at harvest. However, DPA also increased but in a smaller percentage than P A. In 2006, the ABA concentration found in the pulp at veraison was much lower than that one found in the skin (Fig. 7.IOA). The amount of ABA did not show important variation among the treatments, except in 100% ETc initiated at veraison. DPA and P A were found in most of the treatments at a higher concentration than the ABA-GE. The other two compounds studied were found in small amount, and a constant concentration throughout the experimental treatments. At harvest, the hormonal profile was different in the pulp compare to that one found in the skin at the same stage (Fig. 7.IOB). ABA concentration was still the highest compared to the other catabolites in all treatments except for the 100% ETc. ABA-GE increased in the treatments initiated at veraison, but the pattern was not consistent across the treatments. PA and DP A were lower than ABA and the other catabolites in all treatments, except 100 % ETc (Fig. 7. lob). 313
336 2007. In tenns of ABA concentration, the pattern in the skin was very close to that one found in 2006 (Fig. 7.IIA, B). However, there was a better discrimination of the treatments based on this compound. Overall, at veraison ABA concentration was higher than in previous season in all treatments. The 25% ETc treatment at veraison had the highest ABA concentration and very close to the control (Fig. 7.IIA). PA was not found at a detectable concentration. DPA showed little variation, being found at higher concentrations in the irrigated treatments but less than ABA GE. At harvest, the amount of ABA in the skin decreased but less significant than in 2006 (Fig. 7.11B). DPA did not show the same trend as in 2006, being found in higher concentrations in 100% ETc treatments. Overall, all the catabolites decreased in the skin at veraison. DPA was higher than ABA-GE in all treatments except 50% ETc applied at veraison (Fig. 7.11B). In 2007, ABA concentration was much higher in the pulp at veraison than that one found in 2006 at the same sampling date (Fig. 7.12A). A lower concentration was found in the 100% ETc treatments compared to non-irrigated berries or with the deficit irrigated treatments. PA was not found in the pulp at any sampling date. DPA showed a slightly increased trend in the deficit treatments being detected in a smaller amount than ABA-GE across the treatments. At harvest, ABA decreased in pulp in all treatments compare to the previous sampling date (Fig. 7.12B). The same trend was observed for ABA-GE. However, it was not observed a consistent pattern across the treatments. DPA showed an upward trend in all treatments. However, only in 100% ETc the concentration was 2- to 3-fold higher than the ABA-GE (Fig. 7.12B). Relationships among ABA and its catabolites, soil and plant water status, yield components and berry composition. Baco noir (Fig 7.13). PCA was performed on field and chemical data. There were noteworthy correlations among the different variables. The first two factors explained 60.53% of the variability in the data set, whereas factor 1 accounted for 43.09% of the variability and factor 2 only for 17.44%. There was a good separation of the treatments based on the amount of water applied. The 100% ETc treatments were grouped on the right side of the plane while the control and 25% ETc treatments were grouped on the left side of the plane. RDI treatments with low water status were positively associated with ABA in the leaves and skin at veraison while PA and DPA were mostly associated with treatments with high water status (100 % ETc). ABA-GE in leaf and berry skin were positively correlated with each other, and negatively correlated with soil moisture at 60 cm depth. ABA concentration in the leaves was negatively correlated with soil moisture at 20, 40 and 100 cm depths (Fig. 7.13) (Figs and 7.15). The PCA offield and honnone data from Baco noir showed that the first two factors explained 63.28% of the variability in the data set. The first component explained 44.40% and the second one only 18.88% (Fig. 7.14). There was a clear separation of the 314
337 treatments based on the water status level. Separation between the times of imposition was obviously for 100% ETc, and not for the other deficit irrigation treatments. However, 100% ETc initiated at fruit set was located on the left upper quadrant while the other two full replacement treatments were in the lower left quadrant. This indicated that the later treatments were under some degree of water stress during the growing season. DPA in leaves and skin berries were highly associated with high water status. They were highly negatively loaded on the first component, along with Ts and leaf 'V. ABA and most of its catabolites in leaves and berry skin were highly positively loaded on the first component, being negatively correlated with Ts and leaf 'V. This might support the hypothesis that ABA is one of the main compounds involved in stomatal regulation. However, ABA and its catabolites in berry pulp did not show a strong relationship with the water status level, and some of them were not explained by the first two components. The ABA concentration in skin at harvest was negatively correlated not only with soil moisture at 20 and 100 em depth but also with TOH-ABA in the skin. The ABA concentration in leaves was negatively correlated with soil moisture at 40 and 60 em depth, and positively correlated with ABA catabolites in berries. Another PCA was performed on soil and plant water status, berry chemical composition and berry skin hormone composition (Fig. 7.15). The first two factors explained % of the variability in the data set. The first component explained 43.77% and the second one 18.54% (Fig. 7.15). Color intensity, anthocyanins and OSrix were positively correlated with ABA and ABA-GE concentration in the skin at veraison. All these variables were negatively loaded on the PC1, and highly associated with water deficit treatments. However, it was not a clear distribution of the treatments based on the amount of water used or initiation time. Chardonnay (Fig. 7.16): PCA was performed on field and lab data. The diagram showed a high degree of correlation among variables. The first two factors explained % of the variability in the data set, whereas factor 1 accounted for % of the variability and factor 2 for % (Fig. 7.16). ABA concentration in berries at veraison and harvest was positively correlated with that one found in the leaves. ABA was also positively correlated with Brix, and negatively correlated with soil moisture at 60 em, DPA concentration, and the number of clusters per vine. No strong correlations were found between soil water status and the hormonal profile in However, there was a clear separation of treatments based on both water status and irrigation time initiation. The 100% ETc treatments were located on the left side of the plane while the control and 25% ETc treatments were located on the right side of the plane, being associated with both the ABA and ABA-GE concentrations. 315
338 2007 (Figure 7.17). The PCA was performed in 2007 on the same variables as in The PCA plot indicated that factors 1 and 2 explained 63.72% ofthe variability in the data set. There was a better separation of the irrigated treatments in 2007 than in The treatments initiated at fruit set are located in the upper plane while those initiated at veraison are located in the lower plane. There was also a separation based on the amount of water used. The 100% ETc treatments were grouped on the right side of the plane while the deficit irrigation treatments were located on the left side of the plane. ABA concentration in leaf was highly correlated with transpiration, berry weight, and negatively with leaf'll, Brix and soil moisture at 60 and 40 cm depth. ABA in the berries was positively correlated with ABA-GE both at veraison and harvesting time. Moreover, they were negatively correlated with yield, vigor, number of berries per cluster, DPA and PA concentration. On the other hand, ABA concentration in the berries and leaves at veraison were positive correlated with berry weight,and negatively correlated with soil moisture at 40 and 60 em, Brix and TOH ABA. Discussion Field experiments are affected by climatic factors such as temperature and rainfall or soil variation, that cannot be controlled (Alleweldt and DUring 1972). Moreover, their effects on grapevines are a result of their interaction, which makes the process more complex. The factors affecting ABA accumulation are obviously complex, and a better understanding of both ABA synthesis and degradation/sequestration is required to better define and predict these interactions in grapevine. Increases of ABA concentration in V. vinifera (cv. Sultanina) leaves from vines under water deficit conditions have previously reported (Loveys and Kriedemann 1974). These authors found massive accumulations of ABA and high stomatal resistance at leaf'll of -1.3 MPa, following a drying period of several days. These findings are in agreement with results from the present study which showed high accumulations of ABA in leaves under water deficit. Strong correlations between ABA concentration in leaves, leaf'll and the Ts rate were found in both cultivars in this study. These relationships confirm findings from other studies where ABA fluctuated according with plant water status (Tardieau and Davies 1992). However, the two cultivars studied in the present irrigation trials showed different relationships in 2006 and 2007, which suggests that more factors or a complex interaction among them affect these relationships. The same trend in ABA concentration was observed in Concord leaves under water stress with values between 0.33 to 1 mg kg- 1 of fresh leaf (Liu et al. 1978). These authors indicated that the 316
339 increasing amount of ABA was far less in stressed vines (three fold) in V. labruscana than in V. vinifera, where the ABA concentration in water stressed vines increased 40 fold (40 mg kg- l dry weight) compared to that one found in well-hydrated vines (Loveysand Kriedemann 1973). However, this was not the case in the present study, where variation in ABA concentration between two to ten times among the treatments was found. In this study, Baco noir, which is an interspecific hybrid, produced more ABA than Chardonnay (V. vinifera) under the same water status. PA was also detected in Concord leaves (Liu. et al. 1978) but the concentration found was very low (0.02 to 0.04 mg kg-l) compared to that one found in V. vinifera, which exceeded even the ABA concentrations (Kriedemann et al. 1975). In this study the findings were different compare to their results, perhaps because they used potted vines in their trials, different cultivars, and different extraction and analysis methods. However, Diiring and Scienza (1975) reported ABA concentrations in field-grown Riesling leaves (Germany) about a tenth of those found by Coombe and Monk (1979) in Riesling leaves field grown from Australia (478 to 513 ng g-l fresh weight). The difference in water status might be a possible explanation for the same cultivar. The results from Chardonnay trials are in agreement with those found in another water stress study conducted on culticar Chardonnay (Okamoto et al. 2004). Based on experiments with tall and dwarf sunflower, it was concluded that stomatal opening is regulated by the ABA produced in leaves (Hoad 1975). The same conclusion was reached regarding the regulation of leaf gas exchange in grapevine (Loveys and DUring 1984). However, Zhang and Davies (1989) concluded that stomatal regulation is under control of ABA produced on roots. There are important changes in the ABA concentration of grapevine roots in contact with drying soil, but these changes do not necessarily translate to equivalent changes in the amount of ABA from leaves (Loveys et al. 2004). Bulk ABA from grapevine leaves is not sourced purely from the roots, as the sap concentration increases along shoots away from the root source (Soar et al. 2004). These authors suggested that additional ABA is produced in the canopy. In this irrigation trial, the failure of leaves to accumulate high concentrations of ABA and its catabolites in well-irrigated treatments might be explained through the biosynthesis and translocation process rather than the catabolic process. ABA inactivation through oxidation or glycosylation might affect its concentration. However, ABA inactivation did not appear to be as significant as biosynthesis on controlling its concentration (DeLuc et al. 2009). This observation is not totally in agreement with the results. This conclusion is supported by the hormone proftle found at different sampling dates, where decreasing ABA concentration was not accompanied every time by an increase at the same rate of one or the other ABA catabolite. Metabolic steps upstream of 9-cis-epoxycarotenoid dioxygenase (NCED) and ABA catabolism downstream also 317
340 affected ABA concentrations in some tissues and organs (Nambara and Poll 2005). However, the failure of the leaves to accumulate ABA is due to rapid transport out of the leaf (Liang et al. 1996). This explanation is also supported partially by the present study since ABA decreased in wellwatered treatments without a similar increase in the other catabolites. ABA is normally translocated out of the leaf as shown by experiments where obstruction of phloem transport leads to an increase in foliar ABA (Setter et al. 1981). In both cultivars studied, low ABA concentration was correlated with high water status in the vine. Besides translocation and degradation, ABA seems to be stored in the leaves at a concentration that cannot have any physiological effect, possible due to the "ion trap" concept (Dagenhardt et al. 2000). However, some studies showed that translocation through the phloem is a very important way to control ABA concentration in the plant (Hoad and Gaskin 1980, Loveys and DUring 1984, Setter et al. 1981). Data from the present study clearly showed that ABA-GE concentration in the leaves is affected by the water status. Although, ABA-GE is considered a product of the ABA metabolism, no strong relationship was found between these two compounds. ABA-GE followed the same trend most of the time as that of ABA which suggests a possible translocation into or out of the leaves besides of its production in the leaves. Sauter et al. (2001) suggested that the bound forms of ABA are utilized as a long-distance transport form, which can be converted to free ABA by apoplastic hydrolases before being imported into the cell. It was speculated that the reason of ABA conversion from free to bound form is to remove the active free ABA from circulation either through sequestration or inactivation. Once conjugated ABA is localized into a vacuole, it is trapped by hydrophilic properties, and therefore, withdrawn from further metabolism (Bray and Zeevaart 1986). Conjugation is the process of converting ABA to ABA-glucosyl ester (-GE) or ABA-glucosyl ether (-GS). The physiological significance of ABA glycosylation in plants remains unclear. A gene catalyzing the conversion of racemic ABA to ABA-GE has been identified in Adzuki bean seedlings (Cutler and Krochko 1999). Another possible explanation of increasing the ABA-GE simultaneously with the ABA, is that of inactivation of the ABA surplus produced under water deficit conditions and which might negatively affect the photosynthesis process by closing the stomata completely, and triggering the senescence process. ABA-GE does not have biological activity, so under stress conditions ABA-GE might serve as a pool for easy release of ABA (Cutler and Krochko 1999). This explanation could be a plausible one since stomatal closure is one of the first plant reactions in order to keep water balance. However, the ABA translocation process from the roots to the leaves is not excluded but 318
341 it could not be explained totally by the rapid increase of ABA in the leaves under water deficits. In the present study data indicates a large increase in ABA"GE under water stress conditions. ABA GE synthesis might be controlled by factors others than water status, since its concentration in leaves from high water status treatments at some sampling dates in 2007 was almost double than that one found in the similar treatments in Data from the present study indicates a strong relationship among ABA and its metabolites, soil and vine water status. Low concentrations of DPA in leaves under water deficits could be explained by its lack of biological activity. However, DPA and PAwere found in higher concentrations even higher than ABA-GE in leaves under high water status. These results indicated a switch between the catabolic pathways under different water status conditions in both leaves and berries. One explanation might be that the vine has an auto-regulatory complex mechanism which diverts the catabolism pathway based on the needs, up-regulating or downregulating the genes which control the enzymes involved in this process. TOH-ABA does not seem to play an important role in ABA metabolism. It was found in small concentrations and did not vary in concentration throughout different water status conditions. Also, a major observation was that the ABA metabolism is under genetic control, and being cultivar dependant. Under the same water status level, Chardonnay and Baco noir produced different amounts of ABA and metabolites, which might reflect their different strategies to cope with water stress. The ABA and its metabolites profiles were determined in skin and pulp at both veraison and harvest time, in both years of the experiment. Data indicated that the profiles varied not only from season to season but also in the berry fraction. Most studies showed that free ABA concentrations increase in berries at about the time of veraison, although the reported timing of increase in relation to veraison somewhat varies (Cawthon and Morris 1982, Coombe and Hale 1973, Gagne et al. 2006, Kondo and Kawai 1998, Okamoto et al. 2004, Scienza et al. 1978). At veraison, ABA increased by 6-fold in the skin and by about 8-fold in the flesh fraction (Coombe 1976). The timing of increase in ABA concentrations at veraison correlates closely with the increase in sugar concentration and anthocyanins. Although, the ABA variation in berries was not studied over the entire growing period, the data showed a decreasing trend in concentration of ABA from veraison to harvest. Phloem sap contains ABA, and its concentration increases substantially in stressed plant (Zeevaart 1977). This might be a plausible explanation of increasing ABA concentration in berries around veraison time, since in many studies increases in ABA concentration in berries was observed at veraison (Owen et al. 2009). This occurred in the present trials, at beginning of 319
342 August, the time when water deficit usually start to build up in Niagara Peninsula. However, ABA accumulates in fruits of plants growing in drying soils, often because these are relatively alkaline compartments (Sauter et al. 2001). This explanation might probably be valid in other species but not in Vitis spp. However, the data indicated higher ABA concentration in the skin than in the pulp, which could be explained though the gradient ph. The data from the present study is in agreement with previous studies which reported that ABA and partially its catabolites were found in berries at higher concentration at veraison rather than at harvest (Owen et al. 2009). This sugests that ABA could have an important role in triggering the ripening process. There is a marked accumulation of ABA in leaves following a period of soil drying, but no ABA accumulation is evident in fruits because of limited water flux between the developing fruit and the vegetative part of the plant (Davies et al. 2000). These findings are in contradiction with those from the present study, which showed a positive relationship between increasing vine water stress and ABA concentration in berries at veraison but not at harvest. This indicates that phloem transport of foliar ABA increased as berries developed. The decrease in ABA that occurred later in the berry development (harvest time) could be due to a combination of its degradation and synthesis. At veraison, the majority of ABA is transported from leaves to berries where it accumulates first in the seeds and then in the pericarp (Koussa et al. 1994). The increase in ABA concentrations around the time of veraison is consistent with its role in controlling of berry ripening. Some studies show that ABA application enhanced both sugar and anthocyanins accumulation (Dilling et al. 1978, Matsushima et al. 1989). Moreover, recent reports showed that ABA application to grape berries resulted mainly in an increase in color rather than an advancement of sugar accumulation (Mori et al. 2005, Peppi et al. 2007, Peppi and Fidelibus 2008). At veraison, the majority of ABA is transported from leaves to berries where it accumulates. The source of pericarp ABA might be the leaves and the pericarp itself, and less the seeds (Cawthon and Morris 1982, Koussa et al. 1993). In the pericarp, the higher ABA concentration occurred when maximum size of berries was reached some days after the end of veraison (Antolin et al. 2003). This explains why the ripening occurs earlier in the grapes under water deficits. The changes of berry color that occurred at veraison are also related to increased ABA concentration in all organs (seeds, pericarpand leaves) (Koussa et al. 1993). Evidence that support this process is thatthewater supply to the berry after veraison occurs mainly through the phloem. Thus, any changes in phloem loading affect berry stress and ABA accumulation (Bondada et al. 2005). ABA stimulates phloem unloading by increasing passive efflux or by inhibiting reloading (Vreugdenhil 1983). This finding agrees with reports describing the correlation between 320
343 the concentration of endogenous ABA and the import of sugars into developing seeds and fruits (During and Alleweldt 1980, Quebedeaux et ai. 1976). Although, in the present study data indicated an increase of the ABA amount at veraison, it is not possible to conclude that this is due to ABA leaf translocation. Owen et ai. (2009) described the ABA and its catabolites profile in Merlot berries over the growing season. The data from trials with berries are partially in agreement with their data. A possible explanation of this, could be that they used irrigation throughout the season, and aiso a different cultivar. Nowadays, it is well known that different cultivars are more or less sensitive to water stress due to their different capacities to control ABA metabolism. The effect of water deficits on ABA concentrations in grape berries have been described in a previous study (Okamoto et ai. 2004). The ABA content in berries from Chardonnay cultivar is in the range of that found by Okamoto et ai. (2004). However, Data showed that ABA at harvesting time was higher in the control than in 100% ETc initiated at fruit set even if overall the amount dropped considerably by harvesting time. Water deficits increased ABA concentrations in Cabemet Sauvignon berries, but not in Chardonnay berries (DeLuc et ai. 2009). The same authors showed that in Chardonnay berries water deficit did not increase ABA concentration above that of well watered berries. These findings are in contradiction with data from the present research. Even if the amount of ABA was far less in the Chardonnay controls compared to Baco noir, there was still a different profile at both veraison and harvesting time in well and non-irrigated treatments. Moreover, water deficit increased the transcript abundance of genes (lipoxygenase and hydroperoxide lyase) involved in fatty metabolism, a pathway known to affect berry and wine aromas. In Chardonnay, water deficit activated parts of the phenylpropanoid pathway, carotenoid and isoprenoid metabolic pathways that contributed to increased concentrations of antheraxanthin and flavonols (DeLuc et ai. 2009). In the present experiments, ABA profile showed a preference for different catabolic pathways in the skin and the pulp at both veraison and harvesting time. ABA can be metabolized into ABA-GE and phaseic acid, which is then reduced to dihydrophaseic acid. ABA-GE concentrations have been observed to be relatively constant before veraison, but with a trend towards increasing its concentrations after veraison (DeLuc et ai. 2009). Water deficit increased ABA-GE concentrations in Chardonnay berries but not in Cabemet Sauvignon (DeLuc et ai. 2009). This data are partially in agreement with those findings. In the present triais, there was a higher amount of ABA-GE at veraison and much lower at harvesting time. This can be explained by high demand of ABA at beginning of the ripening process, ABA-GE being proved to be an easy release pool of ABA. Also, it is well known that ABA is involved in controlling of many metabolic pathways in the berry at this time. At harvesting sampling time significant amounts of P A and 321
344 DPA were found. This might be explained by the fact that vine divert the metabolic pathway to producing inactive catabolites since no longer need of ABA is required. Water deficit slightly increased the concentration of DP A in both Cabernet Sauvignon and Chardonnay berries at maturity in one experiment (DeLuc et al. 2009). The same authors showed that water deficit had no effect on the concentrations of PA for either cultivar. They also showed that the transcript abundance of ABAHASE (the enzyme involved in phaseic metabolic pathway) was greater in Chardonnay than in Cabernet Sauvignon, and it increased by water deficit for both cultivars. Besides of the relationship found in some studies between water status and ABA concentration, control of ABA could be more complex, its concentrations being also affected by ethylene (Hansen and Grossmann 2000) and phytochrome (Sawada et al 2008). High temperatures (30 C) inhibited anthocyanins accumulation through a reduction of endogenous ABA concentration (Tomana et al. 1979). However, spraying ABA to the clusters restored the level of anthocyanin accumulation in high-temperature treated grapes (Kataoka et al. 1984). The role of hormones in the control of grape berry ripening is quite complex. There is evidence that two other growth hormones playa role in triggering berry ripening. Both ethylene (Szyjewicz et al. 1984) and brassinosteroids (Symons et al. 2006) have been shown to have a positive influence on grape berry ripening. The distribution of free ABA in different berry tissues throughout their development generally followed the same pattern (DeLuc. et al. 2009) which is in agreement with the results from the present study. ABA concentrations were found somewhat higher in seeds than in either skin or flesh at most time points.seeds might be the source of at least some of the ABA found in the flesh and skin, although evidence is currently lacking for this (DeLuc et al. 2009). ABA is produced in the leaves and transported to the berries along with sucrose after veraison (Antolin et al. 2003). However, berryaba concentrations vary independently of leaf concentrations during ripening (Okamoto et al. 2004). Although stressing vines could elevate ABA concentrations throughout the plant, it is still unclear if ABA is produced within the berry as a response to altered water status. or it is imported from the rest of the plant. Concentrations of the ABA catabolic products such as PA, DPA and epi-dpa in sweet cherries were noticeably different between the flesh and seed samples (Setha and Kondo 2005). The same authors reported a DP A concentration in the seeds almost 30 fold higher compared to the flesh at 43 days after full bloom. They suggested that the amount of DPA might have an active role in the regulation of ABA concentration in the seeds (Setha and Kondo 2005). However, some studies showed that DPA has no biological activity (Walton and Li 1995). 322
345 Increased ABA concentration results in closure of the stomata thus limiting the water loss from the plant through transpiration (Zeevaart and Creelman 1988). ABA has been shown to cause rapid alterations in the anionic and K+ ionic channels of the guard cell plasma membranes (Assmann 1993). Data from this study is in agreement with this theory. However, the relationship between the amount of ABA and transpiration was not very strong under high water status. ABA uptake from the xylem could cause partial stomatal closure during the afternoon. However, the diurnal variation in stomatal aperture is not related to xylem ABA concentration in a simple way (Correia et al. 1995). This could be due to influence of other chemical signals, such as cytokinins (Stoll et al. 2000b), changes in the sensitivity of stomata to ABA (Tardieu and Davies 1992), differences in ABA catabolism during day (Trejo et al. 1993) andlor changes in the ph of xylem sap (Stoll et al. 2000a). This might explaine why the relationship between ABA concentration in leaves and transpiration was different in Chardonnay block, in 2007 season. Water deficit increases ABA concentrations in the xylem sap and leaves of grapevine while changes in stomatal conductance are well correlated with ABA concentrations of the xylem sap (Okamoto et al. 2004, Soar et al. 2004). ABA also influences hydraulic conductance (Hose et al. 2000), aquaporin gene expression (Kaldenhoff et al. 2008, Tyerman et al. 2002), and embolism repair in grapevines (Lovisolo et al. 2008). The accumulation of ABA in berries plays an important role in the triggering of veraison (Antolin et al. 2003, Dapeng et al. 1997), and the accumulation of anthocyanins (Matsushima et al. 1989). It was reported recently that anthocyanin synthesis was enhanced by ABA treatment due to its effect on the genes responsible for the biosynthesis of the anthocyanins enzymes (Ban et al. 2003, Jeong et al. 2004). The transcription of genes and activity of proteins involved in sugar accumulation and metabolism during ripening are also influenced by ABA (<;akir et al. 2003, Pan et al. 2005, Yu et al. 2006). The relationships found through the PCA were not consistent from vintage to vintage. However, ABA concentration at veraison in Baco noir was positively correlated with Brix and anthocyanin concentration, which could support the theory of its involvement in the ripening process. In Chardonnay vines it is not clear if ABA has a positive effect on grape composition. It is possible that ABA acts in white cultivars at the cellular level, controlling synthesis of various secondary metabolites other than those with direct impact on fruit composition. These metabolites accumulate under drought stress and function as osmolytes, antioxidants or scavengers that help plants to avoid andlor tolerate stresses (Bartels and Sunkar 2005). 323
346 Conclusions ABA and its catabolite profiles were affected in both cultivars studied not only by level of water status but also by the time of irrigation initiation. A consistent positive relationship between ABA concentration at veraison, '13rix and anthocyanins in Baco noir might support the theory that ABA is involved in the ripening process. Moreover, ABA and its catabolites profile seemed to be under genetic control, and it was more obvious in red cultivars. Chardonnay grapevines produced less ABA in both leaves and berries compared to Baco noir, which might be translated in its different capacity to react at different level of water status. There is not strong evidence from the present study that higher concentrations of ABA in berries under water deficits could control any specific metabolic pathways in Chardonnay, although, it is well documented that moderate water stress positively affects the aromatic compounds. Besides genetic control, ABA and some of its catabolites were strongly affected by water status level. Even with a low magnitude of difference in water status level, changes were detectable in ABA and itscatabolites profile. From all possible catabolites of ABA studied, only ABA-GE, DPA, PA and 7'OH-ABA were found at detectable levels in both seasons. In vines with high water status ABA is not completely turned over as is suggested to happen in other plant species. Moreover, variation in ABA concentration over the entire growing season was not followed by changes in the same proportion in its catabolites, which indicates that translocation might be an important process along with the three catabolism pathways of ABA. There is an apparent control of one or the others catabolic pathway for ABA, depending on Jhe water status level in the vine. ABA-GE was the main catabolite in treatments with high water deficits, while P A and DP A were higher in treatments with high water status, suggesting that the vine produced more ABA-GE under water deficits in order to have a pool of ABA which could be used quickly to control stomatal opening. ABA and part of its catabolites can accurately describe grapevine water status. However, they are highly affected by other climatic factors. Future research should be focused on finding the ABA threshold in the berries responsible to trigger the ripening process, and how this can be controlled in cool climates. 324
347 Literature Cited Alleweldt, D., and H. Dilling Einfluss der Photoperiode aufwachstum und Abscisinsauregehalt der Rebe.Vitis 11: Antolin, M., H. Baigorri, I. Luis, F. Aguirrezabal, L. Geny, M. Broquedis, and M. Sanchez-Diazo ABA during reproductive development in non-irrigated grapevines (Vitis vinifera L. cv. Tempranillo). Austral. J. Grape Wine Res. 9: Assmann, S.M Signal transduction in guard cells. Ann. Rev. Cell Develop. BioI. 9: Ban, T., M. Ishimaru, S. Kobayashi, S. Shiozaki, N. Goto-Yamamoto, and S. Horiuchi Abscisic acid and 2,4-dichlorophenoxyacetic acid affect the expression of anthocyanins biosynthetic pathway genes in 'Kyoho' grape berries. J. Hort. Sci. BiotechnoI. 78: Bartels, D., and R. Sunkar Drought and salt tolerance in plants. Crit. Rev. in Plant Sci, 24: Bondada, B., M.A Matthews, and K.A ShackeI Functional xylem in the post-veraison grape berry. J. Exp. Bot. 56: Bray, E.A, and J.A Zeevaart Compartimentation and equilibration of abscisic acid in isolated Xanthium cells. Plant PhysioI. 80: <;akir, B., A Agasse, C. Gaillard, A Saumonneau, S. Delrot, and R. Atanassova A grape ASR protein involved in sugar and abscisic acid signalling. Plant Cell 15: Cawthon, D. L., and J.R. Morris Relationship of seed number and maturity to berry development, fruit maturation, hormonal changes, and uneven ripening of Concord (Vitis labrusca L.) grapes. J. Amer. Soc. Hort. Sci. 107: Christmann, A, T. Hoffmann, I. Teplova, E. Grill, and A MUller Generation of active pools of abscisic acid revealed by in vivo imaging of water stressed Arabidopsis. Plant Physiol. 137: Comstock, J.P Hydraulic and chemical signalling in the control of stomatal conductance and transpiration. J. Exp. Bot. 53: Coombe, B.G The development of flesh fruits. Ann. Rev. Plant Physiol. 27: Coombe, B.G., and C.R. Hale The hormone content of ripening grape berries and the effects of growth substance treatments. Plant Physiol. 51: Coombe, B.G., and P.R. Monk Proline and abscisic acid content of the juice of ripe Riesling grape berries: Effect of irrigation during harvest. Am. J. Enol. Vitic. 30: Correia, M.J., J.S. Pereira, M.M. Chaves, M.L. Rodrigues, and C.A Pacheco ABA xylem concentrations determine maximum daily leaf conductance of field-grown Vitis vinifera L. plants. Plant Cell Envir. 18: Cutler, AJ., and J.E. Krochko Formation and breakdown of ABA Trends in Plant Sci. 4: Dagenhardt, B., H. Gimmler, E. Hose, and W. Hartung Effect of alkaline and saline substrates on ABA contents, - distribution and -transport in plant roots. Plant Soi1205:
348 Dapeng, Z., X. XueTen, Z. Zilian, and J. Wensuo Studies on the veraison mechanisms: physiological and biochemical responses of grape berries to exogenous hormone treatment and girdling during the lag phase of berry growth. Acta Hort. Sinica. 247: 1-7. Davies, c., P. Boss, and S. Robinson Treatment of grape berries, a nonclimacteric fruit with a synthetic auxin, retards ripening and alters the expression of developmentally regulated genes. Plant PhysioL 115: Davies, W.J., M.A Bacon, D.S. Thompson, W. Sobeih, and L. Rodriguez Regulation ofleaf and fruit growth in plants growing in drying soil: exploitation of the plants' chemical signalling system and hydraulic architecture to increase the efficiency of water use in agriculture. J. Exp. Bot. 51: Deluc, L.D., D.R. Quilici, A Decendit, J. Grimplet, M.D. Wheatley, KA. Schlauch, J.M. Merillon, J.C. Cushman, and G.R. Cramer Water deficit alters differentially metabolic pathways affecting important flavour and quality traits in grape berries of Cabernet Sauvignon and Chardonnay. BMC Genomics 10:212. Dietz, KJ., A. Sauter, K Wichert, D. Messdaghi, and W. Hartung Extracellular ~ glucosidase activity in barley involved in the hydrolysis of ABA glucose conjugate in leaves. J. Exp. Bot. 51: Dodd, I.C., and W.J. Davies The relationship between leaf growth and ABA accumulation in the grass leaf elongation zone. Plant Cell Envir. 19: Downton, W.J.S., and B. R. Loveys Compositional changes during grape berry development in relation to abscisic acid and salinity. Austral. J. Plant PhysioL 5: DUring, H., and D. Alleweldt Effects of plant hormones on phloem transport in grapevines. Der Deutsch Bot. Ges. 93: Dilling, H., D. Alleweldt and R. Koch Studies on hormonal control of ripening in berries of grape vines. Acta Hort. 80: DUring, H., and A Scienza Zur Rolle der endogenen Abscisinsaure bei Wassermangel in Reben. Vitis 14: Feurtado, J.A, S.J. Ambrose, AJ. Cutler, AR.S. Ross, S.R. Abrams, and AR. Kermode Dormancy termination of western white pine (Pinus monticola Dougl. Ex D. Don) seeds is associated with changes in abscisic acid metabolism. Planta 218: Gagne, S., K Esteve, C. Deytieux, C. Sauvier, and L. Geny Influence of abscisic acid in triggering veraison in grape berry skins of Vitis vinifera L. cv. Cabernet Sauvignon. Vitis 40:7-14. Glinka, Z., and L. Reinhold Abscisic acid raises the permeability of plant cells to water. Plant PhysioL 48: Gomez-Cadenas, A., F.R. Tadeo, M. Talon, and E. Primo-Millo Leaf abscission induced by ethylene in water-stressed intact seedlings of Cleopatra Mandarin requires previous abscisic acid accumulation in roots. Plant PhysioL 112: Grossmann, K., and H. Hansen Ethylene-triggered abscisic acid: a principle in plant growth regulation? PhysioL Plant. 113:9-14. Hansen, H., and K Grossmann Auxin-induced ethylene triggers abscisic acid biosynthesis and growth inhibition. Plant PhysioL 124:
349 Hartung, W., S. Wilkinson, and W.J. Davies Factors that regulate abscisie acid concentrations at the primary site of action at the guard cell. J. Exp. Bot. 51: Heilman, J.L., K.J. McInnes, M.J. Savage, RW. Gesch and RJ. Lascano Soil and canopy energy balances in a west Texas vineyard. Agric. For. Meteorol Heilmann, B., W. Hartung, and H. Gimmler The distribution of abscisic acid between chloroplasts and cytoplasm of leaf cells and the permeability of the chloroplast envelope for abscisie acid. Z. pflanzenphysiol. 97: Hoad, G.V Effect of osmotic stress on abscisic acid levels in xylem sap of sunflower (Helianthus annuus L.). Planta. 124: Hoad, G.V., and P. Gaskin Abscisic acid and related compounds in phloem exudate of Yucca flaccida Haw. and coconut (Cocos nucifera L.) Planta. 150: Hose, E., E. Steudle, and W. Hartung Abscisie acid and hydraulic conductivity of maize roots: a study using cell- and root-pressure probes. Planta. 211 : Huang, D., W. Wu, S.R Abrams, and A.J. Cutler The relationship of drought-related gene expression in Arabidopsis thaliana to hormonal and environmental factors. J. Exp, Bot. 59: Inaba, A., M. Ishida, and Y. Sobajima Changes in endogenous hormone concentration during berry development in relation to the ripening of Delaware grape. J. Japan. Soc. Hort. Sci. 45: Jeong, S.T., N. Goto-Yamamoto, S. Kobayashi, and M. Esaka Effects of plant hormones and shading on the accumulation of anthocyanins and the expression of anthocyanin biosynthetie genes in grape berry skins. Plant Sci. 167: Kaiser, W.M., and W. Hartung Uptake and release of abcisic acid by isolated photoautrophic mesophill cells, depending on ph gradients. PI. Physiol. 68: Kaldenhoff, R, M. Ribas-Carbo, J. Flexas, C. Lovisolo, M. Heckwolf and N. Uehlein Aquaporins and plant water balance. Plant Cell Envir. 31: Kataoka, I., Y. Kubo, A. Sugiura, and T. Tomana Effects of temperature, cluster shading and some growth regulators on L-phenylalanine ammonialyase activity and anthocyanin accumulation in black grapes. Mem. ColI. Agric. Kyoto Univ. 124: Kondo, S., and M. Kawai Relationship between free and conjugated ABA levels in seeded and gibberellin-treated seedless, maturing 'Pione' grape berries. J. Am. Soc. Hortie. Sci. 123: Koussa, T., M. Broquedis, and J. Bouard Mise en evidence d'une relation entre les teneurs en acide abscissique des feuilles de vigne et des baies de raisin a l' epoque de la veraison. J. Int. Sci. Vigne Vin 27: Koussa, T., M. Broquedis, and J. Bouard Changes of absisic acid during the development of grapevine latent buds particularly in the phase of dormancy break. Vitis. 33:63-7. Kriedemann, P.E., B.R Loveys, and W.J.S. Downton Internal control of stomatal physiology and photosynthesis. n. Photosynthetic response to phaseic acid. Austral. J. Plant Physiol. 2: Lee, K.H., H.L. Piao, H.Y. Kim, S.M. Choi, F. Jiang, W. Hartung, I. Hwang, J.M. Kwak, I.1. Lee, and I. Hwang Activation of glucosidase via stress-induced polymerization rapidly increases active pools of abscisie acid. Cell 126:
350 Leung, J., and J. Giraudat Abscisic acid signal transduction. Ann. Rev. Plant Physiol. Plant Molec. BioI. 49: Liang, l, J. Zhang, and M.H. Wong Stomatal conductance in relation to xylem sap abscisic acid concentrations in two tropical trees, Acacia confusa and Litsea glutinosa. Plant Cell Envir. 19: Liu, W.T., R. Pool, W. Wenkert, and P.E. Kriedemann Changes in photosynthesis, stomatal resistance and abscisic acid of Vitis labruscana through drought and irrigation cycles. Am. l Enol. Vitic. 29: Loveys, B.R Abscisic acid transport and metabolism in grapevine (Vitis vinifera L.). New Phytol. 98: Loveys, B.R., and H. DUring Diurnal changes in water relations and abscisic acid in fieldgrown Vitis vinifera cultivars. II. Abscisic acid changes under semi-arid conditions. New Phytol. 97: Loveys, B.R., and P.E. Kriedemann Rapid changes in abscisic acid-like inhibitors following alterations in vine leaf water potentials. Physiol. Plant. 28: Loveys, B.R., and P.E. Kriedemann Internal control of stomatal physiology and photosynthesis. I. Stomatal regulation and associated changes in endogenous levels of abscisic acid and phaseic acids. Austral. J. Plant Physiol. 1: Loveys, B.R., M. Stoll, and W.J. Davies Physiological approaches to enhance water use efficiency in agriculture: exploiting plant signalling in novel irrigation practice. p In: Water use efficiency in plant biology. Bacon M.A. (Ed.) Lancaster: University of Lancaster, Lancaster, UK. Lovisolo, c., I. Perrone, W. Hartung, and A. Schubert An abscisic acid-related reduced transpiration promotes gradual embolism repair when grapevines are rehydrated after drought. New Phytol. 180: Matsushima, J., S. Hiratsuka, N. Taniguchi, R. Wada, and K.Suzaki Anthocyanin accumulation and sugar content in the skin of grape cultivar" Olympia" treated with ABA. J. Japan. Soc. Hort. Sci. 58: Mori, K., H. Saito, N. Goto-Yamamoto, M. Kitayama, S. Kobayashi, S. Sugaya, H. Gemma, and K. Hashizume Effects of abscisic acid treatment and night temperatures on anthocyanin composition in Pinot noir grapes. Vitis 44: Munns, R., and R.E. Sharp Involvement of abscisic acid in controlling plant growth in soils of low water potential. Austral. J. Plant Physiol. 20: Munns, R., and R.W. King Abscisic acid is not the only stomatal inhibitor in the transpiration stream. Plant Physiol. 88: Nambara, E., and A. Marion-Poll Abscisic acid biosynthesis and catabolism. Ann. Rev. Plant BioI. 56: Okamoto, G., T. Kuwamura, and K. Hirano Effects of water deficit stress on leaf and berry ABA and berry ripening in Chardonnay grapevines (Vitis vinifera). Vitis 43: Owen, S.J., and S.R. Abrams Measurement of plant hormones by liquid chromatographymass spectrometry. pp In: Plant Hormones: Methods and Protocols. 2nd ed. Cutler S. and Bonetta D. (Eds.), Humana Press, New York. 328
351 Owen, S.J., M. Lafond, P. Bowen, C. Bogdanoff, K. Usher, and S.R. Abrams Profiles of abscisic acid and its catabolites in developing Merlot Grape (Vitis vinifera) berries. Am. J. Enol. Vitic.60: Pan, Q.H., M.J. Li, e.e. Peng, N. Zhang, X. Zou, K.Q. Zou, X.L Wang, X.C. Yu, X.F Wang, and D.P. Zhang Abscisic acid activates acid invertases in developing grape berry. Physiol. Plant. 125: Peppi, M.C., and M.W. Fidelibus Effects of Forchlorfenuron and abscisic acid on the quality of 'Flame Seedless' grapes. HortSci. 43: Peppi, M.e., M.W. Fidelibus, and N. Dokoozlian Application timing and concentration of abscisic acid affect the quality of 'Redglobe' grapes. J. Hortic. Sci. Biotechnol. 82: Quebedeaux, B., P.B. Sweetser, and J.C. Rowell Abscisic acid levels in soybean reproductive structures during development. Plant Physiol. 58: Ross, A.R.S., S.J. Ambrose, AJ. Cutler, J.A Feurtado, AR. Kermode, K. Nelson, R. Zhou, and S.R. Abrams Determination of endogenous and supplied deuterated abscisic acid in plant tissues by high-performance liquid chromatography-electrospray ionization tandem mass spectrometry with multiple reaction monitoring. Anal. Biochem. 329: Sauter, A, W.J. Davies, and W. Hartung The long-distance abscisic acid signal in the droughted plant: the fate of the hormone on its way from root to shoot. J. Exp. Bot. 52: Sawada, Y., M. Aoki, K. Nakaminami, W. Mitsuhashi, K Tatematsu, T. Kushiro, T. Koshiba, Y. Kamiya, Y. Inou, and E. Nambara Phytochrome- and gibberellin-mediated regulation of abscisic acid metabolism during germination of photoblastic lettuce seeds. Plant Physioi. 146: Scienza, A, R. Miravalle, C. Visai, and M. Fregoni Relationships between seed number, gibberellin and abscisic acid levels and ripening in Vitis vinifera L. cv. Cabernet Sauvignon grape berries. Vitis 17: Seki, M., T. Umezawa, K. Urano, and K. Shinozaki Regulatory metabolic networks in drought stress responses. Curro Opin. in Plant BioI. 10: Setha, S., S. Kondo, N. Hirai, and H. Ohigashi Quantification of ABA and its metabolites in sweet cherries using deuterium-labeled internal standards. Plant Growth Regui. 45: Setter, T.L., W.A Brun, and M.L. Brenner Abscisic acid translocation and metabolism in soybeans following depodding and petiole girdling treatments. Plant Physioi. 67: Slovik, S., and W. Hartung Compartmental distribution and redistribution of abscisic acid in intact leaves. III. Analysis of the stress signal chain. Planta 187: Soar, e.j., P.R Dry, and B.R. Loveys Scion photosynthesis and leaf gas exchange in Vitis vinifera L. cv. Shiraz: mediation of rootstock effects via xylem sap ABA Austral. J. Grape Wine Res. 12: Soar, CJ., J. Speirs, S.M. Maffei, and B.R. Loveys Gradients in stomatal conductance, xylem sap ABA and bulk leaf ABA along canes of Vitis vinifera cv. Shiraz: molecular and physiological studies investigating their source. FUllCt. Plant BioI. 31:659-6~9. Stoll, M., P.R. Dry, B.P. Loveys, D. Stewart, and M.G. McCarthy. 2000a. Partial rootzone drying, effects on root distribution and commercial application of a new irrigation technique. Austral. New Zealand Wine Ind. J. 15:
352 Stoll, M., B.P. Loveys, and P. Dry. 2000b. Hormonal changes induced by partial rootzone drying of irrigated grapevine. J. Exp. Bot. 51: Symons, G.M., C. Davies, Y. Shavrukov, I.B. Dry, J.B. Reid, and M.R. Thomas Grapes on steroids. Brassinosteroids are involved in grape berry ripening. Plant Physiol. 140: Szyjewicz, E., N. Rosner, and W.M. Kliewer Ethephon (2-chloroethyl) phosphonic acid, ethrel, CEPA) in viticulture - A review. Am. J. Enol. Vitic. 35: Tardieu, F., and W.J. Davies Stomatal response to abscisic acid is a function of current plant water status. Plant Physiol. 98: Tomana, T., N. Utsunomiya, and I. Kataoka The effect of environmental temperature on fruit ripening on tree. II. The effect of temperatures around whole vines and clusters on the coloration of'kyoho' grapes. J. Japan. Soc. Hort. Sci. 48: Trejo, C.L., W.J. Davies, and L.D.P. Ruiz Sensitivity of stomata to abscisic acid-an effect of the mesophyll. Plant Physiol. 102: Tyerman, S.D., C.M. Niemietz, and H. Bramley Plant aquaporins: multifunctional water and solute channels with expanding roles. Plant Cell Envir. 25: Vreugdenhil, D Abscisic acid inhibits phloem loading of sucrose. Physiol. Plant. 57: Walton, D., and Y. Li Abscisic acid biosynthesis and metabolism. pp In: Plant Hormones Physiology, Biochemistry and Molecular Biology, 2nd edition. Davies P.J. (Ed.). Kluwer Academic Publishers, Dordrecht, The Netherlands. Wheeler, S., B. Loveys, C. Ford, and C. Davies The relationship between the expression of abscisic acid biosynthesis genes, accumulation of abscisic acid and the promotion of Vitis vinifera L. berry ripening by abscisic acid. Austral. J. Grape Wine Res. 15: Wilkinson, S., and W.J. Davies ABA-based chemical signalling: the co-ordination of responses to stress in plants. Plant Cell Envk 25: Wright, S.T.C The relationship between leaf water potential (leaf) and the levels of abscisic acid and ethylene in excised wheat leaves. Planta 134: Xia, M.Z Effects of soil drought during the generative development phase of faba been (Viciafaba) on photosynthetic characters and biomass production. J. Agr. Sci. 122: Yang, Y., R. Sulpice, A Himmelbach, M. Meinhard, A Christmann, and E. Grill Fibrillin expression is regulated by abscisic acid response regulators and is involved in abscisic acidmediated photoprotection. Proc. U.S. National Academy of Sciences 103: Yu, X.c., M.J. Li, G.P' Gao, H.Z. Feng, X.Q. Geng, C.C. Peng, S.Y. Zhu, X.J. Wang, Y.Y. Shen, and D.P. Zhang Abscisic acid stimulates a calcium-dependant protein kinase in grape berry. Plant Physiol. 140: Zacarias, L., and M. Reid Role of growth regulators in the senescence of Arabidopsis thaliana leaves. Physiol. Plant.80: Zaharia, L.r., M.K. Walker-Simmon, C.N. Rodriguez, and S.R. Abrams Chemistry of abscisic acid, abscisic acid catabolites and analogs J. Plant Growth Regul. 24: Zeevaart, J.AD Sites of Abscisic Acid Synthesis and Metabolism in Ricinus communis L. Plant Physiol. 59:
353 Zeevaart, J.AD., and R.A Creelman Metabolism and physiology of abscisic acid. Ann. Rev. Plant Physiol. Plant Mol. BioI. 39: Zhang, J., and W.J. Davies Abscisic acid produced in dehydrating roots may enable the plant to measure the water status ofthe soil. Plant Cell Envir. 12: Zhang, J. and W.J. Davies Does ABA in the xylem control the rate ofleaf growth in soildried maize and sunflower plants? J. Exp. Bot. 41: Zhang, S.Q., and W.H. Outlaw Jr Abscisic acid introduced into the transpiration stream accumulates in the guard-cell apoplast and causes stomatal closure. Plant Cell Envir. 24: Zhou, R., T.M. Squires, S.J. Ambrose, S.R. Abrams, AR.S. Ross, and AJ. Cutler Rapid extraction of abscisic acid and its metabolites for liquid chromatography-tandem mass spectrometry. Am. J. Chromatogr. 1010: Zou, J., G.D. Abrams, D.L. Barton, D.C. Taylor, M.K. Pomeroy, and S.R, Abrams Induction of lipid and oleosin biosynthesis by ( + )-abscisic acid and its metabolites in microspore-derived embryos of Brassica napus L. cv Reston. Plant Physiol. 108:
354 List of Tables Table 7.1 Mobile phase solvent composition and gradient protocol. Table 7.2 Multiple reaction monitoring transitions and retention time used for ion trap mass spectrometry conditions for ABA and its metabolites. 332
355 Table 7.1 Mobile phase solvent composition and gradient protocol Percent Percent Time (min) Solvent Solvent A B Post Time 5.0 A: H % formic acid B: acetonitrile % formic acid; Flow: 350uUmin 333
356 Table 7.2. Multiple reaction monitoring transitions and retention time used for ion trap mass spectrometry conditions for ABA and its metabolites. Analyte Precursor rniz Productrnlz Retention time d3-dpa ABA-GE d5-aba-ge PA d3-pa neopa d3 neopa H ABA d47'ohaba ABA d4-aba
357 List of Figures Figure 7.1. ABA and catabolite profiles of Baco noir leaves sampled from ten irrigation treatments over the growing season in from Lambert Vineyards, Niagara-on-the-Lake, ON, 2006 (AI to A3: means first to third sampling time) and 2007 (B1 to B3: means first to third sampling time) from 10 irrigation treatments. Error bars indicate the standard error of the mean of three biological replicates. A1-6 July, A2-2OJuly, A3-3 August; B1-5 July, B2-19 July, B3-2 August); *Set, Lag, Ver. are irrigation initiation times fruit set, lag phase and veraison, respectively. Figure 7.2. ABA and catabolite profiles of Baco noir leaves sampled from ten irrigation treatments over the growing season from Lambert Vineyards, Niagara-on-the-Lake, ON, 2006 (A4 and A5: means fourth and fifth sampling time) and 2007 (B4 to B5: means fourth and fifth sampling time) from ten irrigation treatments. Error bars indicate the standard error of the mean of three biological replicates. (A4-17 August, A5-30August, B4-16 August, B5-29 August); *Set, Lag, Ver. are irrigation initiation times: fruit set, lag phase and veraison, respectively; * 25, 50, 100 are percentage of water replaced based on ETc. Figure 7.3. ABA and catabolite profiles of Baco noir berry skin from Lambert Vineyards, Niagaraon-the-Lake, ON, 2006: A) at veraison and B) at harvest, from ten irrigation treatments. Error bars indicate the standard error of the mean of three biological replicates. * Set, Lag, Ver. are irrigation initiation times: fruit set, lag phase and veraison, respectively; * 25, 50, 100 are percentage of water replaced based on ETc. Figure 7.4. ABA and catabolite profiles of Baco noir berry pulp sampled from ten irrigation treatments from Lambert Vineyards, Niagara-on-the-Lake, ON, 2006: A) at veraison and B) at harvest) from ten irrigation treatments. Error bars indicate the standard error of the mean of three biological replicates. *Set, Lag, Ver. are irrigation initiation times: fruit set, lag phase and veraison, respectively; * 25, 50, 100 are percentage of water replaced based on ETc. Figure 7.5. ABA and catabolite profiles of Baco noir berry skin sampled from ten irrigation treatments from Lambert Vineyards, Niagara-on-the-Lake, ON, 2007: A) at veraison and B) at harvest from ten irrigation treatments. Error bars indicate the standard error of the mean of three biological replicates. Set, Lag, Ver. are irrigation initiation times: fruit set, lag phase and veraison, respectively; * 25, 50, 100 are percentage of water replaced based on ETc. Figure 7.6. ABA and catabolite profiles of Baco noir berry pulp sampled from ten irrigation treatments from Lambert Vineyards, Niagara-on-the-Lake, ON, 2007: A) at veraison and B) at harvest from ten irrigation treatments. Error bars indicate the standard error of the mean of three biological replicates. Set, Lag, Ver. are irrigation initiation times: fruit set, lag phase and veraison, respectively; * 25, 50, 100 are percentage of water replaced based on ETc. Figure 7.7. ABA and catabolite profiles of Chardonnay leaves over the growing season sampled from seven irrigation treatments from Lambert Vineyards, Niagara-on-the-Lake, ON, 2006 (AI to A3: means first to third sampling time) and 2007 (B1 to B3: means first to third sampling time). Error bars indicate the standard error of the mean of three biological replicates. (A1-6 July, A2-2OJuly, A3-3 August; B1-5 July, B2-19 July, B3-2 August); *Set and Ver. are irrigation initiation times, fruit set and veraison, respectively; * 25, 50, 100 are percentage of water replaced based on ETc Figure 7.8. ABA and catabolite profiles of Chardonnay leaves over the growing season sampled from seven irrigation treatments from Lambert Vineyards, Niagara-on-the-Lake, ON, 2006 (A4 and A5: means fourth and fifth sampling time) and 2007 (B4 to B5: means fourth and fifth 335
358 sampling time) Error bars indicate the standard error of the mean of three biological replicates. (A4-17 August, A5-30 August, B4-16 August, B5-29 August); *Set and Ver. are irrigation initiation times, fruit set and veraison, respectively; * 25, 50, 100 are percentage of water replaced based on ETc. Figure 7.9. ABA and catabolite profiles of Chardonnay berry skin sampled from seven irrigation treatments from Lambert Vineyards, Niagara-on-the-Lake, ON, 2006: A) at veraison and B) at harvest). Error bars indicate the standard error of the mean of three biological replicates. *Set and Ver. are irrigation initiation times: fruit set and veraison, respectively; * 25,50, 100 are percentage of water replaced based on ETc. Figure ABA and catabolite profiles of Chardonnay berry pulp sampled from seven irrigation treatments from Lambert Vineyards, Niagara-on-the-Lake, ON, 2006: A) at veraison and B) at harvest. Error bars indicate the standard error of the mean of three biological replicates. *Set and Ver. are irrigation initiation times: fruit set and veraison, respectively; * 25, 50, 100 are percentage of water replaced based on ETc. Figure ABA and catabolite profiles of Chardonnay berry skin sampled from seven irrigation treatments from Lambert Vineyards, Niagara-on-the-Lake, ON, 2007: A) at veraison and B) at harvest). Error bars indicate the standard error of the mean of three biological replicates. *Set and Ver. are irrigation initiation times: fruit set and veraison, respectively; * 25, 50, 100 are percentage of water replaced based on ETc. Figure ABA and catabolite profiles of Chardonnay berry pulp sampled from seven irrigation treatments from Lambert Vineyards, Niagara-on-the-Lake, ON, 2007: A) at veraison and B) at harvest). Error bars indicate the standard error of the mean of three biological replicates. *Set and Ver. are irrigation initiation times: fruit set and veraison, respectively; * 25, 50, 100 are percentage of water replaced based on ETc. Figure Principal component analysis biplot (F1&F2) of soil and vine water status and water stress hormone composition from 10 irrigation treatments of Baco noir from Lambert Vineyards, Niagara-on-the-Lake, ON, Set, Lag and Veraison are the time for irrigation imposition and 100,50 and 25 represent percentage of the water replaced in the soil through irrigation. Figure Principal component analysis biplot (F1&F2) of soil and vine water status, and water stress hormone composition from 10 irrigation treatments of Baco noir from Lambert Vineyards, Niagara-on-the-Lake, ON, Set, Lag and Veraison are the time for irrigation imposition and 100,50 and 25 represent percentage of the water replaced in the soil through irrigation. Figure Principal component analysis biplot (F1&F2) of soil and vine water status, berry composition, and water stress hormone composition (skin-veraison) from ten irrigation treatments of Baco noir from Lambert Vineyards, Niagara-on-the-Lake, ON, Set, Lag and Veraison are the time for irrigation imposition and 100, 50 and 25 represent percentage of the water replaced in the soil through irrigation. Figure Principal component analysis biplot (Fl&F2) of soil and vine water status, yield components and berry composition, and water stress hormone composition from seven irrigation treatments of Chardonnay vines, from Lambert Vineyards, Niagara-on-the-Lake, ON, Set and Ver. are the time for irrigation imposition and 100,50 and 25 represent percentage of the water replaced in the soil through irrigation. 336
359 Figure Principal component analysis biplot (Fl &F2) of soil and vine water status, yield components, berry composition, and water stress hormone composition from seven irrigation treatments of Chardonnay vines from Lambert Vineyards, Niagara-on-the-Lake, ON, Set and Veraison are the time for irrigation imposition and 100, 50 and 25 represent percentage of the water replaced in the soil through irrigation. 337
360 Al A2 25Ner 50Ner "E 100IVer ~ 25/Lag 1ii ~ 50/Lag 100/Lag i 25/Set ~ 50/Set "E Q) is ai 100/Set Control 25Ner 50Ner 100Ner 25/Lag 50/Lag ~ 100lLag "" ai Ol ~ 25/Set 50/Set 100/Set Control O PA,nOH-ABA ;;OPA.ABAGE. ABA 25Ner 50Ner,.ii... ~ ~ 100Ner 25/Lag o o Concentration (ng/g dry mass) Concentration (ng/g dry mass) Concentration (ng/g dry mass) OPA " 70H-ABA :OPA.ABAGE R ABA 2S/Ver SOlVer /Ver t: ~ 25/Lag a; jg SO/Lag 6 loo/lag "" ~ -c: 25/5et..!::: SO/Set loo/set Control - -~ -.. ~ o Concentration (ng/g dry mass) ;e70h-asa ~ DPA.ABAGE R ABA z-: 70H.. ABA :::: OPA RASAGE R ABA BI B2 25IVer 50/Ver 50IVer 100/Ver 100IVer "E Q) E 25/Lag 1ii 50/Lag ~ 100/Lag ~ Cl 25/Set : 50/Set 100/Set OPA,nOH-ABA "OPA.ABAGE R ABA "E Q) E a; ~ <: 0 ~ Cl "E 25/Lag SO/Lag 100/Lag 25/Set SO/Set l00/set Control OPA "'70H-ABA ::'l OPA RABAGE R ABA Control A Concentration (ng/g dry mass) o Concentration (ng/g dry mass) B3 Figure 7 _ L ABA and catabolite profiles of Baco noir leaves sampled from ten irrigation treatments over the growing season from Lambert Vineyards, Niagara-on-the-Lake, ON, 2006 (AI to A3: means first to third sampling time) and 2007 (B 1 to B3: means first to third sampling time) Error bars indicate the standard error of the mean of three biological replicates. Al- 6 July, A2-2OJuly, A3-3 August; Bl- 5 July, B2-19 July, B3-2 August); *Set, Lag, Ver. represent irrigation initiation times: fruit set, lag phase and veraison, respectively 338
 O PA \" 70H-ABA ; DPA.")
 50/Ver Jiliiiiiil----.")
361 A4 r= jii!! ~ 50ILag A5 25Ner 50Ner 100IVer 'E <IJ 25/Lag.s C!I 50/Lag ~ 100/Lag., C!I Ol 25/Set : SO/Set 100/Set Control Concentration (ng/g dry mass) 25Nerl!!!!i~~~~::::::::::::= /Lag!-!.!~~:~~?~:~::-_ "" ~ 25/Sel,;;~;~::::~ 50/Set! 100/Set Control o Concentration (ng/g dry mass) O PA " 70H-ABA ; DPA.ABAGE ABA OPA ;;;JOH- ABA ;:; DPA.ABAGE ABA 2S/Ver SOlVer 100/Ver 'E 25/lag <IJ ~ SO/lag OPA ~ 100/lag ~n OH - ABA c: :;DPA 0.~ 25/Set.ABAGE Ol SO/Set ABA 100/Set Control o Concentration (ng/g dry mass) 50/Ver Jiliiiiiil /VerJiiiii~;;;;;;;;;;;;~::::==~~ ~ 100/Ver S 25/lag liiiilliii liiiil._ ~ ~ -;; SO/lag... _... o ~ 100/lag Jiii , Ol 25/Set JiliIi SO/Set,._ /Set Control o S S Concentration (ng/9 dry mass),noh-aba ~ DPA.ABAGE. ABA B4 B5 Figure 7 _2_ ABA and catabolite profiles of Baco noir leaves sampled from ten irrigation treatments over the growing season from Lambert Vineyards, Niagara-on-the-Lake, ON, 2006 (A4 and AS: means fourth and fifth sampling time) and 2007 (B4 to BS: means fourth and fifth sampling time)_ Error bars indicate the standard error of the mean of three biological replicates_ (A4-17 August, A5-30August, B4-16 August, BS- 29 August); *Set, Lag, Ver_ represent irrigation initiation times: fruit set, lag phase and veraison, respectively; * 25, 50, 100 are percentage of water replaced based on ETc. 339
362 25Ner 50Ner - 100Ner c Q) E 25/Lag -ro ~ 50/Lag - c 1 ~O/Lag 0 :;::::; ro c... 0> 25/Set 50/Set 1 ~O/Set Control DPA ;':! 70H-ABA. DPA.ABAGE. ABA Concentration (ng/g dry mass) 4000 A 25Ner - 50Ner c 1 DONer Q) E 25/Lag -ro ~ 50/Lag - c g 100/Lag ro c... 0> 25/Set 50/Set DPA ~ 70H-ABA :rs DPA.ABAGE. ABA 100/Set Control a Concentration (ng/g dry mass) 4000 B Figure 7.3. ABA and catabolite profiles of Baco noir berry skin sampled from ten irrigation treatments from Lambert Vineyards, Niagara-on-the-Lake, ON, 2006: A) at veraison and B) at harvest. Error bars indicate the standard error of the mean of three biological replicates. Set, Lag, Ver. are irrigation initiation times: fruit set, lag phase and veraison, respectively; * 25, 50, 100 are percentage of water replaced based on ETc. 340
363 25Ner 50Ner ~ii;;i:::::::~~:::::- ~ 100Ner J ~ 25/Lag -!~~...!:; 50/Lag c ~ 100/Lag co 25/Set.g> L... 50/Set OPA ~ 70H-ABA iliiii DPA.ABAGE. ABA 100/Set Control o Concentration (ng/g dry mass) 2500 A 2SNer SONer -c Q) E -co Q) L... -C 100Ner 2S/Lag SO/Lag ~ 100/Lag co 0> 2S/Set c L... SO/Set 100/Set Control DPA ;s 70H- ABA iliiii DPA.ABAGE. ABA Concentration (ng/g dry mass) 2500 B Figure 7.4. ABA and catabolite profiles Baco noir berry pulp sampled from ten irrigation treatments from Lambert Vineyards, Niagara-on-the-Lake, ON, 2006: A) at veraison and B) at harvest). Error bars indicate the standard error of the mean of three biological replicates. Set, Lag, Ver. are irrigation initiation times: fruit set, lag phase and veraison, respectively; * 25, 50,100 are percentage of water replaced based on ETc. 341
 A 2S/Ver SOlVer... c Q) 100/Ver 2s/Lag.")


364 2S/Ver SOlVer... c Q) 100/Ver 2S/Lag E SO/Lag... co Q)... loa/lag c 0 +" 2S/Set co.;:: en SO/Set... loa/set 1.Y. 70H-ABA :,; OPA Control a Concentration (ng/g dry mass) A 2S/Ver SOlVer... c Q) 100/Ver 2s/Lag... E SO/Lag co Q)... loa/lag c 0 ~ 2s/Set co.;:: en SO/Set /Set 1t! 70H- ABA ~ OPA Control a Concentration (ng/g dry mass) B Figure 7.5. ABA and catabolite profiles of Baco noir berry skin sampled from ten irrigation treatments from Lambert Vineyards. Niagara-on-the-Lake. ON. 2007: A) at veraison and B) at harvest. Error bars indicate the standard error of the mean of three biological replicates. Set. Lag. Ver. are irrigation initiation times: fruit set. lag phase and veraison. respectively; * 25.50, 100 are percentage of water replaced based on ETc. 342
 L- loa/lag - c 0 2S/Set :;:::; co 0> c L- SO/Set loa/set 1C1 70H- ABA!")
... E SO/Lag - co ~ loa/lag c 0 :;:::; co.;:: 0> L- 2S/Set SO/Set loo/set 1C1 70H-ABA!")


365 2S/Ver SOlVer -c 2S/Lag Q)... E SO/Lag co Q) L- loa/lag - c 0 2S/Set :;:::; co 0> c L- SO/Set loa/set 1C1 70H- ABA!l:i DPA 100/Ver Control a lsoo Concentration (ng/g dry mass) A 2S/Ver SOlVer... c 2S/Lag Q)... E SO/Lag - co ~ loa/lag c 0 :;:::; co.;:: 0> L- 2S/Set SO/Set loo/set 1C1 70H-ABA!l\l OPA.ABAGE ABA 100/Ver Control a ls Concentration (ng/g dry mass) 3000 B Figure 7.6. ABA and catabolite profiles of Baco noir berry pulp sampled from ten irrigation treatments from Lambert Vineyards, Niagara-on-the-Lake, ON, 2007: A) at veraison and B) at harvest. Error bars indicate the standard error of the mean of three biological replicates. Set, Lag, Ver. are irrigation initiation times: fruit set, lag phase and veraison, respectively; * 25, 50,100 are percentage of water replaced based on ETc. 343
 Concentration (ng19 dry mass) BI 25Ner_ 25Ner, 50Ner_ ~")
n (nglg dry mass) Concentration (ng/g dry mass) B2 25Ner, 25Ner. 50Ner.")
366 25Ner, 25Ner, e '" 50Ner. e: E 100Ner, ~ 100Ner, iii DPA ~ DPA ~ 25/Set t; c 25/Sel ;;70H,ABA 0 $70H-ABA 0 :::OPA :;. : CPA "".. 50/Set C) C) SOISet.ABAGE :.ABAGE ~ _ ABA R ABA 100/Set 100lSet Ql 50Ner, Conlrol Control Al a Concentration (nglg dry mass) Concentration (ng19 dry mass) BI 25Ner_ 25Ner, 50Ner_ ~ SONer. t; e: Ql Ol E 100Ner, ~ 100Ner, DPA! ~ OPA 25/Set t; c ;;loh-aba 251Set 0 ;;;70H-ABA 0 "". ::: OPA i :OPA '" 501Set C) Ol.ABAGE 50/Set :.ABAGE ~.. ABA. ABA 1001Se! 100/Set Control Control A Concentrati()n (nglg dry mass) Concentration (ng/g dry mass) B2 25Ner, 25Ner. 50Ner. E Ol S'OONer, ~ 25fSet C '" 50Ner, ~ 100Ner, OPA ~ t; 251Set "70H-ABA :::DPA :::D.PA.. c "70H-ABA 0 0 ~ 50lSet "" Ol Ol 50/Set ASAGE.ABAGE ~ ~ R ABA II ABA 100/Set 100/Sei Control Control A Concentration (ng/g dry mass) Concentration ( ng/g dry mass) B3 Figure 7.7. ABA and catabolite profiles of Chardonnay leaves sampled from seven irrigation treatments over the growing season from Lambert Vineyards, Niagara-on-the-Lake, ON, 2006 (AI to A3: means first to third sampling time) and 2007 (Bl to B3: means first to third sampling time). Error bars indicate the standard error of the mean ofthree biological replicates. (Al- 6 July, A2-20 July, A3-3 August; Bl- 5 July, B2-19 July, B3-2 August); *Set and Ver. are irrigation initiation times fruit set and veraison, respectively; * 25, 50, 100 are percentage of water replaced based on ETc. 344
 1000 0 500 1000 1500 Concentration (ng/g dry mass) 2000 B4 25Ner.!~~~~~::::=---l 25Ner. SONer. c ~ looiver.! - 251Set \"\".")
 o 500 1000 1500 Concentration (nglg dry mass) 2000 B5 Figure 7.8.")
367 2SNer. 2SNer. 50Ner. 1: Q) E 100Ner. Cii -.~ 251Set c::.9 } 50ISet ~::==;~~::~~ 100lSet i DPA ;'iloh ABA = DPA.ABAGE. ABA SONer. 1: a> Cii E looner. a>.l: c:: 2SISet 0 i C) ~ SOISet 100lSet DPA,nOH ABA io DPA.ABAGE U BA Control A4 o Concentration (ng/g dry mass) Concentration (ng/g dry mass) 2000 B4 25Ner.!~~~~~::::=---l 25Ner. SONer. c ~ looiver.! - 251Set "". gj, 50ISet : 100lSet DPA 'l!70h ABA = OPA.ABAGE. ABA c,. III E 5ONer......! 100Ner. c:: 0 2SISet ~ C) : SOISet 100lSet,nOH ABA =DPA.ABAGE ABA Control Control AS a BOO 1000 Concentration (nglg dry mass) o Concentration (nglg dry mass) 2000 B5 Figure 7.8. ABA and catabolite profiles of Chardonnay leaves sampled from seven irrigation treatments over the growing season from Lambert Vineyards, Niagara-on-the-Lake, ON, 2006 (A4 and AS: means fourth and fifth sampling time) and 2007 (B4 to B5: means fourth and fifth sampling time). Error bars indicate the standard error of the mean of three biological replicates. (A4-17 August, A5-30August, B4-16 August, B5-29 August); *Set and Ver. are irrigation initiation times: fruit set and veraison, respectively; * 25, 50,100 are percentage of water replaced based on ETc. 345
 A 25Ner 50Ner -c Q) E 100IVer --co ~ DPA 25/Set c ii\jj70h-aba 0 +=l co C'l c '- 50/Set 100/Set Control :::: DPA.ABAGE. ABA a 500 1000 1500 2000 Concentration (ng/g dry mass) B Figure 7.")

368 25Ner 50Ner -c Q) E 100IVer -co -~ DPA 25/Set c ;;:;70H-ABA 0 :;::::; CO C'l c '- 50/Set 100/Set Control ::::DPA.ABAGE ABA a Concentration (ng/g dry mass) A 25Ner 50Ner -c Q) E 100IVer --co ~ DPA 25/Set c ii\jj70h-aba 0 +=l co C'l c '- 50/Set 100/Set Control :::: DPA.ABAGE. ABA a Concentration (ng/g dry mass) B Figure 7.9. ABA and catabolite profiles of Chardonnay berry skin sampled from seven irrigation treatments from Lambert Vineyards, Niagara-on-the-Lake, ON, 2006: A) at veraison and B) at harvest). Error bars indicate the standard error of the mean of three biological replicates. *Set and Ver. are irrigation initiation times: fruit set and veraison, respectively; * 25, 50, 100 are percentage of water replaced based on ETc. 346
 C>... c 25/Set 50lSet 100")
 1500 B Figure 7.10.")
369 ... c (I) 25Ner 50Ner E 100Ner -ro e 251Set -c 0 +=I ro SO/Set 0)... c 100/Set DPA 70H-ABA... DPA.ABAGE ABA Control Concentration (ng/g dry mass) lsdo A 25Ner 50Ner -c (I) E 100Ner... - c 0 :;::::; ro -ro (I) C>... c 25/Set 50lSet 100/Set DPA 70H-ABA = DPA.ABAGE. ABA Control a Concentration (ng/g dry mass) 1500 B Figure ABA and catabolite profiles of Chardonnay berry pulp sampled from seven irrigation treatments from Lambert Vineyards, Niagara-on-the-Lake, ON, 2006: A) at veraison and B) at harvest from. Error bars indicate the standard error of the mean of three biological replicates. *Set and Ver. are irrigation initiation times: fruit set and veraison, respectively; * 25, 50, 100 are percentage of water replaced based on ETc. 347
 2000 A 2SNer... SONer c (l.)... E 100Ner... Cll (l.)... c 0 :0:; Cll C).;::.")


370 2SNer... c (l.) SONer.E 100Ner co... ~ c 2S/8et o ;; CO C) &E SOISet toolset i;;l 70H- ABA tli DPA.ABAGE. ABA o Conc~ntration (ng/g dry mass) 2000 A 2SNer... SONer c (l.)... E 100Ner... Cll (l.)... c 0 :0:; Cll C).;::... 25/Set 50/Set 100/Set i;;l 70H- ABA tii DPA.ABAGE ABA Control Concentration (ng/g dry mass) 2000 B Figure ABA and catabolite profiles of Chardonnay berry skin sampled from seven irrigation treatments from Lambert Vineyards, Niagara-on-the-Lake, ON, 2007: A) at veraison and B) at harvest). Error bars indicate the standard error of the mean of three biological replicates. *Set and Ver. are irrigation initiation times: fruit set and veraison, respectively; * 25, 50, 100 are percentage of water replaced based on ETc 348


371 25Ner - 50Ner c Q) E 100Ner -ro Q)... - c 25/Set ts 70H- ABA 0 ~... DPA ro 0> -;:: 50/Set.ABAGE /Set Control. ABA Concentration (ng/g dry mass) A 25Ner - 50Ner c Q) E 100Ner -ro Q)... - c 25/Set! 70H- ABA 0 ~ :::i DPA ro 0> -;:: 50/Set.ABAGE.... ABA 100/Set Control Concentration (ng/g dry mass) B Figure 7 _12. ABA and catabolite profiles of Chardonnay berry pulp sampled from seven irrigation treatments from Lambert Vineyards, Niagara-on-the-Lake, ON, 2007: A) at veraison and B) at harvest). Error bars indicate the standard error of the mean of three biological replicates. *Set and Ver. are irrigation initiation times: fruit set and veraison, respectively; * 25, 50, 100 are percentage of water replaced based on ETc. 349
 Figure 7.13.")

372 10 Biplot (axes Fl and F2: %) Control 5 + 2S/Set + SMlOO SM40 - ABAGE-Ieaf PA-S.Ver 70H- ABA-S.Ver. M20 '* o:::t o:::t 2S/Ver + I""- 0.-t N u /Lag + SO/Ver. +IOO/Ver.IOO/Set o Fl (43.09 %) Figure Principal component analysis biplot (F1&F2) of soil and vine water status and water stress hormone composition from 10 irrigation treatments of Baco noir from Lambert Vineyards, Niagara-on-the-Lake, ON, Set, Lag and Veraison are the time for irrigation imposition and 100, 50 and 25 represent percentage of the water replaced in the soil through irrigation. Abbreviations used: SM (10 to 100) - soil moisture at 10 to 100 depth, \Jf-Ieaf water potential, Ts-transpiration rate, S.Ver.(skin veraison), S.Har. (skin harvest). 350
 BAGE-Ieaf DPA-Har..;'S/Lag SOlVer ABA-Ver SO/Lag 15 25 Figure 7.14.")

373 - '* co...t N u loo/set Biplot (axes Fl and F2: %) DPA-le?J I10 DPA-S. Har. SM100 70H- ABA-leaf 70H- ABAVer DPA-Ver.2S/Ver ABAGE-Ver Control ~2_Af:~e~ Ver. ABA-Har. ABAGE-S.Har. ABA-leaf SOI.Set Ts 1ft' DPA-S. r I SM30,70.. ~~B~~~?~ar, loo/lag loo/ver F1 (44.40 %) BAGE-Ieaf DPA-Har..;'S/Lag SOlVer ABA-Ver SO/Lag Figure Principal component analysis biplot (F1&F2) of soil and vine water status, and water stress hormone composition from 10 irrigation treatments of Baco noir from Lambert Vineyards, Niagara-on-the-Lake, ON, Set, Lag and Veraison are the time for irrigation imposition and 100, 50 and 25 represent percentage of the water replaced in the soil through irrigation. Abbreviations used: SM (10 to 100) - soil moisture at 10 to 100 depth, ",-leaf water potential, Ts-transpiration rate, S.Ver.(skin veraison), S.Har. (skin harvest). 351

 Figure 7.15.")
374 10 Bip/ot (axes F1 and F2: %) 5 Color Intensity - 2S/Ver ABA- S.ver. SO{Set.1OO/Set '* <:t t I ABAGE-S.Ver. SM 0 Lt"I on ro TsSMlOO I DPA-. r~~ loo/lag N SO/V~~hoc. u.. Hue, SO/lag -5.1OO/Ver Fl (43.77 %) Figure Principal component (Fl&F2) of soil and vine water status, berry composition, and water stress hormone composition (skin-veraison) from ten irrigation treatments of Baco noir from Lambert Vineyards, Niagara-on-the-Lake, ON, Set, Lag and Veraison are the time for irrigation imposition and 100, 50 and 25 represent percentage of the water replaced in the soil through irrigation. Abbreviations used: SM (10 to 100) - soil moisture at 10 to 100 depth, ",-leaf water potential; Ts-transpiration rate; S. Ver.- skin veraison; ph-juice ph; TA-juice titratable acidity; anthoc.- anthocyanin content. 352
 20 25 Figure 7.16.")

375 15 Biplot (axes F1 and F2: %) "*-.-I Lr) N N N u loa/set DPAtaf ev DPA-Har. 5 70H- ABAVer loo/ver. ~M60 70H- c.w. ~~~~_ ABA-leaf BAGE-Har. ABA-Ver BYe Brix DPA-Ver iii ABAGE-Ver 25/Set Control.25/Ver Fl (44.90 %) Figure Principal component analysis biplot (Fl&F2) of soil and vine water status, yield components and berry composition, and water stress hormone composition from seven irrigation treatments of Chardonnay vines from Lambert Vineyards, Niagara-on-the-Lake, ON, Set and Ver. are the time for irrigation imposition and 100, 50 and 25 represent percentage of the water replaced in the soil through irrigation. Abbreviations used: SM (10 to 100) - soil moisture at 10 to 100 depth, 'II-leaf water potential; Ts-transpiration rate; S. Ver.(skin veraison); S. Har. (skin harvest), B/C-berries no. per cluster; C/V-clusters per vine; BW-berry weight; CW-cluster weight; ph-g-juice ph, TA-G -juice titratable acidity. 353
376 15 Biplot (axes Fl and F2: %) 2S/Set + ABAGE-Ver ABAG - 5 ABA- 'cr. ABAGE-Ieaf o::;t,... ph - ""'- 6 < a N 2S/Ver. + -N Contro + SO(Ver. + u.. -5 ABAi er B.w. II~BA-Ieaf 70H- ABA-leaf PA-Ver. OH- ABAVer SM40 IOO/Set /Ver Fl (42.98 %) Ts Figure Principal component analysis biplot (Fl&F2) of soil and vine water status, yield components, berry composition, and water stress hormone composition from seven irrigation treatments of Chardonnay vines from Lambert Vineyards, Niagara-on-the-Lake, ON, Set and Veraison are the time for irrigation imposition and 100, 50 and 25 represent percentage of the water replaced in the soil through irrigation. Abbreviations used: SM (10 to 100) - soil moisture at 10 to 100 depth, 'If-leaf water potential; Ts-transpiration rate; S. Ver.(skin veraison); S. Har. (skin harvest), B/C-berries no. per cluster; CIY-clusters per vine; BW-berry weight; CW-cluster weight; ph-g-juice ph, TA-G -juice titratable acidity. 354
377 Chapter 8 Exogenous ABA and its Impact on Vine Physiology and Grape Composition of Vitis vinifera L. cv. Cabernet Sauvignon in a Cool Climate Area The Niagara Peninsula has to deal with high climate variability. In cool years, veraison time occurs later and grape ripening problems can be seen in the cultivars which have genetically long ripening period. In order to test the hypothesis that by using exogenous ABA one can hasten the veraison and improve grape composition in cool and wet years, two experiments were conducted in one commercial Vitis vinifera L. cv. Cabernet Sauvignon block, located on Niagara-on-the-Lake, Ontario, Canada, over a period of two years ( ). Both experimental years were characterized by higher amount of rainfall and lower temperature than average. The first experiment had four treatments consisting of full canopy, only clusters, and only leaves sprayed plus an untreated control. All treatments were sprayed three times, at two weeks period between applications. All treatments were initiated one week before veraison. The second experiment had three treatments represented by rates of 150 and 300 mg/l and untreated control. Three replicates were assigned per treatment for each experiment. In 2008, after two weeks from experiment initiation, clusters from control still had % green berries, while in 2009 the same percentage was found after 4 weeks. The way through the exogenous ABA reach the fruit is very important in regards of its effects on the ripening process and the fruit composition, berries showed a lower ABA uptake rate than the leaves. In both experimental years the highest effect on fruit composition were observed in vines where whole canopy or only leaves were sprayed. No signs of leaf senescence were observed in any of the ABA treatments. Both treatment concentrations, 150 mg/l and 300 mg/l ABA, hastened the onset of veraison. Transpiration rate was affected mostly in treatments where only leaves and whole canopy was sprayed but no strong effect was observed on leaf water potential. The berry weight was lower in the ABA treatments than the control. At harvest berries from all treatments were uniformly colored, but the berries from clusters treated with the highest ABA concentration showed a higher red-blue color intensity and slightly higher in soluble solids. The treated vines showed not only variation in the total amount of the anthocyanins but also a change in the ratio among them. The highest variation among the treatments was observed in terms of cyanidin, petunidin and malvidin. Overall, using external ABA showed to be effective in hastening the veraison and improve the grape composition of Cabernet Sauvignon. Introduction Abscisic acid (ABA) is a plant hormone which plays a major role in plant adaptation to abiotic environmental stresses (drought, cold and salinity), growth control, seed development, and germination. ABA is involved in the signaling chain of water stress in plants (Christmann et al. 2007, Jiang and Hartung 2008). When ABA concentrations increase during water stress, the stomata close and affect both the transpiration and plant hydraulic conductivity (Stoll et al. 2000). ABA plays a role in the ripening process in grapes (Antolin et al. 2003, Genyet al. 2005, Okamoto et al. 2004). This hormone was associated with the main molecular processes during grape berry ripening (Jeong et al. 2004). Transcripts and proteins linked to ABA biosynthesis have 355
378 been found in berries during the ripening process (Caste11arin et al. 2007, Deluc et al. 2007, Giribaldi et al. 2007). Moreover, ABA has been described as the mediator of the expression of genes involved in the anthocyanin biosynthesis pathway (Hiratsuka et al. 2001). ABA, at certain concentrations, expresses genes encoding invertase or controlling phenol and anthocyanin biosynthesis (Ban et al. 2003, <;akir et al. 2003, Gagne et al. 2006, Pan et al. 2005, Peppi and Fidelibus 2008). ABA treatments at veraison enhanced several processes involved in berry ripening, such as the accumulation of soluble solids, the decrease in the concentration of organic acids, and anthocyanin accumulation (Coombe and Hale 1973, Palejwala et al. 1985, Pirie and Mullins 1976, Wheeler et al. 2009). ABA is also synthesized in the leaves, and transported to the clusters via the phloem vessels (Shiozaki et al. 1999, Wheeler et al. 2009). In grapes, anthocyanin accumulation begins at veraison, and appears to be regulated by ABA (Antolin et al. 2003, Ban et al. 2003, Kataoka et al. 1982). ABA concentrations in berry increase just before veraison (Antolin et al. 2003, Coombe and Hale 1973, Davies et al. 1997, Scienza et al. 1978). Besides of its genetic control, ABA concentration and its effects in plant are affected by the environmental conditions such as temperature (Koshita et al. 2007, Mori et al. 2005), light (Jeong et al. 2004),. and water stress (Antolin et al. 2006, 2007, De1uc et al. 2009, Stoll et al. 2000). Increased concentrations of ABA during the growing season is associated with growth restriction by water stress, which is postulated to be an adaptation mechanism to the adverse condition imposed by water stress (Christmann et al. 2007, Dry et al. 2000, Jiang and Hartung 2008). In Vitis vinifera, periods of moderate water deficit (predawn water potential of;::; -0.8 MPa) during ripening enhanced the polyphenol and anthocyanin concentrations in the berries (Freeman and Kliewer 1983, Hardie and Considine 1976, Matthews and Anderson 1988, Ojeda et. al. 2002). These compounds are important for human health due to their antioxidant capacity (Burns et al. 2000). Exogenous applications of ABA increased the anthocyanins concentration in skins of table grape cultivars Flame Seedless and Red Globe (Peppi et al. 2006, 2007). However, they also showed that no linear relationship was found between grape color variables and the amount of anthocyanins, although, grapes having high skin anthocyanin concentration appeared darker and more red-colored than grapes having low anthocyanin concentration (Peppi et al. 2006, 2007). Anthocyanin concentrations ranged from 6.2 to 26 mg ki 1 of berry in pigmented cultivars (Mattivi et al. 2006). From the winemaking point of view, anthocyanin composition affects the color stability. Cyanidin, delphinidin and petunidin have ortho-diphenolic groups which enhance 356
379 susceptibility to oxidation (Sroka 2005). Methoxylated anthocyanins, such as peonidin and malvidin, are more stable. The relative number of hydroxyl and methoxyl groups also affects polarity and solubility of the corresponding anthocyanins in aqueous and hydro-alcoholic solutions such as must and wine (Castellarin and Di Gaspero 2007). Weather is the main factor that makes a certain vintage great, thus its high variability in Niagara Region (long, hot and dry seasons alternating with short, cool and wet seasons) leads to some inconsistency in wine quality from vintage to vintage. Cabernet Sauvignon, which is widely grown in this region along with Merlot and Cabernet franc, has a long ripening period being highly affected by the weather conditions. In cool climates as this from the Niagara Peninsula, Cabernet Sauvignon shows high variation from vintage to vintage not only in quantity but also in fruit composition. The poor quality of Cabernet Sauvignon wines is mostly associated with cool and wet years while high quality was recorded in dry and hot years. Even using the best cultural practices in the vineyard, the quality of Cabernet Sauvignon grape is not improved in cool and wet years. This study was initiated as a consequence of other research done in the Niagara Region, regarding the relationship of vine water status, ABA and its catabolites profiles (Chapter 7). There are a limited number of studies on the effect of exogenous ABA application on wine grapes, perhaps because for a long period this product has had a prohibitive price. Historically, the cost to produce ABA was too high to justify its use as an agrochemical product, but recently, ABA production methods have improved sufficiently to reconsider its potential use in viticulture. There are just few reports of the effects of ABA on grape yield and composition in field experiments located in cool areas, and some of them have had contradictory results. In this study, it was tested the hypothesis that by applying exogenous ABA onto vines in cool and wet years, one could mimic the positive effects of moderate water stress, and thereby hasten veraison, and improve grape composition of Cabernet Sauvignon. This study tested the effects of exogenous ABA when different vegetal organs were targeted, since most of the previous studies used only berries for ABA application. This research might be useful to grape growers from cool areas, or when abnormal weather conditions occur, in order to meet objectives with respect to fruit composition of red cultivars
380 Materials and Methods Experimental design. The experiments were conducted over two growing seasons (2008 and 2009) in a commercial vineyard (Lambert Vineyards Ltd.) in the Niagara Peninsula Appellation of Ontario (43 13' N,79 08' W, elevation 98 m), Canada. The trials were set up in one Cabernet Sauvignon block (25 rows in total), grafted on S04. Vines were spaced at 1.2 m x 2.7 m, trained to a double Guyot system, and vertically-shoot positioned. Row orientation was north-to-south. Soil management consisted of fertilization annually with 25 t ha- 1 fresh dairy manure, with floor management of alternate rows of annual ryegrass and clean cultivation. Pest control was in accordance with local recommendations (OMAFRA 2007). Three single - row blocks (replicates) for each experiment were assigned. In the ftrst experiment four treatments were assigned, each treatment having different organs treated with a 300 mg/l ABA solution (unsprayed control; and sprayed full canopy, clusters, or leaves). For the second experiment, only clusters were sprayed in all three treatments assigned: control (unsprayed), and two ABA concentrations of 150 mgil and 300 mgil, respectively. In each row replicate, the treatments (one panel of six vines each) were randomly assigned and equally distributed. The product used for spraying was supplied by Valent Biosciences Corporation (Libertyville, IL, USA), and is known as VBC (20% ABA). The hormone was applied between 800h and l000h until run off using a lo-l Solo backpack sprayer. All treatments were imposed one week before veraison, and they were repeated subsequently every 2 weeks for a total of three applications. Vine water status. Biweekly observations were conducted between veraison and harvest time to monitor vine water status. Midday leaf water potential ('1'), transpiration rate (Ts), leaf temperature (T 1 ) and photosynthetic photon flux density (PPFD) data were collected from mature leaves and fully exposed to the sun between ll00h and 1300h. Three leaf samples from three different shoots located close to the trunk and the two extremities were chosen from three vines per each treatment replication. The methodology and instruments used for data collection were described in detail in Chapter 3a. Soil water status. Soil moisture was assessed over a period of 2 years in 2008 to Data was collected from all experimental vines (six per each treatment replicate) starting with one week before first ABA application, and biweekly thereafter. The protocol for data collection and instrument used were described in detail in Chapter 3a. Fruit composition and yield components. Each year at harvest maturity, a ISO-berry sample was collected randomly from each recorded vine and stored at -30 C for future analysis of 358
381 soluble solids, titratable acidity (TA), ph, total anthocyanins and total phenols. These samples were used to determine the other yield components such as the number of berries per cluster, and cluster weight. The protocol and instruments used in measuring variables mentioned above were described in detail in Chapters 3a and 3b. Extraction, preparation and analysis of anthocyanins from berry skin. In 2009 at harvest, 25 berry samples were collected from each recorded vine and quickly frozen in liquid nitrogen. They were transported to Brock University and stored at -25 C for further analysis. All berries were peeled while they were still frozen. They were weighed and then lyophilized for 24h. To approximately 1.5 g of the dry skins it was added cold acidified methanol (containing 2% formic acid), and anthocyanins were extracted in a Wareing blender (5 min.). The extraction solution was centrifuged at 7000 rpm for 10 minutes. The precipitate obtained was then extracted once more in the same manner. The extract solution was filtered through a membrane filter ( m) before loading into the high performance liquid chromatograph (HPLC). An Agilent 1100 Series HPLC (Agilent Technologies, Palo Alto, CA) equipped with a micro vacuum degasser, binary pump, thermostatted micro autos ampler, thermostatted column compartment, UV Nis diode array detector (DAD) and HP Chemstation 3D software was used for ABA identification and quantification. Separation was carried out using an Agilent Zorbax Stablebond SB-C18 reverse-phase column (50 rom x 4.6 rom, 3.5 Jlffi) with a Phenomenex SecurityGuard C-18 4 rom guard cartridge. The binary mobile phase consisted of 0.2% trifluoroacetic acid (TFA) (solvent A), and HPLC-grade acetonitrile and 0.2% TFA (solvent B), as per Them-Gomez et al. (2002). Flow rate was 1.0 mumin. The gradient was as follows: 5% B (0 min), 35% B (15 min), 100% B (16-25 min), 5% B (26 min). Post-run time was 10 minutes for a total run time of 36 minutes. Samples and column temperatures were maintained at 30 C. Sample injection volume was 5 J.1L. The detector was set to wavelengths of 525 nm (bandwidth 20 nm) for anthocyanins. Anthocyanin standards were obtained from Extrasynthese SA (Genay, France). Standards analyzed were delphinidin-3-0-glucoside, cyanidin-3-0-glucoside, petunidin-3-0-glucoside, peonidin-3-0-glucoside, and malvidin-3-0-glucoside. Identification of compounds was carried out by comparing their retention times with the standards. Quantification of anthocyanins was done by generation of a standard calibration curve of the various anthocyanin standards using built-in calibration functionality of the HP ChemStation software. Acetylated anthocyanins were identified by comparing the peak retention times with those in the literature. These anthocyanins were quantified using concentrations of the equivalent non-acylated anthocyanins. 359
382 ABA and catabolites analyses. Leaf samples for ABA analysis were collected during 2008 and 2009 only from vines where the whole canopy was sprayed. A total of nine leaves from each treatment replicate were collected from three recorded vines. The leaves were collected from the same vines from where vine water status data was collected at 2, 4 and 6 h following ABA application. The leaves were immediately introduces in cryogenic vials, kept in liquid nitrogen and transported to the Brock University Viticulture Lab where they were prepared for future analysis. Twenty-five berries were collected randomly from each treatment replicate following the same protocol as that one used for leaf sampling. Both berries and leaves underwent the same preparation and extraction protocol. Berry samples were weighed, washed in 25-mL acidified isopropanol for 1 minute, peeled while frozen, and separated into skin and pulp fraction. Both sample fractions were grounded under liquid nitrogen using a mortar and pestle. The powdered samples were lyophilized and then kept at -25 C in sealed 25-mL plastic vials under dark until extraction was performed. The extraction and analysis protocol along with the equipment used were described in detail in Chapter 7. Data analysis. Yield components and berry composition data were analyzed using the SAS statistical package (SAS Institute; Cary, NC). Using GLM, analysis of variance was performed on physiological and chemical data. Duncan's multiple range test was used for mean separation for all data sets (field and chemical), and Dunnett's t-test was used to determine those treatment means that were statistically different from the control at a significance level of ~0.05. Principal components analysis (PCA) was performed on the means of field data, yield components, and hormone profile data. Results and Discussion Weather summary (Table 8.1). Analyzing rainfall and temperature data over the growing season for the period studied (2008 to 2009) from Virgil Station, Niagara-on-the-Lake, ON, helped for a better understanding of the seasons. In 2008, the monthly mean temperature was lower than the 25-year average only in August while in 2009 the temperature was lower over the entire growing season compared to the average. Moreover, the lower temperature was accompanied by high precipitation in both years of the study, with almost double the average amount in July 2008 and August 2009 (Table 8.1). Due to weather conditions, veraison occurred in 360
383 2009 one week later than 2008, and thus, the first ABA application in 2009 was later too. In 2009, an early frost on 30 October resulted in a loss of the foliage. Field observations. Observations from the first experiment indicated that the vegetal organs targeted by the exogenous ABA are very important in regards to its effects on the ripening process and the fruit composition (Fig. 8.1). In 2008, after 2 weeks from the experiment's initiation, the clusters from the control showed little sign of coloration, while the vines treated with ABA had clusters with different levels of pigmentation (Fig. 8.1). Clusters from vines where the whole canopy was treated with ABA showed the highest percentage of coloration, followed by treatments where leaves and clusters were sprayed (Fig. 8.1). In the second experiment, both ABA concentrations used (150 mgil and 300 mgil) hastened the onset of veraison in After 4 weeks from experiment initiation, clusters in the control still had approximate 15 % green berries (Fig. 8.2). At harvest, berries from both concentration treatments were uniformly colored, but the berries from clusters treated with the highest ABA concentration showed higher color intensity. The same visual perception was observed in At harvesting, the berries from all treatments were uniform colored. However, the berries from clusters treated with the highest ABA concentration showed higher blue color intensity. Observations from this research are in agreement with those of Giribaldi et al. (2009) which showed that ABA was most effective in enhancing ripening when it was supplied before veraison (green stage) and not at later stages (50% or more berry coloration), probably due to the fact that at these later stages the endogenous ABA concentration increased naturally (Owen et al. 2009). Ripening is linked to tissue softening in most fruits, and the grape berry does not make an exception. At each sampling date berries from the vines treated with ABA showed a higher degree of softness. This phenomenon was not accompanied by any premature berry abscission. ABAwas more effective than ethephon at improving the color of Crimson Seedless table grapes, although, sometimes this treatment induced berry softening, an undesirable condition for table grapes but not in wine grapes, especially for areas suitable for mechanical harvesting (Crisosto and Mitchell 2000). Moreover, Crimson Seedless table grapes treated with 300 ill L- 1 ABA had the harvest date hastened between 10 to 30 days compared with the non-treated vines (Cantin et al. 2007). Yield components and berry composition (Tables 8.2 and 8.3). Experiment 1 (Table 8.2). In both years studied, cluster weights from control and the treatment in which clusters were 361
384 only sprayed showed constantly higher values than treatments where only leaves or the whole canopy were sprayed. However, in 2009 the difference among the treatments was 10% higher than that recorded in 2008 for berry and cluster weight and skin mass. The number of berries per cluster did not show a large difference between treatments. In 2009, the number of berries per cluster was lower than 2008 when similar treatments were compared, possible due to the 2008 weather effect. However, differences in cluster weight were determined more by berry weight rather than by the number of berries per cluster. The skin fresh mass was higher in both years in the control treatment compared to the treated ones by 10 to 20%, while the skin dry mass was lower in the control and higher in the treated vines (Table 8.2). The effect of ABA on Brix was not very high at the harvest time, although a difference was found between the control and the whole canopy treatments. The difference between the control and treated vines was from 2 to 5% in 2008 and higher in 2009 (5 to 9% ). The ABA treatments slightly affected the TA in both years. ph was affected only in 2008, with the highest ph value being found in the treatment where only leaves were sprayed. However, no consistent patterns were found among the treatments for TA or ph. Experiment 2 (Table 8.3). The cluster weights in the treatments where different concentrations were used showed the same trend as in the ftrst experiment. However, the magnitude of difference between treatments was lower than in the fust experiment for most of the variables measured, especially in The number of berries per cluster showed different pattern in each year studied. In 2008, the number of berries per cluster was low in the control and higher in the treated vines and vice versa in 2009 (Table 8.3). Berry weight showed the same trend in both years as in the first experiment but the magnitude of difference between treatments was much lower compare to that one found among treatments in the ftrst experiment. Skin fresh mass was slightly higher in control than in treated one, the same pattern being found in 2009 (Table 8.3). Slight variation was found in terms of berry composition, and a consistent pattern was found in terms of Brix, but not for T A and ph. These data are in agreement with some studies where the enhancement of ripening by ABA in grapevine was observed at the composition level (Coombe and Hale 1973, Pirie and Mullins 1976, Wheeler et al. 2009). However, no changes were found in berry size or juice composition of Merlot treated with exogenous ABA (Owen et al. 2009). The lack of variation in berry composition might be explained not only by the cultivar used but also by the time of application and the number of treatments.applied ABA not only increased berry set and prevented premature berry abortion, but also enhanced the sink capacity for carbohydrates of berries from ABA-treated plants (Brenner 1987). Contrary to the expectation in the present study, a significant increase in 362
385 cluster weight and yield per vine was found in ABA-treated vines of Cabernet Sauvignon (Quiroga et al. 2009). These different results could be explained by different weather conditions in Mendoza than those from the present experiments (data not shown), and also by the time and number of ABA applications. The same authors started ABA application immediately after bud-burst and continued weekly until harvest. They concluded that yield increased due to the applied ABA that "somehow" increased berry set or reduced early berry abortion. The low berry weight in the ABA treated vines could be explained by the fact that the ABA controls the water uptake into the berry through the hydraulic conductivity in the plant. In Arabidopsis, several aquaporins were downregulated by water stress and by ABA (Jeong et al. 2004). Among the great number of aquaporins which exist, not all of them are upregulated or downregulated in the same time due to external stress factors (Jang et al. 2004) Anthocyanins and phenols (Table 8.4). In the first experiment in 200S, anthocyanin concentration was almost double in the treatments where only leaves and whole canopies were sprayed compare to the control, while in 2009 the total anthocyanins concentration was almost three fold higher in the same treatments than the control (Table S.4). Findings from this experiment are supported by the data discussed in Chapter 7, and are in agreement with findings of Roby et al. (2004) who indicated that both phenolics and anthocyanins showed a greater concentration in the skin of berries from grapevines that experienced water deficit, and presumably had more ABA. The lowest effect on anthocyanin accumulation in berries was from treatment where only clusters were sprayed. This finding is somehow in contradiction with the Valent Biosciences company recommendation, which suggested spraying only the clusters, in order to obtain the best results. The variation of grapes composition among treatments is also explained by the ABA biological activity, which is reduced by longer exposure to direct light and oxygen (Abrams 1999, Flores and Dorflling 1990). This might.also be explained by the fact that the highest uptake rate occurred at the leaf level (Fig. S.3, S.4A and B). In the second experiment, the ABA concentration increased the total anthocyanins and phenolics in both years studied. However, the magnitude of difference between treated vines and control was much lower than that one found in the first experiment. The exogenous ABA also affected the total phenols concentration. The magnitude of difference between treatments was higher in 200S and lower in In the first experiment, all ABA treated vines had higher total phenols than the control in 200S.1t was not the case in 2009, when just one treatment (only leaves) was higher than the control. In the second experiment, 363
386 treated vines had consistent higher phenol concentration. However, no consistent pattern was observed from season to season. The findings from the present research are in agreement with other studies where anthocyanins formation in berry was accelerated by ABA treatmentafier veraison (Matsushima et al. 1989, Taiara et al. 1988). Temperature is known to influence the accumulation of anthocyanins in berry skins (Spayd et al. 2002). Temperature-control experiments have also shown that exposing whole vines or clusters to high temperature (30 C) inhibited anthocyanins accumulation (Kataoka et al. 1984, Kliewer 1970, Mori et al. 2004). Low temperature facilitates the biosynthesis of ABA or reduces its degradation which leads to a higher concentration of anthocyanins in the berries (Tomana et al1979, Yamane et al. 2006). However, in the present experiments in both growing seasons low temperature was associated with high soil moisture level, which might have the same negative effect on ABA concentration as too high temperature. The data showed that the control had the lowest ABA amount atboth sampling dates but was highly correlated with the anthocyanins concentration (Figs. 8.4, 8.5). These findings are partially in agreement with other studies (Ban et al. 2003, Gagne et al. 2006, Jeong et al. 2004, Pirie and Mullins 1976) where anthocyanins and phenols were affected in an opposite pattern as response to ABA accumulation, which was not the case in present experiments (Table 8.4). The concentration of anthocyanins also increased in Cabernet Sauvignon berries in one experiment where external ABA was used (Gagne et al. 2006). However, other authors found just a small increase in anthocyanins concentration when ABA was applied on clusters of Merlot (Owen et al. 2009). They suggested that this could be an effect of either ABA or DP A. Berry ABA concentrations increase just before veraison (the beginning of color change) (Antolin et al. 2003, Coombe and Hale 1973, Davies et al. 1997). Transcripts and proteins linked to ABA biosynthesis have been found in ripening berries (Deluc et al. 2007, Giribaldi et al. 2007), although, some evidence exists that ABA might also be synthesized in the leaves, and transported to the clusters via the phloem vessels (Shiozaki et al. 1999, Wheeler 2006). The hypothesis that ABA could trigger ripening in the grape berry has been demonstrated in different studies by using exogenous ABA. By spraying this hormone at veraison several processes involved in berry ripening, such as the accumulation of soluble solids, the decrease in the concentration of organic acids, and anthocyanin accumulation were enhanced (Coombe and Hale 1973, Palejwala et al. 1985, Pirie and Mullins 1976, Wheeler et al. 2009). However, in most of the studies exogenous ABA activated only few metabolic pathways related to the ripening process, so its full physiological role in the vine is still unknown. 364
387 In this research data shows that exogenous ABA can successfully mimic water deficits even in vines with high water status, thus having a positive effect on anthocyanins accumulation. Berries from treatments where exogenous ABA was applied, increased the dry skin mass in both years. This suggests that increasing anthocyanins concentration is not necessary due to reducing the ratio berry volume:area surface but also due to more cell layers in the skin. These findings are in agreement with another study where deficit irrigation increased skins mass, this being the predominant tissue of flavonoid biosynthesis (Robyet al. 2004). In Chapter 7 was found a high correlation between vine water status and ABA level in leaves and berries. Effects of water deficit on gene expression and anthocyanins accumulation were maintained far after vines were released from water deficit (Castellarin et al. 2007). This might be due to high ABA accumulation during the water deficit. Also, it was found high ABA concentration in berries from treated vines compared to control even after four weeks from first application (Figs. 8.4, 8.5). Individual anthocyanins (Table 8.5). Data on anthocyanins composition showed that ABA affects not only the total concentration of anthocyanins but also the ratio among different types of anthocyanins which support the visual observations regarding the color and berry hue (Table 8.5). Significant differences were observed in both groups of anthocyanins studied. The acetyl glycosides were found much less compared to non acetylated glycosides. Due to obvious visual differences in color intensity and hue among berries from different treatments in 2009, an analysis of anthocyanin composition was performed. In the first experiment, with few exceptions concentration of both non-acylated anthocyanins and acetylglucosides increased in berries from ABA treatments (Table 8.5). However, treatments in which whole canopy or only leaves were treated had much higher concentrations in almost all anthocyanins analyzed compared to control. The 3-acetyl glucosides showed the same pattern as non-acylated glucosides. However, their concentration was much less than their non-acylated counterparts in both seasons and experiments. The visual observations in color intensity and hue were confirmed through chemical analyses (Table 8.5). Thus, the anthocyanins increased differently in ABA treatments, and therefore, changed the ratio between them. Therefore, color intensity and hue were affected. In most of the treatments, based on their concentration, anthocyanins were ranked as follows: malvidin> delphinidin > peonidin > petunidin >cyanidin. The highest magnitude of difference between control and treated berries was found in malvidin and delphinidin (Table 8.5). Although, acetylglucosides increased in ABA treatments, they did not increased linearly. The ratio between different acetylglucosides components was different than that one found among non-acylated components (Table 8.5) 365
388 In the second experiment, berries treated with 300 mgil had much more malvidin, delphinidin, and petunidin than the control. Cyanidin and petunidin were less in the ISO mgil treatment than the control, which was different from what was expected (Table 8.S). Quantity and composition of anthocyanins influence skin color in black and red cultivars (Mazza and Miniati 1993, Shiraishi and Watanabe 1994). Color of pure anthocyanins shifts progressively from red to blue as the number of substituted groups on the B-ring increases, and as methoxyl groups replace hydroxyl groups (Holton and Cornish 1995). The ratio of blue trihydroxylated to red di-hydroxylated anthocyanins is under transcriptional control of flavonoid 3'(S')-hydroxylase genes (F3'H and F3'S'H), and it correlates well with the evolution of color hue throughout the ripening period in the cultivar Merlot (Castellarin et al. 2007a, b). Cyanidin-based anthocyanins exhibit a reddish color whereas delphinidin-based anthocyanins are purple to blue. They jointly determine the tonality of red berry grape cultivars and their corresponding wines. The relative proportion of the five anthocyanins is largely under genetic control and unique to each cultivar (Albach et al.19s9, Roggero et ali986). Some studies showed that anthocyanin accumulation is under plant hormone control, ABA concentration in the skin being highly correlated to the accumulation of anthocyanins (Kataoka et al. 1982, 1984; Pirie and Mullins 1976). Kyoho grapes treated with ABA at veraison enhanced the accumulation of anthocyanin and the expressions of PAL, CHS, CHI, DFR, LDOX, and UFGT genes in the berry skins (Ban et al. 2003). ABA treatment ofcabemet Sauvignon grapes enhanced the expression of VvmybAl, which coincided with the enhanced expression of enzymes involved in anthocyanins biosynthesis pathway (Jeong et al. 2004). Early deficit irrigation in the experiments hastened the onset of veraison by almost 7 days compared to control (full season irrigation). Berries also synthesized a higher percentage of trihydroxylated anthocyanins (Castellarin et al. 2007a). Assuming that this happened due to high ABA concentration, data from this research is in agreement with their findings. In treatments where ABA was applied, a higher percentage oftri-hydroxylated anthocyanins were found compared to the control (Table 8.S). The increase in 3'4'S' -hydroxylated anthocyanins constitutes an enrichment of purplelblue pigments, hence modifying grape and must color (Castellarin et al. 2006). ABA infiltration/degradation rate (Figure 8.3, 8.4A and B). For a better understanding of the effect of exogenous ABA, the ABA amount left on the berry and leaf surfaces after 2, 4 and 6 hours from the application time at three different sampling times was measured. In 2008, 366
389 exogenous ABA from berry surface was found in a quantity much lower at first sampling date (Aug 19) compared to the other two late sampling dates (Fig. 8.3A). ABA decreased steadily when comparing the sampling times, the lowest amount being found after 6h at first sampling date. The difference among sampling times showed the same pattern at all sampling dates (Fig. 8.3A). ABA found on the leaf surface decrease steadily at each of the sampling time (Fig. 8.3B). The pattern was almost the same at each sampling time with little variation among sampling dates (Figs. 8.3B). In 2009, overall the ABA pattern was similar on both leaf and berry surface (Fig. 8.4A and B). However, ABA concentration was lower at first sampling date, for all sampling times (2, 4, 6 H) compared to the same sampling dates from 2008 season. Moreover, the amount of ABA found at the last two sampling dates (September 11 and 25) was much higher than that one found at the second and third sampling date in In 2009, the amount of ABA on the leaves was higher at the first sampling date compared to However, the decreasing rate was higher between sampling times. At the last two sampling dates (September 11 and 25) the amount of ABA found was lower after two hours and higher after four and six hours from the application time. In the present study data showed a similar trend of ABA as that of Owen et al. (2009) who found a very high level of ABA in and on skin/pulp after 1 day of applying exogenous ABA on Merlot grapes. The same authors found that ABA declined to normal level after 14 days while DPA after 7 days post treatment. They also found high amount of DPA early in the berries development, and this was explained by the high amount of ABA which was catabolized because of lack of need by the plant. This can be supported by data of previous study (Chapter 7) which indicated that vines under high water status tend to catabolize ABA into DPA while under low water status ABA is catabolized into ABA-GE in a higher proportion. The preference for the conjugation pathway could be argue that the plant is trying to have a pool of easy released ABA when the water status drops below a certain limit. Just a small part of the ABA sprayed on berries was taken up and metabolized, most of it being inactivated to its trans-aba form (Owen et al. 2009). ABA is photosensitive and isomerizes to one-to-one mixture of trans-aba and natural cis-aba (Zaharia et al. 2005). The commercial product from Valent Bioscience had no restriction on being used under natural light. The formula of the product had 20% ABA and 80% other ingredients that protect it against inactivation. Using exogenous ABA (the racemic form) might lead to anincrease of ABA concentration in the berry 10 days application (Deytieux-Belleau et al. 2007). 367
390 The discrepancy among different studies using exogenous ABA is explained by the fact that a little ABA is probably absorbed into the berry (Wheeler 2006). The same author indicated that ABA seems to be stable for a considerable period on the berry surface, and it is not broken down quickly by light exposure. Wheeler (2006) suggested that absorption is a limiting factor affecting efficiency, and this depends on the cuticle which covers the leaf and fruit surface. Cuticular waxes constitute the main \ barrier that controls transpiration (SchOnherr 1982), foliar uptake of xenobiotics (Schonherr and Riederer 1986), and resistance against fungi (Commenil et ali997). Riederer and Schreiber (1995) argued that both the chemistry and the structure of cuticular waxes are responsible for these differences. Casado and Heredia (2001) demonstrated the molecular structure of the cuticular wax of grape berry cuticles represents a perfect barrier against water loss and fungus infection. The structural and compositional variability of wax affects the cuticular permeability to water (Schreiber 2005). The epicuticular waxes in the berry skin increase during berry growth. The wax concentration on the grape berry was about 13 to 14 times greater than that on the main leaves (Pallioti and Cartechini 2001). This could be a reasonable explanation why many researchers did not find significant effect on the ripening process when exogenous ABA was used to spray the berries. Moreover, discrepancies found in different studies might also be due to time and frequency of ABA application. In many studies ABA was applied once and most of the time at veraison (Peppi and Fidelibus 2008, Peppi et al. 2006), when the cuticular wax is probably thick enough to delay ABA absorption into the berry. ABA and its catabolites profile in berries from treatments sprayed onto different organs with ABA (Figures 8.5 and 8.6). In 2008, on the first sampling date the hormone profile showed that ABA was in the highest amount in all treatments compare to the other catabolites (Fig. 8.5). However, the control had the lowest ABA concentration, followed upward by the berries treatment, whole canopy and leaves sprayed treatments. The ABA amount found in the leaves treatment was almost 3.5-fold higher than that one found in the control (Fig. 8.5). At the first sampling date except for the control, ABA was followed by ABA-GE, DPA and PA in terms of their abundance in the berry. At the last sampling date the amount of ABA found in the treated berries was much lower than that one found at the first sampling date. ABA-GE was lower in all treatments compare to the first sampling date (Fig. 8.5). In 2009, the profile pattern was almost the same as in In 2009, the first ABA treatment was applied one week later than in This occurred due to weather conditions which caused a general delay in the vine vegetation. The amount of ABA found was lower than that one 368
391 found in 2008 (Fig. 8.6). The pattern was not similar as that one found in 2008 for the other catabolites. The data indicated that exogenous ABA affected directly the amount of ABA in the berry. The target organ for spraying had a great impact on the final hormonal profile in the berry. This might be explained not only by cuticle permeability of different organs but also by the area exposed to ABA, which likely increased the amount of exogenous ABA. The results regarding the ABA concentration are very similar to those of Owen et al. (2009). In both seasons, ABA concentration in berries was higher at the first sampling date than the second one (Figs. 8.5 and 8.6). ABA concentration was higher in treatments when leaves or whole canopy were treated (Fig. 8.5, 8.6). These results are in agreement with Owen et al. (2009) findings where ABA increased significantly close to veraison and decreased thereafter. The findings from the present research confirm the general theory that ABA is associated with onset of veraison. Moreover, ABA seems to accumulate more in berries from treatments where exogenous ABA was applied (Figs. 8.5, 8.6). ABA concentration in berries decreased in all treatments after four weeks from the first application. However, at the second sampling date ABA concentration in berries from treated vines was still higher than the control. This indicates that ABA is strictly involved only in the first part of the ripening process, being metabolized into other compounds or translocated into the seeds or out from the berries. ABA-GE was found at much lower concentration in all treatments compared to that of ABA. However, in treated vines ABA-GE concentration was higher compare to the other ABA catabolites. Higher ABA concentration mimics water stress in the plants which causes the plant to store ABA as ABA-GE. Relationship between hormone, physiological data, yield components and berry composition (Figs. 8.7 and 8.8). In 2008, soil water status was high allover the season, the soil moisture being close to field capacity on most of the sampling dates (data not shown). The PCA of physiological data, yield components, berry composition and ABA catabolites indicated that PC1 and PC2 explained 94.05% of the variability in the data set (Fig. 8.7). PC1 explained % of the variability in the data set while PC2 explained 35.18%. Ts was positively correlated with cluster weight, skin fresh mass, P A and DP A concentration and negatively correlated with Brix, total phenols, anthocyanins, ABA and ABA-GE. Berry weight was highly negatively correlated with TAwhile ph was negatively correlated with the number of berries per cluster and leaf",. PC1 was positively heavily loaded with ABA, ABA-GE and anthocyanin concentration, and negatively loaded with P A. The ABA treatments were well separated based on the target organ. Leaves and whole canopy sprayed treatments were located on the right side of the plot very close to each other being highly associated with ABA concentration in the berry. Only 369
392 berries sprayed treatment was located on the left upper plot while the control was located on the lower left plane. Leaf and whole canopy sprayed treatments were mostly associated with the anthocyanins, ABA and ABA-GE concentration while the control was associated mostly with DPA concentration and skin fresh mass. The exogenous ABA can control Ts (stomatal opening) even if the soil water status is high (Fig. 8.7). Leaf 'I' was not very strongly correlated with Ts, which indicates that these two physiological processes are not under hydraulic control but also hormonal control, which is in agreement with other studies (Lovisolo et al. 2002, Schultz 2003). However, low or no correlation was found between exogenous ABA and Ts, when only clusters were sprayed. The lowest Ts rate was found when the whole canopy was sprayed (Fig. 8.7). These data clearly indicates the positive effect of ABA treatments on the berry composition. The exogenous ABA increased skin dry mass and decreased berry weight. These two variables are highly correlated with color parameters at red cultivars, since skin is the place where anthocyanins are stored The PCA plot of field and laboratory data indicated that PCl and PC2 explained 84.08% of the variability in the data set (Fig. 8.8). PCl explained % of the variability, while PC2 explained 20.16%. PCl was positively loaded with skin fresh mass, Ts, cluster weight, TA, and berry weight, and negatively loaded with anthocyanins, total phenols and ABA concentration. PC2 was positively loaded with the number of berries per cluster and 70H-ABA. Leaf '1', ph, ABA-GE and PA, were not very well explained by the first two components. The PCA pattern was different than 2008, showing a higher degree of correlation among different variables studied. This might indicate that the positive effect of ABA on fruit composition is better expressed in extreme weather conditions. Perhaps, ABA could control cell wall permeability in both directions. Berry weight varied between treated vines and the control, which suggests that ABA controls water uptake into the berry. In 2009, the PCA plot showed a better discrimination between treatments, even between leaf and whole canopy sprayed treatments compare to Conclusions Visual observation showed that ABA was effective in hastening veraison and improving the composition of Cabernet Sauvignon berries. Ability of ABA to control the timing of grape berry maturation depends not only on solution concentration used but also on the target organ sprayed, since different organs have different uptake rates due to cuticle permeability. The cooler and wetter the growing season the greater the effect of the exogenous ABA on fruit composition. 370
393 ABA affected not only fruit composition but also yield components. ABA treated berries were lower in berry weight and higher in skin dry mass, which from a winemaking point these aspects are desirable for wine grapes. ABA affected Ts rates of the vines from treatments where only leaves or whole canopy were treated. This might have a positive effect on water uptake in wet years. By closing stomata, hydraulic conductivity decreases which causes less water uptake into the plant and berries. ABA did not have any abscission effect on leaves or berries at the concentration used in these experiments. Exogenous ABA could provide considerable benefits to the wine industry in terms of grape composition, wine style and for winery scheduling, particularly in wet and cool years. It would be necessary to understand and assess the long term effects of using exogenous ABA not only on general vine metabolism and physiology, but also on wine organoleptic characteristics. Although, some studies on effect of ABA at molecular level have been published during the course of this research, it is still not clear if ABA acts alone or in combination with other hormones on different processes during ripening period. However, ABA could be successfully introduced as an alternative cultural practice, particularly in cool years, and also in regions and growing seasons when there is a high chance of early frost to occur, and a concomitant potential of prematurely losing the foliage. The temporal advancement of ripening through hormonal control might be an asset for viticulturists because earlier fruit maturation is a distinct advantage in cooler areas or areas with a high risk of early frost occurrence, and where an early end of the growing season might prevent adequate fruit maturation. Literature Cited Abrams, S.R Abscisic acid mimics chemicals that protect plants from stress. newsletter, National Research Council, Plant Biotechnology Institute, Saskatoon, Saskatchewan. Albach, R.F., R.E. Kepner, and A.D. Webb Comparison of anthocyanin pigments of red Vinifera grapes. Am. J. Enol. Vitic. 10: Antolin, M.C., M. Ayari, and M. Sanchez,.Diaz Effects of partial root zone drying on yield, ripening and berry ABA in potted Tempranillo grapevines with split roots. Austral. J. Grape Wine Res. 12: Antolin, M.e., H. Baigorri, I. De Luis, F. Aguirrezabal, L. Geny, M. Broquedis, and M. Sanchez Diaz ABA during reproductive development in non-irrigated grapevines (Vitis vinifera L. cv. Tempranillo). Austral. J. Grape Wine Research 9: Ban, T., M. Ishimaru, S. Kobayashi, S.Shiozaki,N. Goto-Yamamoto, ands. Horiuchi Abscisic acid and 2,4-dichloro-henoxyacetic acid affect the expression of anthocyanin biosynthetic pathway genes in 'Kyoho' grape berries. J. Hortic. Sci. Biotechnol. 78: Burns, J., P.T. Gardner, J. O'Neil, S. Crawford, I. Morecroft, D.B. McPhail, e. Lister, D. Matthews, M.R. MacLean, M.E. J. Lean, G.G. Duthie, and A. Crozier Relationship 371
394 among antioxidant activity, vasodilation capacity, and phenolic content of red wines. J. Agric. Food Chern. 48: Brenner, M The role of hormones in photosynthate partitioning and seed filling. pp In: Plant hormones and their role in plant growth and development. Davies, P.J. (Ed.). Martinus Nijhoff Publishing, Dordrecht, Netherlands. (::akir, B., A. Agasse, C. Gaillard, A. Saumonneau, S. Delrot, and R Atanassova A grape ASR protein involved in sugar and abscisic acid signaling. Plant Cell 15: Cantin, e.m., M.W. Fidelibus, and C.H. Crisosto Application of abscisic acid (ABA) at veraison advanced red color development and maintained postharvest quality of Crimson Seedless grapes. Postharvest BioI. Technol. 46: Casado, e.g., and A. Heredia Ultrastructure of the cuticle during growth or-the grape berry (Vitis vinifera). Physiol. Plant. 111: Castellarin, S.D., and G. Di Gaspero Transcriptional control of anthocyanin biosynthetic genes in extreme phenotypes for berry pigmentation of naturally occurring grapevines. BMC Plant Biology 7:46. Castellarin, S.D., G. Di Gaspero, R. Marconi, A. Nonis, E. Peterlunger, S. Paillard, A.F. Adam Blondon and R. Testolin Colour variation in red grapevines (Vitis vinifera L.): genomic organisation, expression of flavonoid 3'-hydroxylase, flavonoid 3',5'-hydroxylase genes and related metabolite profiling of red cyanidin-iblue delphinidin-based anthocyanins in berry skin. BMC Genomics 7:12. Castellarin, S.D., M.A. Matthews, G. Di Gaspero, and G.A. Gambetta. 2007a. Water deficits accelerate ripening and induce changes in gene expression regulating flavonoid biosynthesis in grape berries. Planta 227:101~112. Castellarln, S. D., A. Pfeiffer, P. Sivilotti, M. Degan, E. Peterlunger, and G. Di Gaspero. 2007b. Transcriptional regulation of anthocyanin biosynthesis in ripening fruits of grapevine under seasonal water deficit. Plant Cell Envir. 30(11): Christmann, A., E.W. Weiler, E. Steudle, and E. Grill A hydraulic signal in root-to-shoot signaling of water shortage. Plant J. 52: Commenil, P., B. LOIC, and J. Audran The development of the grape berry cuticle in relation to susceptibility to bunch rot disease. J. Exp. Bot. 48: Coombe, B.G., and C.R. Hale The hormone content of ripening grape berries and the effects of growth substance treatments. Plant Physiol. 51: Crisosto, C.H. and F.G. Mitchell Postharvest handling systems: small fruits. I. Table grapes. Chapter 29. In: Postharvest Technology of Horticultural Crops, Third Edition, Kader A.A. (Ed.), DANR Publication #3311. Davies, C., P.K. Boss, and S.P. Robinson Treatment of grape berries, a nonclimacteric fruit with a synthetic auxin, retards ripening and alters the expression of developmentally regulated gene. Plant Physiol. 115: Deluc, L.D., J. Grimplet, M.D.Wheatley, RL. Tillett, D.R Quilici, C. Osborne, D.A. Schooley, K.A. Schlauch, lc. Cushman, and G.R Cramer Transcriptomic and metabolite analyses of Vitis vinifera L. cv. Cabernet Sauvignon grape berry development. BMC Genomics. 8:429. Deluc, L.D., D.R Quilici, A. Decendit, J. Grimplet, M.D. Wheatley, K.A. Schlauch, J.M. Merillon, J.C. Cushman, and G.R Cramer Water deficit alters differentially metabolic 372
395 pathways affecting important flavour and quality traits in grape berries of Cabernet Sauvignon and Chardonnay. BMC Genomics 10:212. Deytieux-Belleau, c., S. Gagne, A L'Hyvernay, B. Doneche, L. Geny Possible roles of both abscisic acid and indol-acetic acid in controlling grape berry ripening process. J. Inter. Sci. vigne et du vin 41: Dry, P.R., B.R Loveys, and H. DUring Partial drying of the root-zone of grape. 2. Changes in the pattern of root development. Vitis 39:9-12. Flores, A, and K. Dorffling A comparative study of the effects of abscisic acid and new terpenoid abscisic acid analogs on plant physiological processes. J. Plant Growth Regul. 9: Freeman, B.M., and W.M. Kliewer Effects of irrigation, crop level and potassium fertilization on Carignane vines II Grape and wine quality. Am. J. Enol. Vitic 34: Gagne, S., K. Esteve, C. Deytieux, C. Sauvier, and L. Geny Influence of abscisic acid in triggering veraison in grape berry skins of Vitis vinifera L. cv. Cabernet Sauvignon. Vitis 40:7-14. Geny, L., C. Deytieux, and B. Doneche Importance ofhonnonal profile on the onset of ripening in grape berries of Vitis vinifera L. Acta Hort. 682: Giribaldi, M., L. Geny, S. Delrot, and A Schubert Proteomic analysis of the effects of ABA treatments on ripening Vitis vinifera berries. J. Exp. Bot. 61: Giribaldi, M., W. Hartung, and A Schubert The effects of abscisic acid on grape berry ripening are affected by the timing of treatment. Int. J. Vine Wine Sci. 43:1-7. Giribaldi, M., I. Perugini, F.x. Sauvage, and A Schubert Analysis of protein changes during grape berry ripening by 2-DE and MALDI-TOF. Proteomics. 7: Gonzalez-Neves, G., J. Franco, L. Barreiro, G. Gil, M. Moutounet and A Carbonneau Varletal differentiation of Tannat, Cabernet Sauvignon and Merlot grapes and wines according to their anthocyanic composition. Eur. Food Res. Tech. 225: Hardie, W.J., and J.A Considine Response of grapes to water-deficit stress in particular stages of development. Am. J. Enol. Vitic. 27: Hiratsuka, S., H. Onodera, Y. Kawai, T. Kubo, H. Itoh, and R Wada ABA and sugar effects on anthocyanin fonnation in grape berry cultured in vitro. Sci. Hort. 90: Holton, T.A, and E Cornish Genetics and biochemistry of anthocyanin biosynthesis. Plant Ce117: Them-Gomez, M., C.A Lacueva, RM., Lamuela-Raventos, and AL. Waterhouse Rapid HPLC analysis of phenolic compounds in red wines. Am. J. EnoL Vitic. 53: Jeong, S.T., N. Goto-Yamamoto, S. Kobayashi, and M. Esaka Effects of plant hormones and shading on the accumulation of anthocyanins. and the expression of anthocyanin biosynthetic genes in grape berry skins. Plant Sci. 167: Jiang, F., and W. Hartung Long-distance signalling of abscisic acid (ABA): the factors regulating the intensity of the ABA signal. J. Exp. Bot. 59: Kataoka, I., Y. Kubo, A Sugiura, and T. Tomana Effects of temperature, cluster shading and some growth regulators on L-phenylalanine ammonialyase activity and anthocyanin accumulation in black grapes. Mem. Coll. Agric. Kyoto Univ. 124:
396 Kataoka, 1., A. Sugiura, N. Utsunomya, T. Tomana. 1982: Effect of abscisic acid and defoliation on anthocyanin accumulation in Kyoho grapes (Vitis vinifera L. x V. labruscana BAILEY). Vitis 21 : Kliewer, W.M Effect of day temperature and light intensity on coloration of Vitis vinifera L. grapes. J. Am. Soc. Hortic. Sci. 95: Koshita, Y., T. Asakura, H. Fukuda, and Y. Tsuchida Night-time temperature treatment of fruit clusters of 'Aki Queen' grapes during maturation and its effect on the skin color and abscisic acid content. Vitis 46: Lovisolo. C., W. Hartung, and A. Schubert Whole-plant hydraulic conductance and root-toshoot flow of abscisic acid are independently affected by water stress in grapevines. Funct. Plant BioI. 29: Matsushima, J., S. Hiratsuka, N. Taniguchi, R. Wada, and K. Suzaki Anthocyanin accumulation and sugar content in the skin of grape cultivar" Olimpia" treated with ABA. J. Jpn. Soc. Hort. Sci. 58: Matthews, M.A., and M.M. Anderson Fruit ripening in Vitis vinifera L.: responses to seasonal water deficits. Am. J. Enol. Vitic. 39: Mattivi, F., R. Guzzon, U. Vrhovsek, M. Stefanini, and R. Velasco Metabolite profiling of grapes: flavonols and anthocyanins. J. Agric. Food. Chern. 54: Mazza, G., and E. Miniati Anthocyanins in Fruits, Vegetables and Grains. CRC Press Inc Boca Raton, Fla., USA. 362 p. Mori, K., H. Saito, N. Goto-Yamamoto, M. Kitayama, S. Kobayashi, S. Sugaya, H. Gemma, and K. Hashizume Effects of abscisic acid treatment and night temperatures on anthocyanin composition in Pinot noir grapes. Vitis 44: Mori, K., S. Sugaya, and H. Gemma Regulatory mechanism of anthocyanin biosynthesis in 'Kyoho' grape berries grown under different temperature conditions. Environ. Control BioI. 42: Ojeda, H., E. Kraeva, A. Deloire, A. Carbonneau, and C. Andary Influence of pre and postveraison water deficits on synthesis and concentration of skins phenolic compounds during the berry growth of Shiraz grapes (Vitis vinifera L.). Am. J. Enol. Vitic. 53: Okamoto, G., T. Kuwamura, and K. Hirano Effects of water deficit stress on leaf and berry ABA and berry ripening in Chardonnay grapevines (Vitis vinifera). Vitis. 43: OMAFRA (Ontario Ministry Of Agriculture, Food & Rural Affairs) Fruit Production Recommendations. Publication 360, Ontario Ministry of Agriculture, Food and RuralAffairs, Toronto, ON. Owen, S.1., M.D. Lafond, P. Bowen, C. Bogdanoff, K. Usher and S.R. Abrams Profiles of abscisic acid and its catabolites in developing Merlot grape (Vitis vinifera) Berries. Am. J. Enol. Vitic. 60: Palejwala, V.A., H.R. Parikh, andv.v. Modi The role of abscisic acid in the ripening of grapes. Physiol. Plant. 65: Palliotti, A., and A. Cartechini Developmental changes in gas exchange activit yin flowers, berries, and tendrils of field-grown Vitis vinifera L. cv. Cabemet Sauvignon. Am. J. Enol. Vitic. 52:
397 Pan, Q.H., M.J. Li, C.c. Peng, N. Zhang, X. Zou, Z.Q. Zou, X.L. Wang, X.C. Yu, X.F. Wang, and D.P. Zhang Abscisic acid activates acid invertases in developing grape berry. Physiol. Plant. 125: Peppi, M.C., and M.W. Fidelibus Effects offorchlorfenuron and abscisic acid on the quality of 'Flame Seedless' grapes. HortSci. 43: Peppi, M.C., M.W. Fidelibus, and N. Dokoozlian Abscisic acid application timing and concentration affect ftrmness, pigmentation, and color of 'Flame Seedless' grapes. HortSci. 41: Peppi, M.C., M.W. Fidelibus, and N. Dokoozlian Application timing and concentration of abscisic acid affect the quality of 'Redglobe' grapes. J. Hortic. Sci. Biotechnol. 82: Pirie, A, and M.G. Mullins Changes in anthocyanin and phenolic content of grapevine leaf and fruit tissues treated with sucrose, nitrate and abscisic acid. Plant Physiol. 58: Quiroga, AM., F.J. Berli, D. Moreno, J.B. Cavagnaro and R. Bottini Abscisic Acid sprays significantly increase yield per plant in vineyard-grown wine grape (Vitis vinifera L.) cv. Cabemet Sauvignon through increased berry set with no negative effects on anthocyanin content and total polyphenol index of both juice. J. Plant Growth Reg. 80: Riederer, M, and L. Schreiber Waxes-the transport barriers of plant cuticles. pp In: Hamilton, R.J., (Ed.) Waxes: chemistry, molecular biology and functions. The Oily Press, Dundee, UK. Roby, G., J.F. Harbertson, D.A Adams, and M.A Matthews Berry size and vine water deftcits as factors in winegrape composition: anthocyanins and tannins. Austral. J. Grape Wine Res. 10: Roggero, J.P., S. Coen,and J.L. Larice Etude comparative de la composition anthocyanique des cepages. Bull Liais Groupe Polyph. 13: Schonherr, J Resistance of plant surfaces to water loss: transport properties of cutin, suberin and associated lipids. pp. 153~179. In: Encyclopedia of plant physiology. Lange, O.L., P.S. Nobel, C.B. Osmond, H. Ziegler (Eds.) New Series, Vol. 12B. Springer, Berlin. Schonherr, 1., and M. Riederer Plant cuticles sorb lipophilic compounds during enzymatic isolation. Plant Cell Envir. 9: Schreiber, L Polar paths of diffusion across plant cuticles: new evidence for an old hypothesis. Ann. Bot. 95: Scienza, A, R. Miravalle, C. Visai, and M. Fregoni Relationships between seed number, gibberellin and abscisic acid levels and ripening in Vitis vinifera L. cv. Cabemet Sauvignon grape berries. Vitis. 17: Schultz., H.R Differences in hydraulic architecture account for near-isohydric and anisohydric behaviour of two fteld-grown Vitis vinifera L. cultivars during drought. Plant Cell Envir.26: Shiozaki, S., Y. Kamata, T. Ogata, S. Horiuchi, and K. Kawase Localisation of abscisic acid in grape berry by immunohistochemical techniques. J. Japan. Soc. Hort. Sci. 68:1-9. Shiraishi, S., and Y. Watanabe Anthocyanin pigments in the grape skins of cultivars (Vitis spp.). Sci. Bull. Fac. Agric. Kyushu Univ. 48:
398 Spayd, S.E., J.M. Tarara, D.L. Mee, and J.C. Ferguson Separation of sunlight and temperature effects on the composition of Vitis vinifera cv. Merlot berries. Am. J. Enol. Vitic. 53: Sroka, Z Antioxidative and antiradical properties of plant phenolics. Z Natlirforsch 60: Stoll, M., B.R. Loveys, and P. Dry Hormonal changes induced by partial rootzone drying of irrigated grapevine. J. Exp. Bot. 51: Taiara, S., Y. Suzuki, E. Kazama, S. Watanabe, K. Sato, and M. Satake Effect of treating time and concentration of ABA on coloration of "Olympia" grape berry. Agric. Hort. 63: Tomana, T., N. Utsunomiya, and I. Kataoka The effect of environmental temperatures on fruit ripening on the tree. II. The effect of temperatures around whole vines and clusters on the coloration of 'Kyoho' Grapes. J. Jpn. Soc. Hortic. Sci. 48: Wheeler, S The role of abscisic acid in grape berry development. PhD Thesis. University of Adelaide. School of Agriculture, Australia. 162p. Wheeler, S., B. Loveys, C. Ford, and C. Davies The relationship between the expression of abscisic acid biosynthesis genes, accumulation of abscisic acid and the promotion of Vitis vinifera L. berry ripening by abscisic acid. Austral. J. Grape Wine Res. 15: Yamane, T, S.T. Jeong, N. Goto-Yarnarnoto, Y. Koshita, and S. Kobayashi Effects of temperature on anthocyanin biosynthesis in grape berry skins. Am. J. Enol. Vitic. 57: Zaharia, L.I., M.K. Walker-Simmons, C.N. Rodriguez, and S.R. Abrams Chemistry of abscisic acid, abscisic acid catabolites and analogs. J. Plant Growth Regul. 24:
399 List of Tables Table 8.1. Monthly mean temperature and rainfall during growing season, Virgil weather station, Niagara-on-the-Lake, ON. Table 8.2. Impact of exogenous ABA on yield components and berry composition of Cabemet Sauvignon when different target organs were sprayed, Lambert Vineyards, Niagara-on-the Lake, ON ( ). Table 8.3. Impact of exogenous ABA concentration on yield components and berry composition of Cabemet Sauvignon, Lambert Vineyards, Niagara-on-the-Lake, ON ( ) Table 8.4. Impact of exogenous ABA concentration and target organ, on total anthocyanins and phenols in berries of Cabemet Sauvignon, Lambert Vineyards, Niagara-on-the-Lake, ON ( ). Table 8.5. Impact of exogenous ABA concentration and target organ, on anthocyanin composition in berry skin of Cabemet Sauvignon from Lambert Vineyards, Niagara-on-the-Lake, ON (2009). Table 8.5 Impact of exogenous ABA concentration and target organ, on anthocyanin composition in berry skin of Cabemet Sauvignon from Lambert Vineyards, Niagara-on-the-Lake, ON (2009). 377
400 Table 8.1. Monthly mean temperature and rainfall during growing season, Virgil weather station, Niagara-on-the-Lake, ON. Temperature ec) Rainfall (mm) Month Average Average June July August * Average value for each month is the mean temperature for the 25 years 378
401 .' Table 8.2. Impact of exogenous ABA on yield components and berry composition of Cabemet Sauvignon when different target or~ans were sera~ed, Lambert Vine~ards, Nia~ara-on-the-Lak:e, ON. ( ). Target organ Cluster Berries/ Berry Skin fresh mass weight (g) cluster weight (g) (mglberry) Skin dry Titratable mass Brix acidity ph (mglberry) (gil) 2008 Control Berries 140 a 96b 1.45 a 109 a 49c 18.9 c 9.2 b 3.58 ab 141 a 112 a 1.26 c 97b 56ab 19.3 b 9.8 a 3.49b Leaves 129b 101 ab 1.28 c 89c 53b 19.3b 9.4 ab 3.59 a Whole canopy 128b 94 b 1.38 b 94 be 57a 19.6 a 9.4 ab 3.58 ab Significance * * * * * * * * 2009 Control 143 a 91 b 1.41 a 111 a 46c 18.3 b 10.2 a 3.54 Berries 137b 96ab 1.32 b 105b 53b 18.9 ab 9.9ab 3.56 Leaves 118c 98 a 1.25 c 93b 52b 19.1 ab 9.1 b 3.51 Whole canopy 116c 88b 1.29 b 89b 56a 19.2 a 9.6ab 3.53 Significance ** * ** ** * * * ns *,**,***,****, ns: Significant at p < 0.05,0.01,0.001, , or not significant, respectively. Letters represent means separated atp < 0.05, Duncan's multiple range test. Boldfaced data indicate those values significantly greater than the control, Dunnett's t-test; boldfaced and underlined data are significantly less than the control. 379
402 . ' Table 8.3. Impact of exogenous ABA concentration on yield components and berry composition of Cabemet Sauvignon, Lambert Vine~ards, Niagara-on-the-Lake, ON ( ) Skin fresh Skin dry Titratable Cluster weight Berries/ Berry weight Treatment mass mass Brix acidity ph (g) cluster (g) (mglberry) (mglberry) (gil) 2008 Control 138 b 104 b 1.35 a 109 a 49b 18.8 b 8.9b mgIL 139b 108 a 1.24 c 97b 56a 19.3 a 8.8 b mgIL 142 a 110 a 1.29 b 89b 53 b 19.4 a 9.6 a 3.65 Significance * * * * * * * ns 2009 Control 141 a 99a 1.42 a 112 a 48b 18.3 b 9.7 a 3.51b 150 mgil 127b 94 b 1.34 b 101 b 51 ab 19.0 a 8.9 b 3.59 a 300mgIL 118c 93b 1.26c 103 b 56a 19.1 a 7.9 c 3.57 ab Significance ** * * * ** * * * *, **, ***, ****, ns: Significant at p < 0.05, 0.01, 0.001, , or not significant, respectively. Letters represent means separated at p < 0.05, Duncan's multiple range test. Boldfaced data indicate those values significantly greater than the control, Dunnett's t-test; boldfaced and underlined data are significantly less than the control 380
403 Table 8.4. Impact of exogenous ABA concentration and target organ, on total anthocyanins and phenols in berries of Cabernet Sauvignon, Lambert Vineyards, Niagara-on-the-Lake, ON ( ). Anthocyanins (mg/l) Total phenols (mg/l) Treatment Control 426c 248c 1521c 1778 b Berries 548b 421 b 1783 b 1726 b Leaves 721 ab 621 a 1842 a 1856 a Whole canopy. 764 a 658 a 1896 a 1796 b Significance * * * ** Control 412 c 287 c 1651 b 1751 c 150mg/L 478b 399b 1682 b 1891 a 300mg/L 532 a 436 a 1765 a 1765b Significance * * * **,**,***,****, ns: Significant at p < 0.05, 0.01, 0.001, , or not significant, respectively. Letters represent means separated at p < 0.05, Duncan's multiple range test. Boldfaced data indicate those values significantly greater than the control, Dunnett's t-test; boldfaced and underlined data are significantly less than the control 381.,
404 ., Table 8.5 Impact of exogenous ABA concentration and target organ, on anthocyanin composition in berry skin of Cabemet Sauvignon from Lambert Vineyards, Niagara-on-the-Lake, ON (2009). Treatments 3-Glucosides 3-Acetyl glucosides DeL Cya. Pet. Peo. Mal DeL Cya. Pet. Peo. Mal Control c 90.4 b b b c 47.7 c 23.2 ab 37.7 c 41.2b c Berries b 57.3 c ab c c 62.3bb 17.7 b 41.6 be 28.7 c b Leaves ab a a a b 68.3 ab 26.7 a 44.3 b 44.3 a b Whole canopy a ab a ab a 77.5 a 24.1 ab 47.9 a 40.1 b a Significance * ** * ** * * * * * * Control c 79.5b c b c 45.9 c 20.2 b 30.7 c 35.3 b 109.0b 150mg/L b 67.0b b c b 63.5 b 20.6b 41.1 b 33.4 b a 300mg/L a a a a a 71.8 a 31.4 a 45.7 a 48.4 a a Significance ** ** ** * ** * * * * ** *,**,***,****, ns: Significant at p < 0.05, 0.01, 0.001, , or not significant, respectively. Letters represent means separated at p < 0.05, Duncan's multiple range test. Boldfaced data indicate those values significantly greater than the control, Dunnett's t-test; boldfaced and underlined data are significantly less than the control 382
405 List of Figures Figure 8.1. Cabemet Sauvignon clusters after two weeks from first ABA application: A) Control (non-treated), B) Only clusters sprayed, C) Only leaves sprayed, D) Whole canopy sprayed. Lambert Vineyards, Niagara-on-the-Lake, ON, Figure 8.2. Cabemet Sauvignon clusters after four weeks from first ABA application: left to right, unsprayed, 150 and 300 mgil ABA. Lambert Vineyards, Niagara-on-the-Lake, ON, Figure Infiltration rate of exogenous ABA in Cabemet Sauvignon vines Lambert Vineyards, Niagara-on-the-Lake, ON, 2008, after 2,4, and 6 H from treatment application. A) Berries B) Leaves. Berry and leaf samples are from vines where whole canopy was treated with 300 mgil ABA solution. August 19, September 5 and September 19 are the sampling dates. Figure 8.4. InfIltration rate of exogenous ABA in Cabemet Sauvignon vines Lambert Vineyards, Niagara-on-the-Lake, ON, 2009, after 2, 4, and 6 H from treatment application. A) Berries B) Leaves. Berry and leaf samples are from vines where whole canopy was treated with 300 mgil ABA solution. August 25, September 11 and September 25 are the sampling dates. Figure 8.5. Hormone profile of ABA and its metabolites in Cabemet Sauvignon berries after 2 weeks from ABA application (wi) and harvest time (w3) Lambert Vineyards, Niagara-on-the Lake, ON,(2008). Figure 8.6. Hormone profile of ABA and its metabolites in Cabemet Sauvignon berries after 2 weeks from ABA application (wi) and harvest time (w3) Lambert Vineyards, Niagara-on-the Lake, ON, (2009) Figure Principal component analysis (F1 &F2) of physiological data, yield components and berry composition and hormones concentration means from four ABA treatments of Cabemet Sauvignon grape vines from Lambert Vineyards, Niagara-on-the-Lake, ON, Figure Principal component analysis (F1&F2) of physiological data, yield components and berry composition and hormones concentration means, from four ABA treatments of Cabemet Sauvignon from Lambert Vineyards, Niagara-on-the-Lake, ON,

, B) Only clusters sprayed, C)")

406 Figure 8.1. Clusters of Vitis vinifera L. cv. Cabemet Sauvignon after two weeks following first ABA application: A) Control (non-treated), B) Only clusters sprayed, C) Only leaves sprayed, D) Whole canopy sprayed. Lambert Vineyards, Niagara-on-the-Lake, ON,


407 ., Figure 8.2. Clusters of Vitis vinifera L. cv. Cabemet Sauvignon after four weeks following first ABA application: left to right, unsprayed, 150 and 300 mgil ABA. Lambert Vineyards, Niagara-on-the-Lake, ON,
408 6H... s +-' gp... 4H... S" ~ r/j.sep.-19 Sep.-5 o Aug.-19 2H o ABA concentration (ng/g) dry mass 300 A.Sep.-19 Sep.-S o Aug.-19 o ABA concentration (ng/gdry mass) 300 B Figure 8.3. Infiltration rate of exogenous ABA in Cabemet Sauvignon vines after 2, 4, and 6 hours following treatment application. A) Berries B) Leaves. Lambert Vineyards, Niagara-on-the-Lake, ON, Berry and leaf samples are from vines where whole canopy was treated with 300 mgil ABA solution. August 19, September 5 and September 19 are the sampling dates. 386
409 6H o... S bi).s 4H 1 IZl Sep.-25 Sep.-ll OAug.-28.2H o ABA concentration (nglg dry mass) 300 A 6H 0.S.... g 4H ]- tis IZl.Sep.-25 Sep.-ll o Aug.-28 2H o ABA concentration (nglg dry mass) 300 B Figure 8.4. Infiltration rate of exogenous ABA in Cabemet Sauvignon vines after 2, 4, and 6 hours following treatment application. A) Berries B) Leaves. Lambert Vineyards, Niagara-on-the-Lake, ON, Berry and leaf samples are from vines where whole canopy was treated with 300 mgil ABA solution. August 25, September 11 and September 25 are the sampling dates. 387
410 W.canopy-w3 Leaves-w3 Berries-w3 VI +-I c: QJ E ' +-I CO QJ J.!::: Control-w3 W. canopy-wi Leaves-wl Berries-wl ~ PA t~ 70H- ABA DOPA * ABAGE ABA ContrQI-w1 o ,00 ABA concentration (ng!gdry mass) 5000 Figure 8.5. Hormone profile of ABA and its metabolites in Cabemet Sauvignon berries after 2 weeks following ABA application (wi) and harvest time (w3). Lambert Vineyards, Niagara-on-the-Lake, ON,
411 W. canopy-w3 Leaves,..w3 Berries-w3 t: III <1J E -to <1J Control-w3 t= W. canopy-wi Leaves-wi Berries-wi ~ PA 70H-ABA ODPA II ABAGE _.ABA Control-wi o ABA concentration (ng!g dry mass) 5000 Figure 8.6. Hormone profile of ABA and its metabolites in Cabernet Sauvignon berries after 2 weeks following ABA application (wi) and harvest time (w3). Lambert Vineyards, Niagara-on-the-Lake, ON,
412 15 Biplot (axes Fl and F2: %) 10-5 '* 00 M IJ') m -N u ontrol DPA B.w S.D.M Total Ph. Brix ABAGE n ocyanlns Lea~~~ Wholecanop o 5 Fl (58.88 %) Figure 8.7. Principal component analysis (Fl&F2) of physiological data, yield components, berry composition and hormones concentration means from four ABA treatments of Cabernet Sauvignon grape vines from Lambert Vineyards, Niagara-on-the-Lake, ON, Acronyms used: B/C - number of berries per cluster, Total. Ph - total phenols, B.W.- berry weight, C.W. -cluster weight, S.F.M. - skin fresh mass, S.D.M.- skin dry mass, Tstranspiration rate, 'II -leaf water potential. 390
 5 70H-ABA Berries -5 Leaves Antho o a. ABA ABAGE Whole canopy Control -10-15 -10-5 o 5 10 15 F1 (63.91 %) Figure. 8.8. Principal component")

413 10 Biplot (axes Fl and F2: %) 5 70H-ABA Berries -5 Leaves Antho o a. ABA ABAGE Whole canopy Control o F1 (63.91 %) Figure Principal component analysis (Fl&F2) of physiological data, yield components and berry composition and hormones concentration means, from four ABA treatments of Cabemet Sauvignon from Lambert Vineyards, Niagara-on-the-Lake, ON, Acronyms used: B/C - number of berries per cluster, B.W. berry weight, C.W. -cluster weight, S.F.M. - skin fresh mass, S.D.M.- skin dry mass, Ts-transpiration rate, '1' leaf water potential, Total. Ph - total phenols. 391
INVESTIGATIONS INTO THE RELATIONSHIPS OF STRESS AND LEAF HEALTH OF THE GRAPEVINE (VITIS VINIFERA L.) ON GRAPE AND WINE QUALITIES
 ON GRAPE AND WINE QUALITIES") INVESTIGATIONS INTO THE RELATIONSHIPS OF STRESS AND LEAF HEALTH OF THE GRAPEVINE (VITIS VINIFERA L.) ON GRAPE AND WINE QUALITIES by Reuben Wells BAgrSc (Hons) Submitted in fulfilment of the requirements
INVESTIGATIONS INTO THE RELATIONSHIPS OF STRESS AND LEAF HEALTH OF THE GRAPEVINE (VITIS VINIFERA L.) ON GRAPE AND WINE QUALITIES by Reuben Wells BAgrSc (Hons) Submitted in fulfilment of the requirements
IMPOSING WATER DEFICITS TO IMPROVE WINE QUALITY AND REDUCE COSTS
 IMPOSING WATER DEFICITS TO IMPROVE WINE QUALITY AND REDUCE COSTS Terry L. Prichard, Water Management Specialist University of California Davis 420 S. Wilson Way, Stockton, CA 95205 (209) 468-2085; fax
Effects of Capture and Return on Chardonnay (Vitis vinifera L.) Fermentation Volatiles. Emily Hodson
 Fermentation Volatiles. Emily Hodson") Effects of Capture and Return on Chardonnay (Vitis vinifera L.) Fermentation Volatiles. Emily Hodson Thesis submitted to the faculty of the Virginia Polytechnic Institute and State University in partial
Effects of Capture and Return on Chardonnay (Vitis vinifera L.) Fermentation Volatiles. Emily Hodson Thesis submitted to the faculty of the Virginia Polytechnic Institute and State University in partial
Irrigation of Sunflowers in Northwestern Kansas
 Proceedings of the 2013 Irrigation Association Technical Conference, Austin, Texas, November 4-8, Available from the Irrigation Association, Falls Church, Virginia Irrigation of Sunflowers in Northwestern
Vineyard Water Management
 Vineyard Water Management Pierre Helwi Texas A&M AgriLife Extension Service Grape Camp November 7, 2016 Lady Bird Johnson Park Pioneer Pavilion, Fredericksburg, TX Terroir Concept Climate Human factor
ARIMNet2 Young Researchers Seminar
 ARIMNet2 Young Researchers Seminar How to better involve end-users throughout the research process to foster innovation-driven research for a sustainable Mediterranean agriculture at the farm and local
Do lower yields on the vine always make for better wine?
 Grape and wine quality Increasing quality Do lower yields on the vine always make for better wine? Nick Dokoozlian Viticulture, & Enology E&J Gallo ry Do lower yields on the vine always make for better
Final Report. TITLE: Developing Methods for Use of Own-rooted Vitis vinifera Vines in Michigan Vineyards
 Final Report TITLE: Developing Methods for Use of Own-rooted Vitis vinifera Vines in Michigan Vineyards PRINCIPAL INVESTIGATOR: Thomas J. Zabadal OBJECTIVES: (1) To determine the ability to culture varieties
Lack of irrigation in 2002 reduced Riesling crop in Timothy E. Martinson Finger Lakes Grape Program
 Lack of irrigation in 2002 reduced Riesling crop in 2003 Timothy E. Martinson Finger Lakes Grape Program Lailiang Cheng, Alan Lakso, Thomas Henick-Kling and Terry Acree Depts. Horticulture Ithaca, Horticultural
AN ENOLOGY EXTENSION SERVICE QUARTERLY PUBLICATION
 The Effects of Pre-Fermentative Addition of Oenological Tannins on Wine Components and Sensorial Qualities of Red Wine FBZDF Wine. What Where Why How 2017 2. October, November, December What the authors
Leaf removal: a tool to improve crop control and fruit quality in vinifera grapes
 Michigan Grape & Wine Industry Council 2015 Report of Research Activities Leaf removal: a tool to improve crop control and fruit quality in vinifera grapes PI Paolo Sabbatini Dept. of Horticulture, Michigan
PRD. ( : -*) 3- Water Use Efficiency 3 (WUE)
 3- Water Use Efficiency 3 (WUE)") Journal of Horticultural Science Vol. 26, No. 2, Summer 2012, P. 215-222 ISSN: 2008-4730 ( ) 215-222. 1391 2 26 2008-4730 : 2 *1-90/6/5: 90/11/18: (PRD).. ) ( ) PRD. ( %5 (TSS) ph - PRD.. PRD PRD. %1.
Journal of Horticultural Science Vol. 26, No. 2, Summer 2012, P. 215-222 ISSN: 2008-4730 ( ) 215-222. 1391 2 26 2008-4730 : 2 *1-90/6/5: 90/11/18: (PRD).. ) ( ) PRD. ( %5 (TSS) ph - PRD.. PRD PRD. %1.
Research Report: Use of Geotextiles to Reduce Freeze Injury in Ontario Vineyards
 Research Report: Use of Geotextiles to Reduce Freeze Injury in Ontario Vineyards Prepared by Dr. Jim Willwerth CCOVI, Brock University February 26, 20 1 Cool Climate Oenology & Viticulture Institute Brock
Copyright Advanced Viticulture, Inc. Mark Greenspan, Ph.D., CPAg, CCA Advanced Viticulture, Inc.
 Mark Greenspan, Ph.D., CPAg, CCA Advanced Viticulture, Inc. www.advancedvit.com Irrigation Management Water Management Floor Management Weather Frost, Cooling, other. Strategy Physiology of vine water
The Pomology Post. Hull Rot Management on Almonds. by Brent Holtz, Ph.D., University of California Pomology Advisor
 University of California Cooperative Extension The Pomology Post Madera County Volume 54, JUNE 2007 Hull Rot Management on Almonds by Brent Holtz, Ph.D., University of California Pomology Advisor Many
is pleased to introduce the 2017 Scholarship Recipients
 is pleased to introduce the 2017 Scholarship Recipients Congratulations to Elizabeth Burzynski Katherine East Jaclyn Fiola Jerry Lin Sydney Morgan Maria Smith Jake Uretsky Elizabeth Burzynski Cornell University
Influence of climate and variety on the effectiveness of cold maceration. Richard Fennessy Research officer
 Influence of climate and variety on the effectiveness of cold maceration Richard Fennessy Research officer What is pre-fermentative cold maceration ( cold soak ) and what are the benefits? Introduction
WALNUT HEDGEROW PRUNING AND TRAINING TRIAL 2010
 WALNUT HEDGEROW PRUNING AND TRAINING TRIAL 2010 Carolyn DeBuse, John Edstrom, Janine Hasey, and Bruce Lampinen ABSTRACT Hedgerow walnut orchards have been studied since the 1970s as a high density system
The Implications of Climate Change for the Ontario Wine Industry
 The Implications of Climate Change for the Ontario Wine Industry Tony B. Shaw Department of Geography and Cool Climate Oenology and Viticulture Institute Brock University Climate Change Most scientists
Deficit Irrigation Scheduling for Quality Winegrapes
 Deficit Irrigation Scheduling for Quality Winegrapes Terry Prichard, Water Management Specialist Dept. LAWR, Hydrology UC Davis Improving Fruit Quality Improving Fruit Quality Crop Crop Load Management
2012 Research Report Michigan Grape & Wine Industry Council
 2012 Research Report Michigan Grape & Wine Industry Council Early leaf removal to improve crop control, cluster morphology and berry quality in vinifera grapes Paolo Sabbatini 1 and Annemiek Schilder 2
Peach and Nectarine Cork Spot: A Review of the 1998 Season
 Peach and Nectarine Cork Spot: A Review of the 1998 Season Kevin R. Day Tree Fruit Farm Advisor Tulare County University of California Cooperative Extension Along with many other problems, fruit corking
2012 NEW YORK STATE SOYBEAN VARIETY YIELD TESTS. William J. Cox, Phil Atkins, and Mike Davis Dep. of Crop and Soil Sciences
 Dep. of Crop and Soil Sciences Extension Series No. E-12-2 November, 2012 2012 NEW YORK STATE SOYBEAN VARIETY YIELD TESTS William J. Cox, Phil Atkins, and Mike Davis Dep. of Crop and Soil Sciences College
Plant root activity is limited to the soil bulbs Does not require technical expertise to. wetted by the water bottle emitter implement
 Case Study Bottle Drip Irrigation Case Study Background Data Tool Category: Adaptation on the farm Variety: Robusta Climatic Hazard: Prolonged dry spells and high temperatures Expected Outcome: Improved
Relationship between Mineral Nutrition and Postharvest Fruit Disorders of 'Fuerte' Avocados
 Proc. of Second World Avocado Congress 1992 pp. 395-402 Relationship between Mineral Nutrition and Postharvest Fruit Disorders of 'Fuerte' Avocados S.F. du Plessis and T.J. Koen Citrus and Subtropical
Copyright is owned by the Author of the thesis. Permission is given for a copy to be downloaded by an individual for the purpose of research and
 Copyright is owned by the Author of the thesis. Permission is given for a copy to be downloaded by an individual for the purpose of research and private study only. The thesis may not be reproduced elsewhere
Global Perspectives Grant Program
 UW College of Agriculture and Natural Resources Global Perspectives Grant Program Project Report Instructions 1. COVER PAGE Award Period (e.g. Spring 2012): Summer 2015 Principle Investigator(s)_Sadanand
Research News from Cornell s Viticulture and Enology Program Research Focus Cornell Researchers Tackle Green Flavors in Red Wines
 Research News from Cornell s Viticulture and Enology Program Research Focus 2010-1 RESEARCH FOCUS Cornell Researchers Tackle Green Flavors in Red Wines Tim Martinson 1 and Justin Scheiner 2 1 Senior Viticulture
Mechanical Canopy and Crop Load Management of Pinot Gris. Joseph P. Geller and S. Kaan Kurtural
 Mechanical Canopy and Crop Load Management of Pinot Gris Joseph P. Geller and S. Kaan Kurtural 3.6 million tons of wine grapes grown in CA More than 50% comes from the San Joaquin Valley More than 60%
A new approach to understand and control bitter pit in apple
 FINAL PROJECT REPORT WTFRC Project Number: AP-07-707 Project Title: PI: Organization: A new approach to understand and control bitter pit in apple Elizabeth Mitcham University of California Telephone/email:
Joseph G. Alfieri 1, William P. Kustas 1, John H. Prueger 2, Lynn G. McKee 1, Feng Gao 1 Lawrence E. Hipps 3, Sebastian Los 3
 Joseph G. Alfieri 1, William P. Kustas 1, John H. Prueger 2, Lynn G. McKee 1, Feng Gao 1 Lawrence E. Hipps 3, Sebastian Los 3 1 USDA, ARS, Hydrology & Remote Sensing Lab, Beltsville MD 2 USDA,ARS, National
COMPARISON OF THREE METHODOLOGIES TO IDENTIFY DRIVERS OF LIKING OF MILK DESSERTS
 COMPARISON OF THREE METHODOLOGIES TO IDENTIFY DRIVERS OF LIKING OF MILK DESSERTS Gastón Ares, Cecilia Barreiro, Ana Giménez, Adriana Gámbaro Sensory Evaluation Food Science and Technology Department School
OUTLINE Plan of the talk. Introduction Vineyards are variable in space The efficient vineyard project. The field site in Sonoma Results
 UCCE Sonoma County Grape Day February 8, 2017 Assessing variability in the vineyard through a spatially explicit selective-harvest approach A case study in Sonoma L. Brillante, A. Beebee, R. Yu, J. Martinez,
1. Continuing the development and validation of mobile sensors. 3. Identifying and establishing variable rate management field trials
 Project Overview The overall goal of this project is to deliver the tools, techniques, and information for spatial data driven variable rate management in commercial vineyards. Identified 2016 Needs: 1.
Effect of Thinning of Mandarin. on Yield and Fruit Quality. Mohammad Abd-El- Jaber Alabdallah. Supervisor. Prof. Dr.
 Effect of Thinning of Mandarin (Citrus reticulata Blanco. cv. Michal) on Yield and Fruit Quality By Mohammad Abd-El- Jaber Alabdallah Supervisor Prof. Dr. Mostafa Qrunfleh Submitted in Partial Fulfillment
Lesson 2 The Vineyard. From Soil to Harvest
 Lesson 2 The Vineyard From Soil to Harvest Objectives After reading this chapter, you should be able to display an understanding of how grapes are grown for wine production. describe the annual growing
2015 BUD SURVIVAL SURVEY IN NIAGARA AREA VINEYARDS
 BUD SURVIVAL SURVEY IN NIAGARA AREA VINEYARDS Prepared for: The Grape Growers of Ontario KCMS - Applied Research and Consulting 1215 Maple St. P.O Box 13 Fenwick, Ontario L0S 1C0 Telephone: (905) 892-7050
Session 4: Managing seasonal production challenges. Relationships between harvest time and wine composition in Cabernet Sauvignon.
 Session 4: Managing seasonal production challenges Relationships between harvest time and wine composition in Cabernet Sauvignon Keren Bindon Cristian Varela, Helen Holt, Patricia Williamson, Leigh Francis,
The Importance of Dose Rate and Contact Time in the Use of Oak Alternatives
 W H I T E PA P E R The Importance of Dose Rate and Contact Time in the Use of Oak Alternatives David Llodrá, Research & Development Director, Oak Solutions Group www.oaksolutionsgroup.com Copyright 216
Photo Courtesy of D. Gabriel. OSU s Woodhall Vineyard
 Photo Courtesy of D. Gabriel OSU s Woodhall Vineyard Photo courtesy of P. Skinkis The 2012 season is one of the best in recent years. The season had a great start in late April, and despite rain occurring
Michigan Grape & Wine Industry Council 2012 Research Report. Understanding foliar pest interactions for sustainable vine management
 Michigan Grape & Wine Industry Council 2012 Research Report Understanding foliar pest interactions for sustainable vine management Rufus Isaacs 1, Steven Van Timmeren 1, and Paolo Sabbatini 2 1. Dept.
Optimising harvest date through use of an integrated grape compositional and sensory model
 Optimising harvest date through use of an integrated grape compositional and sensory model Alain DELOIRE, Katja ŠUKLJE, Guillaume ANTALICK, Campbell MEEKS, John W. BLACKMAN & Leigh M. SCHMIDTKE National
Airborne Remote Sensing for Precision Viticulture in Niagara. Ralph Brown School of Engineering University of Guelph
 Airborne Remote Sensing for Precision Viticulture in Niagara Ralph Brown School of Engineering University of Guelph Why the interest in precision viticulture? Highly variable regions in Niagara due to
University of California Cooperative Extension Tulare County. Grape Notes. Volume 3, Issue 4 May 2006
 University of California Cooperative Extension Tulare County Grape Notes Volume 3, Issue 4 May 26 Time of Girdle Experiments Princess, Summer Royal, Thompson Seedless Bill Peacock* and Mike Michigan Girdling
Increasing the efficiency of forecasting winegrape yield by using information on spatial variability to select sample sites
 Increasing the efficiency of forecasting winegrape yield by using information on spatial variability to select sample sites Andrew Hall, Research Fellow, Spatial Science Leo Quirk, Viticulture Extension
2012 BUD SURVIVAL SURVEY IN NIAGARA & ESSEX AREA VINEYARDS
 BUD SURVIVAL SURVEY IN NIAGARA & ESSEX AREA VINEYARDS Prepared for: The Grape Growers of Ontario KCMS - Applied Research and Consulting 1215 Maple St. Box#13 Fenwick, Ontario L0S 1C0 Telephone: (905) 892-7050
2014 Agrium AT Fertilizer Trial Glen R. Obear and Bill Kreuser, Ph.D University of Nebraska-Lincoln. Objectives
 2014 Agrium AT Fertilizer Trial Glen R. Obear and Bill Kreuser, Ph.D University of Nebraska-Lincoln Objectives The objective of this research was to quantify turf response to slow- and controlled-release
Impacts of Regulated Deficit Irrigation on Cabernet Sauvignon Grapes and Wine
 Impacts of Regulated Deficit Irrigation on Cabernet Sauvignon Grapes and Wine Jim Harbertson, Richard Larsen, Federico Casassa, Markus Keller Washington State University Viticulture & Enology Program RDI
Irrigation Management of Winegrapes with a Limited Water Supply
 Irrigation Management of Winegrapes with a Limited Water Supply If there are questions regarding the following information, please contact: Terry Prichard at tlprichard@ucdavis.edu or at 209-953- 6120.
Using Less Water and Liking It
 Using Less Water and Liking It Vineyard Water Conservation Demo Project Mark Greenspan, Ph.D. Advanced Viticulture, LLC www.advancedvit.com Copyright Advanced Viticulture, LLC www.advancedvit.com Irrigation
World of Wine: From Grape to Glass
 World of Wine: From Grape to Glass Course Details No Prerequisites Required Course Dates Start Date: th 18 August 2016 0:00 AM UTC End Date: st 31 December 2018 0:00 AM UTC Time Commitment Between 2 to
Late season leaf health CORRELATION OF VINEYARD IMAGERY WITH PINOT NOIR YIELD AND VIGOUR AND FRUIT AND WINE COMPOSITION. 6/22/2010
 // Not all vineyard blocks are uniform This is because of soil variation primarily, especially in factors which affect the supply of water This has a direct effect on vine vigour, which in turn has a direct
Berry sugar and water loading. Principles and a few observations
 Berry sugar and water loading Principles and a few observations Prof Alain Deloire deloire@sun.ac.za Department of Viticulture and Oenology Stellenbosch University UC-Davis, 10 May 2012 Berry sugar and
HANDS-ON SOLUTIONS TO OVERCOME FAST GRAPE RIPENING
 HANDS-ON SOLUTIONS TO OVERCOME FAST GRAPE RIPENING 1 Techniques based on modification of growing and ripening pattern Increase of vine yield (> bud load) Late shoot trimming Late irrigation (i.e. just
Training system considerations
 Comparative results of three training systems in Winchester VVA Meeting: 13-15 Feb 2003 Tony K. Wolf Professor of Viticulture Training system considerations Why research training systems in Virginia? increase
Crop Load Management of Young Vines
 Crop Load Management of Young Vines UC ANR Foothill Grape Day March 29, 2018 George Zhuang UC Cooperative Extension - Fresno County Thanks for Having Me Here! What is Crop Load? Crop load (Ravaz Index)
Soybean Seeding Date Effects on Productivity Jane Froese 1, Bruce Brolley 2 and Derek Lewis 1
 Soybean Seeding Date Effects on Productivity Jane Froese 1, Bruce Brolley 2 and Derek Lewis 1 1 Dept. of Plant Science, University of Manitoba, Winnipeg, MB R3T 2N2 E-mail: jane_froese@umanitoba.ca, derek_lewis@umanitoba.ca
Applied Geomatics--connecting the dots between grapevine physiology,
 Applied Geomatics--connecting the dots between grapevine physiology, terroir, and remote sensing Andrew Reynolds, Brock University Ralph Brown, University of Guelph Matthieu Marciniak; David Ledderhoff;
2011 Vintage Weather Summary for Two Blondes Vineyard
 2011 Vintage Weather Summary for Two Blondes Vineyard Prepared by: Mark Greenspan, Ph.D. Advanced Viticulture, Inc. www.advancedvit.com Introduction This is a weather summary for Two Blondes Vineyard based
Demonstration Vineyard for Seedless Table Grapes for Cool Climates
 Demonstration Vineyard for Seedless Table Grapes for Cool Climates Sonia G. Schloemann Department of Plant, Soil, & Insect Sciences, University of Massachusetts This project was designed to evaluate the
Measured effects of elevated temperature on vine phenology, yield, berry and wine attributes
 Measured effects of elevated temperature on vine phenology, yield, berry and wine attributes Victor Sadras, Martin Moran & Paul Petrie South Australian R&D Institute, Treasury Wine Estates Funded by Grape
Development of smoke taint risk management tools for vignerons and land managers
 Development of smoke taint risk management tools for vignerons and land managers Glynn Ward, Kristen Brodison, Michael Airey, Art Diggle, Michael Saam-Renton, Andrew Taylor, Diana Fisher, Drew Haswell
D Lemmer and FJ Kruger
 D Lemmer and FJ Kruger Lowveld Postharvest Services, PO Box 4001, Nelspruit 1200, SOUTH AFRICA E-mail: fjkruger58@gmail.com ABSTRACT This project aims to develop suitable storage and ripening regimes for
Growing Cabernet Sauvignon at Wynns Coonawarra Estate
 Growing Cabernet Sauvignon at Wynns Coonawarra Estate The influence of vintage, clones and site Ben Harris Vineyard Manager Wynns Coonawarra Estate Coonawarra Red and White Winegrape Varieties Red (90%)
REGULATED DEFICIT IRRIGATION MANAGEMENT FOR WINEGRAPES
 REGULATED DEFICIT IRRIGATION MANAGEMENT FOR WINEGRAPES Terry L. Prichard, Water Management Specialist, UCCE, Dept. of LAWR, UC Davis Rhonda J. Smith, UCCE Farm Advisor, Sonoma County Paul S. Verdegaal,
Effect of Storage Period and Ga3 Soaking of Bulbs on Growth, Flowering and Flower Yield of Tuberose (Polianthes Tuberosa L.) Cv.
 Cv.") Vol.5 No. 1, 28-32 (2016) Received: Sept.2015; Accepted: Jan, 2016 Effect of Storage Period and Ga3 Soaking of Bulbs on Growth, Flowering and Flower Yield of Tuberose (Polianthes Tuberosa L.) Cv. Double
Vol.5 No. 1, 28-32 (2016) Received: Sept.2015; Accepted: Jan, 2016 Effect of Storage Period and Ga3 Soaking of Bulbs on Growth, Flowering and Flower Yield of Tuberose (Polianthes Tuberosa L.) Cv. Double
2 Grapevine Development and
 2 Grapevine Development and Basic Physiology Pat Bowen, Pacific Agri-Food Research Centre Summerland BC V0H 1Z0 The Goals of Viticulture The common goal of viticulture is to make a profit but strategies
Addressing Research Issues Facing Midwest Wine Industry
 Addressing Research Issues Facing Midwest Wine Industry 18th Annual Nebraska Winery and Grape Growers Forum and Trade Show at the Omaha Marriott March 7 th, 2015 Murli R Dharmadhikari Department of Food
Horizontal networks and collaborative marketing in the Tasmanian wine industry
 Horizontal networks and collaborative marketing in the Tasmanian wine industry Gemma Roach, BBus (Hons) Submitted in fulfilment of the requirements for the degree of Doctor of Philosophy University of
NAME OF CONTRIBUTOR(S) AND THEIR AGENCY:
 AND THEIR AGENCY:") TITLE OF PROJECT: Evaluation of Topaz (propiconazole) for transplant size control and earlier maturity of processing tomato. NAME OF CONTRIBUTOR(S) AND THEIR AGENCY: J.W. Zandstra, Ridgetown College, University
TITLE OF PROJECT: Evaluation of Topaz (propiconazole) for transplant size control and earlier maturity of processing tomato. NAME OF CONTRIBUTOR(S) AND THEIR AGENCY: J.W. Zandstra, Ridgetown College, University
INVENTORY POLICY OF TEA AT LARESOLO TEA HOUSE
 INVENTORY POLICY OF TEA AT LARESOLO TEA HOUSE THESIS Submitted in Partial Fulfillment of the Requirement for the Degree of Bachelor of Engineering in Industrial Engineering Desy Maria Manolong 12 14 06863
CERTIFICATE PROGRAMS VITICULTURE AND WINERY TECHNOLOGY VWT 130 General Viticulture VWT 172 Laboratory Analysis
 Napa Valley College 2277 Napa-Vallejo Highway, Napa, CA. 94558 VITICULTURE AND WINERY TECHNOLOGY Dr. Stephen J. Krebs, Program Coordinator, (707) 253-3259, skrebs@napavalley.edu Bryan Avila, Winery Technology
Evolution of Grapegrowing Techniques and New Viticulture Ideas in Spain. Jesús Yuste.
 Evolution of Grapegrowing Techniques and New Viticulture Ideas in Spain Jesús Yuste yusbomje@itacyl.es Instituto Tecnológico Agrario de Castilla y León Valladolid, Spain Training and pruning Traditional
Kevin Sass Moderator Winemaker Halter Ranch Vineyards
 Trials Talks Trials Talks Kevin Sass Moderator Winemaker Halter Ranch Vineyards Francois Cordesse Francis Ford Coppola Winery Keith Orlebeck South Cost Winery Cameron Parry Groth Winery and Vineyards Andrew
Climate Limitations and Vineyards in Arizona
 Climate Limitations and Vineyards in Arizona Arizona Grape Growers Symposium March 23, 2018 Jeremy Weiss Climate and Geospatial Extension Scientist School of Natural Resources and the Environment University
The influence of Cabernet Sauvignon grape maturity on the concentration and extraction of colour and phenolic compounds in wine
 The influence of Cabernet Sauvignon grape maturity on the concentration and extraction of colour and phenolic compounds in wine Cynthia C. Yonker A thesis submitted for fulfillment of the degree of Doctor
NE-1020 Cold Hardy Wine Grape Cultivar Trial
 Iowa State Research Farm Progress Reports 2014 NE-1020 Cold Hardy Wine Grape Cultivar Trial Paul A. Domoto Iowa State University, domoto@iastate.edu Gail R. Nonnecke Iowa State University, nonnecke@iastate.edu
Processing Peach Cultivar Evaluations 2004 Progress Report
 Processing Peach Cultivar Evaluations 2004 Progress Report Cedar Springs Research Station Ridgetown College University of Guelph J.W. Zandstra G.J. Watt TITLE: PROCESSING PEACH CULTIVAR EVALUATION EXPERIMENT
RESOLUTION OIV-ECO
 RESOLUTION OIV-ECO 563-2016 TRAINING PROGRAMS FOR OENOLOGISTS THE GENERAL ASSEMBLY, based on the work of the FORMAT Expert Group, CONSIDERING the resolution OIV-ECO 492-2013 providing the definition of
World of Wine: From Grape to Glass Syllabus
 World of Wine: From Grape to Glass Syllabus COURSE OVERVIEW Have you always wanted to know more about how grapes are grown and wine is made? Perhaps you like a specific wine, but can t pinpoint the reason
Practical Aspects of Crop Load and Canopy Management
 Practical Aspects of Crop Load and Canopy Management Jim Wolpert Extension Viticulturist Department of Viticulture and Enology University of California, Davis Penn State Grape Day August 10, 2011 Presentation
Effects of Leaf Removal and UV-B on Flavonoids, Amino Acids and Methoxypyrazines
 Effects of Leaf Removal and UV-B on Flavonoids, Amino Acids and Methoxypyrazines Professor Brian Jordan Centre for Viticulture & Oenology, Lincoln University What are the major factors to be considered
FOOD FOR THOUGHT Topical Insights from our Subject Matter Experts LEVERAGING AGITATING RETORT PROCESSING TO OPTIMIZE PRODUCT QUALITY
 FOOD FOR THOUGHT Topical Insights from our Subject Matter Experts LEVERAGING AGITATING RETORT PROCESSING TO OPTIMIZE PRODUCT QUALITY The NFL White Paper Series Volume 5, August 2012 Introduction Beyond
Stella Maris on Wine Grapes. Spring, 2018
 Stella Maris on Wine Grapes Spring, 2018 Traditional Stella Maris wine programs have focused on improving cluster architecture, berry set, and yield. Wine Grape Benefits More recent, research has focused
THE EXPECTANCY EFFECTS OF CAFFEINE ON COGNITIVE PERFORMANCE. John E. Lothes II
 THE EXPECTANCY EFFECTS OF CAFFEINE ON COGNITIVE PERFORMANCE John E. Lothes II A Thesis Submitted to the University of North Carolina at Wilmington in Partial Fulfillment of the Requirements for the Degree
Condensed tannin and cell wall composition in wine grapes: Influence on tannin extraction from grapes into wine
 Condensed tannin and cell wall composition in wine grapes: Influence on tannin extraction from grapes into wine by Rachel L. Hanlin Thesis submitted for Doctor of Philosophy The University of Adelaide
2013 Vintage Weather Summary for Two Blondes Vineyard
 2013 Vintage Weather Summary for Two Blondes Vineyard Prepared by: Mark Greenspan, Ph.D. Joe Gallucci M.S. Soils, M.S.. Viticulture Advanced Viticulture, Inc. www.advancedvit.com Introduction This is a
Vineyard IPM Scouting Report for week of 15 September 2014 UW-Extension Door County and Peninsular Agricultural Research Station
 NO. 12 1 Vineyard IPM Scouting Report for week of 15 September 2014 UW-Extension Door County and Peninsular Agricultural Research Station Cold Slows Grape Maturity Grape maturity is reliant on a number
Michigan Grape & Wine Industry Council 2008 Research Report
 Michigan Grape & Wine Industry Council 2008 Research Report Determination of action thresholds for potato leafhopper in winegrapes, and comparison of foliar insecticides for its control Rufus Isaacs 1,
Regression Models for Saffron Yields in Iran
 Regression Models for Saffron ields in Iran Sanaeinejad, S.H., Hosseini, S.N 1 Faculty of Agriculture, Ferdowsi University of Mashhad, Iran sanaei_h@yahoo.co.uk, nasir_nbm@yahoo.com, Abstract: Saffron
Final Report to Delaware Soybean Board January 11, Delaware Soybean Board
 Final Report to Delaware Soybean Board January 11, 2017 Delaware Soybean Board (susanne@hammondmedia.com) Effect of Fertigation on Irrigated Full Season and Double Cropped Soybeans Cory Whaley, James Adkins,
Specific mediterranean characteristics. Mediterranean climate
 Effect of global warming in mediterranean conditions Climate change - Average temperatures increase and efficient rainfalls decrease Consequences for vines and grapes - Shortening of phenologic stages
Varieties and Rootstocks in Texas
 Varieties and Rootstocks in Texas Pierre Helwi, Ph.D Extension Viticulture Specialist Texas A&M AgriLife Extension Service Grape Camp November 05, 2017 Characteristics of Major Types of Grapes Type Fruit
(36) PROHEXADIONE-CALCIUM AFFECTS SHOOT GROWTH AND YIELD OF LEMON, ORANGE AND AVOCADO DIFFERENTLY
 PROHEXADIONE-CALCIUM AFFECTS SHOOT GROWTH AND YIELD OF LEMON, ORANGE AND AVOCADO DIFFERENTLY") (36) PROHEXADIONE-CALCIUM AFFECTS SHOOT GROWTH AND YIELD OF LEMON, ORANGE AND AVOCADO DIFFERENTLY Lauren C. Garner, Yusheng Zheng, Toan Khuong and Carol J. Lovatt 1 ABSTRACT Lemon (Citrus limon L.) and
(36) PROHEXADIONE-CALCIUM AFFECTS SHOOT GROWTH AND YIELD OF LEMON, ORANGE AND AVOCADO DIFFERENTLY Lauren C. Garner, Yusheng Zheng, Toan Khuong and Carol J. Lovatt 1 ABSTRACT Lemon (Citrus limon L.) and
SWEET DOUGH APPLICATION RESEARCH COMPARING THE FUNCTIONALITY OF EGGS TO EGG REPLACERS IN SWEET DOUGH FORMULATIONS RESEARCH SUMMARY
 SWEET DOUGH APPLICATION RESEARCH COMPARING THE FUNCTIONALITY OF EGGS TO EGG REPLACERS IN SWEET DOUGH FORMULATIONS RESEARCH SUMMARY SWEET DOUGH RESEARCH EXECUTIVE SUMMARY For this study, eggs were reduced
Characterising weight loss in Vitis vinifera Shiraz berries at sub-optimal maturity Joanne Tilbrook
 Characterising weight loss in Vitis vinifera Shiraz berries at sub-optimal maturity Joanne Tilbrook Thesis presented for the degree of Doctor of Philosophy The University of Adelaide School of Agriculture,
Varietal Specific Barrel Profiles
 RESEARCH Varietal Specific Barrel Profiles Beaulieu Vineyard and Sea Smoke Cellars 2006 Pinot Noir Domenica Totty, Beaulieu Vineyard Kris Curran, Sea Smoke Cellars Don Shroerder, Sea Smoke Cellars David
Quality of western Canadian flaxseed 2012
 ISSN 1700-2087 Quality of western Canadian flaxseed 2012 Ann S. Puvirajah Oilseeds Contact: Ann S. Puvirajah Oilseeds Tel : 204 983-3354 Email: ann.puvirajah@grainscanada.gc.ca Fax : 204-983-0724 Grain
Quality of Canadian non-food grade soybeans 2014
 ISSN 1705-9453 Quality of Canadian non-food grade soybeans 2014 Ann S. Puvirajah Chemist, Oilseed Services Contact: Ann S. Puvirajah Chemist, Oilseeds Services Tel: 204-983-3354 Email: ann.puvirajah@grainscanada.gc.ca
FLOWERING OF TOMATO IN RELATION TO PRE-PLANTING LOW TEMPERATURES
 FLOWERING OF TOMATO IN RELATION TO PRE-PLANTING LOW TEMPERATURES G. Noto; G. La Malfa Istituto di Orticoltura e Floricoltura Università' degli Studi Catania - Italy Abstract The results of two trials carried