PEEL RIVER HEALTH ASSESSMENT
|
|
|
- Cassandra Hunter
- 6 years ago
- Views:
Transcription


1
2 PEEL RIVER HEALTH ASSESSMENT CONTENTS SUMMARY... 2 Overall River Health Scoring... 2 Overall Data Sufficiency Scoring... 2 HYDROLOGY... 3 Overall Hydrology River Health Scoring... 3 Hydrology Data Sufficiency... 4 Long-Term Trends in Monthly Flow for the Peel River... 5 Recent-Term Trends in Monthly Flow for the Peel River... 7 Trends in Annual Flow for the Peel River Basin... 9 Hydrological Alteration in the Peel River Basin WATER QUALITY Overall Water Quality Health Scoring Water Quality Data Sufficiency FISH Overall Fish Health Scoring Fish Data Sufficiency BENTHICS Overall Benthic Health Scoring Benthic Data Sufficiency... 22
3 SUMMARY OVERALL RIVER HEALTH SCORING Indicator Hydrology Health Category Basin Poor Hydrology Hydrology Score Water Quality Health Category 1 Fair Water Quality Water Quality Health Score Benthic Health Category 2 Very Good Benthic Macro-Invertebrates Benthic Health Score Fish Health Category 4 Data Deficient Fish Fish Health Score Data Deficient Total Score Total Available Score Percentage of Maximum Score Overall Health Category % Fair OVERALL DATA SUFFICIENCY SCORING Hydrology Indicator Data Sufficiency Category Basin Partially Sufficient Data Sufficiency Score 1 Water Quality Data Sufficiency Category Partially Sufficient Data Sufficiency Score 1 Overall River Health Benthic Macro- Invertebrates Data Sufficiency Category Partially Sufficient Data Sufficiency Score 1 Fish Data Sufficiency Category 0 Data Sufficiency Score 0 Total Score Total Available Score Percentage of Maximum Score Overall Data Sufficiency Category % Partially Sufficient
4 HYDROLOGY OVERALL HYDROLOGY RIVER HEALTH SCORING Hydrology Long-Term Trends in Monthly Flow Recent-Term Trends in Monthly Flow Long-Term Trends in Annual Flow Pre- vs. Post- Dam or Recent vs. Historical Analsis of Monthly Flow Indicator percentage change in median monthly flow, measured as the relative change in median monthly flow per year, reported as an average across studied stations and weighted by the median annual flow per station. percentage change in median monthly flow, measured as the relative change in median monthly flow per year, reported as an average across studied stations and weighted by the median annual flow per station. percentage change in median annual flow, reported as an average across studied stations and weighted by the median annual flow per station. Percentage of total months, for all stations analyzed, with significantly different variance in monthly flow pre- vs. post-dam operation or for historical vs. Recent time periods in undammed systems. Percentage change in median monthly flow pre-and post-dam or for historical vs. Recent time periods in undammed systems, averaged across studied stations by mean annual flow. Period of Study Stations 2 Value 0.38 Health Category Good Health Score 3 Period of Study Stations 2 Value 0.86 Health Category Good Health Score 3 Period of Study Stations 2 Value 1.3 Health Category Fair Health Score 2 Period of Study Stations Various 2 Value 64.8% Health Category Very Poor Health Score 0 Period of Study Stations Various 2 Value 32.2% Health Category Fair Health Score 2 Total Score 10 Maximum Available Score Basin 20 Hydrology Score Percentage of Maximum Score Hydrology Health Category 50.0% Poor Hydrology Score 1
5 HYDROLOGY DATA SUFFICIENCY Data Sufficiency Indicator Value Total number of sub-basins 3 Total number of dams (>10m) 0 Year of earliest dam operation - Year of earliest available continuous flow monitoring 1968 monitoring stations available for earliest, continuous flow monitoring 1 sub-basins with monitoring stations 1 Number if monitoring stations on river downstream of dams - Data Sufficiency Category Partially Sufficient Hydrology Year of long-term continuous flow monitoring monitoring stations available for continuous flow monitoring analysis sub-basins with monitoring stations monitoring stations on river downstream of dams - Data Sufficiency Category Partially Sufficient Year of widespread, continuous flow monitoring 1985 monitoring stations available for continuous flow monitoring analysis 2 sub-basins with monitoring stations 2 monitoring stations on river downstream of dams - Data Sufficiency Category Moderately Sufficient Overall Data Sufficiency Category Data Sufficiency Score Partially Sufficient 1

6 LONG-TERM TRENDS IN MONTHLY FLOW FOR THE PEEL RIVER MAP 10. RESULTS OF A SERIES OF TREND ANALYSES OF MEDIAN MONTHLY FLOW IN THE PEEL RIVER BASIN FOR THE PERIOD 1969 TO 2012.
7 TABLE. RESULTS OF LONG-TERM TREND ANALYSES FOR MEDIAN MONTHLY FLOW IN THE PEEL RIVER. Month Theil-Sen Slope Mann-Kendall p-value 10MA001 Start Year of Monitoring 1969 Annual Flow (m 3 /s) Monthly Flow Percentage Change in Monthly Flow* Peel River Theil-Sen Slope Mann-Kendall p-value 10MC002 Start Year of Monitoring 1969 Annual Flow (m 3 /s) Monthly Flow October Percentage Change in Monthly Flow* November * * December ** ** January E-05 *** E-05 *** February E-05 *** E-05 *** March ** ** April May * * June -6.98E ** E ** July August September * * for all months, for each station percentage change in median monthly flow for all months, weighted by median annual flow * Percentage change in median monthly flow is only calculated for months with a statistically significant trend over time. For months without a significant trend, a value of zero is assigned for calculation of the overall station score.
8 RECENT-TERM TRENDS IN MONTHLY FLOW FOR THE PEEL RIVER MAP. RESULTS OF A SERIES OF TREND ANALYSES OF MEDIAN MONTHLY FLOW IN THE PEEL RIVER BASIN FOR THE PERIOD 1985 TO 2012.
9 TABLE. RESULTS OF RECENT-TERM TREND ANALYSES FOR MEDIAN MONTHLY FLOW IN THE PEEL RIVER BASIN. Peel River 10MA001 Start Year of Monitoring 1985 Annual Flow (m 3 /s) MC002 Start Year of Monitoring 1985 Annual Flow (m 3 /s) Month Theil-Sen Slope Mann-Kendall p-value Monthly Flow Percentage Change in Monthly Flow* Theil-Sen Slope Mann-Kendall p-value Monthly Flow Percentage Change in Monthly Flow* October * November * ** December ** E-05 *** January E-05 *** E-05 *** February E-05 *** E-05 *** March ** E-05 *** April E-05 *** May * June -6.98E ** E E-04 *** July August E September * for all months, for each station percentage change in median monthly flow for all months, weighted by median annual flow


10 TRENDS IN ANNUAL FLOW FOR THE PEEL RIVER BASIN TABLE. RESULTS OF LINEAR REGRESSION ANALYSES FOR LONG-TERM TREND ANALYSIS OF MEDIAN ANNUAL FLOW IN THE PEEL RIVER, BY STATION. Station Start Year Intercept Intercept Standard Error Intercept T- Test Statistic Intercept T- Test p-value Slope Slope Standard Error Slope T- Test Statistic Slope T-Test p-value Adjusted R- Squared F-Test Static 10MA * * 10MC *** *** F-Test p-value TABLE. RESULTS OF MANN-KENDALL NON-PARAMETRIC LONG-TERM TREND ANALYSIS OF MEDIAN ANNUAL FLOW IN THE PEEL RIVER, BY STATION. Station Start Year Theil -Sen Slope Mann- Kendall Test Statistic Mann-Kendall Test p-value Annual Flow (m 3 /s) 10MA Percentage Change in Annual Flow 10MC *** Weighted Between Stations 1.25 FIGURE. TIME-SERIES OF LONG-TERM TRENDS IN MEDIAN ANNUAL FLOW FOR THE PEEL RIVER BASIN, BY STATION.
11 HYDROLOGICAL ALTERATION IN THE PEEL RIVER BASIN TABLE. NON-PARAMETRIC COMPARISON OF VARIANCE FOR RECENT VS. HISTORICAL MONTHLY FLOW IN THE PEEL RIVER BASIN. Historic Recent Fligner-Killeen Mann-Whitney Station Month Years of Sampling Monthly Flow (m 3 /s) Absolute Deviation in Monthly Flow (m 3 /s) Years of Sampling Monthly Flow (m 3 /s) Absolute Deviation in Monthly Flow (m 3 /s) Test Statistic p-value Test Statistic p-value Percentage Change in Monthly Flow Between the Two Time Periods Percentage Across Months* Annual Flow (m 3 /s) Weighted Across Basin June ** *** 25.0% July *** *** 14.0% Augus t ** 11.1% September *** *** 22.8% October *** % 10MA001 November *** 9.6% December *** 15.0% 26.3% January *** 24.3% February ** *** 30.2% March *** *** 32.1% April *** *** 23.9% May *** 107.9% September *** 15.3% 32.2% October ** *** 22.7% November *** *** 20.3% December *** *** 22.3% January *** *** 34.3% 10MC002 February *** *** 32.5% March *** *** 26.9% 33.8% April *** *** 30.4% June *** *** 23.4% July % Augus t % May *** 177.2% *Percentage change in median monthly flow is only calculated for months with a statistically significant difference between the two time periods. For months without a siginificant trend, a value of zero is assigned for calculation of the overall score.


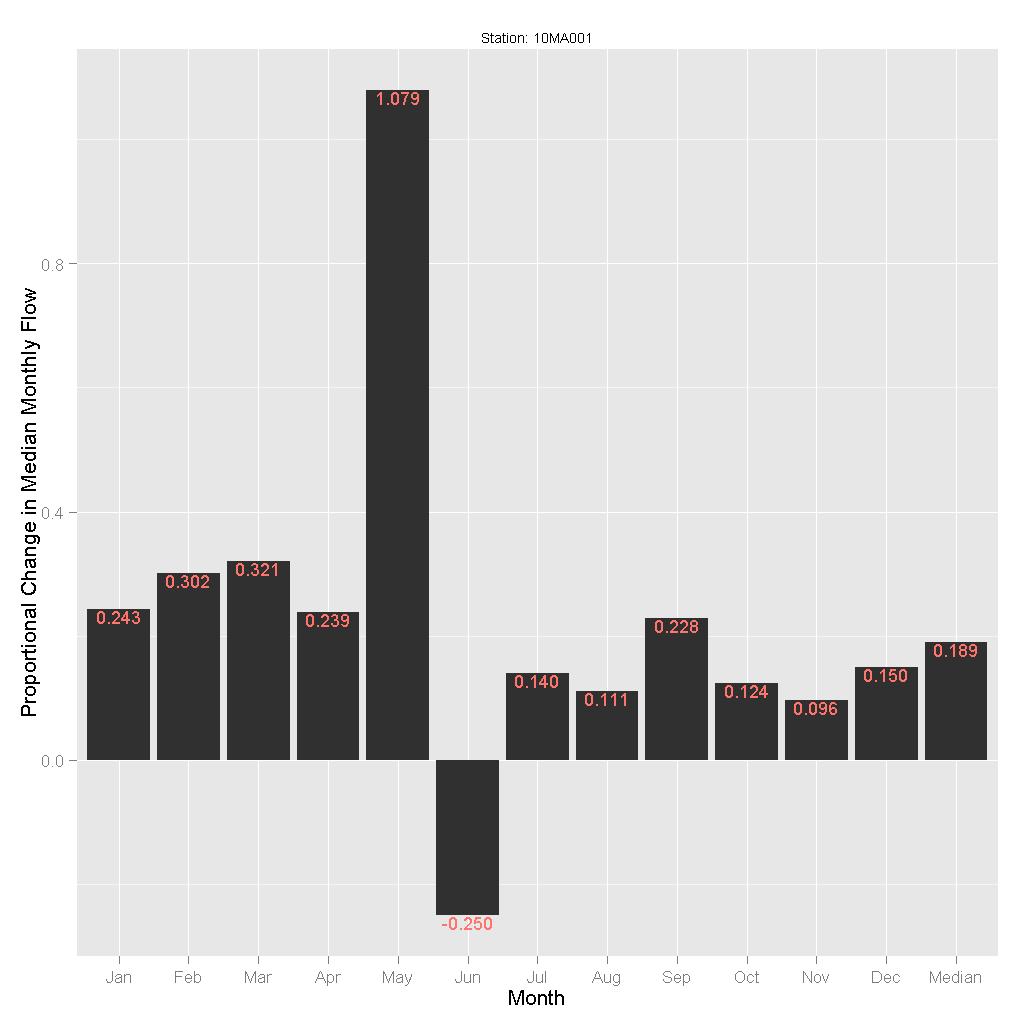
12 FIGURE. ANALYSIS OF VARIANCE IN MONTHLY FLOW FOR RECENT VS. HISTORICAL TIME PERIODS IN THE PEEL RIVER BASIN, BY STATION. FIGURE. PERCENTAGE CHANGE IN MEDIAN MONTHLY FLOW FOR RECENT VS. HISTORICAL TIME PERIODS IN THE PEEL RIVER BASIN, BY STATION.
13 WATER QUALITY OVERALL WATER QUALITY HEALTH SCORING Water Quality Exceedance of water quality guidelines for aquatic life Indicator Exceedance of water quality thresholds. Weighted average of exceedances of three thresholds: water quality guidelines,90th percentile and 77th percentile. Expressed as a proportion of total measurements. Reported as a weighted average for the most recent five years. Value Year Stations 5 Value 0.3 Water Quality Health Category Water Quality Health Score Fair 2 Significant Mann-Kendal timeseries test to determine directional trend in proportion of exceedance of water quality thresholds. Time Period Trend None WATER QUALITY DATA SUFFICIENCY Data Sufficiency Indicator Total number of sub-basins Value 3 Year of earliest available monitoring 1960 Water Quality monitoring stations available for earliest monitoring sub-basins with earliest available monitoring stations Year of most recently available monitoring monitoring stations available within last five years sub-sub-basins within last five years years of sampling in last 10 years Percentage of samples with at least 10 elements measured within last 5 years. Overall Data Sufficiency Category Data Sufficiency Score % Partially Sufficient 1

14 MAP. ADHERENCE TO WATER GUIDELINES FOR MONITORING STATIONS IN THE PEEL RIVER BASIN FOR THE MOST RECENT YEARS AVAILABLE.
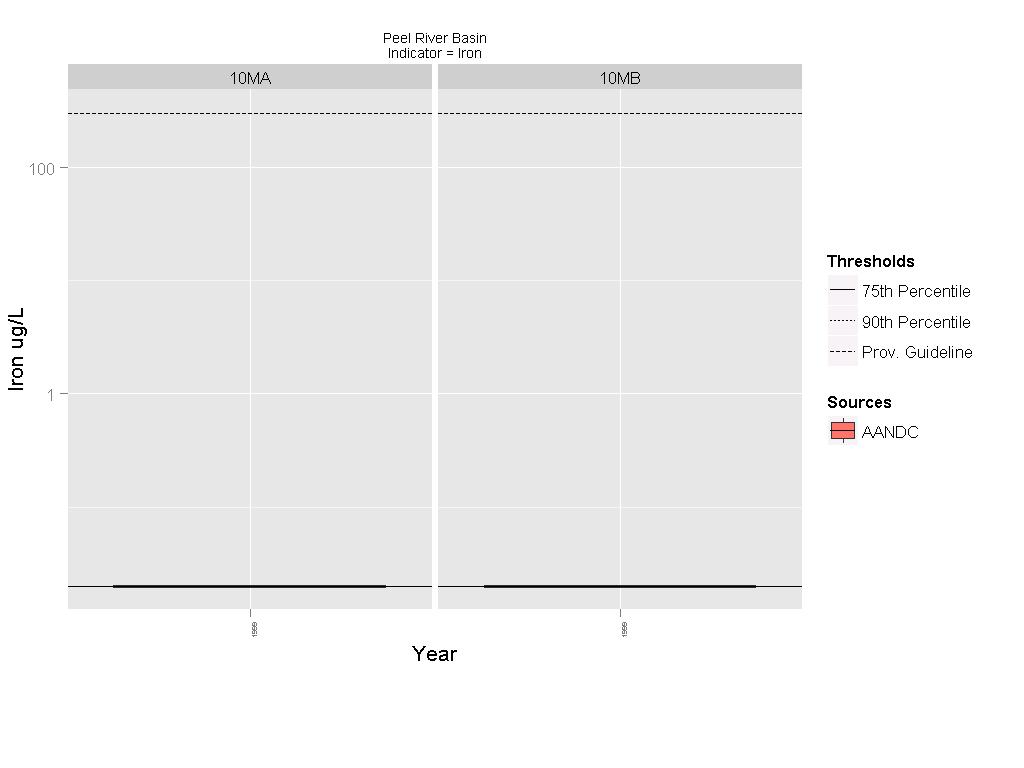
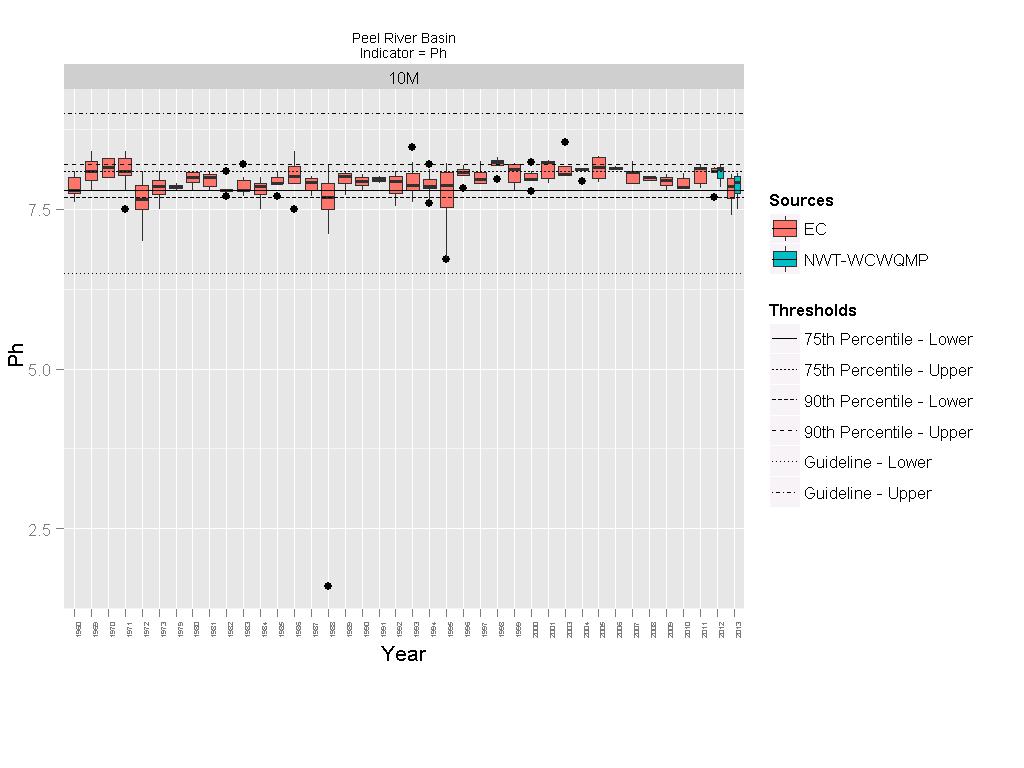
15 FIGURE. WATER QUALITY IN THE PEEL RIVER BASIN BASED ON PROPORTION OF EXCEEDANCE OF THREE THRESHOLDS: PROVINCIAL WATER QUALITY GUIDELINES, 75TH PERCENTILE OF HISTORICAL DISTRIBUTION, AND 90TH PERCENTILE OF HISTORICAL DISTRIBUTION. REPORTED BY YEAR AND DATA SOURCE. Year Source Contaminants Measured Total Sites Measurements Total Guidelines Exceedances Proportion of Guideline Exceedance Total 90th Percentile Exceedances Proportion of 90th Percentile Exceedance Total 75th Percentile Exceedances Proportion of 75th Percentile Exceedance Weighted Exceedance 5-Years Weighted Exceedance 2013 Environment Canada NWT-Wide Communitybased Water Quality Monitoring Program Environment Canada NWT-Wide Communitybased Water Quality Monitoring Program Environment Canada Environment Canada Environment Canada Canadian Aquatic Biomonitoring Network Canadian Aquatic Biomonitoring Network Aboriginal Affairs and Northern Development Canada

16 FIGURE. ANALYSIS OF VARIANCE IN EXCEEDANCE OF WATER QUALITY THRESHOLDS OVER TIME FOR MONITORING STATIONS IN THE PEEL RIVER BASIN, BY SUB-BASIN. FIGURE. ANALYSIS OF VARIANCE IN EXCEEDANCE OF WATER QUALITY THRESHOLDS OVER TIME FOR MONITORING STATIONS IN THE YUKON PORTION OF THE PEEL RIVER BASIN, BY CONTAMINANT.
17
18
19 FIGURE. ANALYSIS OF VARIANCE IN EXCEEDANCE OF WATER QUALITY THRESHOLDS OVER TIME FOR MONITORING STATIONS IN THE NORTHWEST TERRITORIES PORTION OF THE PEEL RIVER BASIN, BY CONTAMINANT.
20
21 TABLE. RESULTS OF MANN-KENDALL NON-PARAMETRIC TREND ANALYSIS OF ANNUAL EXCEEDANCE OF WATER QUALITY THRESHOLDS OVER TIME FOR MONITORING STATIONS IN THE PEEL RIVER BASIN, BY DATA SOURCE.
22 FISH OVERALL FISH HEALTH SCORING Indicator Basin Period of Study Sites 41 Fish Change in Native Fish Species Richness Presence of statistically significant decline in number of total species observed per year. Presence of statistically significant decline in median species richness for the basin. Trend Trend Data Deficient Data Deficient Fish Health Category Data Deficient Fish Health Score Data Deficient FISH DATA SUFFICIENCY Data Sufficiency Indicator Total number of sub-sub-basins Basin 3 Year of earliest available monitoring 1998 sampling locations available for earliest monitoring 3 sub-sub-basins with earliest available sampling locations 3 Earliest year of continuous monitoring 1998 Fish sampling locations available for first year of continuous monitoring sub-sub-basins for first year of continuous monitoring 3 1 Year of most recently available monitoring 2010 monitoring stations available within last five years 51 sub-sub-basins within last five years 3 years of sampling in last 10 years Overall Data Sufficiency Category Data Sufficiency Score 3 Insufficient 0
23 BENTHICS OVERALL BENTHIC HEALTH SCORING Basin Indicator Value Benthic Macro- Invertebrates Index of benthic community composition based on sensitivity to disturbance Hilsenhoff Biotic Index (HBI) score for the basin. Reported as a weighted average for the most recent five years. Significant Mann-Kendal timeseries test to determine directional trend in HBI over time. Year Sites 58 Value 4.01 Benthic Health Category Benthic Health Score Very Good Time Period - Trend - 4 BENTHIC DATA SUFFICIENCY Data Sufficiency Indicator Total number of sub-basins Value 3 Year of earliest available monitoring 1998 Benthic Macro-Invertebrates monitoring stations available for earliest monitoring sub-basins with earliest available monitoring stations Year of most recently available monitoring monitoring stations available within last five years sub-sub-basins within last five years years of sampling in last 10 years 3 Overall Data Sufficiency Category Data Sufficiency Score Partially Sufficient 1

24 MAP. HILSENHOFF'S BIOTIC INDEX SCORES FOR BENTHIC MACRO-INVERTEBRATE COMMUNITIES IN THE PEEL RIVER.


25 Table. HILSENHOFF'S BIOTIC INDEX VALUES FOR BENTHIC MACRO-INVERTEBRATE COMMUNITIES SAMPLED IN THE PEEL RIVER BASIN, BY YEAR, AND DATA SOURCE. Source Sub-basin Year Number of Sites HBI Value CABIN-BISY CABIN-YTG 10MA MB MC MA MB FIGURE. ANALYSIS OF VARIANCE FOR HILSENHOFF'S BIOTIC INDEX VALUES FOR BENTHIC MACRO-INVERTEBRATE COMMUNITIES SAMPLED IN THE PEEL RIVER BASIN. FIGURE. TREND ANALYSIS FOR HILSENHOFF'S BIOTIC INDEX VALUES FOR BENTHIC MACRO-INVERTEBRATE COMMUNITIES SAMPLED IN THE PEEL RIVER BASIN.
Problem Set #3 Key. Forecasting
 Problem Set #3 Key Sonoma State University Business 581E Dr. Cuellar The data set bus581e_ps3.dta is a Stata data set containing annual sales (cases) and revenue from December 18, 2004 to April 2 2011.
Problem Set #15 Key. Measuring the Effects of Promotion II
 Problem Set #15 Key Sonoma State University Business 580-Business Intelligence Dr. Cuellar Measuring the Effects of Promotion II 1. For Total Wine Sales Using a Non-Promoted Price of $9 and a Promoted
EXECUTIVE SUMMARY. 1. When do Asian clams reproduce in Lake George? 2. How fast do Asian clams grow in Lake George?
 Reproduction and Growth of Asian Clams in Lake George Report to the Lake George Association 3-21-16 Sandra Nierzwicki-Bauer, Jeremy Farrell Darrin Fresh Water Institute EXECUTIVE SUMMARY Asian clams have
Quality of western Canadian flaxseed 2012
 ISSN 1700-2087 Quality of western Canadian flaxseed 2012 Ann S. Puvirajah Oilseeds Contact: Ann S. Puvirajah Oilseeds Tel : 204 983-3354 Email: ann.puvirajah@grainscanada.gc.ca Fax : 204-983-0724 Grain
Quality of western Canadian pea beans 2009
 ISSN 1920-9096 Quality of western Canadian pea beans 2009 Ning Wang Program Manager, Pulse Research Contact: Ning Wang Program Manager, Pulse Research Tel : 204-983-2154 Email: ning.wang@grainscanada.gc.ca
Quality of western Canadian peas 2009
 ISSN 1920-9053 Quality of western Canadian peas 2009 Ning Wang Program Manager, Pulse Research Contact: Ning Wang Program Manager, Pulse Research Tel : 204-983-2154 Email: ning.wang@grainscanada.gc.ca
Quality of western Canadian flaxseed 2013
 ISSN 1700-2087 Quality of western Canadian flaxseed 2013 Ann S. Puvirajah Oilseeds Contact: Ann S. Puvirajah Oilseeds Tel : 204 983-3354 Email: mailto:ann.puvirajah@grainscanada.gc.ca Fax : 204-983-0724
Quality of western Canadian flaxseed 2014
 ISSN 1700-2087 Quality of western Canadian flaxseed 2014 Ann S. Puvirajah Oilseeds Contact: Ann S. Puvirajah Oilseeds Tel : 204 983-3354 Email: ann.puvirajah@grainscanada.gc.ca Fax : 204-983-0724 Grain
western Canadian flaxseed 2003
 Quality of western Canadian flaxseed 2003 Douglas R. DeClercq Program Manager, Oilseeds Services James K. Daun Section Head, Oilseeds and Pulses Contact: Douglas R. DeClercq Program Manager, Oilseeds Services
QUARTELY MAIZE MARKET ANALYSIS & OUTLOOK BULLETIN 1 OF 2015
 QUARTELY MAIZE MARKET ANALYSIS & OUTLOOK BULLETIN 1 OF 2015 INTRODUCTION The following discussion is a review of the maize market environment. The analysis is updated on a quarterly 1 basis and the interval
Quality of western Canadian pea beans 2011
 ISSN 1920-9096 Quality of western Canadian pea beans 2011 Ning Wang Program Manager, Pulse Research Contact: Ning Wang Program Manager, Pulse Research Tel : 204 983-2154 Email: ning.wang@grainscanada.gc.ca
Improving Capacity for Crime Repor3ng: Data Quality and Imputa3on Methods Using State Incident- Based Repor3ng System Data
 Improving Capacity for Crime Repor3ng: Data Quality and Imputa3on Methods Using State Incident- Based Repor3ng System Data July 31, 2014 Justice Research and Statistics Association 720 7th Street, NW,
THIS REPORT CONTAINS ASSESSMENTS OF COMMODITY AND TRADE ISSUES MADE BY USDA STAFF AND NOT NECESSARILY STATEMENTS OF OFFICIAL U.S.
 THIS REPORT CONTAINS ASSESSMENTS OF COMMODITY AND TRADE ISSUES MADE BY USDA STAFF AND NOT NECESSARILY STATEMENTS OF OFFICIAL U.S. GOVERNMENT POLICY Required Report - public distribution Date: GAIN Report
Growing divergence between Arabica and Robusta exports
 Growing divergence between Arabica and Robusta exports In April 218, the ICO composite indicator decreased by.4% to an average of 112.56, with the daily price ranging between 11.49 and 114.73. Prices for
Dairy Market. July The U.S. average all-milk price rose by $0.20 per hundredweight in May from a
 Dairy Market Dairy Management Inc. R E P O R T Volume 20 No. 6 July 2017 DMI NMPF Overview The U.S. average all-milk price rose by $0.20 per hundredweight in May from a month earlier, and the June federal
Quality of western Canadian pea beans 2010
 ISSN 1920-9096 Quality of western Canadian pea beans 2010 Ning Wang Program Manager, Pulse Research Contact: Ning Wang Program Manager, Pulse Research Tel : 204 983-2154 Email: ning.wang@grainscanada.gc.ca
Food Additive Produced by IAR Team Focus Technology Co., Ltd
 Food Additive 2012.03 Produced by IAR Team Focus Technology Co., Ltd Contents 1. 2009-2011 Chinese Citric Acid Export Data Analysis... 3 2009-2011 Major Importers of Chinese Citric Acid...4 2. 2009-2011
Tree Rings and Water Resource Management in the Southwest
 Tree Rings and Water Resource Management in the Southwest Connie Woodhouse* School of Geography and Regional Development and Laboratory of Tree-Ring Research, University of Arizona Water Management and
Napa Highway 29 Open Wineries
 4 5 6 7 8 9 35 4 45 5 55 Sonoma State University Business 58-Business Intelligence Problem Set #6 Key Dr. Cuellar Trend Analysis-Analyzing Tasting Room Strategies 1. Graphical Analysis a. Show graphically
Mango Retail Performance Report 2017
 Mango Retail Performance Report 2017 1 Table of Contents Pages 3-9 Pages 10-15 Pages 16-34 Pages 35-44 Pages 45-51 Pages 52-54 Executive Summary Fruit and Tropical Fruit Performance Whole Mango Performance
(A report prepared for Milk SA)
") South African Milk Processors Organisation The voluntary organisation of milk processors for the promotion of the development of the secondary dairy industry to the benefit of the dairy industry, the consumer
South African Milk Processors Organisation The voluntary organisation of milk processors for the promotion of the development of the secondary dairy industry to the benefit of the dairy industry, the consumer
Internet Appendix for CEO Personal Risk-taking and Corporate Policies TABLE IA.1 Pilot CEOs and Firm Risk (Controlling for High Performance Pay)
") TABLE IA.1 Pilot CEOs and Firm Risk (Controlling for High Performance Pay) OLS regressions with annualized standard deviation of firm-level monthly stock returns as the dependent variable. A constant is
TABLE IA.1 Pilot CEOs and Firm Risk (Controlling for High Performance Pay) OLS regressions with annualized standard deviation of firm-level monthly stock returns as the dependent variable. A constant is
Fair Trade and Free Entry: Can a Disequilibrium Market Serve as a Development Tool? Online Appendix September 2014
 Fair Trade and Free Entry: Can a Disequilibrium Market Serve as a Development Tool? 1. Data Construction Online Appendix September 2014 The data consist of the Association s records on all coffee acquisitions
Figure 1: Quartely milk production and gross value
 Million Litres Million Rands QUARTERLY DAIRY MARKET ANALYSIS BULLETIN 1 OF 215 1. INTRODUCTION The following discussion is a review of the dairy market environment. The analysis is updated on a quarterly
MARKET ANALYSIS REPORT NO 1 OF 2015: TABLE GRAPES
 MARKET ANALYSIS REPORT NO 1 OF 215: TABLE GRAPES 1. INTRODUCTION The following text is a review of the table grapes marketing environment. This analysis is updated on a quarterly 1 basis. The interval
Fungicides for phoma control in winter oilseed rape
 October 2016 Fungicides for phoma control in winter oilseed rape Summary of AHDB Cereals & Oilseeds fungicide project 2010-2014 (RD-2007-3457) and 2015-2016 (214-0006) While the Agriculture and Horticulture
Price monitoring of key food items in Donetsk and Luhansk Oblasts
 Market update Issue (October ) UKRAINE Price monitoring of key food items in Donetsk and Luhansk Oblasts Fighting hunger worldwide Highlight Cost of food basket remained higher at national level throughout
Fruit and Vegetables: Q1/2013
 20 May 2013 1100 hrs 097/2013 In the first quarter, the reported volume of fresh fruit and vegetables advanced by 19.4 per cent, whereas the wholesale value declined by 11.6 per cent when compared to the
1. Expressed in billions of real dollars, seasonally adjusted, annual rate.
 ROUTPUT -- Real GNP/GDP 1. Expressed in billions of real dollars, seasonally adjusted, annual rate. 2. First Monthly Vintage: 1965:M11 First Quarterly Vintage: 1965:Q4 3. First Observation: 1947:Q1 4.
Pinto and Great Northern Bean Prices: Historical Trends and Seasonal Patterns
 EXTENSION EC825 Pinto and Great Northern Bean Prices: Historical Trends and Seasonal Patterns Jessica J. Johnson Extension Educator-Agricultural Economics Cover photo by David Ostdiek 2 The Board of Regents
Regression Models for Saffron Yields in Iran
 Regression Models for Saffron ields in Iran Sanaeinejad, S.H., Hosseini, S.N 1 Faculty of Agriculture, Ferdowsi University of Mashhad, Iran sanaei_h@yahoo.co.uk, nasir_nbm@yahoo.com, Abstract: Saffron
POTATOES USA / SNAC-INTERNATIONAL OUT-OF-STORAGE CHIP QUALITY MICHIGAN REGIONAL REPORT
 POTATOES USA / SNAC-INTERNATIONAL OUT-OF-STORAGE CHIP QUALITY 2015-2016 MICHIGAN REGIONAL REPORT Chris Long and Aaron Yoder, Michigan State University Procedure: The 2015 Potatoes USA / SNAC-International
O4W1703APP780 WSET Diploma Online
 O4W1703APP780 WSET Diploma Online Examinations The examinations attached to your course are as follows: Unit 2 March 2017 (date to be confirmed) Unit 1 (Case Study) November 2017 (tbc) 10:30 11:45am registration
China Coffee Market Overview The Guidance For Selling Coffee In China Published November Pages PDF Format 420
 China Coffee Market Overview 2009 2010 The Guidance For Selling Coffee In China Published November 2009 102 Pages PDF Format 420 Order online at: http://www.drinksector.com/basket.asp?idreport=76&basketaction=auto
OF THE VARIOUS DECIDUOUS and
 (9) PLAXICO, JAMES S. 1955. PROBLEMS OF FACTOR-PRODUCT AGGRE- GATION IN COBB-DOUGLAS VALUE PRODUCTIVITY ANALYSIS. JOUR. FARM ECON. 37: 644-675, ILLUS. (10) SCHICKELE, RAINER. 1941. EFFECT OF TENURE SYSTEMS
For the purposes of this page, this distribution arrangement will be referred to as a wine boutique and wine includes wine coolers.
 Beer and Wine Tax Beer and wine taxes are included in the price you pay for: made by an Ontario manufacturer, microbrewer or brew pub that you buy from: Brewers Retail Inc. (i.e., The Beer Store) licensed
Statistics & Agric.Economics Deptt., Tocklai Experimental Station, Tea Research Association, Jorhat , Assam. ABSTRACT
 Two and a Bud 59(2):152-156, 2012 RESEARCH PAPER Global tea production and export trend with special reference to India Prasanna Kumar Bordoloi Statistics & Agric.Economics Deptt., Tocklai Experimental
For personal use only
 SEPTEMBER 216 GLOBAL DAIRY UPDATE European milk production has decreased for the first time since early 215, with volumes in June down 2 compared to last year. Last week we announced our annual results,
Economic Losses from Pollution Closure of Clam Harvesting Areas in Machias Bay
 Economic Losses from Pollution Closure of Clam Harvesting Areas in Machias Bay Kevin Athearn, Ph.D. University of Maine at Machias June 8, 2012 Tora Johnson (UMM) and Brian Beal (UMM) assisted with this
UPPER MIDWEST MARKETING AREA THE BUTTER MARKET AND BEYOND
 UPPER MIDWEST MARKETING AREA THE BUTTER MARKET 1987-2000 AND BEYOND STAFF PAPER 00-01 Prepared by: Henry H. Schaefer July 2000 Federal Milk Market Administrator s Office 4570 West 77th Street Suite 210
Grape Growers of Ontario Developing key measures to critically look at the grape and wine industry
 Grape Growers of Ontario Developing key measures to critically look at the grape and wine industry March 2012 Background and scope of the project Background The Grape Growers of Ontario GGO is looking
Quality of Canadian oilseed-type soybeans 2016
 ISSN 1705-9453 Quality of Canadian oilseed-type soybeans 2016 Véronique J. Barthet Program Manager, Oilseeds Section Contact: Véronique J. Barthet Program Manager, Oilseeds Section Tel : 204 984-5174 Email:
Fungicides for phoma control in winter oilseed rape
 October 2014 Fungicides for phoma control in winter oilseed rape Summary of HGCA fungicide project 2010 2014 (RD-2007-3457) While the Agriculture and Horticulture Development Board, operating through its
Gasoline Empirical Analysis: Competition Bureau March 2005
 Gasoline Empirical Analysis: Update of Four Elements of the January 2001 Conference Board study: "The Final Fifteen Feet of Hose: The Canadian Gasoline Industry in the Year 2000" Competition Bureau March
Russian Fishmeal Market 2015
 March 2016 Russian Fishmeal Market 2015 MacUser Report 111 Photo: www.kombikorm.org Russian Fisheries Research Group - Russian Seafood Market and Fisheries Research and Analytics - CONTENT Introduction.
Citrus Fruits 2014 Summary
 United States Department of Agriculture National Agricultural Statistics Service Citrus Fruits 2014 Summary September 2014 ISSN: 1948-9048 Contents Utilized Citrus Production United States: 2004-2014...
Coffee market continues downward trend
 Coffee market continues downward trend Since August 2017, the ICO composite indicator price has declined in each month except January 2018. The composite indicator decreased by 1.1% in March 2018 to an
Quality of Canadian oilseed-type soybeans 2017
 ISSN 2560-7545 Quality of Canadian oilseed-type soybeans 2017 Bert Siemens Oilseeds Section Contact: Véronique J. Barthet Program Manager, Oilseeds Section Grain Research Laboratory Tel : 204 984-5174
and the World Market for Wine The Central Valley is a Central Part of the Competitive World of Wine What is happening in the world of wine?
 The Central Valley Winegrape Industry and the World Market for Wine Daniel A. Sumner University it of California i Agricultural l Issues Center January 5, 211 The Central Valley is a Central Part of the
2007 Sonoma Research Associates - All rights reserved.
 2007 Sonoma Research Associates - All rights reserved. Practical Applications of the Price Elasticity of Demand Presented by Dan Karnowsky, President Sonoma Research Associates Presented at Competitive
2016 September Sulamita Christian School
 2016 September 29 30 31 01 02 03 04 Back To School Night (Ice Cream Social--$1.50 per ice cream)! 05 06 07 08 09 10 11 First Day of School!! N Cheese, Side Salad, Mac 12 13 14 15 16 17 18 Sandwich, 19
Napa County Planning Commission Board Agenda Letter
 Agenda Date: 7/1/2015 Agenda Placement: 10A Continued From: May 20, 2015 Napa County Planning Commission Board Agenda Letter TO: FROM: Napa County Planning Commission John McDowell for David Morrison -
Coffee market remains volatile but lacks direction
 Coffee market remains volatile but lacks direction Prices fluctuated significantly during August, with the ICO composite indicator dropping by 10 cents before jumping back up another 12 cents by the end
MARKET NEWSLETTER No 111 December 2016
 On 1 January 2017 the new International Agreement on Olive Oil and Table Olives, 2015, came into force, being the sixth International Agreement of the Organisation. This new Agreement will allow the IOC
Consumer Price Index
 KINGDOM OF Consumer Price Index Website: E-mail : Statistics Department P.O. Box 149 Nuku alofa Kingdom of Tonga www.spc.int/prism/tonga/ dept@stats.gov.to Mar, 2018 Price: $ 2.50 Fig 3: Contribution
Effect of Inocucor on strawberry plants growth and production
 Effect of Inocucor on strawberry plants growth and production Final report For Inocucor Technologies Inc. 20 Grove, Knowlton, Quebec, J0E 1V0 Jae Min Park, Dr. Soledad Saldías, Kristen Delaney and Dr.
Seasonal trends in hectares planted, sales volumes on markets and market prices. Pieter van Zyl, Potatoes South Africa
 Seasonal trends in hectares planted, sales volumes on markets and market prices Pieter van Zyl, Potatoes South Africa Producers plant between 5 and 54 hectares of potatoes each year. According to Figure
Dairy Market R E P O R T
 Volume 17 No. 5 Dairy Market R E P O R T May 2014 DMI NMPF Overview Many key milk and dairy product prices continued to set records in April. And while the dairy futures markets indicate that prices will
Citrus: World Markets and Trade
 United States Department of Agriculture Foreign Agricultural Service Citrus: World Markets and Trade Oranges Global orange production for 2012/13 is forecast to drop over 4 percent from the previous year
GLOBAL DAIRY UPDATE KEY DATES MARCH 2017
 MARCH 2017 GLOBAL DAIRY UPDATE European milk production decreased for the seventh consecutive month, while the US remains strong. The rate of decline in New Zealand production is easing. US exports continue
Gregory V. Jones, Ph.D. Division of Business, Communication, and the Environment Department of Environmental Science and Policy
 Vintage 2016 Rogue Valley Reference Vineyard Report Gregory V. Jones, Ph.D. Division of Business, Communication, and the Environment Department of Environmental Science and Policy 1 Summary: The 2016 vintage
POTENTIAL OF THE LAND IN ARCHAR VILLAGE FOR CREATION OF VINES FOR QUALITY WINE GRAPE VARIETIES. CLIMATIC AND GEOGRAPHIC SPECIALITY OF THE TERROIR
 POTENTIAL OF THE LAND IN ARCHAR VILLAGE FOR CREATION OF VINES FOR QUALITY WINE GRAPE VARIETIES. CLIMATIC AND GEOGRAPHIC SPECIALITY OF THE TERROIR Abstract Scientific Papers. Series A. Agronomy, Vol. LIX,
Vintage 2008: Umpqua Valley Reference Vineyard Report
 Vintage 2008: Umpqua Valley Reference Vineyard Report Summary: The cool climate conditions observed prior to and during the early part of the 2008 vintage resulted from a colder than normal North Pacific
RESTAURANT OUTLOOK SURVEY
 Reference Period: Fourth Quarter 2016 RESTAURANT OUTLOOK SURVEY Prepared by Chris Elliott, Senior Economist January 23, 2017 Q2-2011 Restaurant Outlook Survey Fourth Quarter 2016 1 Highlights The share
The Development of a Weather-based Crop Disaster Program
 The Development of a Weather-based Crop Disaster Program Eric Belasco Montana State University 2016 SCC-76 Conference Pensacola, FL March 19, 2016. Belasco March 2016 1 / 18 Motivation Recent efforts to
western Canadian pulse crops 2005
 ISSN 1712-8315 Quality of western Canadian pulse crops 2005 Ning Wang Program Manager, Pulse Research Contact: Ning Wang Program Manager, Pulse Research Tel: 204 983-2154 Email: nwang@grainscanada.gc.ca
Silage Corn Variety Trial in Central Arizona
 Silage Corn Variety Trial in Central Arizona Jay Subramani 1 and Shawna Loper 2 1 Maricopa Ag Center, University of Arizona 2 University of Arizona Cooperative Extension, Pinal County Abstract Information
Panel A: Treated firm matched to one control firm. t + 1 t + 2 t + 3 Total CFO Compensation 5.03% 0.84% 10.27% [0.384] [0.892] [0.
![Panel A: Treated firm matched to one control firm. t + 1 t + 2 t + 3 Total CFO Compensation 5.03% 0.84% 10.27% [0.384] [0.892] [0.](/thumbs/90/101398922.jpg "Panel A: Treated firm matched to one control firm. t + 1 t + 2 t + 3 Total CFO Compensation 5.03% 0.84% 10.27% [0.384] [0.892] [0.") Online Appendix 1 Table O1: Determinants of CMO Compensation: Selection based on both number of other firms in industry that have CMOs and number of other firms in industry with MBA educated executives
Online Appendix 1 Table O1: Determinants of CMO Compensation: Selection based on both number of other firms in industry that have CMOs and number of other firms in industry with MBA educated executives
Bt Corn IRM Compliance in Canada
 Bt Corn IRM Compliance in Canada Canadian Corn Pest Coalition Report Author: Greg Dunlop (BSc. Agr, MBA, CMRP), ifusion Research Ltd. 15 CONTENTS CONTENTS... 2 EXECUTIVE SUMMARY... 4 BT CORN MARKET OVERVIEW...
Quality of western Canadian peas 2017
 ISSN 1920-9053 Quality of western Canadian peas 2017 Ning Wang Program Manager, Pulse Research Grain Research Laboratory Canadian Grain Commission 1404-303 Main Street Winnipeg MB R3C 3G8 www.grainscanada.gc.ca
Vintage 2006: Umpqua Valley Reference Vineyard Report
 Vintage 2006: Umpqua Valley Reference Vineyard Report Summary: The 2006 vintage started off slow with a cool, wet spring and was followed by a largely climatically favorable growing season. The summer
COMPARISON OF CORE AND PEEL SAMPLING METHODS FOR DRY MATTER MEASUREMENT IN HASS AVOCADO FRUIT
 New Zealand Avocado Growers' Association Annual Research Report 2004. 4:36 46. COMPARISON OF CORE AND PEEL SAMPLING METHODS FOR DRY MATTER MEASUREMENT IN HASS AVOCADO FRUIT J. MANDEMAKER H. A. PAK T. A.
MARKET NEWSLETTER No 93 April 2015
 Focus on OLIVE OIL IMPORT TRENDS IN RUSSIA Russian imports of olive oil and olive pomace oil grew at a constant rate between 2/1 and 213/14 when they rose from 3 62 t to 34 814 t (Chart 1). The only exceptions
Current trends of agroclimatic indices applied to grapevine and olive tree in central Italy
 UNIVERSITY OF FLORENCE Department of Agronomy and Land Management Current trends of agroclimatic indices applied to grapevine and olive tree in central Italy Simone Orlandini, Valentina Di Stefano, Annalena
Current trends of agroclimatic indices applied to grapevine and olive tree in central Italy
 UNIVERSITY OF FLORENCE Department of Agronomy and Land Management Current trends of agroclimatic indices applied to grapevine and olive tree in central Italy Simone Orlandini, Valentina Di Stefano, Annalena
Business Statistics /82 Spring 2011 Booth School of Business The University of Chicago Final Exam
 Business Statistics 41000-81/82 Spring 2011 Booth School of Business The University of Chicago Final Exam Name You may use a calculator and two cheat sheets. You have 3 hours. I pledge my honor that I
Dairy Market R E P O R T
 Volume 18 No. 8 Dairy Market R E P O R T August 2015 DMI NMPF Overview Milk prices in many major milk-producing countries have plummeted to levels that are producing severe financial stress for their farmers.
Investment Wines. - Risk Analysis. Prepared by: Michael Shortell & Adiam Woldetensae Date: 06/09/2015
 Investment Wines - Risk Analysis Prepared by: Michael Shortell & Adiam Woldetensae Date: 06/09/2015 Purpose Look at investment wines & examine factors that affect wine prices over time We will identify
Effects of Preharvest Sprays of Maleic Hydrazide on Sugar Beets
 Effects of Preharvest Sprays of Maleic Hydrazide on Sugar Beets F. H. PETO 1 W. G. SMITH 2 AND F. R. LOW 3 A study of 20 years results from the Canadian Sugar Factories at Raymond, Alberta, (l) 4 shows
THIS REPORT CONTAINS ASSESSMENTS OF COMMODITY AND TRADE ISSUES MADE BY USDA STAFF AND NOT NECESSARILY STATEMENTS OF OFFICIAL U.S.
 THIS REPORT CONTAINS ASSESSMENTS OF COMMODITY AND TRADE ISSUES MADE BY USDA STAFF AND NOT NECESSARILY STATEMENTS OF OFFICIAL U.S. GOVERNMENT POLICY Required Report - public distribution Date: GAIN Report
MANGO PERFORMANCE BENCHMARK REPORT
 MANGO PERFORMANCE BENCHMARK REPORT 2015-2016 TABLE OF CONTENTS Page 3 Page 5 Page 12 Page 15 Page 27 Page 36 Page 46 Approach and Data Set Parameters Overview and Mango Trend-Spotting Fruit and Tropical
Online Appendix to The Effect of Liquidity on Governance
 Online Appendix to The Effect of Liquidity on Governance Table OA1: Conditional correlations of liquidity for the subsample of firms targeted by hedge funds This table reports Pearson and Spearman correlations
Climate change may alter human physical activity patterns
 In the format provided by the authors and unedited. SUPPLEMENTARY INFORMATION VOLUME: 1 ARTICLE NUMBER: 0097 Climate change may alter human physical activity patterns Nick Obradovich and James H. Fowler
Senior poverty in Canada, : A decomposition analysis of income and poverty rates
 Senior poverty in Canada, 1973-2006: A decomposition analysis of income and poverty rates Tammy Schirle Department of Economics Wilfrid Laurier University October 2010 Preliminary and Incomplete - Please
Re: LCBO Lightweight Glass Wine Standard Implementation Date
 June 21, 2012 To: All Trade Associations Re: LCBO Lightweight Glass Wine Standard Implementation Date Further to my letter dated June 1st, 2011, I am writing to remind industry representatives that the
Dairy Market. November 2017
 Dairy Market Dairy Management Inc. R E P O R T Volume 20 No. 10 November 2017 DMI NMPF Overview U.S. Cheddar cheese prices hit a 10-month high in October, while butter prices softened but remained well
Prince Edward Island s Merchandise Trade with the World
 Prince Edward Island s Merchandise Trade with the World Publication No. 2013-39-E 26 June 2013 Alexandre Gauthier Economics, Resources and International Affairs Division Parliamentary Information and Research
Coffee market ends 2017/18 in surplus
 Coffee market ends 217/18 in surplus World coffee production in coffee year 217/18 is estimated 5.7% higher at 164.81 million bags as output of Arabica increased by 2.2% to 11.82, and Robusta grew 11.7%
Quality of western Canadian lentils 2011
 ISSN 920-9037 Quality of western Canadian lentils 20 Ning Wang Program Manager, Pulse Research Contact: Ning Wang Program Manager, Pulse Research Tel : 204 983-254 Email: ning.wang@grainscanada.gc.ca Fax
QUARTERLY REVIEW OF THE PERFORMANCE OF THE DAIRY INDUSTRY 1
 QUARTERLY REVIEW OF THE PERFORMANCE OF THE DAIRY INDUSTRY 1 The information in this document is from sources deemed to be correct. Milk SA, the MPO and SAMPRO are not responsible for the results of any
Vivekanandan, K. and G. D. Bandara. Forest Department, Rajamalwatta Road, Battaramulla, Sri Lanka.
 Vivekanandan, K. and G. D. Bandara. Forest Department, Rajamalwatta Road, Battaramulla, Sri Lanka. LEUCAENA SPECIES RESISTANCE TO PSYLLID (H ETERO PSYLLA CUBANA CRAWFORD) IN SRI LANKA Introduction. Giant
Studies in the Postharvest Handling of California Avocados
 California Avocado Society 1993 Yearbook 77: 79-88 Studies in the Postharvest Handling of California Avocados Mary Lu Arpaia Department of Botany and Plant Sciences, University of California, Riverside
Coffee weather report November 10, 2017.
 Coffee weather report November 10, 2017. awhere, Inc., an agricultural intelligence company, is pleased to provide this map-and-chart heavy report focused on the current coffee crop in Brazil. Global stocks
MBA 503 Final Project Guidelines and Rubric
 MBA 503 Final Project Guidelines and Rubric Overview There are two summative assessments for this course. For your first assessment, you will be objectively assessed by your completion of a series of MyAccountingLab
Dietary Diversity in Urban and Rural China: An Endogenous Variety Approach
 Dietary Diversity in Urban and Rural China: An Endogenous Variety Approach Jing Liu September 6, 2011 Road Map What is endogenous variety? Why is it? A structural framework illustrating this idea An application
VINTAGE REPORT. Debbie Lauritz SENIOR WINEMAKER. Marty Gransden VITICULTURALIST MEDIA RELEASE: APRIL, 2016
 2016 VINTAGE REPORT Debbie Lauritz SENIOR WINEMAKER Marty Gransden VITICULTURALIST MEDIA RELEASE: APRIL, 2016 THE VINEYARD Good winter rainfall filled the dams and filled the soil moisture profile leading
Sugar scenario in CIS countries:
 Sugar scenario in CIS countries: on the way to self-sufficiency Andrey Bodin Eurasian Sugar Association Commonwealth of Independent States (CIS) consists of 11 countries CIS Moldova Belarus Population
The multivariate piecewise linear growth model for ZHeight and zbmi can be expressed as:
 Bi-directional relationships between body mass index and height from three to seven years of age: an analysis of children in the United Kingdom Millennium Cohort Study Supplementary material The multivariate
Acreage Forecast
 World (John Sandbakken and Larry Kleingartner) The sunflower is native to North America but commercialization of the plant took place in Russia. Sunflower oil is the preferred oil in most of Europe, Mexico
Dairy Market. April 2016
 Dairy Market Dairy Management Inc. R E P O R T Volume 19 No. 4 April 2016 DMI NMPF Overview Dairy market developments during the first part of April brought slight improvements in the outlook for milk