Corporate Presentation May 2017
|
|
|
- Benjamin Wilkerson
- 6 years ago
- Views:
Transcription

1 Corporate Presentation May 2017

2 I. Concha y Toro: At a Glance 2

3 Viña Concha y Toro Today Largest Chilean and Latin American Winery. Top 10 world s winery in volume commercialized. Unique business model within the wine industry. Production facilities in 3 countries: CL, US & AR. Distribution subsidiaries in 12 countries and 2 commercial offices. Global Presence in 147 countries. 3
 2006: $30.5 2016: $72 CAGR: 8.")
4 Viña Concha y Toro in Numbers Net Sales (million US$) 2006: $ : $977 CAGR: 9.1% Volume (million 9 liter cases, wine) 2006: : 36.2 CAGR: 5.3% EBITDA* (million US$) 2006: $ : $138 CAGR: 7.5% Net Income (million US$) 2006: $ : $72 CAGR: 8.9% * Gross Profit Distribution Costs Administration Costs + Other Income Other Expenses + Depreciation + Amortization 4

5 II. Global Wine Industry 5

6 Wine Industry: Top 10 wine producers Global Production remained flat since % decrease in 2016 Source: OIV 6
 10 42 34 25 1 20 24")
7 Wine Industry: Top 10 wine consumers Global Consumption Increasing 0.4% in 2016 USA, China, Russia leading the growth Consumption (Lts) Source: OIV 7
8 Wine Industry: Global Exports Global Export Value ( ) increased 111% in 16 years Global Export Volume increased 74% in 16 years CAGR: +4.8% CAGR: +3.5% Source: OIV 8

9 Wine Industry: Global Exports Top 6 exporters by value Top 6 exporters by volume +2.2% +3.9% +1.6% +5.3% +0.3% +3.6% +8.0% +1.2% 9.2% +5.6% +0.9% -0.3% Source: OIV 9

10 Wine Industry: Global Imports Top 6 importers by value Top 6 importers by volume +5.8% -0.4% +0.4% +0.8% +3.8% +1.4% +27.9% +4.8% +5.1% +3.9% +20.9% -4.5% Source: OIV 10
11 Wine Industry: Top 10 Wineries The top ten players reached 16% of commercialized volume worldwide. Ranking Company Volume Market Share E&J Gallo Winery Inc 3.39% 2 Constellation Brands Inc 1.84% 3 Wine Group Inc, The 1.84% 4 Viña Concha y Toro SA 1.45% 5 Castel Groupe 1.44% 6 Accolade Wines Ltd 1.44% 7 FeCoVitA Coop Ltda 1.29% 8 Grupo Peñaflor SA 1.23% 9 Treasury Wine Estates Ltd 1.17% 10 Pernod Ricard Groupe 0.98% Source: Euromonitor (2015) 11
12 III. Investment Attractiveness 12

13 Investment Attractiveness 1. Lead by an experienced controlling group 2. Successful track record through years 3. A business model which has supported the growth 4. Market diversification 5. Growth that improves profitability 6. Export Markets Leading the Growth 7. Leading Position 13
14 1. Lead by an experienced controlling group Current Controlling Group is part of CyT since the 50 s. Three families integrate the controlling group. Exclusive focus on wine Leading the growth and expansion through years. Passion for wines Experienced Management Management in the Company for more than 10 years in average. Listed in Santiago Stock Exchange and NYSE 14


15 2. Successful track record through years 1883 Foundation of Concha y Toro 1966 Launch of Casillero del Diablo 1994 First Winery to trade in NYSE 1997 Strategic Alliance: Almaviva Winery 2010 Partnership Manchester United 2013 World s Most Admired Wine Brand 1933 Listed in Santiago Stock Exchange 1993 Launch of Cono Sur Winery 1996 Launch of Trivento Winery in Argentina 2000 Brand Building Global Reach 2011 Acquisition of Fetzer Winery in California, US 2014 Center for Research and Innovation 15


16 VERTICAL INTEGRATION 3. A business model which has supported the growth a. Quality Strong Portfolio of Wines Multiorigin Brands Control of the production and supply chain b. Brand Building Strong Distribution Network Market Diversification Strong Global Brand Recognition c. Global Presence VERTICAL INTEGRATION 16


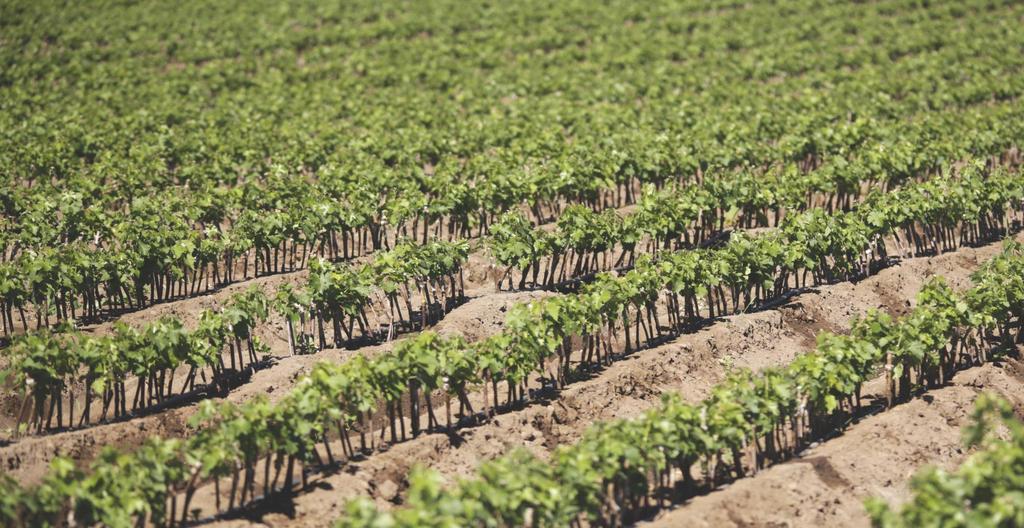
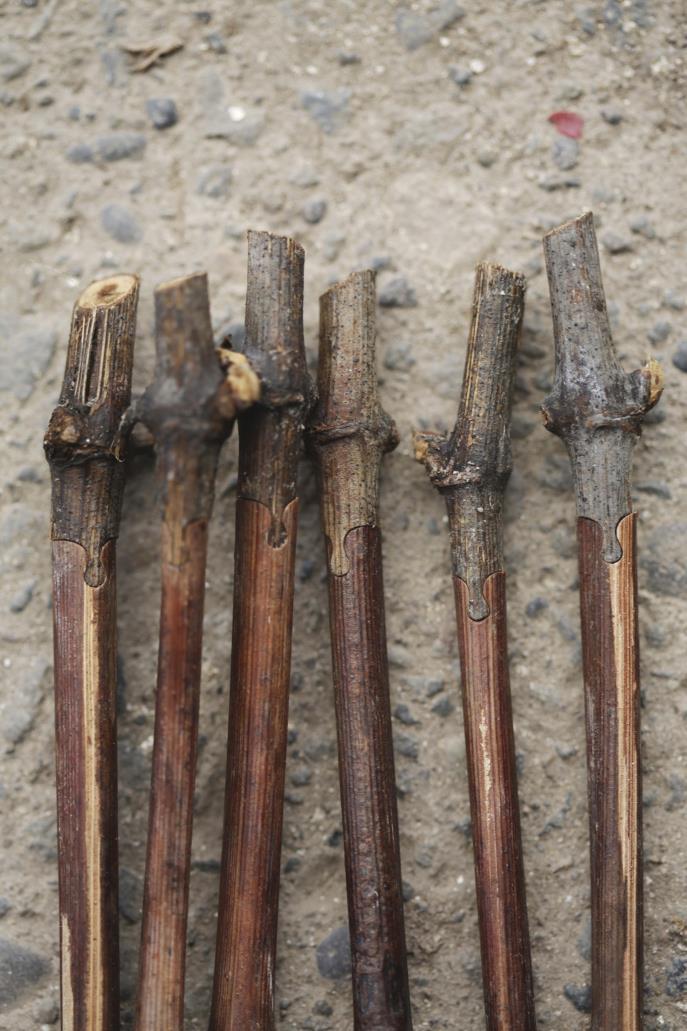
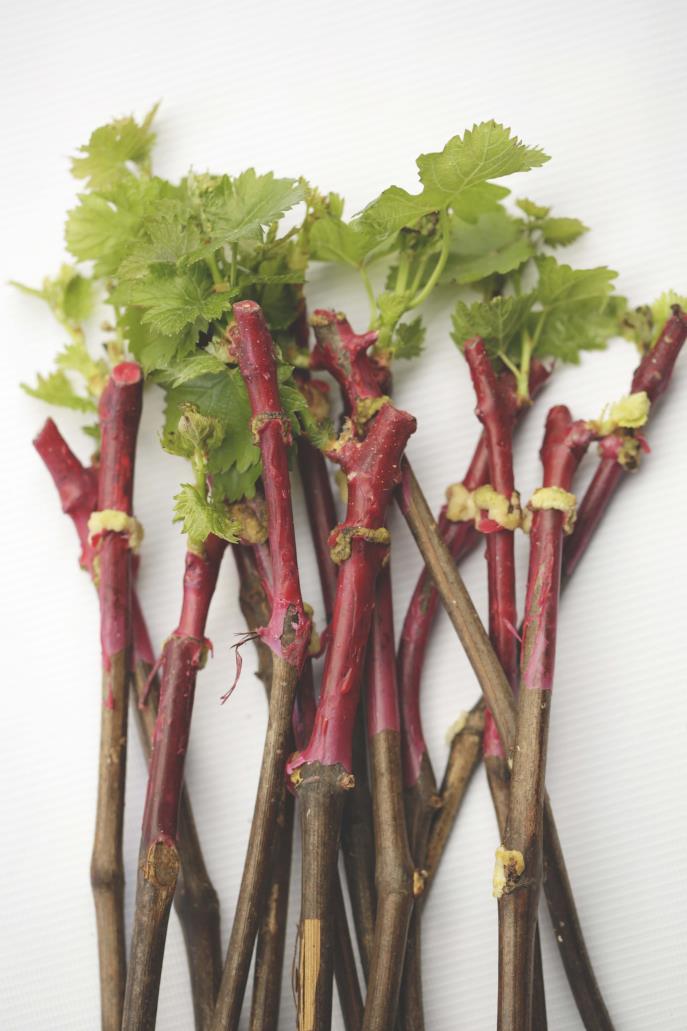
17 a. The importance of Quality Assurance and Consistency CHILE 9 valleys 54 vineyards 9,388 HECTARES ARGENTINA 3 valleys 9 vineyards 1,140 HECTARES CALIFORNIA 3 valleys 14 vineyards 469 HECTARES 17
18 Hectares Planted (Total includes leases)...leading Company in hectares planted Source: Information available in Companies Fact Sheet, Web Site Information, Annual Reports, SEC Fillings (20-F & 10-K) 18
 (*) Inorganic Growth: Fetzer (216.0) + Kross (2.")
19 Investments supporting the growth Sustained Investment Over Time (US$ million) Capex Disclosure ( ) (*) Inorganic Growth: Fetzer (216.0) + Kross (2.7) 19
 20")
20 Investments supporting the growth Hectares Planted Wine Storage & Ageing Capacity (million liters) 20


21 b. Brand Building built on a strong portfolio Multi-origin Brands The America s Wine Portfolio Chile Argentina USA 21
 #1 sales Cabernet Sauvignon (UK) Casillero del")
 Volume (million cases) 2003 2016 CAGR Viña Concha y Toro 15.9 36.")
22 development of brands & history SUCCESSFUL POSITIONING OF A GLOBAL BRAND IN THE PREMIUM CATEGORY Main market, Top 10 in sales (UK) #1 sales Cabernet Sauvignon (UK) Casillero del Diablo Reserva. Preferred Wine (China) Volume (million cases) CAGR Viña Concha y Toro % Casillero del Diablo % % over total Volume 6.3% 15.0% 22

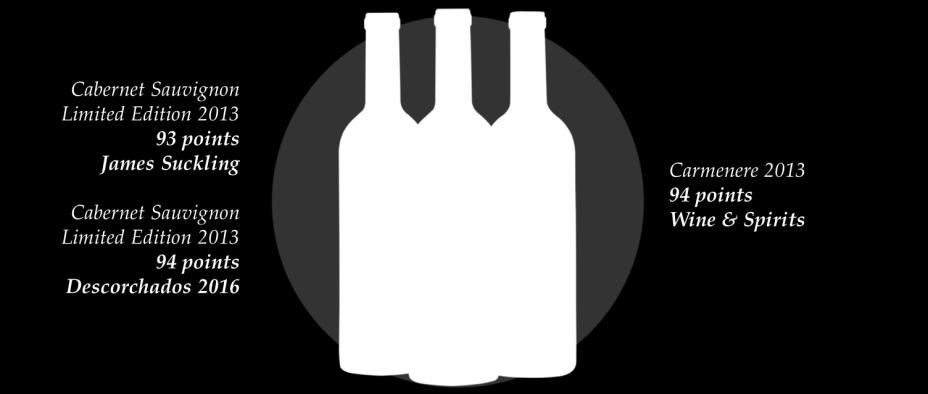
23 development of brands & history Don Melchor pts Don Melchor 2013 Don Melchor pts Don Melchor pts 23
24 Independent strong brands with the endorsement of Concha ytoro VARIETALS USD 5 6 / USD / 5-6 PREMIUM USD 10 / USD 13 7 / 9 SUPER PREMIUM USD / USD / 14 ULTRA PREMIUM USD / USD / 29 ICON USD 65 / USD 95 / USD / 68 / 97 % of sales by value 51% 49% 24
 International Best Drinks Company of the Year 2015 (The Drinks")
25 a recognized winery obtaining global awards #2 Most Admired Wine Brands 2017 (Drinks International, 2017) World s Most Powerful Wine Brand (Intangible Business, 2014 & 2015) International Best Drinks Company of the Year 2015 (The Drinks Business). 25


26 Volume Th. cases % % % 83,602 1,983 15,


27 2.3 strategic partnerships Viña Maipo official sponsor of the ATP World Tour de Tokio. Strategic partnership Casillero del Diablo with Manchester United. Cono Sur Bicicleta is the official wine of Le Tour de France. Concha y Toro Official wine sponsor of Dallas Cowboys Trivento official sponsor or the Premiership Rugby. 27


28 fine wines recognition JAMES SUCKLING DELIVERS THE HIGHEST SCORES TO VIÑA CONCHA Y TORO FINE WINES HISTORIC HIGHEST SCORE OF DON MELCHOR 28


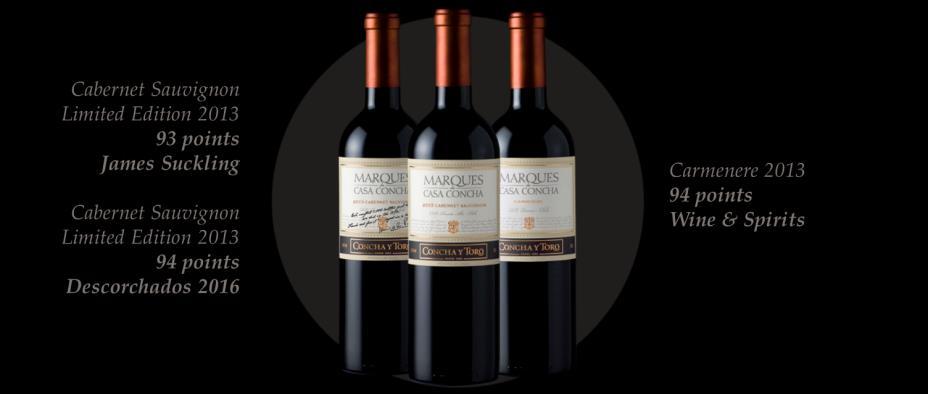
29 the highest accolades for our Portfolio 29


30 c. Global Presence getting closer to markets North America 17.2% Europe 34.4% Asia 9.8% Africa 2.0% Latin America 14.8% Chile 21.8% +140 COUNTRIES 2 COMMERCIAL OFFICES 12 DISTRIBUTION SUBSIDIARIES 30

31 sales that build brand equity Distribution Subsidiaries: Driving the growth 67% of CyT s sales carried out by direct distribution 33% of CyT s sales carried out by third parties distributors 12 distribution subsidiaries UK started operations on 2001 Sales 2001: cases Sales 2016: 6.8 million cases VCT Brazil: leader in wine category 2 commercial offices Since 2012 in South Africa Since 2013 in China Sales growth +136% ( ) 31


32 4. Market diversification Chilean Destination of Bottled Exports Concha y Toro s Currencies and Markets Currency Mix CLP 19,7% 18,9% USD 36,2% 34,7% GBP 17,7% 20,3% EUR 10,2% 10,2% CAD 3,4% 3,2% ARG 1,1% 1,1% SEK 2,7% 2,7% NOK 0,9% 0,8% BRL 5,4% 5,7% MXN 2,5% 2,5% Export Markets include exports to third parties and distribution subsidiaries US and ARG exports excludes shipments to the company s distribution subsidiaries 32
33 leading the chilean export categories The Chilean Bottled Export Industry Concha y Toro Leading Position Rank 2016 Country Share over chilean bottled exports (volume) Chilean exports growth 2016/2015 % Part of CyT in Chilean bottled exports Rank CyT over Chilean Exports 1 USA 11,8% -6,9% 42,4% 1 2 United Kingdom 11,8% 0,7% 48,9% 1 3 China 11,7% 13,8% 11,7% 1 4 Japan 10,6% -2,2% 26,8% 1 5 Brazil 8,9% 14,5% 26,1% 1 6 Netherland 7,0% 18,2% 24,5% 1 7 Canada 4,5% 5,9% 37,2% 1 8 Denmark 4,1% 11,4% 15,9% 1 9 Ireland 3,1% 10,7% 26,8% 2 10 Mexico 2,8% 5,5% 57,5% 1 11 Russia 1,9% 10,3% 20,8% 1 12 Germany 1,8% -17,3% 23,4% 1 13 South Korean 1,8% 1,8% 20,1% 1 14 Colombia 1,7% 25,4% 28,7% 1 15 Belgium 1,5% -16,1% 39,2% 1 33

")
34 Export Volume (thousand cases, wine) 5. Growth that improves profitability Domestic Volume (thousand cases, wine) CAGR: 1.1% Premium Wines Export Volume (thousand cases, wine) Premium Wines Domestic Volume (thousand cases, wine) 34
35 6. Export Markets Leading the Growth Export Sales (million Ch$, Wine) Average Export Price (US$ / 9 liter Case, Wine) Average Export Price (Th. Ch$ / 9 liter Case, Wine) 35

36 Concha y Toro s Exports over Chilean Bottled Wine* Volume Value % 25.8% % 27.2% % 28.3% % 30.2% % 31.4% % 32.3% % 31.5% % 29.7% % 31.3% 2013** 33.9% 30.5% 2014** 32.2% 29.7% 2015** 33.3% 29.7% 2016** 34.0% 30.2% Concha y Toro Santa Rita San Pedro Santa Carolina Others Source: Nielsen 7. Leading Position Concha y Toro s Market Share Domestic Market (Volume) Source: Vinos de Chile (*) Includes bottled & Bag in Box Volume Pro-forma (including wine bottled in UK): 36.9% (as of Dic. 2016) (**) Does not include the wine Bottled by CyT in UK 36

37 IV. Financial Position 37
 Net Sales (billion Ch.$) 2006: $215.8 2016: $658.4 CAGR: +11.")
38 Recovering volume Growth Consolidated Sales (million 9 liter cases, wine) Net Sales (billion Ch.$) 2006: $ : $658.4 CAGR: +11.8% 38
 Includes the extraordinary")

39 Consolidated EBITDA (million Ch$) , a perfect storm (*) Includes the extraordinary effect of the insurance s payments regarding the earthquake of 2010 Consolidated Mg. EBITDA (% over sales) 39
")
40 remaining profitable through years Consolidated Net Profit (million Ch$) (*) Includes the extraordinary effect of the insurance s payments regarding the earthquake of 2010 (Ch$ 19,555 million before taxes) 40
 2,5 (**) Liabilities: Current Liabilities + Non Current Liabilities Financial Debt: Other current financial liabilities + Other non current financial liabilities - Derivatives Net Financial")
41 Net Financial Debt / EBITDA (1) Strong Capital Structure Net Financial Debt / Equity EBITDA (1) / Financial Expenses (1) 1.2 (*) 2,5 (**) Liabilities: Current Liabilities + Non Current Liabilities Financial Debt: Other current financial liabilities + Other non current financial liabilities - Derivatives Net Financial Debt: Other current financial liabilities + Other non current financial liabilities - Derivatives Cash and cash equivalents (1) Last 12 months Financial expenses excludes financial income (*) As convenant, the issuer should have a Leverage not higher that 1.4 times. Leverage: Liabilities / Equity. (**) As convenant, the issuer should have a EBITDA/Financial expenses ratio at least 2.5 times. Source: Superintendencia de Valores y Seguros (SVS) 41
42 Financial Debt Financial Debt* Dic-16 Dic-15 as of: Ch$ MM Av. Interest rate Ch$ MM Av. Interest rate USD ,71% ,93% EUR GBP CLP ,12% ,17% UF ,40% ,98% ARS ,39% ,87% BRL ,80% ,92% MXN ,01% ,31% SEK Total ,69% ,13% * Does not include interest accrued. * Bonds nominated in UF with swap, are showed in final currency 42

43 Financial Debt Financial Debt by Currency As of December 31,

44 Financial Debt Expected Maturity Date (1), as of December 31, 2016 (Billion Ch$) Source: The Company (1) Considers current and non current financial liabilities excluding derivatives. EBITDA, Last 12 Months. As of Dec. 31, 2016, Concha y Toro had a Cash balance of Ch$47.2 billion. 44

45 We have the brands. We have the portfolio. We have the distribution. We have the land. We have the investments. We have the expertise. We are ready to keep growing 45

46 V. Exhibits 46
 3 1. Alfonso Larraín Santa María (Chairman) 2. Rafael Guilisasti Gana 3.")

47 Board of Directors Viña Concha y Toro Shareholder Structure (December 31, 2016) 3 1. Alfonso Larraín Santa María (Chairman) 2. Rafael Guilisasti Gana 3. Rafael Marín Jordán 4. Mariano Fontecilla de Santiago Concha Andrés Larraín Santa María 6. Pablo Guilisasti Gana 7. Jorge Desormeaux Jiménez 5 47
48 Total Sales(*) (in Ch$ million) Chile Domestic Market - wine Export markets(¹) Argentina Domestic Argentina Exports(²) U.S.A. Domestic U.S.A. Exports(²) Total Wine Operating Segment Chile Domestic Market - new business Other Revenues Total Other Operating Segment Consolidated Sales Total Volume(*) (thousand liters) Chile Domestic Market - wine Export markets(¹) Argentina Domestic Argentina Exports(²) U.S.A. Domestic U.S.A. Exports(²) Total Wine Operating Segment Chile Domestic Market - New Business Total Other Operating Segment Consolidated Volume Bottled Sales 4Q2016 & 12M2016 4Q16 4Q15 Change (%) 12M M 2015 Change (%) 18,905 17, % 71,265 65, % 120, , % 432, , % 2,435 2, % 7,562 6, % 4,099 4, % 20,057 18, % 19,043 18, % 62,127 58, % 1,573 1, % 5,832 5, % 166, , % 599, , % 13,692 14, % 51,030 47, % 2,534 1, % 7,622 7, % 16,227 16, % 58,652 55, % 183, , % 658, , % 5.9% 67,959 64,145 4Q16 4Q15 Change (%) 12M M 2015 Change (%) 17,970 16, % 70,680 65, % 62,124 62, % 219, , % 2,101 1, % 7,223 5, % 2,009 2, % 10,065 9, % 5,150 5, % 16,951 17, % % 1,925 1, % 89,890 88, % 325, , % 6,195 7, % 25,065 23, % 6,195 7, % 25,065 23, % 96,085 95, % 351,015 39, ,811 18, % 106.2% Average Price (per liter) Currency Chile Domestic Market - wine Ch$ 1, , % 1, % Export Markets US$ % % Argentina Domestic US$ % % Argentina Exports US$ % % U.S.A. Domestic US$ % % U.S.A. Exports US$ % % (1) Export Volumes include exports to third parties and sales volumes of the company's distribution subsidiaries (UK, Nordics, Brazil, Singapore, Mexico). (2) This figure excludes shipments to the company s distribution subsidiaries. (*) This figure includes bulk wine sales. 48
 Chilean Harvest through years")
49 Historical Harvest Volume (million liters) Chilean Harvest through years 49
50 Cabernet Sauvignon Bulk Wine (Maule Valley) 50
51 Corporate Presentation May 2017
Corporate Presentation July 2016
 Corporate Presentation July 2016 I. Concha y Toro: At a Glance 2 Viña Concha y Toro Today Largest Chilean and Latin American Winery. Top 10 world s winery in volume commercialized. Unique business model
Corporate Presentation
 Corporate Presentation January 2014 1 1 / 1 million liters Wine Industry: Top 10 wine producers Global Production Decreasing 0.9% per year. 5.6% decrease in 2012. 7,000 6,000 CAGR: -2.7% CAGR: -2.1% 5,000
HISTORY CHILE S LEADING WINE PRODUCER. Public company since Main ownership in two families with a long-term vision and passion for wine.
 C O R P O R AT E P R E S E N TAT I O N 2 0 1 8 HISTORY CHILE S LEADING WINE PRODUCER Public company since 1933. Main ownership in two families with a long-term vision and passion for wine. FOUNDED IN PIRQUE
C O R P O R AT E S T R AT E G Y U P D AT E. October, 2018
 C O R P O R AT E S T R AT E G Y U P D AT E October, 2018 FORWARD LOOKING STATEMENTS This presentation contains forward-looking statements, that should be considered as good faith estimates. Such statements
Viña Concha y Toro Investor Presentation Chile Conference Deutsche Bank
 Viña Concha y Toro Investor Presentation Chile Conference Deutsche Bank May, 2011 1 1 / 1 Concha y Toro Performance 2003 (*) 2010 CAGR Sales (Ch$ million) $ 190,303 $ 374,019 10% Exports ** (Ch$ million)
Investor Presentation Andean Conference Bank of America Merrill Lynch
 VIÑA Investor Presentation Andean Conference Bank of America Merrill Lynch July, 2011 1 1 / 1 Second place among the most powerful wine brands in the world. ( The Power 100, Intangible Business, May 2011)
CORPORATE PRESENTATION 2016
 CORPORATE PRESENTATION 2016 HISTORY 1883 Viña Concha y Toro founded in Pirque CHILE S LEADING WINE PRODUCER 133 Years of history Public company since 1933. Main ownership in two families with a long-term
PRESS KIT 2017 Recognized wine portfolio
 PRESS KIT 2017 Recognized wine portfolio Viña Concha y Toro's portfolio demonstrates its vocation for excellence and quality, producing superior-level wines that are recognized and have received important
# 1 in exports of Chilean wine (exports 33.3% of bottled total).
.") PRESS KIT 2018 VIÑA CONCHA Y TORO REINFORCES ITS PREMIUM WINE CATEGORY With a strategy that responds to the new challenges of a dynamic and competitive environment, aimed at sustaining its growth in value
PRESS KIT 2018 VIÑA CONCHA Y TORO REINFORCES ITS PREMIUM WINE CATEGORY With a strategy that responds to the new challenges of a dynamic and competitive environment, aimed at sustaining its growth in value
CONCHA Y TORO: A world class wine industry player. 135 Destination countries Hectares in Chile & Argentina +14.3% Sales US $735 million
 Press kit Viña Concha y Toro / June 2011 CONCHA Y TORO: A world class wine industry player Concha y Toro is today the symbol of Chilean wine in the world and occupies an outstanding position among the
$ BUY STARBUCKS CORPORATION (SBUX) Rena Kaufman. Valuation Methodology. Market Data. Financial Summary (7/1/2018) Profile. Financial Analysis
 Rena Kaufman. Valuation Methodology. Market Data. Financial Summary (7/1/2018) Profile. Financial Analysis") STARBUCKS CORPORATION (SBUX) Market Data Market Cap (intraday): $69,991M Enterprise Value (Aug 9, 2018): $74,898M Enterprise Value/EBITDA (ttm): 14.97x Rena Kaufman $51.88 - BUY Valuation Methodology Method
STARBUCKS CORPORATION (SBUX) Market Data Market Cap (intraday): $69,991M Enterprise Value (Aug 9, 2018): $74,898M Enterprise Value/EBITDA (ttm): 14.97x Rena Kaufman $51.88 - BUY Valuation Methodology Method
Global Alcoholic Drinks Consumption. Prepared by: Sally Easton DipWSET, MW for WSET Alumni
 Global Alcoholic Drinks Consumption Prepared by: Sally Easton DipWSET, MW for WSET Alumni The alcoholic drinks market is undeniably a valuable one. Euromonitor data shows that in 2015 it was valued at
John Culver. group president, Global Retail
 John Culver group president, Global Retail Starbucks has delivered strong growth globally GLOBAL RETAIL CONSOLIDATED REVENUE USD BILLIONS OPERATING INCOME USD BILLIONS CAGR 12% CAGR 17% $13.0 $18.5 $2.8
... AND IT OWNS AN 8.8% 8% STAKE IN GRUPO FINANCIERO BANORTE, WHICH HAS A MARKET VALUE OF AROUND US$750 MILLION
 NOVEMBER 2010 I. COMPANY OVERVIEW GRUMA IS THE WORLD S LARGEST CORN FLOUR AND TORTILLA PRODUCER, WITH OPERATIONS IN THE UNITED STATES, MEXICO, VENEZUELA, CENTRAL AMERICA, EUROPE, ASIA, AND OCEANIA... RGB
05 concha y toro holding Letter from the Chairman Financial Overview Results 2014 Board of Directors Structure and Management Sustainability
 05 concha y toro holding Letter from the Chairman Financial Overview Results 2014 Board of Directors Structure and Management Sustainability 23 center for research and innovation 31 our wineries Viña Concha
Draft version :: do not distribute. April 2015
 Draft version :: do not distribute April 2015 Disclaimer Statements made in this presentation related to VSPT s future performance or financial results are forward-looking statements within the meaning
WORLD WINE SUPPLY OUTLOOK MARCH 5, 2017 THE VINEGAR INSTITUTE 2017 ANNUAL MEETING
 WORLD WINE SUPPLY OUTLOOK MARCH 5, 2017 THE VINEGAR INSTITUTE 2017 ANNUAL MEETING DEDICATED BROKERS IN 8 COUNTRIES GLOBALLY BASED TO BUILD YOUR BUSINESS WORLDWIDE INTRODUCTION - CIATTI COMPANY - BROKER
Viña Concha y Toro. Our Wineries. Information On The Company. Consolidated Financial Statements. Letter from the Chairman 4. Financial Overview 6
 Viña Concha y Toro Letter from the Chairman 4 Financial Overview 6 Results 2016 7 Our Company 12 Board of Directors 14 Structure and Administration 15 Differentiating Pillars 17 Our Wineries Concha y Toro
PHILIPPINES. 1. Market Trends: Import Items Change in % Major Sources in %
 PHILIPPINES A. MARKET OF FRESH FRUITS & VEGETABLES 1. Market Trends: Import Items 2003 2007 Change in % Major Sources in % Value Quantity Value Quantity Value Quantity USD '000 Tons USD '000 Tons Grapes
2018 World Vitiviniculture Situation. OIV Statistical Report on World Vitiviniculture
 2018 World Vitiviniculture Situation OIV Statistical Report on World Vitiviniculture Introduction This report has been prepared by the Statistics department of the International Organisation of Vine and
INVESTOR PRESENTATION. Post FY2017 Volume Announcement
 v INVESTOR PRESENTATION Post FY2017 Volume Announcement FORWARD-LOOKING STATEMENTS This presentation may contain certain forward-looking statements concerning our future performance and should be considered
Draft version :: do not distribute. May 2015
 Draft version :: do not distribute May 2015 Disclaimer Statements made in this presentation related to VSPT s future performance or financial results are forward-looking statements within the meaning of
I. COMPANY I. OVERVIEW
 I. COMPANY I. OVERVIEW GRUMA IS THE WORLD S LARGEST CORN FLOUR AND TORTILLA PRODUCER, WITH OPERATIONS IN THE UNITED STATES, MEXICO, CENTRAL AMERICA, EUROPE, ASIA AND OCEANIA S U B S I D I AR I E S P R
Preliminary unaudited financial results for the full year ended 30 June Amount for this reporting period
 Marlborough Wine Estates Group Limited Results for Announcement to the Market Preliminary unaudited financial results for the full year ended 30 June 2017 Reporting Period 1st July to 30th June 2017 Previous
State of the Vitiviniculture World Market
 Punta del Este, November 19th, 2018 State of the Vitiviniculture World Market Jean-Marie Aurand Director General Topics Potential of viticultural production Production of grapes Production of wine Consumption
C a s a Vi n i c o l a Botter. C o m p a n y P r o f i l e
 C a s a Vi n i c o l a Botter C o m p a n y P r o f i l e A N e v e r E n d i n g S t o r y F a m i l y T r a d i t i o n a n d a N e w G e n e r a t i o n Almost a c e n t u r y of h i s t o r y 1928
Yum! Brands Drive Profitable International Expansion. Graham Allan YRI President
 Yum! Brands Drive Profitable International Expansion Graham Allan YRI President Yum! International Division Agenda... 2006 Results/2007 Outlook Building Our Global Brands Future Growth Another Strong Year
Peet's Coffee & Tea, Inc. Reports 62% Increase in Second Quarter 2008 Diluted Earnings Per Share
 Peet's Coffee & Tea, Inc. Reports 62% Increase in Second Quarter 2008 Diluted Earnings Per Share EMERYVILLE, Calif., July 31, 2008 /PRNewswire-FirstCall via COMTEX News Network/ -- Peet's Coffee & Tea,
International Beverage. Frank van Oers
 International Beverage Frank van Oers Long-term Growth Will Come from Single-Serve and Instants FY08 $3.2 Billion 6% 7% 8% 11% 18% 12% 38% 4% 24% 12% 3% 56% 1% 2 Multi-Serve (ex. Brazil) Single-Serve Instants
STATE OF THE VITIVINICULTURE WORLD MARKET
 STATE OF THE VITIVINICULTURE WORLD MARKET April 2018 1 Table of contents 1. VITICULTURAL PRODUCTION POTENTIAL 3 2. WINE PRODUCTION 5 3. WINE CONSUMPTION 7 4. INTERNATIONAL TRADE 9 Abbreviations: kha: thousands
The global wine market
 South Africa in the Global Wine Market: Tell me about it! VinPro Information Day, January 2014 The global wine market A macro context 1 Global inventories achieving balance Production, consumption and
2012 CORPORATE PRESENTATION
 2012 CORPORATE PRESENTATION Forward-Looking Statements Statements made in this presentation that could relate to Andina s future performance or financial results are forward-looking statements and are
EMBARGO TO ON FRIDAY 16 SEPTEMBER. Scotch Whisky Association. Exports of Scotch Whisky; Year to end of June 2016 (2016 H1)
") EMBARGO TO 00.01 ON FRIDAY 16 SEPTEMBER Scotch Whisky Association Exports of Scotch Whisky; Year to end of June 2016 (2016 H1) VOLUME UP 3.1% to 531 MILLION bottles VALUE DOWN SLIGHTLY BY 1.0% TO 1.70
EMBARGO TO 00.01 ON FRIDAY 16 SEPTEMBER Scotch Whisky Association Exports of Scotch Whisky; Year to end of June 2016 (2016 H1) VOLUME UP 3.1% to 531 MILLION bottles VALUE DOWN SLIGHTLY BY 1.0% TO 1.70
Global Rum Market Insights, Forecast to 2025
 Report Information More information from: https://www.wiseguyreports.com/reports/3652945-global-rum-market-insights-forecast-to-2025 Global Rum Market Insights, Forecast to 2025 Report / Search Code: WGR3652945
Financial Results for Fiscal Year Ending December 31, February 12, 2016 Suntory Beverage & Food Limited
 2016 SUNTORY 2013 BEVERAGE SUNTORY BEVERAGE & FOOD & LIMITED. Limited. All Rights All Reserved Rights Reserved. Financial for Fiscal Year Ending December 31, 2015 February 12, 2016 Suntory Beverage & Food
STATE OF THE VITIVINICULTURE WORLD MARKET
 STATE OF THE VITIVINICULTURE WORLD MARKET April 2015 1 Table of contents 1. 2014 VITIVINICULTURAL PRODUCTION POTENTIAL 3 2. WINE PRODUCTION 5 3. WINE CONSUMPTION 7 4. INTERNATIONAL TRADE 9 Abbreviations:
World vitiviniculture situation
 World vitiviniculture situation Surface area Grape Wine Global grape production Production Consumption Trade 2016 FAO-OIV Focus: Table and Dried Grapes 2 Global area under vines Area under vines in the
World Cocoa Conference Nov 2012
 World Cocoa Conference 19-23 Nov 2012 Situation and prospects for cocoa supply & demand Laurent Pipitone Director of Economics & Statistics Division 1 Improving market information and transparency One
3 rd Quarter & 9 Months 2014 Financial Results 10 November 2014
 3 rd Quarter & 9 Months 2014 Financial Results 10 November 2014 Disclaimer The presentation is prepared by Super Group Ltd ( Super or the Group ) and is solely for the purpose of corporate communication
Value increase in the alcohol market
 Value increase in the alcohol market Warsaw, June 2018 Get to know AMBRA AMBRA Group is a leading manufacturer, importer and distributor of wines and other alcohol beverages in the Central-Eastern Europe.
World vitiviniculture situation
 World vitiviniculture situation Surface area Grape Wine Global grape production Table and dried grapes Production Consumption Trade 2017 OIV Focus: Vine varietal distribution in the world 2 Global area
Becle, S.A.B. de C.V. Santander s Consumer Day Corporate Presentation
 Becle, S.A.B. de C.V. Santander s Consumer Day Corporate Presentation Nov, 20 2018 Disclaimer This presentation has been prepared by Becle, S.A.B. de C.V. ( Becle, Cuervo or the Company ) for informational
Financial Results for Fiscal Year Ending December 31, February 13, 2017 Suntory Beverage & Food Limited
 2017 SUNTORY 2013 BEVERAGE SUNTORY BEVERAGE & FOOD & LIMITED. Limited. All Rights All Reserved Rights Reserved. Financial Results for Fiscal Year Ending December 31, 2016 February 13, 2017 Suntory Beverage
Autumn Press Conference October 19, Name of chairman
 Autumn Press Conference October 19, 2006 Disclaimer This presentation contains forward looking statements which reflect Management s current views and estimates. The forward looking statements involve
2016 was Telepizza Group s best year for chain sales 1 and EBITDA growth over the last decade
 Telepizza Full-Year Results for 2016 2016 was Telepizza Group s best year for chain sales 1 and EBITDA growth over the last decade Chain sales 1 grew by 7% to 517M while Underlying EBITDA rose by 10% to
Private Equity Investments
 Overview for Private Equity Investments Strategic capital and expertise for the wine industry Prepared: September 2011 Copyright 2010 Bacchus Capital Management In classical mythology, Bacchus is the god
Financial Results for H1 Fiscal Year Ending December 31, August 6, 2015 Suntory Beverage & Food Limited
 Financial Results for H1 Fiscal Year Ending December 31, 2015 August 6, 2015 Suntory Beverage & Food Limited 2015 SUNTORY 2013 BEVERAGE SUNTORY BEVERAGE & FOOD & LIMITED. Limited. All Rights All Reserved
Global Beer. Industry Profile. Reference Code: Publication date: December 2006
 Global Beer Industry Profile Reference Code: 0199-0744 Publication date: December 2006 www.datamonitor.com Datamonitor USA 245 Fifth Avenue 4th Floor New York, NY 10016 USA Datamonitor Europe Charles House
THIS REPORT CONTAINS ASSESSMENTS OF COMMODITY AND TRADE ISSUES MADE BY USDA STAFF AND NOT NECESSARILY STATEMENTS OF OFFICIAL U.S.
 THIS REPORT CONTAINS ASSESSMENTS OF COMMODITY AND TRADE ISSUES MADE BY USDA STAFF AND NOT NECESSARILY STATEMENTS OF OFFICIAL U.S. GOVERNMENT POLICY Required Report - public distribution Date: GAIN Report
The. Strauss Group. Company Presentation April 2015
 The Strauss Group Company Presentation April 2015 Strauss Group - Overview A food and beverage company active in More than 20 countries with a strong home base Israel s second-largest food group The world
Pizza Pizza Royalty Corp. ANNUAL GENERAL MEETING May 29, 2013
 Pizza Pizza Royalty Corp. ANNUAL GENERAL MEETING May 29, 2013 1 Elizabeth Wright, Board Chair 2 Forward-Looking Statement This presentation will contain forward-looking statements. Investors should be
Brazil Milk Cow Numbers and Milk Production per Cow,
 TABLE OF CONTENTS 1. Brazil 1.1. Brazil Milk Market Introduction 1.1.1. Brazil Cow Milk Market Production and Fluid Milk Consumption by Volume, 1.1.2. Brazil Milk Cow Numbers and Milk Production per Cow,
China s Export of Key Products of Pharmaceutical Raw Materials
 China s Export of Key Products of Pharmaceutical Raw Materials During the period of the 62nd API China& INTERPHEX CHINA, China Pharmaceutical Industry Association released its annual Report on Analysis
More information from: https://www.wiseguyreports.com/reports/ global-online-food-delivery-and-takeaway-marketanalysis-by-order-type
 Report Information More information from: https://www.wiseguyreports.com/reports/1079744-global-online-food-delivery-and-takeaway-marketanalysis-by-order-type Global Online Food Delivery and Takeaway Market
DECEMBER 2015 HALF YEAR RESULTS BRANDED SALES DRIVES PROFIT UP BY 80% 24 th February 2016
 DECEMBER 2015 HALF YEAR RESULTS BRANDED SALES DRIVES PROFIT UP BY 80% 24 th February 2016 Disclaimer The information in this presentation is general advice, given in good faith and derived from sources
OIV Revised Proposal for the Harmonized System 2017 Edition
 OIV Revised Proposal for the Harmonized System 2017 Edition TABLE OF CONTENTS 1. Preamble... 3 2. Proposal to amend subheading 2204.29 of the Harmonized System (HS)... 4 3. Bag-in-box containers: a growing
Sales for 9 months to 31 March 2008: 5,091 million
 Sales for 9 months to 31 March 2008: 5,091 million Highly dynamic sales (+9.3% nine month cumulative organic growth) Continuing strong growth in the 3 rd quarter: (+7.1% organic growth) Confirmed profit
ICC September 2018 Original: English. Emerging coffee markets: South and East Asia
 ICC 122-6 7 September 2018 Original: English E International Coffee Council 122 st Session 17 21 September 2018 London, UK Emerging coffee markets: South and East Asia Background 1. In accordance with
Global Wine Report SAN JOAQUIN VALLEY WINE GROWERS ASSOCIATION NOVEMBER 29, 2017 DEDICATED BROKERS IN 8 COUNTRIES
 Global Wine Report SAN JOAQUIN VALLEY WINE GROWERS ASSOCIATION NOVEMBER 29, 2017 DEDICATED BROKERS IN 8 COUNTRIES GLOBALLY BASED TO BUILD YOUR BUSINESS WORLDWIDE 1 INTRODUCTION Ciatti Co à 8 Regional Offices
ABN Australian Vintage Limited Full Year Result to 30 June 2018 Profit up 79% and Record Cash Flow
 ABN 78 052 179 932 Company Announcements Australian Securities Exchange 29 August 2018 Key Points Australian Vintage Limited Full Year Result to 30 June 2018 Profit up 79% and Record Cash Flow Net Profit
K+S Acquires Leading South American Salt Producer
 Kassel, A New Position in the Worldwide Salt Business: K+S Acquires Leading South American Salt Producer On Saturday, 22 April 2006, K+S signed the agreement to acquire Chilean salt producer Sociedad Punta
Strengthening our coffee leadership
 Strengthening our coffee leadership Nestlé enters agreement for the perpetual global licensing rights of Starbucks consumer and foodservice products May 7, 2018 Mark Schneider François-Xavier Roger Chief
Colombia Cow Milk Market Production and Fluid Milk Consumption by Volume,
 TABLE OF CONTENTS 1. Colombia 1.1. Colombia Milk Market Introduction 1.1.1. Colombia Cow Milk Market Production and Fluid Milk Consumption by Volume, 2007-2015 1.1.2. Colombia Milk Cow Numbers and Milk
Ontario Wine and Grape Industry Performance Study
 Ontario Wine and Grape Industry Performance Study 2015 Performed by VQA Ontario and Deloitte on behalf of the Ontario wine and grape industry March 2016 FINANCIAL INFORMATION I II 2015 ONTARIO WINE AND
Australian Vintage Ltd. December 2017 Half Year Results 21 st February 2018
 Australian Vintage Ltd. December 2017 Half Year Results 21 st February 2018 Australian Vintage Ltd. December 2017 Half Year Results Disclaimer The presentation has been prepared by Australian Vintage Limited
Global Hot Dogs Market Insights, Forecast to 2025
 Report Information More information from: https://www.wiseguyreports.com/reports/3366552-global-hot-dogs-market-insights-forecast-to-2025 Global Hot Dogs Market Insights, Forecast to 2025 Report / Search
DELIVERING REFRESHING SOFT DRINKS
 BEVERAGES DIVISION DELIVERING REFRESHING SOFT DRINKS Swire Beverages manufactures, markets and distributes refreshing soft drinks to consumers in Hong Kong, Taiwan, Mainland China and the USA. 46 215 PERFORMANCE
Co-operation Amongst Co-operatives: Improving Business Opportunities Across Borders
 Strategies for Transnational Cooperative Trade and Accessing Global Supply Chains Alex Serrano & Stanley Kuehn October 23, 2018 Buenos Aires, Argentina Co-operation Amongst Co-operatives: Improving Business
Three-month sales. April 19, 2018 Nestlé three-month sales 2018
 Three-month sales 1 Disclaimer This presentation contains forward looking statements which reflect Management s current views and estimates. The forward looking statements involve certain risks and uncertainties
Overview of the Manganese Industry
 39th Annual Conference Istanbul, Turkey 2013 Overview of the Manganese Industry International Manganese Institute Alberto Saavedra Market Research Manager June, 2013 Introduction Global Production Supply,
Three-month sales April 20, 2017 Nestlé three-month sales 2017
 Three-month sales 2017 1 Disclaimer This presentation contains forward looking statements which reflect Management s current views and estimates. The forward looking statements involve certain risks and
ANALYSIS ON THE STRUCTURE OF HONEY PRODUCTION AND TRADE IN THE WORLD
 ANALYSIS ON THE STRUCTURE OF HONEY PRODUCTION AND TRADE IN THE WORLD GU G., ZHANG Ch., HU F.* Department of Sericulture and Apiculture, College of Animal Science Zhejiang University, Hangzhou 310029, CHINA
DRIVING THE TORTILLA INDUSTRY GROWTH PRIVATE SECTOR INTERNSHIPS AND LINK
 DRIVING THE TORTILLA INDUSTRY GROWTH PRIVATE SECTOR INTERNSHIPS AND LINK MAY, 2014 TABLE OF CONTENTS I. MISSION FOODS DESCRIPTION II. INTERNSHIP PROGRAMS III. INNOVATION IMPACT ON CPG S HR I. MISSION FOODS
An insight into the viticulture sector
 An insight into the viticulture sector Business Analysis Pio De Gregorio Head Luca Schianchi Senior analyst Brescia, 12 June 2015 World production of wine Billion of liters 2007 2008 2009 2010 2011 2012
Global Cocoa Butter Equivalent (CBE) Market - Volume and Value Analysis By Type, By Region, By Country: Opportunities and Forecast ( )
 Market - Volume and Value Analysis By Type, By Region, By Country: Opportunities and Forecast ( )") Global Cocoa Butter Equivalent (CBE) Market - Volume and Value Analysis By Type, By Region, By Country: Opportunities and Forecast (2017-2022) By Type - Shea Butter, Other Specialty Fats) By Region- APAC,
Global Cocoa Butter Equivalent (CBE) Market - Volume and Value Analysis By Type, By Region, By Country: Opportunities and Forecast (2017-2022) By Type - Shea Butter, Other Specialty Fats) By Region- APAC,
Strong Holiday Performance Drives 5% Global Comp Growth, Global Traffic Increases 2%
 Starbucks Delivers Record Q1 Revenue and EPS Strong Holiday Performance Drives 5% Global Comp Growth, Global Traffic Increases 2% Revenues rise 13% to a record $4.8 billion; EPS of $1.30 includes a gain
Globalization of Agriculture: An Ownership and Market Perspective. Ken Sullivan March 7, 2017
 Globalization of Agriculture: An Ownership and Market Perspective Ken Sullivan March 7, 2017 History and Context 3 $14BN COMPANY THAT OPERATES IN 23 U.S. STATES AND 5 COUNTRIES Smithfield s vertically
Strategy and development perspectives
 Strategy and development perspectives Warsaw, 5 June 2017 AMBRA in brief 1992 establishment of AMBRA S.A. 1995 leader of the sparkling wines segment 1997 acquisition of the CIN&CIN brand 2005 IPO and formation
Investor Presentation
 Investor Presentation COMPANY OVERVIEW GRUMA IS THE WORLD S LARGEST CORN FLOUR AND TORTILLA PRODUCER, WITH OPERATIONS IN THE UNITED STATES, MEXICO, CENTRAL AMERICA, EUROPE, ASIA AND OCEANIA Family: 52%
Majestic Wine 2013/14 Interim Results
 Majestic Wine 2013/14 Interim Results Key Competitive Advantages > > Excellent customer service delivered by highly trained store teams > > Taste before you buy, free to attend wine events and wine courses
UNDERSTANDING, LEADING, BUILDING & WINNING IN THE BUSINESS OF COFFEE FARMER BROTHERS
 UNDERSTANDING, LEADING, BUILDING & WINNING IN THE BUSINESS OF COFFEE FARMER BROTHERS WE ARE A COFFEE COMPANY DESIGNED TO DELIVER THE COFFEE PEOPLE WANT, THE WAY THEY WANT IT. FARMER BROTHERS 2 We have
DISCOVER INTRODUCTION.
 DISCOVER BSEA INTRODUCTION www.brazilsoutheastasia.com INTRODUCING THE BRAZIL-SOUTH EAST ASIA CHAMBER OF COMMERCE (Singapore) Limited BSEA s LAUNCH, EXECUTIVES AND SUPPORT T he Brazil-South East Asia (BSEA)
Leading the Category Driving Growth Creating Value. Fiona KENDRICK Head of Coffee and Beverages Strategic Business Unit
 Leading the Category Driving Growth Creating Value Fiona KENDRICK Head of Coffee and Beverages Strategic Business Unit Disclaimer This presentation contains forward looking statements which reflect Management
Investor Presentation
 Investor Presentation COMPANY OVERVIEW GRUMA IS THE WORLD S LARGEST CORN FLOUR AND TORTILLA PRODUCER, WITH OPERATIONS IN THE UNITED STATES, MEXICO, CENTRAL AMERICA, EUROPE, ASIA AND OCEANIA Family: 52%
Germany is the largest importer of cheese and UK and Italy are the second- and third-largest importers.
 EXTRACTSFROMTHEREPORT 1.Introduction 1.1. Background The cheese market has been one of the most dynamic food segments in the last 20 year with steady growth in production, consumption and international
2008/09 first quarter net sales: 1,756 million (+13%) Strong organic growth: +7% Confirmed profit growth guidance for 2008/09
 Strong organic growth: +7% Confirmed profit growth guidance for 2008/09") Press Release 2008/09 first quarter net sales: 1,756 million (+13%) Strong organic growth: +7% Confirmed profit growth guidance for 2008/09 Press release - Paris, 30 October 2008 Pernod Ricard consolidated
Press Release 2008/09 first quarter net sales: 1,756 million (+13%) Strong organic growth: +7% Confirmed profit growth guidance for 2008/09 Press release - Paris, 30 October 2008 Pernod Ricard consolidated
In 2017, the value of Scotch Whisky exports reached a record 4.37 billion.
 SCOTCH WHISKY 2017 EXPORT ANALYSIS #WHISKYFORTHEWORLD www.scotch-whisky.org.uk " In 2017, the value of Scotch Whisky exports reached a record 4.37 billion. To put this into perspective, more Scotch Whisky
Ontario Wine and Grape Industry Performance Study
 Ontario Wine and Grape Industry Performance Study 2016 Performed by VQA Ontario and Deloitte on behalf of the Ontario wine and grape industry March 2017 FINANCIAL INFORMATION I II 2016 ONTARIO WINE AND
Table grape. Horticulture trade intelligence. Quarter 1: January to March 2017
 Horticulture trade intelligence A custom report compiled for Hort Innovation by Euromonitor International Table grape Quarter 1: January to March 217 Horticulture trade intelligence: Table grape: 217:
TRADITION & TRANSCENDENCE
 BRAND BOOK 2015 SANTA CAROLINA IS HISTORY & ESSENCE TRADITION & TRANSCENDENCE CONTINUOUS IMPROVEMENT & INNOVATION QUALITY & CONSISTENCY SUSTAINABILITY & RESPECT CHILEAN HERITAGE History Santa Carolina
DIRECTORS AND CEO REPORT
 FOR THE YEAR ENDED 30 JUNE 2018 The Directors of Foley Family Wines Limited (FFW) wish to announce the 2018 operating results and annual report for the 12 months ended 30 June 2018. Highlights: Case sales
MARCOS S. JANK. JAPAN BRAZIL Bilateral Dynamics and Partnership in the Agri-Food Sector
 MARCOS S. JANK JAPAN BRAZIL Bilateral Dynamics and Partnership in the Agri-Food Sector JAPAN-BRAZIL BUSINESS COUNCIL Tokyo, Japan 24 th July 2018 Japan and Brazil Competitive Advantages in the Agri-Food
TOPIC 12. Motivation for Trade. Tuesday, March 27, 12
 TOPIC 12 Motivation for Trade BIG PICTURE How significant is world trade to the global economy? Why does trade occur and what are the theoretical benefits of trade? How can we motivate prices in international
Seeka Limited. Retail Investors March 2019
 Seeka Limited Retail Investors March 2019 Orchard-to-market excellence Seeka is an international fresh produce business In Australia Grow, process and market - Kiwifruit - Nashi pears - European pears
@WineIntell Wine Intelligence
 @WineIntell Wine Intelligence 2015 1 About Wine Intelligence Decision-making based on evidence Last year we spoke with more than 80,000 wine consumers in more than 27 wine markets We conducted quantitative
Company Presentation. Opportunity Day 3Q2013 December, 2013
 Company Presentation Opportunity Day 3Q2013 December, 2013 Company Presentation Opportunity Day 3Q2013 December, 2013 Disclaimer Copyright 2013 MK Restaurant Group Public Company Limited. All rights reserved.
Richard Girardot chief Executive Officer. Vevey, December 2 nd, 2009
 Richard Girardot chief Executive Officer Vevey, December 2 nd, 2009 Disclaimer This presentation contains forward looking statements which reflect Management s current views and estimates. The forward
THE OUTLOOK FOR METAL CANS 2014 EDITION TABLE OF CONTENTS
 EXECUTIVE SUMMARY... ES-1 I. INTRODUCTION... 1 The Global Packaging Industry... 1 Metal Can Categories... 2 A Brief History of Metal Cans... 5 Major Developments and Trends... 6 Market Saturation... 7
State of the Spirits Industry 2013
 State of the Spirits Industry 2013 Spirits Continues to Gain U.S. Market Share at the Expense of Beer Supplier $ Share (Billions) Beverage Alcohol Market Share 2005 2011 CAGRs Wine: Spirits: Beer: $49.9
World Yoghurt Market Report
 World Yoghurt Market Report 2000-2020 Price: 1,800 /$2,200 The report contains 330 pages of valuable information Analysis of the current market situation and future possibilities in all regions of the