SAMPLING PRESERVING TESTING MILK
|
|
|
- Amberly Lloyd
- 5 years ago
- Views:
Transcription


1 I STATION BULLETIN 383 DECEMBER 1940 SAMPLING PRESERVING TESTING MILK G. H. Wilster R. P. Robichaux OREGON. STATE SYSTEM OF HIGHER EDUCATION AGRICULTURAL EXPERIMENT. STATION OREGON. STATE. COLLEGE CORVALLIS
2 PREFACE of the development of problems concerning methods of sampling, BECAUSE preserving, and testing milk the Oregon Milk Control Board, in pursuance of the Act that created the board, requested the Oregon Agricultural Experiment Station to investigate the subject. The study was undertaken in April 1939 by the Experiment Station with funds provided by the Milk Control Board. This bulletin gives a complete report of the significant findings obtained during the investigation. On the basis of the data obtained and observations made, a complete set of directions for sampling, preserving, and testing milk has been prepared and is presented in this bulletin. The Experiment Station believes that if these directions are accurately followed, milk can be marketed without discrimination against the buyer or the seller. Director

3 TABLE OF CONTENTS Summary and Conclusions 4 Purpose and Plan of Study 7 Preliminary Investigation and Preparation 8 Methods and Procedures Used for the Part of the Investigation that Involved Daily and Composite Testing 9 Survey of Sampling and Testing Procedures in Portland Milk Plants 12 Accuracy of Milk-Test Bottles 13 Results from the Investigation 14 Daily Versus Composite Testing of Milk 14 Comparison of the Results Obtained when Milk Samples Were Tested Daily and when 5-Day, 7-Day, and 15-Day Composite Samples Were Tested 14 Frequency Distribution of the Differences Between the Average Daily and the 7-Day and the 15-Day Composite Samples 16 Determination of the Fat Content of the Milk Used in the Investigation by the Mojonnier Method 17 Miscellaneous Studies, Including Sampling Milk at Milk Plants, Storing Composite Samples, Testing Procedures, etc. 19 Sampling and Storing Composite Samples 19 Variations in Testing Procedure 29 Directions for Sampling, Preserving, and Testing Milk for Fat by the Babcock Method 35 Sampling, Preserving, and Storing Samples 36 Glassware 37 Centrifuge 38 Miscellaneous Equipment and Reagents 38 Preparing the Milk Samples for Testing 39 Directions for Testing Milk by the Babcock Method 40 Causes of Variation in Milk Tests 42 Important Points in Testing Milk 43 Acknowledgments 44 Page
4 SUMMARY AND CONCLUSIONS A. DAILY VERSUS COMPOSITE TESTING OF MILK During the period May 1939 to April 1940, 2,064 tests for fat in milk were made by the Babcock method in accordance with a standardized procedure and 1,032 tests for fat were made by the Mojonnier method. When composite samples of milk were tested by the Babcock method the results showed small decreases in the fat percentages as compared with the average fat percentages obtained from the testing of the milk daily. A statistical analysis of the results failed to show that the decreases obtained with the composite method of testing had much significance. The trend observed, however, was in one direction: the fat tests with the composite method were generally lower than with the daily method. Testing all the samples by the Mojonnier method also gave small decreases for the composite method of testing. B. MISCELLANEOUS STUDIES, INCLUDING SAMPLING MILK AT MILK PLANTS, STORING COMPOSITE SAMPLES, TESTING PROCEDURES, ETC. This involved making more than 2,000 individual tests on milk. When milk was received at milk plants, the agitation to which the milk was subjected when it was dumped into the weighing vats from the cans, not previously stirred, was not sufficient to obtain a representative sample. A mixing and sampling device constructed at the Experiment Station proved to be an aid in obtaining a representative sample of milk deliveries at milk plants. With composite samples of milk the failure to mix daily the contents of the bottles or allowing the bottles to remain at room temperature long enough each day to increase the temperature of the milk before the samples were returned to the refrigerator caused a greater decrease in the average test than was the case when the composites were mixed daily and returned to the refrigerator promptly after the daily additions of milk. The refrigerator temperature was kept at from 35' to4o F. When composite samples were kept at room temperature (approximately 70 F.) greater decreases from the average daily test were obtained than when the samples were stored in a refrigerator.
5 Formalin did not prove superior to mercuric chloride for preserving composite samples of milk when sterilized bottles were used, regardless of the time and temperature at which the samples were held. The addition of saponin to composite samples of milk did not prove of any benefit in arresting decreases, in the fat percentages of composite samples. No significant difference was obtained in the fat tests from preserved milk that had been stored in rubber-stoppered sample bottles for periods of 7 and 14 days at 400 F. and from preserved milk of the same lot measured into 8-per-cent test bottles, tightly stoppered, and then stored for 7 and 14 days at 40 F. Varying the temperature of the milk at the time of withdrawing the 17.6 cc. charge of milk used for the Babcock test by only a small amount, such as 12 F. from 68 F., did not cause any measurable change in the final results. Measuring at 1000 F. instead of at 68 F. decreased the average fat reading Measuring the milk at a temperature of 120 F. as compared with measuring at 55 F. caused a difference in the test of The lower test was obtained from the milk measured at 120 F. The generally recognized variation permitted is from 60 to 70 F. Legally standard Babcock 8-per-cent milk-test bottles were found to vary as much as cc. above and cc. below the correct capacity of cc. of the graduated portion of the neck. Variations of the graduated portion of the neck from cc. to cc. were found to cause measurable differences in the fat reading. Standardization of the strength, temperature, and amount of acid used for the Babcock test was found to be necessary, if dependable, uniform, and accurate results were to be obtained. A speed of 200 revolutions per minute below the specified speed of a 20-inch diameter centrifuge gave fat tests that averaged per cent less than those obtained at the correct speed. A speed of 200 revolutions per minute above the specified speed for a 20-inch diameter centrifuge gave an average increase of only in the readings Measuring the fat columns immediately when bottles - were removed from the centrifuge, the interior of which was - maintained at from 175 to 180 F., resulted in tests that were per cent higher, on an average, than tests after the bottles and contents had been maintained in the water bath at a temperature of 138 F. for not less than 5 minutes.
6 When tests were being measured, a higher temperature than normal gave a higher fat percentage, and a lower ternperature gave a lower fat percentage. The length of time the test bottles and contents remained in the water bath at 138 F. after the first 5 minutes had no effect on the fat readings. The use of a reading lamp, equipped with a magnifying glass, and needle-pointed calipers when measuring the fat columns from 1,044 samples of milk tested in duplicate and measured by the same operator gave 646 tests that showed no variation between the duplicates, 380 that showed a variation of 0.05, and 18 that showed a variation of No variation greater than 0.10 occurred. The duplicate tests from 834 of the 1,044 samples were measured by a second person. The individual readings obtained by the two persons agreed exactly or within 0.05 per cent in the majority of the readings. A variation of 0.1 per cent occurred with 27 of the tests; the second reader obtained a reading 0.1 per cent higher than the first reader 17 times and a reading 0.1 per cent lower 10 times. I C. DIRECTIONS FOR SAMPLING, PRESERVING, AND TESTING MILK FOR FAT. On the basis of the results obtained and observations made in this study, directions for the sampling, preserving, and test- - ing of milk have been prepared. If these directions are accurately followed, errors in testing will be reduced to a minimum. In the determination of the fat content of milk received at milk plants it is impossible to reach absolute perfection. - Small variations due to slight inaccuracies in the glassware used and normal small errors by the operator are bound to occur. The determination should be made with such accuracy and integrity that duplicate determinations will not vary by more than 0.1 in the fat percentage. If the fat tests are carefully and honestly made, small variations, over a period of time, will give an average that closely approaches the true value. Under these circumstances - neither the seller nor the buyer of the milk will be favored.

7 ()F Sampling, Preserving, and Testing Milk By G. H. WILSTER, Professor of Dairy Manufacturing, and R. P. ROBICHAUX, Research Assistant in Dairy Manufacturing* Purpose and Plan of Study the approximately 100 billion pounds of milk produced in the United States in 1937, 31 billion pounds were skimmed for sale as butterfat and 39 billion pounds were sold as milk to market milk plants and different manufacturing plants. Of the 1 billion pounds of milk produced in Oregon during 1937, 522 million pounds were skimmed for sale as butterfat and 501 million pounds were sold to different dairy plants. The Babcock test is universally used in the United States for determining the amount of fat in milk and cream. It is recognized as one of two official methods by the Association of Official Agricultural Chemists.t The methods of this association are commonly recognized as official by law-enforcing agencies in the different states. The Oregon law requires that "Every milk products plant shall at all times employ a licensed tester, who shall sample and test all milk or cream purchased or received by such plant and who shall be responsible for the operation of the Babcock test of such milk products plant. Every milk products plant shall take accurate samples of any milk or cream received. It shall be unlawful for any milk products plant or any agent or employee or tester thereof to underweigh, undertest, or overtest, or incorrectly weigh, measure or test any, milk or cream received or purchased, or to fraudulently manipulate any weight, test, or measure of any milk or cream, or to make any false entry thereof as to weight or test or measure thereof upon any statement, record, invoice or milk or cream test sheet." The present Oregon law governing the purchase of milk and cream furthermore provides that composite samples of milk must not be made up over a period longer than 15 days or twice a month, and that the glassware and other equipment used in testing and also the procedure of testing be in accordance with certain specific standards. The State Department of Agriculture is vested with authority to enforce the law that governs the purchase of milk and cream in accordance with the Babcock test. In 1938 the Central Testing Laboratory at Portland was established. This laboratory has been testing most of the market milk sold in Portland. It is operated on a cost basis by the State Department of Agriculture. The Oregon Milk Control Board needed further scientific data regarding sampling and testing milk. It made available to the Oregon Agricultural Experiment Station necessary funds for conducting an investigation on this subj ect. Resigned. t Official and Tentative Methods of Analysis of the Association of Official Agricultural Chemists, 4th ed Published by the Association of Official Agricultural Chemists, Washington, D. C. Section Oregon Code 1935 Supplement. I

 a study to determine the error in the results obtained in the Babcock test when unstandardized practices were used.")

8 8 AGRICULTURAL EXPERIMENT STATION BULLETIN 383 Because of the difference in results obtained by using various methods and procedures in sampling and testing and because of the variations obtained by different operators of the Babcock test, the immediate problem was to find out whether the conflicting results were due to faulty equipment and procedures or to inaccuracies in the method. The investigation as outlined by the Oregon Agricultural Experiment Station involved, (1) a study of the variations between different methods of sampling, preserving, and testing milk for fat during various seasons in accordance with a standardized procedure, and (2) a study to determine the error in the results obtained in the Babcock test when unstandardized practices were used. The purpose of this was to try to solve the problem whereby the sampling, preserving, and testing of milk for fat could be more uniformly accomplished by different operators in dairy plants. PRELIMINARY INVESTIGATION AND PREPARATION Before proceeding with the investigation proper, it was deemed necessary to obtain the best type of equipment for sampling and testing, and also necessary to adapt methods and procedures in accordance with the official specifica- - Figure 1. Babcock testing equipment used in the investigation. Sulphuric acid container and burette. Reading lamp for measuring fat columns. Combined water-tempering bath for milk samples (68 F.) and final tests (l3s F.). Automatic control (at right bottom of tank) (for 6U F.). Automatic control (for 13U F.). Electric heating element (for l3u F.) (at left bottom of tank). Magnetic water valve (for 6U F.). Centrifuge, electrically operated, equipped with an electric heater. Speed indicator...'. Indicating thermometer. Interval timer. -. Hot water container.


9 SAMPLING, PRESERVING, TESTING MILI 9 lions in order to develop a high degree of accuracy in the investigational work. This preliminary work extended over a period of approximately 1 month. Because certain pieces of equipment and apparatus could not be purchased, it was necessary to design and construct them at Oregon State College. This was done in order that a considerable number of samples could be tested accurately and efficiently METHODS AND PROCEDURES USED FOR THE PART OF THE INVESTIGATION THAT INVOLVED DAILY AND COMPOSITE TESTING In order to study the seasonal variations, if any, it was decided to divide the observations into a number of periods, or units. A unit meant the collection of six samples of milk daily for daily and composite testing; five samples were obtained at a commercial market-milk plant in the city of Corvallis and one sample was obtained in the Experiment Station dairy products laboratory. These were collected over a period of 15 days for each unit. When sampling the milk, about 1 pint representing the well-mixed milk delivered by each producer was mixed thoroughly by pouring from one container to another until six pourings had been completed. A i-ounce portion of this sample was then poured into each of three rubber-stoppered sample bottles, to which one No. 1 mercuric chloride (corrosive sublimate) tablet had been added. The average weight of a tablet was 0.4 gram. The tablets were reported by the manufacturer to contain 68 per cent mercuric chloride. Two of the bottles were of the 8-ounce size for 5- and 7-day composites and one bottle Figure 2. Water-tempering bath used for milk samples (65 F.).

. The composite samples were stored in the refrigerators in the two different establishments at a temperature of from 35 to 400 F.")
10 10 AGRICULTURAL EXPERIMENT STATION BULLETIN 383 was of the 16-ounce size for the 15-day composite. Another sample (about 4 ounces) was placed in a rubber-stoppered bottle for the daily test. A total of 10 units extending over a period of 10 months was completed. This covered the four seasons of the year from spring 1939 to spring In the first two units, 5-, 7-, and 15-day composite samples were used. In the remaining eight units, only the 7- and 15-day composite methods of testing were compared with the daily method. I Figure 3. Water-tempering bath used for test bottles (138 F.). The composite samples were stored in the refrigerators in the two different establishments at a temperature of from 35 to 400 F. Thu samples were mixed with a rotary motion each day after the addition of the daily portion until all the cream had been removed from the sidcs of the bottles. The samples were then tilted to mix completely the contents of the bottles. The composite samples were returned to the refrigerator as soon as possible after the addition of the daily portions. Both the fresh and composite samples were handled and tested as follows: The samples were placed in a water bath maintained automatically at a temperature of 68 F. by means of an electric regulating device. They were kept in this water bath for approximately I hour. The standard Babcock milk-measuring pipettes were used. They were graduated to hold 17.6 cc. The pipettes were guaranteed by the manufacturers to he within ±0.01 cc. of the correct capacity. Standard 8-per-cent Babcock test bottles were used. No test bottle was used that had a variation in the total volume of the graduated portin of the bottle greater than 0,005 cc. as determined by the use of mercury delivered by means of a specially constructed burette.


11 SAMPLING, PRESERVING, TESTING MILI 11 The sulphuric acid used was tested for its specific gravity at 600 F. by means of an acid hydrometer. The acid was always standardized and checked by means of a hydrometer so that it had a specific gravity of or The acid purchased usually had a specific gravity of to Dilution of the acid was usually done by adding slowly 2 liters of acid to about 40 cc. cold distilled water. The standardized acid was then cooled to the proper temperature in a water bath before being used. Figure 4. Showing the advantage of using a lamp and magnifying glass for measuring fat columns. The test bottle is attached at the top to the lamp. The complete length of the fat column is illuminated.

12 12 AGRICULTURAL EXPERIMENT STATION BULLETIN 383 The acid when added to the milk was of a temperature of from 60 to 70 F. The milk in the test bottles was brought to a uniform temperature before the acid was added by placing the rack containing the test bottles in a bath of cold water for about 5 minutes. An electrically driven centrifuge equipped with a speedometer was used. The air in the centrifuge was maintained during the centrifuging at a temperature of from 135 to 140 F. by means of an electric heater. Distilled water was added to the test bottles after the first and second centrifuging periods. The water was of a temperature of from 140 to 150 F. The test bottles and contents were centrifuged at the proper speed for periods of 5 minutes, 2 minutes, and 1 minute. A time-alarm clock was used for determining the centrifuging periods. After the centrifuging, the bottles were placed in a water-tempering bath with the part of the neck that contained the fat column submerged. The temperature of the water was 138 F. This was automatically maintained by means of an electric heating unit. The bottles were kept in this bath for not less than 5 minutes prior to measuring the fat. All determinations from each sample of milk were made in duplicate and the fat columns were nearly always measured by two different persons. The average of the four readings was accepted as the result for each determination. No difficulty was experienced with charred or curdy fat columns. Differences greater than 0.1 per cent between duplicates did not occur. A specially constructed reading lamp equipped with a magnifying glass was used when measuring the fat column. The fat column was measured to the nearest 0.05 per cent. (See Figure 4.) The two test bottles used when testing each daily sample were nearly always used when testing the composite sample that represented the daily additions. Needle-pointed calipers were used for measuring the fat column. The fat was measured from the lowest extreme point of the column to the extreme top of the meniscus on the surface. The composite samples of milk were handled and tested identically with the daily fresh samples except when it was impossible to obtain a good mixture of the cream with the underlying milk. The samples were then heated to a temperature of 100 F., mixed thoroughly, and subsequently cooled to a temperature of 68 F. before measuring the necessary amount. SURVEY OF SAMPLING AND TESTING PROCEDURES IN PORTLAND MILK PLANTS In addition to the preliminary testing work described above, a survey was made of the methods of sampling, preparing composite samples, and storing samples, and of the types of milk-weighing vats used. A total of 20 different market-milk plants was visited. The survey was made jointly with a representative of the Portland Central Testing Laboratory. The methods of obtaining the daily sample portion from the milk in the weighing vat and mixing this with the milk from previous shipments in the sample bottle varied between the different plants. In all the plants, the milk in each can was stirred by means of a suitable stirrer in accordance with the rules of the Testing Laboratory. In several plants, the milk was stirred not only before but also after it had been dumped
13 SAMPLING, PRESERVING, TESTING MILK 13 into the weighing vat. In one plant, a mechanical stirrer was used for mixing the milk in the weighing vat. After the milk had been placed in the weighing vats, a f-ounce sample was taken by means of a flat-bottomed f-ounce dipper. When the weighing vat was too small to hold all of the milk in the shipment, the lot of milk was divided and a f-ounce sample was taken from each vat. These portions were mixed together and a i-ounce portion was taken of this mixture to be added to the composite sample bottle. The standard f-ounce dipper as required by the Portland Central Testing Laboratory was used in all plants. The method of securing an aliquot portion of the milk in each delivery by means of a proportional sampler was not used in any of the plants visited. The weighing vats used were not of uniform construction. Some had square bottoms and others had rounded bottoms. Most of the vats were equipped for gravity drainage but in two plants a suction pump was used for pumping the milk out of the vat. It was observed that when pumps were used a considerable amount of foam remained in the weighing vat. Little or no foam remained when the vats were emptied by gravity through an outlet valve located in the bottom of the vat. Most of the vats were suspended on regular hanging devices with a dial scale arrangement but others were placed on platform beam scales of different types. The ideal method of adding the daily portion to the sample bottle is to rotate each bottle gently after the addition of each portion until all of the cream has been removed from the side of the bottle, and then tipping the bottle to reincorporate any moisture that had accumulated through condensation on the side of the bottle and stopper and then return the sample to the cooler before it has been heated to any considerable extent. In some plants the bottles were hardly handled at all in order to mix the samples. Some bottles were merely shaken a little without tipping to remove the material from the side of the bottle and the stopper. Some, however, were shaken vigorously after the addition of the daily portion. Upon examination of samples kept at the different plants, it was found that a number of them showed a churned condition. Some had fat and cream adhering to the inside upper surface of the bottle, while milk was spilled on the outside of some bottles. Most of the samples, however, were found to be in a good condition. In most cases all of the composite samples were removed from the plant refrigerator early during the morning, in some instances a considerable time before the milk was received. The sample bottles were left out of the refrigerator at room temperature on the receiving platform until the last sample had been taken. Occasionally, this required a total period of 5 hours or more. ACCURACY OF MILK-TEST BOTTLES Another preliminary investigation was a determination of the accuracy of the graduated portion of the standard milk-test bottle. The Oregon law requires this to be graduated from 0 to 8 per cent, with the smallest divisions representing 0.1 per cent fat. For this work, the Experiment Station designed and had constructed a burette. This burette was checked for accuracy by the U. S. Bureau of Standards, Washington, D. C. Redistilled mercury was used in calibration.
 264 Number of bottles with 0.005 cc. tolerance found to hold 1.600 cc. or more (43.9 per cent of 264) 116 Number of bottles with 0.005 cc. tolerance found to hold 1.599 cc.")

14 14 AGRICULTURAL EXPERIMENT STATION BULLETIN 383 The following results were obtained: Number of bottles checked 356 Number of bottles found to hold cc. mercury at 20 C. ± cc. tolerance (equivalent of per cent fat) 264 Number of bottles with cc. tolerance found to hold cc. or more (43.9 per cent of 264) 116 Number of bottles with cc. tolerance found to hold cc. and under (56.1 per cent of 264) 148 Number of bottles found to hold more than cc. 37 Number of bottles found to hold under cc. 55 Number of bottles found to be within the state tolerance of ± 0.02 cc. (equivalent of 0.1 per cent fat) 356 Resuks from the Investigation DAILY VERSUS COMPOSITE TESTING OF MILK COMPARISON OF THE RESULTS OBTAINED WHEN MILK SAMPLES WERE TESTED DAILY AND WHEN 5-DAY, 7-DAY, AND 15-DAY COMPOSITE SAMPLES WERE TESTED A total of 2,064 individual determinations was made, using the Babcock method of testing. All the samples of milk were tested in accordance with a standardized procedure decided upon and already described, after the preliminary month of observations and testing. The methods used were in harmony with those of the Association of Official Agricultural Chemists* and also with the methods and procedures outlined in the Oregon state law except as indicated.f All samples were tested in duplicate and the fat column in each bottle was generally measured by two different men. The average of the four readings was taken as the final test. All measurements were made to the nearest 0.05 per cent fat. Space does not permit the inclusion of a complete tabulation of all the individual tests obtained. The complete record of this is on file at the Oregon Agricultural Experiment Station. In Table 1 are given in summarized form the average fat percentages obtained in the investigational work. Since the measurements were made to the nearest 0.05 per cent, three decimals are See reference on page 7. Oregon Code 1930, Oregon Code 1935 supplement, and Chapter 116, Oregon Laws ection Oregon Code 1930 specifies that the pipette used should deliver 17.6 cc. water at 20 C. This is apparently a misprint. The common pipette used is graduated to hold 17.6 cc. This latter type of pipette was therefore used. The speeds given by the Association of Official Agricultural Chemists are slightly at variance with those given in Section , Oregon Code, The latter appears to be in error for the 24.inch.diameter centrifuge wheel and does not give the speed for the 22.inch wheel. The speed of the centrifuge used was that specified by the Association of Official Agricultural Chemists. In a letter to the senior author under date of November 25, 1940, Mr. A. W. Metzger, Chief of the Division of Foods and Dairies, State Department of Agriculture, writes as follows regarding this matter: The difference between the Oregon law and the method as recommended by the Association of Official Agricultural Chemists has no doubt crept into the Oregon law through typographical errors. It is the intention of the Department of Agriculture to bring this matter to the attention of tije Corn. mittee on Foods and Dairies at the 1941 legislative session and ask that the law be made to conform to the methods as prescribed by the Association of Official Agricultural Chemists."
15 .035 SAMPLING, PRESERVING, TESTING MILK 15 used in giving the average results. Although this third decimal is not very significant, it does assist in showing the trend and was therefore used for this purpose. It is evident from the data presented that regardless of whether the 5-, 7-, or 15-day composite method of sampling and testing was used the difference Tsble 1. AVERAGE DAILY AND COMPOSITE TESTS. STANDARDIZED PROCEDURE. 2,064 INDI- VIDUAL DETERMINATIONS BARCOde METHOD Number of daily samples Babcock average daily test Babcock average composite test Decrease in percentage due to composite testing Per cent Per cent 5-day COrnOSiteS day composites day conposites between the average daily tests and the composite test representing the same milk was quite consistent. Slightly lower results were obtained with the composite method of testing than with the daily method. The decrease in the average percentage of fat as compared to the average daily tests amounted to for the 5-day composites, for the 7-day composites, and for the 15-day composites. The data obtained were subjected to statistical analysis. The statistical treatment failed to demonstrate a significant difference between the different means. In Table 2 are shown the average daily and the average composite tests in the 10 different units. These tests were summarized in Table 1. Table 2. A COMPARISON OF THE AVERAGE DAILY TESTS tn THE 10 UNITs WITH THE AVERAGE 7-DAY AND 15-DAY COMPOSITE TESTS. 900 SAMPLES MARKET MILK USED. Babcock method Average 7-day Average 15-day Average 7-day composite Average 15-day composite Testing daily composite lower than daily composite lower than Unit test test daily test test daily Per cent Per cent Per cent Per cent I , I The average 7-day composite test was lower than the average daily test in nine units, and it was higher in one unit. When it was higher, the difference amounted to 0.013, and when it was lower the difference amounted to from to The average 15-day composite test was lower than the average daily test in nine units and it was higher in one unit. When it was higher the difference amounted to and when it was lower the difference amounted to from to
16 16 AGRICULTURAL EXPERIMENT STATION BULLETIN 383 The greatest decreases in the 15-day composite test occurred during the two winter months December and January (Units 8 and 9). The data obtained in the study confirm the recently reported findings at the Illinois Agricultural Experiment Station by Tracy and Tuckey,* who found slight decreases in the fat percentages on 7-day composites as compared with the results from daily testing. The differences amounted to per cent for the first period of the winter series, per cent for the second period of the winter series, and per cent for the summer series. The milk from 425 producers was used for the two winter series and from 50 producers for the summer series. At the Michigan Agricultural Experiment Station Lucast compared the daily and bimonthly composite methods of testing over a period of 5 months. The milk used in the investigation was sold by 21 producers to the College Dairy Department. The daily average per cent fat for all samples was 0.11 higher than the average for all composite samples, while for individual patrons the differences in the percentage ranged from 0.03 to In every case the average daily test was higher than the average of the composite tests. FREQUENCY DISTRIBUTION OF THE DIFFERENCES BE- TWEEN THE AVERAGE DAILY AND THE 7-DAY AND THE 15-DAY COMPOSITE SAMPLES (Oregon Agricultural Experiment Station). A frequency distribution of the differences between the average daily and the 7-day and 15-day composite samples is given in Tables 3 and 4. Table 3. FREQUENCY DISTRIRUTION OF THE DIFFESENCES BETWEEN THE AVERAGE DAILY AND THE 7.]iy COMPOSITE TESTS. 60 comparisonsbabcock method (Tnits 1 to 10 inclusive) Average composite test lower than daily test Frequency Per cent fat Number of times Total 60 Average (mean) difference, in per cent, Per cent times composites lower than average daily 66.7 Per cent times composites higher than average daily 26.7 Per cent times composites the same as average daily 6.6 Tracy, P. H., and Tuckey, S. L. Accuracy of Methods of Sampling Milk Deliveries at Milk Plants. Univ. of Ill. Agri. Exp. Sta. Bulletin 459, t Lucas, P. S. Factors Involved in Accuracy of Testing Milk Samples. Michigan Agri. Exp. Sta. Tech. Bul. 158, 1938.
17 SAMPLING, PRESERVING, TESTING MILK 17 Table 4. FREQUENCY DISTRIBUTION OF THE DIFFERENCE BETwEEN THE AVERAGE DAILY AND THE 15-DAY COMPOSITE TESTs. 60 comparisonsbabcock method (Units 1 to 10 inclusive) Average composite test lower than daily test Frequency Pcr Cent fist Number of times Total 60 The average (mean) difference in the per cent fat from the frequency table is Tile actual difference from tile data is Tile difference is due to the rounding off of the numbers in forming the frequency distribution. Per cent times composite test lower than average daily test 66.7 Per cent times composite test higher than average daily test 233 Per cent times composite test the same as average daily test 10.0 In 60 comparisons, the average 7-day composite test was lower than the average daily test in 40, it was the same in 4, and it was higher in 16 comparisons. When the composite tests were lower than the daily tests, the differences ranged from 0.01 to 0.17, and when they were higher, the differences ranged from 0.01 to With 60 comparisons, when the daily testing was compared with the 15- day composite testing, the average composite test was lower than the average daily test 40 times, it was the same 6 times, and it was higher 14 times. When the tests of the composites were lower, the differences ranged from 0.01 to 014, and when they were higher the differences ranged from 0.01 to DETERMINATION OF THE FAT CONTENT OF THE MILK USED IN THE INVESTIGATION BY THE MOJONNIER METHOD As the Mojonnier method of testing milk for fat is well known by the industry and by laboratories, all samples were also tested by this method. The Mojonnier method is a modification of the Roese-Gottlieb method.* The purpose of this comparison was not to determine whether the results obtained by the Babcock method of testing were higher or lower than with the ether See Official and Tentative Methods of Analysis of the Association of Official Agri. cultural Chemists for a description of the official Roese.Gottlieb method.


18 18 AGRICULTURAL EXPERIMENT STATION BULLETIN 383 extraction method, but to determine by means of an entirely different method whether the differences, if any, as obtained by the Babcock method between the testing of individual daily samples and composite samples of milk were similar in both methods of testing. All the daily samples and all the composite samples tested by the Babcock method were, accordingly, also tested by the Mojonnier ether extraction method. Only single determinations were made on each sample. The milk charge for each determination was weighed on an analytical balance. In Table 5 are shown the average fat contents obtained when the samples were tested by the Mojonnier method. Number of daily samples Table 5. AVERAGE DAILY AND CoMposiTE Tssis. 1,032 individual determinations. Mojonnier method Mojonnier average daily test Mojonnier average composite test Decrease in percentage due to composite testing Per cent Per Cent 5.day composites day composites day composites The data show that there was approximately the same decrease for the 5- and 7-day composites with this method of testing as was obtained with the Babcock method. With the 15-day composite method, however, there was a greater difference shown with the Mojonnier than with the Babcock method. Whereas with the Babcock method the average 15-day composite test was below the average daily test, with the Mojonnier method it was below the average daily test. The larger decrease for the 15-day composite tests, using the Mojonnier method, does not appear to have been caused by sampling difficulties, since the sampling and preparation of the samples for the Mojonnier determination were done as carefully and also at the same time and under the same conditions as for the Babcock method. While it was not the purpose of the investigation to check the results obtained by the Babcock method of testing by means of the Mojonnier method, it is observed, however, that the results obtained by the Mojonnier method of testing were lower, on an average, than the results obtained on the same samples of milk by the Babcock method. With the fresh daily samples the difference between the average fat percentage was for the first 60 samples, for the next 420 samples, and for the 900 daily samples. Similar differences have been reported by other investigators. The average per cent fat of the composite samples when tested by the Mojonnier method was lower for the 5-day composites, lower for the 7-day composites, and lower for the 15-day composites than was obtained by the Babcock method.
19 SAMPLING, PRESERVING, TESTING MILK 19 MISCELLANEOUS STUDIES, INCLUDING SAMPLING MILK AT MILK PLANTS, STORING COM- POSITE SAMPLES, TESTING PROCEDURES, ETC. The purpose of this phase of the investigation was to determine to what extent different methods and procedures in sampling milk, storing the composite samples, and testing the milk for fat affected the results obtained. It had been suggested to the Experiment Station by the members of the industry and also by members of the State Department of Agriculture that these methods and procedures be thoroughly investigated. The results from this work should be valuable as a guide to the formulation of rules for sampling, storing composite samples, and testing milk in different milk plants with the view of unifying the methods and practices and thus avoiding discrepancies. 1. SAMPLING AND STORING COMPOSITE SAMPLES (A). Milk-receiving vats. The rules made by the Central Testing Laboratory at Portland for weighing and sampling of milk call for the stirring of each can of milk thoroughly by means of a rolled- or smooth-edge perforated stirring rod before the milk is poured into the weighing vat. They require also that the milk be poured into the weighing vat within 2 or 3 minutes after it has been stirred. Immediately after the milk from each lot has been placed in the weighing vat, a it-ounce sample of the milk should be transferred to the sample bottle. The dipper used must first be filled with milk and emptied in each lot of milk to be sampled before the sample is obtained and transferred to the sample bottle. In order to investigate whether or not it is necessary to stir the milk in the vat after the milk has been poured into the weighing vat, samples were taken in seven Portland milk plants that used the several different types of weighing vats. From 6 to 12 lots of milk received at each plant were sampled and tested. The milk was not stirred in the can prior to dumping. None of the vats was equipped with a mechanical stirrer. The milk was sampled by means of a dipper from the part of the vat from which the sample was usually withdrawn immediately after the milk had been placed in the vat without stirring in the vat. The milk in the vat was then thoroughly stirred by means of a stirring rod and another sample was taken by means of a dipper. All determinations in the laboratory were made in duplicate and the fat column in each bottle was measured by two different persons, The results obtained arc shown in Table 6. It will be noted that in six of the plants the average test after stirring the milk in the vat resulted in a lower test and in one it resulted in a higher test. In the six plants where there was a decrease, as a result of stirring, the decreases in per cent fat ranged from to In the plant where there was an increase this amounted to The data showed that when milk was delivered to milk plants and not previously stirred when it was sampled from the milk-weighing vats, differences in the test of the milk occurred. Some form of stirring device is apparently necessary for stirring the milk in the vat before a sample is obtained.
20 20 AGRICULTURAL EXPERIMENT STATION BULLETIN 383 Table 6. A COMPARISON OF TESTS OF MILK OBTAINED FROM WEIGHING VATS IN PORTLAND MILK PLANTS BEFORE AND AFTER STIRRING THE MILK IN THE VATS. Before After Stirring stirring Capacity in vat in vat Number of of weigh- (average (average Milk plant lots tested log vat test) test) Gallons Per cent Per cent A B C B E F G Test after stirring lower than test before Stirring Milk plant Frequency distribution Number lots milk Times test higher before stirring Times test lower before stirring Times test no different before and after stirring A B 6 I... 3 C D E F G Total Milk plant Mszzienum differences in tests of stirred and unstirred niilk Number lots milk Maximum difference in test of individual lots Per cent A B 6.15 C 6.30 B.10 E F G The results obtained at plant G did not compare with those obtained at the other six plants. The weighing vat used in this plant was rectangular in shape and had the dimensions 52 inches long, 32 inches wide, and 20 inches leep. The milk entered the center of the vat, whereas the sample was taken from one end of the vat. This may account for the higher average test that was obtained after the milk had been stirred. At any rate, the results obtained with this vat show the necessity for a thorough stirring of the milk before sampling it. In a plant in Illinois where the milk-weighing vat was of such a construction that little mixing took place when the milk was poured into it Tracey
21 SAMPLING, PRESERVING, TESTING MILIC 21 and Tuckey* found that with 72 lots of milk the average test of the milk taken from the front of the vat before the milk was stirred was 4.40 per cent and from the rear of the vat it was 4.60 per cent, a difference of 0.20 per cent. The average test of the milk after it had been stirred with a stirring rod wts 4.51 per cent. Variations in the test of the milk obtained from the front and rear of the vat ranged from 0 to 1.0 per cent fat in the 72 lots of milk. (B). Sampling devices. Two different sampling devices for obtaining a sample of milk that would be representative of each shipment of milk were studied. (I) The sampling tray. The construction and use of the sampling tray are shown in Figure 5. The tray was constructed at the Oregon Agricultural Experiment Station.f The tray was located on top of the milk-weighing vat. When the milk was poured into this tray, it traveled to the end of the tray, after which, because of the curved shape of the rear end of the tray, a portion of it returned to the front, effecting a mixing. The mixed milk passed out through two portholes located at the front of the tray. A perforated pipe that extended to the outside was located directly under these ports for the purpose of collecting a proportionate amount of the milk as it passed to the milk-weighing vat. This milk was used for the it-ounce portion necessary for the composite sample. In order to determine whether or not this method of sampling was accurate, six comparisons were made using milk that was not stirred in the cans before it was poured into the sampling tray, and two comparisons were made when the milk was stirred in the cans before it was poured into the sampling tray. The results of two of these eight comparisons are shown in Table 7. The average test for the six comparisons when the milk was not stirred before dumping was 5.05 per cent when the sampling tray was used as compared with a test of the heated milk in the pasteurizing vat of 5.08 per cent, a difference of only 0.03 in the percentage. In the two comparisons where the milk was stirred before dumping, there was no difference between the fat test obtained when the sampling tray was used and that of the test of the milk in the pasteurizing vat after it had been heated. On the basis of the results obtained with the sampling tray, it would seem that such a device may be of considerable advantage in milk plants for taking representative samples of the milk delivered. Perhaps some modification of the construction of the tray may be desirable. (2) The proportionate sampler. The following comparison was made to study the effect on the average fat test when a proportionate samplerl and a dipper sampler were used for sampling milk from a herd of cows. Two samples of milk were taken from the complete milking of each of 20 cows of the Agricultural Experiment Station dairy herd, which is composed of Hoisteins, Ayrshires, and Jerseys. One sample was taken by means of a i-ounce dipper, using an equal amount of the milk of each cow regardless of weight of milk. The other sample was taken with the proportionate sampler by adjusting the dial on the sampler before sampling in accordance with the weight of the Tracey, P. H., and Tuckey, S. L. Accuracy of Methods of Sampling Milk Deliveries at Milk Plants. Illinois Agr. Exp. Sta. But. 459, t After sketch supplied by F. S. Board. Loaned to the Experiment Station by the Braun-Knecht-Hetmann Company of San Francisco, California.

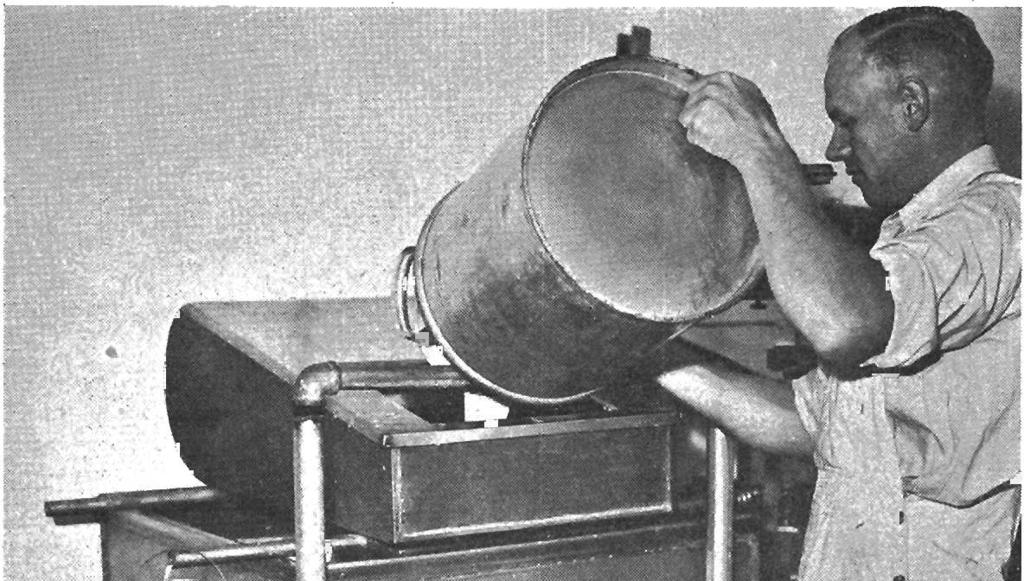
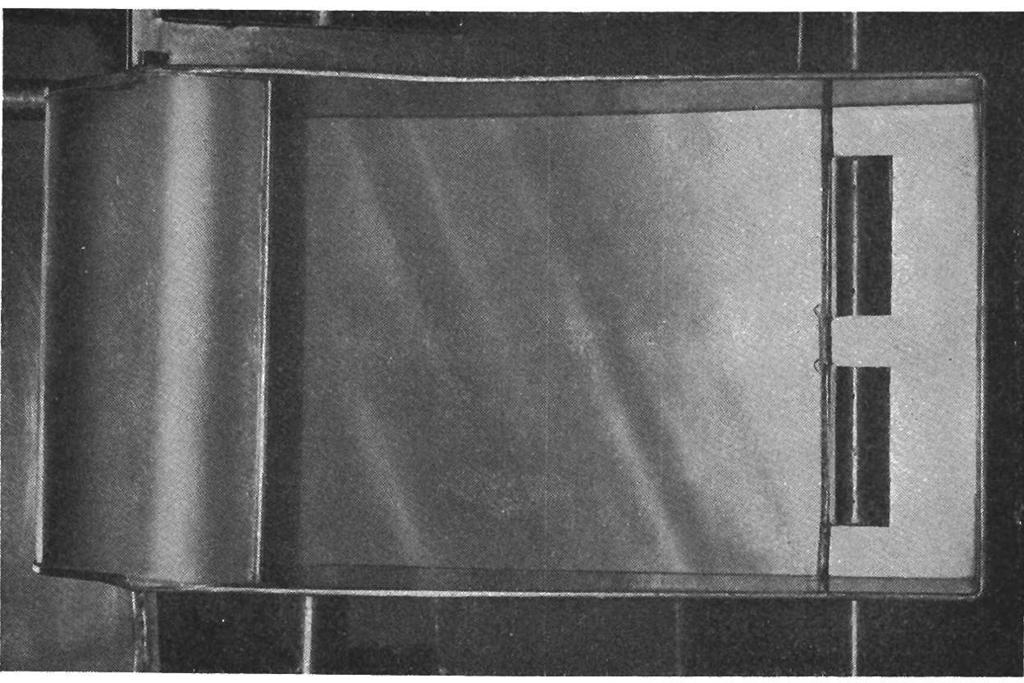
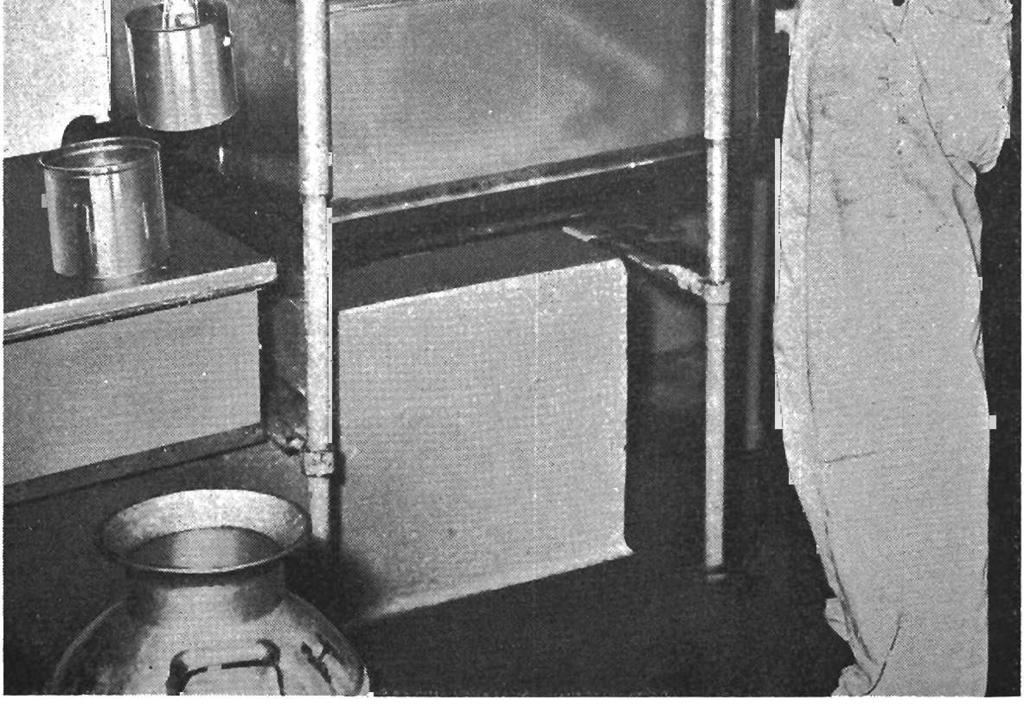

22 I Figure 5. Top: Construction of the sampling tray. Bottom: Using the sampling tray 22
23 4.60 SAMPLING, PRESERVING, TESTING MILK 23 Table 7. Tire EFFICIENCY or IFIE SAMPLING TRAY IN MIXtNG MILK. Amount of fat (test 1< Duplicate test weight Average Weight of divided Sample number test milk by 100) Milk not stir-red in cans befccre dumping 1 2 Per cent fat Per cent fat Per cent fat Pounds J Total 1, pounds fat 58.57X % fat 1135 Sampling tray composite % f at Pasteurizing vat test before heating % fat Pasteurizing vat test after heating % tat Milk stirred in cans before dunsping Total 1, pounds fat >< % fat 1388 Sampling tray composite % fat Pasteurizing vat test before heating % fat Pasteurizing vat test after heating % fat Table 8. SAMPLiNG MILK FROM A HERD OF Cows.0 (All breeds) Proportionate sample. Equal amounts Number of Average of 20 samples svith )-ounce comparison each comparison dipper samples Difference Per cent fat Per cent fat C No attempt was made to select tile same cows for each comparison.
24 I 24 AGRICULTURAL EXPERIMENT STATION BULLETIN 383 milk produced by each cow so that a proportionate sample would be taken from the milk in accordance with the total pounds of milk produced. The results obtained are shown in Table 8. The milk used in the experiment varied in weight, for each cow, from 8 to 35 pounds. The individual tests of the milk from the cows varied from 2.6 to 6.6 per cent. The data obtained show the importance of obtaining an aliquot sample when there is a considerable variation between the weights and the per cent of fat present in the milk produced by the cows. Although such variations would not be expected in the milk received from each producer at a milk plant from day to day, the experiment was conducted to show the inaccuracies that are likely to occur in the event there is a considerable difference from day to day. Table 9. THE EFFECT OF DIFFERENT METHODS or HANDLING AND STORING COMPOSITE Mxt.n SAMPLES ON THE FINAL FAT TEST. Mercuric chloride preservative used 7day composite samples abcock method Method used in handling tile samples Average test Lower than fresh daily test Tested fresh Handled according to standard i2ed pro. cedi4re. Stored at 4O F. Per cent fat 4.30 Sample 1 Sample Not sufficiently stirred daily to reincor. porate cream and moisture. Remained at room temperature 4 hours daily before returning to 4O F storage Sample 1 Sample Shaken vigorously up and down. Re. niained out at room temperature 4 hours daily before returning to 4O F. storage Sample 1 Sample Only slightly stirred daily. Kept at room temperature at all times. Bottles not sterilrzed at the beginning. Sample Sample The samples that were not handled according to standardized procedure were heated to 100 F., then cooled to 6& F. before testing. The fat column in each duplicate test was measured by two men, and the average of the two measurements is given. (C). Effect of the method of handling and storing composite samples on the percentage of fat. The results obtained from using different methods in the handling and storing of composite samples are shown in Tables 9 and 10. For this study two groups of composites, one 7-day and one 15-day, of eight samples each, were carried as follows: A i-ounce dipper of the same sample of well-mixed milk was added to each of the composite samples daily until tested.
25 SAMPLING, PRESERVING, TESTING MILK 25 Two samples from each set of composites were handled according to standardized procedure; that is, they were stored in a dark place at 400 F. at all times and were only taken out each day to add the daily portion; they were rotated gently to reincorporate the cream, and the bottles were tipped to reincorporate any moisture that had lodged on the inside of the bottles. They were then immediately returned to the cooler and kept at 400 F. Two samples from each set of composites were stored at 40 F. but were left out at room temperature each day for 4 hours before being returned to the cooler. Also, they were rotated only slightly, not sufficiently to reincorporate the cream and moisture. Two samples from each set of composites were kept at room temperature for 4 hours each day after adding the daily portion and were shaken vigorously in an up-and-down motion to reincorporate the cream and moisture. The remainder of the time they were stored at 40 F. Two samples from each set of composites were stored at room temperature throughout the period. The bottles were not sterilized to begin with and were not rotated thoroughly each day to mix the cream and milk serum. It is evident from these results that even when composite samples are made up over a period of 7 days it is necessary to use a low temperature (40 F.) for storing the samples and also to mix the contents of the bottles Table 10. THE EFFECT OF DIFFERENT METHODS OF HANDLING AND STORING CosiposiTz MILK SAMPLES ON THE FINAL FAT TEST. Mercuric chloride preservative used 15-day composite samples Babcock method Method used in handling the samples Tested fresh Handled according to standardized pro. ced u-re. Stored at 400 F. Sample 1 Sample 2 Hot sufficiently stirred daily to reincorporate cream and moisture. Remained at room temperature 4 hours daily before returning to 400 F. storage Sample 1 Sample 2 Shaken vigorously up and down. Remnajned out at -room temperature 4 hours daily before returning to 40 F. storage Sample 1 Sample 2 Only slightly stirred daily. He_pt at room temperature at all times. Bottles not sterilized at the beginning Sample 1 Sample 2 Average test Per cent fat 4.10 Lower than fresh daily test Before testing all samples were heated to 1000 F. in a water bath maintained at 110 F. and pipetted for the Babcock teat at that temperature after mixing the cream and serum by pouring from one container to another a total of six times. The samples kept at 40 F. and handled according to standardized procedure, the only ones that could have been sampled without heating due to the ease of reincorporating the cream, were also heated to 100 F. in order to be assured of comparative results. The fat column in each duplicate test was measured by two men, and the average of the two measurements is given.


26 26 AGRICULTURAL EXPERIMENT STATION BULLETIN 383 daily. Samples held at room temperature and not handled according to the standard procedure as outlined had cream and dried material on the sides of the bottles and stoppers. This would not come off when pouring from one bottle to another at a temperature of 100 F., and it was necessary to scrape it off by means of a rubber policeman. It was difficult to get this material reincorporated with the milk, even after the milk had been heated to 100 F. All the samples except those handled according to the standardized procedure showed signs of slight "oiling off" on heating. The method of mixing the samples daily by shaking vigorously proved to be satisfactory in this experiment; this is not an approved method, however, and is not recommended. It may result in a considerable amount of churning. With the 15-day composite samples, the experiment showed the desirability of handling these in accordance with the formerly mentioned standardized procedure. By handling the samples in accordance with this procedure, it is usually unnecessary to heat the samples before testing in order to effect a complete remixing of the cream and the underlying milk. This can usually be accomplished satisfactorily by rotating and tilting the bottle before the milk is heated to a temperature of from 60 to 70 F. before measuring the milk. The appearance of the 15-day composite milk samples at the end of the 15- day period before they were used for testing is shown in Figure 6. The samples handled according to the standardized procedure were in a satisfactory condition.. Figure 6. Comparison of fresh and 15-day composite samples. Bottom: After rotating bottles 15 seconds. Top: Before stirring. 1-2 Fresh milk. 3.4 Composites handled in accordance with standardized procedure. Kept at 40 F. 5-6 Composites held at room temperature 4 hours each day, balance of time at 40 F. Bottles not rotated each day to reincorporate cream and milk. 7-8 Composites handled as 5-6, but shaken vigorously daily when adding the daily portion Composites stored at room temperature during the 15-day period. Only slightly stirred daily. A tough cream layer had formed on the surface, and moldiness was observed on surface and on the underside of the stopper.
27 4.30 I SAMPLING, PRESERVING, TESTING MILK 27 (D). The effect of the preservative used on the fat percentage. In this experiment it was the purpose to determine the effect of mercuric chloride and of formalin as preservatives for milk samples that were stored under different conditions of temperature and light. One-gallon samples of milk were obtained from each of four different dairy farms. Each sample of the well-mixed milk was tested in duplicate for fat by the Babcock method. Each of the four samples was then divided and placed into 24 rubber-stoppered sample bottles. Each batch of 24 bottles was treated and held as follows: Twelve samples from each batch were preserved with two No. 1 mercuric chloride tablets, 4 were stored at 40 F. in darkness, 4 were stored at 70 to 80 F. exposed to daylight, and 4 were stored at 70 F. in darkness. The other 12 samples from each batch were preserved with 0.5 cc. formalin. These were divided into groups of 4 and stored as with the mercuric chloride. The results obtained in this experiment are shown in Table 11. The results for the 15-day and 30-day periods only are shown. Table 11. EFFECT OF TIME, METHOD OF HOLDING, AND TYPE OF PRESERVATIVE ON THE FINAL FAT TEST OF COMPOSITE MILK SAMPLES Lot number 15 days I Preserved with mercuric chloride Original held in fat test darkness Babcock at 40 F. Per cent fat Per cent fat Preserved with formalin held in darkness at 40 F. Per cent fat Preserved with Preserved mercuric with, chloride forrualin exposed to exposed to daylight at daylight at 70 to 70 to 50 F. SO' F. Per ce-nt fat Per cent fat Preserved with Preserved mercuric with chloride formalin at 70 F. at 70 F. in in darkness darkness Per cent fat Per cent fat When tested all samples were heated to 110 F. in a controlledtemperature water bath. All samples were measured at this temperature and tested according to standardized procedure, the average of duplicates being taken as the final fat test. It was found that mercuric chloride was as effective as formalin for preserving samples kept at a low holding temperature (40 F.). The time of holding the composites at the low temperature did not seem to change the results materially. There were no consistent results to show that one preserva Average Decrease in average test as compared with orig inal days I Average Decrease in average test as compared with original :

28 28 AGRICULTURAL EXPERIMENT STATION BULLETIN 383 tive was superior to the other in preventing a decline in the test at the higher temperatures, either when stored in darkness or in daylight. The results did not show that it was advantageous to store composites in darkness instead of in daylight. The use of saponin and cholesterol in composite milk samples. To study whether or not the addition of saponin,* which is an emulsifying agent, to the milk would aid in preventing a decrease in the test of composite samples, a comparison was made that involved the testing of 180 daily samples and day composite samples in which mercuric chloride and saponin were used with one set of samples and mercuric chloride alone with another set of samples. One No. 1 mercuric chloride tablet and 0.5 gram saponin were added to each bottle in the one set of samples and one No. 1 mercuric chloride tablet was added to each bottle in the other set of samples. When handled and tested by the Babcock method in accordance with the standardized procedure, it was found that the average test of the composite samples that contained saponin was lower than the average daily test, and the test of the composite samples that contained no saponin was lower. When tested by the Mojonnier method the average test of the composite samples that contained saponin was higher than the average daily test and the test of the composite samples that contained no saponin was lower. These results show that no material benefit was derived from the use of saponin for composite samples. In another comparison when 0.5 gram cholesterol was added to each sample at the beginning of the 15-day holding period, it was found that the samples that contained cholesterol were badly curdled at the end of the 15 days and could not be tested. The samples had been held at a temperature of 400 F. Comparison of the effect on the fat percentage of storing at 400 F. Preserved milk in rubber-stoppered 8-ounce sample bottles and in tightly stoppered 8-per-cent milk test bottles for periods of 7 and 14 days. Milk from the same lot was divided into 24 8-ounce sample bottles, using 6 ounces of milk for each bottle. Two No. 1 mercuric chloride tablets were added to each bottle. The milk was tempered to 70 F. After thorough mixing, by means of a 17.6 cc. pipette, milk from each bottle was transferred to two sets of 8-per-cent milk-test bottles. The sample bottles were closed by means of rubber stoppers and the test bottles by means of cork stoppers, tightly inserted. One-half of the sample bottles and one-half of the test bottles were Table 12. COMPARISON OF THE EFFECT ON THE FAT PERCENTAGE OF STORING AT 400 F. PRESERVED MILK IN RUBBER.STOPPERED 8-OUNCE SAMPLE BOTTLES AND IN CORK. STOPPERED 8-PER-CENT MILK TEST BOTTLES FOIl PERIODS OF 7 TO 14 DAYS. A glucoside, which occurs in soap bark. Average test Kept in Change from Change from Number of Days Fresh sample test of Kept in test of samples stored milk bottles fresh milk test bottles fresh milk Per cent Per cent Per cent Per cent Per cent Increase increase decrease
29 Per SAMPLING, PRESERVING, TESTING MILK 29 kept in a refrigerator maintained at a temperature of 400 F. for 7 days. The others were stored under the same conditions for 14 days. The samples were tested by the Babcock method at the end of each period. The results obtained are shown in Table 12. The difference obtained between the average of the fresh samples and the average of the preserved, stored samples was of no significance. The average fat percentages of the milk stored in sample bottles for 7 and 14 days and then tested were little different from those of the milk stored in rubber-stoppered 8-per-cent test bottles for the same periods. These results indicate that where relatively large differences in daily and composite samples are obtained such differences are due to difficulties and carelessness in sampling and storing samples rather than due to a loss of fat in properly stored samples. 2. VARIATIONS IN TESTING PROCEDURE Effect of varying the temperature of the milk at the time of pipetting on the fat test. The effect of measuring the charge of milk by the standard 17.6 cc. pipette for the test bottle at a temperature other than at 680 F. is shown in Table 13. Table 13. EFFECT OF TESOPERATURE WHEN PIPETTING MILK ON FAT PERCENTAGE. Average per cent of fat when milk pipetted at a temperature of Number of tests, each comparison 68 F. 80 F. 68 F F. 55 F. 120 F. Per cent Per cent I cent Per cent Per cent Per cent :458 Difference The data obtained show that the temperature at the time of pipetting the sample for the Babcock test is important. There was no measurable difference in the final fat test with a small difference of 12 (68 to 80 F.). There was a decrease in the test of 0.05 when the milk was measured at 100 F. instead of at 68 F. With a difference of 65 (55 to 120 F'.), there was a difference in the average test of The lowest test was obtained when the higher temperatures were used. This can be explained by referring to the coefficient of expansion of milk in accordance with its temperature. In accordance with the work done by the U. S. Bureau of Standards* when the volume of 4-per-cent milk at 68 F. is 1.0, it is at 50 F., at 80 F., at 90 F., at 100 F., at 110 F., and at 120 F. This is evidence to show the importance of using a temperature at the time of measuring the charge of milk that is strictly in accordance with that specified by law. Effect of a variation in the capacity of the graduated portion of milk test bottles on the fat percentage. The present Oregon lawt specifies 0 Bearce, H. W. Studies in the Expansion of Milk and Cream. Journal of Agricul. tural Research. Vol. III, No. 3, t Section and , Oregon Code, 1930.
 at any point in the graduated portion of the bottle neck. Some plant operators believe that more accurate bottles should be used.")

30 30 AGRICULTURAL EXPERIMENT STATION BULLETIN 383 that milk test bottles shall be tested for accuracy by Oregon State College and only those bottles can legally be used that do not vary more than 0.1 in the percentage (0.02 cc.) at any point in the graduated portion of the bottle neck. Some plant operators believe that more accurate bottles should be used. Of a total of 524 bottles examined, using the certified mercury-calibrating burette as previously described, it was found that 46 per cent of the bottles had a capacity of the graduated portion of from to cc. inclusive and 54 per cent contained from to cc. inclusive. The theoretically correct capacity of the graduated portion of the 8-per-cent milk-test bottle is cc. In order to find out how significant a variation in the content of the graduated portion might be in influencing the results obtained, two sets of bottles, 12 to a set, were selected for this test. In one set were placed the bottles that were found to contain in the graduated portion from to cc. inclusive. In the other set were placed the bottles that contained from to cc. inclusive. By means of a 17.6 cc. pipette, well-mixed milk from the same sample of fresh milk was pipetted into each bottle in the two sets. The testing was done in accordance with the standardized procedure and the fat columns were measured, using the reading lamp and a magnifying glass, by two different men reading independently of each other. The experiment was repeated, using a different sample of milk containing a higher percentage of fat. The results obtained are shown in Table 14. Table 14. EFFECT ON FAT TEST WHEN USING TEST BOTTLES OF VARYING CAPACITIES OF TIlE GRADUATED PoRTIoN. (Average test) Number Graduated poltion Graduated portion Difference in Comparison of tests to cc to cc. average test Per cent Per cent Per cent There was an average difference of in the percentage in the first comparison, and in the second comparison. The tests were the highest with the bottles of the smaller neck capacity. This checks fairly well with the theoretical computation. In order to determine if similar results could be obtained at another laboratory, the same test bottles were taken to the Central Testing Laboratory at Portland where the regular assistants made a similar comparison. The results obtained are shown in Table 15. Table is. EFFECT ON FAT TEST WHEN USING TEST BOTTLES OF VARYING CAPACITIES OF TIlE GRADUATED PORTION. TESTS MADE IN COMMERCIAL PRACTICE. (Average test) 2 Comparison Number Graduated portion Graduated portion Difference in of tests to cc to cc. average test Per cent Per cent Per cent


31 SAMPLING, PRESERVING, TESTING MILK 31 The measurements were made to the nearest 0.1 per cent. It will be noted that the results obtained at the two laboratories were substantially similar. (C). The use of sulphuric acid of unknown or incorrect strength in testing milk. Some operators of the Babcock test claim that it is possible to obtain accurate results when sulphuric acid of variable strength and temperature is used, provided the amount of acid added to the milk is varied to allow for the differences. This puts testing on a guess basis, and consistent and uniform results cannot be obtained. It was found in this study that if uniform, accurate results were to be obtained the strength and temperature of the acid should be properly standardized. In Figure 7 are shown tests obtained with acid that had not been standardized for strength and temperature, and tests obtained when the acid had been standardized to the right strength and the correct temperature. The use of too strong acid caused charring of the fat. Inaccurate results were obtained. 4I Figure 7. Results from using sulphuric acid of correct and incorrect strength. Left: Acid too strong. Rig/it: Acid correct strength, specific gravity A study was made of the sulphuric acid used by several dairy plants at Corvallis and in the dairy products laboratory at the College to determine the variation, if any, in the specific gravity and acid concentration (per cent HSSO) of the different lots. Six different lots of acid were examined. Differences were slight. The per cent acid by weight varied from to The theoretical specific gravity calculated from assaying ranged from to 1.838, while the specific gravity as determined by a hydrometer ranged from to (D). Effect of varying the speed of the centrifuge on the fat percentage. The Babcock centrifuge is usually one of three different types; namely, motor driven, steam driven, or hand operated. The correct numlfer of revolutions per minute that a centrifuge should make is dependent on the diameter of the wheel measured from the bottom of opposite cups when they are in an extended position. Variations from the correct speed may occur, however, either due to carelessness of the operator or to unavoidable causes, such as a sudden low steam pressure in the case of the steam turbine machine,
32 32 AGRICULTURAL EXPERIMENT STATION BULLETIN 383 voltage drop in the case of the electric machine, and belt slippage in the case of belt-driven machines. It was found by Babcock* that to obtain a maximum separation of fat it was necessary with a centrifuge wheel of a diameter of 18 inches to revolve this at seven or eight hundred revolutions per minute. The centrifugal force to which the contents of the test bottle were subjected was calculated to be 3065 pounds per square inch. On this basis the speeds at which centrifuge wheels of various diameters should revolve were calculated. Results obtained from the use of three different speeds in 12 determinations are shown in Table 16. The correct speed of the 20-inch wheel of the centrifuge used in this set of comparisons was, in accordance with the calculations, 759 revolutions per minute.t For convenience, 760 revolutions were used. Table 16. EFFECT OF VARYING THE SPEED OF A CENTRIFUGE 200 R.P.M. ABOvE AND BELOW THE SPECIFIED SPEED ON THE FAT PERCENTAGE OF THE SAME SAMPLE OF MILN. Comparison number Specified R.P.M standard (760) Per Cent fat R.P.M. 200 R.P.M. decrease from increase from standard standard (560) (960) Per cent fat Per Cent fat Average Difference It would appear from these data that the speed of the centrifuge is of extreme importance. A speed below that which is required for the diameter of centrifuge wheel had a very definite effect in lowering the fat percentage approximately 0.1 per cent. A speed above that required resulted in little difference from the normal. (E). Effect of varying the temperature of the air in the centrifuge during centrifuging on the final results. A number of Babcock centrifuges in milk plants are steam driven. Occasionally these machines become very hot during centrifuging. If, contrary to state law, the fat columns are measured immediately after the bottles are removed from the centrifuge without first tempering the bottles and contents in a water bath maintained at the correct temperature, incorrect results may be expected. The effect of this on the fat percentage was therefore investigated. In Table 17 are shown the results that were obtained when the readings of 24 tests from the same sample of milk were made with the fat at a temperature of 138 F. aqd at 180 F. An increase of in the average Farrington, E. H., and Woll, F. W. Testing Milk and Its Products, published by Mendota Book Company, Madison, Wisconsin. 26th ed., t See Methods of the Association of Official Agricultural Chemists.
33 0.010 SAMPLING, PRESERVING, TESTING MILK 33 test was obtained when the fat columns were measured at the higher temperature. Table 17. EFFECT OP TUE TEMPERATURE OF THE FAT TN MILK TEST &TTLES ON THE TEST ORTAINED. Results of tests read before and after tempering in 138 F. water bath Increase in test Read from tester Read from bath due to reading Number of at 180 F. at 1380 F. at too high tests (too high) (correct) temperature Average per Cent Average per cent (F). Effect of the temperature of the fat at the time of measuring the fat column on the fat percentage. This series of comparisons involved the following: 24 different samples of milk were tested, and the test bottles after centrifuging were placed in a water bath, with the water at a temperature of 150 F., for a period of 5 minutes. The fat columns were then measured by means of a pair of needle-pointed calipers, using the illuminated reading lamp equipped with a magnifying lens as previously described. The test bottles were returned to the water bath immediately after the fat columns were measured. After the 24 bottles had been returned to the bath, the temperature of the water was reduced to 140 F. The fat columns were then again measured. This was repeated with water-bath temperatures of 130, 120, and 110 F. The results obtained are shown in Table 18. Table 18. EFFECT OF THE WATER 0ATH TEMPERATURE ON THE FINAL FAT TEST. Number of tests 150 F. Average per cent fat when read from a bath maintained at Variation from test at 140 F i 140 F F. 120 F. 110 F Per cent fat Per cent fat Per cent fat Per cent fat Per Cent fat Since a temperature of from 130 to 140 F. is standard, a higher reading would be obtained with a temperature higher than this and a lower reading would be obtained at a temperature lower than this. (G). Effect of the length of time of holding completed tests in the water-tempering bath before measiiring on the fat percentage. The Oregon law specifies that the fat column shall be measured at from 130 to 140 F. and at no other temperature. Tempering the completed tests in a water bath for 5 minutes may be considered the minimum time. An observation was made to determine the influence of holding the test bottles in the water bath for 5 minutes and for 1 hour before reading. The results obtained are shown in Table 19.

34 34 AGRICULTURAL EXPERIMENT STATION BULLETIN 383 Table 19. EFFECT OF TIME OF TEMPERING THE FINISHED TESTS IN A WATER BATH ON THE FINAL FAT TEST Group Number of tests in each group Fat column measured after tempering at 138 F. for Five minutes Average per cent fat One hour Average Per cent fat It will be observed that the average test was practically identical whether the samples had been held for 5 minutes or for 1 hour before the fat column was measured. (H). Effect of adding water at a different temperature to test bottles after second centrifuging on the final fat percentage. When hot water at a temperature considerably higher than that used for tempering the finished tests in the water bath was used for adding to the test bottles before the last period of centrifuging, it was found that the fat column would be lowered from 1 to 1 inches in the neck of the bottles during the subsequent tempering in the water bath. A series of 128 comparisons was made at Corvallis and at Portland in order to determine the effect of this on the readings. The results are shown in Table 20. Table 20. EFFEcT OF THE TEMPERATURE OF THE WATER ADDED TO TEST BOTTLES AFTER THE SECOND CENTRIFUGING PERIOD ON THE FINAL TEST. BOTTLES EEPT IN WATER BATH AT 138 F. FOR 5 MINUTES BEFORE MEASURING THE FAT. Grotip 1 (Corvallis) 56 2 (Portland) 72 Downward migration of fat in necks (inches) Samples tested Average fat Average fat I test. Last test. Last Increase water added water added due to fat F F. migration Per cent fat Per cent fat Uitoi) (itolt) The results obtained when the high-temperature water was used were on an average slightly higher than when the lower-temperature water was used. It was observed that when the high-temperature water was used, the meniscus t the bottom of the fat column was more concave than when the lower-temperature water was used. This would in part account for the higher reading that was obtained with the former. (I). Effect of the addition of glymol to the surface of the fat column on the fat percentage. Because of the difficulty of locating the exact tipper point of the meniscus on the surface of the fat column in the milk-test
EQUIPMENT FOR MAKING BABCOCK TEST FOR FAT IN MILK
 }L~c ~ ~Babcock Test T HE for Fat in Mi~k By J. ~ JJ R Professor of Dairy Chemistry Research....,) ~ '( li: )..-djg's BABCOCK TEST is the most satisfactory and practical method for determining the percentage
OREGON AGRICULTURAL COLLEGE EXTENSION SERVICE. RALPH D. HETZEL, Director.
 College Bulletin No. 09. Issued Monthly. Extension Series VIII No. Entered as second class matter November 27 909 at the postoffice at Corvallis Oregon under the Act of July 6 894. BOYS' AND GIRLS' INDUSTRIAL
College Bulletin No. 90. Extension Series II. No. 3 Issued Monthly. OREGON AGRICULTURAL- COLLEGE EXTENSION SERVIC. Herd Record Keeping BY W. A.
 College Bulletin No. 90. Extension Series II. No. 3 Issued Monthly. OREGON AGRICULTURAL- COLLEGE EXTENSION SERVIC Herd Record Keeping BY W. A. BARR OCTOBER, 1913. The bulletins of the Oregon Agricultural
Buying Filberts On a Sample Basis
 E 55 m ^7q Buying Filberts On a Sample Basis Special Report 279 September 1969 Cooperative Extension Service c, 789/0 ite IP") 0, i mi 1910 S R e, `g,,ttsoliktill:torvti EARs srin ITQ, E,6
IC Chapter 2. Milk and Cream Purchases
 IC 15-18-2 Chapter 2. Milk and Cream Purchases IC 15-18-2-1 "Babcock test" Sec. 1. As used in this chapter, "Babcock test" means the official Babcock test for milk and for cream. IC 15-18-2-2 "Board" Sec.
Determination of Alcohol Content of Wine by Distillation followed by Density Determination by Hydrometry
 Sirromet Wines Pty Ltd 850-938 Mount Cotton Rd Mount Cotton Queensland Australia 4165 www.sirromet.com Courtesy of Jessica Ferguson Assistant Winemaker & Chemist Downloaded from seniorchem.com/eei.html
Effects of Preharvest Sprays of Maleic Hydrazide on Sugar Beets
 Effects of Preharvest Sprays of Maleic Hydrazide on Sugar Beets F. H. PETO 1 W. G. SMITH 2 AND F. R. LOW 3 A study of 20 years results from the Canadian Sugar Factories at Raymond, Alberta, (l) 4 shows
Mastering Measurements
 Food Explorations Lab I: Mastering Measurements STUDENT LAB INVESTIGATIONS Name: Lab Overview During this investigation, you will be asked to measure substances using household measurement tools and scientific
Variations in the Test of Separator Cream.
 Variations in the Test of Separator Cream. One of the greatest problems that has presented itself to the creamery patrons and managers of the West-Central states for the past few years is that of the cause
THE UNIVERSITY OF ILLINOIS - Q3QT7 LIBRARY
 no THE UNIVERSITY OF ILLINOIS - LIBRARY Q3QT7 r NON CIRCULATING CHECK FOR UNBOUND CIRCULA UNIVERSITY OF ILLINOIS. Agricultural Experiment Station, CHAMPAIGN, APRIL, 1894. BULLETIN NO. 32. AN ACID TEST
Chapter 4 Dough-making
 For your review, this is the first five pages of Chapter 4 of The Original Encyclopizza. To return to prior page, use your Back button. ~ To get more info on this book, go to: http://correllconcepts.com/encyclopizza/_home_encyclopizza.htm
EXPERIMENT NO. 3 HYDROMETER ANALYSIS ASTM D-422
 EXPERIMENT NO. 3 HYDROMETER ANALYSIS ASTM D-422 1. AIM To determine grain size distribution of soil, which contains appreciable quantity of soil passing ASTM 200 sieve ( 0.075 mm). 2. APPARATUS: Standard
FACTORS DETERMINING UNITED STATES IMPORTS OF COFFEE
 12 November 1953 FACTORS DETERMINING UNITED STATES IMPORTS OF COFFEE The present paper is the first in a series which will offer analyses of the factors that account for the imports into the United States
BLBS015-Conforti August 11, :35 LABORATORY 1. Measuring Techniques COPYRIGHTED MATERIAL
 LABORATORY 1 Measuring Techniques COPYRIGHTED MATERIAL 1 LABORATORY 1 Measuring Techniques Proper measuring techniques must be emphasized to ensure success in food preparation. There are differences when
TEMPERATURE CONDITIONS AND TOLERANCE OF AVOCADO FRUIT TISSUE
 California Avocado Society 1961 Yearbook 45: 87-92 TEMPERATURE CONDITIONS AND TOLERANCE OF AVOCADO FRUIT TISSUE C. A. Schroeder and Ernest Kay Professor of Botany. University of California, Los Angeles;
Washed agar gave such satisfactory results in the milk-powder. briefly the results of this work and to show the effect of washing
 THE USE OF WASHED AGAR IN CULTURE MEDIA S. HENRY AYERS, COURTLAND S. MUDGE, AND PHILIP RUPP From the Research Laboratories of the Dairy Division, United States Department of Agriculture Received for publication
ALBINISM AND ABNORMAL DEVELOPMENT OF AVOCADO SEEDLINGS 1
 California Avocado Society 1956 Yearbook 40: 156-164 ALBINISM AND ABNORMAL DEVELOPMENT OF AVOCADO SEEDLINGS 1 J. M. Wallace and R. J. Drake J. M. Wallace Is Pathologist and R. J. Drake is Principle Laboratory
Testing Milk and Cream
 Circular (Iowa State College. Agricultural Experiment Station) Iowa Agricultural and Home Economics Experiment Station Publications 12-1916 Testing Milk and Cream M. R. Tolstrup Iowa State College M. Mortensen
Milk Treatments. Lecture 3 English Mustafa M. Kadhim
 Milk Treatments Pasteurization Along with correct cooling, the pasteurization of milk is one of the most important processes in the treatment of milk. If carried out correctly, these processes will supply
Whether to Manufacture
 Whether to Manufacture Butter and Powder or Cheese A Western Regional Research Publication Glen T. Nelson Station Bulletin 546 November 1954 S S De&dim9 S Whether to Manufacture Butterand Powder... or
Royal Society of Chemistry Analytical Division East Anglia Region National Schools' Analyst Competition
 Royal Society of Chemistry Analytical Division East Anglia Region 2017 National Schools' Analyst Competition East Anglia Region Heat Thursday 20th April, 2017 School of Chemistry University of East Anglia
Processing of Pasteurized Market Milk
 Processing of Pasteurized Market Milk Depending on legislations and regulations, the design of the process line for pasteurized market milk varies a great deal from country to country and even from dairy
GEORGIA DEPARTMENT OF CORRECTIONS Standard Operating Procedures. Policy Number: Effective Date: 2/9/2018 Page Number: 1 of 5
 Policy Number: 409.04.04 Effective Date: 2/9/2018 Page Number: 1 of 5 I. Introduction and Summary: To establish and outline portion control methods for implementation at all Georgia Department of Corrections
Preparing & Holding Cold Foods Review
 Preparing & Holding Cold Foods Review Time-Temperature Control 1. Whether storing or serving cold foods, it is important to always keep a close eye on the food s internal temperature. Just like hot foods,
Analysis of Beta-Carotene and Total Carotenoids from Pacific Sea Plasma (Spectrophotometric Method)
") Analysis of Beta-Carotene and Total Carotenoids from Pacific Sea Plasma (Spectrophotometric Method) Background: Spirulina has several carotenoids, the major components being β-carotene, zeaxanthin, echinenone,
Analysis of Beta-Carotene and Total Carotenoids from Pacific Sea Plasma (Spectrophotometric Method) Background: Spirulina has several carotenoids, the major components being β-carotene, zeaxanthin, echinenone,
Grooving Tool: used to cut the soil in the liquid limit device cup and conforming to the critical dimensions shown in AASHTO T 89 Figure 1.
 DETERMINING THE LIQUID LIMIT OF SOILS FOP FOR AASHTO T 89 Scope This procedure covers the determination of the liquid limit of a soil in accordance with AASHTO T 89-13. It is used in conjunction with the
Peanut Meal as a Protein. Fattening Hogs in the Dry Lot. Supplement to Corn for AGRICULTURAL EXPERIMENT STATION ALABAMA POLYTECHNIC INSTITUTE
 BULLETIN No. 224 AUGUST, 1924 Peanut Meal as a Protein Supplement to Corn for Fattening Hogs in the Dry Lot By J. C. GRIMES AND W. D. SALMON AGRICULTURAL EXPERIMENT STATION of the ALABAMA POLYTECHNIC INSTITUTE
SOURCES OF THE FLAVOR IN BUTTER
 July, 1921 Research Bulletin No. 67 SOURCES OF THE FLAVOR IN BUTTER BY B. W. HAMMER AGRICULTURAL EXPERIMENT STATION IOWA STATE COLLEGE OF AGRICUL'l'URE AND MECHANIC ARTS DAIRY SECTION AMES, IOWA THE SOURCES
Effects of Ground Ear Corn vs. Ear Corn Silage on Rumen Fatty Acid Content
 RESEARCH CIRCULAR 183 NOVEMBER 1970 Effects of Ground Ear Corn vs. Ear Corn Silage on Rumen Fatty Acid Content A. D. PRATT H. R. CONRAD OHIO AGRICULTURAL RESEARCH AND DEVELOPMENT CENTER WOOSTER, OHIO CONTENTS
THE EFFECTS OF FINAL MOLASSES AND SUGAR PURITY VALUES ON THE CALCULATION OF 96 0 SUGAR AND FACTORY RECOVERY INDEX. Heera Singh
 THE EFFECTS OF FINAL MOLASSES AND SUGAR PURITY VALUES ON THE CALCULATION OF 96 0 SUGAR AND FACTORY RECOVERY INDEX BY Heera Singh Worthy Park Estate Ltd. INTRODUCTION The objective of this paper is not
FOR PERSONAL USE. Capacity BROWARD COUNTY ELEMENTARY SCIENCE BENCHMARK PLAN ACTIVITY ASSESSMENT OPPORTUNITIES. Grade 3 Quarter 1 Activity 2
 activity 2 Capacity BROWARD COUNTY ELEMENTARY SCIENCE BENCHMARK PLAN Grade 3 Quarter 1 Activity 2 SC.A.1.2.1 The student determines that the properties of materials (e.g., density and volume) can be compared
Department: DOC#: 1 REV: Effective Date: Supersedes: Subject: Blue Cheese from Pasteurized Milk
 Department: DOC#: 1 REV: Effective Date: Supersedes: Subject: Blue Cheese from Pasteurized Milk Issued by: Approved by: Plant Number: 1.0 PURPOSE To establish fixed procedures to be followed during the
ASSEMBLY, No. 502 STATE OF NEW JERSEY. 218th LEGISLATURE PRE-FILED FOR INTRODUCTION IN THE 2018 SESSION
 ASSEMBLY, No. 0 STATE OF NEW JERSEY th LEGISLATURE PRE-FILED FOR INTRODUCTION IN THE 0 SESSION Sponsored by: Assemblyman JOHN DIMAIO District (Hunterdon, Somerset and Warren) Co-Sponsored by: Assemblymen
QUALITY DESCRIPTOR / REPRESENTATIONS GUIDELINES FOR THE
 QUALITY DESCRIPTOR / REPRESENTATIONS GUIDELINES FOR THE AUSTRALIAN FRUIT JUICE INDUSTRY Adopted 30 September 2005 Reviewed 12 January 2007 CODE OF PRACTICE QUALITY DESCRIPTOR/REPRESENTATIONS GUIDELINES
Draught System Troubleshooting & Reference Manual
 Draught System Troubleshooting & Reference Manual BeerTech.ca Parts Of A Basic System Beer Line Keg Coupler High Pressure Gauge Regulator Low Pressure Gauge Regulator Coupling Nut Drum Valve Set Screw
SAN JOAQUIN VALLEY UNIFIED AIR POLLUTION CONTROL DISTRICT COMPLIANCE DEPARTMENT COM 2293
 SAN JOAQUIN VALLEY UNIFIED AIR POLLUTION CONTROL DISTRICT COMPLIANCE DEPARTMENT COM 2293 APPROVED: DATE: April 3, 2012 Morgan Lambert Director of Compliance TITLE: SUBJECT: RULE 4694 WINERY FERMENTATION
CORRELATIONS BETWEEN CUTICLE WAX AND OIL IN AVOCADOS
 California Avocado Society 1966 Yearbook 50: 121-127 CORRELATIONS BETWEEN CUTICLE WAX AND OIL IN AVOCADOS Louis C. Erickson and Gerald G. Porter Cuticle wax, or bloom, is the waxy material which may be
CREAM-BUYING STATION. Operation ofthe UNIVERSITY OF ILLINOIS. Agricultural Experiment Station and Extension Service in Agriculture and Home Economics
 Operation ofthe CREAM-BUYING STATION BY H.A.RUEHE Circular 487 UNIVERSITY OF ILLINOIS COLLEGE OF AGRICULTURE Agricultural Experiment Station and Extension Service in Agriculture and Home Economics CONTENTS
Ti-Pure TITANIUM DIOXIDE DETERMINATION OF UNBRUSHED 325 MESH GRIT, SLURRY METHOD: T
 Ti-Pure TITANIUM DIOXIDE DETERMINATION OF UNBRUSHED 325 MESH GRIT, SLURRY METHOD: T4400.300.01 DuPont Titanium Technologies Page 2 of 5 1. Principle A slurry sample of known percent solids is diluted with
Please be sure to save a copy of this activity to your computer!
 Thank you for your purchase Please be sure to save a copy of this activity to your computer! This activity is copyrighted by AIMS Education Foundation. All rights reserved. No part of this work may be
ACIDITY OF BUTTER AND ITS BY-PRODUCTS F. W. BOUSKA
 ACIDITY OF BUTTER AND ITS BY-PRODUCTS F. W. BOUSKA 8uperi~cndent of Manufacturing, Be~,trice Creamery Company, Chicago, Illinois Received for publication December 11, 1922 From the very be~nning of the
UNITED STATES STANDARDS FOR WHOLE DRY PEAS¹
 UNITED STATES STANDARDS FOR WHOLE DRY PEAS¹ Terms Defined 401 Definition of whole dry peas. Threshed seeds of the garden type pea plant (Pisum sativum L. and Pisum sativum var. arvense (L.) Poir.), which
COLORADO REVISED STATUTES, TITLE 35, AGRICULTURE
 COLORADO REVISED STATUTES, TITLE 35, AGRICULTURE ARTICLE 29.5: COLORADO WINE INDUSTRY DEVELOPMENT ACT Section 35-29.5-101. Short title. 35-29.5-101.5. Legislative declaration. 35-29.5-102. Definitions.
UPPER MIDWEST MARKETING AREA THE BUTTER MARKET AND BEYOND
 UPPER MIDWEST MARKETING AREA THE BUTTER MARKET 1987-2000 AND BEYOND STAFF PAPER 00-01 Prepared by: Henry H. Schaefer July 2000 Federal Milk Market Administrator s Office 4570 West 77th Street Suite 210
Overview. Hydrometer Selection. About Specific Gravity. Conditions Affecting Hydrometer Accuracy
 2 Hydrometer Selection Specific Gravity (Pg. 4) Precision (Pg. 4) Tall Form High Precision (Pg. 4) Short Form High Precision (Pg. 4) Broad (Pg. 5) Baume (Pg. 5) Narrow (Pg. 5) Broad (Pg. 5) Dual Scale
INFLUENCE OF ENVIRONMENT - Wine evaporation from barrels By Richard M. Blazer, Enologist Sterling Vineyards Calistoga, CA
 INFLUENCE OF ENVIRONMENT - Wine evaporation from barrels By Richard M. Blazer, Enologist Sterling Vineyards Calistoga, CA Sterling Vineyards stores barrels of wine in both an air-conditioned, unheated,
GRAIN INSPECTION, PACKERS AND STOCKYARDS CHAPTER 3 ADMINISTRATION FEDERAL GRAIN INSPECTION SERVICE STOP 3630 WASHINGTON, D.C.
 U.S. DEPARTMENT OF AGRICULTURE AFLATOXIN HANDBOOK GRAIN INSPECTION, PACKERS AND STOCKYARDS CHAPTER 3 ADMINISTRATION 3-17-03 FEDERAL GRAIN INSPECTION SERVICE STOP 3630 WASHINGTON, D.C. 20090-3630 CHAPTER
#611 ON-SITE TESTING AND EVALUATION
 OBJECTIVES: After completing this chapter, you will be able to... Discuss the purpose of a percolation test. List the regulatory requirements for conducting a percolation test. Revised 01-02-2013 MEETING
PERMIT APPLICATION FOR MOBILE/EXTENDED FOOD SERVICE UNITS PERMIT APPLICATION FOR
 PERMIT APPLICATION FOR Page 1 of 6 Revised 11/13/2015 New Application A new Mobile/Extended Base of Operation requires a separate Food Service Application Change of Ownership A new Mobile/Extended Base
HI-1017: Pharmacy Technician. Module 10 Pharmacy Equipment
 HI-1017: Pharmacy Technician Module 10 Pharmacy Equipment Slide 1 Main Objectives Types of Pharmacy Equipment Slide 2 Types of Pharmacy Equipment The Four Step Process Class a Prescription Balance Weighing
AWRI Refrigeration Demand Calculator
 AWRI Refrigeration Demand Calculator Resources and expertise are readily available to wine producers to manage efficient refrigeration supply and plant capacity. However, efficient management of winery
GB Translated English of Chinese Standard: GB NATIONAL STANDARD
 Translated English of Chinese Standard: GB5009.6-2016 www.chinesestandard.net Sales@ChineseStandard.net GB NATIONAL STANDARD OF THE PEOPLE S REPUBLIC OF CHINA GB 5009.6-2016 National food safety standard
Dispensing Techniques
 Dispensing Techniques Compounding and Good Practice Compounding (Extemporaneous Dispensing) Definition: A small-scale manufacture of medicines from basic ingredients in the community or in hospital pharmacy
GEORGIA DEPARTMENT OF CORRECTIONS Standard Operating Procedures
 Policy Number: 409.04.31 Effective Date: 10/24/17 Page Number: 1 of 7 I. Introduction and Summary: It is the policy of the Food and Farm Services Subdivision to establish and outline standard operating
DEMONSTRATION OF THE LIFTING POWER OF EVAPORATION.
 DEMONSTRATION OF THE LIFTING POWER OF EVAPORATION. HIRAM P. THUT,. Ohio State University. The lifting power of evaporation and the liquid tension present in water are two important forces in the transpiration
COMPARISON OF CORE AND PEEL SAMPLING METHODS FOR DRY MATTER MEASUREMENT IN HASS AVOCADO FRUIT
 New Zealand Avocado Growers' Association Annual Research Report 2004. 4:36 46. COMPARISON OF CORE AND PEEL SAMPLING METHODS FOR DRY MATTER MEASUREMENT IN HASS AVOCADO FRUIT J. MANDEMAKER H. A. PAK T. A.
Chemistry 212 MOLAR MASS OF A VOLATILE LIQUID USING THE IDEAL GAS LAW
 Chemistry 212 MOLAR MASS OF A VOLATILE LIQUID USING THE IDEAL GAS LAW To study the Ideal Gas Law. LEARNING OBJECTIVES To determine the molar mass of a volatile liquid. BACKGROUND The most common instrument
SCHEME OF TESTING AND INSPECTION FOR CERTIFICATION OF TABLE WINES ACCORDING TO IS 7058:2005 (Second Revision)
") SCHEME OF TESTING AND INSPECTION FOR CERTIFICATION OF TABLE WINES ACCORDING TO IS 7058:2005 (Second Revision) 1. LABORATORY- A laboratory shall be maintained which shall be suitably equipped and staffed
SCHEME OF TESTING AND INSPECTION FOR CERTIFICATION OF TABLE WINES ACCORDING TO IS 7058:2005 (Second Revision) 1. LABORATORY- A laboratory shall be maintained which shall be suitably equipped and staffed
Coffee-and-Cream Science Jim Nelson
 SCIENCE EXPERIMENTS ON FILE Revised Edition 5.11-1 Coffee-and-Cream Science Jim Nelson Topic Newton s law of cooling Time 1 hour! Safety Please click on the safety icon to view the safety precautions.
Practical 1 - Determination of Quinine in Tonic Water
 Practical 1 - Determination of Quinine in Tonic Water Introduction Quinine has a fluorescence and a UV absorbance and so can be quantified using either of these. In the method described here the absorbances
U. S. DEPARTMENT OF AGRICULTURE FOREST SERVICE FOREST PRODUCTS LABORATORY MADlSON, WIS. In Cooperation with the University of Wisconsin
 U. S. DEPARTMENT OF AGRICULTURE FOREST SERVICE FOREST PRODUCTS LABORATORY MADlSON, WIS. In Cooperation with the University of Wisconsin U. S. FOREST SERVICE RESEARCH NOTE FPL-0120 February 1966 PRESERVATION
Food Science and Technology Notes
 Food Science and Technology Notes Extension Division Deportment of Food ScienceandTechnology Virginia Polytechnic Institute Blacksburg, Virginia SEP - - 197~ HOMEMADE CULTURED MILK PRODUCTS by P. M. Large,
United States Standards for Grades of Walnuts (Juglans regia) in the Shell
 in the Shell") United States Department of Agriculture Agricultural Marketing Service Fruit and Vegetable Division Fresh Products Branch United States Standards for Grades of Walnuts (Juglans regia) in the Shell Effective
United States Department of Agriculture Agricultural Marketing Service Fruit and Vegetable Division Fresh Products Branch United States Standards for Grades of Walnuts (Juglans regia) in the Shell Effective
Product Consistency Comparison Study: Continuous Mixing & Batch Mixing
 July 2015 Product Consistency Comparison Study: Continuous Mixing & Batch Mixing By: Jim G. Warren Vice President, Exact Mixing Baked snack production lines require mixing systems that can match the throughput
SUBCHAPTER 4E - ALCOHOLIC BEVERAGES TAX SECTION LICENSES
 SUBCHAPTER 4E - ALCOHOLIC BEVERAGES TAX SECTION.0100 - LICENSES 17 NCAC 04E.0101 PERMIT REQUIRED TO OBTAIN LICENSE History Note: Authority G.S. 105-113.69; 105-113.102; 17 NCAC 04E.0102 APPLICATION FOR
AGRICULTURAL EXPERIMENT STATION Oregon State College Uta. A. Schoenfeld, Director Corvallis. Circular of Information No.
 AGRICULTURAL EXPERIMENT STATION Oregon State College Uta. A. Schoenfeld, Director Corvallis Circular of Information No. 341 May 1944 YOUTH LABOR EFFICIENCY IN HARVESTING SWEET CHERRIES WILLAMETTE VALLEY,
Which of your fingernails comes closest to 1 cm in width? What is the length between your thumb tip and extended index finger tip? If no, why not?
 wrong 0 1 2 3 4 5 6 7 8 9 10 11 12 13 14 15 16 17 right 66 65 64 63 62 61 60 59 58 57 56 55 54 53 52 51 50 49 score 100 98.5 97.0 95.5 93.9 92.4 90.9 89.4 87.9 86.4 84.8 83.3 81.8 80.3 78.8 77.3 75.8 74.2
How to Build a Wine Cellar
 How to Build a Wine Cellar Introduction This guide has been prepared as a general resource to help you build your own wine cellar. The information provided here has been gathered over the course of our
SOLUTIONS IN BRIX MEASUREMENT
 SOLUTIONS IN BRIX MEASUREMENT APPLICATIONS OF DT301-TOUCHÉ IN SUGAR & ALCOHOL INDUSTRIES I ABSTRACT: Based on the success of the product, concentration and density transmitter SMAR, DT301- Touché, close
DEPARTMENT OF LICENSING AND REGULATORY AFFAIRS LIQUOR CONTROL COMMISSION BEER
 DEPARTMENT OF LICENSING AND REGULATORY AFFAIRS LIQUOR CONTROL COMMISSION BEER (By authority conferred on the liquor control commission by section 215(1) of 1998 PA 58, MCL 436.1215(1), and Executive Reorganization
Retailing Frozen Foods
 61 Retailing Frozen Foods G. B. Davis Agricultural Experiment Station Oregon State College Corvallis Circular of Information 562 September 1956 iling Frozen Foods in Portland, Oregon G. B. DAVIS, Associate
7. LOCALIZATION OF FRUIT ON THE TREE, BRANCH GIRDLING AND FRUIT THINNING
 The Division of Subtropical Agriculture. The Volcani Institute of Agricultural Research 1960-1969. Section B. Avocado. Pg 60-68. 7. LOCALIZATION OF FRUIT ON THE TREE, BRANCH GIRDLING AND FRUIT THINNING
5KEK1322 W A_v08.indd 1 5/13/16 2:25 PM
 5KEK1322 W10878653A_v08.indd 1 PARTS AND FEATURES PARTS AND ACCESSORIES Tea steeper lid (center section of lid with handle) Kettle lid (outer section) Stainless steel lime scale filter Removable stainless
Biologist at Work! Experiment: Width across knuckles of: left hand. cm... right hand. cm. Analysis: Decision: /13 cm. Name
 wrong 0 1 2 3 4 5 6 7 8 9 10 11 12 13 14 15 16 17 18 19 20 right 72 71 70 69 68 67 66 65 64 63 62 61 60 59 58 57 56 55 54 53 52 score 100 98.6 97.2 95.8 94.4 93.1 91.7 90.3 88.9 87.5 86.1 84.7 83.3 81.9
A New Approach for Smoothing Soil Grain Size Curve Determined by Hydrometer
 International Journal of Geosciences, 2013, 4, 1285-1291 Published Online November 2013 (http://www.scirp.org/journal/ijg) http://dx.doi.org/10.4236/ijg.2013.49123 A New Approach for Smoothing Soil Grain
CAFFE. CAPPUCCINO. AUTOCAPPUCCINO!
 CAFFE. CAPPUCCINO. AUTOCAPPUCCINO! 03 A COMPLETELY AUTOMATIC BUILT-IN COFFEE MACHINE UNIQUE AUTO- CAPPUCCINO FUNCTION A PALETTE OF COFFEE FLAVOURS SETT I N G P E R S O N A L C O F F E E M A K I N G PROGRAMMES
Prepare and serve wines. unit 614
 unit 614 Prepare and serve wines There s a lot more to serving wine than simply taking the cork out of the bottle and filling up the glass. This unit will help guide you through what you need to know and
Name: Hour: Review: 1. What are the three elements that you need to measure to guarantee a successful recipe?
 #302600 Name: Hour: VIDEO WORKSHEET Review: After watching Kitchen Math: Measuring, answer the following review questions. 1. What are the three elements that you need to measure to guarantee a successful
D Lemmer and FJ Kruger
 D Lemmer and FJ Kruger Lowveld Postharvest Services, PO Box 4001, Nelspruit 1200, SOUTH AFRICA E-mail: fjkruger58@gmail.com ABSTRACT This project aims to develop suitable storage and ripening regimes for
Category for 2018 is Chardonnay
 8 ENTRY FORM 2018 Category for 2018 is Chardonnay OBJECTIVE The aim of the annual Diners Club Winemaker of the Year Award is to encourage winemakers in South Africa to produce fine wine of ever-increasing
Comparative determination of glycosides in senna by using different methods of extraction (Soxhlet, maceration and ultrasonic bath)
") 1 Experiment 1, 2 and 3 Comparative determination of glycosides in senna by using different methods of extraction (Soxhlet, maceration and ultrasonic bath) Aim: determine the yield among different extraction
1 Experiment 1, 2 and 3 Comparative determination of glycosides in senna by using different methods of extraction (Soxhlet, maceration and ultrasonic bath) Aim: determine the yield among different extraction
Measure the specific heat of lead. Identify an unknown metal from its specific heat (optional),
,") Text reference: Sections 10.2, 10.3 On a sunny day, the water in a swimming pool may warm up a degree or two while the concrete around the pool may become too hot to walk on in your bare feet. This may
Text reference: Sections 10.2, 10.3 On a sunny day, the water in a swimming pool may warm up a degree or two while the concrete around the pool may become too hot to walk on in your bare feet. This may
COMMISSION DIRECTIVE 2009/122/EC
 L 242/14 Official Journal of the European Union 15.9.2009 COMMISSION DIRECTIVE 2009/122/EC of 14 September 2009 amending, for the purposes of its adaptation to technical progress, Annex II to Directive
GEORGIA DEPARTMENT OF CORRECTIONS Standard Operating Procedures. Policy Number: Effective Date: 1/16/2018 Page Number: 1 of 6
 Policy Number: 409.04.03 Effective Date: 1/16/2018 Page Number: 1 of 6 I. Introduction and Summary: A. All Food Service Directors, Managers, and Supervisors of Georgia Department of Corrections (GDC) State
Introduction to Measurement and Error Analysis: Measuring the Density of a Solution
 Introduction to Measurement and Error Analysis: Measuring the Density of a Solution Introduction: Most of us are familiar with the refreshing soft drink Coca-Cola, commonly known as Coke. The formula for
The Weights and Measures (Specified Quantities) (Unwrapped Bread and Intoxicating Liquor) Order 2011
 (Unwrapped Bread and Intoxicating Liquor) Order 2011") The Weights and Measures (Specified Quantities) (Unwrapped Bread and Intoxicating Liquor) Order 2011 Guidance for Businesses July 2011 Version 1 Page 1 of 7 Guidance first issued/ Date of change July 2011
The Weights and Measures (Specified Quantities) (Unwrapped Bread and Intoxicating Liquor) Order 2011 Guidance for Businesses July 2011 Version 1 Page 1 of 7 Guidance first issued/ Date of change July 2011
Re: LCBO Lightweight Glass Wine Standard Implementation Date
 June 21, 2012 To: All Trade Associations Re: LCBO Lightweight Glass Wine Standard Implementation Date Further to my letter dated June 1st, 2011, I am writing to remind industry representatives that the
IPPA SAG method revision 0,
 IPPA SAG method revision 0, 23.01.2017 This procedure is based on the method described by Cox and Higby, in Food Inds., 16, 441 (1944) and Joseph and Baier, Food Technol. 3, 18 (1949) and is a modification
STANDARD FOR CANNED CHESTNUTS AND CANNED CHESTNUT PUREE CODEX STAN Adopted in Amendment: 2015.
 STANDARD FOR CANNED CHESTNUTS AND CANNED CHESTNUT PUREE CODEX STAN 145-1985 Adopted in 1985. Amendment: 2015. CODEX STAN 145-1985 2 1. DESCRIPTION 1.1 Product Definition 1.1.1 Canned chestnuts is the product
CODEX STANDARD FOR CANNED APRICOTS CODEX STAN
 CODEX STAN 129 Page 1 of 9 CODEX STANDARD FOR CANNED APRICOTS CODEX STAN 129-1981 1. DESCRIPTION 1.1 Product Definition Canned apricots is the product (a) prepared from stemmed, fresh or frozen or previously
Harvesting and Packing Peaches
 BULLETIN OF THE Agricultural and Mechallical College of Texas (In co-operation with the United States Department of Agriculture.) MAY, 116 EXTENSION SERVICE No. -22 Harvesting and Packing Peaches Fig.
VAPOR-HEAT TREATMENT FOR FRUITS AND VEGETABLES GROWN IN HAWAII
 HAWAII AGRICULTURAL EXPERIMENT STATION of the UNIVERSITY OF HAWAll CIRCULAR N0. 16 VAPOR-HEAT TREATMENT FOR FRUITS AND VEGETABLES GROWN IN HAWAII by WINSTON W. JoNES, Assistant Horticulturist HONOLULU,
LAB: One Tube Reaction Part 1
 AP Chemistry LAB: One Tube Reaction Part 1 Objective: To monitor and document the chemical changes occurring in a single test tube containing a predetermined mixture of chemicals. Materials: test tube,
Further investigations into the rind lesion problems experienced with the Pinkerton cultivar
 Further investigations into the rind lesion problems experienced with the Pinkerton cultivar FJ Kruger and SD Mhlophe Agricultural Research Council Institute for Tropical and Subtropical Crops Private
CHAPTER 2 ANNUAL RETAIL FOOD PRICE MOVEMENTS
 Part 3 2.1 Introduction CHAPTER 2 ANNUAL RETAIL FOOD PRICE MOVEMENTS The Institute for Planning Research, a research institute attached to the University of Port Elizabeth started a longitudinal research
The Separation of a Mixture into Pure Substances
 The Separation of a Mixture into Pure Substances The experiment is designed to familiarize you with some standard chemical techniques and to encourage careful work in separating and weighing chemicals.
Thermal Properties and Temperature
 Thermal Properties and Temperature Question Paper 1 Level IGCSE Subject Physics Exam Board CIE Topic Thermal Physics Sub-Topic Thermal Properties and Temperature Paper Type Alternative to Practical Booklet
AGRICULTUR \L EX^ERIJT.NT STATION Oregon State College Wm. A. Gchoenfeldj Director Corvallis. Circular of Information No.
 AGRICULTUR \L EX^ERIJT.NT STATION Oregon State College Wm. A. Gchoenfeldj Director Corvallis Circular of Information No. 334- March 19AA VEGETABLE SEED TRMTKENTS RECOMMENDED FOR OREGON FQR 1944-* By Frank
HOUSE BILL No As Amended by House Committee
 Session of 0 As Amended by House Committee HOUSE BILL No. By Committee on Commerce, Labor and Economic Development - 0 0 0 AN ACT concerning alcoholic beverages; relating to producer permits licenses;
EFFECT OF TOMATO GENETIC VARIATION ON LYE PEELING EFFICACY TOMATO SOLUTIONS JIM AND ADAM DICK SUMMARY
 EFFECT OF TOMATO GENETIC VARIATION ON LYE PEELING EFFICACY TOMATO SOLUTIONS JIM AND ADAM DICK 2013 SUMMARY Several breeding lines and hybrids were peeled in an 18% lye solution using an exposure time of