2010 CRop QUAlitY RepoRt. The world s most reliable choice.
|
|
|
- Eugenia Taylor
- 5 years ago
- Views:
Transcription


1 CRop QUAlitY RepoRt The world s most reliable choice.


2 PLANTING AND HARVEST DATES WHEAt HRW Planting HRW Harvest HRS Planting HRS Harvest HW Planting HW Harvest Durum Planting Durum Harvest SW Planting SW Harvest SRW Planting SRW Harvest JAN FEB MAr APr MAY JUN JUL AUG U.S. wheat...the world s most reliable choice sep Oct NOv dec PLANtING HArvEst U.s. Wheat Associates is funded by the U.s. department of Agriculture, Foreign Agricultural service, and by wheat producers through the following member organizations: Arizona Grain research and Promotion council Nebraska Wheat Board Arkansas Wheat Promotion Board Ohio small Grains Marketing Program california Wheat commission North dakota Wheat commission colorado Wheat Administrative committee Oklahoma Wheat commission Idaho Wheat commission south dakota Wheat commission Kansas Wheat commission texas Wheat Producers Board Maryland Grain Producers Utilization Board virginia small Grains Board Minnesota Wheat research and Promotion council Montana Wheat and Barley committee Oregon Wheat commission Washington Grain commission HARD RED SPRING SofT RED WINTER DuRum Medium to high protein, medium hard endosperm, red bran, medium gluten content and mellow gluten. Used in pan breads, Asian noodles, hard rolls, flatbreads and general-purpose flour. Highest protein content, hard endosperm, red bran, strong gluten, high water absorption. Used in pan breads, hearth breads, rolls, croissants, bagels, hamburger buns, pizza crust and for blending. Low protein content, soft endosperm, red bran, weak gluten. Used in pastries, cakes, cookies, crackers, pretzels, and flat breads. can also be used for blending. Hardest of all wheats, high protein content, yellow endosperm, white bran. Used to make pasta, couscous, and some Mediterranean breads. HARD WHITE SofT WHITE Wyoming Wheat Marketing commission U.S. Wheat Associates (USW) is the industry s market development organization working in 9 countries on behalf of America s wheat producers. the activities of U.S. Wheat Associates are made possible by producer checkoff dollars managed by 19 state wheat commissions and through cost-share funding provided by USDA s foreign Agricultural Service. for more information, visit Nondiscrimination and Alternate Means of Communications Statement U.S. Wheat Associates prohibits discrimination in all its programs and activities on the basis of race, color, religion, national origin, gender, marital or family status, age, disability, political beliefs or sexual orientation. persons with disabilities who require alternative means for communication of program information (Braille, large print, audiotape, etc.) should contact U.S. Wheat Associates at (tdd/tty , or from outside the U.S ). to file a complaint of discrimination, write to Vice president of finance, U.S. Wheat Associates, 33 th Street, North, Arlington, VA 221, or call U.S. Wheat Associates is an equal opportunity provider and employer. U.S. Wheat Associates. All rights reserved. the U.S. Wheat Associates logo is a registered service mark of U.S. Wheat Associates. HARD RED WINTER Medium to high protein content, hard endosperm, white bran. Used in Asian noodles, whole wheat or high extraction flour applications, pan breads and flat breads. Low protein, low moisture wheat. soft endosperm, white bran, weak gluten. Used in pastries, cakes, biscuits, crackers, flat breads, Asianstyle noodles and snack foods.

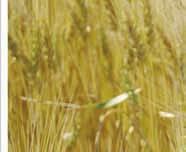
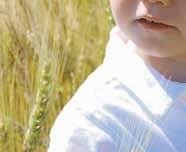
3 TABLE OF CONTENTS Crop Quality Report Overview. 4 US Production, Supply and Demand. 5 What the Tests Mean. 6 Hard Red Winter. 9 Hard Red Spring. 16 Hard White. 23 Durum. 27 Soft White. 31 Soft Red Winter. 36 Analysis Methods. Wheat Grades and Grade Requirements. 42 ON THE COVER: Jhett Davis gets a close look at what promises to be a high-quality wheat crop for his grandfather Ken Davis of Grandview, Texas. (Photo by Laura Davis)


4 CROP QUALITY REPORT OVERVIEW Greetings! U.S. Wheat Associates is pleased to present this Crop Quality Report featuring data for all six classes of U.S. wheat harvested in. The wheat growers we represent have produced another abundant, high-quality crop. That is fortunate given the swift supply shock sparked by the drought and government intervention in Russia a few months ago, and it proves once again that U.S. wheat is the world s most reliable choice. We also strive for transparency, symbolized in part by this Crop Quality Report. Wheat producers and the U.S. government provide the money used to test, analyze and publish the complete picture of each year s crop. You can be confident in the data and our professional staff will help you take advantage of any opportunities or manage any issues that emerge. The price of U.S. wheat is also available to all buyers at all times, and a weekly summary is available on our website at Today, the unprecedented increases that followed the events in the Black Sea region have eased. That is why we can say with confidence that when you consider both price and the new crop s potential revealed in this data, the landed-cost value of U.S. wheat remains high. We will be pleased to work with you to capture that value for your company. We look forward to sharing this information with the world s wheat buyers, millers, bakers, and food processors. On behalf of our producers, our 19 state wheat commission members, and the U.S. Department of Agriculture s Foreign Agricultural Service, thank you for choosing U.S. wheat. Sincerely, SUMMARY OF CLASSES 4 Alan Tracy, President U.S. Wheat Associates Hard Red Winter Hard Red Spring Durum* Soft White Soft Red Winter 5-Year 5-Year 5-Year 5-Year 5-Year Avg Avg Avg Avg Avg Test Weight (lb/bu) (kg/hl) Grade 1 HRW 1 HRW 1 NS 1 NS 1 HAD 1 HAD 2 SW 2 SW 3 SRW 2 SRW Dockage (%) Wheat Moisture (%) Wheat Protein (%) ** Wheat Ash (%) ** Kernel Weight (g) Wheat Falling Number (sec) Flour/Semolina Extraction (%) Flour/Semolina Ash (%) ** Wet Gluten (%) Farinograph: Peak Time (min) n/a n/a Stability (min) n/a n/a Absorption (%) n/a n/a Alveograph W ( -4 joules) Loaf Volume (cc) n/a n/a n/a n/a Production (mmt) * Great Plains durum only, extraction and ash values are for semolina. ** Protein - 12% moisture basis; ash - 14% moisture basis

5 PRODUCTION, SUPPLY AND DEMAND UNITED STATES US Production by Class Crop Year (Beginning June 1) (million metric tons) Hard Red Winter Hard Red Spring Hard White Durum Soft White Soft Red Winter Total Based on USDA crop estimates of September, US Supply and Demand Estimated for /11 (year beginning June 1) (million metric tons) HRW HRS Durum White SRW TOTAL Supply: Beginning Stocks Production Total Supply Demand: Domestic Use Exports Total Demand Ending Stocks Stocks Five-year Average Based on USDA Supply/Demand estimates of October 8,. 5
6 WHAT THE TESTS MEAN Wheat Grades reflect the physical quality and condition of a sample and thus may indicate the general suitability of a sample for milling. The U.S. grade of a sample is determined by measurement of such factors as test weight, damaged kernels, foreign material, shrunken and broken kernels, and wheat of contrasting classes. All numeric factors other than test weight are reported as a percentage by weight of the sample. Grade determining factors include: Test Weight is a measure of the density of the sample and may be an indicator of milling yield and the general condition of the sample, as problems that occur during the growing season or at harvest often reduce test weight. Damaged Kernels are kernels which may be undesirable for milling because of disease, insect activity, frost or sprout damage, etc. Foreign Material is any material other than wheat that remains after dockage is removed. Because foreign material may not be removed by normal cleaning equipment, it may have an adverse effect on milling quality. Shrunken and Broken Kernels are kernels which either were insufficiently filled during growing and have a shrunken or shriveled appearance or have been broken in handling. Such kernels may reduce milling yield. Total Defects is the sum of damaged kernels, foreign material and shrunken and broken kernels. Vitreous Kernels in hard red spring wheat are kernels which are uniformly dark and have no spots which appear chalky or soft. In durum, vitreous kernels have a glassy and translucent appearance without any spots that appear chalky. Dockage is the percentage by weight of any material easily removed from a wheat sample using the Carter Dockage Tester. Dockage, because it can be easily removed, should not have any effect on milling quality but may have other economic effects for buyers. Grade factors are determined only after dockage is removed. Moisture content is the percentage moisture by weight of a sample and is an important indicator of profitability in milling. Flour millers add water to adjust wheat moisture to a standard level before milling. Lower wheat moisture allows more water to be added, increasing the weight of grain to be milled at virtually no cost. Moisture content is also an indicator of grain storability as wheat and flour with low moisture are more stable during storage. Because moisture can be readily added to or physically removed from a sample, other analysis results are often mathematically converted to a standard moisture basis, such as 14%, 12% or dry matter, so results can be meaningfully compared. Protein content is the percentage protein by weight in a sample. Protein can be quickly and easily measured and therefore is an important factor in determining the value of wheat since it relates to many processing properties, such as water absorption and gluten strength. Low protein is desired for products such as snacks or cakes. High protein is desired for products such as pan breads, buns and frozen yeast-raised products. Ash content is the percentage of minerals by weight in wheat or flour. In wheat, ash is primarily concentrated in the bran and is an indication of the flour yield that can be expected during milling. In flour, ash content indicates milling performance by indirectly revealing the amount of bran contamination in flour. Ash in flour can impart a darker color to finished products. Products requiring particularly white flour call for low ash content while whole wheat flour has higher ash content. Kernel Weight is the weight in grams of one thousand kernels of wheat and may indicate grain size and expected milling yield. Kernel Size is a measure of the percentage by weight of large, medium and small kernels in a sample. Large kernels or more uniform kernel size may help improve milling yield. Single Kernel Characterization System (SKCS) measures individual kernels from a sample for size (diameter), weight, hardness (based on the force needed to crush) and moisture. Detailed SKCS results (not reported in this booklet) include the distribution of these factors, which may be an indicator of the uniformity of the sample and may help millers experienced with the system optimize flour milling yields. Kernel characteristics are related to milling properties such as tempering, roll gap settings, and flour starch damage content. Sedimentation value is a measure of the sediment that results when lactic acid is added to a sifted ground wheat sample and can be used as an indicator of gluten quality and thus the baking quality of wheat flour. Falling Number indirectly indicates alpha-amylase activity, which results from sprout damage. High Falling Number values indicate low alpha-amylase activity. Sufficient alphaamylase activity is required in flour for some products such as yeast-raised bread. However, excessive alpha-amylase in wheat cannot be removed and is difficult to blend to lower alpha-amylase content, and the resulting flour produces a sticky dough that can cause problems during processing and products with poor color and weak texture. Falling Number usually correlates closely with amylograph. Extraction is the percentage by weight of flour obtained from a wheat sample. In a commercial flour mill the extraction rate is critically important to mill profitability. In a laboratory, 6


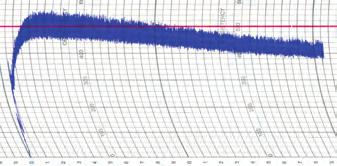
7 WHAT THE TESTS MEAN milling with the Buhler Laboratory Mill is mainly done to obtain flour for other tests. The Buhler Laboratory Mill extraction rate is always significantly lower than the rate that can be obtained on a commercial mill, but may be useful for comparison between crop years. Color is a numerical system to measure a sample s lightness (L*) on a scale of to and chromaticity or hue on two scales each running from -6 to +6 for green-red (a*) and blue-yellow (b*). High L* values indicate a bright color, and higher b* values indicate more yellow. Flour color is influenced by the wheat s endosperm color and the ash content of the flour and often affects the color of the finished product. Wet Gluten is a measure of the quantity of gluten in wheat or flour samples as determined using the Glutomatic system. Gluten forms when water is added to the protein in wheat and is responsible for the elasticity and extensibility characteristics of flour dough. Gluten Index is also determined by the Glutomatic system and is a measure of gluten strength regardless of the quantity of gluten present. Gluten index is used commercially to select durum samples with strong gluten characteristics. In bread wheat a variety of factors other than gluten quality can affect the results though very low gluten index may be an indication of protein damage from insect or disease activity. Amylograph measures flour starch pasting properties that are important to some end products such as sheeted Asian noodles. Amylograph also measures enzyme (alpha-amylase) activity which results from sprout damage. Amylograph results usually correlate very closely with Falling Number results. Starch Damage, the percentage by weight of damaged starch in a flour sample, is a measure of the physical damage done to starch granules during milling. Bread (hard) wheat flour typically has higher starch damage than soft wheat flour. Highly damaged starch readily absorbs more water which affects dough mixing and other processing properties. Because starch damage depends on how the sample was milled, starch damage is important for interpreting other results reported. Farinograph generates a curve that indicates the power being used over time as flour and water are mixed into dough. The results describe the mixing properties of the dough and include: Peak Time is the time interval from the first addition of water to the maximum consistency immediately prior to the first indication of weakening. Long peak times indicate strong gluten and dough properties while short peak times may indicate weak gluten. Stability is the interval between the point where the top of the curve first intersects the -BU line (called the arrival time ) and the point where the top of the curve departs the -BU line ( departure time ). Long stability times also indicate strong gluten and dough properties, useful in such products as yeast-raised breads while short stability times indicate weaker gluten useful in many confectionary products. Absorption is the amount of water (as a percent by weight of 14 percent moisture wheat flour) required to center the curve peak on the -BU line. High water absorption provides economic advantages for producing more dough pieces than flour with lower water absorption. Classification rates the curves produced by the farinograph ( farinograms ) on a scale of 1 to 8, with higher values indicating stronger gluten and dough mixing properties for hard red spring wheat flour. FARINOGRAPH 7

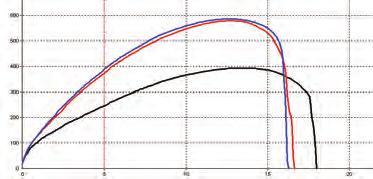
8 WHAT THE TESTS MEAN Alveograph generates a curve indicating the air pressure necessary to inflate a piece of dough like a bubble to the point of rupture and indicates the gluten strength and extensibility of dough. Values reported include: P ( overpressure ), measured in millimeters to the maximum height of the curve, reflects the maximum pressure while blowing the bubble of dough and indicates dough resistance to extension. L (length), the length of the curve measured in millimeters, reflects the size of the bubble and indicates dough extensibility. W (the area under the curve) reflects the amount of energy needed to inflate the dough to the point of rupture and indicates dough strength. The alveograph is well suited for measuring the dough characteristics of weaker gluten wheat. Flour with low P value (indicating weak gluten) and long L value (high extensibility) is preferred for cakes and confectionery products. Flour with high P values (strong gluten) is preferred for breads. Extensograph generates a force-time curve for a piece of dough stretched until it breaks. Results include: Resistance, measured at the maximum curve height in Brabender units (B.U.), reflects the maximum force applied and indicates the resistance of the dough to extension. Extensibility, measured as the total length of the curve at the base line in centimeters, reflects how far the dough was stretched. Area is the area under the curve reported in square centimeters. These factors help describe the gluten strength and dough extensibility characteristics of flour for a wide range of end products. The extensograph can also evaluate the effects of fermentation time and additives on dough performance. Mixograph, similar to the farinograph but quicker and using a smaller amount of flour sample, generates a graph that records the force needed to mix flour or semolina and water into dough. The graph is classified on a scale of 1 to 8, with higher values indicating stronger gluten characteristics for durum milled fractions. Solvent Retention Capacity (or SRC) is the weight of solvent held by flour after centrifugation, and expressed as a percent of the flour weight on a 14 percent moisture basis. The different solvents used relate flour functionality to specific flour components and thus can be useful for predicting commercial baking performance, especially for soft wheat flours. Baking Absorption is the water required for optimum dough mixing performance, expressed as a percent of flour weight on a 14 percent moisture basis. Crumb Grain and Texture is determined on a scale of 1 to by visual comparison to a standard using a constant illumination source. Higher scores are preferred. Loaf Volume is the volume of the test loaf after baking. Higher loaf volumes indicate better baking performance for pan breads. Specks are visually counted in a semolina sample and reported as the number in square inches. Specks, which can detract from pasta appearance and desirability, are small particles of bran or other material that escaped the wheat cleaning and semolina purifying process and thus depend on the milling process as well as the characteristics of the durum. Sugar Snap Cookie, Sponge Cake, Chinese Southern-Type Steamed Bread, Spaghetti, and the Hard White noodle and steamed bread tests all use standardized methods to prepare specific end products to evaluate the suitability of the sample for that product or similar products. Details on many of these tests can be found in the Analysis Methods. Alveograph Photos courtesy of Wheat Marketing Center 8
. Emergence ratings were very close to the five-year average throughout the fall of 9, and the crop was in good condition going into the winter months.")
9 OVERVIEW HARD RED WINTER Midwestern Harvest Survey Weather and Harvest: The hard red winter (HRW) wheat crop began with generally favorable planting conditions in all regions, particularly in the southern plains (Texas and Oklahoma). Emergence ratings were very close to the five-year average throughout the fall of 9, and the crop was in good condition going into the winter months. By early April, fair to excellent crop condition ratings of over 9% were widespread, favorable conditions which continued right through to harvest. Cool temperatures with good moisture tended to be a hindrance, however, to crop maturity. The start of harvest was 2 to 3 weeks behind normal in northeast Colorado, the Nebraska Panhandle and Montana. While the cool, damp weather during grainfill was a major contributor to higher than normal test weights, kernel size and mill yield, those same conditions were not conducive to accumulation of protein, which is below the five-year average. Survey Methods: Sample collection and analysis were conducted by the USDA ARS Hard Red Winter Wheat Quality Lab, Manhattan, Kansas, and Plains Grains, Inc. A total of 468 samples were collected from grain elevators when the local harvest was at least % complete in Texas, Oklahoma, Colorado, Kansas, Nebraska, South Dakota, Wyoming and Montana. The area sampled represents about 8% of HRW production. Official grade and non-grade factors were determined on each sample. Milling, dough functionality and bake tests were run on 112 composites based on 41 production areas and three protein ranges of <11.5%, 11.5% %, and >12.5%. Results were then mathematically aggregated to represent Gulf-tributary, PNW-tributary, and overall results. The analytical methods used are described in the Analysis Methods section of this booklet. Wheat and Grade Data: Seventy-one percent of all individual samples graded US #1 and 92% graded US #2 or better. Average dockage of.6%, damaged kernels and shrunken and broken kernels are all equal to the five-year averages while foreign material and total defects increased slightly over the five-year average. Kernel characteristics, including test weight, thousand kernel weight and kernel diameter, are very good, consistent with favorable growing conditions. Average test weight of 61. lbs/bu. (8.2 kg/hl) is above the five-year and 9 averages. Average thousand kernel weight of 29.4 g is about equal to the five-year average, but slightly lower than 9. Kernel diameter of 2.61 mm is above the five-year average, but slightly below 9. However, growing conditions favoring kernel size and test weight are not conducive to accumulating wheat protein, which is over a half a point below the five-year average and similar to 9. The distribution of protein differs by area with nearly half the Gulf tributary samples in the 11.5% 12.5% category while nearly 6% of PNW tributary samples are in the < 11.5% protein category. Average falling number is 6 seconds, indicative of sound wheat. Flour and Baking Data: The Buhler laboratory mill flour yield reflects outstanding kernel characteristics with an overall average of 7.9%, similar to 9 and well above the five-year average of 7.%. The Gulf average of 7.5% is higher than the five-year average of 7.%; the PNW average of 71.9% is slightly below 9, but well above the five-year average 7.1%. Flour ash and flour color results support proper setting of the mill. Flour protein averages.1%, a full percentage point below the five-year average and reflecting a slightly elevated loss in the milling process. Gulf flour protein is.2%, down one-half point from 9 and eight tenths of a point lower than the five-year average. PNW flour protein is 9.9% a half point lower than 9 (.4%) and over 1 point lower than the five-year average of 11.1%. Farinograph absorption (56.3%) is significantly below 9 and 2 points below the five-year average of 58.3%. Farinograph stability (12. minutes) is above the five-year average of.7 minutes, but below 9. The average W value of 232 is similar to the 9 value and below the five-year average of 257. Loaf volume averages just over 8 cc, comparable to the 9 crop but significantly below the five-year average of 836 cc. Summary: The HRW crop can be characterized as clean and sound with very good milling properties, but with below average protein content and with end-product qualities consistent with the lower protein values. California Harvest Survey California s wheat growing regions are defined by climate, value of alternative crops, and distinct differences in variety selection. California experienced another cool growing season this year. This resulted in very high yields and variable proteins. Disease pressure was low. HRW acreage increased over 15% in the state this year. California red wheats are harvested in the months of June and July. With strong domestic demand for new crop wheat, export buyers are encouraged to express their interest in purchasing California wheat in early spring. Export Cargo Survey The export cargo data represent 3 individual sublot samples provided by USDA s Federal Grain Inspection Service for marketing years and 9. Of 125 -crop samples collected in August and September, 9 are from Gulf and 35 from PNW ports. Of the crop samples, 263 are from Gulf and 115 from PNW ports. Grade data are the official grades on the individual sublots. Milling and baking analyses were conducted by CII Laboratory Services, Kansas City, MO. 9
 81.2 79.9 79.3 8.2 79.7 79.2 Damaged Kernels (%).2.4.4.3.2.3 Foreign Material (%).1.2.3.2.1.1 Shrunken & Broken (%) 1. 1.2 1.1 1.1 1. 1.2 Total Defects (%) 1.4 1.7 1.8 1.6 1.3 1.")
10 HARD RED WINTER midwestern HARVEST DATA Hard Red Winter Composite Average By Protein* 9 5-Year Low Med High Overall Overall Average Wheat Grade Data: Test Weight (lb/bu) (kg/hl) Damaged Kernels (%) Foreign Material (%) Shrunken & Broken (%) Total Defects (%) Grade 1 HRW 1 HRW 1 HRW 1 HRW 1 HRW 1 HRW Wheat Non-Grade Data: Dockage (%) Moisture (%) Protein (%) 12%/% moisture basis 11./ / / / / /14.1 Ash (%) 14%/% moisture basis 1.52/ / / / / /1.8 Kernel Weight (g) Kernel Size (%) lg/md/sm 62/36/2 6/39/1 59/39/2 62/37/1 63/36/1 57/41/1 Single Kernel: Hardness Weight (mg) Diameter (mm) Sedimentation (cc) Falling Number (sec) Flour Data: Lab Mill Extraction (%) Color: L* a* b* Protein (%) 14%/% moisture basis 9.4/.9.3/ /13..1/11.7.6/ /12.9 Ash (%) 14%/% moisture basis./.47.41/.49.43/.51.42/.49.46/.53.51/.59 Wet Gluten (%) Gluten Index Falling Number (sec) N/A N/A N/A N/A N/A 412 Amylograph Viscosity 65 g (BU) > 95 Starch Damage (%) Dough Properties: Farinograph: Peak Time (min) Stability (min) Absorption (%) Alveograph: P (mm) L (mm) P/L Ratio W ( -4 joules) Extensograph: Resistance (BU) 342/ / / / / /456 (45/135 min) Extensibility (cm) 14.2/ / / / / /14.5 Area (sq cm) 85/119 93/131 96/141 91/131 94/132 88/116 Baking Evaluation: Crumb Grain (scale 1-) Crumb Texture (scale 1-) Loaf Volume (cc) % of Area Production: * Low: Less than 11.5%; Med: %; High: 12.5% or greater
11 MIDWESTERN HARVEST DATA HARD RED WINTER Gulf Exportable Average PNW Exportable Average By Protein* 9 5-Year By Protein* 9 5-Year Low Med High Overall Overall Average Low Med High Overall Overall Average HRW 1 HRW 1 HRW 1 HRW 1 HRW 1 HRW 1 HRW 1 HRW 2 HRW 1 HRW 1 HRW 1 HRW / / / / / /14.1.8/ / / / / / / / / / / / / / / / / / /37/1 6/38/2 61/38/1 6/38/2 63/36/2 58//2 64/35/1 57/42/1 66/33/1 63/36/1 69/31/1 54/44/ /.9.3/ /13..2/11.8.7/ / /.7.6/ / /11.5.4/ / /.48.42/.49.44/.51.42/.49.47/.54.51/.59.39/.45./.47.42/.49./.47.43/..49/ N/A N/A > > / / / / /513 2/ / / / / / 436/ / / / / / / / / / / / /16. 83/1 9/129 92/134 9/1 95/134 99/125 91/116 4/138 9/163 97/133 96/ /
12 HARD RED WINTER california and export data Hard Red Winter California Harvest Data Export Cargo Data Medium Protein Average High Protein Average Gulf PNW Wheat Grade Data: Test Weight (lb/bu) (kg/hl) Damaged Kernels (%) Foreign Material (%) Shrunken & Broken (%) Total Defects (%) Grade 1 HRW 1 HRW 1 HRW 1 HRW 1 HRW 1 HRW 1 HRW 1 HRW Wheat Non-Grade Data: Dockage (%) Moisture (%) Protein (%) 12%/% moisture basis 11.7/ / / / / / / /13.5 Ash (%) 14%/% moisture basis 1.39/ / / / / / / /1.62 Kernel Weight (g) Kernel Size (%) lg/md/sm 66/32/2 68/31/2 65/34/1 65/33/1 Single Kernel: Hardness Weight (mg) Diameter (mm) Sedimentation (cc) Falling Number (sec) Flour Data: Lab Mill Extraction (%) Color: L* a* b* Protein (%) 14%/% moisture basis 11./12.8.3/ / /13.4.4/12..4/12.1.4/12.1.6/12.4 Ash (%) 14%/% moisture basis.41/.47.43/.51.41/.48.44/.51.51/.59.51/.59./.58.49/.57 Wet Gluten (%) Gluten Index Falling Number (sec) Amylograph Viscosity 65 g (BU) Starch Damage (%) Dough Properties: Farinograph: Peak Time (min) Stability (min) Absorption (%) Alveograph: P (mm) L (mm) P/L Ratio W ( -4 joules) Extensograph: Resistance (BU) (45/135 min) Extensibility (cm) Area (sq cm) Baking Evaluation: Crumb Grain (scale 1-) Crumb Texture (scale 1-) Loaf Volume (cc) Number of Samples

13 NINE STATES surveyed California Colorado Kansas Montana Nebraska Oklahoma South Dakota Texas Wyoming TEST WEIGHT Pounds/Bushel HECTOLITER WEIGHT Kilograms/Hectoliter 6 Gulf Ports Avg lb/bu PNW Ports Avg lb/bu Gulf Ports Avg kg/hl PNW Ports Avg kg/hl WHEAT MOISTURE Percent PROTEIN (12% mb) Percent Gulf Ports Avg % PNW Ports Avg % 's 9's 's 11's 12's 13's Gulf Ports Avg % PNW Ports Avg % 's 's 11's 12's 13's 14+ kernel weight Grams FALLING NUMBER Seconds Gulf Ports Avg g PNW Ports Avg -.1 g >34 6 Gulf Ports Avg - 4 sec PNW Ports Avg sec <


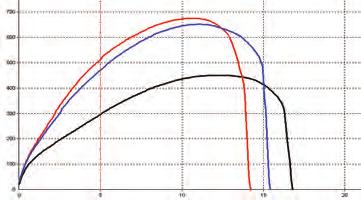
14 HARD RED WINTER Physical dough properties FARINOGRAMS* ALVEOGRAMS EXTENSOGRAMS high protein MEDIUM PROTEIN LOW PROTEIN *Representing Composite Average 14

 3% Other 7% 2 HRW (<11.5% Protein) 14% 2 HRW (11.5%-12.5% Protein) 14% 2 HRW (>12.5% Protein) 14% 1 HRW (11.5%-12.5% Protein) 36% 1 HRW (<11.5% Protein) 29% 1 HRW (11.5%-12.5% Protein) 14% 1 HRW (<11.")
 31% 1 HRW (>12.5% Protein) 14% OVERALL 2 HRW (<11.")
15 Production AND grade data HARD RED WINTER Hard Red Winter Production for the major growing region (million metric tons) California Colorado Kansas Montana Nebraska Oklahoma South Dakota Texas Wyoming Nine-State Total Total HRW Production Based on USDA crop estimates of September,. GULF EXPORTABLE PNW EXPORTABLE 1 HRW (>12.5% Protein) 18% 2 HRW (11.5%-12.5% Protein) 7% 2 HRW (>12.5% Protein) 3% Other 7% 2 HRW (<11.5% Protein) 14% 2 HRW (11.5%-12.5% Protein) 14% 2 HRW (>12.5% Protein) 14% 1 HRW (11.5%-12.5% Protein) 36% 1 HRW (<11.5% Protein) 29% 1 HRW (11.5%-12.5% Protein) 14% 1 HRW (<11.5% Protein) 44% ABOUT HARD RED Winter WHEAT U.S. hard red winter wheat has medium to high protein, medium hard endosperm, red bran, medium gluten content and mellow gluten. Used in pan breads, Asian noodles, hearth breads, hard rolls, flatbreads, croissants and general-purpose flour. 1 HRW (11.5%-12.5% Protein) 31% 1 HRW (>12.5% Protein) 14% OVERALL 2 HRW (<11.5% Protein) 3% 2 HRW (11.5%-12.5% Protein) 8% 2 HRW (>12.5% Protein) 6% 1 HRW (<11.5% Protein) 32% Other 6% 15
16 HARD RED SPRING OVERVIEW Harvest Survey Weather and Harvest: Planting of the hard red spring wheat (HRS) crop began in mid-april, advanced quickly and was 6% complete by early May, % ahead of normal. Persistent rains in late May were beneficial for crop growth, but delayed planting completion into June and caused two distinctly different crop maturities. Moisture and temperatures continued ideal in all areas, similar to 9, and disease pressures were light. Crop development progressed at near normal rates in central, southern and eastern areas, but western and northern areas were later than normal with cool, wet growing conditions. Harvest began in early August, near normal, and good early conditions allowed faster than normal progress into early September when completion reached 7%. Harvest then stalled for three weeks, delayed by crop maturity, cooler than average temperatures and sporadic rains. The last 5% of harvest, mostly in northern Montana, was not completed until early October, well behind average and too late for inclusion in this report. Samples and Methods: Sample collection and analysis were conducted by the Hard Red Spring Wheat Quality Lab, Department of Plant Sciences, North Dakota State University, Fargo, ND. A total of 713 samples were collected from fields, bin sites on farm, or elevators during harvest in Minnesota (122), Montana (125), North Dakota (381) and South Dakota (85). The samples represent approximately 9% of the HRS crop in the four states. Samples were segregated by export region and composited by protein range as follows: less than 13.5%, 13.5%-14.5%, and greater than 14.5%. The methods are described in the Analysis Methods section of this booklet. Wheat and Grade Data: The average grade is US #1 Northern Spring. More than 9% of samples graded #1 and nearly 6% #1 Dark Northern Spring. Production is 6% larger than 9 and third largest on record. Planted area was up marginally, but yield was a record, surpassing the 9 record and about % above average. The crop shows above average test weightand kernel size, minimal damage and improved protein over the record low protein in 9. Adequate moisture and limited disease during the growing season allowed for good kernel development. Average test weight is 61.6 pounds per bushel (81 kg/hl), similar to last year but above the five-year average. Average test weights are slightly lower in West or Pacific Northwest tributary area, compared to the east or Gulf/Great Lakes tributary area. Kernel quality traits, such as ash and size, are also improved over the long-term average. Kernel damage is a mere.1%, below the five-year average of.3%. DON tests were performed on each of the six protein composites and all showed non-detectable or less than.5 ppm values. Higher protein levels in compared to 9 are a plus for traditional buyers, although the record yielding crop still had below average protein, more noticeable across western areas. The average protein is 13.7%, up from 13.2% in 9, but below the five-year average of 14.3%. Protein increased most dramatically in the east, averaging 13.7% and up nearly one point from last year. In the PNW region the average protein level is 13.8% compared to 13.7% in 9. Roughly one-half of the crop is above 14% protein, compared to only one-third last year. In addition, only 6% of the Gulf/Great Lakes tributary crop falls below 12%, compared to nearly % last year. Vitreous kernel counts average 66%, slightly below last year and the five-year average as rain during harvest and lower protein affected kernel color and vitreousness. Western areas show a greater decline in vitreous kernels from the long-term average and may create challenges for buyers demanding DNS. Harvest time rains also reduced average falling number values in the later portion of the harvest, leading to a lower value in the PNW tributary of 366 seconds compared to 375 last year and the five-year average of 9. The Gulf/Great Lakes tributary averages 1 seconds, up from 374 last year. Flour and Baking Data: The Buhler laboratory mill indicates improved flour extraction over 9, 7.% compared with 68.7%. The crop in the eastern area has one and one-half point higher extraction, whereas the western half is one-half point higher. Flour ash averages.53%, up slightly from last year and the five-year average. Dough strength is similar to 9, but still weaker than traditional HRS strength. Farinograph stability is 9.9 minutes, with the PNW tributary at.6 minutes and Gulf/Great Lakes at 9.5 minutes. Dough stability is strongest in the medium and high protein segments of the PNW tributary crop. Absorption values average 65%, about one and one-half points lower than 9 and about a half point less than the five-year average. The PNW region is showing the most significant decline from last year and the five-year average. Absorption increases with protein content across both export regions. four STATES surveyed Minnesota Montana North Dakota South Dakota 16
17 OVERVIEW HARD RED SPRING Average alveograph W-value is higher at 395 than last year at 387. An increase in the east offset a decline in W-values across the west. Based on both the alveograph and the extensograph, dough is less extensible compared to both last year and the five-year average. Dough handling properties are better than last year and the five-year average, however. Loaf volumes are improved with an average of 947 cubic centimeters compared to 916 last year. A greater gain occurred in the east, which averages 952 cc, compared to the PNW region with 9 cc. Loaf volumes are below the five-year average but they noticeably increase at higher protein levels. Bread quality scores are equal to last year and the five-year average with highest scores in the medium protein segments. Summary: The HRS crop has excellent kernel qualities with slightly improved functional quality compared to 9. Buyers will appreciate the high grade profile with improved protein content and more balanced distribution, especially across the eastern half of the region. Protein is still below the long-term average, but nearly one-half the crop is above 14% protein. Dough strength and bake performance are below HRS traditional levels but similar to 9. Flour yields and loaf volumes are higher than 9, and bread quality scores are also good. Some wide quality differences exist, so good communication with sellers and diligent contract specifications will help buyers receive their needed quality. Continued on next page TEST WEIGHT Pounds/Bushel HECTOLITER WEIGHT Kilograms/Hectoliter PNW Avg lb/bu Gulf/Great Lakes Avg lb/bu PNW Avg kg/hl Gulf/Great Lakes Avg kg/hl < < WHEAT MOISTURE Percent PROTEIN (12% mb) Percent 6 PNW Avg % Gulf/Great Lakes Avg % 's 's 11's 12's 13+ PNW Avg % Gulf/Great Lakes Avg % <12 12's 13's 14's 15's 16+ kernel weight Grams FALLING NUMBER Seconds 7 6 PNW Avg g Gulf/Great Lakes Avg g PNW Avg sec Gulf/Great Lakes Avg - 1 sec <
 and 8. Of 252 9- crop samples, 18 were from PNW, 21 from Lakes, and 51 from Gulf ports. Grade data are the official grades on the individual sublots.")
18 HARD RED SPRING harvest DATA Export Cargo Survey The export cargo data represents 485 individual sublot samples provided by USDA s Federal Grain Inspection Service for crop years 9 (collected from October 9 through August ) and 8. Of crop samples, 18 were from PNW, 21 from Lakes, and 51 from Gulf ports. Grade data are the official grades on the individual sublots. Milling and baking analyses were conducted by North Dakota State University. Hard Red Spring Composite Average By Protein* 9 5-year Low Med High Overall Overall Average Wheat Grade Data: Test Weight (lb/bu) (kg/hl) Damaged Kernels (%) Foreign Material (%) Shrunken & Broken (%) Total Defects (%) Vitreous Kernels (%) Grade 1 NS 1 NS 1 DNS 1 NS 1 NS 1 NS Wheat Non-Grade Data: Dockage (%) Moisture (%) Protein (%) 12%/% moisture basis 12.5/ / / / / /16.3 Ash (%) 14%/% moisture basis 1.55/ / / / / /1.86 Kernel Weight (g) Kernel Size (%) lg/md/sm 58/41/1 49/49/2 45/52/3 51/47/2 59/39/2 47/47/6 Single Kernel: Hardness Weight (mg) Diameter (mm) Sedimentation (cc) Falling Number (sec) Flour Data: Lab Mill Extraction (%) Color: L* a* b* Protein (%) 14%/% moisture basis 11.4/ / / / / /15.5 Ash (%) 14%/% moisture basis.52/.6.53/.62.56/.65.53/.62./.58./.58 Wet Gluten (%) Gluten Index Falling Number (sec) Amylograph Viscosity: 65g (BU) g (BU) Starch Damage (%) Dough Properties: Farinograph: Peak Time (min) Stability (min) Absorption (%) Classification Alveograph: P (mm) L (mm) P/L Ratio W ( -4 joules) Extensograph: Resistance (BU) 463/ /678 7/ / / /533 (45/135 min) Extensibility (cm) 16.1/ / / / / /18.9 Area (sq cm) 98/121 6/133 92/134 99/129 97/4 113/129 Baking Evaluation: Absorption (%) Crumb Grain and Texture Loaf Volume (cc) % Area Production: * Low: Less than 13.5%; Med: %; High: 14.5% or greater. 18
19 HARVEST DATA HARD RED SPRING PNW Average Gulf/Great Lakes Average By Protein* 9 5-year By Protein* 9 5-year Low Med High Overall Overall Average Low Med High Overall Overall Average NS 1 NS 1 DNS 1 NS 1 DNS 1 DNS 1 NS 1 NS 1 NS 1 NS 1 NS 1 NS / / / / / / / / / / / / / / / / / / / / / / / / /46/2 46/51/3 41/55/4 47//3 52/46/2 35/55/ 62/37/1 /48/2 48//2 54/44/2 64/35/1 56// / / / / / / / / / / / /15..48/.56.48/.56.52/.6.49/.57.46/.53.49/.57.55/.64.56/.65.59/.69.56/.65.53/.62./ / / /741 49/ / / /6 4/ /519 4/ / / / / / / / / / / / / / /18.5 9/4 115/146 /158 8/134 99/1 124/147 91/133 /126 84/112 92/125 95/ 5/
20 HARD RED SPRING EXPORT CARGO DATA Hard Red Spring PNW Average Great Lakes Average Gulf Average Wheat Grade Data: Test Weight (lb/bu) (kg/hl) Damaged Kernels (%) Foreign Material (%) Shrunken & Broken (%) Total Defects (%) Vitreous Kernels (%) Grade 1 NS 1 DNS 1 NS 1 NS 1 NS 1 NS Wheat Non-Grade Data: Dockage (%) Moisture (%) Protein (%) 12%/% moisture basis 13.5/ / / / / /15.5 Ash (%) 14%/% moisture basis 1.48/ / / / / /1.82 Kernel Weight (g) Kernel Size (%) lg/md/sm 58//2 52/47/3 58//2 59//2 63/35/2 57/42/2 Single Kernel: Hardness Weight (mg) Diameter (mm) Sedimentation (cc) Falling Number (sec) Flour Data: Lab Mill Extraction (%) Color: L* a* b* Protein (%) 14%/% moisture basis 12.7/ / / / / /14.7 Ash (%) 14%/% moisture basis.54/.63.54/.63.57/.67.55/.63.57/.67.57/.66 Wet Gluten (%) Gluten Index Falling Number (sec) Amylograph Viscosity: 65g (BU) g (BU) Starch Damage (%) Dough Properties: Farinograph: Peak Time (min) Stability (min) Absorption (%) Classification Alveograph: P (mm) L (mm) P/L Ratio W ( -4 joules) Extensograph: Resistance (BU) (45/135 min) Extensibility (cm) Area (sq cm) Baking Evaluation: Absorption (%) Crumb Grain and Texture Loaf Volume (cc) Sample Count:

21 PRODUCTION AND GRADE DISTRIBUTION HARD RED SPRING Hard Red Spring Production for the major producing states (million metric tons) Minnesota Montana North Dakota South Dakota Four-State Total Total HRS Production Based on USDA crop estimates of September,. PNW* 1 NS 16% 2 DNS 6% 1 RS 6% Other 6% ABOUT HARD RED SPRING WHEAT GULF/GREAT LAKES 1 RS % 1 DNS 66% Other 5% Highest protein content, hard endosperm, red bran, strong gluten, high water absorption. Used in pan breads, hearth breads, rolls, croissants, bagels, hamburger buns, pizza crust and for blending. 1 NS 36% 1 DNS 49% 2 DNS 3% OVERALL 1 RS 8% Other 5% 1 NS 28% 1 DNS 56% * Harvest delays prevented % of PNW samples from being collected; of all samples collected, % were graded. 21


22 HARD RED SPRING PHYSICAL DOUGH PROPERTIES FARINOGRAMS* ALVEOGRAMS EXTENSOGRAMS high protein MEDIUM PROTEIN LOW PROTEIN *Representing Composite Average 22
23 overview HARD WHITE Harvest Survey Hard white wheat (HW) was primarily grown in the states of Idaho, Kansas, Colorado, and California this year. Other states such as Nebraska and Washington have limited production. According to the USDA report (September, ), total HW production is estimated at 622, metric tons (MT), a decrease from last year s 7, MT. Survey Methods: HW samples were submitted from four regions: Pacific Northwest (PNW), California, Southern Plains, and Northern Plains. Samples from the PNW were collected by the USDA s National Agricultural Statistics Service. Samples from three other regions were either collected by Plains Grains, Inc., Stillwater, OK, or sent directly to the Wheat Marketing Center by growers. These samples represented diverse growing conditions across the country. Wheat grading and protein were conducted by the Federal Grain Inspection Service (FGIS), Portland, Oregon. All other tests were conducted by the Wheat Marketing Center (WMC), Portland, Oregon. HW samples were made into eight composites, based on four regions (PNW, California, Southern Plains, and Northern Plains) and four protein levels (less than 11.5%, %, %, and higher than 13.5%). Wheat and flour tests were done according to the AACC International Approved Methods (11th Edition). Chinese raw and wet noodle testing and steamed bread evaluation were conducted according to protocols established by Asian noodle and steamed bread makers and flour millers at WMC during the US Wheat Associates Asian Products Collaborative Program. Wheat and Grade Data: All samples graded US #1 with test weights from 6.9 to 63.8 lb/bu (8.1 to 83.8 kg/hl). Wheat moisture was in the range of 7.8%-11.2%. Similar to historic data, PNW and California composites had lower wheat moisture than the Southern Plains and the Northern Plains. The California composite had the highest thousand kernel weight and kernel diameter. Falling number values were 339 seconds or higher, indicating sound grain. Flour, Dough and Baking Data: Buhler laboratory mill straight grade flour extractions ranged from 7.% to 73.7% and flour ash contents varied from.41% to.54% (14% mb). These values suggest good milling performance. Flour wet gluten contents were from 25.8% to 39.1%. Amylograph peak viscosities were between 716 and 29 BU, which showed good starch pasting property. Starch damage values were in the range of 3.1% to 5.%, lower than previous years. Lactic acid SRC values were 124% or higher, indicating good gluten strength for bread baking. Farinograph absorption ranged from 54.2% to 61.1%, lower than previous years, possibly related to lower starch damage levels. Farinograph stability times were minutes, showing typically medium to strong dough characteristics of HW wheat. HW usually has similar farinograph water absorption to HRW, but the stability time is much longer indicating more tolerance to overmixing. The ranges of alveograph values were: mm for P values; mm for L values; and joules for W values. Extensograph data at 135-minute resting showed that maximum resistance was in the range of BU, and extensibility was from cm. Compared to HRW, this year s HW showed longer alveograph L values and extensograph extensibility. Most samples showed good baking performance with the bake absorption in the range of 58.%-66.1%, loaf volume from 746 to 31 cc, and the crumb grain and texture scores of points. Noodle Evaluation: HW flours and a control flour were evaluated for both Chinese raw noodles (white salted) and Chinese wet noodles (yellow alkaline). Chinese raw noodle color was acceptable for the low and medium protein composite samples, but was duller for the high protein and the very high protein composites. However, the boiled noodle texture was excellent this year for all samples. Both noodle firmness and chewiness had much higher values than previous years. Chinese wet noodle color was acceptable for the low and the medium protein composites. The high protein composite from the Southern Plains also had an acceptable noodle color. However, the high protein composite from California and the Northern Plains had lower color stability scores. The texture of cooked Chinese wet noodles was excellent for all samples. It is recommended to blend %-% soft white into this year s HW to improve the noodle color while maintaining acceptable noodle texture. Steamed Bread Evaluation: HW flours were evaluated for Asian steamed breads in comparison with a control flour. Results showed that most samples were acceptable for steamed breads except for the low-protein and the highprotein composites from the Southern Plains, which had slightly lower scores. Summary: This year, the US HW production was estimated at 622, metric tons, reduced from last year. Quality analyses of this year s samples showed very good quality performance in milling, dough rheological properties, and end-products including pan breads, Asian noodles, and steamed breads. For Asian noodle application, blending %-% soft wheat into this year s HW may improve noodle color while maintaining acceptable noodle texture. 23


24 HARD WHITE PHYSICAL DOUGH PROPERTIES FARINOGRAMS ALVEOGRAMS EXTENSOGRAMS pnw Low PNW Very High california High southern plains Medium southern plains High northern plains High 24
25 HARVEST DATA HARD WHITE Wheat Grade Data: Pacific Northwest California Southern Plains Northern Plains Low Very High High Low Medium High High Very High Test Weight (lb/bu) (kg/hl) Damaged Kernels (%) Foreign Material (%) Shrunken & Broken (%) Total Defects (%) Grade 1 HW 1 HW 1 HW 1 HW 1 HW 1 HW 1 HW 1 HW Dockage (%) Moisture (%) Protein (%) 12%/% moisture basis 11.1/ / /14.4.9/ / / / /15.8 Ash (%) 14%/% moisture basis 1.41/ / / / / / / /1.66 Kernel Weight (g) Kernel Size (%) lg/md/sm 8/19/1 77/22/1 85/14/1 75/25/ 59//1 /49/1 71/28/1 74/25/1 Single Kernel: Hardness Weight (mg) Diameter (mm) Sedimentation (cc) Falling Number (sec) Flour Data: Lab Mill Extraction (%) Color: L* a* b* Protein (%) 14%/% moisture basis.2/ / / / / / / /14.7 Ash (%) 14%/% moisture basis.47/.55.54/.63./.58./.58./.58.54/.62./.58.41/.48 Wet Gluten (%) Gluten Index Falling Number (sec) Amylograph Viscosity 65 g (BU) Starch Damage (%) Solvent Retention Capacity (%) Water/% Sucrose 62/1 61/1 61/114 56/95 58/7 56/1 55/1 57/5 5% Lactic Acid/5% Na 2 CO 3 156/88 153/81 149/82 124/72 138/74 141/71 154/67 161/68 Dough Properties: Farinograph: Peak Time (min) Stability (min) Absorption (%) Alveograph: P (mm) L (mm) P/L Ratio W (-4 joules) Extensograph: Resistance (BU) 461/ / / /351 3/728 4/ /86 476/887 (45/135 min) Extensibility (cm) 21.8/ / / / /12.9.2/ / /14.7 Area (sq cm) 137/ / /173 85/83 69/115 5/ / /153 Baking Evaluation: Hard White Wheat Non-Grade Data: Bake Absorption (%) Crumb Grain and Texture Loaf Volume (cc) * Protein Ranges: Low, Less than 11.5%; Medium, %; High, 12.6% %; Very High, Greater than 13.5%. 25

26 HARD WHITE HARVEST DATA Hard White Pacific Northwest California Southern Plains Northern Plains Low Very High High Low Medium High High Very High Chinese Raw Noodle-Making Quality: Color at /24 hour: L* 83.5/ /66. 8./ / / / / /68.2 a*.1/.7.8/1.4.4/.9./.9.1/.8.5/1.5.8/1.3.8/1.3 b*.4/ / / / / / /21.6.3/19.9 Change in L* (-24 hr) Cooking Yield (5 min, %) Sensory Color Stability Score Instrumental Texture: Firmness (g) Springiness (%) Cohesiveness Chewiness (g) Chinese Wet Noodle-Making Quality: Uncooked Color at /24 hour: L* 78.5/ / / / / / / /66.8 a* -2./ /. -1.3/.5-1.7/ /. -1.3/. -.9/.6 -.8/.5 b* 24.6/ / / / / / / /22.5 Change in L* (-24 hr) Parboiled Color at /24 hour: L* 75.8/ / / / / / / /74.1 a* -2.1/ / / / / / / /-1.5 b*.8/ / /25.2.3/28.9.3/ / / /24.8 Cooking Yield (1.5 min, %) Uncooked Color Stability Score Parboiled Color Stability Score Instrumental Texture: Firmness (g) Springiness (%) Cohesiveness Chewiness (g) Asian-Type Steamed Bread Evaluation: Specific Volume (ml/g) Total Score * Protein Range: Low, Less than 11.5%; Medium, %; High, 12.6% %; Very High, Greater than 13.5%. ABOUT HARD WHITE WHEAT Medium to high protein content, hard endosperm, white bran. Used in Asian noodles, whole wheat or high extraction flour applications, pan breads and flat breads. 26
27 OVERVIEW DURUM Northern Great Plains Weather and Harvest: Planting began in late April, slightly behind average but ahead of the very slow 9 pace. Cool, wet conditions prevailed throughout much of May delaying final plantings until the middle of June. Moisture levels were adequate and temperatures were cooler than normal, promoting high yield potential throughout the growing season. Development of the crop remained behind the fiveyear average for most of the season with very little stress. Harvest began in mid-august, ahead of last year s abnormally slow pace, but behind average. In mid-september, persistent precipitation stalled harvest substantially, especially areas in Montana and northwest North Dakota. Harvest pace fell well behind average for the last portion of the crop as a result of slow crop maturity and cool, humid conditions. Harvest was finished in mid-october. The late harvest prevented analysis of the last % of the Montana crop. Survey Methods: A total of 4 samples were collected from the primary durum growing area of North Dakota (16) and Montana (44). State offices of the National Agricultural Statistics Service collected samples directly from producers in the field, local elevators or farm bins. These samples represent the grain at the point of origin before any conditioning or market blending, and represent the entire harvested crop, not just the crop being marketing at harvest time. Analysis was conducted by the Durum Quality Lab, North Dakota State University, Fargo, North Dakota. Wheat and Grade Data: The northern U.S. durum crop is about 15% larger than last year due to higher planted area and record yields. The crop averages #1 Hard Amber Durum, the same as last year. However, the prolonged, wet harvest caused a wider distribution of quality and somewhat reduced kernel quality traits and pasta processing performance in a greater than normal share of the crop. Average test weight is 6 pounds per bushel (78.1 kg/hl), down from last year but similar to the five-year average. Thousand kernel weights average grams, down from 42 in 9, but well above the five-year average of 36 grams. The average protein is similar to last year, at 13.4%, but below the five-year average due to the strong yields. Still, more than 6% of the crop is above the typical minimum industry demand of 13%. ABOUT durum WHEAT Durum is the hardest of all wheats, high protein content, yellow endosperm, white bran. Used to make pasta, couscous, and some Mediterranean breads. Average damage is 1.3%, about a point higher than the five-year average due to some disease pressures during the growing season and harvest time rains. Correspondingly, average falling number values fell to 335 seconds compared to 398 in 9, but nearly 8% of the crop is still above seconds. The average vitreous kernel count is 82%, similar to last year, but down from the five-year average, as lower than average protein levels and harvest rains affected vitreousness. Semolina and Processing Data: Milling performance, based on a Buhler laboratory mill, reveals increases in both semolina and total extraction. Total extraction is 73.4% and semolina extraction is 66.3%, both of which are about a point higher than 9 and 2 to 3 points higher than average. Semolina ash values are higher than 9, but lower than the five-year average. Semolina mixing values are similar to last year with a mixogram score of 5.4 (scale 1-8). The average gluten index value is 55%, above the five-year average, with a range of 48 to 79. Pasta quality factors are reflective of the weather s effect on this year s crop with lower color scores and reduced cooked firmness values. Summary: The crop is of average to good quality, and diligent buyers will find more than adequate quantities of the crop with high grades and sound kernel quality that will produce excellent pasta and couscous. Large carryover supplies from 9 and the higher than average production in provide a good pool of high quality durum to select from to produce quality end products. Given the wider spread in quality parameters and market values with the crop, detailed communication between buyers and sellers on contract specifications will take on added importance. Other Durum Production Areas Pacific Southwest: Desert Durum, a trademark of the Arizona Grain Research and Promotion Council and the California Wheat Commission, applies only to durum wheat produced in the states of Arizona and California. Desert Durum is usually delivered identity preserved to U.S. domestic and export markets. The identity preservation system allows buyers to purchase grain varieties having intrinsic quality parameters specific to their needs. Annual production requirements can be contracted ahead with experienced growers who plant certified seed. Handlers then store grain by varietal identity for season-long shipment on the buyers preferred schedules. Desert Durum acreage planted in Arizona and southern California for was about % less than in 9. Grain yields were slightly greater than the expected average. The crop again exhibits consistently large kernel size and low moisture, traits that contribute to achieving high extraction rates. Overall, grain quality characteristics are similar to 27

28 DURUM OVERVIEW expectations. In summary, the Desert Durum crop will deliver the valuable milling, semolina, and pasta quality traits that customers have come to expect. Idaho: Idaho is gaining popularity as a durum-growing area because of its high desert environment and abundance of irrigation water. Durum grown in Idaho is noted for its mellow gluten, which is very good in fresh pasta. Quality data on Idaho s durum crop is available from the Idaho Wheat Commission. Export Cargo Survey The durum export cargo data represents 35 individual sublot samples provided by USDA s Federal Grain Inspection Service for crop year 9 (collected from October 9 through June ) and 39 samples for 8. Grade data are the actual official grades on the individual sublots. Processing analysis was conducted by North Dakota State University. Four of FIVE STATES surveyed Arizona California Montana North Dakota GREAT PLAINS DURUM REGIONAL AVERAGE GREAT PLAINS DURUM GRADE DISTRIBUTION 1-2 AD 6% Other 19% 3 HAD 6% 2 HAD 15% 1 HAD 54% mixogram (SCORE = 5.4) ALVEOGRAM 28
29 harvest AND EXPORT DATA DURUM Durum Harvest Data Export Cargo Data Northern Pacific Southwest Northern Pacific Southwest 9 5-Year Avg Wheat Grade Data: Test Weight (lb/bu) (kg/hl) Damaged Kernels (%) Foreign Material (%) Shrunken and Broken (%) Total Defects (%) Contrasting Classes (%) Vitreous Kernels (%) Grade 1 HAD 1 HAD 1 HAD 1 HAD 1 HAD 1 HAD 2 HAD 1 HAD 1 HAD Wheat Non-Grade Data: Dockage (%) Moisture (%) Protein (%) 12%/% moisture basis 13.4/ / / / / / / / /15.2 Ash (%) 14%/% moisture basis 1.56/ / / /2. 1.7/ / / / /1.89 Kernel Weight (g) Kernel Size (%) lg/md/sm 43/54/3 55/42/3 39/54/7 93/7/ 93/7/ 52/44/3 /53/6 73/26/2 8/19/2 Falling Number (sec) Sedimentation (cc) 43 Semolina Data: Lab Mill Extraction (%) Semolina Extraction (%) Ash (%) 14%/% moisture basis.67/.78.62/.72.69/.8.84/.97.88/1.3.62/.73.64/.74.69/.8.67/.78 Specks (no/ sq in) Protein (%) 14%/% moisture basis 12.4/ / / / / / / / /13.7 Wet Gluten (%) Gluten Index Mixograph Classification Alveograph: P (mm) L (mm) P/L Ratio W (-4 joules) Color: L* a* b* Spaghetti Processing Data: Color Score Cooked Weight (gm) Cooking Loss (%) Cooked Firmness (g cm) Sample Count:
30 DURUM overview TEST WEIGHT Pounds/Bushel HECTOLITER WEIGHT Kilograms/Hectoliter 6 Avg - 6. lb/bu 9 Avg lb/bu Avg kg/hl 9 Avg - 8. kg/hl < < vitreous KERNELS Percent PROTEIN (12% mb) Percent 6 Avg - 82% 9 Avg - 83% < Avg % 9 Avg % <11 12's 13's 14's 15's 16+ kernel weight Grams FALLING NUMBER Seconds Avg -.3 g 9 Avg g < Avg sec 9 Avg sec < Durum Production for the major producing states (million metric tons) Arizona California Idaho..... Montana North Dakota Total Durum Production Based on USDA crop estimates of September,.
31 OVERVIEW PACIFIC NORTHWEST SOFT WHITE Harvest Survey Weather and Harvest: The Pacific Northwest (PNW) had enough soil moisture at planting, and most areas received adequate rainfall during the winter and early spring. Generally cool temperatures prevailed during the early growing season with some limited periods of high temperatures. Dry conditions prevailed during wheat harvest with some localized rain. These weather conditions contributed to average or above average yield in most of the dryland farming areas in Idaho, Oregon, and Washington. Survey and Analysis Methods: Wheat quality testing and data analyses were conducted by the Wheat Marketing Center (WMC), Portland, Oregon. Laboratory testing was conducted according to either American Association of Cereal Chemists Approved Methods (11th Edition) or Wheat Marketing Center Standard Methods. Survey samples were collected from producers under the management of the National Agricultural Statistics Services, USDA, and represent a statistical sampling of the crop. USDA s Federal Grain Inspection Service graded and tested wheat protein. The wheat commissions of Idaho, Oregon, and Washington, U.S. Wheat Associates, Inc., and the U.S. Department of Agriculture supported this program. Wheat and Grade Data: The test weight averages for the soft white (SW) of 59.6 lb/bu (78.5 kg/hl) and white club (WC) of 6. lb/bu (78.9 kg/hl) were both below 9 averages. Other grading factors for SW and WC were similar to last year and the five-year averages. SW dockage remained the same at.7% while WC dockage increased by.3 points to 1.1%. Wheat moisture contents of SW and WC, both at 9.4%, were similar to last year and the five-year averages for SW, but higher than last year and five-year averages of 8.7% for WC. SW protein content (12% mb) of 9.7% was lower than last year and the five-year averages, and WC protein (12% mb) of.3% was similar to last year and the five-year averages. Wheat ash contents were similar to last year and the five-year averages for SW and WC. Thousand kernel weights for both SW and WC were slightly heavier than last year and five-year averages. Kernel diameter values were similar to last year, but larger than five-year average. Falling number values (14% mb) were 337 seconds for SW and 338 seconds for WC, both of which were slightly higher than last year, but similar to the five-year average. Flour, Dough and Baking Data: The crop Buhler Laboratory mill flour extractions for SW at 71.% and for WC at 71.7% were higher than last year and the five-year averages. Flour protein contents (14% mb) were 8.5 and 8.7% for SW and WC, respectively. Flour ash contents for both SW and WC were higher than last year and five-year averages. Falling number values indicated sound flour samples for SW and WC. Amylograph peak viscosity values also indicated sound flour that were higher than last year, and similar to five-year three states surveyed Idaho Oregon Washington average. Starch damage values for SW and WC were lower than last year and the five-year averages. Farinograph peak and stability times showed that both SW and WC had similar weak gluten properties with lower water absorptions than last year and the five-year averages. SW showed slightly longer alveograph L value than last year, but shorter than five-year average. WC displayed longer L values than last year and the five-year averages. This year s extensograph extensibility for SW was similar to last year and the five-year averages. WC extensibility was longer than last year and five-year averages. Sponge cake volume for SW of 1214 cc was significantly larger with a slightly higher score than last year and the five-year averages. The volume for WC of 1229 cc was also bigger than last year and the five-year averages. Cookie diameters for SW and WC were bigger than last year and the five-year averages. SW and WC cookie spread factors were significantly higher than last year. Chinese Southern-Type Steamed Bread: Each flour was made into southern-type steamed bread and compared with a control flour. Specific volumes were higher for SW and WC than last year, but lower than the five-year average. Total scores were slightly higher than last year and the five-year average for SW, and similar to last year but slightly higher than the five-year average for WC. Export Cargo Survey The PNW SW export cargo data show the results of analyses of individual sublot samples including 78 drawn from the 8 crop and 47 from the 9 crop (August 9 through May ). Representative samples were selected from official Federal Grain Inspection Service samples. Grade data were the actual grades on the individual sublots. Milling and processing analyses were conducted by the Wheat Marketing Center. 31
32 PNW SOFT WHITE OVERVIEW Pacific Northwest Soft White Wheat Production in major producing states (million metric tons) SW CLUB SW CLUB SW CLUB SW CLUB SW CLUB Washington Oregon Idaho Three-state Total Three-state Total Soft White Wheat Total US Soft White Wheat Based on USDA crop estimates of September,. TEST WEIGHT Pounds/Bushel HECTOLITER WEIGHT Kilograms/Hectoliter SW Avg lb/bu Club Avg - 6. lb/bu SW Avg kg/hl Club Avg kg/hl <57 57's 58's 59's 6's 61s 62's 63's <74 74's 75's 76's 77's 78's 79's 8's 81+ WHEAT MOISTURE Percent PROTEIN (12% mb) Percent SW Avg - 9.4% Club Avg - 9.4% 's 8's 9's 's 11's 12's 13+ SW Avg - 9.7% Club Avg -.3% 's 7's 8's 9's 's 11's 12's 13+ kernel weight Grams FALLING NUMBER Seconds SW Avg g Club Avg g SW Avg sec Club Avg sec <


33 physical dough properties PNW SOFT WHITE FARINOGRAMS ALVEOGRAMS EXTENSOGRAMS high protein MEDIUM protein LOW protein AVERAGE protein CLUB 33
34 PNW SOFT WHITE harvest data 34 Soft White Soft White By Protein* Club 9 5-Year Average Low Med High All Average SW Club SW Club Wheat Grade Data: Test Weight (lb/bu) (kg/hl) Damaged Kernels (%) Foreign Material (%) Shrunken & Broken (%) Total Defects (%) Grade 2 SW 1 SW 2 SW 2 SW 1 WC 2 SW 1 WC 2 SW 1 WC Wheat Non-Grade Data: Dockage (%) Moisture (%) Protein (%) 12%/% moisture basis 8.1/ / / /11..3/11.7.3/11.7.2/11.6.4/11.8.3/11.7 Ash (%) 14%/% moisture basis 1.34/ / / / / / / / /1.52 Kernel Weight (g) Kernel Size (%) lg/md/sm 88/11/1 83/16/1 72/27/1 81/18/1 78/21/1 77/22/1 72/27/1 79//1 73/26/1 Single Kernel: Hardness Weight (mg) Diameter (mm) Sedimentation (cc) Falling Number (sec) Flour Data: Lab Mill Extraction (%) Color: L* a* b* Protein (%) 14%/% moisture basis 7./ /9.8.3/ / /.1 8.9/.3 9./.5 8.8/.2 8.8/.2 Ash (%) 14%/% moisture basis./.58.49/.57.55/.64.51/.59.48/.56.46/.53.47/.55.42/.49.42/.49 Wet Gluten (%) Gluten Index Falling Number (sec) Amylograph Viscosity 65 g (BU) Starch Damage (%) Solvent Retention Capacity (%) Water/% Sucrose 49/88 47/91 47/94 47/91 43/84 6/118 57/113 55/1 48/1 5% Lactic Acid/5% Na 2 CO 3 84/71 91/71 2/69 92/7 73/61 /93 86/88 5/83 83/77 Dough Properties: Farinograph: Peak Time (min) Stability (min) Absorption (%) Alveograph: P (mm) L (mm) P/L Ratio W (-4 joules) Extensograph: Resistance (BU) (45 min) Extensibility (cm) Area (sq cm) Baking Evaluation: Sponge Cake: Volume (cc) Score Cookie: Diameter (cm) Spread Factor (width/height) Chinese Southern-Type Steamed Bread Evaluation: Specific Volume (ml/g) Total Score % of Area Production: * Low: Less than 9.%; Medium: %; High: Greater than.5%
 1. 1.3 Grade 1 SW 1 SW Wheat Non-Grade Data: Dockage (%).3.3 Moisture (%) 9.2 9.5 Protein (%) 12%/% moisture basis.2/11.6.7/12.1 Ash (%) 14%/% moisture basis 1.31/1.52 1./1.63 Kernel Weight (g) 36.")
35 EXPORT CARGO DATA PNW SOFT WHITE Soft White 9 8 Wheat Grade Data: Test Weight (lb/bu) (kg/hl) Damaged Kernels (%).1.2 Foreign Material (%).1.1 Shrunken & Broken (%).8 1. Total Defects (%) Grade 1 SW 1 SW Wheat Non-Grade Data: Dockage (%).3.3 Moisture (%) Protein (%) 12%/% moisture basis.2/11.6.7/12.1 Ash (%) 14%/% moisture basis 1.31/ /1.63 Kernel Weight (g) Kernel Size (%) lg/md/sm 82/18/ 77/22/1 Single Kernel: Hardness Weight (mg) Diameter (mm) Sedimentation (cc) Falling Number (sec) Flour Data: Lab Mill Extraction (%) Color: L* a* b* Protein (%) 14%/% moisture basis 8.6/. 9./.5 Ash (%) 14%/% moisture basis.39/.45.42/.49 Wet Gluten (%) Gluten Index Falling Number (sec) Amylograph Viscosity 65 g (BU) Starch Damage (%) Solvent Retention Capacity (%) Water/% Sucrose 5% Lactic Acid/5% Na 2 CO 3 Dough Properties: Farinograph: Peak Time (min) Stability (min) Absorption (%) Alveograph: P (mm) L (mm) P/L Ratio W (-4 joules) Extensograph: Resistance (BU) (45 min) Extensibility (cm) Area (sq cm) Baking Evaluation: Sponge Cake: Volume (cc) Score Cookie: Diameter (cm) Spread Factor (width/height) Chinese Southern-Type Steamed Bread Evaluation: Specific Volume (ml/g) Total Score Sample Count: SW GRADE DISTRIBUTION US #3 13% Other 6% US #2 35% US #1 46% ABOUT SOFT WHITE WHEAT Low protein, low moisture wheat. Soft endosperm, white bran, weak gluten. Used in pastries, cakes, biscuits, crackers, flat breads, Asian-style noodles and snack foods. Can also be used for blending. 35
36 SOFT RED WINTER OVERVIEW Harvest Survey ABOUT soft red winter WHEAT Weather and Harvest: Soft red winter wheat (SRW) is grown over a wide area of the eastern United States. Planted area was down sharply in the fall of 9, to record lows in four states, as a wet fall delayed harvesting of row crops and prevented planting of wheat. Large carry-in stocks and prices favoring other crops also discouraged SRW planting. Ample moisture was favorable for development of wheat that did get planted. The crop was generally in very good condition by early spring. Unusually heavy, widespread rainfall in May and early June followed by unusually hot temperatures favored diseases in some areas and adversely affected quality. Rain delayed the start of harvest, but harvest then proceeded more rapidly than the five-year average pace, partly because of the small planted area. Harvesting was largely complete in the East Coast states by early July and throughout the survey area by mid-july. Survey Methods: Sample collection and analysis were conducted by CII Laboratory Services, Kansas City, Missouri. For, 347 samples were collected from elevators in 18 reporting areas in Arkansas, Illinois, Indiana, Maryland, Missouri, Ohio, North Carolina, Virginia and Kentucky. Samples were collected at two different times reflecting early and late harvest. Test weight, moisture, protein, thousand kernel weight, wheat ash and falling number were determined on individual samples, while the remaining tests were determined on 36 composite samples. The results were weighted by five-year average production for the 18 reporting areas and combined into Composite Average, East Coast and Gulf Ports values. East Coast-tributary states include Maryland, North Carolina and Virginia, while the others are considered Gulf tributary. The Analysis Methods section of this booklet identifies the test methods used. Wheat and Grade Data: The adverse growing conditions are reflected in the low average grade of #3 SRW, mainly from low test weights. Average test weight of 57.9 lb/bu (76.2 kg/hl) is.3 lb/bu (.4 kg/hl) above 9 but still well below the fiveyear average of 59.4 lb/bu (78.1 kg/hl). Average grade and test weight in the East Coast states are higher than Gulf values and are similar to the five-year averages. Both Gulf and East Coast areas have damage higher than the five-year averages, though lower than the 9 values. Protein content is slightly above last year and the five-year average for the Gulf states and a full percentage point above the five-year average in the East Coast states. DON values are below the five-year average in the East Coast states, but are well above the five-year average for the Gulf states. Average falling number values are all above. Flour and Baking Data: Buhler laboratory mill flour extraction is above the 9 value and one percentage point higher than the five-year average despite lower than average test weight. Farinograph peak and stability times are all above last year and similar to or above the five-year average, indicating good processing qualities. The alveograph W value is similar to the five-year average for the East Coast states, but below last year and the five-year average in Gulf samples. Loaf volume is similar to last year and above the five-year average. Summary: The SRW crop was affected by excessively heavy rainfall in most areas followed by unusually high temperatures which resulted in increased disease and damage, reduced test weight, and above average incidence of DON in the Gulf states. However, milling and farinograph quality are similar to or better than the five-year averages and protein content is higher than average. Buyers will need to craft specifications carefully to be sure that they receive qualities that meet their needs either for traditional soft wheat products or blending with stronger wheat. Export Cargo Survey The export cargo data represents 123 individual sublot samples for crop years and 9 from Gulf of Mexico and East Coast ports. Samples were selected from official Federal Grain Inspection Service samples, and grade data are the official grades on the individual sublots. Milling and baking analyses were conducted by CII Laboratory Services. 36 Low protein content, soft endosperm, red bran, weak gluten. Used in pastries, cakes, cookies, crackers, pretzels, and flat breads. Can also be used for blending. Nine of SIXTEEN STATES surveyed Arkansas Illinois Indiana Kentucky Maryland Missouri North Carolina Ohio Virginia

37 OVERVIEW SOFT RED WINTER TEST WEIGHT Pounds/Bushel HECTOLITER WEIGHT Kilograms/Hectoliter East Coast Avg lb/bu Gulf Avg lb/bu East Coast Avg kg/hl Gulf Avg kg/hl WHEAT MOISTURE Percent PROTEIN (12% mb) Percent 6 East Coast Avg % Gulf Avg - 13.% 's 12's 13's 14's 15's 6 East Coast Avg - 11.% Gulf Avg -.1% 's 9's 's 11's 12's 13's 14's kernel weight Grams FALLING NUMBER Seconds East Coast Avg g Gulf Avg g < East Coast Avg sec Gulf Avg sec < GRADE DISTRIBUTION* 3 SRW 47% 2 SRW 33% 5 SRW 3% 1 SRW 17% *Based on composite samples. 37
38 SOFT RED WINTER HARVEST DATA Soft Red Winter Composite Average East Coast* Gulf Ports* 9 5-Year Avg 9 5-Year Avg 9 5-Year Avg Wheat Grade Data: Test Weight (lb/bu) (kg/hl) Damaged Kernels (%) Foreign Material (%) Shrunken & Broken (%) Total Defects (%) Grade 3 SRW 3 SRW 2 SRW 2 SRW 2 SRW 2 SRW 3 SRW 3 SRW 2 SRW Wheat Non-Grade Data: Dockage (%) Moisture (%) Protein (%) 12%/% moisture basis.3/11.7./ / /12.5.9/12.4./11.4.1/ / /11.3 Ash (%) 14%/% moisture basis 1.55/ / / / / / / / /1.8 Kernel Weight (g) Kernel Size (%) lg/md/sm 8/19/1 8/19/1 83/16/1 77/22/1 83/16/1 86/13/1 81/18/1 8/19/1 83/16/1 Single Kernel: Hardness Weight (mg) Diameter (mm) Sedimentation (cc) Falling Number (sec) DON (ppm) Flour Data: Lab Mill Extraction (%) Color: L* a* b* Protein (%) 14%/% moisture basis 8.6/. 8.2/ / /.8 8.8/.3 8.4/ /9.9 8./ /9.6 Ash (%) 14%/% moisture basis.43/.51.45/.52.43/..43/..44/.51.43/..44/.51.45/.52.43/. Wet Gluten (%) Gluten Index Falling Number (sec) Amylograph Viscosity 65 g (BU) Starch Damage (%) Solvent Retention Capacity (%) Water/% Sucrose 56/7 59/115 55/8 56/9 59/118 56/112 55/4 58/1 54/5 5% Lactic Acid/5% Na 2 CO 3 116/81 117/87 1/79 119/81 122/89 113/81 113/8 114/87 7/78 Dough Properties: Farinograph: Peak Time (min) Stability (min) Absorption (%) Alveograph: P (mm) L (mm) P/L Ratio W (-4 joules) Baking Evaluation: Crumb Grain Crumb Texture Loaf Volume (cc) Cookie Spread Ratio % of Area Sampled: % 18% 82% * East Coast - Maryland, Virginia and North Carolina; Gulf Ports - Arkansas, Illinois, Indiana, Kentucky, Missouri and Ohio 38
.8.8 Moisture (%) 12.5 12.4 Protein (%) 12%/% moisture basis.2/11.6./11.4 Ash (%) 14%/% moisture basis 1.56/1.81 1.57/1.")
 349 346 DON (ppm) 1. Flour Data: Lab Mill Extraction (%) 7.7 69.8 Color: L* 92.9 93.1 a* -2.9-3. b* 8. 7.4 Protein (%) 14%/% moisture basis 8.7/.1 8.4/9.")
 383 377 Amylograph Viscosity 65 g (BU) 727 591 Starch Damage (%) Solvent Retention Capacity (%) Water/% Sucrose 5% Lactic Acid/5% Na 2 CO 3 Dough Properties: Farinograph: Peak")
39 EXPORT CARGO DATA SOFT RED WINTER Soft Red Winter 9 Wheat Grade Data: Test Weight (lb/bu) (kg/hl) Damaged Kernels (%) Foreign Material (%).1.1 Shrunken & Broken (%).9.8 Total Defects (%) Grade 2 SRW 2 SRW Wheat Non-Grade Data: Dockage (%).8.8 Moisture (%) Protein (%) 12%/% moisture basis.2/11.6./11.4 Ash (%) 14%/% moisture basis 1.56/ /1.83 Kernel Weight (g) Kernel Size (%) lg/md/sm 79/19/2 82/17/1 Single Kernel: Hardness.8 Weight (mg) 31.1 Diameter (mm) 2.29 Sedimentation (cc) Falling Number (sec) DON (ppm) 1. Flour Data: Lab Mill Extraction (%) Color: L* a* b* Protein (%) 14%/% moisture basis 8.7/.1 8.4/9.8 Ash (%) 14%/% moisture basis.41/.48.46/.54 Wet Gluten (%) Gluten Index Falling Number (sec) Amylograph Viscosity 65 g (BU) Starch Damage (%) Solvent Retention Capacity (%) Water/% Sucrose 5% Lactic Acid/5% Na 2 CO 3 Dough Properties: Farinograph: Peak Time (min) Stability (min) Absorption (%) Alveograph: P (mm) L (mm) P/L Ratio W ( -4 joules) Baking Evaluation: Crumb Grain Crumb Texture Loaf Volume (cc) Cookie Spread Ratio Sample Count: 17 6 Soft Red Winter Production in major producing states (million metric tons) Alabama Arkansas Georgia Illinois Indiana Kentucky Louisiana Maryland Michigan Mississippi Missouri North Carolina Ohio South Carolina Tennessee Virginia State Total Total SRW Production Based on USDA crop estimates of September,. FARINOGRAMS gulf ALVEOGRAMS gulf EAST COAST EAST COAST 39
Survey Overview. SRW States and Areas Surveyed. U.S. Wheat Class Production Areas. East Coast States. Gulf Port States
 Survey Overview Hard Red Winter Hard Red Spring Soft White Hard White U.S. Wheat Class Production Areas Gulf Port States East Coast States SRW States and Areas Surveyed Weather and Harvest: Soft red winter
Planting and harvest dates
 Planting and harvest dates W H E A T JAN FEB MAR APR MAY JUN JUL AUG SEP OCT NOV DEC HRW Planting HRW Harvest PLANTING HARVEST HRS Planting HRS Harvest SRW Planting SRW Harvest SW Planting SW Harvest HW
2018 CROP QUALITY REPORT
 218 CROP QUALITY REPORT Dear friends: It is my pleasure to introduce the 218 U.S. Wheat Associates (USW) Crop Quality Report. This objective information comes at a time when market conditions are creating
Arizona / California Combined Crop Analysis Desert Durum Crop Quality Report
 Arizona / California Combined Crop Analysis 2017 Desert Durum Crop Quality Report 2017 Desert Durum Crop Quality Report Desert Durum DESERT DURUM PRODUCTION Desert Durum is a registered certification mark
2016 Hard Red Wheat / Hard White Wheat. Crop Quality Report
 2016 Hard Red Wheat / Hard White Wheat Crop Quality Report California Wheat California's wheat growing regions are defined by climate, value of alternative crops, and distinct differences in variety selection.
Hard Red Winter Wheat 2018 Regional Quality Survey Hard Red Winter Wheat Regional Quality Survey 1 PHOTO CREDIT: KIMBERLY WARNER
 Hard Red Winter Wheat 2018 Regional Quality Survey 2018 Hard Red Winter Wheat Regional Quality Survey 1 PHOTO CREDIT: KIMBERLY WARNER 127 Noble Research Center Stillwater, OK 74078 ph 405.744.9333 pgiadmin@plainsgrains.org
2017 Hard Red Wheat / Hard White Wheat. Crop Quality Report
 2017 Hard Red Wheat / Hard White Wheat Crop Quality Report 2017 HR / HW Crop Quality Report 2 California Wheat California's wheat growing regions are de ined by climate, value of alternative crops, and
2015 Hard Red Wheat / Hard White Wheat. Crop Quality Report
 2015 Hard Red Wheat / Hard White Wheat Crop Quality Report California Wheat California's wheat growing regions are defined by climate, value of alternative crops, and distinct differences in variety selection.
2018 Hard Red Wheat / Hard White Wheat. Crop Quality Report
 2018 Hard Red Wheat / Hard White Wheat Crop Quality Report 2018 HR / HW Crop Quality Report 2 California Wheat California's wheat growing regions are defined by climate, value of alternative crops, and
2016 Hard Red Winter Wheat Regional Quality Survey
 2016 Hard Red Winter Wheat Regional Quality Survey Plains Grains, Inc. 127 Noble Research Center Stillwater, OK 74078 Ph 405.744.9333 pgiadmin@plainsgrains.org www.plainsgrains.org Colorado Wheat Administrative
2009 Hard Red Winter Wheat Regional Quality Survey
 PGI Plains Grains Inc. 2009 Hard Red Winter Wheat Regional Quality Survey PGI Plains Grains Inc. 321B CITD Stillwater, OK 74078 Phone: (405) 744-9333 pgiadmin@plainsgrains.org www.plainsgrains.org Colorado
Hard Red Winter Wheat 2017 Regional Quality Survey PHOTO CREDIT: KIMBERLY WARNER
 Hard Red Winter Wheat 2017 Regional Quality Survey PHOTO CREDIT: KIMBERLY WARNER 127 Noble Research Center Stillwater, OK 74078 ph 405.744.9333 pgiadmin@plainsgrains.org www.plainsgrains.org Colorado Wheat
Quality of western Canadian wheat exports 2011
 ISSN 498-9670 Quality of western Canadian wheat exports 20 Contact: Susan Stevenson Chemist, Wheat protein research Grain Research Laboratory Tel. : 204-983-334 Canadian Grain Commission Email: susan.stevenson@grainscanada.gc.ca
Wheat Quality Attributes and their Implications. Ashok Sarkar Senior Advisor, Technology Canadian International Grains Institute
 Wheat Quality Attributes and their Implications Ashok Sarkar Senior Advisor, Technology Canadian International Grains Institute Wheat Quality Attributes Wheat quality is a function of: Genetics (variety)
PGI Plains Grains Inc.
 Pc. 127 Noble Research Center, Stillwater, OK 74078 Phone: (405) 744-9333 pgiadmin@plainsgrains.org www.plainsgrains.org Pc. Colorado Wheat Administrative Committee www.coloradowheat.org Idaho Wheat Commission
Hard Red Wheat 2010 Hard White Wheat 2010
 Hard Red Wheat 2010 Hard White Wheat 2010 C R O P Q U A L I T Y R E P O R T 2010 California Wheat California s wheat growing regions are defined by climate, value of alternative crops, and the distinct
Chinese Hard-Bite Noodles (1)
") Hard White Wheat Quality Targets Dual Purpose -- Chinese Noodles and Western Pan Bread Updated on March 2, 2001 at Hard White Wheat Quality Targets Workshop Wheat Marketing Center, Portland, Oregon Chinese
Hard White Wheat Quality Targets Dual Purpose -- Chinese Noodles and Western Pan Bread Updated on March 2, 2001 at Hard White Wheat Quality Targets Workshop Wheat Marketing Center, Portland, Oregon Chinese
Minnesota. Montana. North Dakota. South Dakota. U.S. Hard Red Spring Wheat REGIONAL QUALITY REPORT 2005
 Minnesota Montana North Dakota South Dakota REGIONAL QUALITY REPORT 2005 U.S. Hard Red Spring Wheat the aristocrat of wheat Hard red spring a specialty wheat grown primarily in the Northern Plains of the
Quality of western Canadian wheat exports 2010
 ISSN 498-9670 Quality of western Canadian wheat exports 200 Contact: Susan Stevenson Chemist, Wheat protein research Grain Research Laboratory Tel. : 204-983-334 Canadian Grain Commission Email: susan.stevenson@grainscanada.gc.ca
Quality of western Canadian wheat 2006
 ISSN 498-9670 Quality of western Canadian wheat 2006 N.M. Edwards Program Manager, Bread Wheat Studies and Baking Research D.W. Hatcher Program Manager, Asian Products and Wheat Enzymes B.A. Marchylo Program
CBH 2015/16 QUALITY REPORT
 CBH 2015/16 QUALITY REPORT CBH GROUP Our business OUR CUSTOMERS Flour millers, Maltsters Feed manufacturers Food processors OUR GROWERS 4500 members 10 million tonnes production average Largest Co-op in
Quality of western Canadian wheat exports 2008
 ISSN 498-9670 Quality of western Canadian wheat exports 2008 Contact: Susan Stevenson Chemist, Wheat protein research Grain Research Laboratory Tel. : 204-983-334 Canadian Grain Commission Email: susan.stevenson@grainscanada.gc.ca
Canadian Wheat Quality Crop CWRS and CWAD
 Wheat from Western Canada QUALITY PLUS Canadian Wheat Quality - 2014 Crop CWRS and CWAD Grain Research Laboratory Canadian New Crop Missions Wheat from Western Canada QUALITY PLUS CWRS Protein Content:
Australian Crop Quality Report East Coast Wheat 2008/09
 East Coast Wheat 2008/09 A REPORT PRESENTED BY GRAIN GROWERS ASSOCIATION (GGA) AND THE GRAINS RESEARCH AND DEVELOPMENT CORPORATION (GRDC) This work is copyright. The Copyright Act 1968 permits fair dealing
U.S. Pacific Northwest Soft White Wheat Quality Report
 2014 Harvest U.S. Pacific Northwest Wheat Quality Report This project is funded by the Washington Grain Commission, Oregon Wheat Commission, Idaho Wheat Commission, Wheat Marketing Center, Inc., and U.S.
MGEX Spring Wheat 2013
 MGEX Spring Wheat 213 The Minneapolis Grain Exchange, Inc. (MGEX) has been the principal market for hard red spring (HRS) wheat since 1881, offering futures and options contracts based on this unique commodity.
Overseas Varietal Analysis Project 2009 Crop. Durum Wheat. Program by
 Cover 5.qxd 12/14/2010 12:46 PM Page 1 Overseas Varietal Analysis Project 2009 Crop Durum Wheat Program by Microspore Plantlets photo courtesy of Washington State University Greenhouse photo courtesy of
U.S. PACIFIC NORTHWEST Soft White Wheat Quality Report
 2013 Harvest U.S. PACIFIC NORTHWEST Wheat Quality Report This project is funded by the Washington Grain Commission, Oregon Wheat Commission, Idaho Wheat Commission, Wheat Marketing Center, Inc., and U.S.
U.S. Pacific Northwest Soft White Wheat Quality Report
 2015 Harvest U.S. Pacific Northwest Wheat Quality Report This project is funded by the Idaho Wheat Commission, Oregon Wheat Commission, Washington Grain Commission, U.S. Wheat Associates, and Wheat Marketing
Quality of western Canadian wheat 2011
 ISSN 1498-9654 Quality of western Canadian wheat 2011 N.M. Edwards Program Manager, Bread Wheat Research D.W. Hatcher Program Manager, Asian Products and Wheat Enzymes B.X. Fu Program Manager, Durum Wheat
UPPER MIDWEST MARKETING AREA THE BUTTER MARKET AND BEYOND
 UPPER MIDWEST MARKETING AREA THE BUTTER MARKET 1987-2000 AND BEYOND STAFF PAPER 00-01 Prepared by: Henry H. Schaefer July 2000 Federal Milk Market Administrator s Office 4570 West 77th Street Suite 210
Hard Red Winter Wheat
 Cover 2.qxd 12/14/2010 12:41 PM Page 1 Overseas Varietal Analysis Project 2009 Crop Hard Red Winter Wheat Program by Microspore Plantlets photo courtesy of Washington State University Greenhouse photo
U.S. PACIFIC NORTHWEST Soft White Wheat Quality Report
 211 Harvest U.S. PACIFIC NORTHWEST Wheat Quality Report This project is funded by the Washington Grain Commission, Oregon Wheat Commission, Idaho Wheat Commission, Wheat Marketing Center, Inc., and U.S.
Chapter 3 Dough Ingredients
 For your review, this is the first five pages of Chapter 3 of The Original Encyclopizza. To return to prior page, use your Back button. ~ To get more info on this book, go to: http://correllconcepts.com/encyclopizza/_home_encyclopizza.htm
An Overview of New Crop Quality Of CWRS, CPSR & CWRW
 Wheat from Western Canada QUALITY PLUS An Overview of New Crop Quality Of CWRS, CPSR & CWRW Ashok Sarkar Head, Milling Technology Canadian International Grains Institute asarkar@cigi.ca Cigi s Harvest
Quality of western Canadian wheat exports
 Cargo shipments l February 1 to July 31, 1999 Introduction This bulletin reports quality data for cargoes of all classes of western Canadian wheat exported by ship from February 1 to July 31, 1999. Two
Growing divergence between Arabica and Robusta exports
 Growing divergence between Arabica and Robusta exports In April 218, the ICO composite indicator decreased by.4% to an average of 112.56, with the daily price ranging between 11.49 and 114.73. Prices for
Seminar by Wendy Rohrer, Research Associate, CSES Thursday, September 21, :00 p.m. 246 Smyth Hall
 From Our Fields to Your Table? A Look at the Virginia Tech Bread Wheat Project and Possible Implications for the Future of Wheat Production in Virginia Seminar by Wendy Rohrer, Research Associate, CSES
Grain Craft. Thresher Seed Days Fort Hall, ID
 Grain Craft Thresher Seed Days Fort Hall, ID Portland, OR Pendleton, OR Blackfoot, ID Ogden, UT Salt Lake City, UT Great Falls, MT Billings, MT Rosedale, KS McPherson, KS Wichita, KS Chattanooga, TN Cleveland,
Dairy Market. May 2016
 Dairy Market R E P O R T Volume 19 No. 5 May 2016 DMI NMPF Overview Increased production per cow and expectations for additional milk production growth is dampening the outlook for milk prices for the
Federal Milk Market Administrator U.S. Department of Agriculture. H. Paul Kyburz, Market Administrator
 Federal Milk Market Administrator U.S. Department of Agriculture UPPER MIDWEST DAIRY NEWS H. Paul Kyburz, Market Administrator Volume 9, Issue 7 Upper Midwest Marketing Area, Federal Order No. 30 July
Spring Wheat Opportunities and Challenges for 2008
 Spring Wheat Opportunities and Challenges for 2008 Introduction to Opportunities and Risk Spring Wheat Production Budget The Straw Poll Making the Grade, and Now What Variety Selection and Supply Production
Fresh Deciduous Fruit (Apples, Grapes, & Pears): World Markets and Trade
: World Markets and Trade") Million MT United States Department of Agriculture Foreign Agricultural Service December 21 Fresh Deciduous Fruit (Apples, Grapes, & Pears): World Markets and Trade 21/11 Forecast: World Apple Trade Declines;
Million MT United States Department of Agriculture Foreign Agricultural Service December 21 Fresh Deciduous Fruit (Apples, Grapes, & Pears): World Markets and Trade 21/11 Forecast: World Apple Trade Declines;
Development and characterization of wheat breads with chestnut flour. Marta Gonzaga. Raquel Guiné Miguel Baptista Luísa Beirão-da-Costa Paula Correia
 Development and characterization of wheat breads with chestnut flour Marta Gonzaga Raquel Guiné Miguel Baptista Luísa Beirão-da-Costa Paula Correia 1 Introduction Bread is one of the oldest functional
Basis could avoid last fall s disaster Smaller corn crop should free up space for soybeans By Bryce Knorr
 Basis could avoid last fall s disaster Smaller corn crop should free up space for soybeans By Bryce Knorr While the futures market has offered only occasional hope this summer, the picture in the cash
Dairy Market. November 2017
 Dairy Market Dairy Management Inc. R E P O R T Volume 20 No. 10 November 2017 DMI NMPF Overview U.S. Cheddar cheese prices hit a 10-month high in October, while butter prices softened but remained well
UNITED STATES STANDARDS FOR BEANS Terms Defined
 UNITED STATES STANDARDS FOR BEANS Terms Defined 101 Beans. Beans shall be dry threshed field and garden beans, whole, broken, and split, commonly used for edible purposes. 102 Classes. 1 Beans shall be
Quality of western Canadian peas 2017
 ISSN 1920-9053 Quality of western Canadian peas 2017 Ning Wang Program Manager, Pulse Research Grain Research Laboratory Canadian Grain Commission 1404-303 Main Street Winnipeg MB R3C 3G8 www.grainscanada.gc.ca
Introduction. Materials and Methods
 Introduction wheat (Triticum turgidum L. Var ) comprises approximately % of worldwide wheat production. Most of the wheat produced in the United States is grown in North Dakota (7%), with Montana, South
United States Standards for Beans
 United States Department of Agriculture Grain Inspection, Packers and Stockyards Administration Federal Grain Inspection Service Effective December 2008 United States Standards for Beans TABLE OF CONTENTS
UPPER MIDWEST DAIRY NEWS
 Federal Milk Market Administrator U.S. Department of Agriculture UPPER MIDWEST DAIRY NEWS H. Paul Kyburz, Market Administrator Volume 15, Issue 1 Upper Midwest Marketing Area, Federal Order No. 30 January
Step by Step Wheat Farming, Milling & Quality Requirements. Dr. Irfan Hashmi
 Step by Step Wheat Farming, Milling & Quality Requirements By Dr. Irfan Hashmi Wheat Farm Cultivation Irrigation Plant Seed Grain Ready to Harvest Harvesting Country Elevator Rail Car Barge Loading Barge
Wheat Summary. MF Global Daily Report
 US research@mfglobal.com April 7, 2011 Wheat Summary MF Global Daily Report MF Global Inc. 440 S. LaSalle 20th Floor Chicago, IL 60605 Review Markets that are being supported by weather concerns always
QUALITY, PRICING AND THE PERFORMANCE OF THE WHEAT INDUSTRY IN SOUTH AFRICA
 QUALITY, PRICING AND THE PERFORMANCE OF THE WHEAT INDUSTRY IN SOUTH AFRICA 21 September 2015 Dr Johnny van der Merwe Lecturer / Agricultural economics (Prof HD van Schalkwyk and Dr PC Cloete) So what motivated
Quality of western Canadian pea beans 2011
 ISSN 1920-9096 Quality of western Canadian pea beans 2011 Ning Wang Program Manager, Pulse Research Contact: Ning Wang Program Manager, Pulse Research Tel : 204 983-2154 Email: ning.wang@grainscanada.gc.ca
Coffee market ends 2017/18 in surplus
 Coffee market ends 217/18 in surplus World coffee production in coffee year 217/18 is estimated 5.7% higher at 164.81 million bags as output of Arabica increased by 2.2% to 11.82, and Robusta grew 11.7%
UPPER MIDWEST DAIRY NEWS
 Federal Milk Market Administrator U.S. Department of Agriculture UPPER MIDWEST DAIRY NEWS H. Paul Kyburz, Market Administrator Volume 3, Issue 10 Upper Midwest Marketing Area, Federal Order No. 30 October
The Brabender GlutoPeak A new type of dough rheology
 23 nd Annual IAOM Mideast & Africa District Conference & Expo 5-8 December 2012 Abu Dhabi, United Arab Emirates The Brabender GlutoPeak A new type of dough rheology Dipl.- Ing.(FH) Markus Löns Brabender
Coffee market ends 2016/17 coffee year in deficit for the third consecutive year
 Coffee market ends 2016/17 coffee year in deficit for the third consecutive year The ICO composite indicator continued its downward trend that started at the end of August, averaging 124.46 US cents/lb.
The Brabender GlutoPeak Introduction and first results from the practice
 25 nd IAOM Mideast & Africa Conference & Expo 3-6 December 2014 Cape Town, South Africa The Brabender GlutoPeak Introduction and first results from the practice Dipl.- Ing.(FH) Markus Löns Brabender GmbH
Quality of western Canadian flaxseed 2012
 ISSN 1700-2087 Quality of western Canadian flaxseed 2012 Ann S. Puvirajah Oilseeds Contact: Ann S. Puvirajah Oilseeds Tel : 204 983-3354 Email: ann.puvirajah@grainscanada.gc.ca Fax : 204-983-0724 Grain
Coffee prices rose slightly in January 2019
 Coffee prices rose slightly in January 2019 In January 2019, the ICO composite indicator rose by 0.9% to 101.56 US cents/lb as prices for all group indicators increased. After starting at a low of 99.16
Quality of the United States Soybean Crop: Dr. Seth. L. Naeve and Dr. James H. Orf 2
 Quality of the United States Soybean Crop: 2007 1 Dr. Seth. L. Naeve and Dr. James H. Orf 2 Summary The American Soybean Association and the US Soybean Export Council have supported a survey of the quality
UNITED STATES STANDARDS FOR WHOLE DRY PEAS¹
 UNITED STATES STANDARDS FOR WHOLE DRY PEAS¹ Terms Defined 401 Definition of whole dry peas. Threshed seeds of the garden type pea plant (Pisum sativum L. and Pisum sativum var. arvense (L.) Poir.), which
MONTHLY COFFEE MARKET REPORT
 1 E MONTHLY COFFEE MARKET REPORT March 2014 Ongoing uncertainty over the Brazilian coffee crop has caused significant fluctuations in coffee prices during March, with monthly volatility of the International
Application & Method. doughlab. Torque. 10 min. Time. Dough Rheometer with Variable Temperature & Mixing Energy. Standard Method: AACCI
 T he New Standard Application & Method Torque Time 10 min Flour Dough Bread Pasta & Noodles Dough Rheometer with Variable Temperature & Mixing Energy Standard Method: AACCI 54-70.01 (dl) The is a flexible
Malting barley prices Basis FOB Swedish /Danish Port Oct 14/15/16/17/18
 t 12 September 2016 General: Malting barley harvest in Scandinavia and Baltics is now very much finished. some remaining crop on fields in Mid- Sweden. Work to sort out the quality of the harvest and looking
Dairy Market. Overview. Commercial Use of Dairy Products. U.S. Dairy Trade
 Dairy Market Dairy Management Inc. R E P O R T Volume 19 No. 11 November 2016 DMI NMPF Overview Four straight months of rising milk prices and three straight months of falling feed costs have brought some
2018/19 expected to be the second year of surplus
 2018/19 expected to be the second year of surplus Coffee year 2018/19 is expected to be the second consecutive season of surplus, as global output, estimated at 167.47 million bags, exceeds world consumption,
WEEKLY MAIZE REPORT 30 OCTOBER 2018
 WEEKLY MAIZE REPORT 30 OCTOBER 2018 Unigrain (Pty) Ltd Tel. No. : +27 11 692 4400 Fax. No. : +27 11 412 1183 INTERNATIONAL MARKET Table 1: CME Maize prices and weekly changes (cents/bushel) Currently 23/10/2018
Acreage Forecast
 World (John Sandbakken and Larry Kleingartner) The sunflower is native to North America but commercialization of the plant took place in Russia. Sunflower oil is the preferred oil in most of Europe, Mexico
The C.W. Brabender 3-Phase-System Tools for Quality Control, Research and Development
 The C.W. Brabender 3-Phase-System Tools for Quality Control, Research and Development Dr. Jens Dreisoerner, Head of Food Laboratory Brabender GmbH & Co.KG Duisburg - Germany Content Content 1. History
Influence of GA 3 Sizing Sprays on Ruby Seedless
 University of California Tulare County Cooperative Extension Influence of GA 3 Sizing Sprays on Ruby Seedless Pub. TB8-97 Introduction: The majority of Ruby Seedless table grapes grown and marketed over
GENOTYPIC AND ENVIRONMENTAL EFFECTS ON BREAD-MAKING QUALITY OF WINTER WHEAT IN ROMANIA
 GENOTYPIC AND ENVIRONMENTAL EFFECTS ON BREAD-MAKING QUALITY OF WINTER WHEAT IN ROMANIA Mihaela Tianu, Nicolae N. Sãulescu and Gheorghe Ittu ABSTRACT Bread-making quality was analysed in two sets of wheat
Dairy Market R E P O R T
 Volume 18 No. 8 Dairy Market R E P O R T August 2015 DMI NMPF Overview Milk prices in many major milk-producing countries have plummeted to levels that are producing severe financial stress for their farmers.
Record exports in coffee year 2017/18
 Record exports in coffee year 2017/18 Total coffee exports increased each year since 2010/11 with a new record reached in 2017/18 at 121.86 million bags, 2% higher than 2016/17. In the twelve months ending
Quality of Canadian oilseed-type soybeans 2016
 ISSN 1705-9453 Quality of Canadian oilseed-type soybeans 2016 Véronique J. Barthet Program Manager, Oilseeds Section Contact: Véronique J. Barthet Program Manager, Oilseeds Section Tel : 204 984-5174 Email:
Cultivation Pattern:
 Introduction: Cumin seed commonly know as Jeera (Cuminum cyminum) belongs to Apiacae family. Though Cumin is a native of Egypt, it now mostly produced in India. India is the largest producer and consumer
Gluten Index. Application & Method. Measure Gluten Quantity and Quality
 Gluten Index Application & Method Wheat & Flour Dough Bread Pasta Measure Gluten Quantity and Quality GI The World Standard Gluten Tes t Gluten Index: AACC/No. 38-12.02 ICC/No. 155&158 Wet Gluten Content:
MANGO PERFORMANCE BENCHMARK REPORT
 MANGO PERFORMANCE BENCHMARK REPORT 2015-2016 TABLE OF CONTENTS Page 3 Page 5 Page 12 Page 15 Page 27 Page 36 Page 46 Approach and Data Set Parameters Overview and Mango Trend-Spotting Fruit and Tropical
Potatoes 2011 Summary
 United States Department of Agriculture National Agricultural Statistics Service Potatoes 0 Summary September 0 ISSN: Contents Introduction... Narrative... Potato Utilization United States: 000... 0 Potato
Clean. Consistent. Quality.
 Clean. Consistent. Quality. 2018 CROP IN REVIEW 1 2018 Canadian Wheat Crop in Review Clean. Canadian wheat is sustainably produced by farmers using modern farming practises supported by Canada s natural
India. Oilseeds and Products Update. August 2012
 THIS REPORT CONTAINS ASSESSMENTS OF COMMODITY AND TRADE ISSUES MADE BY STAFF AND NOT NECESSARILY STATEMENTS OF OFFICIAL U.S. GOVERNMENT POLICY Required Report - public distribution Oilseeds and Products
Pinto and Great Northern Bean Prices: Historical Trends and Seasonal Patterns
 EXTENSION EC825 Pinto and Great Northern Bean Prices: Historical Trends and Seasonal Patterns Jessica J. Johnson Extension Educator-Agricultural Economics Cover photo by David Ostdiek 2 The Board of Regents
Coffee market continues downward trend
 Coffee market continues downward trend Since August 2017, the ICO composite indicator price has declined in each month except January 2018. The composite indicator decreased by 1.1% in March 2018 to an
Soft Commodity Markets - Upcoming Milestones, and How the Market Could Be Affected
 Soft Commodity Markets - Upcoming Milestones, and How the Market Could Be Affected September 15, 2014 Judith Ganes President J. Ganes Consulting, LLC Weather & Politics Current Weather Expectations El
SPRING WHEAT FUTURES AND OPTIONS
 SPRING WHEAT FUTURES AND OPTIONS W hether it s a farmer near Minot, a trader in Minneapolis or a there is only one place to look when it comes to hard red spring WORLD S LARGEST SPRING WHEAT MARKET Since
Quality of western Canadian flaxseed 2013
 ISSN 1700-2087 Quality of western Canadian flaxseed 2013 Ann S. Puvirajah Oilseeds Contact: Ann S. Puvirajah Oilseeds Tel : 204 983-3354 Email: mailto:ann.puvirajah@grainscanada.gc.ca Fax : 204-983-0724
Dairy Market. October 2016
 Dairy Market Dairy Management Inc. R E P O R T Volume 19 No. 10 October 2016 DMI NMPF Overview Milk prices continued a generally solid recovery from their late-spring low through August, when the U.S.
The Potential of Enzymes to Improve the Price/ Performance Ratio of Flour
 The Potential of Enzymes to Improve the Price/ Performance Ratio of Flour Lutz Popper, Ph.D., Head R & D Mühlenchemie GmbH & Co. KG Ahrensburg, Germany LP04012001 LP27112014 2 Properties of High Quality
2016 USE YOUR NOODLE Pasta Trivia
 2016 USE YOUR NOODLE Pasta Trivia North Dakota is the largest producer of durum in the United States. In addition, pasta is not only easy to make, it s nutritious too. Join in the fun of celebrating National
Coffee market remains volatile but lacks direction
 Coffee market remains volatile but lacks direction Prices fluctuated significantly during August, with the ICO composite indicator dropping by 10 cents before jumping back up another 12 cents by the end
MONTHLY COFFEE MARKET REPORT
 E MONTHLY COFFEE MARKET REPORT June 2013 Coffee prices fell sharply in June 2013, as market fundamentals, combined with an uncertain macroeconomic outlook, drove the ICO composite indicator price to its
Description of CDC Tatra and CDC Yon spring emmer wheat cultivars.
 Description of CDC Tatra and CDC Yon spring emmer wheat cultivars. Background: Currently, most of the emmer product sold in Canada is imported from either Italy or the USA. Emmer produced in Italy has
Dairy Market. Overview. Commercial Use of Dairy Products. U.S. Dairy Trade
 Dairy Market Dairy Management Inc. R E P O R T Volume 21 No. 5 May 2018 DMI NMPF Overview Many of the key dairy market statistics reported for March and April indicated that milk prices for U.S. dairy
WEEKLY OILSEED REPORT 27 JUNE 2018
 WEEKLY OILSEED REPORT 27 JUNE 218 Unigrain (Pty) Ltd Tel. No. : +27 11 692 44 Fax. No. : +27 11 412 1183 INTERNATIONAL MARKET Table 1: CME Soybean prices and weekly change (cents/bushel) Currently 2/6/218
CALIFORNIA PREMIUM ALMONDS
 CALIFORNIA PREMIUM ALMONDS PRODUCT CATALOG history This amazing little nut made its first known appearance in 1400 BC. The book of Numbers in the Bible tells of Aaron s rod that blossomed and bore almonds,
Native Grass Cultivars/Selections Information Sheet Conservation Specification Information Sheet
 NATIVE GRASS CULTIVARS AND SELECTIONS FOR USE IN MISSOURI This guidance is to assist in the development of seeding plans designed with specific selections/cultivars that fit the soil and site conditions
western Canadian flaxseed 2003
 Quality of western Canadian flaxseed 2003 Douglas R. DeClercq Program Manager, Oilseeds Services James K. Daun Section Head, Oilseeds and Pulses Contact: Douglas R. DeClercq Program Manager, Oilseeds Services
WEEKLY MAIZE REPORT 13 JUNE 2018
 17/08/01 17/08/15 17/08/29 17/09/12 17/09/26 17/10/10 17/10/24 17/11/07 17/11/21 17/12/05 17/12/19 18/01/02 18/01/16 18/01/30 18/02/13 18/02/27 18/03/13 18/03/27 18/04/10 18/04/24 18/05/08 18/05/22 18/06/05