Induced Changes in Phenolic Composition of Wines After Foliar Application of Eugenol and Guaiacol Solutions to Grapevines
|
|
|
- Meghan Hardy
- 6 years ago
- Views:
Transcription
1 Journal of Agricultural Science; Vol. 5, No. 9; 2013 ISSN E-ISSN Published by Canadian Center of Science and Education Induced Changes in Phenolic Composition of Wines After Foliar Application of Eugenol and Guaiacol Solutions to Grapevines Ana I Pardo-García 1, Ana M Martínez-Gil 1, Francisco Pardo 2, Gonzalo L. Alonso 1 & M Rosario Salinas 1 1 Cátedra de Química Agrícola. E.T.S.I. Agrónomos. Universidad de Castilla-La Mancha. Avda. España s/n., Albacete 02071, Spain 2 Bodega San Isidro (BSI), Carretera de Murcia s/n, Jumilla 30520, Murcia, Spain Correspondence: M Rosario Salinas, Cátedra de Química Agrícola. E.T.S.I. Agrónomos. Universidad de Castilla-La Mancha. Avda. España s/n., Albacete 02071, Spain. Tel: Fax: Rosario.Salinas@uclm.es Received: July 12, 2013 Accepted: August 1, 2013 Online Published: August 15, 2013 doi: /jas.v5n9p179 URL: Abstract Due to the beneficial properties of polyphenols in wines and the effect of external factors on them, this work evaluates the effect of the foliar application of eugenol and guaiacol on grapevines on the phenolic composition of wines elaborated from such grapes. Three different treatments were carried out on cv. Monastrell at veraison time: eugenol, guaiacol and eugenol + guaiacol. Several families of phenolic compounds were studied in wines at three different sampling times, including phenolic acids, stilbenes, flavanols, flavonols and anthocyanins, which were analysed by HPLC-DAD-MS. Eugenol treatment enhanced the concentration of the studied compounds, guaiacol produced changes in the compounds related to primary metabolism, such as sugar and acids, as well in some polyphenols, but when eugenol and guaiacol were applied altogether similar changes to eugenol alone were observed, such as an increase in the content of anthocyanins and stilbenes among other phenolic compounds. Results suggest that foliar applications of eugenol on Monastrell grapevines (alone or together with guaiacol) could be considered as an important stimulant for production of grape polyphenols, implicated in quality color, as well as in beneficial properties on human health. Keywords: eugenol, guaiacol, grapevines, wines, polyphenols 1. Introduction Phenolic compounds are secondary plant metabolites synthesized by the shikimic acid rute. They have an important contribution on wine characteristics, such as color, astringency and bitterness. The biosynthesis of phenolic compounds in grapes is regulated by genetic factors, as well as the environment, climatic conditions and agronomic strategies (Vilanova, Santalla, & Masa, 2009). The presence and quantity of these compounds in wines depend on their content in grapes, but also the winemaking techniques and conservation conditions of the wines, since phenolic compounds are implicated in a variety of reactions in wines, such as enzymatic, polymerisation, copigmentation and precipitation reactions, which cause changes throughout the life of a wine. Color is one of the most important quality parameters of wines, being the anthocyanins (red pigments present in grapes) the main contributors to color in a red wine. There are different structures of anthocyanins and derived of them which have diverse stability against certain factors such as ph, temperature, light or SO 2. From the first steps of the winemaking process to the ageing of the wine, monomeric anthocyanins are implicated in different phenomena. They can interact with themselves, resulting in polymerization, thereby increasing their stability and as consequence, the stability of the wine color. Moreover, other phenolic compounds, such as phenolic acids, flavanols and flavonols can interact as copigments with anthocyanins to form more stable structures. Depending on the compound, their effect as copigment is different. Flavanols seem to be the less effective copigments compared with hydroxicinnamic acids and flavonols, which enhance the color of malvidin-3-glucoside in model wine solutions (Gómez-Míguez, González-Manzano, Escribano-Bailón, Heredia, & Santos-Buelga, 2006), although their addition of them has variable effects depending on the grape cultivar (Schwarz, Picazo-Bacete, Winterhalter, & Hermosín-Gutiérrez, 2005). Recently, González-Manzano, Dueñas, Rivas-Gonzalo, Escribano-Bailón, and Santos-Buelga (2009) reported that flavanols induced changes in the color, perceptible to 179
2 human eye. So, the levels of these copigments are as important as the levels of anthocyanins in determining the color of red wine. The production of an effective copigmentation is also due to winemaking practices. Some studies show how different foliar applications on grapevines can modify the concentration of these compounds in both grapes and wines; so, Carmona, Peñaranda, Carrascal, Zalacain, and Salinas (2001) carried out one of the first studies related to vegetal extracts applied to vineyard, showing a significant increase in the color of Bobal grapes; Parrado et al. (2007) showed that the application of an vegetable extract on cv. Tempranillo, using a drip system, can enhance the concentration of anthocyanins in grapes. Recently, it has been reported that abscisic acid treatments enhance the synthesis of anthocyanins and flavonols depending on the cultivar (Sandhu, Gray, Lu, & Gu, 2011). Other studies showed changes in the aroma composition of grapes and the wines produced after foliar application of an aqueous oak extract (Martínez-Gil et al., 2013; Martínez-Gil, Garde-Cerdán, Martínez, Alonso, & Salinas, 2011; Martínez-Gil, Garde-Cerdán, Zalacain, Pardo-García, & Salinas, 2012). Oak extract is composed by a diversity of compounds, such as polyphenols and volatiles, being eugenol and guaiacol among them. So, treatments with both of these compounds were studied, showing that eugenol and guaiacol solution applied to grapevines resulted in changes in the volatile composition of wines and not only produced a considerably higher concentration of free eugenol and guaiacol compounds, but also modified the concentrations of other volatiles (Martínez-Gil et al., 2012), suggesting that these compounds were assimilated by the plant and accumulated in grapes. It had been also demonstrated that exogenous eugenol and guaiacol affected the volatile composition of tomatoes (Pardo-García, Martínez-Gil, López-Córcoles, Zalacain, & Salinas, 2012), which seemed to be modulated by the treatments. Guaiacol and eugenol were absorbed by tomato plants after the exposure to a surrounding atmosphere as well after foliar treatment; both of them increased their content and changed the content of other volatile compounds in the fruits. Such effect could be due to a stimulation on the volatile production mechanism. Eugenol is a phenylpropanoid while guaiacol is a phenylpropanoid derived. Both compounds are also products of the secondary metabolism of the plants and they are present in grapes and wines. Phenylpropanoids are a large group of plant volatile compounds that play multiple roles in the structure, the plant protection against pathogens (Gang et al., 2001) and they have important effects on product qualities such as flavour and color (Dixon, Lamb, Masoud, Sewalt, & Paiva, 1996). Due to the fact that plant phenylpropanoid pathway is responsible for the synthesis of a wide variety of secondary metabolic compounds, including lignins, salicylates, coumarins, hydroxycinnamic amides, flavonoid phytoalexins, pigments, and antioxidants (Dixon et al., 1996), it could be suggested that any modification in the concentration of any compound could change the content of their products. In addition, it is also known that eugenol is a phenylpropanoid involved in defense mechanisms of the plants, whereas other phenolic compounds are related to the quality of wines. However, there is scarce literature about guaiacol implication in this role in plants. The above evidences suggest that exogenous eugenol and guaiacol solutions applied to the grapevines could affect the secondary metabolites content of grapes such as the phenolic compounds and, as a consequence, in the produced wines. So, the aim of this study was to examine how the foliar applications of exogenous eugenol and guaiacol solutions to grapevines affect to the content and evolution of the main phenolic compounds in wines, such as phenolic acids, stilbenes, flavanols, flavonols and anthocyanins. 2. Materials and Methods 2.1 Chemicals and Standards Eugenol and guaiacol were purchased from Sigma-Aldrich (Steinheim, Germany), as well as the standards employed to identify and quantify phenolic compounds such as: (+)-catechin, caffeic acid, p-coumaric acid, (-)-epicatechin, ferulic acid, gallic acid, kaempferol, quercetin dihydrate, t-resveratrol, syringic acid and vanillic acid. Malvidin-3-O-glucoside (Mv-3-G), Quercetin-3-O-glucoside (Q-3-G) and Kaempferol-3-O-glucoside (K-3-G) standard were obtained from Extrasynthése (Geneay, France). HPLC-grade acetonitrile was purchased from Panreac (Barcelona, Spain). 2.2 Grapevine Treatments Experiment was carried out during the year 2010 in the experimental plot of BSI winery ( Jumilla, Southwest of Spain), latitude 38º 28 N, longitude 1º 18 W. The plot covered an area of 1.09 ha and had a loam soil (8.7 ph, 7.5% lime, meq/l of sulfates and 1% of organic matter). 8-year-old grapevines (Vitis vinifera cv. Monastrell ) were cultivated on a trellis system (2.8 x 1.5 m), fitted with a drip irrigation system and subjected 180
3 to the same pruning practices. Similar climatic conditions were observed during the last years, with an annual average temperature of 16 ºC (minimum of -15 ºC in January and a maximum of 40 ºC in August). Treatments were carried out over plants located in an edaphologically homogeneous part of the plot, avoiding its edges. All plants were disposed in rows, using 10 of them for the experiment. Each treatment was carried out over 16 different plants selected among the rows, so that treated and untreated rows were alternated to avoid contamination. Moreover, 16 additional plants were selected as control. The treatments were carried out when the environmental temperature was below 20 ºC, at approximately 8 o clock in the morning. Each was applied at the 7 th day of veraison. Treatments consisted of different aqueous solutions of reference compounds namely: eugenol (E treatment), guaiacol (G treatment) and eugenol+guaiacol (E+G treatment) in a concentration of 0.6% (v/v). A total of 5 L of each solution was directly sprayed over leaves (each plant was treated with 300 ml of solution approximately). For all treatments, 0.05 % (v/v) of adjuvant Fluvius (BASF, Germany) was added, since this is a superficial wetting agent typically used for treatments with foliar herbicides, constituted by an inert mixture of polymers. Due to the fact that guaiacol and eugenol are present in grapes and wines, the applied quantity of each compound was chosen according to Martínez-Gil et al. (2012) and Pardo-García et al. (2012). 2.3 Winemaking Healthy grapes were harvested on September 9 th, at their optimum maturation moment with the ºBaumé/titratable acidity (g L -1 tartaric acid) ratio between 2.3 and 2.5. Grapes were processed by the red winemaking traditional method. Grapes of each treatment were crushed, destemed, divided and placed into two 30 L stainless steel tanks (2 wines from each treatment were obtained). 80 mg/l of sulphur dioxide were added to each tank. After that, 20 g hl -1 of yeast, UCLM S377 strain (Springer Oenologie) were inoculated to carry out the alcoholic fermentation, which took placed at a temperature of 22 ± 1 C. After 11 days of maceration-fermentation, skins were removed with a traditional vertical hand-press. Then, each wine was given back to its tank to complete the alcoholic fermentation. Malolactic fermentation was induced using 8 g hl -1 of a commercial bacterium strain, Lall II-4 (Lallemand). The malolactic fermentation was carried out in 5 L tanks. Once this step finalized, the wines were bottled and stored for six month. Three wine sampling times were performed: at the end of the alcoholic fermentation (AF), the malolactic fermentation (MLF) and after six months of MLF. Wine samples were frozen at -20 ºC until analysis. 2.4 Analyses Eugenol and Guaiacol Determination by SBSE-GC-MS The wine volatile compounds were extracted by stir bar sorptive extraction (SBSE) according to Marín, Zalacain, De Miguel, Alonso, & Salinas (2005) and were analysed by gas chromatography-mass spectrometry (GC-MS). The polydimethylsiloxane coated stir bar (0.5 mm film thickness, 10 mm length, Twister, Gerstel, Mülheim and der Ruhr, Germany) was introduced into 25 ml of wine, to which 62.5 µl of internal standards γ-hexalactone and 3-methyl-1-pentanol solution at 1 µl ml -1, both in absolute ethanol (Merck, Damstard, Germany) was added. All samples were stirred at 500 rpm at room temperature for 60 min. The stir bar was then removed from the sample, rinsed with distilled water and dried with a cellulose tissue, and later transferred into a thermal desorption tube for GC MS analysis. Thermal desorption was performed on a TD with a PTV injector "Programmed-Temperature Vaporization" CIS-4 Gerstel installed on an Agilent 7890A GC- 5975C insert XL MDS (Agilent Technologies, Palo Alto, CA, USA). Volatile compounds were desorbed from the stir bar at the following conditions: oven temperature at 330ºC; desorption time, 4 min; cold trap temperature, -30ºC; helium inlet flow, 45 ml/min. The compounds were transferred into the gas chromatograph with a fused silica capillary column (BP21 stationary phase, 50 m length, 0.22 mm i.d., and 0.25 μm film thickness; SGE, Ringwood, Australia). The chromatographic program was set at 40ºC (held for 2 min), raised to 150ºC at 10ºC/min (held for 5 min) and then raised to 230ºC at 10ºC/min (held for 2 min). The total time analysis was 28 minutes. For mass spectrometry analysis, electron impact mode (EI) at 70 ev was used. The mass range varied from 35 to 500 u and the detector temperature was 150ºC. The identification and quantification were carried out in the SCAN mode. The analysis of volatile compounds in each wine sample was done in duplicate, and as the fermentations were done also in duplicate, the results showed for these compounds were the mean of 4 analyses. The identity of peaks was assigned using the NIST library and confirmed by the retention time of standards. The m/z employed for quantification was 109 and 164 for guaiacol and eugenol respectively. The quantification was based on five-point calibration curves of respective standards (Aldrich, Steinheim, Germany) (R 2 > 0.97) in ethanol-water solutions (12% v/v, ph= 3.6, 5g L -1 tartaric acid). 181
4 2.4.2 Oenological Parameters The classical parameters of wines such as alcoholic degree (ºA), ph, total acidity and volatile acidity were analysed by an equipment based on infrared spectroscopy (FT-IR Multispec of TDI) for liquid samples analysis attending the methods established by ECC (1990) Phenolic Compounds Determination by HPLC-DAD-MS Table 1. Retention times (Rt), ionization mode (ESI/MS), molecular weight and molecular ion (m/z) used for identification of hydroxycinnamic ester acids, flavonols and anthocyanins by MM-ESI-MS detector Compound assignation Hydroxycinnamic ester acids HPLC, Rt(min) ESI/MS mode Molecular weight Molecular ion (m/z) t-caftaric acid negative t-coutaric acid negative Flavonols Myricetin 3-O-galactoside negative Myricetin 3-O-glucuronide a negative Myricetin 3-O-glucoside a negative Quercetin 3-O-galactoside negative Quercetin 3-O-glucuronide b negative Quercetin 3-O-glucoside b negative Laricitrin 3-O-glucoside/galactoside negative Kaempferol 3-O-glucoside positive Syringetin 3-O-glucoside negative Myricetin negative Quercetine negative Kaempferol positive Anthocyanins Delphinidin 3-O-glucoside positive Cyanidin 3-O-glucoside positive Petunidin 3-O-glucoside positive Peonidin 3-O-glucoside positive Malvidin 3-O-glucoside positive Petunidin 3-O-(6-O-acetyl)-glucoside positive Peonidin 3-O-(6-acetyl)-glucoside positive Malvidin 3-O-(6-acetyl)-glucoside positive Malvidin 3-(6-t-caffeoyl-glucoside positive Cyanidin 3-(6-p-coumaroyl)-glucoside positive Petunidin 3-(6-p-coumaroyl)-glucoside positive Malvidin 3-(6-p-coumaroyl)-glucoside positive Vitisin A Malvidin 3-O-glucoside positive Vitisin B Malvidin 3-O-glucoside positive a Compounds coeluted, b Compounds coeluted. 1 It could be glucoside or galactoside of laricitrin. 182
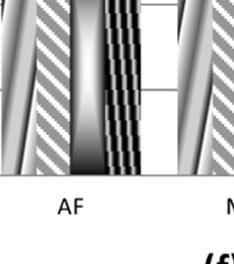
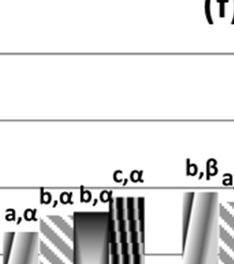
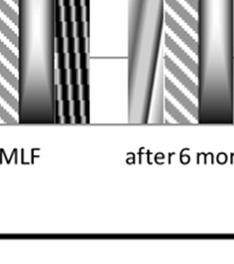
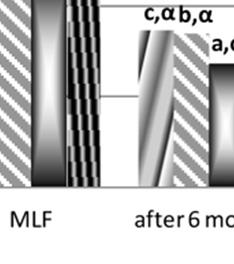
5 The studied compounds belong to different phenolic families, such as phenolic acids, stilbenes, flavanols, flavonols and anthocyanins. A multi-objective function had been defined as a criterion for obtaining a satisfactory compromise among number of compounds separated, resolution and analysis time. Only the most important of these families were measured, taking into account different aspects like their abundance in wines, contribution in reactions related with color stabilization and importance in human health. The chromatographic conditions were adapted from the Cozzolino et al. (2004) for red wines, with the addition of a mass spectrometer detector. The samples were filtered through a PVDF Durapore filter of 0.45 µm (Millipore, Bedford, MA) and 20 μl were injected into an Agilent 1200 high performance liquid chromatograph (HPLC, Palo Alto, CA) equipped with a Diode Array Detector (DAD, Agilent G1315D) and a Mass Spectrometer (6130 Quadrupole LC/MS, G1956B (SL)) multimode electrospray and atmospheric pressure chemical ionization (MM-ESI/APCI-MS) system, coupled to an Agilent Chem Station (version B.03.01) data-processing station. Separation was performed on a reversed-phase Zorbax-Eclipse XDB-C18 (4.6 mm x 150 mm, 5 μm particle sizes) and a precolumn of the same material at 30 ºC. The HPLC grade solvents used were water/formic acid/acetonitrile (97.5:1.5:1, v/v/v) as solvent A and acetonitrile/formic acid/solvent A (78.5:1.5:20, v/v/v) as solvent B. The elution gradient for solvent B was as follows: 0 min, 5%; 2 min, 10%; 7 min, 14.5%; 10 min, 18.5%; 12 min, 20%; 17 min, 20%; 28 min, 30%; 30 min, 30%; 32 min, 50.5%; 38 min, 80%; 40 min, 100%. The system was equilibrated with the starting conditions during 10 minutes prior to injection of the next sample. The flow rate was 0.5 ml min -1. Phenolic acids, stilbenes and flavanols detection was carried out with the DAD detector by comparison with the corresponding UV-vis spectra and retention time of their pure standards in the chromatogram. Standard of piceid-t-resveratrol were not available, so it was tentatively identified by spectral parameters (Jeandet, 1997). T-caftaric acid and t-coutaric acid neither were available, so they were identified with the molecular ion and the spectral parameters, which were very close to their analogous caffeic and coumaric acids (Peña-Neira, Hernández, García-Vallejo, Estrella, & Suarez, 2000). Compounds were quantified and identified at different wavelength: (+) catechin, (-)-epicatechin, gallic acid and syringic acid at 280 nm; vanillic acid at 256 nm; t-caffeic acid and caftaric acid at 324 nm, while t-resveratrol, piceid-t-resveratrol, p-coumaric acid and t-p-coutaric acid were quantified at 308 nm. The flavonols and anthocyanins whose standard were not available were identified on the basis of their molecular ion (showed in Table 1, including also the hydroxycinnamic ester acids, altogether with the ionization mode) by electrospray ionization mass spectrometry (MM-ESI-MS) and the bibliography, according to UV-vis spectra and elution order (Castillo-Muñoz, González, Alonso, Romero, & Gutiérrez, 2009). The parameters employed for MM-ESI-MS were: dry gas, N 2, 10 ml/min; drying temperature, 350 ºC; vaporizer temperature, 200 ºC; nebulizer, 55 psi; capillary, 2000 V (positive and negative ionization mode); scan range, m/z. Negative mode was used in the identification of hydroxycinnamic ester acids and flavonols, while positive mode was used in anthocyanins. Quantification was done using the spectra obtained by DAD; flavonols at 360 nm and anthocyanins at 520 nm. For quantification, calibration curves were obtained with solutions of the available standards in ethanol-water (12% v/v, ph= 3.6, 5g L -1 tartaric acid). T-piceid-resveratrol was expressed as t-resveratrol equivalents, t-caftaric acid as t-caffeic acid, t-p-coutaric acid as p-coumaric acid, the flavonol glycosides were quantified as Q-3-G equivalents, myricetin as quercetin equivalent and the anthocyanins as Mv-3-G equivalents Total Phenolic Content, Total Anthocyanins and Color Intensity Determination by UV-vis Spectrophotometry Parameters such as total phenolic index (TPI), total anthocyanins (TA) and color intensity (CI) were measured with a Lambda 25 UV-vis spectrophotometer (Perkin Elmer, Norwalk, CT). In all cases, samples were first filtered through a PVDF Durapore filter of 0.45µm (Millipore, Bedford, MA). TPI was determined at 280 nm according to Singleton & Rossi (1965), TA was measured at 520 nm according to Puissant-Leon and CI was determined following Glories method measuring absorbance at 420, 520, and 620 nm (Glories, 1984). 2.5 Sensorial Analysis Three visual phase descriptors and spicy aromatic series were evaluated by a panel of eight expert judges between 30 and 55 years old, after alcoholic, malolactic fermentation and after six months. The panellists rated each attribute on a scale from 1 (absence) to 7 (maximum presence). 2.6 Statistical Analysis The statistical analysis of the data was performed using SPSS Version 19.0 statistical package for Windows (SPSS, Chicago, IL). Phenolic compounds data were processed using variance analysis (ANOVA). Differences 183
6 between means were compared using the least significant difference (LSD) test at a 0.05 probability level. Statgraphics Plus 5.1 (STSC Inc., Rockville, MD, USA) was used to perform the simple regression and principal component analyses. 3. Results and Discussion 3.1 Eugenol and Guaiacol by SBSE-GC-MS Concentrations of these volatile compounds in wines from treated grapevines are shown in Table 2. We can observe that the content of both compounds changed depending on the treatment carried out. Regarding to guaiacol, it did not change when E treatment was carried out, while the concentration increased when G and E+G treatment were applied, regardless of sampling time, being in the last case when the highest change took place (1150% respect to control, while it was 210% when only G was applied). On the other hand, the eugenol content also varied depending on the treatment. In G wines, eugenol concentration was higher than in control. Although in both cases (G and control) concentrations were much lower comparing with E and E+G wines, the increase in G wines was about 250% respect to control), the increase in percentage was high, although in absolute value the differences ranged between 4-5 μg/l, while greater increase of that compound were produced by the effect of E treatment (20000%). Eugenol also increased in a higher degree when the E+G treatment were carried out, as happened with guaiacol. In the three treatments (E, G, E+G), the same quantity of eugenol and guaiacol was applied (0.6% (v/v)), but the increase of both volatiles in wines was different, depending on the compound and treatment carried out. Maybe the variations could be due to the fact that the assimilation of these exogenous compounds by the plant was different, as well the translocation step or the way in which the volatiles were stored in the plant. Some studies suggest that glycosylation is one of storage medium of volatile compounds, which limits the toxicity of some of them, as the glycosides are much more water soluble than aglycons, so they are considered to be vectors for the transport and accumulation of such compounds in plants (Winterhalter & Skouroumounis, 1997). The aroma glycosidic precursors are a diverse group of odorless compounds which can suffer hydrolysis by acids or enzymes, giving the odour-active aglycones (Gunata, Bayonove, Baumes, & Cordonnier, 1985). An increase of glycosylated forms of guaiacol and 4-methylguaiacol were observed when grapevines were exposed to smoke from the fire forests (Singh et al., 2011). On the other hand, when both volatiles were applied together, higher volatile concentration of each compound was produced in wines than when they were applied independently. Moreover, similar concentrations of each compound were observed at different sampling times. This synergic effect could be due to the fact that plants were stimulated to produce more of these compounds and the absorption was higher or maybe there was a different degree in the hydrolysis of their precursors, giving their aglycones, so higher proportion of volatile compounds was generated. Anyway, these results suggest that the application of exogenous eugenol and guaiacol compounds modified the composition of grapes in a similar way that was observed with Verdejo and Petit Verdot wines after oak extract application (Martínez-Gil et al., 2012). Eugenol and guaiacol concentrations in wines overcame their respectively odor threshold, which provides to wines nice aromatic spicy notes. Eugenol is a component of clove (85-95%) and other spices such as basil and cinnamon, which are used as food flavouring; it is also used as food additives, as well in dental material. On the other hand, guaiacol is a component of the smoke employed to conserve food (smoke food). Although eugenol and guaiacol concentrations in wines were elevated, they are much lower than their toxicity level (DL 50 orally in rats: 2680 and 725 mg kg -1 respectively (The Merck Index)), which means a person (65 kg) should drink L and L of wine to reach those concentration of eugenol and guaiacol, respectively. Table 2. Volatil content of guaiacol and eugenol in the wines produced from the treated grapevines at the end of the alcoholic fermentation (AF), malolactic fermentation (MLF) and after 6 months of MLF Treatment Guaiacol content (μg/l) Eugenol content (μg/l) AF MLF 6 months AF MLF 6 months control 48 ± 12 α,a 55 ± 10 α,a 59 ± 3 α,a 1.49 ± 0.14 α,a 1.87 ± 0.21 β,a 1.72 ± 0.13 αβ,a E 46 ± 11 α,a 51 ± 6 α,a 43 ± 6 α,a 250 ± 40 α,c 310 ± 20 α,c 280 ± 30 α,c G 150 ± 10 α,b 180 ± 20 α,b 150 ± 14 α,b 5.4 ± 0.7 α,b 7.0 ± 0.6 β,b 6.6 ± 0.9 αβ,b E+G 600 ± 40 α,c 560 ± 50 α,c 550 ± 30 α,c 530 ± 44 α,d 530 ± 43 α,d 570 ± 40 α,d 184
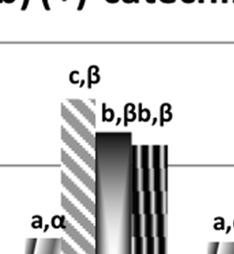
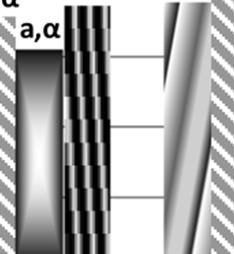
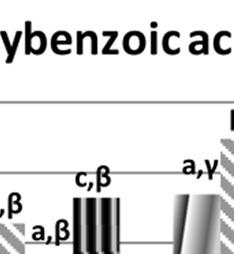
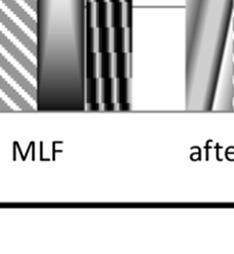
7 All parameters are given with their standard deviation (n=4). E: wine from grapevines eugenol treatment; G: wine from grapevines guaiacol treatment; E+G: wine from grapevines eugenol and guaiacol treatment. Different Greek letters in the same row indicate differences among the sampling times, while different Latin letters in the same column indicate differences in the concentration among the wines (level of significance: p < 0.05). 3.2 Oenological Parameters Oenological parameters were measured in the different sampling times to check the evolution of the wines (Table 3). ph, total acidity and volatile acidity values of all samples were common for red wines (Ribéreau-Gayon, P. (2000)). However, it can be observed that wines from treatments had lower ph values than control wine, meaning that treatments improved the microbiological stability of wines. On the other hand, wines from G treatment had the lowest alcoholic degree, which could be related with the negative effect in the sugar accumulation of grapes observed by Kennison, Wilkinson, Pollnitz, Williams, and Gibberd (2009) which studied grapevine exposure, being the guaiacol a component of the smoke and present at elevated concentration in wines from smoke-affected grapes (Singh et al., 2011). Anyway, G treatment seems to affect the primary metabolism of the plant because the wines obtained had also less acidity than wines from the other treatments. The same behavior was observed at 3 sampling times. Table 3. Oenological parameters in wines at the end of the alcoholic fermentation (AF), after malolactic fermentation (MLF) and after six months AF Treatment ph titratable ac. volatile ac. A (%v/v) Control 3.80 ± 0.03 c 5.60 ± 0.11 b 0.46 ± 0.05 b ± 0.48 b E 3.69 ± 0.01 b 5.19 ± 0.41 a 0.22 ± 0.01 a ± 0.34 b G 3.65 ± 0.01 a 5.04 ± 0.01 a 0.22 ± 0.01 a ± 0.05 a E+G 3.68 ± 0.01 a,b 5.68 ± 0.04 b 0.26 ± 0.00 a ± 0.08 b MLF Treatment ph titratable ac. volatile ac. A (%v/v) Control 3.96 ± 0.01 c 4.81 ± 0.06 a 0.56 ± 0.15 a ± 0.25 b E 3.86 ± 0.01 b 5.11 ± 0.08 b 0.42 ± 0.06 a ± 0.13 b,c G 3.82 ± 0.01 a 4.82 ± 0.04 a 0.54 ± 0.08 a ± 0.11 a E+G 3.86 ± 0.01 b 5.20 ± 0.05 b 0.46 ± 0.00 a ± 0.19 c 6 MONTHS Treatment ph titratable ac. volatile ac. A (%v/v) Control 3.96 ± 0.02 c 4.66 ± 0.08 a,b 0.61 ± 0.01 b ± 0.15 b E 3.81 ± 0.01 a,b 5.82 ± 0.15 c 0.59 ± 0.06 b ± 0.18 c G 3.80 ± 0.02 a 4.53 ± 0.08 a 0.51 ± 0.01 a ± 0.14 a E+G 3.84 ± 0.02 b 4.81 ± 0.08 b 0.57 ± 0.03 a,b ± 0.08 b All parameters are given with their standard deviation (n=4). E: wine from grapevines eugenol treatment; G: wine from grapevines guaiacol treatment; E+G: wine from grapevines eugenol and guaiacol treatment. Titratable acidity is expressed in g/l of tartaric acid, while volatile acidity is expressed as g/l of acetic acid and alcoholic degree. Different letters in the same column indicate significant differences among the wines (level of significance: p < 0.05). 3.3 Phenolic Compounds Determination by HPLC-DAD-MS The total content of the phenolic acids, as well as the content of the hydroxybenzoic acids (gallic, vanillic and syringic acids), hydroxycinnamic acids (caffeic and coumaric acids) and the hydroxycinnamic acid esters (caftaric and t-coutaric acids) are presented in Figure 1A (a-d). In general, the total phenolic acids content was 185
8 higher in wines from treatments than in control and at the end of the malolactic fermentation, especially after six months of this (Figure 1A (a)). The concentration of hydroxybenzoic acids (Figure 1A(b)) also was different among the studied wines. Their content was higher in E and E+G wines than in control and G wines. Except vanillic acid, no other hydroxybenzoic acid concentrations were modified by the effect of the G treatment (data not shown), while E and E+G ones produced an increase in the content of all of them. They also increased after malolactic fermentation, which was due to the contribution of gallic acid, since vanillic and syringic acids remained constant through the samplings (data not shown). Similar values and behaviour of hydroxybenzoic acids in Monastrelll wines was reported by Lorenzo, Pardo, Zalacain, Alonso, and Salinas (2005). The content of hydroxycinammic acids (Figure 1A(c)) after alcoholic fermentation was slightly higher in E and E+G wines than in control and G wines, as happened with the hydroxybenzoic acids. However, at the end of the malolactic fermentation and after six month of this, they were considerably more abundant in E wine. Hydroxycinnamic acids are copigments, involved in covalent reactions with anthocyanins to give more stable compounds. Darías-Martín et al. (2002) showed the strong copigmentation effect when additions of t-caffeic acid in pre-fermentation step of Listan Negro and Negramoll wines were made. On the other hand, prefermentation addition of t-p-coumaric acid increased the absorbance at 520 nm in Cabernet Sauvignon wines, while caffeic acid addition had the opposite effect, which showed that their effect depends on the grape variety (Schwarz et al., 2005). T-caffeic and t-p-coumaric acids are present in wine as a consequence of the hydrolysis of their derivatives, as can be their respective hydroxycinnamoyltartaric acids present in grapes and from the hydrolysis of acylated anthocyanins (Monagas, Bartolomé, & Gómez-Cordovés, 2005). Lorenzo et al. (2005) reported the content of hydroxycinnamic acids in Monastrell wines, which increased from the alcoholic fermentation to after 9 months. After alcoholic fermentation the content of hydroxycinnamic ester acids (Figure 1A(d)) was higher in the wines from treatments than in control. After malolactic fermentation there was a slight decrease of their concentration in all wines, except for E wines, which had a great loss of t-caftaric and t-coutaric acids, which means that a large hydrolysis of these compounds took place during malolactic fermentation. The marked changes of both compounds could explain the above increase of t-caffeic and t-p-coumaric acids. On the other hand, hydroxycinnamic esters did not present changes after six months respect to malolactic fermentation. Zafrilla et al. (2003) showed a slight decrease of these esters in Monastrell wines, but after 7 month storage period. The studied stilbenes were t-resveratrol and its glucoside piceid-t-resveratrol or t-resveratrol 3-O-β-D-glucopyranoside. T-resveratrol has antioxidant properties and beneficial effects for human health, with hepatic and cardio protective properties, among others (Rotches-Ribalta, Andres-Lacueva, Estruch, Escribano, & Urpi-Sarda, 2012). In our study the standard of t-resveratrol aglycone allows us to confirm its identity in the samples, but the piceid compound is tentatively identified according to the bibliography and the spectra obtained at 308 nm (Jeandet, 1997). After the alcoholic fermentation, total content of stilbenes (Figure 1B(a)) was higher in wines from treatments than in control, suggesting that the compounds applied by foliar treatments stimulate the stilbenes synthesis, as well their presence in wines. The same behaviour was observed at the end of the malolactic fermentation and 6 month after, especially in wines from eugenol treatments, being an increase of t-resveratrol as well of its piceid glucoside. (Figures 1B (b,c)). Other preharvest chemical treatments such as benzothiadiazole and chitosan (Iriti, Rossoni, Borgo, & Faoro, 2004) increased the content of t-resveratrol in grapes. Although the increase of stilbenes in the grapes could be due to a stress produced to the plants (Roldán, Palacios, Caro, & Pérez, 2003), it also depended on the chemical nature of the compounds applied, such as eugenol which produced the highest increase of stilbenes. The synthesis of the piceid depends on t-resveratrol because it is the initial compound in the stilbene pathway, which can be glycosilated into a non-toxic compound such as piceid-t-resveratrol (Pezet, Gindro, Viret, & Spring, 2004). So, the results suggest that eugenol and guaiacol can act as stimulating agents to enhance the content of t-resveratrol and their derivatives in wines. The flavanols studied were the monomers (+)-catechin and (-)-epicatechin (Figure 1C (a,b,c)). The total concentrations of these compounds were higher in wines from treatments than in control wine for all sampling times. The highest content of them was always in E wine. In control wine, the total flavanols content remained without significant changes through the time, but in wines from treatments, a decrease was observed with time. Similar decreased was observed by other authors (Lorenzo et al., 2005). Comparing the individual profile of (+)-catechin and (-)-epicatechin, it was observed that (+)-catechin content was always the lowest in control wine, while it was the highest in E wine. G and E+G wines had similar concentration in the three samplings carried out. After 6 months, there was a slight decrease of (+)-catechin in all wines. The content of (-)-epicatechin at the end of the alcoholic fermentation was also the highest in E wine, but in this case its concentration decreased further 186
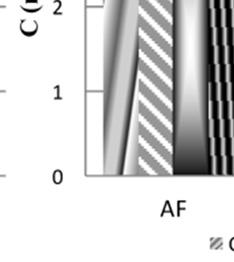
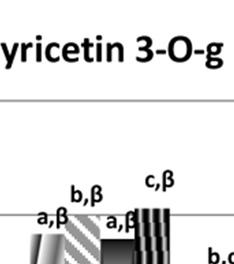
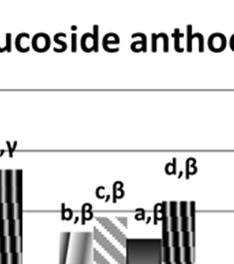
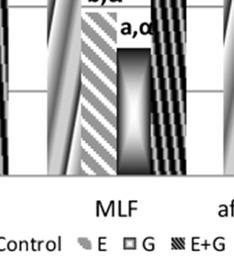
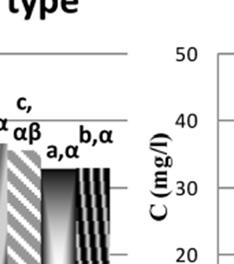
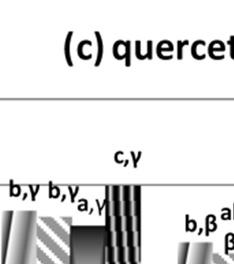
9 than in the others wines, especially during malolactic fermentation. These compounds form complex polymers and can combine with some anthocyanins to give more stable pigments and as consequence more stable color in wines (González-Manzano et al., 2009). Maybe the decreased of free (+)-catechin and (-)-epicatechin in wine is due to a loss by solid precipitation, oxidation or polimerization reactions. On the other hand, flavanols concentration can increase in wines due to the fact that they can be liberated from galloylated precursors (effect which could be related with the increase of gallic acid along the different samplings commented above). So, it is possible that a combination of degradation and liberation of these compounds took place in wines from treated vineyards. Flavonols are yellow pigments, which are also involved in the phenomenon of copigmentation (Boulton, 2001), contributing to color stabilization in red wines. The flavonols profiles of the studied wines are showed in Figure 1D (a-f). Among the 12 flavonols studied there are aglycones, glucosides, glucuronides and galactosides of myricetin, quercetin, laricitrin and syringetin (Table 1). The flavonols 3-O-glycosides suffer diverse degree of hydrolysis depending on the different compounds, so they are classified according to the type of aglycone (myricetin, quercetin, laricitrin, syringetin and kaempferol) and the glycosylation (glycosilated and aglycone) to discussion. The total content of the different flavonols (aglycone + glycosilated) (Figure 1D(a)) changed depending on the studied samples, but the proportion of the diverse types was similar. It can be observed that Monastrell wines had high proportion of quercetin-type flavonols, quercetin-glucuronide being the most abundant (data not shown), while quercetin-glucoside was in very low concentration, as it has been reported in previous work (Hermosín-Gutiérrez, Castillo-Muñoz, Gomez-Alonso, & García-Romero, 2011). This fact could be due because quercetin 3-O-glucoside is very labile and it is hydrolyzed to a large extent (Castillo-Muñoz, Gómez-Alonso, García-Romero, & Hermosín-Gutiérrez, 2007). There was also high proportion of myricetin 3-O-glycosides, having similar profile to quercetin type (high proportion of myricetin 3-O-glucuronide). On the other hand, although kaempferol 3-glucoside could be guaranteed by comparison with authentic standard, peak was not found in the samples and no other flavonol 3-O-glycoside of kaempferol was identified in the studied wines. Moreover, kaempferol aglycone was in very low proportion in comparison with the other flavonols ( % of the total flavonols). At the end of the alcoholic fermentation, the total flavonols content in E and E+G wines was slightly higher than in control and G wines. There was a little decreased of them through the sampling times, except to E+G wine, which remained constant after malolactic fermentation. On the other hand, flavonols 3-O glycosides decreased with the time in the samples, while the quantity of aglycones increased, as it was expected due to hydrolysis phenomenon. Laricitrin and syringetin flavonols were in low quantity and their behaviour in wines was similar. After 6 months of the alcoholic fermentation, it was a high increase of aglycones in E wines (Figure1D(f)), influencing in the total content of flavonols. It was also observed an increase in control and G wines after six months, although their total flavonols content decreased at this sampling time. The individual profile of 11 monomeric anthocyanins was studied (Table 1), which were grouped in non-acylated (glucoside anthocyanins: delphinidin, cyanidin, petunidin, peonidin and malvidin 3-O-glucoside), acetyl (peonidin and malvidin 3-O-(6-acetyl)-glucosides) caffeoyl (malvidin 3-O-(6-t-caffeoyl)-glucoside) and coumaril-derivatives (cyanidin, petunidin and malvidin 3-O-(6-p-coumaroyl)-glucosides). Figure 1E(a-e) shows their content in the wines. After alcoholic fermentation, the total anthocyanins content was higher in wines from treated grapevines than in control one, being more abundant in E and E+G wines, meaning that treatments could favour their synthesis or extraction into the wines. After malolactic fermentation the total content of these pigments decreased in all wines, although the highest reduction took place in E wines. However, control and G wines had still the lowest values of anthocyanins. After 6 months all wines had the lowest quantities of total anthocyanins and decreased the differences in their content among the wines; the total anthocyanins content of E and E+G wines was similar to control, while in G wines it was the lowest content. Glucoside anthocyanins were the most abundant in wines (Figure 1E(b)), so the wine profile of them was similar to that of total anthocyanins. Acetyl anthocyanins are pigments derived from the glucoside anthocyanins, whose content is showed in Figure 1E(c). The lowest content was also found in control wines. At the end of the malolactic fermentation the levels of acetyl anthocyanins decreased in wines, except to control, which remained constant, but after 6 months, they decreased in all the wines, being G wines those with the lowest content of acetyl anthocyanins. Regarding to coumaroyl anthocyanins (Figure 1E(d)), as happened in the above cases, after alcoholic fermentation the highest content was in E wine, but the highest decreased produced after malolactic fermentation was also for this wine. It seems feasible to think that the strongly increased of the p-coumaric acid (commented above) in E wine after malolactic fermentation was also due to the degradation of the coumaroyl pigments, besides the hydrolysis of t-p-coutaric acid. 187
10 Caffeoyl anthocyanins, derived pigments from glucoside anthocyanins, were found in low quantity in wines, being between the 0.4-7% of the total anthocyanins content (Figure 1E(e)). The behavior of this pigment was similar than that showed to glucoside anthocyanins, except in control, which had the highest content of malvidin 3-O-(6-t-caffeoyl)-glucoside. The contents of t-caffeic acid and Mv-3-G (precursors of this pigment) were higher in E and E+G wines than in control, while the caffeoyl derived pigment content was lower in those wines than in control. This fact could be due to different factors such as its formation was not favored by any reason, the degradation degree in these wines was higher than in control or due to copigmentation process. Figure 1F(a-c) shows the content of vitisines A and B of Mv-3-G in the wines. Vitisines are no present in fresh grapes, so their formation and existence in wines depend on the conditions of wines and the presence of the secondary metabolic products, such as pyruvate and acetaldehyde (Morata, Calderón, González, Gómez-Cordovés, & Suárez, 2007). At the end of the alcoholic fermentation the total vitisins concentration was different depending on the treatment carried out. In this case, wine from guaiacol grapevines treatment and control wine had the highest content. However, during malolactic fermentation there was a degradation of them in all wines and after 6 months, control was the wine with higher content of them. Vitisin A and vitisin B were with similar levels after alcoholic fermentation, although the differences appreciated in the total content between wines in the first sampling time were due to vitisin B in a large extent, whose concentration were much higher in G and control wines than in the others. On the other hand, after malolactic fermentation these differences were due to vitisin A content, which decreased, although in a lesser degree than vitisin B. During malolactic fermentation there was degradation of both pigments, but vitisin A seemed to be more stable than the other. Morata, Gómez-Cordovés, Calderón, & Suárez (2006) reported that the presence of vitisins is important in color stability of red wines by the effect of their improved resistance to bleaching by sulfur dioxide. 3.4 Total Phenolic index, total anthocyanins and color intensity by UV-vis spectrophotometry Figure 2 shows the values of total phenolic index (TPI), total anthocyanins and color intensity. These parameters have great interest for wineries, because they are used by oenologists for the regular wine control and to take decisions about the winemaking to be employed. Although the differences of TPI were not very big among the studied wines after the alcoholic fermentation, E and E+G wines had higher values, with significant differences respect to control and G wines. After malolactic fermentation TPI values remained constant or decreased slightly, as occurred with G wines. After 6 months decreased in all wines, being E and E+G those with higher TPI values than control and G wines. Total anthocyanins content had similar behaviour than TPI, because in all samplings, E and E+G wines had the biggest values. The total anthocyanins content was also bigger in E and E+G wines than in the other ones, being in accordance to the individual anthocyanin results studied above. Moreover, in both cases the highest content was for the wine from grapevines treated with eugenol solution. After malolactic fermentation the level of total anthocyanins decreased in all the wines, as was expected, being E and E+G wines the samples with the highest content of them, while its value was significantly lower in G wine than control one. After 6 months total anthocyanins also decreased in all wines. E and E+G wines remained with bigger values of anthocyanins, but differences among them and control wine decreased at this sampling time. Color intensity is related to the content of TPI and anthocyanins. Although E and E+G wines had slightly higher color intensity values than control and G wines, there were significant differences between them. At the end of the malolactic fermentation and after 6 months of this, the color intensity decreased in all samples, being the highest value for E wines. In any case, the treatments carried out modified the parameters measured by UV-vis; so, while eugenol produced an increase in the content of TPI, total anthocyanins and the color intensity in wines, the application of guaiacol did not modified these parameters or decreased in their values. 188


11 Journal of Agricultural Science Vol. 5, No. 9;


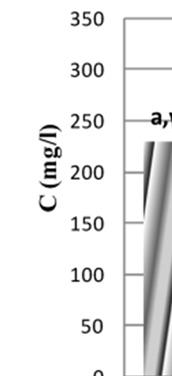


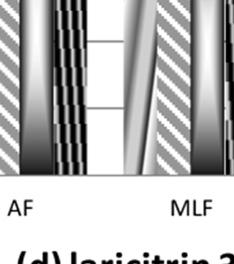
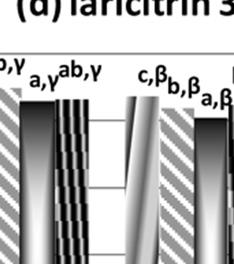


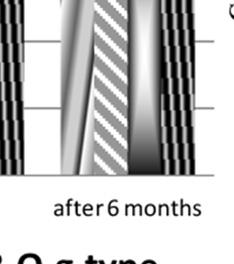


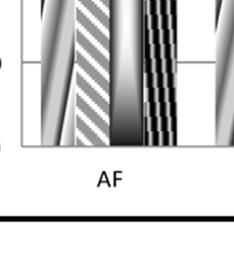


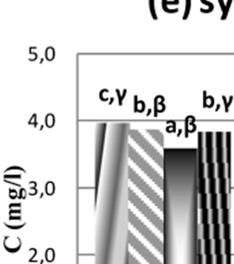
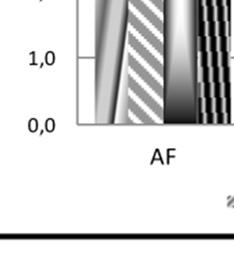


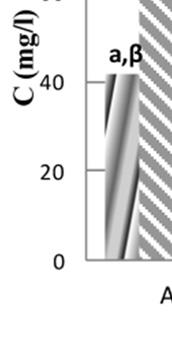
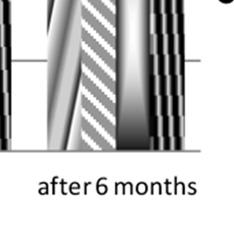
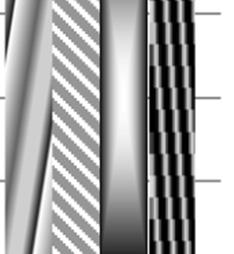
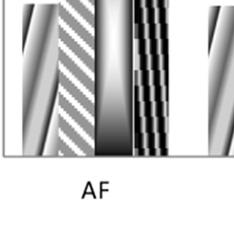
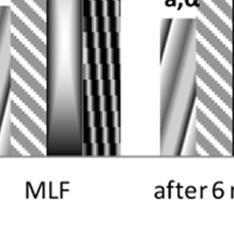
12 Journal of A Agricultural Sciience Figure 1. Content of pphenolic comppounds in winees 190 Vol. 5, No. 9; 2013


 hydroxycinnamic ester acids")
 piceid-t-resveratrol concentration; C: (a) total flavanols,")
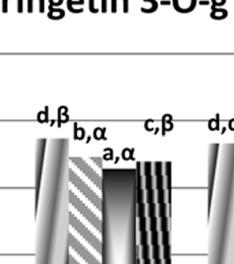
 myricetin 3-O-g type, (c) quercetin 3-O-g")
, (e) syringetin 3-O-g type) and (f)")
 acetyl anthocyanins, (d) coumaroyl")
 total vitisins, (b) vitisin A and (c) vitisin B")


")


13 Journal of Agricultural Science Vol. 5, No. 9; 2013 All parameters are given with their standard deviation (n=4). E: wine from grapevine eugenol treatment; G: wine from grapevine guaiacol treatment; E+G: wine from grapevine eugenol and guaiacol treatment. A: (a) total phenolic acids, (b) hydroxybenzoic acids, (c) hidroxycinammicc acids and ( d) hydroxycinnamic ester acids concentration); B: (a) total stilbenes, (b) t-resveratrol and (c) piceid-t-resveratrol concentration; C: (a) total flavanols, (b) (+)-catechin and (c) (-)-epicatechin concentration; D: (a) total flavonols, (b) myricetin 3-O-g type, (c) quercetin 3-O-g type, (d) laricitrin 3-O-g type (laricitin 3-O-glucoside/galactoside), (e) syringetin 3-O-g type) and (f) aglycone concentration; E: (a) total anthocyanins, (b) glucoside anthocyanins, (c) acetyl anthocyanins, (d) coumaroyl anthocyanins and (e) caffeoyl anthocyanins concentration; F: (a) total vitisins, (b) vitisin A and (c) vitisin B concentration of the studiedd wines in the different samplings. For each sample, different Latin letter indicate significant differences among the samples, while different Greek letters indicate differences among the sampling time (level of significance: p < 0.05). All parameters are given with their standard deviation (n = 4) ). Figure 2. Values of spectrophotometrically measures of, polypheno total index (TPI), total anthocyanins content and color intensity. E: wine from grapevines eugenol treatment; G: wine from grapevines guaiacol treatment; E+G: E wine from grapevines eugenol and guaiacol treatment. Different Greek letters indicate differences among the sampling times, while different Latin letters indicate differences among the wines (level of significance of p < 0.05) 0 191


, which are related to wine")


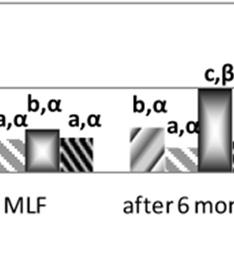
14 Journal of Agricultural Science Vol. 5, No. 9; Sensorial Analysis Visual and olfactory profile was done because they are the most linked with the studied parameters. Mean values of the evaluated descriptors are presented in Figure 3 (a-c), showing the blue, red and yellow descriptors (visual phase), which are related to wine quality and can give information about the age of wines. So, a young wine is characterized by having red and blue tones, while with ageing there is a loss of them and higher yellow tones t appears (Monagas, Martín-Álvarez, Gómez-Cordovés & Bartolomé). Judges found color differences among the wines, being red and blue tones higher for E and E+G wines than the other ones, while the highest yelloww hue was in control wine. It is important to note that although after six month, judges did not found big differences of red hue among the samples, variations were observed regarding to yellow one. Regards to olfactory score, values of spicy aromatic seriess are showed in Figure 3d, they are the mean of the total of spicy and clove attributes, because they are linked with eugenol and guaiacol. Differences among wines were appreciated by judges, who found wines from treatments with more spicy notes than control in the three sampling time. Consequently, results showed that foliar treatments over grapevines, especially E and E+G, improved the color stability of wines through the time and gave spicy characters to wine. Figure 3. Visual and olfactory scores of the blue, red, yellow hue and spicy seriess descriptors of sensorial analysis of wines. E: wine from grapevines eugenol treatment; G: wine from grapevines guaiacol treatment; E+G: wine from grapevines eugenol and guaiacol treatment. Different Greek letters indicate differences among the sampling times, while different Latin letters indicate differences among the wines (level of significance: p < 0.05) 192

 and Table 4 are the results of the principal")
, which explains 53.6% of the variance, while PC2 explains 16.2% and PC3 the 12.3%.")
15 Journal of Agricultural Science Vol. 5, No. 9; Statistical Analysis a) b) Figure 4. Principal component analysis of wine phenolic compounds. PC1: principal component 1; PC2: principal component 2; PC3: principal component 3. E: wine from grapevines eugenol treatment; G: wine from grapevines guaiacol treatment; E+G: wine from grapevines eugenol and guaiacol treatment. AF: at the end of o the alcoholic fermentation; MLF at the end of the malolactic fermentation; 6m: 6 months after malolactic fermentation Figure 4 (a,b) and Table 4 are the results of the principal component analysis, done with the concentration of phenolic compounds determined by HPLC-MS in the different wines studied at the different sampling times. It shows thatt samples from the treatments and control were separated along the first principal component (PC1), which explains 53.6% of the variance, while PC2 explains 16.2% and PC3 the 12.3%. Table 4 shows each parameter weigh on the components. It can be observed that glycosides of flavonols and anthocyanins, especially the acylated, had a high weight on the PC1, which are strongly correlated with gallic acid and myricetin. On the other hand, the flavanols (+)-catechin and (-)-epicatechin, together with the stilbenes studied, syringic acid, quercetin, kaempferol and vanillic acid had the highest weight on PC2, having negative correlation, except from the last compound. We can observe that samples after 6 months are distributedd on the left of PC1, while on the right are the samples after alcoholic fermentation, which had higher content of anthocyanins and flavonols. The distribution along the component 1 is according to evolution of wines. Taking into account wines from the same sampling time, we can observe that E and E+G wines are located on the right of control and G samples, meaning the latest had lower content of anthocyanins and glycosidic flavonols than E and E+G wines. The same behavior took place in the three sampling times studied, although after 6 months, G wines were on the right of the others, which means that these wines lost the anthocyanins in higher degree. If remove PC1 from the plot (which are correlated with the evolution of wines over the time) and have into account PC3 versus PC2 (Figure 4(b)), 4 samples were grouped according the treatment carried out. Variable cyanidin-3-o-glucoside, together with gallic, g vanillic, syringic acids and quercetin had high weight on PC3, which were strongly correlated with t-resveratrol, caftaric and coutaric acids. Wines from the treatments were distributed on the left of PC2, showing theyy had higher content of stilbenes, (+)-catechin, (-) epicatechin, quercetin and kaempferol than control wine. Onn the other hand, G samples were located on the negative region of PC3, which means it had higher proportion of t-resveratrol than piceid, higher amount of t-caftaricc and t-p-coutaric acids than samples from other treatments, which were characterized by having higher content of the variables positively correlated with PC3 (cyanidin-3-o-glucosideand E+G wines showed differences, which decreased through the sampling times. The results showedd that gallic, vanillic, syringic acids and quercetin) (Table 4) ). After alcoholic fermentation, E stilbenes were the principal compounds modified by the treatments, which content increased. On the other hand, h G wines were the samples that the least color stability presented. Maybe, the low proportion of t-caffeicc and t-p-coumaric in relation of their ester derivatives was related with the stability, they are in lower concentration in G wines, which could imply less contribution in copigmentation phenomenon. 193
EVOLUTION OF PHENOLIC COMPOUNDS DURING WINEMAKING AND MATURATION UNDER MODIFIED ATMOSPHERE
 EVOLUTION OF PHENOLIC COMPOUNDS DURING WINEMAKING AND MATURATION UNDER MODIFIED ATMOSPHERE A. Bimpilas, D. Tsimogiannis, V. Oreopoulou Laboratory of Food Chemistry and Technology, School of Chemical Engineering,
distinct category of "wines with controlled origin denomination" (DOC) was maintained and, in regard to the maturation degree of the grapes at
 was maintained and, in regard to the maturation degree of the grapes at") ABSTARCT By knowing the fact that on an international level Romanian red wines enjoy a considerable attention, this study was initiated in order to know the possibilities of obtaining in Iaşi vineyard
ABSTARCT By knowing the fact that on an international level Romanian red wines enjoy a considerable attention, this study was initiated in order to know the possibilities of obtaining in Iaşi vineyard
VWT 272 Class 14. Quiz 12. Number of quizzes taken 16 Min 3 Max 30 Mean 21.1 Median 21 Mode 23
 VWT 272 Class 14 Quiz 12 Number of quizzes taken 16 Min 3 Max 30 Mean 21.1 Median 21 Mode 23 Lecture 14 Phenolics: The Dark Art of Winemaking Whether at Naishapur or Babylon, Whether the Cup with sweet
Fast Analysis of Smoke Taint Compounds in Wine with an Agilent J&W DB-HeavyWax GC Column
 Application Note Flavors and Fragrances Fast Analysis of Smoke Taint Compounds in Wine with an Agilent J&W DB-HeavyWax GC Column Author Vanessa Abercrombie Agilent Technologies, Inc. Abstract The analysis
Somchai Rice 1, Jacek A. Koziel 1, Anne Fennell 2 1
 Determination of aroma compounds in red wines made from early and late harvest Frontenac and Marquette grapes using aroma dilution analysis and simultaneous multidimensional gas chromatography mass spectrometry
Varietal Specific Barrel Profiles
 RESEARCH Varietal Specific Barrel Profiles Beaulieu Vineyard and Sea Smoke Cellars 2006 Pinot Noir Domenica Totty, Beaulieu Vineyard Kris Curran, Sea Smoke Cellars Don Shroerder, Sea Smoke Cellars David
Increasing Toast Character in French Oak Profiles
 RESEARCH Increasing Toast Character in French Oak Profiles Beaulieu Vineyard 2006 Chardonnay Domenica Totty, Beaulieu Vineyard David Llodrá, World Cooperage Dr. James Swan, Consultant www.worldcooperage.com
Journal of Chemical and Pharmaceutical Research, 2017, 9(9): Research Article
: Research Article") Available online www.jocpr.com Journal of Chemical and Pharmaceutical Research, 2017, 9(9):135-139 Research Article ISSN : 0975-7384 CODEN(USA) : JCPRC5 The Identification and Quantitation of Thymol and
Available online www.jocpr.com Journal of Chemical and Pharmaceutical Research, 2017, 9(9):135-139 Research Article ISSN : 0975-7384 CODEN(USA) : JCPRC5 The Identification and Quantitation of Thymol and
Oregon Wine Advisory Board Research Progress Report
 Grape Research Reports, 1996-97: Fermentation Processing Effects on Anthocyanin and... Page 1 of 10 Oregon Wine Advisory Board Research Progress Report 1996-1997 Fermentation Processing Effects on Anthocyanin
STUDIES ON THE CHROMATIC CHARACTERISTICS OF RED WINES AND COLOR EVOLUTION DURING MATURATION
 Scientific Bulletin. Series F. Biotechnologies, Vol. XVII, 2013 ISSN 2285-1364, CD-ROM ISSN 2285-5521, ISSN Online 2285-1372, ISSN-L 2285-1364 STUDIES ON THE CHROMATIC CHARACTERISTICS OF RED WINES AND
Michigan Grape & Wine Industry Council Annual Report 2012
 Michigan Grape & Wine Industry Council Annual Report 2012 Title: Determining pigment co-factor content in commercial wine grapes and effect of micro-oxidation in Michigan Wines Principal Investigator:
GAS-CHROMATOGRAPHIC ANALYSIS OF SOME VOLATILE CONGENERS IN DIFFERENT TYPES OF STRONG ALCOHOLIC FRUIT SPIRITS
 GAS-CHROMATOGRAPHIC ANALYSIS OF SOME VOLATILE CONGENERS IN DIFFERENT TYPES OF STRONG ALCOHOLIC FRUIT SPIRITS Vesna Kostik 1*, Shaban Memeti 1, Biljana Bauer 2 1* Institute of Public Health of Republic
Somchai Rice 1, Jacek A. Koziel 1, Jennie Savits 2,3, Murlidhar Dharmadhikari 2,3 1 Agricultural and Biosystems Engineering, Iowa State University
 Pre-fermentation skin contact temperatures and their impact on aroma compounds in white wines made from La Crescent grapes using aroma dilution analysis and simultaneous multidimensional gas chromatography
Oregon Wine Advisory Board Research Progress Report
 Page 1 of 7 Oregon Wine Advisory Board Research Progress Report 1997-1998 Fermentation Processing Effects on Anthocyanins and Phenolic Composition of Oregon Pinot noir Wines Barney Watson, Naomi Goldberg,
Analytical Method for Coumaphos (Targeted to agricultural, animal and fishery products)
") Analytical Method for Coumaphos (Targeted to agricultural, animal and fishery products) The target compound to be determined is coumaphos. 1. Instruments Gas chromatograph-flame thermionic detector (GC-FTD)
Analytical Method for Coumaphos (Targeted to agricultural, animal and fishery products) The target compound to be determined is coumaphos. 1. Instruments Gas chromatograph-flame thermionic detector (GC-FTD)
Analytical Report. Volatile Organic Compounds Profile by GC-MS in Clove E-liquid Flavor Concentrate. PO Box 2624 Woodinville, WA 98072
 Millis Scientific, Inc 6400 Baltimore National Pike #201 Baltimore MD 21228 Telephone: 877-844-2635 Email: info@millisscientific.com Title Report No. Analytical Report Volatile Organic Compounds Profile
Determination of the concentration of caffeine, theobromine, and gallic acid in commercial tea samples
 Determination of the concentration of caffeine, theobromine, and gallic acid in commercial tea samples Janna Erickson Department of Chemistry, Concordia College, 901 8 th St S, Moorhead, MN 56562 Abstract
AN ENOLOGY EXTENSION SERVICE QUARTERLY PUBLICATION
 The Effects of Pre-Fermentative Addition of Oenological Tannins on Wine Components and Sensorial Qualities of Red Wine FBZDF Wine. What Where Why How 2017 2. October, November, December What the authors
Determination of Caffeine in Coffee Products According to DIN 20481
 Deteration of Caffeine in Coffee Products According to DI 81 Application ote Food Testing & Agriculture Food Authenticity Author Edgar aegele Agilent Technologies, Inc. Waldbronn, Germany Abstract This
Analytical Report. Volatile Organic Compounds Profile by GC-MS in Cupcake Batter Flavor Concentrate
 Millis Scientific, Inc 6400 Baltimore National Pike #201 Baltimore MD 21228 Telephone: 877-844-2635 Email: info@millisscientific.com Title Analytical Report Report No. 042216-001-6 Issue Date April 22,
One class classification based authentication of peanut oils by fatty
 Electronic Supplementary Material (ESI) for RSC Advances. This journal is The Royal Society of Chemistry 2015 One class classification based authentication of peanut oils by fatty acid profiles Liangxiao
Smoke Taint Update. Thomas Collins, PhD Washington State University
 Smoke Taint Update Thomas Collins, PhD Washington State University Wildfires and Wine Overview of smoke taint & the 2017 vintage Review of smoke marker compounds Glycosides of smoke related phenols Risk
Effects of Leaf Removal and UV-B on Flavonoids, Amino Acids and Methoxypyrazines
 Effects of Leaf Removal and UV-B on Flavonoids, Amino Acids and Methoxypyrazines Professor Brian Jordan Centre for Viticulture & Oenology, Lincoln University What are the major factors to be considered
High resolution mass approaches for wine and oenological products analysis
 High resolution mass approaches for wine and oenological products analysis Barnaba C., Nardin T., Larcher R. IASMA Fondazione Edmund Mach, via E. Mach, 1, 38010 San Michele all Adige, Italy chiara.barnaba@fmach.it
Timing of Treatment O 2 Dosage Typical Duration During Fermentation mg/l Total Daily. Between AF - MLF 1 3 mg/l/day 4 10 Days
 Micro-Oxygenation Principles Micro-oxygenation is a technique that involves the addition of controlled amounts of oxygen into wines. The goal is to simulate the effects of barrel-ageing in a controlled
Solid Phase Micro Extraction of Flavor Compounds in Beer
 Solid Phase Micro Extraction of Flavor Compounds in Beer ANNE JUREK Reducing Carryover in Environmental Water Samples Application Note Environmental Author Anne Jurek Applications Chemist EST Analytical
Custom Barrel Profiling
 RESEARCH Custom Barrel Profiling Changing Toasting Profiles to Customize Barrels for Rodney Strong Vineyards Pinot Noir Program Rodney Strong Vineyards www.worldcooperage.com 1 OBJECTIVE The objective
Optimization of pomegranate jam preservation conditions
 Optimization of pomegranate jam preservation conditions Legua P., Melgarejo P., Martínez J.J., Martínez R., Hernández F. in Melgarejo P. (ed.), Valero D. (ed.). II International Symposium on the Pomegranate
Analysis of Resveratrol in Wine by HPLC
 Analysis of Resveratrol in Wine by HPLC Outline Introduction Resveratrol o o Discovery Biosynthesis HPLC separation Results Conclusion Introduction Composition of flavoring, coloring and other characteristic
Influence of climate and variety on the effectiveness of cold maceration. Richard Fennessy Research officer
 Influence of climate and variety on the effectiveness of cold maceration Richard Fennessy Research officer What is pre-fermentative cold maceration ( cold soak ) and what are the benefits? Introduction
BARRELS, BARREL ADJUNCTS, AND ALTERNATIVES
 BARRELS, BARREL ADJUNCTS, AND ALTERNATIVES Section 2. Volatile Phenols. Guaiacyl and syringyl (Figure 7) make up the largest portion of oak volatiles. These are products of the degradation of lignin. Most
RESOLUTION OIV-OENO MONOGRAPH ON GLUTATHIONE
 RESOLUTION OIV-OENO 571-2017 MONOGRAPH ON GLUTATHIONE THE GENERAL ASSEMBLY, IN VIEW OF Article 2, paragraph 2 iv of the Agreement of 3 April 2001 establishing the International Organisation of Vine and
Solid Phase Micro Extraction of Flavor Compounds in Beer
 Solid Phase Micro Extraction of Flavor Compounds in Beer ANNE JUREK Low Level Detection of Trichloroanisole in Red Wine Application Note Food/Flavor Author Anne Jurek Applications Chemist EST Analytical
NomaSense PolyScan. Analysisof oxidizable compounds in grapes and wines
 NomaSense PolyScan Analysisof oxidizable compounds in grapes and wines Oxidizablecompounds GSH SO 2 Reaction with volatile sulfur compounds Reaction with amino acids Loss of varietal thiols Modulation
Analytical Report. Table 1: Target compound levels. Concentration units are ppm or N/D, not detected.
 03/20/17 Report 032017-13 Page 1 of 4 Millis Scientific, Inc 6400 Baltimore National Pike #201 Baltimore MD 21228 Telephone: 877-844-2635 Email: info@millisscientific.com Analytical Report Title Vicinal
RESOLUTION OIV-OENO ANALYSIS OF VOLATILE COMPOUNDS IN WINES BY GAS CHROMATOGRAPHY
 RESOLUTION OIV-OENO 553-2016 ANALYSIS OF VOLATILE COMPOUNDS IN WINES BY GAS CHROMATOGRAPHY THE GENERAL ASSEMBLY, In view of Article 2, paragraph 2 iv of the Agreement of 3 April 2001 establishing the International
Application Note FP High Sensitivity Coumarin Analysis. Introduction. Keywords
 FP-2 Introduction To prevent the production of illegal light diesel oil, which contains kerosene or heavy oil, 1 ppm of coumarin is added to either the kerosene or a heavy oil as a discriminator. The analysis
The Importance of Dose Rate and Contact Time in the Use of Oak Alternatives
 W H I T E PA P E R The Importance of Dose Rate and Contact Time in the Use of Oak Alternatives David Llodrá, Research & Development Director, Oak Solutions Group www.oaksolutionsgroup.com Copyright 216
Determination of Melamine Residue in Milk Powder and Egg Using Agilent SampliQ Polymer SCX Solid Phase Extraction and the Agilent 1200 Series HPLC/UV
 Determination of Melamine Residue in Milk Powder and Egg Using Agilent SampliQ Polymer SCX Solid Phase Extraction and the Agilent 1200 Series HPLC/UV Application Note Food Safety Authors Chen-Hao Zhai
Vinmetrica s SC-50 MLF Analyzer: a Comparison of Methods for Measuring Malic Acid in Wines.
 Vinmetrica s SC-50 MLF Analyzer: a Comparison of Methods for Measuring Malic Acid in Wines. J. Richard Sportsman and Rachel Swanson At Vinmetrica, our goal is to provide products for the accurate yet inexpensive
High-Resolution Sampling 2D-LC with the Agilent 1290 Infinity II 2D-LC Solution
 High-Resolution Sampling D-LC with the Agilent 9 Infinity II D-LC Solution Reliable Quantification of Coeluting Substances Technical Overview Author Susanne Stephan Agilent Technologies, Inc. Waldbronn,
Rapid Tea Analysis on Poroshell 120 SB-C18 with LC/MS
 Rapid Tea Analysis on Poroshell 12 SB-C18 with LC/MS Application Note Food and Beverage Authors Anne E. Mack and William J. Long Agilent Technologies, Inc. 285 Centerville Road Wilmington, DE 1988 USA
Session 4: Managing seasonal production challenges. Relationships between harvest time and wine composition in Cabernet Sauvignon.
 Session 4: Managing seasonal production challenges Relationships between harvest time and wine composition in Cabernet Sauvignon Keren Bindon Cristian Varela, Helen Holt, Patricia Williamson, Leigh Francis,
Flavonoids in grapes. Simon Robinson, Mandy Walker, Rachel Kilmister and Mark Downey. 11 June 2014 PLANT INDUSTRY
 Flavonoids in grapes Simon Robinson, Mandy Walker, Rachel Kilmister and Mark Downey 11 June 2014 PLANT INDUSTRY Grapes to wine a 2 metabolic zoo Grapevines Hundreds of different metabolites determine Wine
CHAPTER 8. Sample Laboratory Experiments
 CHAPTER 8 Sample Laboratory Experiments 8.a Analytical Experiments without an External Reference Standard; Conformational Identification without Quantification. Jake Ginsbach CAUTION: Do not repeat this
Flavor and Aroma Biology
 Flavor and Aroma Biology limonene O OCH3 O H methylsalicylate phenylacetaldehyde O H OCH3 benzaldehyde eugenol O H phenylacetaldehyde O neral O geranial nerolidol limonene Florence Zakharov Department
COLOR ENHANCEMENT OF FETEASCĂ NEAGRĂ WINES BY USING PECTOLYTIC ENZYMES DURING MACERATION
 The Annals of the University Dunarea de Jos of Galati Fascicle VI Food Technology 36(1) 18-25 ORIGINAL RESEARCH PAPER COLOR ENHANCEMENT OF FETEASCĂ NEAGRĂ WINES BY USING PECTOLYTIC ENZYMES DURING MACERATION
Profiling of Aroma Components in Wine Using a Novel Hybrid GC/MS/MS System
 APPLICATION NOTE Gas Chromatography/ Mass Spectrometry Authors: Sharanya Reddy Thomas Dillon PerkinElmer, Inc. Shelton, CT Profiling of Aroma Components in Wine Using a Novel Hybrid GC/MS/MS System Introduction
Smoke Taint: Effect of wildfires on fruit and wine composition
 UCCE Sonoma County Grape Day February 7, 2019 Smoke Taint: Effect of wildfires on fruit and wine composition Thomas Collins, PhD Washington State University Smoke taint Wines made from vineyards exposed
Strategies for reducing alcohol concentration in wine
 Strategies for reducing alcohol concentration in wine Cristian Varela Senior Research Scientist Alcohol in Australian wine 2014 2005 Average 13.6% 14.5% Ethanol Godden et al. 2015 Why is alcohol increasing?
COOPER COMPARISONS Next Phase of Study: Results with Wine
 COOPER COMPARISONS Next Phase of Study: Results with Wine A follow-up study has just been completed, with the generous cooperation of Cakebread Cellars, Lafond Winery, and Edna Valley Vineyards. Many of
Rapid Analysis of Soft Drinks Using the ACQUITY UPLC H-Class System with the Waters Beverage Analysis Kit
 Rapid Analysis of Soft Drinks Using the ACQUITY UPLC H-Class System with the Waters Beverage Analysis Kit Mark E. Benvenuti, Raymond Giska, and Jennifer A. Burgess Waters Corporation, Milford, MA U.S.
Addressing Research Issues Facing Midwest Wine Industry
 Addressing Research Issues Facing Midwest Wine Industry 18th Annual Nebraska Winery and Grape Growers Forum and Trade Show at the Omaha Marriott March 7 th, 2015 Murli R Dharmadhikari Department of Food
! " # # $% 004/2009. SpeedExtractor E-916
 ! "# # $% 004/2009 SpeedExtractor E-916! " # # $% The Genépi plant (Artemisia umbelliformis) grows in alpine areas. It is also cultivated and used to produce a herb liquor. Costunolide is a sesquiterpene
Comparison of Supercritical Fluid Extraction with Steam Distillation for the Extraction of Bay Oil from Bay (Pimenta Racemosa) Leaves
 Leaves") International Journal of Engineering Science Invention ISSN (Online): 2319 6734, ISSN (Print): 2319 6726 Volume 5 Issue 1 January 2016 PP.51-55 Comparison of Supercritical Fluid Extraction with Steam Distillation
International Journal of Engineering Science Invention ISSN (Online): 2319 6734, ISSN (Print): 2319 6726 Volume 5 Issue 1 January 2016 PP.51-55 Comparison of Supercritical Fluid Extraction with Steam Distillation
How to fine-tune your wine
 How to fine-tune your wine Fining agents help remove undesirable elements or compounds to improve the quality of wine. Fining is not just used in wines for bottle preparation, in some cases there are more
Technical note. How much do potential precursor compounds contribute to reductive aromas in wines post-bottling?
 Technical note How much do potential precursor compounds contribute to reductive aromas in wines post-bottling? Introduction The formation of unpleasant reductive aromas in wines is an issue of concern
Comprehensive analysis of coffee bean extracts by GC GC TOF MS
 Application Released: January 6 Application ote Comprehensive analysis of coffee bean extracts by GC GC TF MS Summary This Application ote shows that BenchTF time-of-flight mass spectrometers, in conjunction
Determination of Methylcafestol in Roasted Coffee Products According to DIN 10779
 Deteration of Methylcafestol in Roasted Coffee Products According to DIN 1779 Application Note Food Testing & Agriculture Food Authenticity Author Edgar Naegele Agilent Technologies, Inc. Waldbronn, Germany
A new approach to understand and control bitter pit in apple
 FINAL PROJECT REPORT WTFRC Project Number: AP-07-707 Project Title: PI: Organization: A new approach to understand and control bitter pit in apple Elizabeth Mitcham University of California Telephone/email:
Application Note: Analysis of Melamine in Milk (updated: 04/17/09) Product: DPX-CX (1 ml or 5 ml) Page 1 of 5 INTRODUCTION
 Product: DPX-CX (1 ml or 5 ml) Page 1 of 5 INTRODUCTION") Page 1 of 5 Application Note: Analysis of Melamine in Milk (updated: 04/17/09) Product: DPX-CX (1 ml or 5 ml) INTRODUCTION There has been great interest recently for detecting melamine in food samples
Page 1 of 5 Application Note: Analysis of Melamine in Milk (updated: 04/17/09) Product: DPX-CX (1 ml or 5 ml) INTRODUCTION There has been great interest recently for detecting melamine in food samples
Measuring Sulfur Dioxide: A Perennial Issue. Tom Collins Fosters Wine Estates Americas
 Measuring Sulfur Dioxide: A Perennial Issue Tom Collins Fosters Wine Estates Americas 5 February 2010 Measuring SO 2 : A Perennial Issue In the collaborative proficiency testing program managed by ASEV
Pigmented Tannin: Structural Elucidation by a Complimentary Suite of Mass Spectrometric Techniques
 Pigmented Tannin: Structural Elucidation by a Complimentary Suite of Mass Spectrometric Techniques Jonathan R. Cave Andrew L. Waterhouse Carlito B. Lebrilla James A. Kennedy Production White Vineyard Crush
TOASTING TECHNIQUES: Old World and New World RESEARCH. Joel Aiken and Bob Masyczek, Beaulieu Vineyard Maurizio Angeletti, Antinori Winery
 RESEARCH TOASTING TECHNIQUES: Old World and New World Joel Aiken and Bob Masyczek, Beaulieu Vineyard Maurizio Angeletti, Antinori Winery www.worldcooperage.com 1 INTRODUCTION In the traditional art of
Acta Chimica and Pharmaceutica Indica
 Acta Chimica and Pharmaceutica Indica Research Vol 7 Issue 2 Oxygen Removal from the White Wine in Winery VladimirBales *, DominikFurman, Pavel Timar and Milos Sevcik 2 Faculty of Chemical and Food Technology,
Tartrate Stability. Mavrik North America Bob Kreisher, Ph.D
 Tartrate Stability Mavrik North America Bob Kreisher, Ph.D Tartrate Stability Potassium bitartrate = KHT Tartrate Stability: Absence of visible crystals (precipitation) after extended time at a reference
Fruit maturity and quality. Azra Alikadić Web Valley 2016, San Lorenzo Dorsino
 Fruit maturity and quality Azra Alikadić Web Valley 2016, San Lorenzo Dorsino Quality - Quality implies the degree of excellence of a product or its suitability for a particular use. - Which combines:
Tyler Trent, SVOC Application Specialist; Teledyne Tekmar P a g e 1
 Application Note Flavor and Aroma Profile of Hops Using FET-Headspace on the Teledyne Tekmar Versa with GC/MS Tyler Trent, SVOC Application Specialist; Teledyne Tekmar P a g e 1 Abstract To brewers and
Chemical and Sensory Differences in American Oak Toasting Profiles
 RESEARCH Chemical and Sensory Differences in American Oak Toasting Profiles John Cole, Kendall-Jackson Chris Johnson, Kendall-Jackson Marcia Monahan, Kendall-Jackson David Llodrá, World Cooperage Dr. James
JUICE CHEMICAL ANALYSIS: WHAT TO MEASURE AND WHY
 JUICE CHEMICAL ANALYSIS: WHAT TO MEASURE AND WHY Anita Oberholster JULY 15, 2016 2015-2016 CURRENT ISSUES: FERMENTATION READINESS UC DAVIS CONFERENCE CENTER Anita Oberholster Introduction What to measure?
DEVELOPMENT OF A RAPID METHOD FOR THE ASSESSMENT OF PHENOLIC MATURITY IN BURGUNDY PINOT NOIR
 PINOT NOIR, PAGE 1 DEVELOPMENT OF A RAPID METHOD FOR THE ASSESSMENT OF PHENOLIC MATURITY IN BURGUNDY PINOT NOIR Eric GRANDJEAN, Centre Œnologique de Bourgogne (COEB)* Christine MONAMY, Bureau Interprofessionnel
Optimising harvest date through use of an integrated grape compositional and sensory model
 Optimising harvest date through use of an integrated grape compositional and sensory model Alain DELOIRE, Katja ŠUKLJE, Guillaume ANTALICK, Campbell MEEKS, John W. BLACKMAN & Leigh M. SCHMIDTKE National
Novel methods for the amelioration of smoke tainted wine
 Novel methods for the amelioration of smoke tainted wine Kerry Wilkinson, Renata Ristic and Anthea Fudge The University of Adelaide Life Impact The University of Adelaide Aims of ARC Smoke Taint Project
Determination Of Saponin And Various Chemical Compounds In Camellia Sinensis And Genus Ilex.
 Determination Of Saponin And Various Chemical Compounds In Camellia Sinensis And Genus Ilex. Sensus Technical Note (SEN-TN-0027) 05/22/2009 ABSTRACT Youngmok Kim, Ph.D. and Daniel J. Wampler, Ph.D. Saponin
DBP Formation from the Chlorination of Organics in Tea and Coffee
 DBP Formation from the Chlorination of Organics in Tea and Coffee Tom Bond*, Seeheen (Celine) Tang and Michael R. Templeton Department of Civil and Environmental Engineering, Imperial College London t.bond@imperial.ac.uk
TSKgel TECHNICAL INFORMATION SHEET No. 131
 TSKgel TECNICAL INFORMATION SEET No. Analysis of Synthetic Sweeteners in Coffee by PLC Synthetic sweeteners are used in many foods because they have fewer calories than sugar. Acesulfame potassium (Acesulfame-K),
REPORT. Virginia Wine Board. Creating Amarone-Style Wines Using an Enhanced Dehydration Technique.
 REPORT Virginia Wine Board Creating Amarone-Style Wines Using an Enhanced Dehydration Technique. Principal Investigators: Molly Kelly, Enology Extension Specialist Virginia Tech Department of Food Science
Flavonoids in grapes. Simon Robinson, Mandy Walker, Rachel Kilmister and Mark Downey. ASVO SEMINAR : MILDURA, 24 July 2014 AGRICULTURE FLAGSHIP
 Flavonoids in grapes Simon Robinson, Mandy Walker, Rachel Kilmister and Mark Downey ASVO SEMINAR : MILDURA, 24 July 2014 AGRICULTURE FLAGSHIP Flavonoids in grapes Grape Flavonoids Flavonoids are important
Effects of Capture and Return on Chardonnay (Vitis vinifera L.) Fermentation Volatiles. Emily Hodson
 Fermentation Volatiles. Emily Hodson") Effects of Capture and Return on Chardonnay (Vitis vinifera L.) Fermentation Volatiles. Emily Hodson Thesis submitted to the faculty of the Virginia Polytechnic Institute and State University in partial
Effects of Capture and Return on Chardonnay (Vitis vinifera L.) Fermentation Volatiles. Emily Hodson Thesis submitted to the faculty of the Virginia Polytechnic Institute and State University in partial
The Influence of Cap Management and Fermentation Temperature. The Influence of Cap Management and Fermentation Temperature
 The Influence of Cap Management and Fermentation Temperature Larry Lerno, Cristina Medina Plaza, Jordan Beaver, Konrad Miller, Siriwan Panprivech, Ravi Ponangi, Leanne Hearne, Tom Blair, Anita Oberholster,
Understanding Cap Extraction in Red Wine Fermentations
 Understanding Cap Extraction in Red Wine Fermentations Max Reichwage, Larry Lerno, Doug Adams, Ravi Ponangi, Cyd Yonker, Leanne Hearne, Anita Oberholster, and David Block Driving innovation in grape growing
Introduction to Barrel Profiling
 RESEARCH Introduction to Barrel Profiling The Effects of Time and Temperature on Wine Barrel Flavors Tarapacá www.worldcooperage.com 1 OBJECTIVE The objective is to determine if the new Barrel Profiling
Extraction of Multiple Mycotoxins From Animal Feed Using ISOLUTE Myco SPE Columns prior to LC-MS/MS Analysis
 Application Note AN804 Extraction of Multiple Mycotoxins From Animal Feed Using ISOLUTE Myco Page 1 Extraction of Multiple Mycotoxins From Animal Feed Using ISOLUTE Myco SPE Columns prior to LC-MS/MS Analysis
Grapes, the essential raw material determining wine volatile. composition. It s not just about varietal characters.
 Grapes, the essential raw material determining wine volatile composition. It s not just about varietal characters. Paul Boss and Eric Dennis Food Futures Flagship and CSIR Plant Industry, P Box 350 Glen
The sugar determination in the winemaking process
 The sugar determination in the winemaking process Simone Bellassai Enologist and CDR WineLab specialist. Which are the methods commonly used for the sugar analyses in wine or grape juice? Which are their
Extraction by subcritical water of polyphenols from Dunkelfelder and Cabernet Franc grape pomace coupled with membrane filtration
 Extraction by subcritical water of polyphenols from Dunkelfelder and Cabernet Franc grape pomace coupled with membrane filtration Sami YAMMINE a, Cristel DELSART a, Xavier Vitrac b, Rémy GHIDOSSI a, Martine
Flavor and Aroma Biology
 Flavor and Aroma Biology limonene O OCH3 O H methylsalicylate phenylacetaldehyde O H OCH3 benzaldehyde eugenol O H phenylacetaldehyde O neral O geranial nerolidol limonene Florence Zakharov Department
Analysis of trace elements and major components in wine with the Thermo Scientific icap 7400 ICP-OES
 APPLICATION NOTE 43355 Analysis of trace elements and major components in wine with the Thermo Scientific icap 7400 ICP-OES Authors Sanja Asendorf, Application Specialist, Thermo Fisher Scientific, Bremen,
Experiment 6 Thin-Layer Chromatography (TLC)
") Experiment 6 Thin-Layer Chromatography (TLC) OUTCOMES After completing this experiment, the student should be able to: explain basic principles of chromatography in general. describe important aspects
Experiment 6 Thin-Layer Chromatography (TLC) OUTCOMES After completing this experiment, the student should be able to: explain basic principles of chromatography in general. describe important aspects
Recent Developments in Coffee Roasting Technology
 Index Table of contents Recent Developments in Coffee Roasting Technology R. PERREN 2, R. GEIGER 3, S. SCHENKER 4, F. ESCHER 1 1 Institute of Food Science, Swiss Federal Institute of Technology (ETH),
AppNote 4/2003. Fast Analysis of Beverages using a Mass Spectral Based Chemical Sensor KEYWORDS ABSTRACT
 AppNote 4/2003 Fast Analysis of Beverages using a Mass Spectral Based Chemical Sensor Vanessa R. Kinton, Robert J. Collins Gerstel, Inc., Caton Research Center, 1510 Caton Center Drive, Suite H, Baltimore,
Good Brett and other urban Brettanomyces myths
 Good Brett and other urban Brettanomyces myths Chris Curtin Research Manager Three myths to bust today 1. Brett can be good, or at least not all bad 2. Brett is no longer a problem, I don t need to worry
Information of commercial enzyme preparations (Bio-Laffort, France) used in
 used in") Supporting Information Supplementary Table 1. Information of commercial enzyme preparations (Bio-Laffort, France) used in this study (www.laffort.com/en) Commercial enzyme preparation Properties Application
Supporting Information Supplementary Table 1. Information of commercial enzyme preparations (Bio-Laffort, France) used in this study (www.laffort.com/en) Commercial enzyme preparation Properties Application
Extraction of Acrylamide from Coffee Using ISOLUTE. SLE+ Prior to LC-MS/MS Analysis
 Application Note AN796 Extraction of Acrylamide from Coffee using ISOLUTE SLE+ Page 1 Extraction of Acrylamide from Coffee Using ISOLUTE SLE+ Prior to LC-MS/MS Analysis This application note describes
AppNote 2/2003. Wine Discrimination using a Mass Spectral Based Chemical Sensor KEYWORDS ABSTRACT
 AppNote 2/2003 Wine Discrimination using a Mass Spectral Based Chemical Sensor Vanessa R. Kinton, Edward A. Pfannkoch Gerstel, Inc., Caton Research Center, 1510 Caton Center Drive, Suite H, Baltimore,
«Precision and homogeneity of barrels selected with OakScan : two examples of selection adapted to different wine profiles or aging objectives»
 «Precision and homogeneity of barrels selected with OakScan : two examples of selection adapted to different wine profiles or aging objectives» Nicolas Mourey - October 2015 WWW.RADOUX.FR Introduction
RISK MANAGEMENT OF BEER FERMENTATION DIACETYL CONTROL
 Buletin USAMV-CN, 62/2006 (303-307) ISSN 1454 2382 RISK MANAGEMENT OF BEER FERMENTATION DIACETYL CONTROL Mudura Elena, SevastiŃa Muste, Maria Tofană, Crina Mureşan elenamudura@yahoo.com University of Agricultural
Discriminating terroirs by combination of phenolics and sensory profiles of Malbec wines from Mendoza
 Discriminating terroirs by combination of phenolics and sensory profiles of Malbec wines from Mendoza Roy Urvieta, his PhD Adviser Ariel Fontana, Fernando Buscema, Beatriz Coste and Rubén Bottini, published
Developing Ontario Appassimento Wines: The impact of drying method, yeast strain and botrytis on wine quality and consumer choice
 Developing Ontario Appassimento Wines: The impact of drying method, yeast strain and botrytis on wine quality and consumer choice CCOVI Lecture Series March 16, 2016 Dr. Debra Inglis Why Develop Appassimento
membrane technology forum Frederick Liberatore & Jamie Vinsant Minneapolis, Minnesota 3-5 June, 2015
 membrane technology forum Frederick Liberatore & Jamie Vinsant Minneapolis, Minnesota 3-5 June, 2015 membrane solutions to current winemakers challenges Anne-Cecile Valentin membrane technology forum 2015