ANALYSIS OF CATECHINS IN TEN CLONES OF EAST AFRICAN TEA JOHN KANYIRI A THESIS SUBLUTTSD IN PART FULFILMENT FOR THE DECREE OF MASTER OF SCIENCE
|
|
|
- Donald Young
- 5 years ago
- Views:
Transcription


1 \ ANALYSIS OF CATECHINS IN TEN CLONES OF EAST AFRICAN TEA BY JOHN KANYIRI A THESIS SUBLUTTSD IN PART FULFILMENT FOR THE DECREE OF MASTER OF SCIENCE IN THE UNIVERSITY OF NAIROBI THIS TRESIS HAS ^ UNIVERSITY L1LRARY 1980


2 This thesis is my original work and has not been presented for a degree in any other University* \ John Kanyiri iffanyoko i s CANDIDATE *~*< This thesis has been submitted for examination with my approval as University Supervisor Ur* B.M* Uunavu j*» Supervispr^^ University of Nairobi

3 TABLES OF CONTENTS \ C H A p PAGE SUMMARY. 1 I INTRODUCTION. 2 II EXPERIMENTAL 12 ITT RESULTS AND DISCUSSIONS PRESENCE OP TWO MORE "CATECHEIS IN SOLE CLONES *1 7 CONCLUSION 62 REFERENCES 66' BIBLIOGRAPHY 69 ACKNOWLEDGEMENTS 70

 which had different catechin pattern was done.")
4 1 s u m m a r y ANALYSIS OF CATECHINS HI TEN CLONES OF EAST AFRICAN TEA A simple and fast method of analysis of catechins in the tea plant was developed. The method was applied for semiquantitative comparison of different catechins in ten clones of East African Tea. The method was found to bo reproducible and handy since very simple equipment was required. Differences in the catechin pattern in the ten clones vrere found to exist. Comparison of the catechin pattern of the progenies of two clones (6/8 and 3 l / n ) which had different catechin pattern was done. The clones produced from closed pollination of the 6/8 and 3l/l1 were grouped into five categories. Two lower honologues of the catechins were found to occur in detectable amounts in two of the clones (12/12 and 12/19) investigated. One of the compounds (-) epiafzelechin has been previously reported in tea (liyers et al; 1959) while the other (-) epiafzelechin * gallate has not been reported, methods for the separation of the two compounds from the tea were also worked out.

 These compounds are the theaflavins (TF) whose structures are known, and the thearubigins (TR) which are heterogenous condensation compounds.")
5 2 C H A F E R I INTRODUCTION 1.1 General The material used for tea manufacture is a shoot consisting of the first two leaves and a bud. This is usually referred to as a flush (Fig. 1). The flush is used as a starting material in the tea manufacture due to its high content of polyphenols, specifically the catechins. During tea manufacture, the catechins undergo enzymatic oxidation as well as non-enzymatic reactions to give compounds which impart the desired characteristics of black tea (llillin and Rustidge; 15^7 ) These compounds are the theaflavins (TF) whose structures are known, and the thearubigins (TR) which are heterogenous condensation compounds. Some of the work done on theaflavin analysis in teas indicates that a positive correlation exists between the theaflavin content and the market price of plain teas, i.e. teas which have no flavour (Hilton and Ellis; 1972, Hilton and Palmer-Jones; 1975)* Since the East African teas are regarded to be plain, they fetch a high market value because of their high theaflavin content. Although there is no well established relationship between the catechins and the theaflavins, Hilton (1975) has showed that presence of high contents of one of the catechins, epigallocatechin, in the shoot favours production of teas with high content of theaflavins.


* This is")

6 3 Also Coggon et al (1973) have shown that unless at least two catechins of different structures are present in the system, everything else remaining the same, TF cannot be formed. FIGURE I: DIAGRAM OF A FLUSH "two leaves and a bud" The overall quality of made tea defined as the sum of the desirable characteristics such as flavour, colour, brightness and briskness, is mainly determined by the type of the tea plant used in the manufacture. Different clones of tea have been found to give teas which have different overall qualities (Forrest and Bendall,1969)* This is mainly due to the difference in their catechin patterns. A catechin pattern is the distribution of catechins in terras of percentage dry matter of the catechins in a given clone. Since there are six major catechins which have been shown to occur in the tea flush, a change in at least one of them will give a plant with a different catechin pattern. However, changes in the catechins occurring in low concentrations would not be expected to have a major influence in the overall quality of the tea.

.")
 Epigallocatechin gallate EGCG 9-13 (-)")
 Gallocatechin 4CC 3-4 (+) Catechin +C 1-2 The structures of the catechins")
7 A 1.2* CATECHINS AND OTHER POLYPHENOLS OCCURRING IN TEA There ore six major catechins which occur in a tea flush. Their names and their approximate percentages in terms of the dry matter content as found in Assam tea are as shown below (Roberts; 1962). TABLE 1 Percentage (dry matter) of catechins found in Assam tea Catechin Abbreviation % in tea (-) Epigallocatechin gallate EGCG 9-13 (-) Epigallocatechin EGC 3-6 (-) Epicatechin gallate ECG 3-6 (-) Epicatechin EC 1-3 (+) Gallocatechin 4CC 3-4 (+) Catechin +C 1-2 The structures of the catechins are as shown below*- la. (-) Epicatechin (SC), Hg H lb. (-) Epigallocatechin (EGC)yR^ H, Rg^OH
, 3» 4» 5 -")
 Epigallocatechin")

 Catechin (+C)> R^ *")
8 5 1 c, (-) Epicatecliin gallate (ECG), 3» 4» 5 - Trihydroxybenzcyl, R2 = H 1 d* (-) Epigallocatechin gallate (SGCG), R.j 3> Trihydroxybenzoyl, Rg «* OH 2 b, (+) Catechin (+C)> R^ * H 2 b. (+) Gallocatechin (-KJC), R_» OH J L


 4 a*")

9 6 3 a* (-) Epiafzelechin, R^ H 3 b* (-) Epiafzelechin gallate R =3» 4» 5 - Trihydroxy- ^ benzoyl The other related, compounds which occur in tea flush, though in much lower concentration, are the Leucoantho- cyanidins with the following structures (Sanderson; 1972) 4 a* Leucoanthocyanidin, R - H > R** OH 4 b* Leucodelphinidin, R R^» OH Flavonols (s) have also been found in tea* They have 5


10 7 5 a, Kaempferol, R^*!^ " ^ 5 b. Quercetin, R^ ** OH, «H 5 c* tlyricetin, R^ Rg «OH Also present in tea are the esters of quinic acid, p-couiaaryl quinic acid, chlorogenic acids or oaffeoylquinic acid, and theogallin or 3-galloylquinic acid. 6 a* P-coumarylquinic acid, R = H 6 b* chlorogenic acid, R * OH


11 8 - The theaflavins, which are the products of the enzymatic and non-enzymatic reactions of catechins, have the following structures (8) 8 a* Theaflavin, R^ * R^ H 8 b # Theaflavin gallate A, R1 «H,R2-3>4»5- Trihydroxybenzoyl 8 c* Theaflavin gallate 3, R2 - H, R^ - 3, 4, 5 - Trihydroxybenzoyl 8d* Theaflavin digallate, R1 " R2 ^ " Trihydroxybenzoyl
 9 a.")


12 9 The structures of epitheaflavic acids which are also related to theaflavins is shown below(9) 9 a. Epitheaflavic acid, R =* H 9 b. 3-Galloyl epitheaflavic acid, R 3> 4» 5-Trihydroxjrbenzoyl The amount of catechins in a tea flush varies from one component of the flush to another. Table 2 below shows the total percentage of the catechins in terms of the dry matter content in different parts of a flush of Assam tea, (Bhatia 19^3)

.")
13 10 Table 2 Percentage of Catechins in Different Parts of the Flush, of Assam Tea Coarjonent Bud 1st leaf 2nd leaf 3rd leaf Upper stem Lower stem Percentage catechin Besides this progressive decrease in the total amount of catechins in the different parts of the flush, catechin pattern is also different in the different components of the flush. In general the younger leaves have a high content of the gallated catechins and lov/er contents of the ungallated catechins. In the older leaves, the order is reversed. The stems have a higher content of GC than the leaves (Bhatia and Ullah, 1968} Forrest and Bendall, 1969} Nakagawa and Torii; 1964). Catechin contents and patterns are also affected by seasons, locality and different cultural treatments. All these factors had to be given consideration in the work concerning catechin analysis.


14 11 1,3 AEI GF THIS WORK The major objective of this work was to determine the catechin pattern of the East African teas in order to find out whether there are any clonal differences among them. It was also desired to find out whether it would be possible to apply the clonal differences in plant breeding work. Lastly, it was of interest to find out whether catechin patterns could be easily related to the overall tea quality as far as the East Africa teas were concerned. In order to accomplish the above, it was necessary to work out a simple and easy method for the analysis of the catechins.
 on August 6, 1973* Plots size for each clone was $2 plants spaced at 1.22x1.22m and replicated three tines.")
 Materials for analysis")
15 12 CHAPTER II EXPERIMENTAL 2.1 General methods \ The leaf material used for analysis was obtained from one field in Tinbilil estate, Tea Research Institute of East Africa (TRIEA), Kericho. The field was planted with CFTs (Clonal Field Trials) on August 6, 1973* Plots size for each clone was $2 plants spaced at 1.22x1.22m and replicated three tines. Besides the 10 clones used for this work, the field contained other clones of tea (Camellia Sinensis L»). Regular plucking of the plots started on February 4> 1975* Plucking was done weekly and fertilizer was applied regularly as recommended by the TRIEA (Tolhurst, and Green; 1973) Materials for analysis were obtained monthly to coincide with the day when actual plucking was being done. Shoots consisting of two leaves and a bud were used. As soon as leaf wa3 brought from the field, 10.00g in replicate for each clone were weighed accurately in a polythene bag. They were packed in cooling bags with ice packs placed on top and then transported to the laboratory in Nairobi on the sane day ( 4 hr journey). On arrival, they were placed in a deep freeze until required for analysis. On examination at arrival, they were found to be in good condition
 which is normally used as a reference standard are also shown below (lljuguna; 1977 ) In this work the")

16 13 The 10 clones of the tea used are shown below. Their yields and quality relative to one clone (6/8) which is normally used as a reference standard are also shown below (lljuguna; 1977 ) In this work the clone 6/8 is also used as a standard. Table 5 The Quality and Yields of E.A. clones relative to clone 6/8 Clone Quality of 6/8 Yield c/o of 6/8 1 6/ i 3 1/11 102* / / / / / / ,4 * Seedling / ' 10 7/ * T h e seedling tea included in the table was not included in this work,
 was transported to Nairobi (30 minutes drive) and then stored in the freezer.")
 acetone. The suspension was filtered on a Buchner funnel. The residue was macerated two more times with 1 litre of 80^o acetone each time, and finally with 1 litre of absolute acetone.")
17 u 2.2 PREPARATION OP REFERENCE EXTRACT CONTAINING THE SIX CATBCHIN5 The material used to prepare the reference extract consisted of two leaves and a hud of clone 6/81 which was obtained from a farm about 20 km from Nairobi. The material (about 1 kg.) was transported to Nairobi (30 minutes drive) and then stored in the freezer. Extraction was done the following day using the method by Co and Sanderson (1970) as follows* A 500g sample of fresh frozen tea leaves were macerated in a Sanyo Blender for two minutes with 1 litre of cold (0 C) acetone. The suspension was filtered on a Buchner funnel. The residue was macerated two more times with 1 litre of 80^o acetone each time, and finally with 1 litre of absolute acetone. The combined acetone extracts 41 were mixed with 21 of chloroform in a separating funnel. Distilled water was added until two layers formed and the chloroform layer was extracted three times with a quarter its volume of distilled water. The combined aqueous layers containing most of the polyphenols free of fat-soluble materials?/ere saturated with NaCl and extracted four times with a third their volume of ethyl acetate. The ethyl acetate extracts were combined, dried with anhydrous Na2S0^ and taken to dryness under reduced pressure. The solids obtained were extracted twice with dry ethyl acetate in order to extract the unoxidized tea flavonols from the oxidized (coloured) materials which are left behind

18 15 The ethyl acetate extract was evaporated to dryness under reduced pressure and the polyphenols obtained were dissolved in distilled water and freeze dried. The final product was a light-tan powder. The freeze dried extract was stored in a desiccator under P20^ uatil required for use. This reference extract is referred to in this thesis as "6/8 extract or simply as the extract". The extract proved to be very useful in the investigations and development of the analytical methods since it contained all the catechins found in the tea leaf,

 (6:1:2) v/v (Nordstrom and Swain; 1952)* 2nd Dimension 6$* v/v acetic acid - water Spray reagents Reagent I, Amixture of 2$ w/v")
19 ANALYSIS 0? CATSCHDIS BY PAPER CHROwlTOGRAPItY Apparatus and Materials Shan don chromatographic tanks and dipping trays, Whatman paper No, 1, Vanillin, p-toluenesulphonic acid, Ferric chloride and potasium ferricyanide. Analytical grade solvents were used. Solvent systems 1st Dimension Butanol - acetic acid - water, (B,A,W,) (6:1:2) v/v (Nordstrom and Swain; 1952)* 2nd Dimension 6$* v/v acetic acid - water Spray reagents Reagent I, Amixture of 2$ w/v vanillin and 1,3$ w/v p-toluenesulphonic acid in methanol (Roux and Llaihs; 1960), t * * * Reagent II, 2 /o Potassium ferricyanide, and 2fr ferric chloride (Barton et al; 1952)» The components of reagent two were each diluted five times and then mixed in equal proportions just before dipping. Methods The 6/8 extract was used as reference material. The development was as reported by Roberts (1964), On dipping the.paper after drying the separation of the catechins was found as reported by Roberts (1964). However, the resolution was poor and in most cases there was overlap. (Dipping in Reagent i)

, Nairobi. Visual comparison of the intensity of the spots when the extract was analysed is shown below.")
20 17 When the chromatograph was left for a week it was found that the +Gallocatechin spot had assumed a colour that was very different from all the others* Whereas all the other catechins gave colours which varied from yellow brown to dark brown, the +GC was very light pink. Subsequently it Y/as possible to identify the +GC from its colour as well as its position on 2D paper chromatograph. The identities of the catechins separated on the 2D paper chromatograph were arrived at by comparing their Rfs with those of authentic catechins obtained from Dr. Wilkins of the International Centre for Insect Physiology and Ecology (ICIPE), Nairobi. Visual comparison of the intensity of the spots when the extract was analysed is shown below. Other vanillin +ve polyphenols e.g. leucoanthocyanidins were also observed but these were not of interest and are therefore not included. Table 4 VISUAL COMPARISON OF CATSCHIN INTENSITIES OF THE EXTRACT ON 2D PAPER CHROMATOGRAPH Catechln Spot intensities (-) EGCG (-) ESC ( ) GC (-) ECG, (-) EC (+) C + +


21 18 It was soon realized that if comparison was to be made between clones, then paper chromatography was not the best technique. The resolution was very poor and reproducibility of this method was doubtful. Alternative methods were therefore sought. 2.4 ANALYSIS OF CATECKINS BY GLC Collier and mallows (1971) worked out a GI method for the estimation of catechins by derivatizing then to Triraethylsilyl ethers. Attempts were made to analyse catechins in fresh tea using their method. GLC equipment used A Pye Unicam 105 in analysis mode, and fitted with a flame ionization detector was used for analysis. The column fitted was a 1.5m long coiled glass (i.u. 4 ^ ) previously packed with 5$ OV^ coated Gas Chrom Q(l mesh.) The experimental conditions were as described by the two authors above except that the instrument did not have a detector heater. Reagents N^O-Bis-(trimethylsilyl) acetamide (BSA) and trimethyl- chlorosilane (TL3CS) were obtained from BBS. +catechin, EC, EGC, ECG, and EGCG were kindly supplied by Dr. C.K. Wilkins of ICIP3. All the solvents used were Analar grade*


22 19 Methods The extract previously described was derivatized according to Collier and Liallows (1971) On injecting an appropriate amount in the G-LC, it was found that the Gallated catechins did not appear* For this reason it was decided to use a mixture of EGCG and ECG. These two were derivatized and injected but they could not be detected. However, the two derivatized catechins (EGCG and ECG) were detected when the temperature was raised. After trying for many tines it was concluded that the whole problem wa3 due to the fact that the instrument did not have a detector heater. Since when the temperatures were raised initially, the two catechins were detected. Since so much tine had been spent in trying to set up the equipment, and separation was not improving, it wa3 decided to stop the analysis using the GLC and concentrate on other methods.
 gave better resolution but in this case the analysis was also twodimensional which required longer analysis time.")


23 ANALYSIS OF CATECHINS BY TLC As was mentioned above, analysis of the catechins by paper chromatography failed to give good resolution which could be used for the comparison of the different clones. TI on cellulose (Forrest and Bandel; 1968) gave better resolution but in this case the analysis was also twodimensional which required longer analysis time. Realizing the need and advantage for a method which could take a shorter analysis time, attempts were made to develop a one dimensional TLC analysis. By investigating one way TLC methods previously used for separation of other flavonoids, two TLC methods were developed which Y/ere one way and yet could give good resolution of the six catechins. One of the methods, using silica gel coating took about hours for development, while the othor on cellulose coating took 7 hours for development. With the two methods, it was found that it would be possible to compare catechin distribution in ten or even more clones at 3& 0. Also with short analysis time, it was possible to repeat the analysis where necessary. (a) SILICA GEL LjSTKOD Apparatus and Materials A TLC Motorized coater, and Silica gel C type 60 supplied by Llerck. Glass plates 20 x 20cm and 20 x 10cm, 2mm thick, were obtained locally. were used as the Reagent (i) and (il) as previously described spraying reagents. The 6/8 extract as well as the authentic catechins, were used for development in these separation methods.


24 21 ilethod The silica gel slurry was prepared by shaking silica gel G with twice its volume of water until the mixture was homogenous. The slurry was then applied on glass plates using the BTL motorized coater. After air drying, the plates were placed in the oven at 100 C until required for use. When required for use they were removed from the oven and cooled in a desiccator before use. For the analysis of the catechins, 6/8 extract in methanol was applied using a capillary tube. Spots were applied at about 2cm from the edge of the plate. The plate was then placed in the developing tank containing the solvent system. The solvent system was made up of chloroform-ethylacetate-formic acid in the proportions (60:40:10) v/v. This composition was found to give the best separation of all the catechins. Before arriving at this composition, various compositions had been tried and found not to give good separation. An original proportion (50:40:10) which was given by Stahl and S c h o m ( ) for the flavonoids in general gave poor resolution. After development (about 1.5 hours), the plate was dried in the oven and then sprayed with the vanillin reagent. The catechins gave the Rf values shown in Table 5 below. Authentic catechins were also analysed with the extract so as to identify the different catechins in the extract. Since there was no authentic +GC, the +GC in the extract was identified by its colour when sprayed with the vanillin reagent. The +GC gave a pink colour with the vanillin reagent as mentioned previously in the section on paper chromatography.


25 22 Table 5 Rfs of catechins on silica reel Catechin Rf X10Q X \ 40 + c 31 EC 2 6 ECG 22 +GC 1 0 EGC 1 4 EGCG 1 1 These Rfs were approximate and sometimes after long use the solvent gave different Rfs* However, the most important thing was that the separation was always good. Y/hen Reagent II was used as the spray reagent, more dilute samples had to be used; since it was more sensitive than Reagent I. However, Reagent II could only be used after the identity of the catechins had been established since it was a general reagent for all the polyphenols* No interference by the other polyphenols was found to occur on the catechins* A number of polyphenols were analysed also to determine whether they interferred with the catechins* These were, gallic acid whose Rf was higher than X, and chlorogenic acid, whose Rf was less than that of EGCG. Quercetin was also tried and found to have a higher Rf value than X «A crude extract of theogallin (Stagg and Swain j 1971) was also analysed and found to have moved only a short distance from the origin*


26 Plate 1as Analysis of 10 clones by silica gel layers - Vanillin spray Plate 1b: Analysis of 10 clones by silica gel layers - Ferricyanide spray


 Cellulose layers Vanillin spray I")

27 Figure; 2*. Analysis of catechins on silica gel layers using CHCl3~Et-acetate«Formic acid (60-*40:l0) Figure: 3: Analysis of catechins on cellulose layers using n-amyl alcoho[»ccetic acid**water (2-1-1) Cellulose layers Vanillin spray I Ferricyanide spray o o c i *, o o o o... o o... 6/8 EGCG EGC ECG EC +C j6/8 SGCG EGC ECG EC + Extr. «Extr.


28 Plate 2a: Analysis of 10 clones by cellulose layers - Vanillin spray Plate 2b: Analysis of 10 clones by cellulose layers - PerricyanitLe spray

 of fresh leaves (2+ a bud) for all the clones. 2. Also the same amount of solvent was used for the extraction of the catechins for all the clones. (100 ml). 3.")
29 25 CHAPTER III RESULTS AUD DISCUSSION 3.1 ANALYSIS OF CATSCSHT3 IN DIFFERENT CLONES As soon as an appropriate method for catechin analysis had been developed, a procedure was worked out to adopt the method for the comparison of catechins in the ten clones. The following procedure was adopted. 1. Since fresh material was being used for the analysis, it was decided to use the same weight (lo.oog) of fresh leaves (2+ a bud) for all the clones. 2. Also the same amount of solvent was used for the extraction of the catechins for all the clones. (100 ml). 3. The same amount (2 pi) of the extract was to be applied on the TLC plates for all the clones. In this way, if any differences were observed in the catechin pattern on the TLC plate, then they were due to the clone(s) since all the other conditions had been standardized. METHODS 0? AIIALY3I5 For each clone 10.00g of the leaves previously stored in a freezer were homogenized (for 5 minutes) in a small blender using 20 mis of cold methanol. The mixture was filtered, and the residue homogenized once more with 20 ml more of cold methanol. The procedure was repeated four times. After these extractions no more chlorophyll could be isolated from the residue

 was used.")


30 26 Figure 4: Apparatus used for applying the sample on the TLC plates The combined filtrate was made up to 100 ml. then stored in a freezer until required for analysis. To be able to apply the same amount of sample on the plate for all the clones, the apparatus shown, (fig. 4 above) was used. To fill the capillary tube with the sample required was done by dipping it in the sample, the sample sucked by capillary action until it was full. The whole sample was then applied on the TLC plate. To fill another sample, the capillary tube was first cleaned by filling it with methanol as before. To remove the methanol the teat was pressed quickly so that the methanol was ejected. This was repeated about 4 times until it was felt that the tube was cleani The next sample was filled and applied as before. After applying all the 10 samples, the spots were left to dry and then the plate was developed as previously described. Spraying was also as previously described.


31 27 The results of analysis indicated that there were some differences which were noticeable on the plate by visual comparison of the intensities of the spots. However, this difference was not as large as would have been expected. It was then felt that inclusion of all the component of the flush complicated the analysis since catechin varied with the age of the leaf and variation in the different clones would not be expected to be the same. Some preliminary analysis was done on each component of the flush as well as on a 3rd leaf and a mature leaf so that for each clone, 5 samples were analysed consisting of bud, 1st leaf, 2nd leaf, 3rd leaf and a mature leaf. Results of analysis by visual comparison of the intensity of the spots are shown below in table 7* These results are in agreement with the results obtained elsewhere (Forrest and Bandel; 1969» Bhatia and Ullah; 1968, Nakagawa and Toriij 1964)*
 buds (2) 1 st leaves and then")

32 Table 7* Catcchins in different leaves of clone 6/8 tea Catechin bud 1st 2nd' 3rd Mature +C EC ECO H H- ++ *GC EGC H EGCCr H HfHI 1H i H On basis of the results from the previous analysis it was decided to compare the catechin pattern in all the ten olones using (l) buds (2) 1 st leaves and then (3) 2nd leaves* This sort of comparison would reveal variations of the catechins within clones in the three components of the flush. The results showed that clonal variation in the catechin pattern was more pronounced for an individual component than for the whole flush. As a result of this and the previous analysis, it was found that the 2nd leaf struck a balance in the catechin pattern variation from the youngest bud to the 3rd leaf.with analysis of the 2nd leaf, the ungall at ed minor catechins viz. +C and +GC which are normally absent in the bud were present. Even a major catechin such as EGC was in very low concentration in the bud. On the other hand with the 2nd leaf, the gallated catechins had their concentration lowered but still high enough for easy detection.


33 29 Although using the 2nd leaf had the disadvantage of not representing the material used for manufacture, clonal variation was more pronounced which is an important part of this work. It would have involved more work beyond the scope of this project if the three components were to be analysed every time. Hence only the 2nd leaf was to be analysed. The other reason which warranted using the 2nd leaf for the analysis was the fact that it contributed the largest proportion in terms of the dry matter towards the weight of the flush. The results in this work seem to agree with those reported elsewhere. ANALYSIS OF COMPOSITION BY WEIGHT OF THE DIFFERENT CQmPOHEHTo OF A FLUSH Yfaen analysing the catechins in the flush, it was found that the 2nd leaf was the best indicator of the catechin pattern in the clones of the tea used. Results from elsewhere (Bhatia} 196$; Iwasa, 1977? Wilson, 1969) h ad shown that for a two plus a bud, the second leaf contributed about 46/^ of the dry weight of the shoot. It was therefore decided that an experiment be done using the ten clones


34 30 Experimental t». v - Leaf material, (2 + a bud) from the ten clones were obtained from the Botany department of TRIEA. About 10,Og were accurately weighed for each clone. The material was then separated into; 2nd leaf, 1st leaf, bud and the stem. These components were then weighed separately. The determination of the ft by weight (fresh weight) of each component was done. The samples were then placed in an oven at 100 ^5 ^ for 24 hours. After cooling in a desiccator the individual components were then weighed. Prom these the percentage by dry weight of the components was determined. The results were as shown on table 8a and b below

35 31 Table 8at Distribution by wt. of the different components of the flush in ten clones ( % Fresh wt.) Clone 2nd 1at Bud Stem 6/ / / / / / / / / / Mean*


36 32 Table 8bi Distribution by wt. of the different components of the flush in ten clones ( % Dry wt.) Clone 2nd 1st Bud Stem 6/ / / / / *7 11/ / / / / * Mean* Except for one clone, 11/ 52, all the other clones give results which shows that the 2nd leaf contributed % of the dry weight of the flush* The mean value for the ten clones was found to be a mean of 23 in term of the The 1st leaf ranked 2nd with by dry weight, while the bud ranked last, with mean of 13>j. In terns of the fresh wt., the 2nd leaf ranked 1 st with 43$» while again the bud was last* It should also be noted that on wet weight basis, the stem contributed a higher $ of mass of the flush than on dry weight basis.


37 33 5,2* Comparison of Catechins in the ten clones Visual comparison of the intensity of the spots could not have been practicable with the ten samples and six catechins in each sample. Comparison of the intensities of the spots using a densitometer would have been the best method. However, a densitometer was not available. For this reason a method was sought whereby it would be possible to compare the catechins in the ten clones without recourse to a densitometer. While trying to get the optimum concentration of the sample solution to be applied on the TLC, it was found that very low concentrations of the sample revealed the presence of only three catechins mainly EGCG, EGC and ECG, with ECC showing a faint spot. The other catechins vrere only very faintly visible or not visible at all. On increasing the concentration gradually, the other catechins appeared according to their concentrations. +C and/or -KJC were the last to reappear. The concentration of the reference sample solution had been worked out so that all the catechins were visible. If the sample solution was then diluted successively and the solutions applied on the same plate, concentrations would be reached where no catechins were visible on the TLC plate. Analysis of the plate, noting the concentration just before a given spot visually disappeared, would show the concentration of the given catechin in that sample relative to its concentration in another sample.


38 34 For instance, when two clones(6/8 and 3l/ll) were successively diluted as previously mentioned, it was found outfthat for 6/8 the EGC spot almost disappeared after it was diluted 10 times. For the same compound in 31/11» the spot almost disappeared when diluted 5 times. In this way one could by comparison say that the 3GC in 6/8 was twice a3 much as in 31/11. All the other catechins could also be compared in a similar fashion if all the condition were the same for the two clones. Since it was not possible to compare clones with each other without using a reference, clone 6/8 was used as the reference clone, so that all the other clones were evaluated against 6/8. Clone 6/8 was chosen for this purpose because as previously shown it was also used as a reference in describing the yield or quality of the other clones. Dilution of the sample solutions from each clone were carried out as shown in table 9 below Table 9* Successive dilution of the solution for comparison on the TLC Dilution Denoted by No of tj Sample solution 1-1 ml. to ml. to ml. to ml. to ml. to


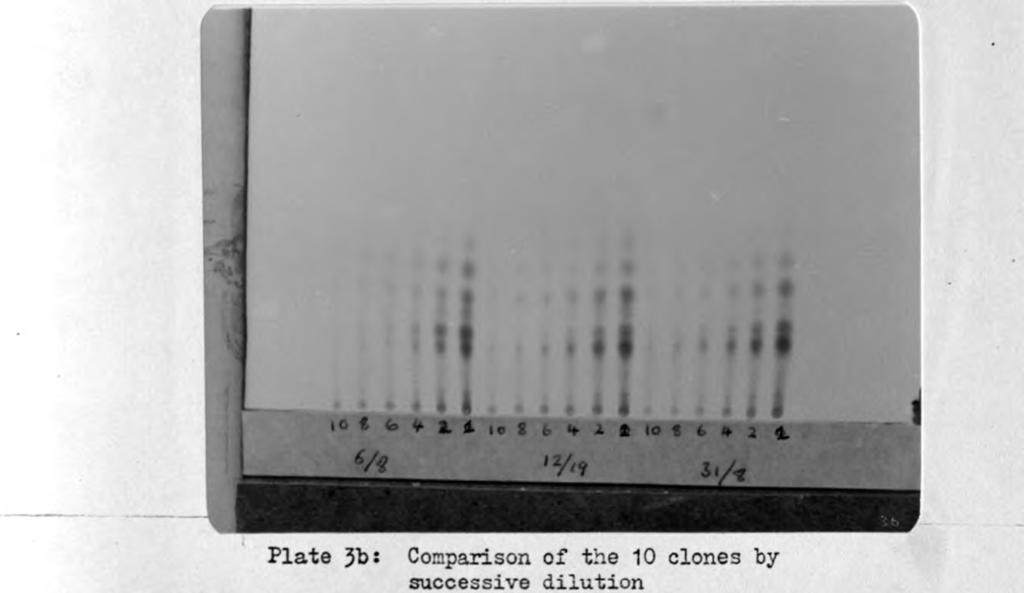
39 Plate 3a: Comparison of the 10 clones by successive dilution
 shows the TLC diagram s of clone 6 /8 and")


40 Figure 5 : fcomparison of the intensities of catechins on JLC after successive dilution;(5a) shows the TLC diagram s of clone 6 /8 and 31/11, while (5b) shows the data sheet used for recording the results after comparison. +C O (5a) Clone 6/8 Clone $1/11 'X 0 «SC O O ECG "X 0 * O O +GC 0 0 y X «>.SGC O O O x 0 0 X 0 : 0 0 EGCG 0 O 0» T J p o l a O 0 Tines Dild j i! b ; j it g,o KEY: l-*_j latching intensities for the two clones y.x'/a Uatchir^ intensities as recorded for each catechir r 0/0 Concentration relative to clone 6 /8


41 F i g u r e 6: EGCG and ECG variations in ten clones: 6 /8 used as s t a n d a r d


42 Figure 7* EGG,EC,*GC and *C variation in ten clones 6 / 8 used as standard


43 Plate 4a: Comparison of progenies of 6 /8 x 3l/l1 by successive dilution Plate 4b s Comparison of all the progenies of 6 /8 x 31/11


44 I. Figure 8a: comparison of catechin pattern in progenies of 6 /8 and 31/11, using 31/11 as standard i-e- 100%


45 ANALYSIS OF CAT3CKINS III PROGENIES OBTAINED BY CLOSED POLLINATION BETWEEN 6/8 x 517l1 Material for analysis \ The material used for analysis wa3 obtained from the Botany dept,, TRIEA. The progenies had been obtained from hand pollinated seeds of clone 6/8 x 3l/l1* (Green _et _al; 1974)* Fifty of the clones were propagated to the field in 1975* The material was plucked in August, 1970 Analysis of the catechins was as previously mentioned. A total of 40 clones were analysed and the catechin pattern computed relative to 6/8 and also relative to 3*1/1*1 Although 6/8 had been used as a standard in the previous comparison, it was found necessary to use 31/11 as a standard in this comparison. The reason being that by using the two clones as a standard, then it would be possible to determine whether the progenies were 6/8 dominant or 3l/l1 dominant with respect to the catechin pattern. The results in figure 8a and b are shown for 5 clones. All the other clones produced from the d o s e d pollination of 3l/l1 and 6/8 (Table 11), were analysed in the same way,
 Those which resembled 6/8 2) Those which were close to 6/8 N 3) Those which were between 6/8 and 3l/l1 in")


46 39 In this way, the clones obtained after closed pollination of 6/8 x 3l/l1 could be divided into five groups. 1) Those which resembled 6/8 2) Those which were close to 6/8 N 3) Those which were between 6/8 and 3l/l1 in pattern 4) Those which were close to 3l/l1 5) And those that resembled 3l/l1 Table 11: The five groups of the clones from 6/8 x 3l/l1 Resembling 6 /8 Close to 6 /8 Between 6 /8 and 31/11 Close to 31/11 Resembling 31/11 311/32 311/8 311/5 311/5 311/2 311/73 311/13 311/38 311/57 311/4 311/76 311/24 311/59 311/ /6 311/ /32 311/62 311/ /11 311/ / /98 311/ /54 311/ / / /84 311/ / / /215

 show how these clones could be divided. These histograms sho?")

47 40 Prom table 11, 6 clones out of the 36 analysed were found to have a catechin pattern resembling that of 6/8 while 9 were found to have a catechin pattern resembling 31/ 1 1. Of the reminder, 5 were close to 6/8, 7 close to 3l/l1 while 9 were in between the two clones, or could not be categorized* The histograms (figure 9) show how these clones could be divided. These histograms sho?f that the progenies of 6/8 x 3l/l1 are 31/11 dominant in terms of the catechin pattern. Whether these would also give a tea of quality close to 3l/l1 remains to be established. However, if all else remains the same, we would expect the clones resembling 3l/l1 to give teas 0f same quality as 3l/l1«This can only be verified when the clones will be manufactured and tasted.


48 \ Figure 9: Frequency distribution histograms of progenies 6 /8 and 31/11.Distribution in Numbers KEY: Resembling 6 / 8 H j Close to 6 / 8 Between 6/8 and. 3l/l1 i m!\ Close to 3 1/11 jmllill! Resembling- 3 1/11

 catechin percentages lower than 6/8.")

49 CHAPTER 17 Presence of two more "catechins" in some clones It was mentioned earlier that comparison of the catechin patterns in the ten clones relative to 6/8 revealed some noticeable differences in some clones* Some of the differences were so pronounced that they warranted further investigations. One such difference was observed in clone 12/12, in which the percentage of (+) catechin relative to 6/8 was 5 higher. Except for clone 12/19* which had the same percentage as 6/8, all the other clones had their (+) catechin percentages lower than 6/8. In all the TLC plates which were analysed for comparison purposes, it was noticed that the (+) catechin spot for clone 12/12 was always the most intense when the vanillin reagent was used as a visualizing reagent. The intensity was even much higher when ferricyanide spray was also used. To check whether the (+) catechin spot was enhanced due to the presence of other non-catechin polyphenols, it was decided to analyse the clone 12/12 extract using the cellulose TLC. It was expected that if the enhancement was due to another compound then the compound was not likely to have the same Rf on the silica gel TLC as on cellulose. Upon analysis as previously stated, it was noticed that although the +C spot was still larger, there was-another vanillin positive compound in the 12/12 extract which had a higher Rf than ECG. (See figure 10c).


50 42 (With cellulose TLC DCG had the highest Rf obtained so far). However, the compound was in much lower concentration th«n any of the catechins previously mentioned# It was also sensitive to the Ferricyanide reagent. With this complication, it was decided to prepare a crude extract from 12/12 as had been done for the 6/8 so as to be able to investigate the new compound further. Analysis of the extract by cellulose again confirmed the presence of the compound. Also analysis of the 12/12 extract on silica gel TLC, showed the same intense +C spot. But now there was another faint spot whose Rf was higher than +C. This spot was very faint with both spray reagents and it was easy to detect the spot only when the extract was applied in concentrated form. Previously, it had been noticed that the Rf of the catechins on the silica gel were very sensitive to small changes in solvent composition# Formic acid had the largest effect on the Rf Thus when a solvent composition of 60*40:15 was used instead of 60*40:10, (chloroform - ethyl acetateformic acid), the +C spot was resolved into two distinct spots# The previously mentioned faint spot with Rf higher than +C retained its position, while the +C spot got resolved into two spots (see fig. 10b), one at the original position and the other one at a slightly higher Rf.
 Silica gel 6 0:4 0:15 Vanillin Spray")

51 Figure 10* TLC separation of X and Z;on (b) and on cellulose layers (c) (a) Silica gel 6 0 :40:10 Vanillin Spray (b) Silica gel 6 0:4 0:15 Vanillin Spray 0 o o o # 0 0 O O e c <j O O o 4 o o o. z O *C. O 8 & 9 o o +GC o o 0 0 o Q G C Q cgcg o o /12 dilute 12/12 cone. 6/ o 1 2 / 1 2 dilute 12/12 6 /8 cone.
 and ] (c)")


52 silica gel la y e r (a) and ] (c) Cellulose 2 0:10:10 Vanillin Spray f * 0 Q ecc f a o O 4-C. ) S G 'G if'o i Qec, 0 O O+&C 0 0 O cn / i I I! i i it i t 12/12 12/12 dilute conco CO i


53 The spot with highest Rf was denoted by X while the one resolved from +C was denoted by Z. When attempts were made to use preparative TLC on the silica gel in order to isolate compounds X and Z it was not possible to extract them from the silica gel whatever solvent was used for extraction (water, methanol, ethyl acetate etc)* Using the cellulose layers the compound having the highest Rf on cellulose was isolated by preparative TLC and on TLC reanalysis on the silica gel, it was found to be Z. 4*2 TENTATIVE IDENTIFICATION OF THE CATECHINS X AND Z BY THEIR Rfs ON THE TLC 3 Careful observation of the Rfs of the catechins on the silica gel layers seemed to suggest that the Rfs were a function of the numbers of OH groups as well as the epineric structure of the cateciiin. With this in mind, graphs of Rf of the catechins against their number of OH groups were plotted* Since the number of OH groups on X and Z were not known, graphs were first ploted using the known catechins* Three lines were plotted, viz* one for the (-) gallated catechins; the second one of the (+) catechins and the third one for the (-) catechins* All the graphs were parallel lines. Now since the catechin had to have a whole number of OH groups, X and Z were inserted on the lines according to their Rfs and also according to the lines giving a whole number of OH groups.
-afzelechin was present it would also have fallen on the (+)-catechin line at the position shown on the graph.")

54 Using those criteria X was found to correspond with (-)-epiafzelechin while Z was found to correspond with (-)-epiafzelechin gallate. This seemed to suggest that if the (+)-afzelechin was present it would also have fallen on the (+)-catechin line at the position shown on the graph. According to this approach the Rfs of the catechins having the same epimerio structures, and similarly substituted were functions of the number of OH groups. Since there was a second TLC method which could also be carried out on the catechins, graphs were also drawn using the Rfs on the cellulose layer. Results of the graph again suggested that Z wa3 likely to be (-)-epiafzelechin gallate as suggested above. The position of X on the cellulose plate had not been known since unlike Z it was not well separated from the other catechins on cellulose, and therefore, preparative TLC could not be carried out. On the other hand, the position of X was only known on the Silica gel and although it was well separated from the other catechins, it was not possible to extract the catechins from the silica gel TLC plates. The indication from the graph (fig. 12) that X had an Rf close to ECG was interesting since ECG being the second highest catechin in tea and also X being in such low concentrations, would mean that X might not be easily detected in an extract containing ECG.


-catechins 0")
55 Figure 11: Graph of RFxioo of cafechins v.s: their no. of OH. I RFxtoo KEY: (-)-catechins O (+)-catechins 0 (-)-gallated catechins

-catechins 0 (-)-gallated")
56 Figure 12: Graph of RFxioo f catechins v-s. their no. of OH i KEY: (- )-catechins (+)-catechins 0 (-)-gallated catechins *
 could also not be found# To be able to characterize the compound X (supposedly (-)-epiafzelechin) it was necessary to isolate it from")
 could not be applied since these were meant for the separation of only six catechins# It was therefore necessary to develop a method")
57 45 Unfortunately there was no authentic (-)-epiafzelechin to confirm whether X was what it had been shown to be by the two TLC methods. The species of trees containing this compound (King et alt 1955) could also not be found# To be able to characterize the compound X (supposedly (-)-epiafzelechin) it was necessary to isolate it from the tea extract# Being the lov/est in concentration in tea among the other catechins in much higher concentration, it was expected that isolation of X would not be all that simple# The methods used for the isolation of the other catechins (Vuataz et al, 1959) could not be applied since these were meant for the separation of only six catechins# It was therefore necessary to develop a method whereby would be possible to isolate X and o and characterize them#

 the catechins")
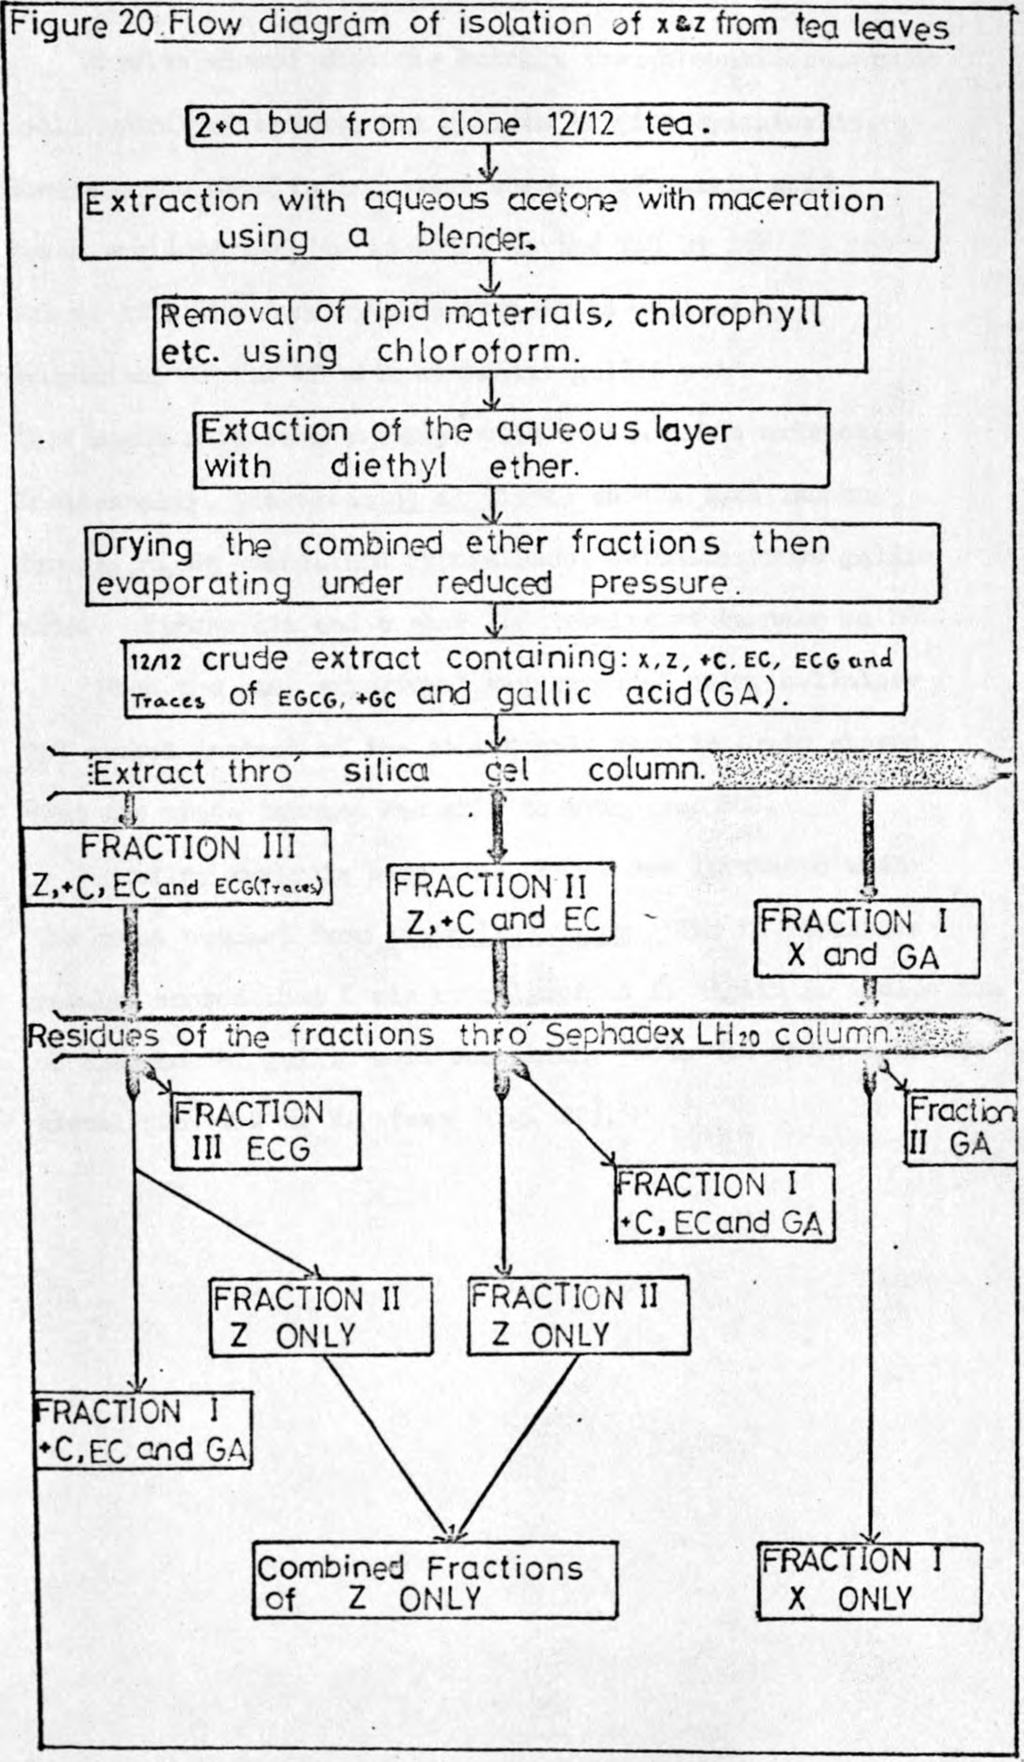
58 METHODS USED FOR SEPARATION OF X AND Z FROM THE OTHER CATECHINS Leaf materials from clone 12/12 were used. Leaves previously stored in a deep freezer were homogenized with cold acetone as previously described. The combined acetone extracts were separated into two layers by addition of l/5 its volume of chloroform. The aqueous layer was then extracted 5 times with 1/3 its volume of diethyl ether (investigations had shown that by using diethyl ether instead of ethyl acetate (Co and Sanderson 1970) the catechins extracted were mainly the less polar ones i.e. Z, X, EC, +C). The other catechins (EGCG-, EGC, +GC and ECG) were also extracted, though in very low concentration. The combined ether extracts were dried over anhydrous sodium sulphate, and then evaporated under reduced pressure to near dryness. The extract co obtained was rich in Z, X, C and EC. Separation of X, Z was carried out using this extract. Thi3 extract is referred to as the 12/12 extract. Since silica gel gave very good separation of the catechins it was felt that transformation of the method into column would also give good separation. However, the solvent used for TLC could not be used on column.


59 47 This was because it contained formic acid which would be difficult to remove after the separation. Hence a different, solvent system was to be used, probably the same but omitting formic acid, i.e. chloroform and ethyl acetate. But since ethyl acetate was more polar and also the compounds seemed more soluble in ether, it was felt that using ether in place of ethyl acetate might give separation. The separation was tried on TLC using air dried plates.(fig. 13). Activated plates gave streaks and therefore were abandoned. Another TLC trial using a solvent system of 6 s4 gave Rf for X as 0:13 while that of +C was 0s08 suggesting even better separation. Having got good separation on the TLC it was now necessary to translate it into column separation. Considering that the Rf of X was very low, it was obvious that to get good separation on the column within a reasonable time, as short column as possible was to be used. And to separate a large amount of sample, a column had to be very wide. The following diagram shows the arrangement used for the separation of X. (see fig. 14)*

")
60 Figure 13: TLC separation of X air-dried silica gel layers Solvent system: diethyl etherchloroform (7 :3 ) Vanillin spray

61 and ( J-catechin using RFxioo of X = 1 3 RFxioo of w*c = 8 ie. good separation


62 \ Figure 14: Apparatus used'for from the crude tea extract separating X & Z


63 48 The separation was monitored b y letting a few drops of the eluate fall on the vanillin reagent paper and then heating the paper with a hair drier, whereupon if compound X had started eluting, a red colour was given. As soon as the eluate gave the red colour, fraction collection was started. About 10 ml fractions were collected. The collection was continued until no colour was obtained with the eluate. Y/hen the colour reaction with the eluate reappeared, collection of the fractions was again started, until about 10 more fractions were collected. The fractions were then analysed on the silica gel plates. The same amount of each fraction was applied.


64 49 After a number of preliminary separations, the best separation conditions were found to be as follows Solvent system - diethyl ethers chloroform 1 :1 / Column material - silica gel BDH mesh Column length - 8 cm Column diameter - cm flow rate 2*0 ml/min. Method: The silica gel slurry was prepared using the solvent system mentioned above. The slurry was shaken then swirled so as to remove the air bubbles and then added to the column using a funnel. Addition was done until the column length was slightly above 8 cm so that on settling the length became about 8 cm, A filter paper was placed at the top of the silica gel. The excess solvent above the column was either eluted or removed by sunction until the level was the same as the column packing. About 0.5g of the 12/12 crude extract was dissolved in about 15 ml of the solvent. This solution was placed at the top of the column and then allowed to elute until it was at the same level as the column packing, A few mis of the solvent system was added for rinsing. This was again eluted. The solvent mixture was then added and the rate of flow adjusted to 2.0 ml/min. After collecting the first 100 ml, the eluate was constantly monitored using vanillin reagent paper (filter paper previously dipped in vanillin reagent then dried). I I i


65 Figure 15: TLC monitoring of the fractions eluted through a silica gel column (fraction s 1 to 1A mainly X ) Silica gel layers Vanillin Spray o X 9 # o X O o O? O O o O O o o O * o o # o *. o o o # o o r o O # o / * * * * m m»v/2 l*l fy9 n/a 9 J2 IS 16 I2//1 e*t*. ext*, loo ml extr. Bxtr. xtr. f^ r a. c t i c sis l O W t e a ch.

 TLC monitor indicated it to contain trace Z, and +C and EC and ECG 5) TLC monitor indicated it to contain trace EC, ECG and EGCG From this it was clear that it was")
66 50 Once the separation nethod was mastered, it was possible to carry out bulk collection as soon as colour with the eluate was obtained* When the colour intensity seemed to disappear, the container was changed, and then when the colour reaction reappeared again another container was placed and at this stage fractions of 100 ml each were collected. In this way separation of the catechin by column was as follows: (Fractions 1 to 5) 1) Ho colour with vanillin 2) TLC monitoring indicated that it contained mainly X 3) TLC monitor, indicated it to contain Z, +C and trace EC 4) TLC monitor indicated it to contain trace Z, and +C and EC and ECG 5) TLC monitor indicated it to contain trace EC, ECG and EGCG From this it was clear that it was possible to separate X from the rest of the catechin. However, it was not possible to separate Z from the other catechins especially +C and EC, This was expected since even on the silica gel TLC Z overlapped with (+) catechin, while the Rfs between (+) catechin and epicatechin were very close.


 cellu")
67 Figure: 16 Checking the purity of X by TLC using; ( a ) cellu lo se layers


68 51 Having isolated X from the rest of the catechins, the next step was to check for its purity. This is because during the separation only vanillin reagent was used for checking the presence of the catechins. The ferricyanide reagent could not be used due to its non-specificity. V/hen X was analysed on the silica gel TLC and the Ferricyanide reagent used as a spray, it was observed that X was not pure but was contaminated with another compound which was not sensitive to the vanillin reagent. The compound had only slightly higher Rf than X. The compound was suspected to be gallic acid, and indeed on checking its Rf with that of gallic acid it was found to be the same. Even on cellulose, the Rfs agreed with that of gallic acid. Spray with an acid indicator (Bromecrasol blue) confirmed it to be the acid. This meant that although X had been separated from the rest of the catechins, it had not been separated from gallic acid. It was therefore necessary to work out a method whereby X could be separated from gallic acid.. By coincidence the method for separation of Z from the rest of the catechins happened to cater for the separation of X from gallic acid as will be shown later on.


69 52 4*4 ISOLATION OF COluPOUND Z FROM THE REST OF THE CATE CHINS USING SEPHADEX LH20 COLUi.IT Analysis of the catechins on both silica gel and cellulose layers had shown that their Rfs were dependent on their structures as well as on the numbers of hydroxyl groups they contained* Johnston et al (1968) also showed that on sephadex LH20 column, there was a definite correlation between elution volume of the flavonoids and their structures* They also showed that the degree of adsorption of the aglycones depends generally on the number of the hydroxyl groups* With this in mind, separation of compound Z from the other catechins was tried* Method Sephadex LH20 was swollen overnight in methanol. The gel was then packed into a column 57 x 1*75 cm* The flow rate was adjusted to 1 ml/min* The 12/12 extract was used for trial separation. About 50 S* of the extract dissolved in methanol was applied on the top of the column* Elution was done using methanol* Five ml fractions Y/ere collected then analysed on TIC*

 catechins, while Z eluted with (-) Epicatechin gallate which again supports the previous results which indicated that X was ( ) epiafzelechin while Z was (-) epiafzelechin gallate.")
70 53 4*5* TLC Monitoring of the fractions after separation on Senhadex LK20 Column Fraction collection was started as soon as the slightest vanillin reaction was detected with the eluate. All the fractions were 5 nl each. The same amount of the sample from each fraction was applied on the TLC for analysis. The results are shown in table 12. These results seem to indicate that although complete separation of the catechins was not possible, the separation was as expected from Johnston s work (i960)* Compound X eluted at the same time as (+) catechins, while Z eluted with (-) Epicatechin gallate which again supports the previous results which indicated that X was ( ) epiafzelechin while Z was (-) epiafzelechin gallate. In this analysis, the extract used was that of 12/12 which did not contain any E G C, and contained only traces of +GC. From the separation of the other catechins, it was expected that if the sample contained EGC as well as all the other catechins, then this would have eluted with the +GC soon after (+) catechin and epicatechin. In the next analysis therefore a mixture of 6/8 and 12/12 was used


71 / Figure17: TLC monitoring of the fractions eluted through Sephadex LH2 0 column, solvent; methanol Silica gel layers Vanillin spray O X 2 - O z 2 * O+c O + c 0 * +c * 0 E c 0 O E C o - 0 & C6.. O *... O Q f c o 0 CG CS * O * : O^-Sc-.. O f<3 C* OE-GCG *.. Gcg ) 0 : y : : - l*//2 ' 2 6/e. 3 * 'V'* S 9 10 U _ / - r a & t / o a s S m / i.


72 TABLE NO* 12 j TLC monitoring of fraction after separation on Sephadex LH20 Fraction I II III IV V No catechin Mainly X, +C & Mainly + C, EC No catechin Z and ECG deteoted traces of EC & traces of detected only tgc Fraction VI VII VIII IX Mainly EC, Mainly EGCG & Traces of EGCG No catechin & traces of traces of ECG' ONLY detected Z & ECG
. This was methanol chloroform in the ratio 1*1.")
73 5 A Although the above-mentioned, separation using LH20 seemed to give further information as to the structure of X and Z, the separation was not all that impressive, and it was decided to try a different solvent system which might give better separation* The solvent system tried was that used by Coxon ot al (1972). This was methanol chloroform in the ratio 1*1. The same column was used* The flow rate was again adjusted to 1 ml/inin* This time a mixture of 6/8 and 12/12 extract was used* (This was because 6/8 had no detectable X or Z, whereas 12/12 which contained X and Z did not have EGC and +GC in appreciable concentration* Again the sample was eluted and fractions of 4 ml each collected* They were analysed on the TLC* The TLC trace shows that* 1) X eluted alone followed by 2) +C, EC, and GA which eluted at the same time 3) Z though slightly ahead eluted with +GC, EGC, 4) followed by ECG, which eluted alone, followed 5) by EGCG which eluted alone. With this sort of separation, a graph of Ve vs the number of OH groups was plotted*
 Silica gel layers Perricyanide")


74 Figure 18: TLC monitoring- of the fractions eluted through Sephadex LHio column, solvent; MeOH:CHCb (50'50) Silica gel layers Perricyanide spray e 9 oo 0 O G* X Z+c EC E C6 O 4<ic 8 C.& C tc.cs..... O... O..., o o O O O o *.... o o O O o o *... * * * J,. oooooo# o o O O * * o o O O d * / * o o Q o # K 1* IS * S $ » fcach FRACTION r Ani.


75 55 The graph showed, that straight line plots were obtained, (a) for the simple ungallated catechin viz X, +C, EC, +GC and EGC$ n (b) (c) for the gallated catechins viz, Z, ECG and EGCG the two graphs intersected at the Ve for Z, and +GC, BGC. This again seem to support the structures of X, and Z as predicted from their R f3 on the TLC, The separation by Sephadex LH20 did not only prove useful in supporting the previous work on TLC but v/as also useful in the separation of X and Z from the rest of the catechins. It was previously mentioned that the sample of X obtained from column separation using silica gel was contaminated by gallic acid, A look at the TLC results on the fractions from sephadex LH20 show that X eluted alone on LH20, while gallic acid eluted with (+) catechin and epicatechin. This meant that X was pure in this case. It also meant that once X had been separated on silica gel its purification could be done by passing it through sephadex LH20. This way all the X separated using silica gel was purified.
 catechin and epicatechin.")

76 56 From the analysis of fractions from LH20 it can he seen that Z eluted with +GC and EGC* This might at first appear as a complicating factor hut it was previously shown that when the 12 /12 extract was passed through the silica gel column X eluted first followed hy Z, then hy (+) catechin and epicatechin. Epicatechin gallate eluted later on followed by (+) GC and EGC* By collecting fraction after X had just eluted it was possible to get a fraction consisting of mainly Z, +C and EC and a trace of ECG* uith no +GC and EGC present, passing the sample through sephadex LH20 fractions consisting of Z only could he collected* Reanalysis of the collected fraction on TLC showed the sample to he mainly Z*


77 L Figure 19 : Graph of Ve/Vt vs- the num ber of OH of the catechins a s separated through^ Sephade* LH20 column, s o lv e n t; MeOH-CHCU (50-50) Ve = Elution volume Vt = T otal bed volume

, but since a proper strain of A.")
78 FURTHER ANALYSIS OF X AMD Z Indications from three different chromatographic methods were that Z was a gallate of X. To verify this, some more experiments on Z were performedo One of the methods was hydrolysis of Z under mild conditions. Such hydrolysis would only be done using enzymes. If on hydrolysis Z gave X and gallic acid, then this should be a confirmation that it was a gallate of X, or opiafzelechin gallate. For the enzymatic hydrolysis to be done, it was necessary to prepare tannase from Aspergillus niger. The preparation of tannase was according to Coxon et al (1970), but since a proper strain of A. niger as used by Coxon was not available, crude mixture cultured from potatoes was used as a starting material. With no proper knowledge as to whether the extract from the A. niger could hydrolyse gallate or not, its effect on the catechin gallates was first tried by incubating the aqueous extract with Epicatechin gallate' at room temperature (23^C). Analysis of the reaction mixture was performed before addition of the catechin and then at given intervals after the addition.


79


80 58 Results showed that the extract though considered crude could hydrolyse epicatechin gallate to give epicatechin. However, the results indicated absence of gallic acid which would be easy to identify on the TLC by its colour with the ferricyanide reagent as well a3 by comparison of its Rf with authentic gallic acid. This might have been expected with such a crude extract. Incidentally, Nicholson et al (*1931) showed that tannase from A. nirrer contained pyrogallase, which destroys gallic acid. Figure 21a and b show TLC results of tannase on ECG When the same experiment was repeated using cellulose TLC method instead of the silica gel, results again showed that the crude tannase was able to hydrolyse ECG. Similar analysis were done when Z was incubated with the crude extract from Aoergillus niger. results showed that Z was hydrolysed to X. The TLC analysis Again no indication of presence of gallic acid was shown. Both TLC methods showed hydrolysis of Z to X. (*see fig. 22).


81 TLC Result of A Figure 21: <'-*/<*>^ 'y c - r extract on ECG


82 59 4*7* HYDROLYSIS OF GALLATES WITH TANNASE IN THE PRESENCE OF ALCOHOLS Although hydrolysis of the gallates did not give gallic acid as expected, it is interesting to note that incubation of the gallates with tannase in the presence of methanol or ethanol, gave the aglycone and either methylgallate or ethylgallate. This was shovm by the two TLC methods - figure 25* The gallates as expected had a much higher Rf than the catechin or gallic acid on silica gel layers. The gallates also gave a +ve colour with the ferricyanide reagent. Comparison of the Rfs with those of authentic gallates supported their presence. Similar experiments on the cellulose layer also gave the same results. Therefore, although Z or ECG did not give gallic acid on hydrolysis, it is now obvious that either the gallic acid was enzymatically decomposed as soon as it was formed, or it was transformed into an alcohol gallate when alcohol was included in the reaction mixture. The last part of the experiment to show that Z wa3 a gallate was the measurement of the Emax for both X and Z. The table No. 13 shows the experimental values as well as literature values of the catechins and their gallate. Coxon et al (1972).


83 Figure 22; TLC Results of hydrolysis of Z with tannase, from / V C c / Q.* '. Silica gel Ferricyanide spray. G r n Q X Z 0 0 z.4-c 0. E C Q. C (r 0 + <rc O ECrC O t t r C<r Q 1 2.//2. t z x b r - Z o n l y a 0r f \ / 2 / / 2 e z x t r. Figure 25 s TLC Results of hydrolysis of gallates with tannase in the presence of ethanol GA - Gallic acid
 * 276 2200 (-) Epiafzelechin gallate (z) (Expt.")
 Epicatechin-5, * * * * 282 25800 (-) Epigallocatechin-5, ^-^i&allate * * * * 285 26600 * King et al (1955) * * Vuataz et al (1959) * * * Wilkins et al (1971) * *")

84 60 Table No. 15: EXPERB I?rAL AND IJTERATUBE VALUES 0?. E mcix OF CATSCHINS AND THEIR GALLATES m a x nm Emax Compound X (Expt.) \ (-) Epiafzelechin (Expt. and Lit.) * (-) Epiafzelechin gallate (z) (Expt.) (-) Epicatechin * * (-) Epicatechin-5-gallate * *, * * * (-) Epigallocatechin * * (-) Epigallocatechin-5-gallate * * f * * * (-) Epicatechin-5, * * * * (-) Epigallocatechin-5, ^-^i&allate * * * * * King et al (1955) * * Vuataz et al (1959) * * * Wilkins et al (1971) * * * * Coxon et al (1972) As seen, Z has an Emax about four times as high as for X, in agreement with the literature values which also indicate that the Emax of monogallate is at least four times as high as that of its aglycone. Later on after this analysis had been done, a sample of (-) epiafzelechin was kindly sent by by Professor Clark-Lewis of Flinders University,' Australia, Its comparison with compound X on both the TLC methods indicated that they were the same.

 to predominate in the")
85 61 A final aiguement for showing that Z is a gallate of X was achieved by analysing the bud of the flush* The amount of Z in the bud was considerably higher than X which is to be expected since gallated catechins have been shown (Bhatia and Ullah, 1968} Forrest and Bendall, 1969} Nakagawa and Torii, 1964) to predominate in the bud,


86 62 CHAPTER V CONCLUSION Two simple and fast TLC methods of analysis, of catechins in fresh tea leaf were developed. Since both methods were one dimension TLC, very low concentration of the extract from tea leaf was required for analysis. When high conoentra^- tion of the extract was used, two lower homologues of the catechins were detected. These normally occur in very low concentration in the tea leaf. One of these catechins has not been reported anywhere. In one of the analysis methods, which used silica gel, no interference from the non-catechin polyphenols occurring in the tea leaf was found. In the second method of analysis, where cellulose was used, interference from the non-catechin polyphenols was evaded by the use of specific spray reagent for the catechin. Further developments of the methods were done by plotting the Rf of the catechin against the number of hydroxyl groups of the catechin. Each catechin homologue fell on a straight line on both the methods. These methods could be used for the tentative identification of other catechin homologues not previously reported, in tea leaf. Since the two lower members of the catechins were to be separated from the tea leaf, a method for their separation was also developed.
 epiafzelechin gallate. Only two clones appeared to have detectable amounts of these two compounds under the condition of the analysis.")

87 After separation one of the compounds gave identical results when compared with (-) epiafzelechin. The second compound gave (-) epiafzelechin when hydrolysed enzymatically using crude tannase. This was identified as (-) epiafzelechin gallate. Only two clones appeared to have detectable amounts of these two compounds under the condition of the analysis. However, when higher concentrations of the tea leaf extract from the other clones were used the two compounds were also detected. Using the two methods, analysis of the components of the flush was done. The younger leaves were found to be richer in the gallated catechins, and poorer in the ungallated catechins, while the older leaves were found to have the reverse pattern. The stem was found to have very low concentration of the catechins and especially the gallates. This result agreed very well with those reported elsewhere (Bhatia and Ullah, 1968; Forrest and Bendall, 1969; Nakagawa and Torii, 1964)* Comparison of the catechin pattern using the whole shoot and also using the second leaf was done. The second leaf was found to be the best indicator of the catechin pattern in the clones used. Also in separate experiments, the second leaf was found to contribute about 45tfo of the dry weight of the shoot. Therefore, in the comparison of the catechin pattern in the tea clones, the second leaf was used rather than the whole shoot.


88 Comparison of the catechin pattern in the tea clones revealed that differences existed. One of the clones, 6/8 usually used as a standard for yield and quality, v/as found to have a very unique pattern. The other clone $l/l1 a high quality clone was found to have a pattern distinct from that of 6/ 8, Two other clones had close patterns but also unique from the rest. These two clones were the ones which had detectable amounts of the two lower, members of the catechins under the experimental conditons used. The remaining six catechins did not appear to have patterns which varied a lot from each other, \ Catechin analysis can be applied in breeding work to follow the catechin pattern of the progenies of known parents. Since very little amount of leaf would be required, the analysis could be done using plants in the nursery. It would be expected that other factors being the same, clones with the same pattern of catechins should give teas of more or less the same quality. The analysis of the catechins would be useful in earmarking plants with potential for good quality, in plant breeding, using nursery material.


89 65 Finally application of the catechin analysis in the manufacturing process could be done to follow up the changes occurring during fermentation* Previously, monitoring of the changes occurring during fermentation has been slow and tedious since it takes long to get the results, more than a day* With the one way TLC, it is possible to otain the results within two hours, besides analysing about 20 samples on the same plate* This type of work is likely to be very useful to the *A* tea industry especially bearing in mind that the ij.a* teas fetch their high value in the world market due to their cup characteristics which basically tie up with the content of some catechins (Hilton, 1975)
 4) I.S. Bhatia, Two and a bud. 1 0 1 Number 2, 29, (l9^3) 5.) I.S. Bhatia and Li.R. Ullah, J. Sci. Fd. Agric; 19. 559-542 (1968) 6) A.E.")
 9) H. Co and G.W. Sanderson, J. Fd. Sci0, 35,. 160, (1970 ) 10) P.D. Collier and R. Mallows, J. Chron. 5 7 29-45, (1971) - 11) D.T.")
. 13) G.I. Forrest, Final. Report, T.R.S. Malawi, Sept. (19^7) 14) G.I. Forrest and D.3. Bendall, Biochem. J. 115i 741-755,(1969) 15) K.J. Green, C.N. Kagira, J.C. Templer, C.")
90 66 REFERENCES 1) R.F. Albach and G.H. Redman, Phytochem. 8, 127, (1969) 2) G.U. Barton, R.S. Evans and J.A.F. Gardener, Nature. H O 249, (1952) 3) J.E. Berkowitz, P. Coggon and Sanderson, Phytochem. 10, , (1971) 4) I.S. Bhatia, Two and a bud Number 2, 29, (l9^3) 5.) I.S. Bhatia and Li.R. Ullah, J. Sci. Fd. Agric; (1968) 6) A.E. Bradifield, M. Penney (in part) and W.3. bright J. Chen. Soc., (1947) 7 ) R.A. Cartwright and E.A.1I. Roberts Chen, and Ind , (1954) 8) P. Coggon, G.A. Moss, H.N. Graham and G.W. Sanderson, J. Africa Fd. Chen , (1973) 9) H. Co and G.W. Sanderson, J. Fd. Sci0, 35,. 160, (1970 ) 10) P.D. Collier and R. Mallows, J. Chron , (1971) - 11) D.T. Cox on, A. Holmes, V<.D. Ollis, and V.Co Vora, Tetrahedron. 28, , (1972) 12) A. Ferriti, V.P. Flanagan, H.A. Bondarovich and M.A. Gianturco, J. A^rric. Fd. Chen. 16. No. 5, , (1968). 13) G.I. Forrest, Final. Report, T.R.S. Malawi, Sept. (19^7) 14) G.I. Forrest and D.3. Bendall, Biochem. J. 115i ,(1969) 15) K.J. Green, C.N. Kagira, J.C. Templer, C.G. Bazirake- Ntawera, Annual Report (ifrxbla.)
 20) P.J. Hilton, Phvtochem. 11, 1243-1248, (1972) 21) P.J. Hilton, Quarterly Hewsletter Ho. 37, 3, (1975) 22) P.J. Hilton and E.T. Ellis, J. Sci. Agric. 23, 227-233, (1972) 23) P.J. Hilton, Palmer-Jones and R.")
 26) K.M. Johnston, D.J. Sterm and A.C. Waiss-Jr., J. Chromo 35«539-541, (1968) 27) F.E. King, J.W. Clark-Lewis (in part) and W.F. Forbes J. Chem. Soc. 2948-2956, (1955) 28) D.J. Liillin and R.")
91 67 16) S.B. Gupta, J«Chrosu 56, (1968) 17) M. Hanefeld and K. Herrmann, J. Chrom, , (1976) 18) E. Haslam and J.E. Strangroom, Biochem. J. 99«28-31, (1966) 19) D.E. Hathway, Biochem. J ,(1958) 20) P.J. Hilton, Phvtochem. 11, , (1972) 21) P.J. Hilton, Quarterly Hewsletter Ho. 37, 3, (1975) 22) P.J. Hilton and E.T. Ellis, J. Sci. Agric. 23, , (1972) 23) P.J. Hilton, Palmer-Jones and R.T. Ellis, J. Sci. Pdo A.^ric. 24% , (1973) 24) P.J. Hilton and Palmer-Jones, J. Sci, Fdo Agric , (1975) 25) K. Iwasa, Jaoan Agricultural Research Quarterly, 9, No. 3, , (1975) 26) K.M. Johnston, D.J. Sterm and A.C. Waiss-Jr., J. Chromo 35« , (1968) 27) F.E. King, J.W. Clark-Lewis (in part) and W.F. Forbes J. Chem. Soc , (1955) 28) D.J. Liillin and R.W. Rustridge, Process Biochemistry. June (1967) 29) M. Llyers, E.A.H. Roberts and R.W. Rustridge Chem. and Ind., 25, (1959)
 33) Vo Nicholson, M. Nierenstein, J.C. Pool and H*V. Price, Biochem. J. * 25. 7 52. (1931) 34) C.Ko Njuguna, (Personal communication 1977) 35) C.G.")
 37) S.A.H* Roberts, in T.A. Geissman (Ed) $ ' Chemistry of Flavonoid Compounds\" 468-512, Perganon, London, (1962) 38) D.G. Roux and A*S* Laihs, J* Chron, 4* (i960) 39) G.")
92 I 68 i 30) Mo Nakagawa, Japan Agricultural Research Quarterly. 5. Ho. 3, (197 ) % 31) M. Hakagawa, Japan Agricultural Research Quarterly. 9. Ho. 3, , (1975) 32) U. Kakagawa and H. Torii, Agricultural Biol0 Chen. 28, , (1964) 33) Vo Nicholson, M. Nierenstein, J.C. Pool and H*V. Price, Biochem. J. * (1931) 34) C.Ko Njuguna, (Personal communication 1977) 35) C.G. Nordstrom and D. Swain, (1952), "Thin Layer Chromatography," "2. Stahl (3d)," Springer-Verlag, (1969) 36) A.R. Pierce, H.N. Graham, S, Glassner, H. Madlin and J.G, Gonzalez, Anal* Chenu 41 > , (19^9) 37) S.A.H* Roberts, in T.A. Geissman (Ed) $ ' Chemistry of Flavonoid Compounds" , Perganon, London, (1962) 38) D.G. Roux and A*S* Laihs, J* Chron, 4* (i960) 39) G..Y, Sanderson, Recent Advances in Phytochemistry V p I. 5* , (1972) 40) S«K. Sarkar and R.E* Eowarth, J* Agric. Fd. Chen* 24» , (1976) 41) G.V. Stagg and D. Swain, Phytochem*, 10* , (1971) 42) E. Stahl and P.J. S chom, Z-*Physiol.Chem* 325> 263, (1961) 43) J.A.H. Tolhurst and LLJ* Green, "Fertilizer for 2.A. Tea", T.R.I.E.A. pamphlet Ho* 23/73> C1973) 44) C.K. Wilkins, J. Chron* 27 > , (1973) 45) C.K* Wilkins, J. de 3ruijn, 0. Korver, O.J., Frost and K. Weinges, J. Sci. Fd. A-ric , (1971^


93 BIBLIOGRAPHY T. Eden; "Tea" Longman London 1965 L* Parkas, M* Gabor, F* Kallay, "Topics in Plavonoids Chemistry Symposium" 1973* Elsevier Scientific Publishing Company Amsterdam T*A* Geissman "The Chemistry of the Plavonoid Compounds" Pergamon Press, London, 1962 J*B* Har b o m e, "Biochemistry of phenolic compounds" Academic press, London and N*Y J.B. H a rbome, "Comparative Biochemistry of the flavonoids". Academic press, London, 1967 J*B* Harbome, T*J. iiabry and H* Llabry "The Plavonoids" Chapman and Hall, London, 1975 M* Nierenstein; "Natural Organic Tannins" J and A* Churchil Ltd*, 1934 W*D. Ollis; "Recent Developments in the Chemistry of Natural phenolic compounds", Pergamon press, 1961 P. Riberean - Gayon "Plant Phenolics" Oliver and Boyd, 1972 E* Stahl; "Thin layer chromatography" Spring er-verlag 1969 J. V/erkhoven (Ed*) "Tea processing" PAO Agric. Service Bulletin No* 26, 1974 "The Chemistry of vegetable tannins"* A symposium 1956 Geo*.Marshall and Co* Ltd*, London


94 70 ACKm7L5DG i3nts I am very grateful to the Director of the TRIEA for making the necessary arrangements for me to undertake this study, and to the Governing Body of the TRIEA for the sponsorship* I am most indebted to all my supervisors for their indispensable guidance, suggestions and encouragements in the course of this work. To Dr. P.K. Aggarwal for his guidance in the early stages of the work. To Dr. C.A. Herbin for his advice in the middle stage of the work and to Drs. C.K. Wilkins of ICIPE and Dr. R.M. LIunavu for their guidance in the final stages. I am also most grateful to Prof. Wandiga and Prof. Robins for their advice and encouragements during my stay in the department. Lly sincere thanks to Prof. Clark-Lewis for supplying the (-) epiafzelechin standard and also to Dr. W.B. Eyton of James Finlay Ltd., for his suggestions and also for supplying some literature. I am most grateful to all my colleagues with the TRIEA for their timely suggestions, advice and encouragements, and also to all those staff who were involved with the arrangement of the leaf samples etc., particularly in the Chemistry and Botany departments of the TRIEA. Finally, I am deeply grateful to my wife for her patience and encouragements and also for the typing of the work,
Analytical Method for Coumaphos (Targeted to agricultural, animal and fishery products)
") Analytical Method for Coumaphos (Targeted to agricultural, animal and fishery products) The target compound to be determined is coumaphos. 1. Instruments Gas chromatograph-flame thermionic detector (GC-FTD)
Analytical Method for Coumaphos (Targeted to agricultural, animal and fishery products) The target compound to be determined is coumaphos. 1. Instruments Gas chromatograph-flame thermionic detector (GC-FTD)
Experiment 6 Thin-Layer Chromatography (TLC)
") Experiment 6 Thin-Layer Chromatography (TLC) OUTCOMES After completing this experiment, the student should be able to: explain basic principles of chromatography in general. describe important aspects
Experiment 6 Thin-Layer Chromatography (TLC) OUTCOMES After completing this experiment, the student should be able to: explain basic principles of chromatography in general. describe important aspects
CHEM Experiment 4 Introduction to Separation Techniques I. Objectives
 1 CHEM 0011 Experiment 4 Introduction to Separation Techniques I Objectives 1. To learn the gravity filtration technique 2. To learn the suction filtration technique 3. To learn about solvent extraction
Separations. Objective. Background. Date Lab Time Name
 Objective Separations Techniques of separating mixtures will be illustrated using chromatographic methods. The natural pigments found in spinach leaves, β-carotene and chlorophyll, will be separated using
EFFECT OF TOMATO GENETIC VARIATION ON LYE PEELING EFFICACY TOMATO SOLUTIONS JIM AND ADAM DICK SUMMARY
 EFFECT OF TOMATO GENETIC VARIATION ON LYE PEELING EFFICACY TOMATO SOLUTIONS JIM AND ADAM DICK 2013 SUMMARY Several breeding lines and hybrids were peeled in an 18% lye solution using an exposure time of
RESOLUTION OIV-OENO ANALYSIS OF VOLATILE COMPOUNDS IN WINES BY GAS CHROMATOGRAPHY
 RESOLUTION OIV-OENO 553-2016 ANALYSIS OF VOLATILE COMPOUNDS IN WINES BY GAS CHROMATOGRAPHY THE GENERAL ASSEMBLY, In view of Article 2, paragraph 2 iv of the Agreement of 3 April 2001 establishing the International
EXTRACTION. Extraction is a very common laboratory procedure used when isolating or purifying a product.
 EXTRACTION Extraction is a very common laboratory procedure used when isolating or purifying a product. Extraction is the drawing or pulling out of something from something else. By far the most universal
Student Handout Procedure
 Student Handout Procedure Lab period 1: Reaction: Measure 0.75 g of solid cinnamic acid and 25 ml of your unknown alcohol in a 100 ml round bottom flask. Add a stir bar and stir solution until it is completely
10. THE ROLE OF PLANT GROWTH REGULATORS IN THE DEVELOPMENT, GROWTH AND MATURATION OF THE FRUIT
 The Division of Subtropical Agriculture. The Volcani Institute of Agricultural Research 1960-1969. Section B. Avocado. Pg 77-83. 10. THE ROLE OF PLANT GROWTH REGULATORS IN THE DEVELOPMENT, GROWTH AND MATURATION
3. Aspirin Analysis. Prelaboratory Assignment. 3.1 Introduction
 In this experiment, you will analyze the purity of your crude and recrystallized aspirin products using a method called thin layer chromatography (TLC). You will also determine the percent yield of your
C27 Chromatography. Collect: Column Mortar and pestle Dropper (229 mm) Capillary tube TLC plate Aluminum foil UV light
 Capillary tube TLC plate Aluminum foil UV light") C27 Chromatography (2017/04/24) Collect: Column Mortar and pestle Dropper (229 mm) Capillary tube TLC plate Aluminum foil UV light Prepare: Green leaves Beaker (30 100 ml) Erlenmeyer flask (50, 125 ml)
C27 Chromatography (2017/04/24) Collect: Column Mortar and pestle Dropper (229 mm) Capillary tube TLC plate Aluminum foil UV light Prepare: Green leaves Beaker (30 100 ml) Erlenmeyer flask (50, 125 ml)
Practical 1 - Determination of Quinine in Tonic Water
 Practical 1 - Determination of Quinine in Tonic Water Introduction Quinine has a fluorescence and a UV absorbance and so can be quantified using either of these. In the method described here the absorbances
CORRELATIONS BETWEEN CUTICLE WAX AND OIL IN AVOCADOS
 California Avocado Society 1966 Yearbook 50: 121-127 CORRELATIONS BETWEEN CUTICLE WAX AND OIL IN AVOCADOS Louis C. Erickson and Gerald G. Porter Cuticle wax, or bloom, is the waxy material which may be
CHAPTER 4 ISOLATION OF ANTIFUNGAL COMPOUNDS FROM C. dentata (Burm.f) C.A. Sm.
 C.A. Sm.") CHAPTER 4 ISOLATION OF ANTIFUNGAL COMPOUNDS FROM C. dentata (Burm.f) C.A. Sm. 4.1. INTRODUCTION 4.1.1. Compounds isolated from Cornaceae family Reports concerning isolation of compounds from Curtisia dentata
CHAPTER 4 ISOLATION OF ANTIFUNGAL COMPOUNDS FROM C. dentata (Burm.f) C.A. Sm. 4.1. INTRODUCTION 4.1.1. Compounds isolated from Cornaceae family Reports concerning isolation of compounds from Curtisia dentata
EXTRACTION PROCEDURE
 SPE Application Note for Multiresidue Exraction and Clean Up from Fruit and Vegetables This note outlines solid phase extraction (SPE) methodology for the multiresidue extraction and clean up of fruits
Separating the Components of a Mixture
 Separating the Components of a Mixture Introduction: Mixtures are not unique to chemistry; we encounter them on a daily basis. The food and drinks we consume, the fuel we use in our vehicles, building
THIN LAYER CHROMATOGRAPHY AND MELTING POINT DETERMINATION: DETECTION OF CAFFEINE IN VARIOUS SAMPLES
 EXPERIMENT 8 THIN LAYER CHROMATOGRAPHY AND MELTING POINT DETERMINATION: DETECTION OF CAFFEINE IN VARIOUS SAMPLES Additional Resources http://orgchem.colorado.edu/hndbksupport/tlc/tlc.html http://coffeefaq.com/caffaq.html
Lab 2. Drug Abuse. Solubility and Colligative Properties of Solutions: Coffee, Soda, and Ice Cream
 Lab 2. Drug Abuse. Solubility and Colligative Properties of Solutions: Coffee, Soda, and Ice Cream How do I make a stronger cup of coffee? How do I make ice cream? Prelab Spend 5 minutes doing the following
myclobutanil 987 MYCLOBUTANIL (181)
") myclobutanil 987 MYCLOBUTANIL (181) EXPLANATION Myclobutanil was evaluated in 1992 and. In the JMPR evaluated six field trials on hops conducted in the UK but the four trials which complied with GAP were
myclobutanil 987 MYCLOBUTANIL (181) EXPLANATION Myclobutanil was evaluated in 1992 and. In the JMPR evaluated six field trials on hops conducted in the UK but the four trials which complied with GAP were
Title: Reagents Copy No: ## SOP No.: 3.13/3.1/S Effective Date: July 8, 2013 Location: ### Reagents
 QSM Approval: Reagents 1. Introduction Laboratory reagents are used in all procedural steps during the course of sample preparation. To ensure that reagents are of known quality and purity and free of
Lab 2. Drug Abuse. Solubility and Colligative Properties of Solutions: Coffee, Soda, and Ice Cream
 Lab 2. Drug Abuse. Solubility and Colligative Properties of Solutions: Coffee, Soda, and Ice Cream How do I make a stronger cup of coffee? How do I make ice cream? Prelab Spend 5 minutes doing the following
Wine-Tasting by Numbers: Using Binary Logistic Regression to Reveal the Preferences of Experts
 Wine-Tasting by Numbers: Using Binary Logistic Regression to Reveal the Preferences of Experts When you need to understand situations that seem to defy data analysis, you may be able to use techniques
Coffee Filter Chromatography
 Here is a summary of what you will learn in this section: Solutions can be separated by filtration, paper chromatography, evaporation, or distillation. Mechanical mixtures can be separated by sorting,
CHAPTER 8. Sample Laboratory Experiments
 CHAPTER 8 Sample Laboratory Experiments 8.a Analytical Experiments without an External Reference Standard; Conformational Identification without Quantification. Jake Ginsbach CAUTION: Do not repeat this
The Separation of a Mixture into Pure Substances
 The Separation of a Mixture into Pure Substances The experiment is designed to familiarize you with some standard chemical techniques and to encourage careful work in separating and weighing chemicals.
Solubility Lab Packet
 Solubility Lab Packet **This packet was created using information gathered from the American Chemical Society s Investigation #4: Dissolving Solids, Liquids, and Gases (2007). It is intended to be used
PECTINASE Product Code: P129
 PECTINASE Product Code: P129 Enzyme for sample clarification prior to patulin analysis. For in vitro use only. P129/V1/02.06.16 www.r-biopharm.com Contents Page Test Principle... 3 Kit Components... 3
GAS-CHROMATOGRAPHIC ANALYSIS OF SOME VOLATILE CONGENERS IN DIFFERENT TYPES OF STRONG ALCOHOLIC FRUIT SPIRITS
 GAS-CHROMATOGRAPHIC ANALYSIS OF SOME VOLATILE CONGENERS IN DIFFERENT TYPES OF STRONG ALCOHOLIC FRUIT SPIRITS Vesna Kostik 1*, Shaban Memeti 1, Biljana Bauer 2 1* Institute of Public Health of Republic
Relationship between Mineral Nutrition and Postharvest Fruit Disorders of 'Fuerte' Avocados
 Proc. of Second World Avocado Congress 1992 pp. 395-402 Relationship between Mineral Nutrition and Postharvest Fruit Disorders of 'Fuerte' Avocados S.F. du Plessis and T.J. Koen Citrus and Subtropical
ALBINISM AND ABNORMAL DEVELOPMENT OF AVOCADO SEEDLINGS 1
 California Avocado Society 1956 Yearbook 40: 156-164 ALBINISM AND ABNORMAL DEVELOPMENT OF AVOCADO SEEDLINGS 1 J. M. Wallace and R. J. Drake J. M. Wallace Is Pathologist and R. J. Drake is Principle Laboratory
Application Note: Analysis of Melamine in Milk (updated: 04/17/09) Product: DPX-CX (1 ml or 5 ml) Page 1 of 5 INTRODUCTION
 Product: DPX-CX (1 ml or 5 ml) Page 1 of 5 INTRODUCTION") Page 1 of 5 Application Note: Analysis of Melamine in Milk (updated: 04/17/09) Product: DPX-CX (1 ml or 5 ml) INTRODUCTION There has been great interest recently for detecting melamine in food samples
Page 1 of 5 Application Note: Analysis of Melamine in Milk (updated: 04/17/09) Product: DPX-CX (1 ml or 5 ml) INTRODUCTION There has been great interest recently for detecting melamine in food samples
Distillation Purification of Liquids
 Distillation Purification of Liquids Types of Distillations commonly used in Organic Lab: Simple separates volatile compounds (liquids) from non-volatile compounds (solids) or volatiles with boiling points
Samples: Standard solutions of rutin, quercetina, rosmarinic acid, caffeic acid and gallic acid. Commercial teas: Green, Ceilan, Hornimans and Black.
 Tea is the third most consumed drink in world after water and coffee. It is prepared from plant shoots or leaves from Camellia Sinensis. All the varieties of this drink, available in the market (white,
Determination of the concentration of caffeine, theobromine, and gallic acid in commercial tea samples
 Determination of the concentration of caffeine, theobromine, and gallic acid in commercial tea samples Janna Erickson Department of Chemistry, Concordia College, 901 8 th St S, Moorhead, MN 56562 Abstract
III InTIfir IIII A COMPARATIVE STUDY OF BLACK TEA AND INSTANT TEA TO DEVELOP AN INSTANT TEA TABLE~ WITH RETAINED HEALTH PROMOTING PROPERTIES
 A COMPARATIVE STUDY OF BLACK TEA AND INSTANT TEA TO DEVELOP AN INSTANT TEA TABLE~ WITH RETAINED HEALTH PROMOTING PROPERTIES By PALAMANDADIGE THARANGI SRIYANGlKA RAJAPAKSHA MUDALIGE Thesis submitted to
CHAPTER XI STUDY OF STEROIDAL SAPOGENINS
 CHAPTER XI STUDY OF STEROIDAL SAPOGENINS 1 STUDY OF STEROIDAL SAPOGENINS The present investigation describes the isolation and identification of Steroidal Sapogenins from roots, shoots and fruits of Abutilon
Extraction of Acrylamide from Coffee Using ISOLUTE. SLE+ Prior to LC-MS/MS Analysis
 Application Note AN796 Extraction of Acrylamide from Coffee using ISOLUTE SLE+ Page 1 Extraction of Acrylamide from Coffee Using ISOLUTE SLE+ Prior to LC-MS/MS Analysis This application note describes
Determination Of Saponin And Various Chemical Compounds In Camellia Sinensis And Genus Ilex.
 Determination Of Saponin And Various Chemical Compounds In Camellia Sinensis And Genus Ilex. Sensus Technical Note (SEN-TN-0027) 05/22/2009 ABSTRACT Youngmok Kim, Ph.D. and Daniel J. Wampler, Ph.D. Saponin
Effects of Seedling Age, and Different Levels of N, K and K/N on Quality and Yield of Tomato Grown in Perlite Bag Culture
 Effects of Seedling Age, and Different Levels of N, K and K/N on Quality and Yield of Tomato Grown in Perlite Bag Culture Sureyya ALTINTAS*, Servet VARIS, Ömer KESKIN, İbrahim KURU Namık Kemal University,
Varietal Specific Barrel Profiles
 RESEARCH Varietal Specific Barrel Profiles Beaulieu Vineyard and Sea Smoke Cellars 2006 Pinot Noir Domenica Totty, Beaulieu Vineyard Kris Curran, Sea Smoke Cellars Don Shroerder, Sea Smoke Cellars David
Sequential Separation of Lysozyme, Ovomucin, Ovotransferrin and Ovalbumin from Egg White
 AS 662 ASL R3104 2016 Sequential Separation of Lysozyme, Ovomucin, Ovotransferrin and Ovalbumin from Egg White Sandun Abeyrathne Iowa State University Hyunyong Lee Iowa State University, hdragon@iastate.edu
DEVELOPMENT OF A RAPID METHOD FOR THE ASSESSMENT OF PHENOLIC MATURITY IN BURGUNDY PINOT NOIR
 PINOT NOIR, PAGE 1 DEVELOPMENT OF A RAPID METHOD FOR THE ASSESSMENT OF PHENOLIC MATURITY IN BURGUNDY PINOT NOIR Eric GRANDJEAN, Centre Œnologique de Bourgogne (COEB)* Christine MONAMY, Bureau Interprofessionnel
One class classification based authentication of peanut oils by fatty
 Electronic Supplementary Material (ESI) for RSC Advances. This journal is The Royal Society of Chemistry 2015 One class classification based authentication of peanut oils by fatty acid profiles Liangxiao
Cold Stability Anything But Stable! Eric Wilkes Fosters Wine Estates
 Cold Stability Anything But Stable! Fosters Wine Estates What is Cold Stability? Cold stability refers to a wine s tendency to precipitate solids when held cool. The major precipitates tend to be tartrates
Research - Strawberry Nutrition
 Research - Strawberry Nutrition The Effect of Increased Nitrogen and Potassium Levels within the Sap of Strawberry Leaf Petioles on Overall Yield and Quality of Strawberry Fruit as Affected by Justification:
High Performance Thing Layer Chromatographic (HPTLC) analysis of polyphenolic composition in wine samples
 analysis of polyphenolic composition in wine samples") High Performance Thing Layer Chromatographic (HPTLC) analysis of polyphenolic composition in wine samples 1 A/prof Snezana Agatonovic-Kustrin Dr David W. Morton Chandima Hettiarachchi Common antioxidants
High Performance Thing Layer Chromatographic (HPTLC) analysis of polyphenolic composition in wine samples 1 A/prof Snezana Agatonovic-Kustrin Dr David W. Morton Chandima Hettiarachchi Common antioxidants
An Economic And Simple Purification Procedure For The Large-Scale Production Of Ovotransferrin From Egg White
 An Economic And Simple Purification Procedure For The Large-Scale Production Of Ovotransferrin From Egg White D. U. Ahn, E. J. Lee and A. Pometto Department of Animal Science, Iowa State University, Ames,
PROPOXUR (075) EXPLANATION
 EXPLANATION") 337 PROPOXUR (075) EXPLANATION Propoxur was evaluated by the JMPR in 1973, 1977, 1981, 1983 and 1991. At the 1994 CCPR, several delegations expressed the opinion that the MRLs recommended by the 1991 JMPR
337 PROPOXUR (075) EXPLANATION Propoxur was evaluated by the JMPR in 1973, 1977, 1981, 1983 and 1991. At the 1994 CCPR, several delegations expressed the opinion that the MRLs recommended by the 1991 JMPR
Separation of Ovotransferrin and Ovomucoid from Chicken Egg White
 Animal Industry Report AS 662 ASL R3105 2016 Separation of and from Chicken Egg White Sandun Abeyrathne Iowa State University Hyunyong Lee Iowa State University, hdragon@iastate.edu Dong U. Ahn Iowa State
Organic Chemistry 211 Laboratory Gas Chromatography
 MATERIALS Organic Chemistry 211 Laboratory Gas Chromatography Computer vials of: Logger Pro ethyl acetate Vernier Mini GC butyl acetate Temperature Probe collected fractions from Exp. 5 1 L glass syringe
Journal of Chemical and Pharmaceutical Research, 2017, 9(9): Research Article
: Research Article") Available online www.jocpr.com Journal of Chemical and Pharmaceutical Research, 2017, 9(9):135-139 Research Article ISSN : 0975-7384 CODEN(USA) : JCPRC5 The Identification and Quantitation of Thymol and
Available online www.jocpr.com Journal of Chemical and Pharmaceutical Research, 2017, 9(9):135-139 Research Article ISSN : 0975-7384 CODEN(USA) : JCPRC5 The Identification and Quantitation of Thymol and
1. Blender: Osterizer, 10-speed, or equivalent. 2. Separatory Funnel: Kilborn or equivalent (see figure 1) 2. HCl Solution: HCl/water (7:93 by volume)
 2. HCl Solution: HCl/water (7:93 by volume)") EXTER.01-1 INFESTATION IN WHOLE CORN PRINCIPLE Whole corn is suspended in aqueous borax solution to float insects and insect fragments, which are collected on filter paper for microscopic identification
EXTER.01-1 INFESTATION IN WHOLE CORN PRINCIPLE Whole corn is suspended in aqueous borax solution to float insects and insect fragments, which are collected on filter paper for microscopic identification
15. Extraction: Isolation of Caffeine from Tea
 15. Extraction: Isolation of Caffeine from Tea In this experiment you will isolate a compound from a natural source using two extraction techniques. Such compounds are often referred to as natural products.
Interpretation Guide. Yeast and Mold Count Plate
 Interpretation Guide The 3M Petrifilm Yeast and Mold Count Plate is a sample-ready culture medium system which contains nutrients supplemented with antibiotics, a cold-water-soluble gelling agent, and
Influence of GA 3 Sizing Sprays on Ruby Seedless
 University of California Tulare County Cooperative Extension Influence of GA 3 Sizing Sprays on Ruby Seedless Pub. TB8-97 Introduction: The majority of Ruby Seedless table grapes grown and marketed over
2. Other constituents in the sample solution should not interfere with the precipitation of the component of interest.
 EXPERIMENT 15 Percentage Yield of Lead (II) Iodide in a Gravimetric Analysis INTRODUCTION In a gravimetric analysis, a substance is treated so that the component of interest is separated either in its
Separation of a Mixture
 Separation of a Mixture The isolation of pure components of a mixture requires the separation of one component from another. Chemists have developed techniques for doing this. These methods take advantage
THE EFFECT OF ETHYLENE UPON RIPENING AND RESPIRATORY RATE OF AVOCADO FRUIT
 California Avocado Society 1966 Yearbook 50: 128-133 THE EFFECT OF ETHYLENE UPON RIPENING AND RESPIRATORY RATE OF AVOCADO FRUIT Irving L. Eaks University of California, Riverside Avocado fruits will not
Determination of Alcohol Content of Wine by Distillation followed by Density Determination by Hydrometry
 Sirromet Wines Pty Ltd 850-938 Mount Cotton Rd Mount Cotton Queensland Australia 4165 www.sirromet.com Courtesy of Jessica Ferguson Assistant Winemaker & Chemist Downloaded from seniorchem.com/eei.html
D Lemmer and FJ Kruger
 D Lemmer and FJ Kruger Lowveld Postharvest Services, PO Box 4001, Nelspruit 1200, SOUTH AFRICA E-mail: fjkruger58@gmail.com ABSTRACT This project aims to develop suitable storage and ripening regimes for
FRUIT GROWTH IN THE ORIENTAL PERSIMMON
 California Avocado Society 1960 Yearbook 44: 130-133 FRUIT GROWTH IN THE ORIENTAL PERSIMMON C. A. Schroeder Associated Professor of Subtropical Horticulture, University of California at Los Angeles. The
EXPERIMENT NO. 3 HYDROMETER ANALYSIS ASTM D-422
 EXPERIMENT NO. 3 HYDROMETER ANALYSIS ASTM D-422 1. AIM To determine grain size distribution of soil, which contains appreciable quantity of soil passing ASTM 200 sieve ( 0.075 mm). 2. APPARATUS: Standard
Morphological Characteristics of Greek Saffron Stigmas from Kozani Region
 Morphological Characteristics of Greek Saffron Stigmas from Kozani Region Theodora Mitsopoulou and Maria Z. Tsimidou Aristotle University of Thessaloniki, School of Chemistry Laboratory of Food Science
FACTORS DETERMINING UNITED STATES IMPORTS OF COFFEE
 12 November 1953 FACTORS DETERMINING UNITED STATES IMPORTS OF COFFEE The present paper is the first in a series which will offer analyses of the factors that account for the imports into the United States
Determination of Pesticides in Coffee with QuEChERS Extraction and Silica Gel SPE Cleanup
 Determination of Pesticides in Coffee with QuEChERS Extraction and Silica Gel SPE Cleanup UCT Part Numbers ECMSSC50CT-MP 50-mL centrifuge tube and Mylar pouch containing 4000 mg MgSO4 and 1000 mg NaCl
WINE GRAPE TRIAL REPORT
 WINE GRAPE TRIAL REPORT Stellenbosch, Western Cape Louisvale 2008/09 season Introduction A trial was conducted in the Stellenbosch area on an older wine grape vineyard to determine whether AnnGro alone,
COMPARISON OF CORE AND PEEL SAMPLING METHODS FOR DRY MATTER MEASUREMENT IN HASS AVOCADO FRUIT
 New Zealand Avocado Growers' Association Annual Research Report 2004. 4:36 46. COMPARISON OF CORE AND PEEL SAMPLING METHODS FOR DRY MATTER MEASUREMENT IN HASS AVOCADO FRUIT J. MANDEMAKER H. A. PAK T. A.
NomaSense PolyScan. Analysisof oxidizable compounds in grapes and wines
 NomaSense PolyScan Analysisof oxidizable compounds in grapes and wines Oxidizablecompounds GSH SO 2 Reaction with volatile sulfur compounds Reaction with amino acids Loss of varietal thiols Modulation
Comparative determination of glycosides in senna by using different methods of extraction (Soxhlet, maceration and ultrasonic bath)
") 1 Experiment 1, 2 and 3 Comparative determination of glycosides in senna by using different methods of extraction (Soxhlet, maceration and ultrasonic bath) Aim: determine the yield among different extraction
1 Experiment 1, 2 and 3 Comparative determination of glycosides in senna by using different methods of extraction (Soxhlet, maceration and ultrasonic bath) Aim: determine the yield among different extraction
Separating the Components of a Mixture
 Separating the Components of a Mixture Introduction Many naturally occurring substances occur as mixtures rather than pure substances. There are two main types of mixtures, homogeneous and heterogeneous.
INFLUENCE OF ENVIRONMENT - Wine evaporation from barrels By Richard M. Blazer, Enologist Sterling Vineyards Calistoga, CA
 INFLUENCE OF ENVIRONMENT - Wine evaporation from barrels By Richard M. Blazer, Enologist Sterling Vineyards Calistoga, CA Sterling Vineyards stores barrels of wine in both an air-conditioned, unheated,
EXPERIMENT #3: Extraction and Drying Agents: Extraction of Caffeine from Tea
 EXPERIMENT #3: Extraction and Drying Agents: Extraction of Caffeine from Tea Chem 241, Lab Section In this experiment we will extract caffeine from tea leaves while learning several new laboratory techniques,
TSKgel TECHNICAL INFORMATION SHEET No. 131
 TSKgel TECNICAL INFORMATION SEET No. Analysis of Synthetic Sweeteners in Coffee by PLC Synthetic sweeteners are used in many foods because they have fewer calories than sugar. Acesulfame potassium (Acesulfame-K),
MILK ADULTERATION. By, Gautami Shirsat Grisha Dialani Sushmita Suman
 MILK ADULTERATION By, Gautami Shirsat Grisha Dialani Sushmita Suman CONSUMER SURVEY Average consumption per day 1 lit. Type of consumption Directly as milk or in tea Mostly preferred Buffalo Milk Consumers
Separating the Components of a Mixture
 Separating the Components of a Mixture Introduction Many naturally occurring substances occur as mixtures rather than pure substances. There are two main types of mixtures, homogeneous and heterogeneous.
IT S TOO EASY TO JUST SAY. hot water and tea leaves are the only ingredients allowed BREWED TEA!
 IT S T EASY T JUST SAY hot water and tea leaves are the only ingredients allowed BREWED TEA! Since 1988, when the first ice-tea drink bottled in PET in Europe was formulated in the R&D Laboratory at L
LAB: One Tube Reaction Part 1
 AP Chemistry LAB: One Tube Reaction Part 1 Objective: To monitor and document the chemical changes occurring in a single test tube containing a predetermined mixture of chemicals. Materials: test tube,
Detecting Melamine Adulteration in Milk Powder
 Detecting Melamine Adulteration in Milk Powder Introduction Food adulteration is at the top of the list when it comes to food safety concerns, especially following recent incidents, such as the 2008 Chinese
Properties of Water Lab: What Makes Water Special? An Investigation of the Liquid That Makes All Life Possible: Water!
 Properties of Water Lab: What Makes Water Special? An Investigation of the Liquid That Makes All Life Possible: Water! Background: Water has some peculiar properties, but because it is the most common
S. Kavish 1, W. S. Botheju 2, C. S. De Silva 1* 1 Department of Agricultural and Plantation Engineering, The Open. Abstract
 OUSL Journal (2016) Vol. 10, (pp. 73-92) Impact of Inlet Drying Temperature in Endless Chain Pressure Dryers on the Quality Characteristics of Leafy Type of Tea Produced Using Different Leaf Standards
CODEX STANDARD FOR QUICK FROZEN STRAWBERRIES 1 CODEX STAN
 CODEX STAN 52 Page 1 of 6 CODEX STANDARD FOR QUICK FROZEN STRAWBERRIES 1 CODEX STAN 52-1981 1. SCOPE This standard shall apply to quick frozen strawberries (excluding quick frozen strawberry puree) of
Production, Optimization and Characterization of Wine from Pineapple (Ananas comosus Linn.)
") Production, Optimization and Characterization of Wine from Pineapple (Ananas comosus Linn.) S.RAJKUMAR IMMANUEL ASSOCIATE PROFESSOR DEPARTMENT OF BOTANY THE AMERICAN COLLEGE MADURAI 625002(TN) INDIA WINE
Production, Optimization and Characterization of Wine from Pineapple (Ananas comosus Linn.) S.RAJKUMAR IMMANUEL ASSOCIATE PROFESSOR DEPARTMENT OF BOTANY THE AMERICAN COLLEGE MADURAI 625002(TN) INDIA WINE
Lab 2: Phase transitions & ice cream
 Lab 2: Phase transitions & ice cream Lab sections on Tuesday Sept 18 Friday Sept 21 In this lab you will observe how changing two parameters, pressure and salt concentration, affects the two phase transitions
Chemical Components and Taste of Green Tea
 Chemical Components and Taste of Green Tea By MUNEYUKI NAKAGAWA Tea Technology Division, National Research Institute of Tea It has been said that green tea contains various kinds of chemical substances
COMMISSION DIRECTIVE 2009/122/EC
 L 242/14 Official Journal of the European Union 15.9.2009 COMMISSION DIRECTIVE 2009/122/EC of 14 September 2009 amending, for the purposes of its adaptation to technical progress, Annex II to Directive
Notes on the Philadelphia Fed s Real-Time Data Set for Macroeconomists (RTDSM) Capacity Utilization. Last Updated: December 21, 2016
 Capacity Utilization. Last Updated: December 21, 2016") 1 Notes on the Philadelphia Fed s Real-Time Data Set for Macroeconomists (RTDSM) Capacity Utilization Last Updated: December 21, 2016 I. General Comments This file provides documentation for the Philadelphia
1 Notes on the Philadelphia Fed s Real-Time Data Set for Macroeconomists (RTDSM) Capacity Utilization Last Updated: December 21, 2016 I. General Comments This file provides documentation for the Philadelphia
MATERIALS AND METHODS
 to yields of various sieved fractions and mean particle sizes (MPSs) from a micro hammer-cutter mill equipped with 2-mm and 6-mm screens (grinding time of this mill reported by other investigators was
This document is a preview generated by EVS
 TECHNICAL REPORT ISO/TR 12591 First edition 2013-12-15 White tea Definition Thé blanc Définition Reference number ISO 2013 COPYRIGHT PROTECTED DOCUMENT ISO 2013 All rights reserved. Unless otherwise specified,
Determination of Caffeine in Coffee Products According to DIN 20481
 Deteration of Caffeine in Coffee Products According to DI 81 Application ote Food Testing & Agriculture Food Authenticity Author Edgar aegele Agilent Technologies, Inc. Waldbronn, Germany Abstract This
COMMISSION OF THE EUROPEAN COMMUNITIES. Draft COMMISSION DIRECTIVE../ /EC
 EN EN EN COMMISSION OF THE EUROPEAN COMMUNITIES Brussels, C(2008) XXX final Draft COMMISSION DIRECTIVE../ /EC of [ ] amending, for the purposes of its adaptation to technical progress, Annex II to Directive
7. LOCALIZATION OF FRUIT ON THE TREE, BRANCH GIRDLING AND FRUIT THINNING
 The Division of Subtropical Agriculture. The Volcani Institute of Agricultural Research 1960-1969. Section B. Avocado. Pg 60-68. 7. LOCALIZATION OF FRUIT ON THE TREE, BRANCH GIRDLING AND FRUIT THINNING
EXTRACTION OF SEDIMENTS FOR AROMATIC AND CHLORINATED HYDROCARBONS
 EXTRACTION OF SEDIMENTS FOR AROMATIC AND CHLORINATED HYDROCARBONS Juan. A. Ramirez, Bo Wang, Donell S. Frank, Thomas. J. McDonald, Rebecca Price, Susanne J. McDonald and James M. Brooks TDI-Brooks International./B&B
The Column Oven Oven capabilities Oven safety Configuring the oven Making a temperature-programmed run Fast chromatography
 4 The Column Oven Oven capabilities Oven safety Configuring the oven Procedure: Setting up an isothermal run Making a temperature-programmed run Oven temperature programming setpoints Oven ramp rates Procedure:
A COMPARATIVE STUDY OF THE CAFFEINE PROFILE OF MATURE TEA LEAVES AND PROCESSED TEA MARKETED IN SONITPUR DISTRICT OF ASSAM, INDIA.
 Volume-5, Issue-4, Oct-Dec-2015 Coden: IJPAJX-CAS-USA, Copyrights@2015 ISSN-2231-4490 Received: 10 th Aug-2015 Revised: 27 th Aug-2015 Accepted: 4 th Sept-2015 Research article A COMPARATIVE STUDY OF THE
Cambridge International Examinations Cambridge International General Certificate of Secondary Education
 Cambridge International Examinations Cambridge International General Certificate of Secondary Education *1219785243* BIOLOGY 06/62 Paper 6 Alternative to Practical October/November 15 1 hour Candidates
Mixtures and Solutions Stations Lesson Plan by Clara Welch Based on FOSS & Kitchen Chemistry by John Bath, Ph. D. and Sally Mayberry, Ed. D.
 Mixtures and Solutions Stations Lesson Plan by Clara Welch Based on FOSS & Kitchen Chemistry by John Bath, Ph. D. and Sally Mayberry, Ed. D. Overview: This lesson is a group of activities that may be used
2,4-D (020) The 2001 Meeting received information on GAP and supervised residue trials for the postharvest use of 2,4-D on lemons and oranges.
 The 2001 Meeting received information on GAP and supervised residue trials for the postharvest use of 2,4-D on lemons and oranges.") 91 2,4-D (2) EXPLANATION 2,4-D was evaluated for residues within the CCPR Periodic Review Programme by the JMPR in 1998. The Meeting recommended numerous MRLs including an MRL of.1 mg/kg for grapefruit
91 2,4-D (2) EXPLANATION 2,4-D was evaluated for residues within the CCPR Periodic Review Programme by the JMPR in 1998. The Meeting recommended numerous MRLs including an MRL of.1 mg/kg for grapefruit
Alcoholic Fermentation in Yeast A Bioengineering Design Challenge 1
 Alcoholic Fermentation in Yeast A Bioengineering Design Challenge 1 I. Introduction Yeasts are single cell fungi. People use yeast to make bread, wine and beer. For your experiment, you will use the little
THE MANIFOLD EFFECTS OF GENES AFFECTING FRUIT SIZE AND VEGETATIVE GROWTH IN THE RASPBERRY
 THE MANIFOLD EFFECTS OF GENES AFFECTING FRUIT SIZE AND VEGETATIVE GROWTH IN THE RASPBERRY II. GENE I2 BY D. L. JENNINGS Scottish Horticultural Research Institute, Dundee {Received 16 September 1965)...