APPLICATION OF GEOMATICS TECHNOLOGIES TO CHARACTERIZE SPATIAL VARIABILITY AT STRATUS VINEYARDS. Victoria Tasker,( \
|
|
|
- Jonah Boyd
- 6 years ago
- Views:
Transcription
1 APPLICATION OF GEOMATICS TECHNOLOGIES TO CHARACTERIZE SPATIAL VARIABILITY AT STRATUS VINEYARDS by Victoria Tasker,( \ A thesis submitted in partial fulfillment of the requirements for the degree Master of Arts MA Program in Geography BROCK UNIVERSITY ' St. Catharines, Ontario August 2011 Victoria Tasker, 2011
2 ii Abstract Vineyards vary over space and time, making geomatics technologies ideally suited to study terroir. This study applied geomatics technologies - GPS, remote sensing and GIS - to characterize the spatial variability at Stratus Vineyards in the Niagara Region. The concept of spatial terroir was used to visualize, monitor and analyze the spatial and temporal variability of variables that influence grape quality. Spatial interpolation and spatial autocorrelation were used to measure the pattern demonstrated by soil moisture,," leaf water potential, vine vigour, soil composition and grape composition on two Cabernet Franc blocks and one Chardonnay block. All variables demonstrated some spatial variability within and between the vineyard block and over time. Soil moisture exhibited the most significant spatial clustering and was temporally stable. Geomatics technologies provided valuable spatial information related to the natural spatial variability at Stratus Vineyards and can be used to inform and influence vineyard management decisions.
3 iii Acknowledgements This thesis is the result of many hours of hard work and a support network that is second to none. This research would not be possible without the financial contribution of the Ontario Centres of Excellence (OCE) Centre for Earth and Environmental Technologies (CEET), provided through Dr. Jollineau's research grant. My biggest thank you goes to my supervisor - Dr. Marilyne Jollineau. You are a dedicated, passionate and inspiring mentor. Your commitment to this project, thoroughness of review and endless advice has made my graduate experience amazing and inspired me to pursue further graduate education. In addition, thank you to the committee members, Dr. Chris Fullerton and Dr. J Andy Reynolds, for making yourselves available to discuss thesis-related issues, providing timely feedback and sharing your related experiences. Dr. Reynolds equipment and viticulture research lab were also instrumental in ensuring accurate and precise data collection. In addition to the committee, I am indebted to so many people who have collectively contributed to the success of this study. Thank you to Dr. Ralph Brown who provided the aerial imagery and soil samples for this project. Thank you to fellow CCOVI graduate students, Matthieu Marciniak and David Ledderhof, for being my vineyard gurus and making long vineyard hours efficient and entertaining. Also, many interns and research assistants contributed to the success ofthis study; most notably: Tieg LaPointe, Darren Plakatis,!revor Clark '!lld Sarah Muir. I am incredibly grateful to the entire Department of Geography at Brock University for providing a supportive and happy learning environment. In particular, I would like to thank Dr. David Butz, the graduate program director, who time and time again went far above his responsibilities as program director to listen, provide advice and unending support to me and all of the other graduate students. Virginia Wagg, the department superstar (also known as the administrative coordinator), has also been instrumental in my success at Brock. Thank you, Virg! Thank you to Loris Gasparotto, the departmental Cartographer, and Dimitre lankoulov, the departmental computer technician, for your cartographic and technical expertise. Also, a very special thank you
4 iv to Dr. Tony Shaw, who provided expert advice as it relates to geography and viticulture. Much of my success is a result of the opportunities, support and teaching provided by Colleen Beard and Sharon Janzen from the Brock University Map Library. The experience working at the Map Library instilled lifelong stills and a passion for GIS! Thank you to my fellow graduate students for providing a great working environment, especially Katie Hemsworth, my lifelong conference buddy and Jesse Barber, my always entertaining distracter. Last, but definitely not least, I would like to extend my heartfelt thanks to my family. The Tasker, Fast and Powell families combine to make the best family and support network that I could ever want or need. I'd like to especially thank my Poppa who always knew geomatics was right for me! And finally - to my husband - who is \ very supportive of my education. Thank you!
5 v Table of Contents Abstract... ii Acknowledgements... iii List of Figures... vii List of Tables... viii List of Appendices... ix Chapter 1 Introduction Background Geospatial Infonnation and Geomatics Technology Precision Viticulture versus Spatial Terroir The Importance of Studying Spatial Terroir in the Niagara Wine Region Research Questions and Thesis Outline... {... 8 Chapter 2 Literature Review: The Use of Geomatics Technologies in Viticulture Introduction Precision Agriculture Precision Viticulture Environmental Sustainability in Viticulture Vineyard Variability Applications Site Selection Vineyard Design Within-vineyard Management The Concept of Spatial Terroir Place GPS - Visualize Remote Sensing 7" Monitor... :~ GIS -Analyze... : Geospatial Analysis Integrate - Manage Conclusion Chapter 3 Characterizing Spatial Terroir at Stratus Vineyards Introduction Place - Stratus Vineyards SaIIlpling Strategy GPS - Visualize Remote Sensing - Monitor Field Data... 39
6 VI Vineyard Variables Grape Composition Variables Remotely Sensed Data GIS - Analysis Descriptive Statistical Analysis Spatial Statistical Analysis Spatial Interpolation Spatial Autocorrelation Chapter Summary Chapter 4 Results and Discussion of Characterizing Spatial Terroir at Stratus Introduction Analysis of Spatial Terroir at Stratus Vineyards Soil Moisture Leaf Water Potential ('JI)...( Vine Vigour... :' Soil Composition Grape Composition Importance of the Pattern in Vineyard and Grape Composition Variables Limitations of Data Collected Influence on Vineyard Decisions Integration of Spatial Terroir at Stratus Vineyards Limitations to Integration Chapter Conclusion Chapter 5 Conclusions Introduction Suggestions for Further Study Moving Forward Reference List Appendices... 85
7 List of Figures vii Figure 1.1: The interaction of terroir... 2 Figure 1.2: Satellite image illustrating spatial variability at Stratus Vineyards and surrounding area, Niagara-on-the-Lake, Ontario. This image was acquired from SPOT 5 on July 22, Figure 2.1: Niagara's unique agricultural land Figure 2.2: Spatial terroir conceptual diagram Figure 2.3: Effectively presenting complex spatial data Figure 3.1: Spatial terroir diagram for Stratus Vineyards Figure 3.2: A photo taken in the vineyard at Stratus, illustrating that the vineyard looks flats and that the effects ofthe topography are not obvious Figure 3.3: Map of vineyard blocks at Stratus Vineyards Figure 3.4: Flags used to mark sample vines; orange flag (left), orange and blue flag (right)... f Figure 3.5: SPOT-5 satellite image (left) with a 10 metre spatial resolution acquired on July 22 nd, 2007 and airborne image (right) with a 40 cm spatial resolution acquired on August 21 st, Both images show the northern portion of the CH 1 block at Stratus Vineyards with the sample vines overlaid Figure 3.6: Comparison between the IDW (left) and Kriging (right) interpolation techniques for soil moisture on September 19 th,
8 viii List of Tables Table 3.1: Description of Vineyard Block Characteristics Table 3.2: Instruments Used to Collect the Field and Grape Composition Data Table 3.3: Remotely Sensed Imagery and Field Data Collection Dates Table 3.4: Inventory of Geospatial Data Collected for Stratus Vineyards Table 4.1: Monthly Rainfall Averages in 2008,2009 and
9 ix List of Appendices Appendix A: The Sampling Strategy Used Appendix B: Digital Elevation Model, Road and River Networks at Stratus Vineyards and the Surrounding Environment Appendix C: Descriptive Statistics for 2008 and 2009 Soil Moisture Data Appendix D: Proportional Symbol Map for Soil Moisture Values from September 19, Appendix E: CF1 Soil Moisture for 2008 and Appendix F: CF2 Soil Moisture for 2008 and Appendix G: CHI Soil Moisture for 2008 and Appendix H: Moran's I for 2008 and 2009 Soil Moisture Data...; Appendix I: Local Moran's Ii for CF1 and CF2 on August 22,2008 and August 31,2009 for Soil Moisture... ~ : Appendix J: Descriptive Statistics for Absolute Leaf Water Potential from 2008 and Appendix K: Average of Leaf Water Potential Values for 2008 and Appendix L: Moran's I for 2008 and 2009 Leaf Water Potential Appendix M: NDVI of Stratus Vineyards on August 31, Appendix N: Comparison ofndvi of CHI from 2008 and Appendix 0: Soil Composition at Stratus and Surrounding Environment Appendix P: Sand, Silt and Clay Distribution at Stratus Appendix Q: Descriptive Statistics for 2008 and 2009 Grape Composition Appendix R: CF1 Grape Composition for 2008 and Appendix S: CF2 Grape Composition for 2008 and Appendix T: CHI Grape Composition for 2008 and Appendix U: Moran's I for 2008 and 2009 Grape Composition Data
10 1 Chapter 1 Introduction 1.1 Background The upsurge of geospatial information in society, from global positioning systems (GPS) for navigation to ever expanding on-line mapping tools, is revolutionizing how people interact with the natural and built environment. For example, when Google Maps and Google Earth were initially introduced, our ability to see the world and understand the places in it grew exponentially. When MLS (Multiple Listing Service for real estate) introduced a spatially-based application for listing homes, the functionality ofthe site from ~pser point of view was greatly improved. Along with the powerful visualization capabilities 0-[ geomatics technologies through maps and imagery, such as the examples above, geospatial information can influence the decisions we make. For example, personal navigation GPS units do not only help people visualize their way home; they help millions of people make more informed driving decisions on a daily basis. Spatial information is changing how we live and interact in the world and those benefits are extending further every day. The benefits of geomatics technologies have influenced the viticulture community, allowing vineyard managers to make more informed decisions based on spatial information. In the last decade, viticulture and geospatial studies propagated, with new studies building off of the knowledge acquired from the previous studies. The main purpose of this research study is to provide a better understanding of the use of geomatics technologies and derived geospatial informatio~ for improved.yineyard management in the Niagara Region. This research study was rooted in two key industry accepted assumptions. First, vineyards are inherently variable (Bramley, 2006; Proffitt, Bramley, Lamb and Winter, 2006; Smart and Robinson, 1991). Variability exists between viticulture regions, vineyards and even vineyard blocks (Proffitt et ai., 2006). Second, many viticulture experts also believe that great wines start in the vineyard (Sommers, 2008; Baldy, 1995; Smart and Robinson, 1991). Thus, the strong connection between grapes in the vineyard and the wines they produce makes the inherent vineyard variability useful information for vineyard managers, winemakers and other vineyard decision-makers (Baldy, 1995). However, understanding the variability in vineyards is challenging because there are many factors that contribute to grape characteristics and incredibly

.")

11 2 complex connections exist between those factors (Vaudour, 2002). The complex connections that influence grape characteristics and subsequent quality in the grape growing environment are known as terroir. Terroir is the term used to refer to the interaction of climate, microclimate, local topography (i.e., slope, aspect and elevation), geology, soil, vineyard planting, choice of grape variety and management practice (Sommers, 2008; Reynolds, Senchuk, van der Reest and de Savigny, 2007; Jones, Snead and Nelson, 2006). The interaction of climate, topography, soil and geology create terroir that is unique for every vineyard (Figure 1.1). Although terroir is more easily understood through the physical variables of the landscape, it has social and economic dimensions as well. Good terroir is only possible when ideal physical conditions are coupled with socio-economic conditions that are geared to quality-oriented grape production (Van Leeuwen and Seguin, 2006). This includes relying on ma~agement techniques that have been tested and perfected over time, including keeping diligent records of all vineyard activities - such as spray schedules, leaf pulling, weather records, and crop and harvest details - to better understand how to manipulate grape quality based on the unique terroir (Bramley, 2005; Collings, 2003). Terroir has a substantial effect on grape quality but its natural variability and the complexity of interaction between the components that comprise terroir make it difficult to study. Rain ~=::J Climate Temperature Micro-climate Elevation _._ Topography Slope Aspect Drainage ~.. Soil Composition Depth I":":':::' ~% ~.. r.::.f.-.{~~q I Geology ~~:eral Parent material Image adapted from: Sommers, 2008; Van Leeuwen and Seguin, 2006; Vaudour, 2002 Figure 1.1: The interaction of terroir.
12 1.2 Geospatial Information and Geomatics Technology 3 Geospatial information is proving to be useful in understanding the natural spatial variability of the terroir. Geospatial information, acquired through geomatics technologies, has the capability of providing valuable vineyard information that makes it possible to manage vineyards more precisely than ever before (Proffitt et al., 2006; Lamb and Bramley, 2001; Morris, 2001). Geomatics technologies include GPS, remote sensing and geographic information systems (GIS). These technologies are rooted in capturing, storing, using and managing spatially referenced or georeferenced data; that is, data identified according to their location. GPS is a satellite-based navigation system that can acquire precise and accurate positional information (x, y and z) about vineyard features. Remote sensing, on the other hand, is a useful tool for obtaining detailed and accurate imagery of features on or near the earth's surface. Air:;+:and space-borne imagery allows for improved monitoring of vineyards, offering several advantages over traditional field methods of collecting vineyard information, such as digitally capturing an entire vineyard with a single satellite image and monitoring change over time. Another advantage of remote-sensing technology is that it provided a synoptic view of a vineyard (Figure 1.2). This SPOT 5 image illustrates the spatial variation in vine vigour (a measure of overall vine health) using a standard false-colour image where red represents areas of high vine vigour and healthy vegetation. Comparing the high vigour vineyard areas to the forest canopy reveals that the denser and healthier the vegetation, the brighter the red appears on the image. Whereas, areas of blue-green (known as cyan) are of extremely low vine vigour and/or exposed soil. Variations of the red and/or cyan colours illustrate the variations in high and low vigour within the vineyard blocks and black represented water. Improved vineyard'management de~isions can be made if these underlying spatial variations are understood. The synthesis of GPS and remote-sensing data, along with other geospatial data, into a GIS environment allows for more sophisticated analyses of vineyard variables. GIS has superior visualization tools, as well as the capacity to calculate the geostatistical relationship between variables using spatial analysis, potentially revealing new vineyard information that is not obvious without spatial analysis.


.")
13 4 Source: SPOT, 2007 Figure 1.2: Satellite image illustrating spatial variability at Stratus Vineyards and surrounding area, Niagara-on-the-Lake, Ontario. This image was acquired from SPOT 5 on July 22, Geomatics technologies were widely used in agriculture for decades and are increasingly being used in viticulture to understand the natural spatial variability of vineyards. Vineyard managers accounted for spatial variability in their management practices prior to the emergence of geospatial information, as growers have long known that vine and block characteristics vary in the vineyard and affects resulting grape yield and quality (Bramley and Hamilton, 2004). Many wineries recognize vineyard blocks with unique characteristics that make high quality grapes and subsequently selectively manage and harvest them to produce vintage-quality wines. For example, Vineland Estates Winery in the Niagara Region produces a distinct "Elevation" vintage
14 5 from their vineyard block with the highest elevation that consistently produce grapes with complex flavours that are crafted into high quality wines (Vineland Estates, 2010). The advantage of using geomatics technologies to understand the variability that has always existed in vineyards is its ability to visualize, monitor and analyze the magnitude of this spatial variability over various spatial and temporal scales with a level of precision and accuracy that were previously unattainable (Klinsky, Sieber and Meredith, 2010; Proffitt et al., 2006; Srinivasan, 2006). Geomatics technologies provide vineyard managers with the opportunity to examine the factors that influence grape quality by revealing underlying spatial variations in the vineyard (Hubbard, Lunt, Grote and Yoram, 2006; Bramley and Hamilton, 2004). 1.3 Precision Viticulture versus Spatial Terroir ~ ~ Research studies related to using geomatics technologies in viticulture are often classified as precision viticulture (PV), which is an approach to vineyard management that emphasizes targeted practices rather than uniform operations (Robinson, 2006). It encompasses the use of a range of tools and technologies that enable vineyard mangers to make informed and targeted management decisions (Proffitt et al., 2006). Targeted, or zonal, management refers to varying inputs and vineyard management techniques based on the natural variability of the vineyard (Robinson, 2006). Targeted management can lead to, for example, selective harvesting based on vineyard zones with similar characteristics (Bramley, 2001). However, PV is a broad term, as it can refer to the "precise application of vineyard management practices, for example, pruning and harvesting; and of resources such as fertilizers, water and pesticides" (Proffitt et al., 2006, 5). Studies in PV do not necessitate th~ use of geomatics technologies to facilitate precision, " practices, although these technologies are commonly used to obtain additional information about a region or vineyard of interest. Studies related to PV have also largely focused on the use of remotely sensed imagery to acquire detailed and accurate vineyard information, and often produces information that leads to more targeted management of vineyards (Delenne, Durrieu, Rabatel and Deshayes, 2010; Nemani, Johnson and White, 2006; Lamb, Weedon and Bramley, 2004; Hall, Lamb, Holzapfel and Louis, 2002). Old World vintners introduced the concept of terroir but it is New World wine producers - Australia, California and Canada - that are leading the investigation of geomatics applications in unlocking the mysteries of terroir; mysteries that have a profound impact on wine quality (Nemani et al., 2006; Reynolds and De Savigny, 2001).
15 6 Terroir is essentially a spatial concept since its primary component is the effect of geographic location on grape production (Jones, 2006). Traditional viticulture-based analyses of terroir have examined the effect of climate, microclimate, topography, soil and geology; without explicitly including a spatial component (Sommers, 2008). However, as a result of evolving geomatics technologies, geospatial and geostatistical techniques, terroir has been monitored and analyzed spatially in various studies (Reynolds, de Savigny and Willwerth, 2010; Reynolds, Marciniak, Brock, Tremblay and Baissas, 2010; Willwerth, Reynolds and Lesschaeve, 2010; Reynolds et at., 2007; Jones, 2006; Jones et at., 2006; Haynes, 2006; MacQueen and Meinert, 2006; Bramley, 2005; Bramley and Hamilton, 2004). These research studies have used geomatics technologies and geospatial techniques to visualize, monitor and analyze the spatial component of terroir. By using geomatics technologies and pe~forming sophisticated spatial data analyses with terroir, assessments of the spatial variation within vineyards are feasible. The term "spatial terroir" refers to analysis of spatial variability within vineyards using geomatics technologies. Understanding the unique spatial terroir (ST) of a vineyard (or vineyard block) gives vineyard decision makers greater insight into the terroir of their vineyards. In addition, some variations in terroir are obvious, such as the age or slope of a vineyard. However, other variations are less obvious and/or cannot be detected with visual observation alone. Geomatics technologies can be used to extract vineyard information that can impact vineyard management decisions, which have the potential to lead to improvements in the quality of grapes and the efficiency of farming operations. Since the information needs of every wine producing region and every winery are different, it is essential to assess the unique ST for this study's area of interest. 1.4 The Importance of Studying Spatial Terroir in the Niagara Wine Region At present, Canada aspires to a vision of a world class wine industry but, in comparison to the Old World, is a relatively new producer of premium wines. The first evidence of commercial wine production in Ontario was in 1811 (Beech, 2010). Thus, vineyard managers have had less than two centuries to develop viticulture techniques; this, compared to the Old World wine regions (i.e., Europe) where wine production was exceptionally profitable in the 8 th and 9 th century AD in Greece (Robinson, 2006). The 'youthfulness' of the Canadian wine industry, in contrast to Old World, means that vineyard managers and winery owners have not had centuries
16 to devise management strategies best suited to the particular terroir of different regions and/or vineyards. Thus, this research study was initiated by the need for improved vineyard information related to the ST in the Niagara Region in order to help Niagara remain competitive in a global wine market. To date, vineyard managers in the Niagara Region had overcome numerous obstacles since the inception of commercial winemaking, from cool climate growing conditions and restrictions to trade, to disease-prone vines and the establishment of new vineyards with appropriate vineyard management techniques (Haynes, 2006; Collings, 2003; RAEIS, 2003). Historically, Niagara grapes were mostly the native Vilis labruscana species, which produced poor quality wines. French-American hybrids were introduced in the late 1940' s and gradually replaced the V. labruscana varieties, while small plantings of some Vilis vinifera were -. established in the early 1950's (DeChaunac, 1953). In the early 1970's, experienced viticulturists placed greater focus on V. vinifera varieties (i.e., Cabernet Sauvignon, Pinot noir, etc.), despite warnings that they would not survive the harsh winters. The French-American hybrids and V. vinifera did well in the cool climate and by 1988, V. labruscana grape varieties were prohibited for use in Ontario wines that adhered to the quality standards that were implemented with the formation of the Vintners Quality Alliance (VQA) in Ontario (VQA, 2009; Aspler, 2006; Hope-Ross, 2006). More recent developments include the creation of the Cool Climate Oenology and Viticulture Institute (CCOVI) at Brock University and the Winery and Viticulture Technician program at Niagara College; dedicated to advancing research and training professionals in the field. The continued development of Niagara's wine region thro~gh practice, research and innovation enabled Niagara wines to achieve medal winning quality and capture a local and international audience. The Niagara Region is increasingly defined through the emergence of a niche market: the Niagara wine industry (Gayler, 2005). This industry attracts millions of tourists a year, generating employment opportunities and creating a reputable name for Niagara (Hashimoto and Telfer, 2003). Although the wine industry is still relatively small compared to other industry groups, the growth of the industry has outpaced most industries in Niagara as the number of wineries increased from 18 to over 60 between 1990 and 2006 and has over 500 grape producers (Hope-Ross, 2006; RAEIS, 2003). This successful development has allowed the Niagara wine region to become increasingly focused on establishing itself as a producer of 7
17 8 premium wines. However, this development has only occurred in the last three decades. In this context, understanding the spatial variability of the terroir using geomatics technologies, or spatial terroir, can help vineyard managers acquire and analyze important information related to vineyard variability, improving decision making in the vineyard and improving the quality of wines produced. 1.5 Research Questions and Thesis Outline Geographers are routinely interested in the interaction between the natural and built environment, often from a spatial point of view. Viticulturists are routinely interested in the interaction between the vineyard and the vineyard management strategy, with the overall intention of producing better grapes. In this research study, viti~plture and geography coalesced to investigate the spatial analysis of variability within a vineyard. This research study was part of a larger multi-disciplinary collaborative research project that investigated the value and use of geomatics technologies in viticulture in the Niagara wine region of Canada. The research team included viticulturists, geographers, biologists, engineers and industry personnel that were collectively working with over a dozen wineries and grape growers in the Niagara Region (see Hakimi Razaei and Reynolds, 2010a; 2010b; 2010c; Reynolds et al., 2010a; 2010b; Willwerth et al., 2010). The focus of this study, in particular, was on the application of geomatics technologies at Stratus Vineyards, a local winery in Niagara-on-the-Lake focused on producing premium wines while reducing the ecological footprint of their agricultural operations. The overall goal of this study was to investigate the applic~tion of geomatics technologies to characterize vineyard spatial variability at Stratus, understood in this thesis as spatial terroir. There were two main objectives: first, to characterize the variability within and between vineyard blocks to determine ifthere was an observed pattern (random, dispersed or clustered) in vineyard and grape composition variables that were known to influence subsequent wine production; and second, to determine if there was temporal consistency in the observed patterns. The vineyard variables were soil moisture, leaf water potential, vine vigour and soil composition; and the grape composition variables were berry weight, Brix content, titratable acidity (T A) and ph. The patterns in vineyard variables were spatially and temporally analyzed both within each vineyard block and between the vineyard blocks. The findings of this study were hoped to contribute to
18 the development of a precision management strategy at Stratus Vineyards and to further the industry's understanding of the spatial variability of terroir, especially as it related to the Niagara Region. This thesis was organized into five chapters, with each chapter dedicated to the understanding or application of geomatics technologies in viticulture. This study began with a review of the existing literature on the use of geomatics in viticulture, including the initial emergence of precision agriculture and the development of precision viticulture. The fundamental concept enabling PV is the natural spatial variability within vineyards. The applications ofpv explored were site selection, vineyard design and within-vineyard management. Within-vineyard management was the focus ofthis study and was structured by the spatial terroir conceptual diagram. Particular attention was,dedicated to visualizing, ", monitoring and analyzing the spatial variation within the terroir using GPS, remote sensing and GIS. Next, the ST conceptual diagram was applied to an empirical characterization of the spatial terroir within the selected study site, Stratus Vineyards in Niagara-on-the-Lake, Ontario. The analysis focused on characterizing the spatial variability within and between selected vineyard blocks and over time. The characterization of ST was established by defining the study site - Stratus Vineyards - and the sampling strategy. Next, GPS was used to help visualize the study site and then ground data and remote sensing were used to monitor the vineyard. The data collected was concerned with both vineyard characteristics and grape composition variables. The data collected from GPS and remote sensing facilitated descriptive statistical and spatial analyses, including spatial interpolation and spatial autocorrelation. These data were presented by variable analyzed: soil moisture, leaf water potential, vine vig<?uf, soil composition and grape composition. The discussion of the results was centered on the application ofst and how the results were useful for vineyard management and limitations associated with the study and geomatics in viticulture in general. The study concluded by revisiting the characterization of spatial terroir and making suggestions for further study. Characterizing the spatial terroir, within and between vineyard blocks and over time, provided detailed spatial information that can promote improved vineyard decision making in the Niagara wine region. 9
19 10 Chapter 2 Literature Review: The Use of Geomatics Technologies in Viticulture 2.1 Introduction A report on Canada's progress in environmentally sustainable agriculture indicated that, although progress in precision agriculture practices had occurred, the development was becoming stationary and required an infusion of new resources (Winfield and Rabantek, 1995). Within the context of agricultural practices, geomatics technologies evolved, in part, from an ever-growing need to revolutionize conventional resource-intensive agricultural practices that use an,t overabundance of external inputs from machinery, pesticides arid synthetic fertilizers while increasing productivity and quality (Winfield and Rabantek, 1995). Since this report in 1995, the continued development and use of geomatics technologies contributed to an infusion of new information sources in agriculture. The agriculture industry benefitted from the introduction of geospatial information to their management but its adoption by the wine industry was slower (Kitchen, 2008; Nemani et al., 2006). In 2001, the American Society of Enology and Viticulture symposium that specifically explored the use of geomatics technologies in the grape and wine industry was wittily titled "Space Age Wine growing" (Reynolds, 2001). At that time, the use of geomatics technologies in viticulture was a 'space age' concept with limited use, integration or even understanding. In the last decade, the progress of geomatics research and use in viticulture has gained momentum and the concept of precision viticulture (PV) was more widely known and "' increasingly practiced (Bramley, 2006; Proffitt et ai., 2006). Geoinatics technologies employed in PV - global positioning systems (GPS), remote sensing and geographic information system (GIS) - can facilitate visualizing, monitoring and analyzing vineyards at a more detailed scale than previously unachievable (Proffitt et ai., 2006). The spatial information extracted using geomatics technologies can allow vineyard decision makers "to make more informed, targeted management decisions in the vineyard" (Proffitt et ai., 2006,8). However, what does more informed targeted management decisions entail? How were geomatics technologies used in viticulture?
20 11 The purpose of this chapter was to examine the extent to which geomatics technologies contributed to improvements in vineyard management. The goal of this chapter was to provide a thorough review of the existing geomatics and viticulture literature on the use of geomatics technologies for improved vineyard management practices. This required a review of the development of geomatics techniques in viticulture, including the initial emergence of precision agriculture to the evolution of precision viticulture. The foundational concept in viticulture - that vineyards were inherently variable - was closely examined to better understand how geomatics technologies can be used to analyze that variability. Next, applications of geomatics in viticulture were presented. These include site selection, vineyard design and within-vineyard management. The concept of spatial terroir was used to structure the review of the application of geomatics technologies for within-vineyard management, rel~ed to visualizing, monitoring and analyzing vineyard variability. 2.2 Precision Agriculture The application of technology to food production has a long and somewhat controversial past. Technological advances in food production typically increased productivity to feed the world's hungry population (Gonsalves, Becker, Braun, Campilan, De Chavez, Fajber, Kapiriri, Rivaca Caminade and Vernooy, 2005). Developments such as the green revolution and genetically modified foods focused on resource exploitation, capital development and technological intensification (Gonsalves et at., 2005; Winfield and Rabantek, 1995). With an increasing reliance on external inputs in agriculture, the effects of food production on the environment caused widespread anthropogenic qamage, rendering the environment more vulnerable with increased air, ground and water pollution, overproduction and a shift away from natural food production (Falconer and Foresman, 2002). However, the application of geomatics technologies served a different purpose in agriculture. The technology was used to acquire and model information about features on the Earth for greater environmental and economic efficiency of agricultural practices, rather than sole gains in productivity (Stafford, 2006). The use of geomatics technologies in agriculture, where the industry maximizes spatial knowledge to assist food production, was termed precision agriculture (P A). Precision agricultural practices harness science and technology to acquire information related to agriculture production to better inform decisions (Del ago and Berry, 2008; Lamb, Frazier and Adams, 2008; Srinivasan, 2006).
21 12 Johann Von Thunen, one ofthe first agricultural geographers, recognized the strong relationship between geography and agriculture as early as the mid-1800s and since then, there has been substantial research dedicated to better understanding that relationship (Sommers, 2008). Spatial information in agricultural production began in the early twentieth century with the production of the first known yield maps in 1928 (Stafford, 2006). Historically, agriculturists realized the benefits of using detailed spatial information to transform traditional farming practices that relied heavily on information based on regional averages but were limited by the data available (Delago and Berry, 2008; Nemani et az., 2006). Linking spatial relationships to management activities can potentially lead to reduced cost, optimized yield/quality and protection ofthe environment (Srinivasan, 2006). However, the high cost and limited benefit prevented early applications of geomatics in agriculture to mov~tinto mainstream agriculture (Lamb et az., 2008). It was not until later developments in satellites, global positioning technologies, and ever expanding computer and digital storage capabilities that allowed geomatics applications in agriculture to progress. In the 1970s and 1980s, the agricultural community began to visualize, monitor and analyze zonal variability between and within fields. Using soil surveys, aerial images and ground scouting, farmers obtained enough information to begin "site specific management" (Morris, 2001; Robert, 2001). The information revolution in agriculture provided insight into the spatial and temporal variability in fields and lead to the development of precision farming practices. The concepts of precision and targeted management in agriculture were not new or revolutionary, as agriculturists have always recognized variability and controlled input to maximize output (Stafford, 2006).. According to rinivasan (2006), the management of variability using traditional methods and/or modem technologies improves profitability and minimizes adverse environmental impacts and is crucial for sustainable agriculture. What was changing was the sophistication of the technology used to visualize, monitor and manage the variability. Although traditional agricultural methods did try to control variability without modem technologies, P A practices using geomatics technologies were increasingly required because of the enlargement of agriculture fields, resulting from a shift from smaller family farms to large businesses that were capable of managing large fields (Stafford, 2006). The need for modem technologies was supported by the technical and scientific innovations of the 21 st century, including greater precision in location information from GPS, improvements in remote-
22 13 sensing capabilities, and advances in GIS computing power and storage capabilities (Robert, 2001). The decreasing cost ofpa practices and the gradual information diffusion created an explosion in the breadth of precision applications, from commercial farming to turf, forestry, pasture and natural resource management (Delago and Berry, 2008). In the last decade, P A has expanded to include viticulture and wine production. 2.3 Precision Viticulture Viticulture is a broad term referring to the science and production of grapes, and includes all aspects of vineyard management. Vineyard management encompasses planting vines, trellising, fertilizing, controlling disease and pests, harvesting and analyzing the vineyard (Reynolds et ai., 2007; Jones et ai., 2006). Traditional vineyard management oft~ uses an average approach to -. management, controlling variability to produce uniform grapes and make consistent wines. The addition of precision practices to viticulture allows managers to make targeted management decisions, treating vineyards as heterogeneous rather than homogeneous (Proffitt et ai., 2006). The extent of precision practices is directly dependent on the availability of detailed information, both spatial and non-spatial, about the vineyard (Delago and Berry, 2008; Collings, 2003). The more information available, the better the likelihood of making more informed management decisions, which can impact the quantity and quality of grapes, and subsequent wine, produced. Improvement in the quality of grapes is a major concern in viticulture management because grapes are a value-added product. During the growing season, the vines must be carefully managed and after harvest, the grapes must be skillfully made into wine. The grapes produce a higher value product, with the quality and price of the resulting wine being directly linked to grape quality (Smart, 2009; Baldy, 2005). Thus, employing precision techniques that can improve grape quality is of upmost concern for vineyard managers. The outcome ofpv practices varies according to the quality and quantity of wine produced and the desired wine style, as every winery has different specifications (Collings, 2003). For example, some wineries want uniform grapes in order to mass produce wines while others are more interested in creating limited edition vintages with unique grape characteristics. It is up to the vineyard decision makers to use geospatial information to fill their specific information needs regarding grape growing and wine making.
23 2.3.1 Environmental Sustainability in Viticulture Using geomatics technologies to make more informed decisions in the vineyard has the potential to improve the environmental sustainability of vineyard operations (Bramley, 2006). Grape growing and wine making is a resource intensive industry that requires heavy agriculture equipment such as tractors; fertilizers, pesticides and herbicides; and labour-intensive soil, vine and grape maintenance for successful production. Increasingly, vineyard decision makers are turning to geomatics technologies to provide the necessary information to make more informed decisions in the vineyard to reduce the environmental impact of grape growing operations (Cozzolino, 2009; Falconer and Foresman, 2002). For example, being aware oflocal rivers and streams on or surrounding the vineyard property can lead to more precise spray application, avoiding areas closest to sensitive ecosystems such as waterways. Recognizing the interaction of " the vineyard and the natural environment is a holistic approach to agricultural and vineyard management that is proving to be more environmentally sustainable (Gonsalves et ai" 2005; Clinge1effer, Sommer and Walker, 1998). In addition, environmentally sustainable vineyard practices do not result from one decision to be sustainable; it is the result of numerous vineyard decisions working together to reduce the environmental impact of agriculture operations. A growing number of wineries in Niagara and all over the world are employing environmentally sustainable initiatives to reduce their environmental footprint, including Leader in Environment and Energy Design winery buildings (e.g., Stratus Vineyards), organic wines (e.g., Malivoire Wines), biodynamic farming practices (e.g., Southbrook Vineyards) and efficient production and packaging methods. With the introduction of geomatics technologies, vineyard managers are able to acquire more detailed and accurate information to be used to make more informed and precise decisions in the vineyard (Klinsky et ai., 2010; Bramley, 2006). With more 'green' thinking wineries, precision viticulture is increasingly being applied to improve environmental sustainability in the wine industry Vineyard Variability Vineyards are an ideal application for a geospatial study due to their natural spatial variability. As a result of the effects of terroir, there is substantial intra- and inter-regional variability, including large scale variability between and within vineyard blocks (Proffitt et ai., 2006). If vintners can understand the variability of vineyard characteristics and manipulate the quality of
24 15 grapes based on information regarding that variability, they can improve the quality of the wine produced (Bramley and Hamilton, 2004; Bramley, 2005). Using geospatial information, it is possible to detect and control consistent patterns in vineyard variability that were stable over time, such as soil composition, soil moisture, vine vigour, natural variations in the topography and some indictors of grape quality (Proffitt et ai., 2006). Since some variability is inconsistent and changes over time (such as weather and climate), it is especially important to understand consistent patterns in vineyard variability, as viticulturists need to gain as much control as possible over a system as complex and variable as growing grapes for wine production (Nemani et at., 2006; Hall et ai., 2002; Lamb and Bramley, 2001). By having an improved understanding ofthe underlying natural variability of vineyards, managers can properly devise a strategy to better control grape production (Bramley, 2006; Robert, 2001)..;In addition, over time assessment of variability can lead to corrections in the existing management strategy and optimization of current management practices (Bramley, 2006). Geospatial information allows vineyard management to shift from the average to the precise approach, dividing non-uniform blocks into management zones to maximize, not eliminate, variability (Smart, 2009; Bramley, 2006). A study by Hubbard et at (2006) concluded that precision viticulture strategies promoted consistently high-quality wines by encouraging uniform development in the vineyard. But, why promote uniformity when wine production can benefit from the inherent variation? Uniform management is not optimal since vineyards are variable and vintners can gain control over the variability to better control desired output (Bramley, 2006). If variability remains unmanaged, uncertain yield and inconsistent quality can result (Hall, Louis and Lamb, 2008). According tb Bramley (2005), one of the main benefits of PV is the ability to perform targeted vineyard management. By making use of valuable geospatial information, managers can selectively assess, quantify, treat and harvest their vineyards; subsequently adjusting management practices to blocks rather than entire vineyards (Bramley and Hamilton, 2004). Detailed and accurate geospatial information also allows viticulturists to monitor vine quality and yield information, analyze grape composition and manage specific vineyard zones (Lamb and Bramley, 2001). Geomatics technologies do not replace traditional practices in viticulture; it improves the information known about a vineyard and in some cases, can also be used to create new information not previously known about a vineyard. For example, an aerial or satellite image can be enhanced (e.g., using the normalized
25 difference vegetation index or NDVI) to highlight areas of high or low vegetative vigour, revealing information not otherwise visible by ground scouting (Hall et al., 2002). This information leads to more informed decisions, resulting in better grapes for superior wines Applications Australian researchers emerged at the forefront ofpv studies and involved the use of a range of geomatics technologies for vineyard applications (e.g., Bramley, 2006; Proffitt et al., 2006; Hall et al., 2002; Bramley, 2001; Lamb and Bramley, 2001). With large vineyards and early adoption of precision techniques, Australia's wine production capacity developed quickly and efficiently to create a marketable wine that was distinct, consistent and deliverable (Cozzolino, 2009). Since the introduction ofpv research in Australia, there has be~:{l an industry-wide trend toward integrating geospatial information for precision vineyard management (e.g., Reynolds et al., 2007; Bramley, 2005; Bramley and Hamilton, 2004; Hall, Louis and Lamb, 2003; and Hall et al., 2002). Although there are potential applications of geomatics technologies in winemaking, marketing and distribution, the applications explored here are related to viticulture and grape growing for improved vineyard management. There are various geographic scales of analysis when applying geomatics technologies to grape growing and wine production; ranging from regional identification and site selection to vineyard design, and within-vineyard management. Suitable site selection and proper vineyard design are key components of vineyard management, as they provide the essential foundation for quality grape production. However, as the capabilities of geomatics technologies continues to improve, much of the current research focuses on within-vineyard manag~ment. Viticulturists can gain a better understanding and thus, greater control over the spatial variability of important vineyard variables. The following sections briefly describe the role of geomatics technologies in site selection, vineyard design and within-vineyard management Site Selection The first step toward good vineyard management is starting with an appropriate, if not ideal, site for grape production. Geomatics related research studies are often concerned with suitability in region, site and variety for the purpose of maximizing productivity in yield and quality (Hubbard et al., 2006; Jones, 2006; Fuentes, Conroy, Kelley and Rogers, 2004). Analyzing site potential
 compared to well established (i.e., Old World) wine producing regions (Sommers, 2008; Jones et ai.")
 examined the use of GPS and GIS technologies to determine site suitability in a newly developing wine region in the Umpqua Valley in Oregon, establishing that there")

26 17 using geomatics technologies is particularly useful since it provides an opportunity to combine climate, soil and land use/land cover data to create an inventory of land suitability in new wine producing regions where less is known about the terroir (i.e., New world regions such as Oregon) compared to well established (i.e., Old World) wine producing regions (Sommers, 2008; Jones et ai., 2006; Wolf and Boyer, 2001). For example, Jones et ai (2006) examined the use of GPS and GIS technologies to determine site suitability in a newly developing wine region in the Umpqua Valley in Oregon, establishing that there was suitable terroir for grape growing where grape growing did not previously exist. The geospatial information acquired about the Umpqua Valley had the potential to "initiate better decisions in the site selection process, thus leading to fewer and/or more efficient trial and error procedures" (Jones et ai., 2006, 125). Tatem (2005) used satellite imagery to map vineyard suitability based on glo~;al climate patterns. Although geomatics technologies are often used to optimize vineyard site selection, caution is required when performing site selection using GIS since growing high-quality grapes is a complex science. One cannot assume that combining generalized criteria, i.e., less than five degree slope, sandy loam soil and vegetative land use, will result in a meaningful GIS output. The user must select an appropriate scale for analysis and input relevant large-scale information for meaningful results. A sizable portion of the Niagara Region is designated unique agricultural land that is ideal for grape production but does not mean all of the land is suitable (Figure 2.1). GIS can make this overgeneralization if detailed large-scale information was not incorporated into the system. Thus, an appropriate methodology was essential to produce useful results. Niagar.a's Unique Agricultural Land LAKE ONTAAIO -- Regional Boundary -- Area M~lcipelHy _ Urban Areas AgrIcultural DesIgnatIons (from Regional Niagara Policy Plan) ~ Unique _ PrIme Rural Areas Figure 2.1: Niagara's unique agricultural land. Map modified from: RAEIS, 2003 (not to scale).
27 2.4.2 Vineyard Design 18 Since grapevines are perennial and take multiple years to begin producing quality fruit, initial planting decisions are extremely important for subsequent vineyard management. Vineyard design that incorporates detailed spatial vineyard information is more likely to be better suited to the terroir and subsequently produce higher quality grapes (Sommers, 2008). Similar to an engineer creating a blue print before constructing a building, a vineyard owner must strategize a vineyard design prior to planting the vineyard. There are multiple ways geomatics technologies can provide greater spatial information so the owner can make better design decisions, starting with GPS. Acquiring exact location information regarding the size and extent of a plot ofland is essential to help visualize the potential vineyard. Incorporating the location information into a GIS environment, and coupling it with topographic (slope, aspect, elevation), soil variations and geological information, to model the environment leads to improved decisions while establishing the vineyard. This could influence vineyard design, including grape variety, row orientation, irrigation and drainage system, and block layout (Proffitt et al., 2006). Choosing an ideal grape variety, given the terroir of the particular plot ofland, can also improve vineyard performance (Tatem, 2005; Collings, 2003). Each grape variety requires particular conditions to produce high-quality grapes, i.e., Cabemet Franc requires a long growing season and Riesling requires well drained soil rich in limestone deposits (Collings, 2003; Gishen, Hand, Dambergs, Esler, Francis, Kambouris, Johnstone and Hoj, 2001; Baldy, 1995). Using GIS to model the environment can provide greater spatial information to promote better vineyard planting decisions. In addition, geomatics technologies were used to adjust and regulate varietal choices and assess the performance of established viticulture regions in the Okanagan and Similkameen Valleys in British Columbia (Bowen, Bogdanoff, Estergaard, Marsh, Usher, Smith and Frank, 2006). Bowen et al (2006) also incorporated information related to individual vineyard performance into a GIS environment based on growers input from annual surveys and general maps (i.e., 1 : soil survey). However, the results were generalized as the study did not include inputs from detailed maps or sub block datasets; this further emphasizes the importance of within-vineyard information.
28 2.4.3 Within-vineyard Management 19 Recent advances in geomatics technologies, coupled with increased knowledge of sophisticated techniques for extracting valuable vineyard information related to vineyard and grape quality characteristics across space and over time have resulted in a plethora of within-vineyard studies. Within-vineyard spatial analyses facilitate a greater understanding of the terroir and spatial variation therein, thus making within-vineyard management a thriving area in vineyard research. Management zones can be used to reduce variability between vineyard blocks and segregate higher-quality grapes (Nemani et al., 2006). Bramley (2005) and Bramley and Hamilton (2004) examined block variation in grape quality and yield between and within-vineyard blocks, establishing that there was substantial variation that warranted targeted management. Advances in remote sensing provide automated approaches to delineating :tilanagement zones that can be easily integrated into a GIS to produce valuable information for vineyard management (Delenne et ai., 2010; Pedroso, Taylor, Tisseyre, Charnomordic and Guillaume, 2010; Delenne, Durrieu, Rabatel, Deshayes, Bailly, Lelong and Couteron, 2007). Studies involving within-vineyard spatial analyses using geomatics technologies for improved vineyard management decisions were the focus of the remainder of this chapter and the concept of spatial terroir was used to frame this discussion. 2.5 The Concept of Spatial Terroir Many precision viticulture efforts are dedicated to gaining a more informed understanding of the geographic location and variation ofthe terroir (Sommers, 2008). By combining geomatics technologies for extracting and analyzing spatial data with terroir? assessments of the spatial variation within-vineyards are possible (MacQueen and Meinert, 2006). Understanding the unique spatial terroir of a vineyard or vineyard block will give vintners greater insight into the terroir of their vineyards, information that can guide their decision-making process. Spatial terroir (ST) was a term devised to refer to the spatial analysis of variability within a vineyard using geomatics technologies. The concepts central to ST were the variations in the terroir, geomatics technologies and spatial analysis. ST was based on the principles of precision viticulture but represents a larger scale of analysis, as it only pertains to within-vineyard management. The concept of PV is widely used to describe viticulturists and winemakers attempts to control grape production by making targeted management decisions; however, it does
29 20 not assume a within-vineyard scale of analysis (Proffitt et al., 2006). ST is specifically concerned with the spatial variation of the terroir within the vineyard, as there is an emerging importance of knowledge of within-vineyard spatial variability to help viticulturists make better decisions. Research studies on within-vineyard management using geomatics technologies are on the rise, especially within the past five years; thus, a conceptual diagram of spatial terroir was developed in order to facilitate a discussion about the integration of geomatics technologies into vineyard management. The concept of spatial terroir was discussed with reference to a conceptual diagram to provide structure to a review of within-vineyard management practices using geomatics technologies. The components of the ST conceptual diagram were based on what other scholars identified as key components of successful precision agricultur({,;i'precision viticulture and/or within-vineyard management approaches. Srinivasan (2006) identified the principles of precision agriculture as data collection, diagnostics, analysis (or management planning), precision field operations (application) and evaluation. Also from an agricultural point of view, Cook and Adams (2000) identified a cyclical procedure to P A that comprised of observing yield variation, interpreting it in relation to other variables, evaluating the potential for action and implementing the preferred option. From a strictly viticulture perspective, Proffitt et al (2006) classified the components ofpv as locate, quantify, understand and act. Lamb and Bramley (2001) identified a more detailed conceptual framework that included observation and data collection, data interpretation and evaluation, implementation and management. This framework also included an often overlooked component: the revaluation and assessment after the system was integrated. Bramley (2006) emphasized that "further work was needed to improve the design of within-vineyard management experiments. Thus, based on this evaluation, the ST conceptual diagram (Figure 2.2), was used to structure a discussion about the literature presented here, as well as subsequent experiment design in the rest of this thesis. The conceptual diagram began with a place and the spatial components include GPS, remote sensing and GIS and were respectively tied to the terroir components visualize, monitor and analyze. The system was closed and connected by the integration of the system into existing vineyard management systems. Each component of this model was analyzed according to its ability to contribute to the understanding of spatial terroir.

.")
30 Place Figure 2.2: Spatial terroir conceptual diagram., ~ The centre of all geographic studies is the concept of place 1 (Smith et al., 2007). Thus, the analysis of spatial terroir must begin with place, as well. The methods to apply a withinvineyard analysis must be developed and customized for each research study site because each vineyard/winery has varying vineyard management requirements (Reynolds et a!., 2007; Bramley, 2005; Bramley and Hamilton, 2004). The ST concept must be modified for each situation when applying geomatics technologies as no two wine regions, vineyards, vines or management strategies were the same (Smart, 2009). For example, applying ST to vineyards in Australia would be much different than applying ST to vineyards in the Niagara Region, as the vineyards in Australia are, on average, substantially larger than vineyards in Canada (Hope-Ross, ; Lamb and Bramley, 2001). Thus, the ability to collect within-vineyard ground data to correlate it with remotely sensed imagery in Niagara is much more feasible than in an Australian vineyard that could be ten, or more, times the size. By knowing the needs and characteristics of the particular place under investigation, the application of ST can be adjusted to be more relevant for the particular place. I The concept of place, especially as it relates to the Niagara wine region, is complex. For a more comprehensive review of Niagara wine and place, see Ripmeester, Mackintosh and Fullerton (forthcoming).
31 2.5.2 GPS - Visualize 22 A global positioning system (GPS) is a satellite navigation system that provides reliable information about the position of features on (or near) the Earth's surface (Robinson, 2006). Mainstream society has adopted the technology to provide accurate turn-by-tum directions during road navigation. More advanced applications identify precise and accurate 3-D geographic coordinates (i.e., latitude, longitude and elevation) on the Earth's surface to track detailed location information. In addition, GPS can track time and thus, speed can be calculated (Proffitt, et al., 2006). So, for example, farm equipment loaded with a GPS can automate steering of tractors to ensure there was no overlap in sowing, spraying or harvesting while keeping a steady pace to ensure even distribution (Mercer, 2008). GPS technology was the foundation of variable rate technology and yield mapping, trackihg georeferenced information on-the-go (Bramley, 2006). It controls cost by reducing farm inputs, simultaneously benefitting the natural environment. By knowing the location of vineyard features or problems, it became possible to track the interaction between elements over time and space (Falconer and Foresman, 2002). A simple example of the importance of location information was presented by Proffitt et al (2006): a winemaker harvests 100 tons of grapes at one time and makes three batches of wine. Two ofthose vintages were mediocre while the third was a superior prize-winning wine. How can the winemaker replicate those results the following year ifhe/she does not know where those grapes came from in the vineyard? Tracking detailed information about the exact location of the prize-winning grapes was essential for the reproducible production of high quality wine. In addition, the location information from a GPS can be plotted onto an existing map using publically available data to facilitate vineya;d visualization. -Once vineyard decision makers acquire accurate location and boundary information regarding a vineyard, they can incorporate free data made available through data-sharing consortiums and internet-based geospatial data sites; sites such as GeoGratis, a portal provided by the Earth Sciences Sector through Natural Resources Canada that offers access and download of geospatial data collections at no cost for all of Canada (see GeoGratis.gc.ca for more information). Free data can include aerial and satellite imagery, digital elevation models and vegetation indices; street, water and river networks; land-use and land-cover maps; and maps of soil type. These data are generalized and not specific to a particular vineyard but contain valuable information that assists in building
32 23 an extensive spatial understanding of a vineyard and the surrounding environment. Although ST was used to analyze within-vineyard level data, the surrounding environment was inextricably tied to the vineyard (Cozzolino, 2009; Sommers, 2008; Roling and Wagemakers, 1998). Publically available data, coupled with location infonnation, assists in visualizing the vineyard in the context of the surrounding environment Remote Sensing - Monitor Monitoring vineyards can be done on the ground and from a distance. Data was traditionally collected by way of ground scouting to monitor vineyard conditions related to disease, pests, growth and grape maturation. Vineyard managers typically collect vineyard infonnation throughout the growing season to assess the perfonnance of the,vineyard. Since vineyard -. conditions change dramatically throughout the growing season, it was a labor-intensive job to col1tinuously monitor changes on the ground (Bramley, 2006). In addition, subtle differences in topography can make a significant impact on crop development, yield and quality (Bishop and McBratney, 2002). Vineyard monitoring typically includes (but is not limited to) soil surveys, soil composition, vine vigour, yield, grape quality and other productivity related variables (Nemani et at., 2006). The introduction of remote sensing, from a distance, is increasingly supplementing vineyard data collected on the ground. Imagery acquired by satellites and aerial platfonns allows for the monitoring and mapping of vineyard characteristics over time, including canopy condition, vigour and grape quality, and yield (throughout the growing season and from season to season). Imagery provides a different point of.view when monitoring vineyards, allowing managers to observe the entire vineyard from above rather than from the ground. The monitoring of vineyards using imagery transfonns vineyard managers approximate idea of variability to knowing "how variable and precisely where" (Bramley, 2006; 32). Improvements in remote sensing capabilities allow detailed imagery to be more accessible and reliable, transfonning a multi-day ground scout of vineyard condition to one satellite snapshot (e.g., Da Silva and Ducati, 2009; and Hall et at., 2002). Monitoring large portions of vineyards with unprecedented detail and regularity proved to be especially important to Australian wineries because the vineyards were among the largest in the world (Bramley, 2005; Bramley and Hamilton, 2004).
33 24 Remote-sensing devices collect vineyard data by measuring reflected energy in the blue, green, red and infrared portions of the electromagnetic (EM) spectrum (Hall et al., 2002). Humans can see the visible portion of the EM spectrum (blue, green and red) but cannot see the near-infrared portion of the spectrum, which contains the most detailed information on vegetation health and vigour (Hall et al., 2003). So, similar to how a dentist can see problems with teeth from an x-ray that are not visible by simple observation, remote sensing can reveal new vineyard information using portions of the EM spectrum that human eyes cannot detect. There are several image enhancement techniques, such as vegetation indices, which are useful in revealing new vineyard information. The most frequently used indices are: the normalized difference vegetation index (NDVI), a ratio of reflected energy from the near infrared and red portions of the EM spectrum that is commonly used to visually. 'nhance the vegetated components across an image scene; and leaf-area index (LAI), a ratio of leaf area to canopy (Hall et al., 2008; Hall et al., 2003; Hall et al., 2002). Vegetation indices can also assist in correlating ground data and imagery, making relationships between the ground data and imagery more obvious (Hall et al., 2008). Digital elevation models (DEMs), created from remote-sensing technologies, such as Light Detection and Ranging (LiDAR), are also useful to observe the elevation range, slope and aspect of a vineyard (Bishop and McBratney, 2002). This elevation information can then be used to facilitate vineyard irrigation, spray and drainage decisions (Bishop and McBratney, 2002). Continued improvements in the spatial and spectral resolutions of remote-sensing devices allows for more detailed information to be extracted from imagery. Initial studies using remote sensing in viticulture aimed to characterize and map vineyard canopy and the variations therein (Hall et al., 2002; Hall et al., 2003; Bramley and Hamilton, 2004; Bramley, 2005). The goal was to define useful relationships between vineyard characteristics and grape quality, acting as a foundation for remote sensing and viticulture studies (Hall et al., 2002). In particular, there is increasing evidence that water potential, both in the soil and in the vine, has a significant impact on grape quality, with slight water stress often improving the quality of grape produced (Nemani et al., 2006; Peterlunger, Sivilotti and Colussi, 2004). Soil and leaf water potential is more easily detected using air- and space-borne imagery so multiple studies were using remote sensing to define within-vineyard management zones related to water status (e.g., Acevedo-Opazo, Tisseyre, Guillaume and Ojeda, 2008; Hubbard et al., 2006; Gruber and Schultz, 2004;
34 25 Peterlunger et at., 2004). More recent studies used very high spatial resolution remote-sensing data to delineate vineyard management zones using automated algorithms without any input from ground surveys or GPS data, further dividing vineyards into manageable zones based on similar characteristics (e.g., Delenne et at., 2010; Pedroso et at., 2010; Delenne et at., 2007). These automated approaches are in their infancy but are gaining momentum as research progresses. Although remote sensing is not currently able to replace ground data completely, it is anticipated that over time reliance on ground data will decrease with the continued development of remote-sensing techniques GIS -Analyze The collection of GPS and remote-sensing data is critical for GIS because it builds the database " <" required for further, more advanced, data analyses. A GIS environment facilitates the organization and presentation of complex data sets (Harvey, 2008; Delaney and Van Niel, 2007; Wolf and Boyer, 2001). GIS combines layers of data to visualize relationships, monitor trends and conduct analyses but can only be effective if appropriate data are obtained (Robinson, 2006; Falconer and Foresman, 2002). Relating viticulture data from GPS, remote sensing and GIS together creates detailed spatial information that can be applied to vineyard decision making (Grieger and Armstrong, 2001). Understanding the often subtle relationships that exist in grape growing - between climate, topography, soil and geology, water status, grape variety and management application - can provide vineyard decision-makers with detailed spatial information to support precision management strategies (Proffitt et at., 2006). A system that provides readily available informat~on in a timely..manner can offer immense benefits (Falconer and Foresman, 2002). As the technology improves - allowing for greater detail in vineyard, vine and grape information - so does a vineyard manager's ability to manipulate grape quality. The strength of GIS comes from its ability to conduct advanced spatial analyses. The combination of GIS and spatial analysis facilitates the processing of large spatial datasets and their variables using both geographic and computer science knowledge (Berry, Griffith and Tiefelsdorf, 2008). Geospatial analysis is essentially concerned with "what happens where" and uses the power of GIS software to analyze the relationship between places and variables (Smith, Goodchild and Longley, 2007). There are many tools and techniques for geospatial analysis available and widely used with GIS. Numerous textbooks and industry papers describe the
35 26 parameters of the tools and the associated applications. Some of the literature is software independent (for example, Harvey, 2008; Delaney and Van Niel, 2007; Schuurman, 2004; and Rogerson, 2001) while others are produced by software companies (for example, Thomas and Sappington, 2009; Wade and Sommer, 2006; and Wong and Lee, 2005), most notable ESRI which produces dozens of GIS related books under the publisher ESRI press. Regardless of software, the basic functions and conceptual framework for geospatial analyses are the same. Traditionally, static maps are used to communicate and store spatial data; however, the advances in GIS add storage capacity, sophisticated display options, and advanced statistical and mapping capabilities (Harvey, 2008; Smith et at., 2007). Since GIS databases are dynamic compared to static maps, it is up to the researcher to decide how to present the data using mapping technologies (Greenspan, 2001). According to Smith ~ at (2002) geospatial analysis exists at the interaction of the decision maker and the computer. The results obtained from geospatial analysis must be interpreted by using human reasoning and knowledge. In the case of PV, it was the job of the vineyard decision makers to interpret and apply the results of geospatial analysis to their vineyard management strategy. Thus, all studies that examine ST must consider data management and display. The use of GIS in vineyard management requires effective data management and organization before analysis can be done correctly. As with most GIS projects, a significant amount of geospatial data is required to analyze the spatial variability of terroir. For example, one spectral reflectance curve contains over 1,000 data points and that measurement can be taken hundreds oftimes in the vineyard. Thus, well-organized data management strategies were emphasized by Proffitt et at (2006); in order to keep mass amount.s of data organized. Proper organization and a well-documented inventory of data facilitated more complex data analyses. Advancements in geomatics technologies convert complex data tables into illustrative maps, transforming the way we were able to visualize spatial data (Proffitt et at., 2006). Once the data are organized, advanced spatial analyses can begin. The display of the data is also an important component ofpv studies. Effective presentation of geospatial data is the best way to communicate the results of geospatial analysis to the vineyard decision makers; the people who have the ability to affect change on the current vineyard management strategy by incorporating geospatial information. Geospatial studies consider projection, scale, colour schemes, map layout and other design elements to effectively

. grav.1 (gikg) _ m-~9 _ 550-71 5 Source: Proffitt et ai., 2006, 24 Source: Morani et ai., 2009, 104 Figure 2.")
.")
.")
 from these point")
36 27 communicate the results. The maps generated are often layered or tiled due to the large datasets that need to be presented (Figure 2.3). The maps visually and creatively display of the results of the geospatial analysis, revealing patterns observed and measured in the geospatial data. With effective data organization and display, geospatial analysis is used understand the statistical relationship between variables to generate meaningful spatial information using GIS software (Wong and Lee, 2005). grav.1 (gikg) _ m-~9 _ Source: Proffitt et ai., 2006, 24 Source: Morani et ai., 2009, 104 Figure 2.3: Effectively presenting complex spatial data Geospatial Analysis Making use of spatial data, geospatial analysis encompasses surface, locational, network and geostatistical analysis (Smith ~t ai., 2007). T,he technique most commonly used in vineyard studies, thus far in the literature, was surface analysis since they help identify the most advantageous elevations, slopes, aspects and angles of the vineyard topography (Jones et ai., 2006; Bishop and McBratney, 2002). However, vineyard variables collected on the ground are point data, rather than area data. Thus, geostatistical analyses, such as spatial interpolation techniques, are commonly used to create a surface of data values (known as a raster dataset) from these point data (Smith et at., 2007). Interpolation techniques are used to predict or estimate values for the areas between sample points (Delaney and Van Niel, 2007; Smith et ai., 2007). Interpolation is based on Tobler's First Law of Geography: "all things were related, but closer things were more related" (Wong and Lee, 2005; 10 - quoting Tobler, 1970). The
37 28 rationale for interpolation is that observed points in space are more likely to have similar values than points far apart. This method provides a good visual indication of spatial pattern, especially when it is not possible or feasible to observe or measure the entire study area. In the PV literature, the two most common data interpolation techniques are the Inverse Distance-Weighted (IDW) spatial average interpolation and Kriging. The IDW spatial average interpolation (a deterministic approach) is often more advantageous because "the technique gives nearby points more significance in calculating the interpolation than more distant points" (Harvey, 2008; 283). For example, Reynolds et al (2007) used the IDW interpolation algorithm to construct raster data files used to study vineyard variability. Studies by Bramley (2005) and Bramley and Hamilton (2004), on the other hand, indicated that Kriging (a gecistatistical approach) was most effective interpolation technique when the talue (or variable) at the data point, rather than the actual location of the data point, was of most interest. The interpolation of vineyard data is the most common method of analysis in viticulture studies since it transforms point data into a surface of data that can be analyzed at a glance, providing an easy to interpret visualization of the data under investigation. Morani, Castrignano and Pagliarin (2009), for example, applied spatial interpolation to better understand the variation in soil composition throughout the vineyard. Understanding the variability of soil data, especially as it relates to soil texture, is valuable for vineyard managers because regional or national soil surveys are based on approximate boundaries and classification averages and often do not provide adequate detail needed for PV. Interpolation provides a visual impression of the variability of the data. More advanced spatial analysis quantifies the pattern represented by the data. More recently, statistical techniques are being applied to study vineyards, when correct and detailed datasets are obtained. Often, vineyard managers collect data of interest (i.e., soil composition, soil moisture and grape composition) but without GIS capabilities, are limited to non-spatial statistical analysis. The most common non-spatial statistic is the mean because vineyard managers often manage based on an average approach (Delago and Berry, 2008). Greenough, Mallory and Fryer (2006) used correlation coefficients, an exploratory data analysis technique, to quantify differences in grape and wine quality based on region of origin. They found that grapes were "fingerprinted" according to their area of origin, substantiating the influence of terroir on wine using a statistical measure. Other common statistics used to analyze vineyard variables are minimum, maximum and spread of values; standard deviation; frequency
38 29 distribution; analysis of variance (or ANOVA); and regression analysis (Bramley, 2006). Many classical experiments in viticulture are designed to determine if a particular treatment (i.e., selective irrigation, fertilization, canopy management) delivers a significant result from the untreated (or control) block (Peterlunger et al., 2004; Storchi and Costantini, 2004; Chone, Van Leeuwen, Chery and Ribereau-Gayon, 2001). These experiments used inferential statistics to determine ifthere was a measurable and significant difference between the treatment and control sub blocks. Typically, the allocation of treatments to blocks was randomized to control for the natural spatial variability in vineyards. However, the underlying spatial variation within a vineyard is complex and known to influence grape and subsequent wine quality, in addition to the treatment being tested (Reynolds et al., 2007; Van Leeuwen, and Seguin, 2006; Coventry, Fisher, Strommer and Reynolds, 2004; Fuentes et al., 2004; Va~our, 2002). Thus, the vineyard phenomenon under investigation is significantly influenced by the natural spatial variability in the vineyard. Knowing more about the variability can assist in further studies of the vineyard. More advanced studies using geostatistical methods are emerging to better understand the natural spatial variability within a vineyard. Hall et al (2008) used frequency distribution diagrams (histograms) and scatter plots to analyze the relationship between the results ofleaf area index (LAI) and NDVI; both common measures of vine vigour resulting from the processing of remotely sensed images. They determined that the overall canopy area and density can be measured with both LAI and NDVI but there was not a significant relationship between LAI and NDVI. Bramley and Hamilton (2004) and Bramley (2005) used what they described as simple methods of spatial analysis - including k-means clustering, spread and coefficient of variation - in order to quantify spatial and temporal variability in.key indicators of grape quality and yield. Using GIS software to conduct these analyses, the studies identified the significance of patterns of variation related to yield (performance) and quality (berry weight, Brix, TA, ph, colour and phenolics). Bramley and Hamilton (2004) concluded that the spatially and temporally consistent patterns of variation related to grape yield and grape quality enabled differential management, or zonal management. Vineyards were divided into zones of uniform performance and subsequent treatments and harvesting were managed based on the zones (Pedroso et al., 2010; Morani et al., 2009; Robinson, 2006). An important consideration in geospatial analysis is that variables closer in space tend to be dependent. The statistic used to measure the association between those variables is known as
39 30 spatial autocorrelation (Ebdon, 1990). Spatial autocorrelation measures if the values of the variables are more or less similar than would randomly be expected over space, giving a better indication of spatial pattern (Overmars, de Koning and Veldkamp, 2003). If the values show no spatial autocorrelation, they were said to be randomly distributed. If they show positive spatial autocorrelation, the values were said to be clustered and if they show negative spatial autocorrelation, the values of said to be dispersed. Spatial autocorrelation is measured both globally and locally (Ord and Getis, 2001). The measures of global spatial autocorrelation, including Moran's I, Geary's c and Matheron's variogram, determine if the values of the entire dataset are random, clustered or dispersed over space (Ebdon, 1990). In the presence of global autocorrelation, local measures of spatial autocorrelation, such as Getis-Ord G and Anselin, test for spatial dependence by identifying hot spots (clusters) or outl{ers within the dataset (Ord and Getis, 2001). Both global and local measures of spatial autocorrelation identify spatial patterns in large datasets and provide a good indication of pattern in variability. Although these methods have not been applied directly to existing vineyard variability studies, they were proven to be useful in the spatial analysis ofland-use change and ecological modeling (Overmars et ai., 2003; Koenig, 1999). Geospatial analysis, and in particular geostatistical analysis, gives vineyard managers the information they require to support precision management of their vineyards (Morani et al., 2009). GIS, and related geospatial analysis, are increasingly being associated with higher quality, higher value wines, as a better understanding the natural spatial variability within a vineyard allows vineyard managers to manage for the variability that influences grape quality (Proffitt et al., 2006) Integrate - Manage The biggest challenge of the spatial terroir conceptual framework is integrating geomatics technologies into the existing vineyard management strategy. The technologies - GPS, RS and GIS - are only part of ST (Kitchen, 2008). In order for a system to be an effective tool in achieving management that considers within-vineyard variation, the technology must be integrated into the existing management system (Cozzolino, 2009; Lamb et al., 2008; Grieger and Armstrong, 2001). Successful integration of the system maximizes benefits to a wide audience, connecting the researchers to the users: "integrated vineyard management requires commitment to both the research required, which underpins the industry, and the reality of trying
40 31 to implement new research ideas into everyday vineyard practices" (Grieger and Armstrong, 2001; 71). In the wine industry in particular, an integrated data management system provides an opportunity for vineyard managers to conduct precision viticulture outside of a research context; making valuable vineyard information available with minimal costs over time (Bramley, 2006). Adoption and integration of geomatics technologies into practice is a key factor for the future of precision practices (Lamb et al., 2008). However, there are multiple barriers to integration of geomatics in vineyard management that must be minimized and/or amended, including the exclusionary nature of technology, disconnect between technology and user, formal training required before using software and lack of clear policy for integration (Thomas and Sappington, 2009; Proffitt et al., 2006; Grieger and Armstrong, 2001). Historically, the process of adopting agricultural innovations, both in developed and dey~oping nations, was restricted by social, economic and political constraints; geomatics-related viticulture innovations were no exception (Sirnivasan, 2006). Thus, effective integration of a geomatics-based ST system must extend beyond the capabilities of the technology and consider the economic and social limitations to integration (Kitchen, 2008; Langhelle, 2000). Some of the major considerations to integration are cost; knowledge and availability of geomatics technologies and software; data collection and delivery methods; and willingness to redesign existing vineyard management strategies based on the geospatial information extracted using geomatics technologies (Proffitt et al., 2006; Grieger and Armstrong, 2001). In addition, the literature developing the methods and techniques for using geomatics technologies in viticulture are mostly academic in nature. Implementing PV can take years to design and perfect, as it is a cyclical process requiring data, technology and know-how (Proffitt et al., 2006). Outside of a res.earch context, a commercial endeavour is often required to maximize the benefit of the technology to a wider audience (Lamb et ai., 2008). Commercialization is not well documented in the literature since cost-effective and reliable methods of using geomatics technologies in viticulture are still under development. Since integration is such a key component of a successful ST system, and each vineyard has very specific needs, implementation will be further discussed in particular reference to the study site presented in this research study.
41 2.6 Conclusion 32 Spatial terroir provides a useful conceptual framework to structure the review of the application of geomatics technologies for within-vineyard management. Existing literature emphasizes that each study was unique, using different places, technologies, techniques and methods. The findings also vary but overall, the review ofpv literature finds that geomatics provides measurable benefits to the wine and grape growing industry. Many of the studies reviewed in this chapter demonstrated that geomatics contributed to a greater understanding of the variability that naturally exists in vineyards. It established the importance of using geomatics technologies to characterize vineyard variability, leading to more informed vineyard decision making. The following chapter will apply the spatial terroir conceptual framework to analyze the spatial variability at Stratus Vineyards.
42 33 Chapter 3 Characterizing Spatial Terroir at Stratus Vineyards 3.1 Introduction In this chapter, the conceptual diagram of spatial terroir (ST) that structured the review of literature related to characterizing vineyard spatial variability using geomatics technologies was applied to empirically characterize ST at Stratus Vineyards, a local winery in Niagara-on-the Lake, Ontario. Stratus Vineyards is focused on producing premium wines while reducing the ecological footprint of their agricultural operations. The overall goal of this study was to J investigate the application of geomatics technologies to geospatially analyze vineyard variability at Stratus, understood in this thesis as spatial terroir. There were two main objectives in order to achieve the goal. The first objective was to determine if there was any observed pattern (random, dispersed or clustered) in vineyard and grape composition variables that were known to influence grape quality. The vineyard variables of interest were soil moisture, leaf water potential (\ji), vine vigour and soil composition; and grape composition variables of interest were berry weight, Brix, titratable acidity (TA) and ph. The second objective was to determine if there was temporal consistency in the observed patterns. The patterns in vineyard variables were spatially and temporally analyzed both within each vineyard block and between the vineyard blocks. Characterizing ST at Stratus Vineyards is.!he focus of this chapter and the methodology follows the framework established from the ST diagram (Figure 3.1). This chapter began with a detailed description of the study site, justifying its relevance as an ideal site for this particular study and explaining the sampling method used. Next, GPS was used to mark vineyard sample vines and visualize the vineyard. This chapter also focused on the use of existing geospatial data to gain a better understanding of Stratus Vineyards. It was followed by the monitoring of this vineyard using field data, grape data and remotely sensed data that were collected during the 2008 and 2009 growing seasons. Next, spatial analysis techniques (e.g., spatial interpolation and spatial autocorrelation) were used to analyze the spatial variability between and within vineyard blocks. Lastly, this chapter considered how this information can be useful at Stratus Vineyards.
; thus, a more manageable study site is required.")
.")
43 34 Figure 3.1: Spatial terroir diagram for Stra1;6s Vineyards. 3.2 Place - Stratus Vineyards The importance ofpv approaches to vineyards in the Niagara wine region was established in Chapter 1. However, the Region's grape growing land is extensive with over 10,000 acres of grapes for wine production harvested in 2005 (Hope-Ross, 2006); thus, a more manageable study site is required. Stratus Vineyards, a 55 acre vineyard and winery in Niagara-on-the-Lake, Ontario, was selected for further study since it represented a manageable sized study site. Stratus is committed to responsible stewardship of the land and environmental sustainability (Stratus, 2009). The winery is LEED (Leadership in Energy and Environmental Design) certified and "committed to building on the existing foundations of quality-oriented pioneers and wineries in efforts to anchor Niagara as one of the world's great wine regions." Stratus, established in 2000, took over a mature estate with existing vineyards and also planted new varieties. The vineyard is a diverse mix of mature and young vines, red and white V. vinifera varieties and a contemporary management strategy with an Old World winemaker native of the Loire Valley in France. Stratus is part of a large contiguous block of vineyards located in the Niagara Lakeshore subappellation of the Niagara Region (VQA, 2009). This area is characterized by long gentle slopes, clay loam soils and deltaic sands (Haynes, 2006). The sub-appellation is moderated by the influence of Lake Ontario, contributing to long, consistent growing seasons and the production of full-bodied wines.

. However, there is still substantial variability that exists within and between the vineyard blocks at Stratus.")
44 35 The variability that exists at Stratus, in particular, and in the Niagara Lakeshore subappellation, in general, may not be as obvious as the variability that exists in other vineyards around the world. For example, the sizable vineyards in Australia or mountainside vineyards in Italy's Valle d' Aosta alpine terrain display obvious variability compared to that of an image of Stratus Vineyards (Figure 3.2). However, there is still substantial variability that exists within and between the vineyard blocks at Stratus. In addition, the vineyard represents an ideal study site given that the decision-makers at the winery (mainly the vineyard manager and the winemaker) recognize the potential of geospatial information to improve vineyard management while minimizing the impact of farm operations on the natural environment. However, like many agriculturists, they did not have the capacity to integrate geomatics technologies into their existing vineyard management system. Instead of tackling geospatial analysis independently, they agreed to be part of this research study that collected and analyzed valuable spatial vineyard information in order to obtain more detailed information to support their management decisions. Since Stratus did not have the resources or capabilities to employ geomatics technologies on their own, Brock University became an integral part of the place as well. The combination of Stratus (the vineyard) and Brock University (the research institution) was a collective place that makes the analysis of spatial terroir possible. " Figure 3.2: A photo taken in the vineyard at Stratus, illustrating gentle east facing slopes with relatively flat topography.

.")


45 3.2.1 Sampling Strategy 36 The sampling strategy used in the vineyard was important for the development of precision management. Stratus Vineyards is divided into multiple blocks containing close to a dozen V. vinifera varieties. All of the blocks are stringently managed and well maintained, and trained to a Scott Henry trellising system to maximize sun exposure, in order to produce the highest quality grapes possible (Smart and Robinson, 1991). The blocks analyzed in this study were two Cabemet Franc blocks - CF 1, CF2, and one Chardonnay block - CH 1 (Figure 3.3). CF 1 and CF2 were chosen for this study since they were the two largest blocks of the same variety at Stratus, enabling comparisons between them. CH 1 was chosen because it was the largest single block of the same variety at Stratus and thus were useful for characterizing ST over a large area with the same grape variety. Stratus Vineyards + N East and West Une Map created in 2009 by: Loris Gasparotto, Brock University Cartographer Figure 3.3: Map of vineyard blocks at Stratus Vineyards.
. In selecting sample points (i.e., vines) for further study within these blocks, a stratified random sampling")


46 37 Within these three blocks, sample vines were selected to collect vineyard and grape data. There were 112 data points (i.e., sample vines) in CF1, 96 data points in CF2 and 107 data points in CHI. These sample blocks differed in terms of their size, age and number of vines (Table 3.1). In selecting sample points (i.e., vines) for further study within these blocks, a stratified random sampling method was used as it "maintains a necessary randomness and overcomes the chance for an uneven distribution of points" (McCoy, 2005, 16). To assign sample points, every fourth row was sampled and every tenth vine therein. To mark a sample vine, an orange (and blue for every fourth sample) flag was tied around the trunk of the sentinel vine (Figure 3.4). All vineyard measurements and samples were taken on the east side of the row. The location of each sample vine created a uniform pattern (Appendix A); the orange points represent the sample vines and the blue points represent every fourth sample yine where additional field data were collected (these data were further discussed in the Field Data section below). Table 3.1: Description of Vineyard Block Characteristics. Block Area Perimeter I". Year Numbe.r Number Number of 1_% of Vines Name (ha) (m) Planted of Rows of Vines Samples Sampled CF , % CF , % CHI , % Figure 3.4: Flags used to mark sample vines; orange flag (left), orange and blue flag (right).
47 3.3 GPS - Visualize 38 Vineyard data points were linked to a geographic position on the Earth's surface, using a procedure known as georeferencing, using a GPS unit. Although there were readily available GPS units designed for daily navigation, sub-metre accuracies are required for data collection in the vineyard environment. A GPS with differential correction can enhance the accuracy of the location information through ground reference stations (Stafford, 2006). The sample vines, vineyard rows and sub blocks within Stratus were georeferenced using a Trimble GeoXT handheld GPS with differential correction. Location information is extremely important since subsequent data collected at each sample vine needs to be coupled with this information to facilitate mapping and spatial analyses. This one-time data collection provided latitude and longitude coordinates for the data points so the same vines coull be revisited throughout the growing season and across growing seasons. Collecting location data also proved to be useful for visualizing vineyard characteristics using readily available and free geospatial data. This step required no vineyard-specific data collection beyond location, providing a simple and cost-effective method of gaining detailed spatial vineyard information. The free data most useful to begin to characterize ST at Stratus Vineyards and the surrounding environment include digital elevation models (DEM), stream networks, local roads and land use. These data, coupled with the vineyard and sub blocks GPS data collected as part of the research study, was the foundation for more sophisticated spatial analysis. 3.4 Remote Sensing - Monitor Although management and operational practices - including trellising, pruning, fertilizer application, spray schedule, leaf pulling and bunch thinning - were widely accepted in the viticulture community to be key determinants of grape composition (Reynolds et al., 2007; Jones et al., 2006; Bramley, 2005; Coventry et al., 2004; Collings, 2003; Krstic, Leamon, DeGaris, Whiting, McCarthy and Clingeleffer, 2001; Gishen et at., 2001), this study focused on the underlying spatial characteristics and variability that affect grape composition, requiring the monitoring of the vineyard and grape characteristics. Vineyard monitoring was accomplished through the collection of field data and airborne remote-sensing data.
48 3.4.1 Field Data 39 There are several well-established vineyard and fruit compositional measures indicative of grape quality. Vineyard variables measured in this study included soil moisture, leaf water potential ('II), weight of cane prunings (vine size) and soil composition. Variables that are considered the major indicators of grape composition are: soluble solids (OBrix), berry weight, titratable acidity (TA) and ph (Bramley, 2005; Collings, 2003; Gishen et al., 2001; Krstic et al., 2001). To determine the spatial variability of the vineyard blocks at Stratus, variables were quantified using the equipment available through Dr. Marilyne Jollineau (Department of Geography) and Dr. Andy Reynolds (Viticulture Lab) at Brock University (Table 3.2). Table 3.2: Instruments Used to Collect the Field and Grape compos! Soil moisture Leaf water potential ("') Soil composition Measured: Volumetric water content as a percentage, with "standard mode" setting (versus the high clay mode) Instrument: Fieldscout Time Domain Reflectometry (TDR) 300 soil moisture. IL Measured: Bars of pressure Instrument: pressure bomb chamber, Model 3005 Plant Water Status Soil Moisture' Santa CA Measured: ph, organic matter (%); phosphorus, potassium, magnesium and calcium (ppm); and soil texture (% sand, silt and clay) at depths of 1-40 cm and cm Instrument: Soil collected at '-Food Lab. Measured: Weight of pruned shoots of seasonal growth Instrument: Portable scale Berry size Soluble solids COBrix) Titratable acidity (TA) Measured: Weight of 100 berry samples, calculated mean berry weight Instrument: Electronic scale, model SB3200; Mettler Toledo Canada, Mis' ON Measured: Percent by weight of Brix in the grape must Instrument: Temperature-compensated Abbe bench refractometer, model 1045 American' NY Measured: 5-mL samples titrated to an 8.2 endpoint with 0.1 N NaOH Instrument: PC-Titrate autotitrator Plus; model PC Man-Tech. ON Measured: Acidity or alkalinity in the must ph Instrument: Accumet meter model 25' Fisher Scientific Sources: Reynolds et al., 2007; Collings, 2003; Somers, 1998; Smart and Robinson, 1991; Ough and Amerine, 1988
49 Since primary data collection consisted of two stages (i.e., in the vineyard and after harvest grape composition analyses), requiring different data collection and processing procedures, the analysis was divided into 'Vineyard Variables' and 'Grape Composition Variables.' The following sections provided a description of the vineyard and grape compositional variables that were measured in this study Vineyard Variables Vineyard variables were collected in the field on two occasions during the 2008 growing season: August 22 nd and September 19 th Blocks CFl and CF2 were sampled on both dates but CHI was only sampled in September. During the 2009 growing season, vineyard variables were collected from all three blocks on July 8 th, July 28 th, August 1 ih, August? 1 st and September 15 th Vineyard variable data collection was conducted under clear sky conditions with average air temperatures> 20 C. A one-time data collection of soil samples throughout the vineyard from 2009, described below, were included in this study. Typically, the collection offield data took a full day to complete with a minimum of four people. On average, three measurements per vine were taken for soil moisture and two measurements were taken for leaf 'I' to reduce the margin of error. Soil moisture data were collected at every sample vine using a time domain reflectometry (TDR) device that measures the conduction of electrodes in the soil to determine the moisture content. Measurements were taken of the percent water by volume at a distance of 10 cm away from the base of the vine and a depth of20 cm into the soil. Three separate readings from each sample vine were taken and the mean was used i~ subsequent analysis. The 'standard mode' setting was used, rather than the high clay setting on the TDR device, due to the high percent of loam over clay identified from a regional soil survey (Kingston and Presant, 1989; Ontario Institute of Pedology, 1989). Soils playa significant role in vineyard variability, especially in regard to their associated water holding capacity (Storchi and Costantini, 2004; Hall et ai., 2002). The expected range of soil moisture values vary substantially due to soil composition and its water holding capacity as "soil properties can vary laterally over distances as small as several metres to tens of metres" (Hubbard et ai., 2006; 193). It was essential to incorporate small scale soil variability into precision viticulture practices (Haynes, 2006; Hubbard et ai., 2006).
50 41 Leaf water potential (\}') was another measure of vineyard moisture that was a more direct measure of water status than soil moisture since it determines the water (or water stress) in the vine leaf itself and not just in the root zone (Hubbard et al., 2006). It measures water tension in the plant xylem tissue. The values can vary significantly due to geographical and temporal influences but they provide a consistent measure ofleafwater potential (Hubbard et al., 2006). The interaction between the grapevine and moisture in the environment was important for fruit quality development (Acevedo-Opazo, 2008; Peterlunger et al., 2004). Water stress was linked to a decrease in vine and berry growth, increase in grape sugar and colour and better wine aroma and harmony in structure; as long as it was not too severe to impair the maturation process (Peterlunger et al., 2004). These data were collected at every fourth sample vine u~fng a pressure chamber Model 2005 Plant Water Status Console. A fully developed healthy leaf in full sun was cut from the sample vine and the leaf was placed in a pressurized chamber with the cut end sticking out of the chamber. Pressure was applied to the leafby opening the compressed nitrogen value and the negative pressure was measured when sap was released from the cut end of the petiole. This measurement was repeated three times at each sample vine and the average was used for further analysis. The more pressure that was required to release moisture indicates a higher instance of water stress on the vine. Absolute pressure values below 10 bars indicated no water stress where values from 10 to 16 bars suggested low, medium, and high water stress (Hakimi Rezaei and Reynolds, 2010a). Pruning weight was a good indicator of vine size, a key factor in grape quality (Bramley and Hamilton, 2004). The vine size can help define appropriate vineyard management zones (Reynolds et al., 2007). Although remote-sensing techniques can be used to assess vine size and/or vigour throughout the season, the cane pruning weight quantified the overall seasonal growth (Hall et al., 2003). Cane pruning weight data were collected for each vine in February 2009 and February 2010, respectively. A limitation of this method at Stratus was that the vineyard management strategy involved regular trimming of the vines and canopy throughout the growing season. Although the pruning from the seasonal growth of the canes was different than the canopy management pruning, it can still slightly affect the pruning weights of the canes at the end of the season.
51 42 Soil composition was analyzed at 43 sample locations throughout the vineyard, not just within the three sub blocks. The soil sampling was part of another research study being conducted at Stratus through the University of Guelph and the soil data were generously donated for use in this study. The sampling technique was based on the needs of the other study and thus, the sample locations were selected at regular intervals throughout the vineyard, known as systematic sampling. Each soil sample was collected at two depths: 1-40 cm and cm. The samples were analyzed for soil texture, which includes percent sand, silt and clay. They were also analyzed for composition, which included organic matter, phosphorus, potassium, magnesium, calcium and ph values. The literature suggests that soil composition, not just moisture, may be a key determinant of wine grape quality (Hubbard et ai., 2006; Gruber and Schultz, 2004; Storchi and Costantini, 2004). In addition to these soil tests, the soil inf<)rmation from the 1 : soil survey of the Regional Municipality of Niagara was included in the analysis, as it was the most detailed soil information publically available to date (Kingston and Presant, 1989) Grape Composition Variables Analyzing grape composition helps quantify key variables that are tied to wine quality (Hazak, Harbertson, Lin and Ro, 2004; Collings, 2003; Gishen et ai., 200 I; Krstic et ai., 200 I). The grapes were collected the day prior to commercial harvesting. Cabemet Franc requires a longer growing season than Chardonnay to produce mature, full bodied wines. In 2008 and 2009, CHI was harvested in late October and CFI and CF2 were harvested in mid November. Grape composition was analyzed in the viticulture lab at Brock University in December. The methods used were consistent for both the 2008 and 2009 grapes. During sampling, four grape clusters were taken from each sample vine. Clusters ranged in size from approximately 200 to 500 single berry samples from each vine; these were the recommended sample sizes needed to reduce the standard error (Ough and Amerine, 1988). Berry-to-berry variation can be significant within clusters and vines due to cluster distribution, sunlight exposure and harvest date (Krstic et ai., 2001). To account for berry-to-berry variation, the sample clusters were randomly selected for each sample vine; being careful to select from both sides, the top and the bottom trellis of the sentinel vine. The samples were placed in a ziplock bag with a label indicating the block, row and vine number from which the samples were drawn. The samples remained frozen at -25 C until they were ready to be analyzed.
52 43 The frozen grape samples were subsequently removed from the freezer, individually broken up and randomized so representative samples of the berries were taken from the clusters. One hundred grape samples were carefully counted, weighed and placed in a smaller zip-lock bag, labeled and placed back into the freezer before analysis began. Once all of the samples were prepared, approximately 24 samples (or less) were removed from the freezer at a time for analysis that takes approximately 8 to 10 hours to complete. The samples were placed in a 250- ml beaker, labeled and heated to 80 C using an Isotemp 228 water bath (Fisher Scientific, Ottawa, ON). Once the samples reached 80 C, they were kept at that temperature for 30 minutes to dissolve any precipitated tartaric acid that could influence subsequent testing (Ough and Amerine, 1988). The grape samples were cooled, homogenized in a juicer (Model 500; Omega Products, Harrisburg, P A) and clarified using an IEC Centra Cl(1 Centrifuge (International Equipment, Needham Heights, MA) to remove any remaining particles. The remaining tests were conducted with the grape must (grape juice). The must samples were analyzed according to the four indicators for grape composition: berry weight, Brix (sugar), TA and ph. Berry weight is an important variable to observe because the concentration of colour and flavour increases in smaller grapes, and the size of the grape contribute to the balance between quality and quantity (Gishen et al., 2001). It is important to observe the variation around the mean since "bunches with a mix of small and large berries have a lower potential for quality than those with uniform berry size" (Collings, 2003; 20). Soluble solids are an estimation of the concentration of sugar, expressed as the degrees by weight of sugar ebrix) in a solution (Collings, 2003; Robinson, 2006). It is also referred to as the Baume or total soluble solids (Collings, 2003). Titratable acidity (T A) is a measure of the organic acids that is measured by titrating the TA in grape juice using an alkaline solution to determine the concentration of hydrogen ions (Collings, 2003; OUgh and Amerine, 1988). High acidity levels are associated with cool climate regions, such as Niagara so monitoring the Brix/acid balance at harvest is essential (Collings, 2003). Also, smaller berries have a higher concentration of TA (Somers, 1998). ph is a measure of acidity or alkalinity in the must (Collings, 2003). This measure is often regarded as more informative than T A even thought there is no identified relationship between ph and TA (Ough and Amerine, 1988). The average ph of grape musts range from 3.1 to 3.6, with Chardonnay values centering around 3.3 to 3.4 (Haynes, 2006; OUgh and Amerine, 1988).
53 3.4.2 Remotely Sensed Data 44 The vineyard and grape data from Stratus Vineyards were supplemented with remotely sensed images. Dr. Ralph Brown from the University of Guelph collected aerial images on four occasions during the 2008 growing season and three occasions during the 2009 growing season. The imagery covered the visible (400 to 700 nm) and the near-infrared (700 to 1,400 nm) portions of the EM spectrum, at a spatial resolution of 40 cm. Where possible, field data collection was coincident with the acquisition of airborne imagery (Table 3.3). The imagery and data collection that most closely coincides with each other was August 21 st and August 22 nd (respectively) for the 2008 field season and September 1 st and August 31 st (respectively). Thus, the imagery dates of August 21 st 2008 and September 1 st 2009 were used for further image analysis. Table 3.3: Remotely Sensed Imagery and Field Data Collection Dates. May 28 July 1 July 29 August 21 August 5 September 1 In addition to the aerial imagery collected for this study, other images were obtained to support further analysis. Unfortunately, the desired QuickBird satellite image was not successfully obtained during the 2008 or 2009 growing season for the Niagara Region due to factors beyond the control of this study. The limitation of the aerial imagery compared to satellite imagery was that multiple tiles were required to cover all of Stratus, whereas satellite imagery could have provided a quick snap-shot of the vineyard in one image scene. An


 with a 10 metre spatial resolution acquired on July 22 nd, 2007 and airborne image (right) with a 40 cm spatial resolution acquired on")

54 45 advantage of aerial imagery was its superior spatial resolution compared to satellite imagery (Figure 3.5). The satellite imagery used in this study was a SPOT metre multispectral satellite image that included green, red and near-infrared bands. The image was acquired on July 22 nd,2007. A panchromatic aerial image with a 10-cm spatial resolution, acquired by the Regional Municipality of Niagara in June 2006 and provided through the Brock University map library, was also used as a background for multiple maps. Figure 3.5: SPOT -5 satellite tmage (left) with a 10 metre spatial resolution acquired on July 22 nd, 2007 and airborne image (right) with a 40 cm spatial resolution acquired on August 21 S\ Both images show the northern portion ofthe CHI block at Stratus Vineyards with the sample vines overlaid. The aerial images collected throughout the growing season were processed using imageto-image registration to correct for geometric distortions and to geographically reference images. The process was completed using software designed for processing and analyzing geospatial imagery, ENVI 4.4. Ground control points were used, along with corrected images containing known and registered ground control points, to rectify the raw images. The exact coordinates of known objects in the image (i.e., NW post for block CFI) were identified using the North
55 American Datum 1983 UTM Zone 17N projected coordinate system and registered to the raw image. Registration was necessary to establish the exact spatial orientation and position of the images, relative to the ground (Lillesand, Kiefer and Chipman, 2004). This ensured that the images were ready for further processing, including overlay with other geospatial data. The normalized difference vegetation index (NDVI) is commonly used to monitor largearea vegetative areas. The calculation is sensitive to the incidence and condition of vegetation, making it ideal for the monitoring of vineyard vegetative growth and vigour (Hall et al., 2008; Hall et al., 2002). NDVI was calculated using the spectral bands from the near-infrared (NIR) and red portions ofthe electromagnetic spectrum, as follows: NDVI = NIR - RED NIR + RED The images used to compute NDVI were August 21 st, 2008 and September 1 st, ENVI4.4 image processing software was used to create the NDVI images, transforming the aerial images into vegetation indices. The input file types were the red and NIR band with a floating point output data type. To be compatible in the ArcGIS environment, the file was saved as an ESRI grid file. The index values represented in the NDVI was a good indication of vegetative vigour within the vineyard, as vegetative areas yield high index values due to the high NIR reflectance and low red reflectance of vegetation. Also, healthier and/or denser the vegetation result in higher index values, closest to + 1. In contrast, non-vegetated features such as water, snow and clouds have very low NIR reflectance and higher red reflectance, yielding an index value closer to -1 (Lillesand et al., 2004). Soil and exposed rock have similar NIR and red reflectance values and produce index values near zer6. Thus, the NDVI values produce an image that was useful in the interpretation of vine vigour (Hall et al., 2008; Hall et al., 2003; Hall et al., 2002). The vineyard, grape and remotely sensed datasets was the foundation for further geostatistical analysis GIS - Analysis GIS was used to complete a statistical and geostatistical analysis of the field data collected. Analysis of the ST within a vineyard required a lot of information; including location, soil moisture, soil composition and grape composition. An inventory of data helped organize the data for further statistical analysis (Table 3.4).
56 Table 3.4: Inventory of Geospatial Data Collected for Stratus Vineyards. 47 GPS Vineyard Variables Grape Composition Variables Remote Sensing General Data Location points for sample vines Boundaries for blocks CFl CF2 and CHt Soil moisture Leaf water potential Pruning weight Soil sition Berry weight Brix ph Titratable Aerial images from 2008 and 2009 field seasons SPOT 5 image from 2007 ( Panchromatic aerial images from 2006 elevation model from 2006 Streams and river network Road network Land-use/land-cover Descriptive Statistical Analysis In this study, initial statistical analyses included measures of central tendency and measures of dispersion. Measures of central tendency are concerned with the average of the data and measures of dispersion help determine the spread and variability of the data (Rogerson, 2001; Ebdon, 1990). The measures of central tendency calculated in this study provided an indication of the typical values associated with each block. The measures of dispersion characterize the variability of the dataset, providing a good indication of the spread of values within and between vineyard blocks. Mean, median, mode, minimum and maximum identify, respectively, the average, middle value, most frequently occurring value, minimum value and maximum value in the dataset (Rogerson, 2006; Ebdon, 1990). Range provides a measure of the difference between the minimum and maximum value. Variance calculates the mean of the squared deviation while standard deviation - the more commonly used measure of dispersion - was the square root of the variance (Ebdon, 1990). Skewness and kurtosis were concerned with the shape of the distribution; where skewness measures the concentration of values on either side of the mean and kurtosis measures the concentration of values relative to frequency distribution (Ebdon, 1990).
57 48 Overall, the descriptive statistics were useful to understand the characteristics of a very large dataset and facilitated appropriate method choices for further analyses. They were also useful in identifying and reducing erroneous data entries before further analyses, making it easier to identify extreme high or low values that might be incorrectly reported. The descriptive statistics provided a good summary of the sample data, forming the basis of further geospatial analysis. To conduct descriptive analysis, the data were entered and organized in Microsoft (MS) Excel spreadsheets. The descriptive statistics were calculated separately for each dataset, organized by data type, block and date (if relevant). For variables where multiple measurements were taken, the calculations were made from the average value. For example, since soil moisture measurements were taken a minimum of three times per sample, the average value was calculated and used for further analysis. The data were statisti~~ly analyzed in Excel before being converted into GIS-compatible files Spatial Statistical Analysis After gaining descriptive insight into the data, examining the spatial relationships within and between blocks helped quantify the ST of the vineyard. The purpose of looking at these data spatially was to understand the pattern in the vineyard variables and grape characteristics. Past vineyard studies use GPS, remote sensing and GIS but no studies, to date, have explicitly examined the spatial pattern of the data using spatial autocorrelation. Spatial statistics (or geostatistics) were used to determine if there was a measurable and significant pattern in the spatial variability of both vineyard and grape composition variables. This provided a better indication of the likelihood of the 9bserved pattern being a result of a process, rather than just random. In addition, analyzing the data spatially made it easier to compare patterns between and within blocks over time and revealed new information that was not apparent in the original dataset. The types of spatial statistics used in this study were spatial interpolation and spatial autocorrelation. These two statistics were used to first, visually assess the pattern and second, quantify the pattern in the vineyard and grape composition variables. The data were imported into ArcGIS from MS Excel files containing both the vineyard and grape data, and the latitude (y) and longitude (x) coordinates that were collected using a GPS in the field. In order for the database to be used spatially (i.e., capable of mapping), x, y were assigned to a spatial reference in ArcGIS. The data were collected using latitude and longitude,
58 49 which was a geographic projection. Although the geographic coordinate system was suitable for mapping variables, the data needed to be re-projected from a geographic (lat/long, measured in degrees) to a projected coordinate system (i.e., a Universal Transverse Mercator or UTM projection, measured in metres) to obtain accurate geostatistical results. Geostatistical calculations were based on either Euclidean or Manhattan distance and required projected data to accurately calculate based on measured distances on the Earth's surface (Wong and Lee, 2005). The data were divided into datasets according to date collected, block and variable. The analysis was conducted on each file separately to examine the spatial pattern of each dataset individually, to facilitate comparisons both within and between blocks over time Spatial Interpolation The purpose of spatial interpolation was to transform point data into a continuous surface to estimate the values in the entire block, rather than just analyzing the sample points. This allowed the data to be visualized for the entire block so conclusions could be inferred about the population from the sample. There were multiple techniques to interpolate point data based on variable values (see Chapter 2). Each technique can have a profound impact on the result. Based on the literature review, the two main techniques used to spatially interpolate vineyard point data were inverse-distance-weighting (ldw) and Kriging. In order to determine which of these two interpolation methods were most effective for this study, given the software available, trials were run to assess the two techniques. Although the general pattern produced by the two techniques was similar, the IDW technique placed too much weight on the location of data points, rather than the value ofthqse data points (Figure 3.6). Note that these images have different resolutions as a result of the differences in the IDW versus Kriging interpolation technique. Since the sampling method was pre-determined, the weighting of the data points was less relevant to the analyses. Thus, the Kriging technique of interpolation was the most appropriate method for this study since it produced a result that minimized the influence of sample location. Interpolation was conducted separately for each sub block and for each variable so the distance between the blocks did not influence the Kriging algorithm. Since interpolation created a square raster, the interpolated data were individually clipped to the boundary of the block. The datasets interpolated were soil moisture, leaf'll, soil composition and the grape composition variables.


.")
59 50 Figure 3.6: Comparison between the IDW (left) and Krigin~ (right) interpolation techniques for soil moisture on September 19 t, Spatial Autocorrelation In this study, spatial autocorrelation was applied to the vineyard variables. It was a quantitative statistical technique for analyzing correlation that was relative to distance (Miller, 2004). Measuring spatial autocorrelation was an approach that considered the variables or characteristics of the points in the analysis, not just the pattern of the location of the points (Wong and Lee, 2005). Spatial autocorrelation was useful for variables that fluctuate synchronously over wide geographical areas (Koenig, 1999). Thi.s analysis was concerned about 'within' block variations of feature locations and variables associated with it; known as marked point patterns (Rogerson, 2001). Using spatial autocorrelation, it was possible to measure the pattern the vineyard variables exhibited. It was a measure of the degree to which a set of spatial features and their associated data values were clustered (positive spatial autocorrelation), random (no spatial autocorrelation) or dispersed (negative spatial autocorrelation) over space (Robinson, 2001). Positive spatial autocorrelation was an indication that the spatial pattern resulted from a significant dependence among the variable in space.
60 Multiple techniques were available to analyze spatial autocorrelation. This study used the Moran's Index spatial autocorrelation technique because it considered the values of the variables (rather than the location ofthe variables) and was most readily available in the software available. Moran's Index can be calculated using global Moran's I and local Moran's h Global Moran's I was a single measure for the entire dataset where local Moran's Ii measured each point in the dataset. The global result was an overall indication of the pattern for the dataset (i.e., CFl on September 15, 2009) while the local result was more detailed and helped identify hot spots and outliers by analyzing each data point. Global Moran's I was calculated on each dataset where local Moran's Ii was calculated only (due to time constraints) on variables that exhibited high global spatial autocorrelation. ( Global Moran's I was calculated on each of the 51 datas~ts using ArcGIS and generated the Moran's index, the expected index, associated variance, z-score, p-value, associated pattern and significance level for the entire dataset. The null hypothesis for each variable was that there was no pattern to the arrangement of the values associated with the geographic features in the study area. If the z-scores fell outside of the desired confidence level, the null hypothesis was rejected; indicating that there was a pattern to the variables. The advantage of Moran's index was that it determined the direction of the pattern, either as clustered or dispersed. When the z score indicated statistical significance, the pattern was either clustered or dispersed (Rogerson, 2001). A Moran's I value near + 1 indicated clustering while a value near -1 indicated dispersion (Wong and Lee, 2005; Unwin, 1996). It was used to determine, for example, if the Brix values from sample vines in CF 1 on September 22, 2008 were clustered, dispersed or random. This was helpful information in determining the overall pattern of the individual blocks and to compare blocks over time. Subsequently, local Moran's Ii was used on variables that produced positive global spatial autocorrelation results in order to further understand the pattern indicated by global autocorrelation. Local Moran's Index maps the clusters and hot spots for each point in the dataset (Smith et at., 2007; Ord and Getis, 2000). Given a set of weighted features, the cluster and outlier analysis tool in ArcGIS identified clusters of features with values similar in magnitude and spatial outliers. The data was represented using graduated colours grouped into classes to quantify the difference in the z-score between the points. These data points were 51
61 52 useful to overlay on the interpolated data of the same data. It helped detennine and explain the significance of the pattern observed during interpolation. The spatial autocorrelation tools available in a GIS environment were capable of handling the range of data and mass amounts of spatial infonnation to conduct a vineyard study. The spatial analysis techniques used in this study infer from the sample to the larger population from which the sample was drawn in order to learn more about vineyard and grape variables. 3.6 Chapter Summary Characterizing the spatial terroir within and between vineyard blocks, as well as over time, required the use of GPS, remote sensing and GIS to visualize, monitor and analyze vineyard variables. This chapter provided a detailed methodology and ju~fication for the methods used -, to characterize the spatial terroir ofthree vineyard blocks at Stratus Vineyards. GPS was used to visualize vineyard data, establishing important location infonnation for subsequent monitoring and analysis. Field data and remotely sensed data were used to continuously monitor the vineyard. The field data collection occurred both in the vineyard throughout the growing season and in the harvested grapes, with variables collected relating to vineyard characteristics and grape composition. The remotely sensed monitoring was aerial imagery collected during the 2008 and 2009 field seasons. These GPS and remote sensing vineyard data were the basis for the spatial analysis, facilitating descriptive and spatial statistical analysis. The geostatistical analysis was conducted using the spatial interpolation and spatial autocorrelation methods. Based on these methods, ST can be characterized for the selected study area. The following chapter presei).ts the results of the characterization of ST at Stratus.
62 53 Chapter 4 Results and Discussion of Characterizing Spatial Terroir at Stratus 4.1 Introduction Establishing a framework for spatial terroir provided a structure that facilitated the spatial analysis of variability within a vineyard and between vineyard blocks over time. The ST conceptual diagram structured the literature review on the use of geomatics technologies in viticulture in Chapter 2 and structured the methods for the characterization of spatial terroir at Stratus Vineyards in Chapter 3. This chapter presented the results and discussion of the,t characterization of ST. Since the overall goal of this study was -to investigate the applications of geomatics technologies to geospatially analyze vineyard variability at Stratus Vineyards (known as spatial terroir), the results section presented the characterization of each vineyard and grape composition variable. Building on the location information, each variable - soil moisture, leaf\j1, vine vigour, soil composition and grape composition - was analyzed statistically and geospatially to characterize the variability ofthat variable within and between vineyard blocks to determine if there was an observed pattern; and assessed the temporal stability of the variability using the data collected over time. The patterns of variability in vineyard and grape composition variables, with particular emphasis on the importance of soil moisture, were quantified. The limitations of this study were also discussed with particular emphasis on data collection procedures. The benefits and challenges to inte~~ting ST at Stratus with specific attention on the capability of ST to inform vineyard management decisions were also discussed. 4.2 Analysis of Spatial Terroir at Stratus Vineyards Spatial terroir was designed to build a more comprehensive understanding of the spatial variability in the vineyard, starting with the location infonnation. The GPS unit used to collect the location information used differential correction in order to obtain sub-metre accuracy and provided accurate enough location infonnation to use as a foundation for the analysis of ST. Before analyzing the specific vineyard and grape composition variables, it was important to build on location information using the spatial information readily available, such as digital elevation
63 models, road networks, local streams and water bodies (Appendix B). This map, and particularly the elevation information, highlighted the importance of using geomatics technologies to extract information about less obvious variations so vineyard management accounted for those differences. For example, the topographic variations at Stratus were barely discernible (see Figure 3.2) but the map revealed a seven metre elevation range; conveying information related to the slope, aspect and angle and the general topographic features including the location of high points and river banks. This geospatial information had the potential to lead to changes in management related to irrigation (although less relevant at Stratus), location and position of drainage tiles, grape variety choices and general precision management strategies. Beyond the vineyard boundaries, this information revealed local streams and other J natural features that share the same ecosystem as the vineyard, such as two adjacent rivers that run parallel to the vineyard rows. Understanding the vineyard in relation to the surrounding environment can increase the vineyard manager's capacity to make informed management decisions that potentially contribute to environmentally sustainable practices within the vineyard (see Chapter 2). Basic topographic information and surrounding land use/land cover information, combined with location information collected in the vineyard, began the characterization of ST at Stratus Vineyards. Adding more detailed vineyard and grape composition information to the location information enhanced the characterization of ST at Stratus Vineyards. The next sections presented more detailed analyses of information related to the spatial and temporal variability of vineyard characteristics and grape composition variables; including soil moisture, leaf'l', vin~ vigour, soil ~~mposition and grape composition Soil Moisture Soil moisture was used to infer information related to overall water availability in the vineyard. First, descriptive statistics were used to summarize the data (Appendix C) and provided information related to the variability of soil moisture between blocks and over time; and to some extent, the variability within the block. All of the soil moisture datasets were normally distributed. Within each block, the soil moisture values were consistently higher for CF2 than CFl, except for one sampling date on July 8 th 2009 where CFl and CF2 had similar values. CFl had a lower range, variance and standard deviation than that of CF2 and CH I, indicating more 54
64 uniform soil moisture. Interestingly, the lowest levels of soil moisture measured in CFl coincided with the highest elevation values. Between the blocks, the range of soil moisture values varies significantly with a low of 7% to a high of 52%. The average soil moisture values were different, with an overall average from all data collection dates of22% for CFl, 28% for CF2 and 25% for CHI. As for the fluctuation in soil moisture over time, the average values did not consistently increase or decrease over time for any block. However, the average values for soil moisture most often increased or decreased from the previous data collection date consistently across all blocks; meaning the average 2009 soil moisture values from July 28 th were higher than August 17th, August 17th was lower than August 31 st and August 31 st was higher than September 15 th in all blocks. This indicated that the values increased or decreased from the previous data collection date in synchronization with t~ other blocks, even though they contain different central tendency values. Thus, the factors that influence soil moisture values (i.e., rain or lack of rain) influenced all of the blocks uniformly. In order to further investigate the variation of soil moisture within vineyard blocks, the data were mapped. The proportional symbol technique provided a general indication of the variation both within and between the blocks (Appendix D). This map illustrated that the soil moisture in CF2 was greater than the soil moisture in CFl, a finding already revealed from the descriptive statistics. To get the most detailed understanding of the variation within the blocks over time, these data were mapped via spatial interpolation to reveal the variability within the blocks and over time (Appendix E, F and G for CFl, CF2 and CHI, respectively). Since the interpolated maps showed soil moisture by block, it helped predict the temporal stability of the.. variability in soil moisture. The soil moisture maps exhibited a significantly clustered pattern that was stable over time for each block. The clustered pattern present in soil moisture was consistently highest in the northern portion of both blocks CFl and CF2. The direction of the patterns in soil moisture was consistent with the elevation range within the vineyard. The spatial pattern visible for soil moisture in CHI was not as obvious or consistent as that displayed in CFl and CF2, though all blocks warranted the testing of the significance of the pattern using spatial autocorrelation. 55
65 56 Spatial autocorrelation was measured using Moran's 1. Using this technique, the null hypothesis was that there was a random spatial pattern measured in the soil moisture variable. The null hypothesis was rejected if a pattern (either clustered or dispersed) was detected for soil moisture and then was verified to be significant based on the z-score (Wong and Lee, 2005). Moran's I produced a value for the entire block. Overall, each vineyard block at every data collection date illustrated significant clustering of values, with a 0.01 significance level (Appendix H). Where Moran's index values near indicate clustering while index values near -1.0 indicated dispersion, soil moisture values were all above 0.3 with one as high as Although CFI and CF2 illustrated the most obvious visual clustering pattern via interpolation, CHI returned the highest Moran's I values verifying spatial clustering. Since the global measure for spatial autocorrelation returned significant clustering, 10cal.t;.1oran's Ii was applied to soil moisture data to detennine if the clustered pattern resulted from outliers or from a quantifiable spatial pattern. To further understand the variability of the soil moisture pattern, local Moran's index was applied to identify potential hot spots and outliers. The local Moran's Ii helped explain the clustering in soil moisture since it produced a Moran's index value for each data point, rather than one for the entire dataset. The result returned by the local Moran's index, overlaid onto the interpolated image, identified if the clustered pattern visible was the result of hotspots of similar values (measurable cluster) or ifthere was an outlier influencing the result (Appendix I). Moran's Ii indicated that the visible clusters in the northern portions of both blocks efl and CF2 from August 22 nd 2008 and August 31 st 2009 were the result of a hotspot (identified by circles on map) rather than an outlier. There were some outliers in the image that were identified by values with a z-score significantly different than the surrounding values; i.e., north-east side of CF2 in 2008 (identified by arrow on map). However, the vast majority of results contained similar z scores grouped together. This indicated that the clustering observed in soil moisture during the 2008 and 2009 field season was significant and not caused by outliers. This can have implications for the future predictability of soil moisture in subsequent years, especially if drought conditions are present and irrigation is required.
66 4.2.2 Leaf Water Potential ('P) 57 The absolute values for leaf 'I' were used; the higher the value, the greater the degree of water stress. The descriptive statistics for the leaf 'I' indicated the average value in CFl was 7.3 bars, CF2 was 8.2 bars, and CHI was 7.1 bars (Appendix J). These values indicated that there was no water stress on grapevine leaves, as water stress typically occurs at greater than 10 bars (Hakimi Rezaei and Reynolds, 2010). The highest average leaf 'I' values for CF2 coincided with the highest average for soil moisture. Over time, leaf 'I' fluctuated irregularly with no consistently increasing or decreasing trend within a block or between the blocks throughout the growing season. Also, the fluctuation did not coincide with the variability in soil moisture data over time. The values had a small range, variance and standard deviation. The leaf 'I' results were a more direct measure of overaw~ater status than soil moisture but had a labour intensive and time restricted data collection method. The pressure bomb data collection technique required the leaf to be in full sun prior to measurement and could only occur two hours before or after solar noon. This limited time frame for accurate data collection resulted in leaf'l' only being measured at every fourth sample vine. Since the sampling strategy ofleaf'l' was different than the other variables, the other variables were not directly comparable. Spatial interpolation of leaf 'I' using the same Kriging method that was applied to the soil moisture, soil composition and berry composition datasets produced an erroneous pattern when applied to leaf '1'. Thus, due to sparse distribution of sampling points, spatial interpolation was not a suitable method of analysis for leaf '1'. A suggestion for future data collection would be to sample a smaller area at the same interval as other data so all of the datasets can be accurately analyzed and compared. A denser sampling strat~gy, preferably matching the sampling strategy of other vineyard variables, would facilitate better comparisons between leaf 'I' and the other data collected. Since interpolation was not an effective spatial analysis technique for leaf '1', the mean leaf 'I' values were calculated for all of the data collection dates combined to see if any clustering could be detected (Appendix K). There is no immediately obvious clustering of values, like there is in the soil moisture proportional symbols map (Appendix D); however, there is a clear difference in values between CFl and CF2, with CFl having consistently lower leaf 'I' values. This indicated that leaves in CF2 were experiencing greater likelihood of water stress, although
67 58 no values are in the water stress range. The leaf,!, in CHI was much below water stress levels without displaying a consistent pattern to the variation of values, except for a ridge of higher values running the length of the block. The Moran's I indicated there was a random to dispersed spatial pattern to the leaf,!, data (Appendix L). CF1 had a dispersed spatial pattern with significance levels that ranged from 0.01 (28-Jul-09, 17-Aug-09 and 31-Aug-09) to 0.05 (22-Aug-08, 18-Sept-08 and 8-July-09) and one data set with only a 0.10 (15-Sept-09). The CF2 Moran's Index returned results identifying mostly random patterns and few dispersed patterns with only a 0.10 significance level. Moran's I for CHI confirmed a significant (0.01) dispersed pattern for every leaf,!, data collection date. The results from leaf,!, did not identify significant patterns like the results from soil moisture, but still revealed differences between CF 1, CF2 and CH 1. \ t Vine Vigour Vine vigour was measured using pruning weight and NDVI. Pruning weight was a measure of the weight of seasonal growth pruned during the winter months. Upon inspection of the data from the descriptive statistics (presented with descriptive statistics for the grape composition in Appendix Q), the pruning data from 2008 and 2009 have extremely different values. The pruning weight data had the largest variability within the blocks and over time, with the highest range and standard deviation, prompting more detailed inspection of the raw data and results. The pruning weight average for CF1 was 480 grams in 2008 and 39 grams in 2009; CF2 was 762 grams in 2008 and 39 grams in 2009; CHI was 700 grams in 2008 and 32 grams in Two different scales were used in 2008 and 2009 but this equipment di.fference would not cause a difference up to 500% between the 2008 and 2009 pruning data. Some of the inconsistencies in the pruning data could be attributed to the substantial pruning and canopy management that occurred at Stratus throughout the growing season. However, since the data inconsistencies could not be explained or corrected, the pruning data was removed from further analysis. Thus, the aerial imagery was used to produce a NDVI, which was also a measure of vine vigour. The advantage ofndvi over ground measurements was its ability to provide a quick snap-shot of the variability in vine vigour (Appendix M). The aerial images did not cover the entire vineyard but still provided enough information to characterize vineyard variability. The most noteworthy trend was the pocket oflow vigour in CF2 (circled in yellow) that coincided
68 59 with low water status in the interpolated soil moisture maps (Appendix F). This area of low vigour was associated with lower soil moisture. The overall vigour within and between CF1, CF2 and CHI illustrated subtle variation, with consistently high vigour in CF1 compared to CF2. Although no definitive conclusion can be made about the association between vigour and soil moisture, the information available in an NDVI map provided the vineyard manager with at-aglance vigour information. NDVI was also used to make direct comparisons between blocks over time, as illustrated using block CHI (Appendix N). To interpret the NDVI results, it was helpful to look at the high and low values around CHI to understand the variation within the vineyard. Other land uses appeared to have a much higher or lower NDVI value and helped better assess the vine vigour and health of the vineyard. The vineyard block just south of C~(l appeared very dark in the image with NDVI values averaging around zero, compared to the study block, especially in These values were associated with a bare field that was newly planted during the 2008 field season, exposing mainly soil, young vine trunks and shoots with very little vegetative growth. In comparison, to the north-west ofcf1, there were very high NDVI values associated with a healthy forest canopy. In comparison to the new planting to the south and the forest to the north-west, the NDVI values for the CHI block displays a variation of values ranging from 0.1 to 0.6, represented by a myriad oflight and dark tones. This illustrated substantially more vigour than the new planting but much less vigour than the forest canopy. When looking within CH 1, there were subtle variations in the vigour throughout the block that confirm the presence of variability in the vineyard Soil Composition Existing literature suggested that soil composition, not just moisture, was a key determinant of grape quality (Hubbard et al., 2006; Gruber and Schultz, 2004; Storchi and Costantini, 2004). According to Old World viticulturists, incorporating small scale soil variability into management can lead to increased quality (Reynolds et al., 2007; Hubbard et al., 2006). New World viticulturists, on the other hand, place less emphasis on soil but still consider it a medium that impacts vine growth and vigour (Reynolds et al., 2007). Understanding the soil composition based on the national soil survey provided a good impression of the characterization of the soil both within and surrounding the vineyard. This information included a generalized summary of
69 60 soil characteristics; including drainage, parent material, classification and texture. The main soil compositions identified at Stratus (from highest to lowest quantity) are: Beverly, Vineland and Tavistock (Appendix 0). Beverly soil was classified with a silt loam texture (SIL), with parent materials that were primarily lacustrine silty clay with imperfect drainage. Similar to Beverly soil, Vineland soil had imperfect drainage, but the parent materials were mainly reddish-hued lacustrine fine sandy loam and very fine sandy loam. The texture of Vineland soil was classified as very fine sandy clay loam (VFSCL). The Tavistock soil was primarily loamy (L) texture over lacustrine silty clay, with imperfect drainage (Niagara Soils, 1990; Kingston and Presant, 1989; Ontario Institute of Pedology, 1989). The location ofcfl was primarily contained by Beverly and some Vineland soil, CHI was contained entirely by Vineland soil, and CF2 contains Beverly, Vineland and Tavistock soil. CF2 contains the greatesr'variability in soil composition and CHI was the most uniform. These data were limited in detail because they were compiled based on a 1 : scale soil surveys and contain soil boundaries that were only approximately located (Kingston and Pres ant, 1989). A more detailed analysis of soil composition was achieved by analyzing the Stratus specific soil samples. The soil samples were measured to a depth of 40 cm below the surface and the percent sand, silt and clay were spatially interpolated to provide a better understanding of the variation in soil composition (Appendix P). These data supplement the 1 : Niagara soil survey maps; providing more detailed soil information than what was previously available. The distribution of clay appears to be most uniform throughout the entire vineyard, with increasingly higher percentage of clay in the northern portions of the vineyard. Sand and silt display more variability throughout the vineyard. CHI contains the highest levels of sand compared to CFl and CF2 that appears to have more uniform sand distribution. There were high levels of silt in CFl with a very obvious strip of high silt soil intersecting CFl. Conversely, there were very low percentages of silt in CHI and moderate, but consistent, levels in CF2. This variability in soil composition not identified from the national soil survey helps to better understand the influences on the grape production at a large, more detailed scale. The differences in soil composition and texture can impact the ideal grape variety, trellising system and, in general, future management decisions.
70 4.2.5 Grape Composition 61 Analyzing grape composition variables can provide information related to how the natural variation of terroir affects the grapes produced. The descriptive statistics for the grape composition were organized according to variable by year, so direct comparisons could be made between blocks and within blocks over time (Appendix Q). The grape composition values were normally distributed. The mean berry weight did not consistently increase or decrease from 2008 to 2009, although the Cabernet Franc blocks had more similar values based on the variance and standard deviation. From 2008 to 2009, the Cabernet Franc grapes were, on average, larger while the Chardonnay grapes were smaller. In the Cabernet Franc blocks, the berry size was inversely related to the Brix values and as berry size increased, Brix levels decreased. This indicated that the larger the grape, the lower the concentration of sugars. The Brix values between blocks had substantial differences in the range of values; for example, the mean Brix levels were 24.6 and 22.6 for CFt, 25.6 and 21.6 for CF2 and 23.7 and 22.9 for CHI (respectively for 2008 and 2009). Interestingly, the Brix levels from 2008 were higher than that of2009 and the TA levels from 2008 were consistently lower than 2009, although the Brix levels between CFt and CF2 were only slightly different with less than one Brix difference. The results for ph demonstrated very little variability within or between blocks, although the values for the Chardonnay grapes were higher than the ph of the Cabernet Franc grapes. The spatial interpolation of grape composition data - Appendix R, S and T for CF I, CF2 and CHI, respectively- allowed for the visual assessment of the grape composition data that contributed to vineyard variability. Brix, TA and ph all displayed signs of variability, while CFI and CF2 demonstrated the strongest occurrence ~f spatial clustering. CFI and CF2 showed a similar distribution of 'pockets' of high and low values for Brix, TA and ph. CHI did not have obvious similarities in the pattern of distribution for Brix, T A or ph. For spatial autocorrelation, the null hypothesis was that there was no pattern to the arrangement of the grape composition values associated with the geographic features in the study area. Moran's I for berry weight, Brix, T A, and ph confirmed that the grape composition variables displayed no consistent pattern across CFI and CF2 or CHI and in most cases returned a random result (Appendix U). There was not a consistent pattern identified in any ofthe grape composition variables. CHI contained the most random and dispersed patterns, where CFI and
71 62 CF2 were equally represented by clustered or random patterns without any dispersed patterns in the spatial data. Overall, the grape composition variables do not spatially correlate with each other and the null hypothesis could not be rejected. Since there was no consistent pattern in the grape composition variables revealed using Moran's I, local Moran's Ii was not applied to the berry composition data. 4.3 Importance of the Pattern in Vineyard and Grape Composition Variables The benefits of geomatics extend beyond its capacity to capture, store, analyze and display spatially related vineyard data (Delaney and Van Niel, 2007; Robinson, 2006; Wade and Sommer, 2006). GIS enabled the collection and maintenance of a large quantity of vineyard information, visualize and simplify complex data, produce high ~Quality maps and create new information from existing data. These data, combined, built a better understanding of the variation within the vineyard. The base data provided the vineyard decision-makers with improved spatial knowledge of the vineyard, from basic topographic information (such as elevation) to surrounding land cover and land uses. The results of the spatial analysis added to the information already known about the vineyard by providing more detailed estimates of the variability in the vineyard and revealing patterns in vineyard and grape composition variables. Overall, all variables returned results that demonstrated variability within blocks, between blocks and over time, revealing information related to the patterns in the vineyard. These patterns were most notable in soil moisture, displaying the most obvious and stable spatial and temporal pattern. Interestingly, the soil moisture values indicated that CF2 was perpetually -, wetter than CF I but had leaf '" values that indicated CF2 had a higher tendency toward water stress than CFt. These findings seem to contradict each other, as one would associate higher soil moisture values with a decreased probability of water stress. More data are required before these findings can confirm the relationship between the leaf", and soil moisture. In general, leaf '" results did not demonstrate the same consistency as the soil moisture data. This again could be attributed to the difference in sampling strategy or challenges associated with data collection. In addition, leaf", can be strongly influenced by trellising system since minor modifications to the vine can increase or decrease the water demand (Reynolds and Vanden Heuvel, 2009). Thus, the difference in the trellising systems between CFI and CF2 (Scott Henry) and CHI (Lenz Moser)
72 63 could have caused substantial differences in measured leaf,!,. Before stronger conclusions can be drawn from leaf,!" more data will be needed. Although all of the variables helped characterize the ST at Stratus, the clustering of the soil moisture variable for each block and over time was consistent and displayed obvious patterns using descriptive statistics, spatial interpolation and spatial autocorrelation; revealing information about the vineyard that was not easily detected on the ground. Researchers spent hundreds of hours in the vineyard collecting data and no obvious pattern to soil moisture was detected by way of visual observation (also known as ground scouting). The presence of moisture in the soil was obvious from ground scouting but it was not possible to identify any pattern within or between the vineyard blocks. In addition, ground scouting was limited to.t observing conditions within the rows but not across the rows, rriaking it difficult to detect patterns in the entire block, especially in vineyard rows at Stratus that can be > 500 m in length. The temporally stable clustered pattern displayed in the soil moisture data was of greatest interest, as the findings were relevant to the long term management plans at Stratus. Knowing the grapes produced from CF2 have a consistently higher level of soil moisture throughout the growing season can influence the management strategy. Grape quality may be directly related to water availability and management strategies need to control for the detrimental effects of too much or too little moisture throughout the growing season, especially since the climate and weather conditions can fluctuate quite substantially across seasons in the Niagara Region. Extremely high rainfall levels can trigger various molds, rots and pests. Knowing areas that retain the highest moisture levels throughout the.~eason can help identify vulnerable portions of the vineyard. Similarly, knowing areas with low water availability can also support decisions related to targeted irrigation during extreme drought conditions. Soil moisture is an important variable to measure when characterizing ST since mild water stress can lead to decreased growth and increased Brix during the grape maturation process. This has led to grapes producing wines with improved aroma and harmony in structure (Peterlunger et ai., 2004). However, the 2008 and 2009 growing season had rainfall averages that were much higher than the two years previous and higher than the 30 year seasonal average, especially in June, July and August (Table 4.1). It is possible that the oversaturation of water in the soil could have exceeded the uptake capabilities of the vines and thus, the variation in soil


73 64 moisture would have less of an impact on grape composition or negatively impact grape composition. Analyzing soil moisture does not measure the uptake of the moisture in the soil by the vines and is at best a measure of water availability and an indirect measure of vine water status. The next step could be to test the sensory characteristics of wines made from the grapes that were harvested according to the soil moisture patterns identified in the findings to determine if the spatial patterns in soil moisture translate to differences in wine quality. For example, the grapes from CFl and CF2 could have been selectively harvested and made into two wine lots of Cabernet Franc, given the substantial soil moisture differences between the blocks. Sensory analysis on the resulting wine would determine if there were measurable differences in the sensory characteristics between wines made from the two blocks using an extensively trained panel of wine tasters. The panel members independently and blindly assess the wines for dominant aromas and flavours, which could be perceived as quality differences. Table 4.1: Monthly Rainfall Averages in 2008,2009 and for Vineland Station (mm) Source: National Climate Data and Information Archive, 2010 Information related to vine and overall vineyard vigour was important for canopy management. Canopy management directly influences the intera~tion between the grapes and the environment; pruning the canopy controls vigour, and vigour influences the maturation of the grapes. Vineyard vigour must be balanced; not too much because it can take away from the grape maturation process and not too little because it cannot support healthy fruit development (Robinson, 2006). Balanced vine vigour can lead to quality grape production. This was especially important information for Stratus Vineyards as the site demonstrates areas of high vigour, coupled with a current management strategy that focuses on controlling the vigour. Targeting areas of known high vigour through pruning throughout the season can control the quality of grapes produced at the end of the season. More detailed vigour information can change the management strategy. The NDVI from 2008 showed more vigour compared to 2009
74 65 since the top fruiting zone was cut off of vines between 2008 and The vineyard manager identified the area as having low vigour and the Scott Henry trellising system was designed to control high vigour areas. Thus, modifying the trellising system of the Chardonnay vines controls the overall vigour in the block and the change in vigour was detectable in the NDVI image. Longer term monitoring of vigour in CH I would determine how the vigour changes over time after modifications to the management of the vines. The soil regulated water and nutrient uptake, acting as a mediator between the vines and the environment. Thus, its composition had a direct impact on grape production. The soil data supplemented the national soil data already available. The variation between sand, silt and clay distribution in the vineyard are substantial enough to impact vineyard decisions; especially since CHI had more uniform soil texture, while CFI and CF2 had suqstantial soil variations within and between the blocks. Considering CFI and CF2 were typically harvested together and made into one vintage, the different soils can have an impact on the Cabernet Franc grapes and lead to selective harvesting and/or the production of two smaller wine batches. Grape composition was important in the wine-making process since the variables studied can influence wine quality. Although no consistent spatial or temporal patterns were displayed from these data, the results could still be useful for the vineyard manager. Understanding the variability of these grape composition variables adds another layer of information to the decision-making process. Having two blocks of the same variety (CFI and CF2) allowed for more direct comparisons about the differences in grape composition, illustrating that the two blocks of the same variety produced grapes with different composition. This information regarding the variability can influence the decisions made in the vineyard. 4.4 Limitations of Data Collected The capacity and advantages of ST -based vineyard management were interconnected to the data available. The quality of information can only be as good as the data, as the lack of adequate data (both precise and accurate) would restrict the possibility of studying ST. Publically available data were not detailed enough to inform targeted management decisions. Researchers act as a bridge between the technological development and vineyard manager by collecting data related to vineyard location, vineyard imagery, growing season information and after harvest grape quality measures using GPS, remote sensing, GIS and geostatistical analyses.
75 66 These data required long labour intensive days in the field and lab, as well as data processing and outputting to get a spatial perspective on the three study blocks of interest. These three sub blocks only represented approximately 10 acres of Stratus' 55-acre vineyard. Sampling and collecting data for the entire vineyard increases the breadth of the study, improving what was known about the vineyard spatially. Also, the results for soil moisture were presented more conclusively because there were seven datasets from different dates throughout the growing seasons, while the berry data only had two datasets. Two years of data was also problematic since 2008 and 2009 were anomalous years containing much higher than average rainfall (see Table 4.1). The overabundance of rainy days in 2008 and 2009, especially compared to the optimal conditions experienced in Niagara in 2007, prevented the analysis or comparison of the impact of water stress, a condition directly linked with wine qu~iity. It would be ideal to use the analyzed patterns in the three sample blocks to extrapolate across the full 55-acre vineyard. However, it was not possible given the nature of vineyard characteristics. The terroir within a vineyard was affected by multiple factors ranging from soil type, water status, topography, grape variety, vine age and condition. To extrapolate information for the entire vineyard based on the three vineyard blocks would be subject to uncertainty and high margins of error. Thus, this study focused primarily on interpolation to estimate values to areas that did not coincide with measured points from within the measured points. For future studies, using remotely sensed images to assess the patterns within the entire vineyard would likely be more accurate than extrapolating from the three study blocks. For example, once more was known about particular spectral reflectance values as they relate to vineyard characteristics (i.e., water status of vines), the obs"erved patterns"from the imagery can be used to identify characteristics and patterns throughout the entire vineyard. As more information becomes available about terroir and its link to grape composition and quality, the less ground data will be required to undergo studies such as this one that applies geomatics technologies to vineyard management. Just as extrapolating the data collected within the three blocks to determine patterns in the entire vineyard was not accurate; extrapolating the data from this study to the entire Niagara Region was not accurate. The extrapolation of the specific findings of this study to the Niagara Region was not feasible; nor was it economically sustainable to conduct research ofthis depth in all of the vineyards in Niagara, due to the labour intensive data collection required for this geomatics based initiative. This study examined approximately three hundred
76 67 data points in three blocks of a much larger vineyard and required expensive equipment and hundreds of data collection hours. The development of more advanced monitoring and sensing could enable extensive data collection that could support entire vineyard extrapolation. 4.5 Influence on Vineyard Decisions The overall result of employing precision practices was to make more informed vineyard decisions that lead to better wine. The interaction between the grapevine, natural environment and vineyard management strategy influences grape production and ultimately, wine quality. Better wine was often associated with higher quality but how 'higher quality' was defined was prone to intense subjectivity. To one winery, better quality could mean higher price and to another, better quality could mean environmentally sustainable production practices. Better ~ (' wine, by way of making more informed vineyard decisions based on information made available through geomatics technologies, depends on targeted quality and price standards of the winery. Each winery had different production capabilities and desired targets. The ability of a winery to adopt a PV or ST strategy or influence change on management and/or wine-making strategy was related to factors such as targeted quality and price standards of the grapes/wine and infrastructure in the winery. For example, if a winery does not have the infrastructure to make small-batch wines, it would not benefit from selective harvesting. However, it could still benefit from zonal management, as the vineyard management decisions directly impact the grapes produced. Thus, the extent of adoption ofpv and value in the characterization ofst was dependent on the objective of the winery. At Stratus, the winemaker ~xpressed inter.est in replanting CHI since it has not produced the high quality grapes sought by Stratus Vineyards. The results of this study provided information about the spatial variability of select vineyard and grape composition variables and the findings have the potential to influence planning decisions for the future of this block. These decisions include the ideal: variety for Vineland soil with very fine silt clay loam texture and high variability in soil moisture; trellising system that is designed for a lower vigour area; or, redesign of block boundaries to promote maximum uniformity in fruit development. Also, given the high standard wines and upscale setting at Stratus Vineyards, unique and interesting wines fit the desired quality and price targets of the winery. For example, currently Stratus makes one Cabemet Franc vintage using grapes from CFI and CF2. However, making two separate
77 68 Cabemet Franc vintages from the two blocks that have obvious variations in soil moisture could produce two distinct wines. This unique grape growing and wine making experience would also be a good experience to share with the customers who visit the boutique to taste, learn about and purchase wines. The choice of different vintages ofthe same variety has already proven successful at well-established wineries in the Niagara Region, such as Vineland Estates Winery. Vineland creates three different vintages of Riesling, each from grapes from different parts of the vineyard that have a unique terroir. The selectively harvesting decisions at Vineland were based on specific knowledge of the vineyard, acquired over the winery's 25 year history (Vineland Estates Winery, 2010). The vineyard at Vineland Estates is also situated on land at the edge of the escarpment and demonstrates very obvious topographic differences. Stratus, on the other hand, was only established in the year 2000 has very subtle topqgraphic variation. Characterizing the ST at Stratus helped compensate for the short history of the winery and unseen differences in the terroir Integration of Spatial Terroir at Stratus Vineyards This research study characterized the spatial terroir at Stratus Vineyards by analyzing the variability in key vineyard and grape composition variables. However, characterizing ST and managing ST were two different issues, as the spatial variability in vineyards requires precise control to manage variation effectively (Cook and Adams, 2000). Having more information to make better decisions in the vineyard leads to more precise control and ultimately influences the vineyard management strategy, as the vineyard management strategy subsequently affects the resulting wine; but the benefits of ST can only make a substantial impact on vineyard management if the system was being used by the vineyard manager (Lamb et ai., 2008). In order for ST to be an effective tool in supporting vineyard decisions, the application must connect geomatics to a real world problem and be integrated into the existing framework for management (Cozzolino, 2009; Grieger and Armstrong, 2001). Successful integration of the system maximizes benefits to a wide audience, connecting the researchers to the users: "integrated vineyard management requires commitment to both the research required, which underpins the industry, and the reality of trying to implement new research ideas into everyday vineyard practices" (Grieger and Armstrong, 2001; 71). In the wine industry, an integrated data management system provides an opportunity for vineyard managers to conduct precision
78 viticulture outside of a research context; making valuable vineyard information available with minimal costs over time (Bramley, 2006). For this information to be useful to the management at Stratus Vineyards, it needed to be integrated into existing vineyard management before spatial information could become a regular part of vineyard management decisions. Geomatics techniques can provide valuable geospatial information but most often it is research teams and 'those in the know' that are investigating the use and application of these technologies (Roling and Wagemakers, 1998). All too often, there is a demarcation between the producer of geomatics technologies and the user of the information, acting as a roadblock to integration and adoption (Grieger and Armstrong, 2001). Participatory research is increasingly being used to connect the technology to the application. A participatory GIS framework : ~ recognizes the powerful influence of grass-roots dissemination'inethods in order to successfully employ the technology (Klinsky et al., 2010). A key consideration of participatory research is the importance of local knowledge. Participatory methods require geospatial information to be integrated with local knowledge as the foundation for successful participatory vineyard management. The integration of geomatics technologies into practical management must work in conjunction with existing viticulture knowledge. If a vineyard manager already identified a south facing block with superior soil composition and drainage to produce vintage-quality wine, geospatial information should work to incorporate that information. The inappropriate application of the technology, including ignoring existing vineyard information makes the system useless (Lamb et al., 2008). Creating a geomatics system around existing vineyard information builds local capacity ~or integration,pfthe system into the existing viticulture management strategy Limitations to Integration There are multiple factors that influenced the long-term integration of geomatics for effective geospatial vineyard management; thus, restricting the wide-spread implementation of PV in grape growing and wine production in the Niagara Region. Barriers that limit the application and integration of geomatics technology for improved vineyard management are existing management and high cost. The underpinning of a strong ST initiative - the application of GPS, remote sensing and GIS - acts as a foundation for geomatics-based vineyard management system
79 70 (Cozzolino, 2009). These technologies combine to create a stronger foundation to improve the possibility of achieving successful geomatics use in viticulture (Lamb et al., 2008). However, to enable wide-spread benefits to vineyard decision-makers, ST needs to be integrated into the existing vineyard management strategy. When integrating a technological approach to Stratus, the technology is not the solution. The technology helps achieve a solution by giving the decision-makers spatial information to make more informed decisions that influence the existing management strategy. A ST approach does not substitute good management, as the vineyard manager still makes the decisions in the vineyard; the technology provides more information to support decision-making (Proffitt et al., 2006). For example, when determining the best variety of grape to plant in a region, the vineyard manager's knowledge of the soil, climate, and vineyard history is essential. Their expertise and decision-mak~1ig allows geomatics technology to have the biggest influence, giving the decision-makers a better spatial understanding of their vineyards. Cost is also a major limiting factor in the application of geomatics in viticulture. Technology needs to be economically attractive to promote adoption (Lamb et al., 2008). The initial investment can be daunting but with the rising costs of farming supplies and equipment (i.e., fuel, fertilizers, irrigation), geomatics-based technologies are cost effective; reducing the inputs for sustained outputs (Mercer, 2008). The management of a natural resource, such as viticulture land, is directly linked to the economic infrastructure (Falconer and Foresman, 2002). This study, as well as many studies related to PV, relies on funded research (Bramley, 2006). Academic research collaboration facilitates the introduction of geomatics technologies to wineries and in some cases, can be" taken over b)i'industry partners or directly by the winery. Some larger wineries, such as Quails' Gate in the Okanagan Valley in British Columbia, are able to hire full-time researchers to explore the best winery-specific approach to employing geomatics technologies (Quail's Gate, 2010). However, many do not have the resources to dedicate to an additional full-time staff or to financially support a research study. The solution to this problem could be data sharing and commercialization. Commercialization would reduce the burden and cost on individual wineries and promote collaboration within the wine producing region. Unfortunately, these solutions were not adequately developed in this study and stands as a good direction for further research, explored in the conclusion.
80 4.6 Chapter Conclusion 71 The characterization of spatial terroir at Stratus Vineyards provided a useful framework for applying geomatics technologies to analyze vineyard variability. ST built a better understanding of the interaction between the vineyard, grape and the natural environment; as the addition of information related to the spatial and temporal variability of more detailed vineyard characteristics and grape composition variables augmented what was already known about the vineyard. Complex analyses of vineyard variability were performed in the study by visualizing, monitoring and geospatially analyzing vineyard data, building a spatial understanding ofthe vineyard. The results began to build a comprehensive understanding of the terroir and the variability within. Most notably, there were clear patterns displayed by the soil moisture within the vineyard blocks, between block and over time. In addition, the analyses of other variables provide the vineyard manager with information that did not previously exist. The overall findings of this study build a better understanding of the spatial and temporal variability as it relates to vineyard characteristics and grape composition within Stratus Vineyards.
81 Chapter 5 72 Conclusions 5.1 Introduction Terroir is a well-studied and broadly defmed concept in viticulture that is concerned with the influences on grape development throughout the growing season. These influences include the interaction between climate, topography, soil geology, grape variety and management strategy. To add to the complexity of terroir, the factors that influence grape growing vary over space and time, and translate into spatial variations in grape yield and quality. The variability that exists within a vineyard and between vineyard blocks makes masterin~terroir a complex endeavour for any vineyard decision maker. Vineyard managers would ideally like to adopt a management strategy that takes advantage of the complexities of variation while controlling detrimental variables. Adopting a spatial terroir strategy could enable vineyard managers to obtain more information to better predict the influences on grape growing and wine production and ultimately, make better decisions in the vineyard. Geomatics technologies, in particular, are useful for visualizing, monitoring and analyzing the variability in terroir over space and time, known in this study as the spatial terroir. This study aimed to characterize vineyard variability using geomatics technologies for the purpose of gaining valuable information about the vineyard. The better the information a vineyard manager has regarding the influence on grape growing and wine production, the increased likelihood of making more informed decisions. This goal was achieved by characterizing the spatial terroir at Stratus Vineyards in the Niagara Region. This research study analyzed the spatial variability of Stratus Vineyards using geomatics technologies and geospatial information. ST was used as a foundation to structure both the review of geomatics technologies in viticulture and the characterization of the spatial variability within and between three vineyard blocks at Stratus Vineyards. The use of GPS, remote sensing and GIS to visualize, monitor and analyze vineyard variability proved to be valuable in characterizing ST. Remote sensing, GIS and GPS all exist independently but using all three components of geomatics in viticulture together maximizes synergy and makes the most of each technology. It began by highlighting the importance of using precision methods and analyzing spatial terroir (ST) in the Niagara
82 73 Region of Canada. It presented a review of the relevant literature on the value and use of geomatics technologies to study vineyards and their variability. It quantified and analyzed vineyard and grape composition variables, integrated remotely sensed imagery and produced spatial information that can be amalgamated with Stratus' existing vineyard management strategy. It was successfully determined that some factors, especially soil moisture, demonstrated significant and predictable variability in the vineyard. However, there is still more work required to fully integrate the benefits of ST into the management system at Stratus. The work presented in this thesis was part of a larger multidisciplinary research study that was investigating the value and use of geomatics technologies for improved vineyard management in the Niagara Region. The findings ofthis study are hoped to benefit the larger resear~h project, contributing to the understanding of spatial variability within local vineyards. The characterization of ST at Stratus Vineyards enabled the visualization and simplification of vineyard data, and production of high quality maps of related vineyard variables and creation of new information that can improve vineyard management decisions. 5.2 Suggestions for Further Study The results of characterizing the ST at Stratus can have the potential to form the foundation of further PV initiatives. For the long-term success of a PV or ST project, further study should address the issues surrounding further data analysis, continuous monitoring and integration into existing management strategies. The spatial analysis used in this study aims to examine the spatial pattern that exjsts in the data. However, it does not attempt to infer the process that produces it. It is difficult to correlate patterns in the vineyard and its affect on the grapes produced since there are so many factors influencing grape production. This study aimed to characterize ST to better understand the patterns existing within and between vineyard blocks and over time. The findings from this study do not identify or confirm a causal relationship between the variables; instead, it identifies the pattern of vineyard and grape composition variables and applies geomatics techniques at Stratus Vineyards. The information generated in this study has the potential to form the foundation of further study that correlate vineyard, grape and environmental variables.
83 74 Continuous monitoring of the variables at Stratus Vineyards would provide a better longterm understanding of the ST within the vineyard. Due to high cost of data collection, achieving adequate monitoring of vineyard and grape variables would be ideally suited to volunteered geographic information (VOl), where the vineyard workers would collect the spatial data necessary to conduct spatial analysis. Characterizing ST using data generated through VOl could reduce the cost and burden of a completely research-based project. Commercialization of a sellable product (i.e., subscription access to an online spatial data portal) could make the technology and information available to a wider audience by reducing the need for large investments and making it accessible to small vineyards, like those in Niagara. An important next step would be to integrate PV concepts into existing management strategies. The integration of geomatics in viticulture needs to t:peasure the ability for geomatics techniques to influence management strategy in the vineyard. A potential solution to better integrate PV into vineyard management is through commercialization, offering a geomatics system that is cost-effective and extends the benefits of geomatics technologies to a wideaudience. Some companies - such as Weather Innovation Network, EnvironmentalOeosolutions and Associated Engineering - are currently offering some geomatics-related consultation and are also collaboratively working with wineries to develop geomatics technologies and techniques to apply to vineyards. The benefits of a geomatics-based sustainable approach to viticulture are more likely to be achieved when the financial commitment ofthe subscribers (i.e., wineries and grape growers) is cost-effective with a clear benefit to the winery. Oeomatics technologies provide detailed vineyard information with promising results despite the existing limitations. More effective methods for data collection allowyor larger areas to be sampled and simplistic data delivery would benefit the local vineyards within and outside of the Niagara Region. Another application of geomatics in viticulture that warrants further study is the integration of geomatics technologies into existing vineyard management systems to promote sustainable management in viticulture. The Niagara wine industry aspires to be a world class wine producer. This study, as well as current research, suggests that integrating valuable geospatial information can assist in achieving higher quality wines while contributing to greater environmental sustainability of vineyard operations (MacQueen and Meinert, 2006; Proffitt, Bramley, Lamb and Winter, 2006). With the increasing fragility ofthe natural environment, coupled with the dependence of grape growing on that natural environment, it is essential to
84 75 ensure that future viticulture practices are environmentally sustainable. The complex interplay between viticulture management, geomatics technologies, spatial terroir and environmental sustainability needs to be explored further. This thesis addressed some of the impacts studying ST can have on environmental sustainability of vineyard practices but does not comprehensively explore it. Many studies have emerged on the need to reduce the environmental impact of agricultural practices and the ability of technology and geomatics to fill that need (I<Iinsky et al., 2010; Cozzolino, 2009; Falconer and Foresman, 2002; Clingeleffer et al., 1998; Winfield and Rabantek,1995). However, the increasing prevalence of 'green' wineries - those focused on being responsible stewards of the land and leaving a lighter environmental footprint - demonstrates that need for more information related to PV and sustainable viticulture. Reducing the impact of environmental operations on the natural enviroilll1;ent can preserve the land that produces grapes; thus protecting the prosperity of the wine industry. 5.3 Moving Forward Good wine is not typically the result of chance; it is the result of hard work and the culmination of hundreds of grape-growing and wine-making decisions. Employing precision viticulture techniques improves the information available to vineyard managers and ultimately influences the decisions made in the vineyard. Considering the Niagara wine region is relatively young, it stands to gain maximum benefit from understanding the unique spatial terroir of the viticultural landscape. Just as good wine is the culmination of hundreds of vineyard decisions, the success of the Niagara wine region is a culmination of many factors working together, including economic and tourism d~velopment, historical and cultural roots, industry knowledge, viticulture and oenology infrastructure and quality wine production. The addition of geomatics technologies to the industry could provide an excellent niche for Niagara in the vast global wine market. The benefits of employing geomatics in viticulture can expand what is known about the vineyard and grapes, improve decision-making, and promote more environmentally sustainable practices. The application of geomatics to viticulture and characterization of ST gives local Niagara grape growers and wineries knowledge that old world vineyards managers have had to develop and acquire over centuries. By introducing geomatics technologies to the factors contributing to the success of the Niagara wine region, it promotes the continued prosperity of the Niagara wine region.
85 76 Reference List Acevedo-Opazo, C., Tisseyre, B., Guillaume, S., and Ojeda, H. (2008). The potential of high spatial resolution infonnation to define within-vineyard zones related to vine water status. Precision Agriculture, 9(5), Aspler, T. (2006). The wine atlas of Canada. Angel Edition. Toronto: Random House Canada. Baldy, M. (1995). Great wines were made in the vineyard: growing wine grapes: principles and practices. The university wine course, ( ). San Francisco, CA: Wine Appreciation Guild. Beech, M. (4-December 2010). Who's the wine industry's daddy? The St. Catharines Standard. Al., ~ Berry, B., Griffith, D. and Tiefelsdorf, M. (2008). From spatial analysis to geospatial science. Geographical Analysis, 40, Bishop, T. and McBratney, A. (2002). Creating field extent digital elevation models for precision agriculture. Precision Agriculture, 3(1), Bowen, P, Bogdanoff, c., Estergaard, B., Marsh, S., Usher, K., Smith, C. and Frank:, G. (2006). Use of geographic infonnation system technology to assess viticulture perfonnance in the Okanagan and Similkameen Valleys, British Columbia. In Macqueen, R. and Meinert, L. (Eds.). Fine wine and terroir: the geoscience perspective, ( ). St. John's: Geological Association of Canada. Bramley, R. (2006). Acquiring an infonned sense of place: practical applications of precision viticulture. Wine Industry Journal, 21(1), Bramley, R. (2005). Understanding variability in winegrape production systems 2: within vineyard variation in quality over several vintages. Australian Journal of Grape and Wine Research, 11, Bramley, R. and Hamilton, R. (2004). Understanding variability in winegrape production systems 1: within vineyard variation in yield over several vintages. Australian Journal of Grape and Wine Research, 10, Bramley, R. (2001). Vineyard sampling for more precise, targeted management. Geospatial Information in Agriculture: Precision Agriculture Symposium: Commodities and Management, 13,
86 Clingeleffer, P., Sommer, K. and Walker, R. (1998). Holistic system approach for sustainable vineyard management for grape and wine quality. In Blair, R., Sas, A, Hayes, F. and Hoj, P. (Eds.). Proceeding of the tenth Australian wine industry technical conference: Sydney, New South Wales. Urrbrae, Australia: Australian Wine Research Institute. 77 Collings, S. (Ed.). (2003). Growing quality grapes to winery specification: quality measurement and management options for grapegrowers. South Australia: Winetitles. Cook, S. and Adams, M. (2000). Uncertainty and interpretation of spatial information: the case of precision agriculture. In Hill, M. and Aspinall, R. (Eds.). Spatial informationfor land use management. Australia: Gordon and Breach Science Publishers. Cozzolino, D. (2009). Ensuring sustainable management of water and soil for Australian grape and wine production. Australian and New Zealand Wine Industry Journal, 24(4), De Chaunac, A (1953). Canada, a winemaking country. Ameripan Journal of Enology and Viticulture, 3(1), Delago, J. and Berry, J. (2008). Advances in precision conservation. Advances in Agronomy, 98, Delaney, J. and Van Niel, K. (2007). Geographical information systems: an introduction (Second Edition). Victoria, Australia: Oxford University Press. Delenne, C., Durrieu, S., Rabatel, G., and Deshayes, M. (2010). From pixel to vine parcel: A complete methodology for vineyard delineation and characterization using remotesensing data. Computers and Electronics in Agriculture, 70(1), Delenne, C., Durrieu, S., Rabatel, G., Deshayes, M., Bailly, J. S., Lelong, C. and Couteron, P. (2007). Textural approaches for vineyard detection and characterization using very high spatial resolution remote sensing data, International Journal of Remote Sensing, 29(4), Ebdon, D. (1990). Statistics in geography (2 nd edition). Oxford, UK: Basil Blackwell. Falconer, A and Foresman, J. (Eds.). (2002). A systemfor survival: GIS and sustainable development. Redlands, California: ESRI Press. Fuentes, S., Conroy, P., Kelley, G. and Rogers, G. (2004). Use of infrared thermography to assess spatial and temporal variability of stomatal conductance of grapevines under partial rootzone drying: an irrigation scheduling application. In Williams, L. (Ed.). In Proceedings of the VIIth international symposium on grapevine physiology and biotechnology, ( ). Belgium: International Society for Horticultural Science.
87 78 Gayler, J. (2005). Stemming the urban tide: policy and attitudinal changes for saving the Canadian countryside. In Gilg, A., Yarwood, R., Essex, S., Smithers, J. and Wilson, R. (Eds.), Rural change and sustainability: agriculture, the environment and communities. Wallingford, UK: CABI Publishing, Gishen, M., Iland, P., Dambergs, R., Esler, M., Francis, I., Kambouris, A., Johnstone, R. and Hoj, P. (2001). Objective measures of grape and wine quality. In Blair, R., Williams, P. and Hoj, P. (Eds.). Conference proceedings: Australian wine industry technical conference, ( ). South Australia: A WITC, Inc. Gonsalves, J., Becker, T., Braun, A., Campilan, D., De Chavez, H., Fajber, E., Kapiriri, M., Rivaca-Caminade, J. and Vemooy, R. (Eds.). (2005). Participatory research and development for sustainable agriculture and natural resource management: a sourcebook. Ottawa, ON: International Development Research Centre, Greenspan, M. (2001). Mapping technologies in premium viney(5,rds. In Reynolds, A. (Ed.). (27-41). Space age winegrowing: A proceedings of a symposium. St. Catharines, ON: American Society of Enology and Viticulture. Greenough, J., Mallory, L., and Fryer, B. (2006). Regional trace element fingerprinting of Canadian wines. In Macqueen, R. and Meinert, L. (Eds.). Fine wine and terroir: the geoscience perspective, ( ). St. John's: Geological Association of Canada. Grieger, G. and Armstrong, H. (2001). Integrated vineyard management: research and reality. In Blair, R., Williams, P. and Hoj, P. (Eds.). Conference proceedings: Australian wine industry technical conference, (68-72). South Australia: A WITC, Inc. Gruber, B. and Schultz, H. (2004). Coupling of soil water status at different vineyard sites. In Williams, L. (Ed.). In Proceedings of the VIIth international symposium on grapevine physiology and biotechnology, ( ). Belgium: International Society for Horticultural Science. Hakimi Rezaei, J. and Reynolds, A. (2010a). Impact of vine water status on sensory evaluation of Cabemet Franc wines in the Niagara Peninsula of Ontario. J. Int. Sciences Vigne Vin, 44, f Hakimi Rezaei, J. and Reynolds, A. (201 Ob). Characterization of Niagara peninsula cabemet franc wines by sensory analysis. American Journal of Enology and Viticulture, 61, Hakimi Rezaei, J. and Reynolds, A. (20lOc). Evaluation of cabernet franc wines in the Niagara peninsula. Progres Agricole et Viticole, 127(4), Hall, A., Louis, J. and Lamb, D. (2008). Low-resolution remotely sensed images of wine grape vineyards map spatial variability in planimetric canopy area instead of leaf area index. Australian Journal of Grape and Wine Research, 14(1), 9-17.
88 Hall, A., Lamb, B., Holzapfel, B. and Louis, J. (2002). Optical remote sensing applications in viticulture - a review. Australian Journal of Grape and Wine Research, 8, Hall, A., Louis, J. and Lamb, D. (2003). Characterizing and mapping vineyard canopy using high-spatial-resolution aerial multispectral images. Computers and Geosciences, 29, Harvey, F. (2008). A Primer of GIS: Fundamental geographic and cartographic concepts. New York: The Guilford Press. Hashimoto, A., and Telfer, D. (2003). Positioning an emerging wine route in the Niagara Region: understanding the wine tourism market and its implications for marketing. Journal of Travel and Tourism Marketing, 14(3/4), Haynes, S. (2006). A geological foundation for terroirs and potential sub-appellations of Niagara Peninsula wines, Ontario, Canada. In Macqueen, R. and,:meinert, L. (Eds.). Fine wine and terroir: the geoscience perspective, (9-30). St. John's: Geological Association of Canada. Hazak, J., Harbertson, J., Lin, C. and Ro, B. (2004). The phenolic components of grape berries relation to wine composition. In Williams, L. (Ed.). In Proceedings of the VIIth International Symposium on Grapevine Physiology and Biotechnology, ( ). Belgium: International Society for Horticultural Science. Hope-Ross, P. (2006). From the vine to the glass: Canada's grape and wine industry. Statistics Canada Analytical Paper, Catalogue no MIE No Hubbard, S., Lunt, 1., Grote, K. and Y oram, R. (2006). Vineyard soil water content: mapping small-scale variability using ground penetrating radar. In Macqueen, R. and Meinert, L. (Eds.). Fine wine and terroir: the geoscience perspective, ( ). St. John's: Geological Association of Canada. Jones, G. (2006). Climate and terroir: impacts of climate variability and change on wine. In Macqueen, R. and Meinert, L. (Eds.). Fine wine and terroir: the geoscience perspective, ( ). St. John's: Geological Association of Canada. Jones, G., Snead, N. and Nelson, P. (2006). Modeling viticultural landscapes: a GIS analysis of the terroir potential in the Umpqua valley of Oregon. In Macqueen, R.and Meinert, L. (Eds.). Fine wine and terroir: the geoscience perspective, ( ). St. John's: Geological Association of Canada. Kingston, M., Presant, E. (1989). The soils of the Regional Municipality of Niagara, Volume 1 and 2. Report No. 60 ofthe Ontario Institute of Pedology. Toronto: Ontario Ministry of Agriculture and Food.
89 Kitchen, N. (2008). Emerging technologies for real-time and integrated agricultural decisions. Computers and Electronics in Agriculture, 61, Klinsky, S., Sieber, R. and Meredith, T. (2010). Connecting local to global: geographic information systems and ecological footprints as tools for sustainability. The Professional Geographer, 62(1), Koenig, W. (1999). Spatial autocorrelation of ecological phenomena. Tree, 14(1),22-26 Krstic, M., Leamon, K., DeGaris, K., Whiting, J., McCarthy, M and Clingeleffer, P. (2001). Sampling for wine grape quality parameters in the vineyard: variability and post-harvest issues. In Blair, R., Williams, P. and Hoj, P. (Eds.). Conference proceedings: Australian wine industry technical conference, (87-90). South Australia: A WITC, Inc. Lamb, D. and Bramley, R. (2001). Precision viticulture - tools, techniques and benefits. In Blair, R., Williams, P. and Hoj, P. (Eds.). Conference proceedthgs: Australian wine industry technical conference, (91-97). South Australia: AWITC, Inc. Lamb, D., Frazier, P. and Adams, P. (2008). Improving pathways to adoption: putting the right P's in precision agriculture. Computers and Electronics in Agriculture, 61,4-9. Lamb, D., Weedon, M. and Bramley, R. (2004). Using remote sensing to predict grape phenolics and colour at harvest in a cabemet sauvignon vineyard: timing observations against vine phenology and optimizing image resolution. Australian Journal of Grape and Wine Research, 10, Lillesand, T., Kiefer, R., and Chipman, J. (2004). Remote sensing and image interpretation. Fifth edition. Hoboken, NJ: John Wiley and Sons. MacQueen, R. and Meinert, L. (Eds.) (2006). Fine wine and terroir: The geoscience perspective. St. John's, N.L.: Geological Association of Canada. McCoy, R. (2005). field methods in remote sensing. New York: The Guilford Press. McGrew, J and Monroe, C. (2000). An introduction to statistical problem solving in geography (2 nd Edition). McGraw-Hill Companies, U.S.A. Mercer, D. (24- May 2008). Going high-tech down on the farm. The St. Catharines Standard, Standard Business, C9. Miller, H., (2004). Tobler's first law and spatial analysis. Annals of the Association of American Geographers, 94(2),
90 81 Morani, F., Castrignano, A., and Pagliarin, C. (2009). Application of multivariate geostatistics in delineating management zones within a gravelly vineyard using geo-electrical sensors. Computers and Electronics in Agriculture, 68, Morris, J. (2001). Precision viticulture - a mechanized systems approach. In Reynolds, A. (Ed.). ( ). Space age winegrowing: A proceedings of a symposium. St. Catharines, ON.: American Society of Enology and Viticulture. National Climate Data and Information Archive. (201O-last updated). Climate summaries. Environment Canada. Retrieved on April 13, 2011 from: National Climate Data and Information Archive. (2010-last updated). Canadian climate normals Environment Canada. Retrieved on April 14, 2010 from: _normals/index _ e.html ~ ~ '. Nemani, R., Johnson, L. and White, M. (2006). Application of remote sensing and ecosystem modeling in vineyard management. In Srinivasan, A. (Ed.). Handbook of precision agriculture: Principles and applications, ( ). Bringhamton, NY: Food Products Press. Ord, K. and Getis, A. (2001). Testing for local spatial autocorrelation in the presence of global autocorrelation. Journal of Regional Science, 41(3), Ontario Institute of Pedology [map]. (1989). Soils of St. Catharines - Niagara-on-the-Lake. Regional Municipality of Niagara, Ontario. Sheet 3, Scale 1 :25,000. Ough, C. and Amerine, M. (1988). Methodsfor analysis of musts and wines (2 nd ed.). New York: John Wiley and Sons. Overmars, K., de Koning, G. and Veldkamp, A. (2003). Spatial autocorrelation in multi-scale land use models. Ecological Modeling, 164, Pedroso, M., Taylor, J., Tisseyre, B., Charnomordic, B., and Guillaume, S. (2010). A segmentation algorithm for the delineation of agricultural management zones. Computers and Electronics in Agriculture, 70(1), Peterlunger, E., Sivilotti, P. and Colussi, V. (2004). Water stress increased pholphenolic quality in 'Merlot' grapes. In Williams, L. (Ed.). In Proceedings of the VIIth International Symposium on Grapevine Physiology and Biotechnology, ( ). Belgium: International Society for Horticultural Science. Proffitt, T., Bramley, R., Lamb, D. and Winter, E. (2006). Precision viticulture: A new era in vineyard management. Ashford, South Australia: Winetitles.
91 82 Quails' Gate. (2010 -last updated). Quails' Gate Okanagan Valley [Homepage of Quails' Gate]. Retrieved August 20,2010 from htlp:llwww.quailsgate.comlindex.php Regional Agricultural Economic Impact Study [RAEIS]. (2003) The Regional Municipality of Niagara. Report prepared by Planscape: Bracebridge, Ontario. Reynolds, A., de Savigny, C., and Willwerth, J. (2010a). Riesling terroir in Ontario vineyards. The roles of soil texture, vine size and vine water status. Progres Agricole et Viticole, 127(10), Reynolds, A., Marciniak, M., Brown, R., Tremblay, L. and Baissas, L. (2010b). Using GPS, GIS and airborne imaging to understand Niagara terroir. Progres Agricole et Viticole, 127(12), Reynolds, A., Vanden Heuvel, J. (2009). Influence of grapevine training systems on vine growth and fruit composition: a review. American Journal ofe11610gy and Viticulture, 60(3), Reynolds, A., Senchuk, I., van der Reest, C. and De Savigny, C. (2007). Use ofgps and GIS for elucidation of the basis for terroir: spatial variation in an Ontario riesling vineyard. American Journal of Enology and Viticulture, 58(2), Reynolds, A. and De Savigny, C. (2001). Use of GPS/GIS to determine the basis for terroir. In Reynolds, A. (Ed.). (79-102). Space age winegrowing: A proceedings of a symposium. St. Catharines, ON: American Society of Enology and Viticulture. Reynolds, A. (Ed.). (2001). Space age winegrowing: a proceedings of a symposium. St. Catharines, ON: American Society of Enology and Viticulture. Ripmeester, M., Mackintosh, P., and Fullerton, C. (Eds.) (forthcoming). The world of niagara wine. Waterloo: Wilfrid Laurier University Press. Robert, P. (2001). Site-specific managementfor the 2r t century. i. Status and research needs. In Reynolds, A. (Ed.). (7-15). Space age winegrowing: A proceedings of a symposium. St. Catharines: American Society of Enology and Viticulture. Robinson, J. (Ed). (2006). The Oxford companion to wine (3 rd edition). New York: Oxford University Press. Roling, N., and Wagemakers, M. (1998). Facilitating sustainable agriculture: participatory learning and adaptive management in times of environmental uncertainty. Cambridge, U.K; New York: Cambridge University Press. Rogerson, P. (2010). Statistical methods for geography: A student's guide (3 rd Edition). London: Sage Publications.
92 Rogerson, P. (2001). Statistical methods for geography. London: Sage Publications. 83 Schuurman, N. (2004). GIS: a short introduction. Malden: Blackwell Publishing. Smart, R. (2009). Grape prices and wine quality. Wine Industry Journal, 24(4), Smart, R. and Robinson, M. (1991). Sunlight into wine: a handbookfor winegrape canopy management. South Australia: Winetitles. Smith, M., Goodchild, M and Longley, P. (2007). Geospatial analysis: a comprehensive guide to principles, techniques and software tools. Leicester, UK: Matador, an imprint of Troubador Publishing Ltd. Somers, C. (1998). The wine spectrum: an approach towards objective definition of wine quality. South Australia: Winetitles. Sommers, B. (2008). The geography of wine: how landscapes, cultures, terroir, and the weather make a good drop. New York: Plume. Srinivasan, A. (2006). Precision agriculture: an overview. In Srinivasan, A. (Ed.). Handbook of precision agriculture: principles and applications, (3-18). Bringhamton, NY: Food Products Press. Stafford, J. (2006). The role of technology in the emergence and current status of precision agriculture. In Srinivasan, A. (Ed.). Handbook of precision agriculture: principles and applications, (19-56). Bringhamton, NY: Food Products Press. Storchi, P. and Costantini, E. (2004). The influence of climate and soil on viticultural and enological parameters of'sangiovese' grapevines under non-irrigated conditions. In Williams, L. (Ed.). Inproceedings of the VIIth international symposium on grapevine physiology and biotechnology, ( ). Belgium: International Society for Horticultural Science. Stratus (2010 -last updated). Stratus Vineyards [Homepage of Stratus Vineyards]. Retrieved February 3 rd, 2010 from Tatem, A. (2005). Global climate matching: satellite imagery as a tool for mapping vineyard suitability. Journal of Wine Research, 16(1), Thomas, C. and Sappington, N. (2009). GISfor decision support and public policy making (1st ed.). Redlands, California: ESRI Press. Van Leeuwen, C. and Seguin, G. (2006). The concept of terroir in viticulture. Journal of Wine Research, 17(1), 1-10.
93 84 Vaudour, E. (2002). The quality of grapes and wine in relation to geography: notions of terroir at various scales. Journal of Wine Research, 12(2), Vineland Estates Winery. (2010 -last updated). Wine catalogue: Elevation Wines. Retrieved August 20,2010 from Vintners Quality Alliance Ontario [VQA]. (2009). VQA Ontario appellations of origin. Retrieved on April 27, 2009 from Wade, T. and Sommer, S. (2006). A to Z GIS: An illustrated dictionary ofgeographic information systems (2nd ed.). Redlands, California: ESRI Press. Willwerth, J., Reynolds, A., and Lesschaeve, L. (2010). Terroir factors: their impact in the vineyard and on the sensory profiles of Riesling wines. Progres Agricole et Viticole, 127(8), Winfield, M. and Rabantek, J. (1995). Environmentally sustainable agriculture in Canada: an overview and assessment of critical needs. Toronto, ON: Canadian Institute for Environmental Law and Policy. Wong, D. And Lee, J. (2005). Statistical analysis of geographic information with Arc View GIS and ArcGIS. New Jersey: John Wiley and Sons. Digital Data with Controlled Access: 2006 Orthoimagery of the Niagara Region [computer file]. (2006). Thorold, ON: Regional Municipality of Niagara Public Works Department. Available: Brock University Map Library Controlled Access S:\MapLibrary\2006 _Niagara _ orthos\stcatharines _1 Ocm.sid (Accessed March 2009). CanMap Streets [computer file]. (2010). Markham, ON: DMTI Spatial, Inc. Available: Brock University Map Library Controlled Access S:\MapLibrary\DATA\DMTI\CanMapStreets\v2010_3 (Accessed December 2010). CanMap Water [computer file]. (2010). Markham, ON: DMTI Spatial, Inc. Available: Brock University Map Library Controlled Access S:\MapLibrary\DATA\DMTI\CanMapWater\v201O_3 (Accessed December 2010). Niagara Soils [computer file]. (1990). Guelph, Ontario: Agriculture and Agri-Food Canada. Available: Brock University Map Library Controlled Access (OMIKRON) S:\Maplibrary\DATA\Niagara\OMAFRA\soils\NIAGS (Accessed February 25, 2011). SPOT satellite image over Niagara, July 22, 2007] [ electronic resource]. (2007). Lethbridge, AB: Alberta Terrestrial Imaging Centre. Available: Brock University Map Library Controlled Access G (Accessed December 2010).


94 Appendices 85 Appendix A: The Sampling Strategy Used Source: Base 2006 Orthoimagery provided by Brock University Map Library, Copyright, The Regional Municipality of Niagara, Area Municipalities and their suppliers have donated this aerial photography for use under license by Brock University. The orange points represent the sample vines and the blue points represent every fourth sample vine where additional field data were collected; these data were overlaid on a panchromatic aerial image of the vineyard from Spring 2006.


95 86 Appendix B: Digital Elevation Model, Road and River Networks at Stratus Vineyards and the Surrounding Environment Data sources: CanMap Streets, 2010; CanMap Water, 2010.
96 Appendix C: Descriptive Statistics for 2008 and 2009 Soil Moisture Data 87 F ~ 22-Aug I 19-5ep 8-Jul I 28-Jul I 17-Aug I 31-Aug I 15-Sep Mean Median Mode Min Max Range Variance Standard Deviation Skewness Kurtosis , ~009 CF2 22-Aug I 19-5ep 8-Jul I 28-Ju1J 17-Aug T 31-Aug I 15-Sep Mean Median Mode Min Max Range Variance Standard Deviation Skewness Kurtosis CH 'W, Aug I 19-5ep 8-Jul I 28-Jul T 17-Aug I 31-Aug I 15-Sep Mean n/a Median n/a Mode n/a Min n/a Max n/a Range n/a Variance n/a Standard Deviation n/a Skewness n/a Kurtosis n/a


97 Appendix D: Proportional Symbol Map for Soil Moisture Values from September 19, Sept 19, 2008 o o o o


 High")


98 Appendix E: efl Soil Moisture for 2008 and Aug-OB 19-5ept-OB B-July-09 2B-July-09 + N CF Aug Aug-09 1S-Sept-09 Soil Moisture (%) High I Low Metres


")

99 Appendix F: CF2 Soil Moisture for 2008 and Aug ept-08 8-July-09 + ' N, ~-.-~ ---. CF Aug Aug Sept-09 Soil Moisture (%) High Low 0 75 I I Metres 150 I


")


100 Appendix G: CH 1 Soil Moisture for 2008 and N 19-5ept-OS S-July-09 2S-July-09 CH Soil Moisture (%) 17-Aug Aug-09 ( 1S-Sept High Low o 75 I Metres 150 I
101 Appendix H: Moran's 1 for 2008 and 2009 Soil Moisture Data 92 " 200S 2009 CF1 ~, 22-Aug I 1S-Sep S-Jul I 2S-Jul I 17-Aug I 31-Aug I 15 Sep Moran's Index Expected Index Variance Z Score P-Value Pattern clustered clustered clustered clustered clustered clustered clustered Significance Level CF2 200S Aug I 1S-Sep S-Jul I 2S-Jul I 17-Aug I 31-Aug I 15-Sep Moran's Index Expected Index Variance i Z Score P-Value Pattern clustered clustered clustered clustered clustered clustered clustered Significance Level CH1 200S Aug I 1S-Sep 8-Jul I 2S-Jul I 17-Aug I 31-Aug I 15 Sep Moran's Index n/a Expected Index n/a Variance n/a Z Score n/a P Value n/a Pattern n/a clustered clustered clustered clustered clustered clustered Significance Level n/a


102 93 Appendix I: Local Moran's Ii for CF1 and CF2 on August 22, 2008 and August 31, 2009 for Soil Moisture 22-Aug Aug _.- N -- o Metres CC.::>O (, c:::-:: 8CCC) CO -c 2008 & 2009 Local Moran's I Z-score > 2.58 Std. Dev Std. Dev. o Std. Dev Std. Oev Std. Dev Std. Dev. < Std. Dev.
103 Appendix J: Descriptive Statistics for Absolute Leaf Water Potential from 2008 and CF1 200S 2Q09, 22-Aug I 19-5ep S-Jul I 2S-Jul I 17-Aug I 31-Aug I 15-Sep Mean Median Mode Min Max Range Variance Standard Deviation Skewness Kurtosis , 200S 2009 CF2 22-Aug I 1S-Sep 8-Jul I 2S-Jul A 17-Aug I 31-Aug I 15-Sep Mean Median Mode Min Max Range Variance Standard Deviation Skewness Kurtosis CH1 200S Aug I 18-Sep 8-Jul I 2S-Jul I 17-Aug 1 31-Aug I 15-Sep Mean nfa Median nfa Mode nfa 6.8., Min nfa Max nfa Range nfa Variance nfa Standard Deviation nfa Skewness nfa Kurtosis nfa


104 Appendix K: Average of Leaf Water Potential Values for 2008 and Mean Leaf4J (Absolute Value)
105 Appendix L: Moran's I for 2008 and 2009 Leaf Water Potential. 96 efl Aug I 18-Sep 8-Jul I 28-Jul I 17-Aug I 31-Aug I Moran's Index Expected Index Variance Z Score P-Value Pattern dispersed dispersed dispersed dispersed dispersed dispersed dispersed Significance Level , 20i)8 ~O09 CF2, ~. IS-Sep 22-Aug I 18-Sep 8-Jul I 28-Jul I 17-Aug I 31-Aug] IS-Sep Moran's Index Expected Index Variance Z Score ( P-Value ' Pattern dispersed random dispersed random dispersed dispersed dispersed Significance Level CHI " Aug I 18-Sep 8-Jul I 28-Jul I 17-Aug I 31-Aug I IS-Sep Moran's Index n/a Expected Index n/a Variance n/a Z Score n/a P-Value n/a Pattern n/a dispersed dispersed dispersed dispersed dispersed dispersed Significance Level n/a


106 Appendix M: NDVI of Stratus Vineyards on August 31,


107 Appendix N: Comparison ofndvi ofchl from 2008 and Aug-2008 CH1 Metres


108 Appendix 0: Soil Composition at Stratus and Surrounding Environment 99 Not Mapped Soil Composition Soil Name SOIL TEXTURE CL: Clay loam L: Loam SIL: Silt loam SICL: Silty clay loam VFSCL Very fin silt clay loam -- Major Roads -- Rivers D Stratus boundary


109 Appendix P: Sand, Silt and Clay Distribution at Stratus Soil Composition 100 ~~... % Sand 58 % Clay Stratus Vineyards Soil Sample Points 1-40 em depth + N I I Meters 400 I
110 Appendix Q: Descriptive Statistics for 2008 and 2009 Grape Composition B'erry weight Brix (0) Titratable ph 101 Pruning Wt (grams) CF1, (grams) Acidity (g,m/l) 2008 I I J I I 2009 Mean , Median Mode Min , Max Range Variance Standard Deviation Skewness Kurtosis Berry weight Brix (0) Titratable ph Pruning Wt (grams~ CF2 (grams) Acidity (gm/l{ -, 2008 I I I I 2009 Mean Median Mode Min Max Range Variance Standard Deviation Skewness Kurtosis Berry weight Brix (0) Tltratable ph Pruning Wt (grams) CH1 (grams) Acidity {gm/l,l 2008 I I I I I 2009 Mean Median Mode N/A N/A Min Max Range Variance Standard Deviation Skewness Kurtosis


111 Appendix R: CF 1 Grape Composition for 2008 and N --! 2008 Berry Weight Brix 2009 grams 1.7 CF TA ph 2009 gil o I I I Metres 3.3


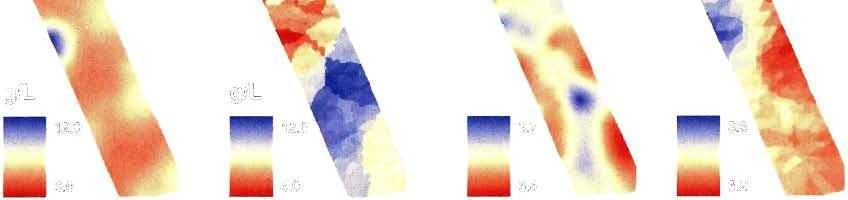
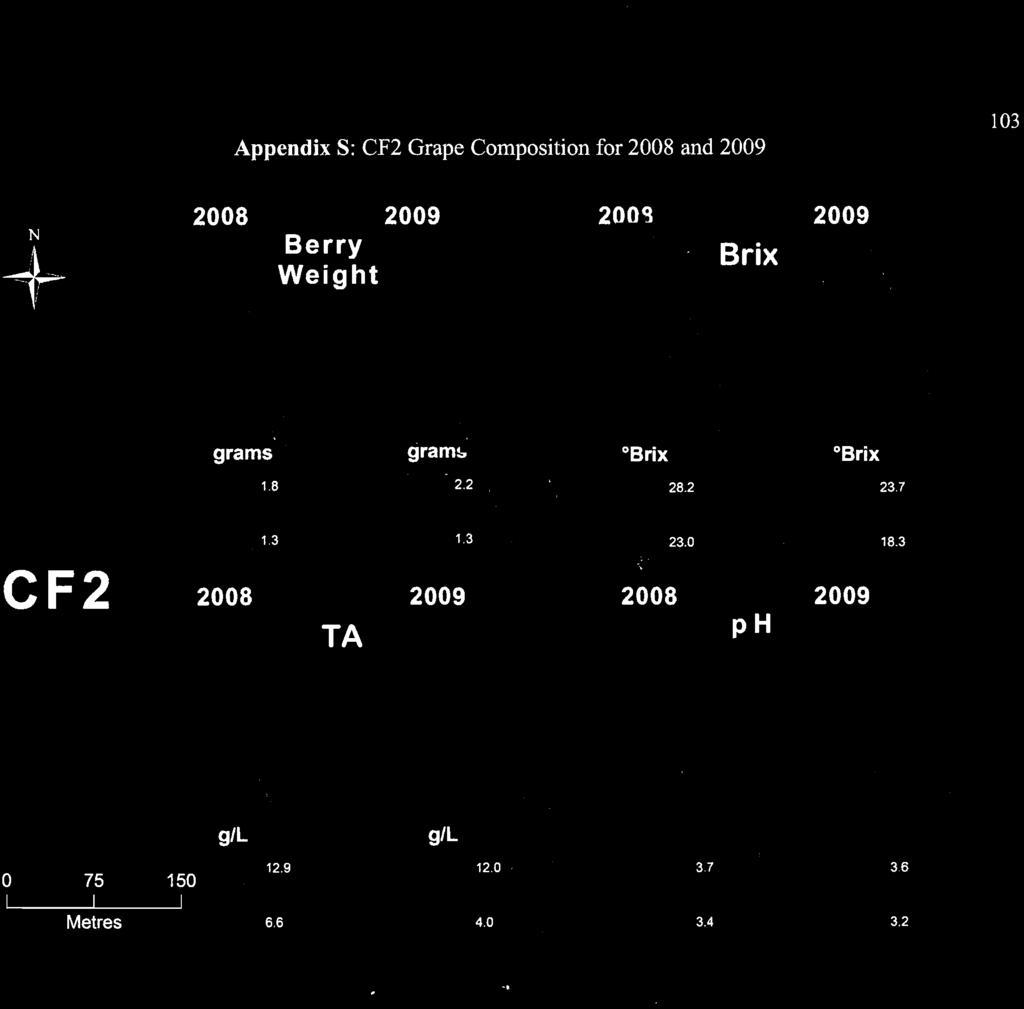
112 Appendix S: CF2 Grape Composition for 2008 and N Brix 2009 Brix CF TA : ph gil o 75 I Metres 150 I 6.6


113 Appendix T: CHI Grape Composition for 2008 and N 2008 Berry Weight Brix 2009 grams Brix Brix 2, , TA 2009 ph 2009 gil gil , CH Metres 150
Airborne Remote Sensing for Precision Viticulture in Niagara. Ralph Brown School of Engineering University of Guelph
 Airborne Remote Sensing for Precision Viticulture in Niagara Ralph Brown School of Engineering University of Guelph Why the interest in precision viticulture? Highly variable regions in Niagara due to
Research Proposal: Viticultural Terroir in Ashtabula County, Ohio
 Research Proposal: Viticultural Terroir in Ashtabula County, Ohio Prepared for: Applications in Cartography and Geographic Information Systems Prepared by: Paul Boehnlein, Undergraduate June 3, 2008 Summary
Geographic Information Systemystem
 Agenda Time 9:00:-9:20 9-20 9:50 9:50 10:00 Topic Intro to GIS/Mapping and GPS Applications for GIS in Vineyards Break Presenter Kelly Bobbitt, Mike Bobbitt and Associates Kelly Bobbitt, Mike Bobbitt and
Increasing the efficiency of forecasting winegrape yield by using information on spatial variability to select sample sites
 Increasing the efficiency of forecasting winegrape yield by using information on spatial variability to select sample sites Andrew Hall, Research Fellow, Spatial Science Leo Quirk, Viticulture Extension
1. Continuing the development and validation of mobile sensors. 3. Identifying and establishing variable rate management field trials
 Project Overview The overall goal of this project is to deliver the tools, techniques, and information for spatial data driven variable rate management in commercial vineyards. Identified 2016 Needs: 1.
Roaster/Production Operative. Coffee for The People by The Coffee People. Our Values: The Role:
 Are you an enthusiastic professional with a passion for ensuring the highest quality and service for your teams? At Java Republic we are currently expanding, so we are looking for an Roaster/Production
Oregon Wine Industry Sustainable Showcase. Gregory V. Jones
 Oregon Wine Industry Sustainable Showcase Gregory V. Jones Panel Framework Oregon wineries and vineyards are implementing innovative sustainability and environmental practices across the entire system
Colorado State University Viticulture and Enology. Grapevine Cold Hardiness
 Colorado State University Viticulture and Enology Grapevine Cold Hardiness Grapevine cold hardiness is dependent on multiple independent variables such as variety and clone, shoot vigor, previous season
Is Fair Trade Fair? ARKANSAS C3 TEACHERS HUB. 9-12th Grade Economics Inquiry. Supporting Questions
 9-12th Grade Economics Inquiry Is Fair Trade Fair? Public Domain Image Supporting Questions 1. What is fair trade? 2. If fair trade is so unique, what is free trade? 3. What are the costs and benefits
Coffee zone updating: contribution to the Agricultural Sector
 1 Coffee zone updating: contribution to the Agricultural Sector Author¹: GEOG. Graciela Romero Martinez Authors²: José Antonio Guzmán Mailing address: 131-3009, Santa Barbara of Heredia Email address:
March 2017 DATA-DRIVEN INSIGHTS FOR VINEYARDS
 March 2017 DATA-DRIVEN INSIGHTS FOR VINEYARDS What do great wine, water on mars and drones have in common? Today: Drone Technologies in Viticulture AGENDA Technology Context: big data, precision ag, drones
Sustainable oenology and viticulture: new strategies and trends in wine production
 Sustainable oenology and viticulture: new strategies and trends in wine production Dr. Vassileios Varelas Oenologist-Agricultural Engineer Wine and Vine Consultant Sweden Aim of the presentation Offer
Washington Wine Commission: Wine industry grows its research commitment
 PROGRESS EDITION MARCH 22, 2016 10:33 PM Washington Wine Commission: Wine industry grows its research commitment HIGHLIGHTS New WSU Wine Science Center a significant step up for industry Development of
2. The proposal has been sent to the Virtual Screening Committee (VSC) for evaluation and will be examined by the Executive Board in September 2008.
 for evaluation and will be examined by the Executive Board in September 2008.") WP Board 1052/08 International Coffee Organization Organización Internacional del Café Organização Internacional do Café Organisation Internationale du Café 20 August 2008 English only Projects/Common
WP Board 1052/08 International Coffee Organization Organización Internacional del Café Organização Internacional do Café Organisation Internationale du Café 20 August 2008 English only Projects/Common
Joseph G. Alfieri 1, William P. Kustas 1, John H. Prueger 2, Lynn G. McKee 1, Feng Gao 1 Lawrence E. Hipps 3, Sebastian Los 3
 Joseph G. Alfieri 1, William P. Kustas 1, John H. Prueger 2, Lynn G. McKee 1, Feng Gao 1 Lawrence E. Hipps 3, Sebastian Los 3 1 USDA, ARS, Hydrology & Remote Sensing Lab, Beltsville MD 2 USDA,ARS, National
Coffee Eco-labeling: Profit, Prosperity, & Healthy Nature? Brian Crespi Andre Goncalves Janani Kannan Alexey Kudryavtsev Jessica Stern
 Coffee Eco-labeling: Profit, Prosperity, & Healthy Nature? Brian Crespi Andre Goncalves Janani Kannan Alexey Kudryavtsev Jessica Stern Presentation Outline I. Introduction II. III. IV. Question at hand
Healthy Soils for a Sustainable Viticulture John Reganold
 Healthy Soils for a Sustainable Viticulture John Reganold Department of Crop & Soil Sciences Pullman, W Sustainable Viticulture Economically viable Environmentally sound Socially responsible QuickTime
Shaping the Future: Production and Market Challenges
 Call for Papers Dear Sir/Madam At the invitation of the Ministry of Stockbreeding, Agriculture, and Fisheries of the Oriental Republic of Uruguay, the 41th World Congress of Vine and Wine and the 16 th
Sustainable Coffee Challenge FAQ
 Sustainable Coffee Challenge FAQ What is the Sustainable Coffee Challenge? The Sustainable Coffee Challenge is a pre-competitive collaboration of partners working across the coffee sector, united in developing
Growing Cabernet Sauvignon at Wynns Coonawarra Estate
 Growing Cabernet Sauvignon at Wynns Coonawarra Estate The influence of vintage, clones and site Ben Harris Vineyard Manager Wynns Coonawarra Estate Coonawarra Red and White Winegrape Varieties Red (90%)
Literature Review. Jesús René Cázares Juárez (141428)
") Literature Review Jesús René Cázares Juárez (141428) Sustainable wine tourism development applied to the wine valleys in Baja California The development of wine tourism in many wine-producing regions around
Literature Review Jesús René Cázares Juárez (141428) Sustainable wine tourism development applied to the wine valleys in Baja California The development of wine tourism in many wine-producing regions around
Academic Year 2014/2015 Assessment Report. Bachelor of Science in Viticulture, Department of Viticulture and Enology
 Academic Year 2014/2015 Assessment Report Bachelor of Science in Viticulture, Department of Viticulture and Enology Due to changes in faculty assignments, there was no SOAP coordinator for the Department
Grape Growers of Ontario Developing key measures to critically look at the grape and wine industry
 Grape Growers of Ontario Developing key measures to critically look at the grape and wine industry March 2012 Background and scope of the project Background The Grape Growers of Ontario GGO is looking
LIVE Wines Backgrounder Certified Sustainable Northwest Wines
 LIVE Wines Backgrounder Certified Sustainable Northwest Wines Principled Wine Production LIVE Wines are independently certified to meet strict international standards for environmentally and socially responsible
Applied Geomatics--connecting the dots between grapevine physiology,
 Applied Geomatics--connecting the dots between grapevine physiology, terroir, and remote sensing Andrew Reynolds, Brock University Ralph Brown, University of Guelph Matthieu Marciniak; David Ledderhoff;
JCAST. Department of Viticulture and Enology, B.S. in Viticulture
 JCAST Department of Viticulture and Enology, B.S. in Viticulture Student Outcomes Assessment Plan (SOAP) I. Mission Statement The mission of the Department of Viticulture and Enology at California State
MBA 503 Final Project Guidelines and Rubric
 MBA 503 Final Project Guidelines and Rubric Overview There are two summative assessments for this course. For your first assessment, you will be objectively assessed by your completion of a series of MyAccountingLab
FINAL REPORT TO AUSTRALIAN GRAPE AND WINE AUTHORITY. Project Number: AGT1524. Principal Investigator: Ana Hranilovic
 Collaboration with Bordeaux researchers to explore genotypic and phenotypic diversity of Lachancea thermotolerans - a promising non- Saccharomyces for winemaking FINAL REPORT TO AUSTRALIAN GRAPE AND WINE
Big Data and the Productivity Challenge for Wine Grapes. Nick Dokoozlian Agricultural Outlook Forum February
 Big Data and the Productivity Challenge for Wine Grapes Nick Dokoozlian Agricultural Outlook Forum February 2016 0 Big Data and the Productivity Challenge for Wine Grapes Outline Current production challenges
is pleased to introduce the 2017 Scholarship Recipients
 is pleased to introduce the 2017 Scholarship Recipients Congratulations to Elizabeth Burzynski Katherine East Jaclyn Fiola Jerry Lin Sydney Morgan Maria Smith Jake Uretsky Elizabeth Burzynski Cornell University
RESOLUTION OIV-ECO
 RESOLUTION OIV-ECO 563-2016 TRAINING PROGRAMS FOR OENOLOGISTS THE GENERAL ASSEMBLY, based on the work of the FORMAT Expert Group, CONSIDERING the resolution OIV-ECO 492-2013 providing the definition of
Fairfield Public Schools Family Consumer Sciences Curriculum Food Service 30
 Fairfield Public Schools Family Consumer Sciences Curriculum Food Service 30 Food Service 30 BOE Approved 05/09/2017 1 Food Service 30 Food Service 30 Students will continue to participate in the school
DETERMINANTS OF DINER RESPONSE TO ORIENTAL CUISINE IN SPECIALITY RESTAURANTS AND SELECTED CLASSIFIED HOTELS IN NAIROBI COUNTY, KENYA
 DETERMINANTS OF DINER RESPONSE TO ORIENTAL CUISINE IN SPECIALITY RESTAURANTS AND SELECTED CLASSIFIED HOTELS IN NAIROBI COUNTY, KENYA NYAKIRA NORAH EILEEN (B.ED ARTS) T 129/12132/2009 A RESEACH PROPOSAL
Draft Document: Not for Distribution SUSTAINABLE COFFEE PARTNERSHIP: OUTLINE OF STRUCTURE AND APPROACH
 CONFÉRENCE DES NATIONS UNIES SUR LE COMMERCE ET LE DÉVELOPPEMENT UNITED NATIONS CONFERENCE ON TRADE AND DEVELOPMENT SUSTAINABLE COFFEE PARTNERSHIP: OUTLINE OF STRUCTURE AND APPROACH 1.0 Rationale and Overview
Work Sample (Minimum) for 10-K Integration Assignment MAN and for suppliers of raw materials and services that the Company relies on.
 for 10-K Integration Assignment MAN and for suppliers of raw materials and services that the Company relies on.") Work Sample (Minimum) for 10-K Integration Assignment MAN 4720 Employee Name: Your name goes here Company: Starbucks Date of Your Report: Date of 10-K: PESTEL 1. Political: Pg. 5 The Company supports the
Work Sample (Minimum) for 10-K Integration Assignment MAN 4720 Employee Name: Your name goes here Company: Starbucks Date of Your Report: Date of 10-K: PESTEL 1. Political: Pg. 5 The Company supports the
Wine Clusters Equal Export Success
 University of Wollongong Research Online Faculty of Commerce - Papers (Archive) Faculty of Business 2004 Wine Clusters Equal Export Success D. K. Aylward University of Wollongong, daylward@uow.edu.au Publication
Reputation Tapping: Examining Consumer Response to Wine Appellation Information
 Reputation Tapping: Examining Consumer Response to Wine Appellation Information Brad Rickard, Assistant Professor Charles H. Dyson School of Applied Economics and Management Cornell University Presented
Réseau Vinicole Européen R&D d'excellence
 Réseau Vinicole Européen R&D d'excellence Lien de la Vigne / Vinelink 1 Paris, 09th March 2012 R&D is strategic for the sustainable competitiveness of the EU wine sector However R&D focus and investment
Vineyard Manager Position: Pay: Opening Date: Closing Date: Required Documents: Direct Applications and Questions to: Vineyard Manager
 Vineyard Manager Vacancy at Vox Vineyards (TerraVox) 19310 NW Farley Hampton Rd, Kansas City, MO 64153 Position: Vineyard Manager Pay: Commensurate with Experience plus Benefits Opening Date: November
The Roles of Social Media and Expert Reviews in the Market for High-End Goods: An Example Using Bordeaux and California Wines
 The Roles of Social Media and Expert Reviews in the Market for High-End Goods: An Example Using Bordeaux and California Wines Alex Albright, Stanford/Harvard University Peter Pedroni, Williams College
EFFECT OF TOMATO GENETIC VARIATION ON LYE PEELING EFFICACY TOMATO SOLUTIONS JIM AND ADAM DICK SUMMARY
 EFFECT OF TOMATO GENETIC VARIATION ON LYE PEELING EFFICACY TOMATO SOLUTIONS JIM AND ADAM DICK 2013 SUMMARY Several breeding lines and hybrids were peeled in an 18% lye solution using an exposure time of
Eco-Schools USA Sustainable Food Audit
 Eco-Schools USA Sustainable Food Audit Learning Objectives Discuss the importance of health and nutrition and discover the impacts food can have on the body. Monitor their food choices, making healthier,
INVESTIGATIONS INTO THE RELATIONSHIPS OF STRESS AND LEAF HEALTH OF THE GRAPEVINE (VITIS VINIFERA L.) ON GRAPE AND WINE QUALITIES
 ON GRAPE AND WINE QUALITIES") INVESTIGATIONS INTO THE RELATIONSHIPS OF STRESS AND LEAF HEALTH OF THE GRAPEVINE (VITIS VINIFERA L.) ON GRAPE AND WINE QUALITIES by Reuben Wells BAgrSc (Hons) Submitted in fulfilment of the requirements
INVESTIGATIONS INTO THE RELATIONSHIPS OF STRESS AND LEAF HEALTH OF THE GRAPEVINE (VITIS VINIFERA L.) ON GRAPE AND WINE QUALITIES by Reuben Wells BAgrSc (Hons) Submitted in fulfilment of the requirements
Fairtrade Designation Endorsement
 Fairtrade Designation Endorsement Recommendation: That the May 8, 2013, Corporate Services report 2013COC042, be received for information. Report Summary This report provides information about Fairtrade
POSITION DESCRIPTION. DATE OF VERSION: January Position Summary:
 POSITION DESCRIPTION POSITION TITLE: DEPARTMENT: REPORTING TO: Graduate / Wine Ambassador Global Marketing Graduate Manager LOCATION: Various PR JOB BAND: Local Banding F DATE OF VERSION: January 2018
COUNTRY PLAN 2017: TANZANIA
 COUNTRY PLAN 2017: TANZANIA COUNTRY PLAN 2017: TANZANIA VISION2020 PRIORITIES AND NATIONAL STRATEGY PRIORITIES Vision2020 SDG s No poverty Quality education Gender equality Decent work Responsible Production
CHAPTER I BACKGROUND
 CHAPTER I BACKGROUND 1.1. Problem Definition Indonesia is one of the developing countries that already officially open its economy market into global. This could be seen as a challenge for Indonesian local
Quality of Canadian oilseed-type soybeans 2016
 ISSN 1705-9453 Quality of Canadian oilseed-type soybeans 2016 Véronique J. Barthet Program Manager, Oilseeds Section Contact: Véronique J. Barthet Program Manager, Oilseeds Section Tel : 204 984-5174 Email:
Napa County Planning Commission Board Agenda Letter
 Agenda Date: 7/1/2015 Agenda Placement: 10A Continued From: May 20, 2015 Napa County Planning Commission Board Agenda Letter TO: FROM: Napa County Planning Commission John McDowell for David Morrison -
POSITION DESCRIPTION. DATE OF VERSION: August Position Summary:
 POSITION DESCRIPTION POSITION TITLE: DEPARTMENT: REPORTING TO: Wine Ambassador Global Marketing Graduate Manager LOCATION: Various PR JOB BAND: Local Banding F DATE OF VERSION: August 2016 Position Summary:
UNIVERSITY OF PLYMOUTH SUSTAINABLE FOOD PLAN
 UNIVERSITY OF PLYMOUTH SUSTAINABLE FOOD PLAN 2014 2020 Date Section Page Issue Modifications Approved (Print name) 28/03/2011 Issued. 1 First issue Procurement 09/07/2014 All All 2 Updated from original
LAKE ONTARIO BEAMSVILLE BENCH VINEMOUNT RIDGE STATISTICS
 APPELLATION MAP Appellation Overview Diverse terroir, vine friendly micro climates, remarkably complex wines The Niagara Peninsula has the largest planted area of all viticulture areas in Canada. Situated
Research Report: Use of Geotextiles to Reduce Freeze Injury in Ontario Vineyards
 Research Report: Use of Geotextiles to Reduce Freeze Injury in Ontario Vineyards Prepared by Dr. Jim Willwerth CCOVI, Brock University February 26, 20 1 Cool Climate Oenology & Viticulture Institute Brock
Structures of Life. Investigation 1: Origin of Seeds. Big Question: 3 rd Science Notebook. Name:
 3 rd Science Notebook Structures of Life Investigation 1: Origin of Seeds Name: Big Question: What are the properties of seeds and how does water affect them? 1 Alignment with New York State Science Standards
BREWERS ASSOCIATION CRAFT BREWER DEFINITION UPDATE FREQUENTLY ASKED QUESTIONS. December 18, 2018
 BREWERS ASSOCIATION CRAFT BREWER DEFINITION UPDATE FREQUENTLY ASKED QUESTIONS December 18, 2018 What is the new definition? An American craft brewer is a small and independent brewer. Small: Annual production
/536 Level 3 Professional Chefs (Kitchen and Larder) Version 1.1 September Sample Mark Scheme
 Version 1.1 September Sample Mark Scheme") 6100-036/536 Level 3 Professional Chefs (Kitchen and Larder) Version 1.1 September 2017 Sample Mark Scheme 1 List two food safety requirements that must be considered when purchasing equipment for use
6100-036/536 Level 3 Professional Chefs (Kitchen and Larder) Version 1.1 September 2017 Sample Mark Scheme 1 List two food safety requirements that must be considered when purchasing equipment for use
The 2006 Economic Impact of Nebraska Wineries and Grape Growers
 A Bureau of Business Economic Impact Analysis From the University of Nebraska Lincoln The 2006 Economic Impact of Nebraska Wineries and Grape Growers Dr. Eric Thompson Seth Freudenburg Prepared for The
Francis MACARY UR ETBX, Irstea The 31st of March to the 2nd of April,
 Using multiple criteria decision aid to improve best agricultural and environmental management practices in the area of a big wine company, near Bordeaux Francis MACARY UR ETBX, Irstea francis.macary@irstea.fr
Smart Specialisation Strategy for REMTh: setting priorities
 JOINT RESEARCH CENTRE Smart Specialisation Strategy for REMTh: setting priorities Michalis METAXAS Innovatia Systems What is Smart Specialisation? = fact based: all assets + capabilities + bottlenecks
Results from the First North Carolina Wine Industry Tracker Survey
 Results from the First North Carolina Wine Industry Tracker Survey - 2009 Dr. Michael R. Evans Director and Professor of Hospitality and Tourism Management and Dr. James E. Stoddard Professor of Marketing
"Primary agricultural commodity trade and labour market outcome
 "Primary agricultural commodity trade and labour market outcomes" FERDI - Fondation pour les Etudes et Recherches sur le Developpement International African Economic Conference 2014 - Knowledge and innovation
VITICULTURE AND ENOLOGY
 VITICULTURE AND ENOLOGY Class L-25: Agricultural and Forest Science and Technology http://www.enol.unimi.it/ DIRECTOR OF THE BACHELOR S PROGRAMME Prof. Attilio Scienza Department of Crop Production Tree
UNIT TITLE: PROVIDE ADVICE TO PATRONS ON FOOD AND BEVERAGE SERVICES NOMINAL HOURS: 80
 UNIT TITLE: PROVIDE ADVICE TO PATRONS ON FOOD AND BEVERAGE SERVICES NOMINAL HOURS: 80 UNIT NUMBER: D1.HBS.CL5.10 UNIT DESCRIPTOR: This unit deals with the skills and knowledge required to provide advice
Plant root activity is limited to the soil bulbs Does not require technical expertise to. wetted by the water bottle emitter implement
 Case Study Bottle Drip Irrigation Case Study Background Data Tool Category: Adaptation on the farm Variety: Robusta Climatic Hazard: Prolonged dry spells and high temperatures Expected Outcome: Improved
The aim of the thesis is to determine the economic efficiency of production factors utilization in S.C. AGROINDUSTRIALA BUCIUM S.A.
 The aim of the thesis is to determine the economic efficiency of production factors utilization in S.C. AGROINDUSTRIALA BUCIUM S.A. The research objectives are: to study the history and importance of grape
The Implications of Climate Change for the Ontario Wine Industry
 The Implications of Climate Change for the Ontario Wine Industry Tony B. Shaw Department of Geography and Cool Climate Oenology and Viticulture Institute Brock University Climate Change Most scientists
CENTRAL OTAGO WINEGROWERS ASSOCIATION (INC.)
") CENTRAL OTAGO WINEGROWERS ASSOCIATION (INC.) Executive Officer: Natalie Wilson President: James Dicey Central Otago Winegrowers Assn E: james@grapevision.co.nz P.O. Box 155 Ph. 027 445 0602 Cromwell, Central
CENTRAL OTAGO WINEGROWERS ASSOCIATION (INC.) Executive Officer: Natalie Wilson President: James Dicey Central Otago Winegrowers Assn E: james@grapevision.co.nz P.O. Box 155 Ph. 027 445 0602 Cromwell, Central
ARIMNet2 Young Researchers Seminar
 ARIMNet2 Young Researchers Seminar How to better involve end-users throughout the research process to foster innovation-driven research for a sustainable Mediterranean agriculture at the farm and local
Influence of GA 3 Sizing Sprays on Ruby Seedless
 University of California Tulare County Cooperative Extension Influence of GA 3 Sizing Sprays on Ruby Seedless Pub. TB8-97 Introduction: The majority of Ruby Seedless table grapes grown and marketed over
NZ GEOGRAPHICAL INDICATION (GI)
") NZ GEOGRAPHICAL INDICATION (GI) EXAMINATION CHECKSHEET Application information (reg 7) and formalities Box Reference Number 1 GI Number: 1015 GI Name: WAIHEKE ISLAND 2 New Zealand GI correctly selected
NZ GEOGRAPHICAL INDICATION (GI) EXAMINATION CHECKSHEET Application information (reg 7) and formalities Box Reference Number 1 GI Number: 1015 GI Name: WAIHEKE ISLAND 2 New Zealand GI correctly selected
UNIVERSITY OF PLYMOUTH FAIRTRADE PLAN
 UNIVERSITY OF PLYMOUTH FAIRTRADE PLAN 2014 2020 Date Section Page Issue Modifications Approved (Print name) December Issued. 1 First issue Linda Morris 2012 09/07/2014 All All 2 Updated from original Policy
Serving the New Senior Managing Menus and Dining. Senior Living Culinary and Nutrition Summit April 6, 2016
 Serving the New Senior Managing Menus and Dining Senior Living Culinary and Nutrition Summit April 6, 2016 2 Today s senior is a luxury-oriented consumer. What does the modern day resident want in foodservices
WACS culinary certification scheme
 WACS culinary certification scheme About this document This document provides an overview of the requirements that applicants need to meet in order to achieve the WACS Certified Chef de Cuisine professional
ANALYSIS OF THE EVOLUTION AND DISTRIBUTION OF MAIZE CULTIVATED AREA AND PRODUCTION IN ROMANIA
 ANALYSIS OF THE EVOLUTION AND DISTRIBUTION OF MAIZE CULTIVATED AREA AND PRODUCTION IN ROMANIA Agatha POPESCU University of Agricultural Sciences and Veterinary Medicine, Bucharest, 59 Marasti, District
Expressions of Interest:
 Expressions of Interest: Independent Industry Membership of the National Wine and Grape Industry Centre (NWGIC) Board Expressions of interest are invited for membership of the National Wine and Grape Industry
World of Wine: From Grape to Glass Syllabus
 World of Wine: From Grape to Glass Syllabus COURSE OVERVIEW Have you always wanted to know more about how grapes are grown and wine is made? Perhaps you like a specific wine, but can t pinpoint the reason
Sample. TO: Prof. Hussain FROM: GROUP (Names of group members) DATE: October 09, 2003 RE: Final Project Proposal for Group Project
 DATE: October 09, 2003 RE: Final Project Proposal for Group Project") Sample TO: Prof. Hussain FROM: GROUP (Names of group members) DATE: October 09, 2003 RE: Final Project Proposal for Group Project INTRODUCTION Our group has chosen Chilean Wine exports for our research
Sample TO: Prof. Hussain FROM: GROUP (Names of group members) DATE: October 09, 2003 RE: Final Project Proposal for Group Project INTRODUCTION Our group has chosen Chilean Wine exports for our research
Quality of Canadian oilseed-type soybeans 2017
 ISSN 2560-7545 Quality of Canadian oilseed-type soybeans 2017 Bert Siemens Oilseeds Section Contact: Véronique J. Barthet Program Manager, Oilseeds Section Grain Research Laboratory Tel : 204 984-5174
Final Report. TITLE: Developing Methods for Use of Own-rooted Vitis vinifera Vines in Michigan Vineyards
 Final Report TITLE: Developing Methods for Use of Own-rooted Vitis vinifera Vines in Michigan Vineyards PRINCIPAL INVESTIGATOR: Thomas J. Zabadal OBJECTIVES: (1) To determine the ability to culture varieties
HSC Geography. Year 2016 Mark Pages 30 Published Feb 7, Geography Notes. By Annabelle (97.35 ATAR)
") HSC Geography Year 2016 Mark 93.00 Pages 30 Published Feb 7, 2017 Geography Notes By Annabelle (97.35 ATAR) Powered by TCPDF (www.tcpdf.org) Your notes author, Annabelle. Annabelle achieved an ATAR of
HSC Geography Year 2016 Mark 93.00 Pages 30 Published Feb 7, 2017 Geography Notes By Annabelle (97.35 ATAR) Powered by TCPDF (www.tcpdf.org) Your notes author, Annabelle. Annabelle achieved an ATAR of
NZ GEOGRAPHICAL INDICATION (GI)
") NZ GEOGRAPHICAL INDICATION (GI) EXAMINATION CHECKSHEET Application information (reg 7) and formalities Box Reference Number 1 GI Number: 1021 GI Name: MATAKANA 2 New Zealand GI correctly selected (cf foreign)
NZ GEOGRAPHICAL INDICATION (GI) EXAMINATION CHECKSHEET Application information (reg 7) and formalities Box Reference Number 1 GI Number: 1021 GI Name: MATAKANA 2 New Zealand GI correctly selected (cf foreign)
BVM PROSPECTUS. DAMIAN ADAMS Ph E MIKE CROAD Ph E
 BVM PROSPECTUS Berakah Vineyard Management is a market leader in all aspects of vineyard operations, from vineyard establishment through to cost-leading vineyard management and wine company relationship
Starbucks BRAZIL. Presentation Outline
 Starbucks BRAZIL Prepared by: Aminata Ouattara Daniele Albagli Melissa Butz Matvey Kostromichev Presentation Outline Introduction Mission & Objectives PESTEL Analysis PORTER Analysis SWOT Analysis Capabilities
Sustainable Coffee Economy
 Seeking a Balance Sustainable Coffee Economy Brazilian initiatives and experience Environmental Sustainability Respecting the limits of capacity Economic Sustainability support of ecosystems Rational and
Terroir: a concept to bring added value for producers and consumers. Alessandra Roversi
 Terroir: a concept to bring added value for producers and consumers Alessandra Roversi alessandra@al-gusto.ch Objectives of the presentation A way of thinking food Academic + Practice Sense of place Dynamic,
CERTIFIED SUSTAINABLE ANNUAL REPORT 2017
 ANNUAL REPORT 2017 Welcome to the California Sustainable Winegrowing Alliance s (CSWA s) first Certified California Sustainable Winegrowing ( ) Annual Report, a yearly update on statistics and progress
Cost of Establishment and Operation Cold-Hardy Grapes in the Thousand Islands Region
 Cost of Establishment and Operation Cold-Hardy Grapes in the Thousand Islands Region Miguel I. Gómez, Dayea Oh and Sogol Kananizadeh Dyson School of Applier Economics and Management, Cornell University
Global Perspectives Grant Program
 UW College of Agriculture and Natural Resources Global Perspectives Grant Program Project Report Instructions 1. COVER PAGE Award Period (e.g. Spring 2012): Summer 2015 Principle Investigator(s)_Sadanand
1 a) State three leadership styles used by a food and beverage supervisor. (3 marks)
 State three leadership styles used by a food and beverage supervisor. (3 marks)") Sample Mark Scheme 1 State three leadership styles used by a food and beverage supervisor. For each style of leadership stated in, explain a situation when it would be appropriate to be used. Autocratic
Sample Mark Scheme 1 State three leadership styles used by a food and beverage supervisor. For each style of leadership stated in, explain a situation when it would be appropriate to be used. Autocratic
Buying Filberts On a Sample Basis
 E 55 m ^7q Buying Filberts On a Sample Basis Special Report 279 September 1969 Cooperative Extension Service c, 789/0 ite IP") 0, i mi 1910 S R e, `g,,ttsoliktill:torvti EARs srin ITQ, E,6
The Secret to Sustainability of the Global Tea Industry
 The Secret to Sustainability of the Global Tea Industry Presented by Joe Simrany, President, Tea Association of the USA, Inc. FAO Meeting New Delhi, India May 12-14, 2010 Secret to Sustainability Background
Proposal for the Approval of a New Subdivision of the. Okanagan Valley Geographical Indication NARAMATA BENCH SUB-GI.
 Proposal for the Approval of a New Subdivision of the Okanagan Valley Geographical Indication NARAMATA BENCH SUB-GI 23 April 2018 Prepared by the Sub-GI Committee, Naramata Bench Introduction This document
Running Head: MESSAGE ON A BOTTLE: THE WINE LABEL S INFLUENCE p. 1. Message on a bottle: the wine label s influence. Stephanie Marchant
 Running Head: MESSAGE ON A BOTTLE: THE WINE LABEL S INFLUENCE p. 1 Message on a bottle: the wine label s influence Stephanie Marchant West Virginia University Running Head: MESSAGE ON A BOTTLE: THE WINE
MARKETING TRENDS FOR COCONUT PRODUCTS IN SRI LANKA
 ,'6 b l\o L( cl/\r!y ~?\ 1IJ7'X ~.fsool- CR Cc~~ ~t).> MARKETING TRENDS FOR COCONUT PRODUCTS IN SRI LANKA 1950-1981 By Sunil Chandra ~~nnapperuma B.A. (Ceylon) A dissertation submitted in partial fulfilment
Development of a Master Class Curriculum on Wines of Nova Scotia
 Request for Proposals for Development of a Master Class Curriculum on Wines of Nova Scotia RFP Number: 18-001 Issued By: Canadian Association of Professional Sommeliers Atlantic Chapter (CAPS-AC) Representative:
Elderberry Ripeness and Determination of When to Harvest. Patrick Byers, Regional Horticulture Specialist,
 Elderberry Ripeness and Determination of When to Harvest Patrick Byers, Regional Horticulture Specialist, byerspl@missouri.edu 1. Ripeness is an elusive concept for many people a. Ripeness is often entirely
Coffee and climate change. Effectively guiding forward looking climate change adaptation of global coffee supply chains
 Coffee and climate change Effectively guiding forward looking climate change adaptation of global coffee supply chains The future of coffee production The future of coffee production Picture: N. Palmer
KOREA MARKET REPORT: FRUIT AND VEGETABLES
 KOREA MARKET REPORT: FRUIT AND VEGETABLES 주한뉴질랜드대사관 NEW ZEALAND EMBASSY SEOUL DECEMBER 2016 Page 2 of 6 Note for readers This report has been produced by MFAT and NZTE staff of the New Zealand Embassy
Tucson Cactus and Succulent Society. Opuntioid Garden Proposal. Tucson Prickly Park
 Tucson Cactus and Succulent Society Opuntioid Garden Proposal Tucson Prickly Park December 6, 2010 Prepared by: Jessie Byrd Desert Green Design P a g e 1 TUCSON CACTUS AND SUCCULENT SOCIETY: Started in
Fleurieu zone (other)
") Fleurieu zone (other) Incorporating Southern Fleurieu and Kangaroo Island wine regions, as well as the remainder of the Fleurieu zone outside all GI regions Regional summary report 2006 South Australian
Fleurieu zone (other) Incorporating Southern Fleurieu and Kangaroo Island wine regions, as well as the remainder of the Fleurieu zone outside all GI regions Regional summary report 2006 South Australian