Development of sensory tools for quality grading of Cyclopia genistoides, C. longifolia, C. maculata and C. subternata herbal teas
|
|
|
- Thomasine Snow
- 6 years ago
- Views:
Transcription

1 Development of sensory tools for quality grading of Cyclopia genistoides, C. longifolia, C. maculata and C. subternata herbal teas Lené Mari Erasmus Thesis presented in partial fulfilment of the requirements for the degree of Master of Science in Food Science Department of Food Science Faculty of AgriSciences Stellenbosch University Supervisor: M. Muller Co-supervisor: Prof. E. Joubert March 2015
2 DECLARATION By submitting this dissertation electronically, I declare that the entirety of the work contained therein is my own, original work, that I am the sole author thereof (save to the extent explicitly otherwise stated), that reproduction and publication thereof by Stellenbosch University will not infringe any third party rights and that I have not previously in its entirety or in part submitted it for obtaining any qualification. Lené Mari Erasmus Date: March 2015 Copyright 2015 Stellenbosch University All rights reserved i
3 SUMMARY The sensory profiles and the phenolic composition of C. genistoides, C. longifolia, C. maculata and C. subternata, used for commercial production of honeybush tea, were determined with the aim to develop quality control tools, such as sensory wheels and statistical models to predict the basic taste and mouthfeel modalities using compositional data. Optimum fermentation parameters for C. longifolia in terms of aroma and flavour development were determined by investigating eight temperature/time regimes (80 C and 90 C for 8, 16, 24 and 32 h), using descriptive sensory analysis (DSA). Fermentation at 80 C/24 h or 90 C/24 h significantly reduced the negative sensory attributes present and produced a tea of good sensory quality. Previously, 80 C/24 h and 90 /16 h were shown to deliver optimum quality for the other three Cyclopia species. A large sample set (N = 150) consisting of C. genistoides, C. maculata and C. subternata, harvested during three production years (2010, 2012 and 2013), as well as C. longifolia harvested in 2013, was used to develop sensory wheels. All the samples were produced by fermentation at the two optimum fermentation temperature/time regimes of each species. The plant material was sourced from different production regions and plantations to ensure inherent plant variation was accommodated. The characteristic and generic sensory profile of honeybush was defined as a fynbos-floral, woody, fynbos-sweet aroma and flavour, with a sweet taste and slightly astringent mouthfeel. Species-specific sensory profiles were also identified. Cyclopia genistoides had a strong rose geranium flavour and a perceptible bitter taste, whereas C. longifolia had a similar sensory profile to that of C. genistoides, however, C. longifolia s rose geranium flavour was less prominent and its bitter taste not perceptible. Cyclopia maculata and C. subternata were both described as having caramel and other sweet-associated notes and a slightly astringent mouthfeel. These results were used to develop a generic sensory wheel for both aroma and flavour, as well as similar wheels for each of the four Cyclopia species. Each sensory wheel reflects the relative intensity of the sensory attributes, while prevalence of the major attributes were accommodated in accompanying bar graphs. Sorting was investigated as a rapid profiling technique to serve as an alternative to the standard profiling method, descriptive sensory analysis (DSA). Instructed sorting was identified as a possible rapid sensory profiling tool for the honeybush industry, especially when samples need to be classified according to a selected list of sensory attributes. Uninstructed sorting can be used when the aim is to categorise a group of samples freely according to similarities and thus determine the natural grouping of samples within a broader sample set. The phenolic content of the respective four Cyclopia species differed qualitatively and quantitatively. Of the compounds quantified only four compounds were present in all four species, i.e. hesperidin, vicenin-2, mangiferin and isomangiferin. A larger number of compounds were present in three out of four species. The predictive value of the phenolic compounds towards the intensity of the taste and mouthfeel attributes (sweet, sour, bitter and astringent) was investigated ii
4 using Pearson s correlation analysis, partial least squares regression (PLS) and step-wise regression analysis. Potential candidate predictors for taste and mouthfeel attributes were identified such as the xanthones, mangiferin and isomangiferin, being responsible for bitter taste and astringency. iii
5 UITTREKSEL Die sensoriese profiel en fenoliese samestelling van C. genistoides, C. longifolia, C. maculata en C. subternata, waarvan heuningbostee geproduseer word, is bepaal om gehaltebeheer hulpmiddels te ontwikkel soos sensoriese wiele en statistiese modelle wat die fenoliese samestelling kan gebruik om die basiese smaak en mondgevoel eienskappe van infusies te voorspel. Die optimum fermentasie parameters vir C. longifolia in terma van aroma- en geurontwikkeling is bepaal deur agt temperatuur/tyd kombinasies (80 C en 90 C vir 8, 16, 24 en 32 h) te ondersoek met behulp van beskrywende sensoriese analise (BSA). Fermentasie by 80 C/24 h of 90 C/24 h het n beduidende afname in die negatiewe sensoriese eienskappe veroorsaak en tot die ontwikkeling van tee met ʼn goeie sensoriese kwaliteit gelei. Die fermentasie parameters, 80 C/24 h en 90 /16 h, is voorheen aangedui as die optimale kondisies vir die ontwikkeling van n goeie kwaliteit tee vir die ander drie Cyclopia spesies. 'n Groot stel monsters (N = 150), bestaande uit C. genistoides, C. maculata en C. subternata en ge-oes gedurende drie produksiejare (2010, 2012 en 2013), sowel as C. longifolia ge-oes in 2013, is gebruik om die sensoriese wiele te ontwikkel. Die twee optimum fermentasie temperatuur/tyd kombinasies van elke spesie is gebruik om die monsters te produseer. Plantmateriaal afkomstig van verskillende produksiegebiede en plantasies is versamel ten einde te verseker dat die monsters n betekenisvolle hoeveelheid inherente variasie dek. Die generiese en "karakteristieke" sensoriese profiel wat met heuningbos geassosieer word, is gedefinieer as 'n "fynbos-blomagtige", "houtagtige", "fynbos-soet" aroma en geur, met 'n soet smaak en effense vrank mondgevoel. Spesies-spesifieke sensoriese profiele is ook geïdentifiseer. Cyclopia genistoides het 'n sterk "roos malva" geur en n merkbare bitter smaak. Die sensoriese profiel van C. longifolia is soortgelyk aan dié van C. genistoides, maar sy "roos malva" geur was minder prominent en 'n bitter smaak was nie sensories waarneembaar nie. Beide C. maculata en C. subternata het waarneembare "karamel" en ander "soet-verwante" eienskappe, asook 'n effense vrank mondgevoel getoon. Die volle stel data is uiteindelik gebruik om 'n generiese sensoriese wiel vir heuningbostee, asook spesies-spesifieke sensoriese wiele vir elk van die vier Cyclopia spesies saam te stel. Die onderskeie sensoriese wiele weerspieël die relatiewe intensiteit van elk van die sensoriese eienskappe, terwyl die voorkoms-frekwensie van die onderskeie sensoriese eienskappe in gepaardgaande kolomgrafieke geillustreer is. Sortering, 'n vinnige profileringsmetode, is as alternatief tot die standaard profileringsmetode, beskrywende sensoriese analise (BSA), ondersoek. Gestrukteerde sortering is geïdentifiseer as 'n moontlike hulpmiddel vir die heuningbosbedryf om die sensoriese profiel van heuningbos te bepaal, veral wanneer n groot aantal monsters vinning geklassifiseer moet word volgens 'n lys geselekteerde sensoriese eienskappe. Ongestrukteerde sortering kan gebruik word wanneer die doel is om n groot aantal monsters vrylik te kategoriseer volgens hul sensoriese ooreenkomste of verskille. iv
6 Die fenoliese saamestelling van die vier Cyclopia spesies het kwalitatief en kwantitatief verskil. Slegs vier van die gekwantifiseerde verbindings was teenwoordig in al vier spesies, naamlik hesperidien, visenien-2, mangiferien en isomangiferien. Meer verbindings was egter teenwoordig in drie van die vier spesies. Die voorspellingswaarde van die fenoliese verbindings tot die intensiteit van die smaak en mondgevoel eienskappe (soet, suur, bitter en vrank) is ondersoek met behulp van Pearson se korrelasie, gedeeltelike kleinste-kwadrate regressie (PLS) en stapsgewyse regressie analises. Potensiële "kandidaat voorspellers" vir die smaak en mondgevoel eienskappe, soos die xantone, mangiferien en isomangiferien, verantwoordelik vir 'n bitter smaak en vrank mondgevoel, is geïdentifiseer. v
7 ACKNOWLEDGEMENTS I would like to express my most sincere gratitude to the following people and institutions for their invaluable contributions in helping me to complete this study: Nina Muller, my study leader, for your endless motivation and support. Thank you for encouraging me throughout this study. I am forever grateful for your guidance and willingness to help any time of the day. Prof. Lizette Joubert, my co-supervisor, whose guidance, assistance and attention to detail was invaluable to me throughout this study. Thank you for your valuable input and motivation. The financial assistance of the Research and Technology Fund from DAFF of South Africa (NRF grant number: 92094) towards this research is hereby acknowledged. Opinions expressed and conclusions arrived at, are those of the author and are not necessarily to be attributed to the NRF. Other financial support received through a grant from the Economic Competitive Support Package for Agroprocessing to the ARC by the South African Government. Dr. Dalene de Beer, thank you for your invaluable input, your attention to detail and your technical insights (especially with the HPLC analysis and data interpretation). Marieta van der Rijst, for the statistical analysis of the data. Thank you for your willingness to help and the countless analysing and re-analysing of data, as well as helping with the interpretation thereof. Marlise Joubert, for sourcing, harvesting and transporting honeybush samples and your interest in this project. George Dico, for the preparation of fermented plant material. John, James and Natasha Achilles, for all your help in the lab and assistance preparing countless tea infusions. Thank you for your help and your friendship, and thank you Natasha for the endless cups of tea during the writing of my thesis. I am sincerely grateful. Erika Moelich, for your valuable input and assistance regarding the use of Compusense five program, and for your friendliness and interest in my project. Prof. Martin Kidd, for all the statistical analyses done on the sorting method data. Thank you for all your assistance during the data analysis, as well as the interpretation thereof and for sharing your knowledge. Prof. Tormod Næs, for sharing your knowledge of multivariate analysis and your significant input and advice regarding statistical analyses. Prof. Dominique Valentin, for sharing your knowledge of rapid sensory analysis techniques, especially sorting. Neliswa Matrose, for conducting the total polyphenol analysis. Ilona Steenkamp, for your guidance at the start of my study and your friendly support. vi
8 Alex Schulze, for the HPLC analysis and method development and thank you for all your help during the processing of the data. The sensory panel, for their interest and commitment to this study, as well as their kindness and encouragement. My fellow students, Bianca Jolley, Kirsty Giddey, Alex Bergh, Adel Conradie, Wendy Buys and Brigitte du Preez- Thank you for all the encouragement, advice and support. I am truly grateful for your friendship and without you the past two years would not have been the same. My friends, for your interest in my study and all your encouragement and support. My family, whose confidence in my abilities kept me motivated during this study. Thank you for your endless love, support, guidance and encouragement. Without you this would not have been possible. My Heavenly Farther, for all the blessings in my life and for providing me with the ability and support system to complete this study. Every mountain top is within reach if you just keep climbing. Barry Finlay vii
9 NOTES This thesis is presented in the format prescribed by the Department of Food Science at Stellenbosch University. The structure is in the form of one or more research chapters (papers prepared for publication) and is prefaced by an introduction chapter with the study objectives, followed by a literature review chapter and culminating with a chapter for elaborating a general discussion and conclusion. The language, style and referencing format used are in accordance with the requirements of the International Journal of Food Science and Technology. This thesis represents a compilation of manuscripts where each chapter is an individual entity and some repetition between chapters has, therefore, been unavoidable. viii
10 TABLE OF CONTENTS DECLARATION... i SUMMARY... ii UITTREKSEL... iv ACKNOWLEDGEMENTS... vi NOTES... viii TABLE OF CONTENTS... ix CHAPTER Introduction... 1 CHAPTER Literature review 1. Introduction Honeybush industry History Botanical description and geographical distribution Industry Processing of honeybush Harvesting Fermentation Drying Grading and quality control Sensory profiling Descriptive sensory analysis Rapid sensory methods Sensory profile of honeybush species Chemical composition of honeybush Non-volatile compounds Volatile compounds Interactions between volatile and non-volatile compounds Basic taste modalities and astringency and role of polyphenols Physiology of taste and mouthfeel Taste modulation Sweet Sour ix
11 5.2.3 Bitter Astringency Role of polyphenols in basic taste modalities, astringency and aroma Statistical Methodologies Analysis of DSA data Prediction models Development of a prediction model Prediction models in the industry Quality control tools for industry Sensory lexicons Sensory wheels Conclusions References CHAPTER The effect of fermentation temperature and time on the sensory profile of C. longifolia Abstract Introduction Materials and methods Sample collection and processing of plant material Preparation of infusion Descriptive sensory analysis Training panel Testing procedure Statistical procedures Results and discussion Conclusions References CHAPTER Sensory profile of C. genistoides, C. maculata, C. subternata and C. longifolia and the development of quality control tools for the honeybush industry Abstract Introduction Materials and methods Sample collection and processing of plant material Descriptive sensory analysis (DSA) x
12 2.2.1 Preparation of infusions DSA training and testing procedures Sorting Samples for sorting Sorting panel Sorting procedure Statistical procedures Statistical analysis of DSA data Statistical analysis of sorting data Results and discussion Species-specific and generic sensory profile of honeybush Species-specific profiles of C. genistoides, C. maculata, C. subternata and C. longifolia Overall sensory profile of four honeybush species Development of quality control tools for the honeybush industry Rapid methodologies for sensory profiling Instructed sorting Uninstructed sorting Conclusions References CHAPTER Chemical composition of C. genistoides, C. longifolia, C. maculata and C. subternata as potential predictors of taste and mouthfeel Abstract Introduction Materials and methods Samples and sample preparation Descriptive sensory analysis Chemicals Total polyphenol content Soluble solids content Quantification of individual phenolic compounds Statistical analysis Results Phenolic content and sensory intensities xi
13 3.2 Association between samples, compositional parameters and sensory attributes Prediction of taste and mouthfeel based on phenolic composition Cyclopia genistoides Cyclopia longifolia Cyclopia maculata Cyclopia subternata Combined Cyclopia species data set Discussion of results Phenolic content and sensory intensities Prediction of taste and mouthfeel based on phenolic composition Conclusions References CHAPTER General discussion and conclusions 1. Introduction Establishing of processing parameters for C. longifolia Development of quality-control tools for the honeybush industry Generic and species-specific wheels for honeybush Rapid profiling methods for an industry environment Prediction of taste and mouthfeel attributes based on phenolic composition References ADDENDA Addendum A Addendum B Addendum C Addendum D xii
14 CHAPTER 1 INTRODUCTION Honeybush tea is produced from the Cyclopia shrub that grows along the coastal and mountainous regions of the Eastern and Western Cape provinces of South Africa (Joubert et al., 2011). There are many different Cyclopia species, with more than 20 species described to date (Schutte, 1997). Honeybush is a traditional South African herbal tea and was first mentioned in 1705 when it was believed to be used for medicinal purposes (Du Toit et al., 1998; Joubert et al., 2011). Honeybush remained a largely unknown product until it was rediscovered in the 1990 s (Joubert et al., 2011). The demand for this herbal tea, usually in the so-called fermented format, has increased substantially over the last decade. This demand is driven, in part, by consumer awareness of the link between diet and disease, thus expanding the market for health-promoting food products. Over the past ten years the export of honeybush has grown from 50 to 200 tonnes and currently production cannot supply in the demand or sustain further growth of the market (Joubert et al., 2011). Commercially, C. subternata, C. genistoides and C. intermedia are the major species, however, the focus has recently shifted to include other Cyclopia species such as C. longifolia and C. maculata. With the growing demand, unsustainable harvesting practices are one of the key concerns that are threatening wild populations. Furthermore, expansion of cultivation, identification of new land suitable for honeybush cultivation and conservation are pressing issues faced by industry (SAHTA, 2011). Due to this a breeding program has been developed at Infruitec- Nietvoorbij, one of the research institutes of the Agricultural Research Council of South Africa, to improve plant material for cultivation, largely to increase production per hectare (Bester, 2013). With an increasing demand, another concern is the issue of honeybush being produced in other countries and the fact that such a move could threaten the entire South African honeybush industry. Honeybush has, however, recently been granted Geographical Indication (GI) protection, meaning that the name honeybush belongs to the South African Honeybush Tea Association (SAHTA) and is protected from use elsewhere, unless the product originates from the honeybush growing regions within South Africa (Brand-Jonker, 2014; Anon., 2013). There are a number of examples where GI s have been introduced in EU countries to protect product names and place of origin, e.g. Port in Portugal and Champagne produced in the Champagne region of France (Addor & Grazioli, 2002; Van de Kop & Sautier, 2006). The newly acquired GI status of honeybush will hopefully have a large economic impact on the industry, yet, in order to maintain the GI status the characteristic sensory profile of honeybush in general and the respective commercially viable species in particular need to be described. South Africa s Agricultural Products Standards Act for the export of honeybush tea states that honeybush should have a clean and characteristic taste and aroma of honeybush and that it should be free from any foreign flavours and odours which detrimentally effect the characteristics of the product (Anon., 2000). This description is vague as it does not define the characteristic aroma, flavour or mouthfeel of honeybush as such, or any of the 1
15 Cyclopia species. In previous research, the different Cyclopia species were shown to have different sensory profiles (Theron et al., 2014; Bergh, 2014). The latter, along with environmental conditions and potentially different processing conditions, all lead to a variation in sensory quality. The lack of standardised sensory terminology for honeybush per se, as well for the respective Cyclopia species, opens the door for targeted research. In the 1990 s the overall sensory profile of honeybush has been described as being sweet and honey-like. Other descriptors such as fruity, grassy and burnt were also used (Du Toit & Joubert, 1998; 1999). Theron et al. (2014) recently researched the sensory profile of six Cyclopia species, primarily to determine the characteristic sensory profile of honeybush. The characteristic sensory profile was defined as a combination of floral, fruity, woody, plant-like and sweet-associated aromas with a sweet taste and slightly astringent mouthfeel (Theron et al., 2014). These results were, however, based on a limited number of samples sourced during one production season and further research on a larger sample set is necessary to validate the latter characteristic profile. Studies found that the oxidative chemical reaction, known as fermentation, is responsible for the development of the characteristic aroma and flavour of honeybush (Du Toit & Joubert, 1999). Fermentation of honeybush at 70 C for 60 h or 90 C for 36 h produced an acceptable endproduct (Du Toit & Joubert, 1999). The fermentation conditions currently employed by the industry are, however, not standardised, resulting in inconsistent quality. A recent study has indicated that the processing conditions, 80 C/24 h and 90 C/16 h, could be regarded as optimum fermentation conditions for C. genistoides, C. maculata and C. subternata (Theron, 2012). Subtle differences were observed in the sensory profiles of each species at 80 C/24 h and 90 C/16 h. Cyclopia genistoides fermented at 80 C/24 h developed a strong rose geranium aroma, with this note being less prominent at 90 C. Fermentation of C. maculata at 90 C caused an increase in negative sensory attributes; however, a fermentation time of 24 h effectively reduced the intensity of the negative sensory attributes. It was thus recommended that C. maculata should be fermented at 80 C for 24 h. It was also found that C. subternata can be fermented at 80 C/24 h or 90 C/16 h, depending on whether a floral or apricot jam note is desired (Theron, 2012). These results indicate that the optimum fermentation parameters are different for each of the Cyclopia species tested, yet it still needs to be investigated for other commercially viable Cyclopia species, e.g. C. longifolia. The lack of quality control tools and a standardised grading system are restricting the growth of the South African honeybush industry. Inconsistency in the quality of honeybush can lead to poor acceptance of the product by the market. Therefore, the development of quality control tools, such as a sensory wheel and lexicon for honeybush could aid in the development of consistent products. Internationally, sensory lexicons and sensory wheels are often used in industry as quality control tools. A sensory lexicon consists of a set of terms that describe the sensory profile of a product, as well as definitions and reference standards for clarification of the respective terms (Drake & Civille, 2002). Sensory lexicons are regarded as sophisticated tools in 2
16 sensory research. It can serve as a powerful, qualitative frame of reference when conducting descriptive sensory analysis, but also when determining the broad-based quality of a product (Drake & Civille, 2002). Processors, researchers and industry should use it as tools to monitor product quality and product consistency (Lee & Chambers, 2007). Sensory lexicons have been developed for a variety of products, including rooibos (Koch et al., 2012) and honeybush (Theron et al., 2014). A sensory wheel is a simplified graphical representation of the sensory descriptors included in sensory lexicons (Noble et al., 1984). A variety of aroma and flavour wheels have been developed for food products such as red wine (Gawel et al., 2000), olive oil (Aparicio & Morales, 1995) and rooibos tea (Koch et al., 2012; Jolley, 2014). Theron et al. (2014) developed the first generic sensory wheel for honeybush, however, the latter research suggested that it would be worthwhile to invest in the development of species-specific sensory wheels. Species-specific wheels could be useful during the blending of Cyclopia species, but also when it is important to produce a honeybush product with a specific sensory profile for niche markets. Sensory profiling plays a major role in new product development as flavour greatly affects the acceptance of a food product by consumers. Sensory analysis is considered the ultimate method to measure flavour quality, as instrumental and chemical measures lack the capability to integrate sensory perceptions and the accuracy of human senses (Aparicio et al., 1996). Descriptive sensory analysis (DSA) is regarded as a primary tool when analysing the aroma, flavour, texture, taste and mouthfeel profile of a food product (Lawless, 1999). DSA can be used to establish the full sensory profile of a product and the DSA data can be combined with other types of data, for example instrumental data to determine instrumental quality drivers of sensory quality or with consumer preference data to determine sensory quality drivers of consumer preference (Lawless & Heymann, 2010). DSA is a reliable method that results in detailed quantitative and qualitative results, but it is sometimes regarded as time-consuming and costly, especially within industry. A DSA panel usually requires extensive training before analysis can start, yet some companies just do not have the time or resources to conduct extensive panel training (Cartier et al., 2006; Valentin et al., 2012). Within industry, there is thus a vital need for faster and more costeffective sensory profiling methods. Even though DSA has been used to determine the sensory profile of herbal teas such as rooibos (Koch et al., 2012; Jolley, 2014) and honeybush (Theron et al., 2014), it could be beneficial for the honeybush industry if a more rapid profiling method were to be used to obtain profiling results similar to that of DSA. There are several rapid profiling methods currently available, but the sorting task is regarded as one of the most popular methods, especially within industry (Chollet et al., 2011). Sorting is a quick and easy tool that can provide valuable qualitative sensory information (Lelièvre et al., 2008). The viability of sorting as a rapid profiling tool for the honeybush industry should thus be investigated. The sensory quality of honeybush is dependent on the aroma, flavour, taste and mouthfeel attributes, which in turn is affected by the presence and concentration of volatile (aroma) and nonvolatile (taste and mouthfeel) compounds. Theron (2012) studied the correlation between specific 3
17 phenolic compounds and sensory attributes associated with the basic taste modalities and the mouthfeel attribute, astringency. Sweet taste could not be correlated with any specific phenolic compounds, but a significant negative correlation was found between sweet taste and the phenolic compounds mangiferin and isomangiferin (Theron, 2012). In the latter study mangiferin, isomangiferin and hesperidin was also correlated with the bitter taste and it was postulated that mangiferin could be responsible for the bitter taste in honeybush, especially in C. genistoides. Mangiferin and isomangiferin were also believed to be responsible for the mouthfeel attribute, astringency in honeybush (Theron, 2012). The latter study proposed that using a larger honeybush sample set, thereby incorporating more product variation, might result in more information on the role of phenolic compounds in the sweet, sour and bitter taste modalities, as well as astringency. Prediction models are relatively new tools used by the industry to predict the quality of a product. Prediction models take into account certain aspects within the manufacturing process and try to determine the role they play in the quality of the end product (Wang & Ruan, 2009). Prediction models have been developed for a number of products, such as dry-cured ham (Careri et al., 1993), wine (Frank & Kowalski, 1984) and Longjing teas (Wang & Ruan, 2009). The study on Longjing teas formulated a prediction model by correlating the non-volatile compounds, volatile compounds and leaf and infusion colours with the sensory scores received from a tasting panel (Wang & Ruan, 2009). The development of a prediction model for honeybush should be investigated, primarily to establish the correlation between the taste and mouthfeel attributes and phenolic compounds. A prediction model based on the latter could be a useful quality control tool, i.e. to ensure standardisation of product grading within the honeybush industry. The aim of this study was therefore to 1) determine the effect of different fermentation temperature/time combinations on the sensory profile of C. longifolia in order to identify the optimum fermentation conditions, 2) to determine the defining aroma, flavour, taste and mouthfeel attributes of C. genistoides, C. subternata, C. maculata and C. longifolia, to validate the generic sensory wheel and lexicon for honeybush and to develop species-specific sensory wheels for the respective Cyclopia species, 3) to test the viability of sorting as a rapid profiling method to classify three honeybush species (C. genistoides, C. maculata and C. subternata) according to their sensory profiles and finally 4) to determine the difference in the phenolic content of four Cyclopia species and the contribution of individual phenolic compounds to the taste and mouthfeel of honeybush infusions, the data of which would be used to develop a sensory-chemical prediction model for honeybush. 4
18 REFERENCES Addor, F. & Grazioli, A. (2002). Geographical indications beyond wines and spirits: A roadmap for a better protection for geographical indications in the WTO/TRIPS agreement. The Journal of World Intellectual Property, 5, Anonymous. (2000). Agricultural Product Standards Act. Act no. 119 of G.N.R. 1177/2000. Johannesburg, South Africa: Lex Patria Publishers. Anonymous. (2013). Final prohibition on the use of certain words. Notice 988. Merchandise Marks Act (Act 17 of 1941). Government Gazette 4 October 2013, South Africa. Aparicio, R. & Morales, M.T. (1995). Sensory wheels: a statistical technique for comparing QDA panels - application to virgin olive oil. Journal of the Science of Food and Agriculture, 67, Aparicio, R., Morales, M.T. & Alonso, M.V. (1996). Relationship between volatile compounds and sensory attributes of olive oils by the sensory wheel. Journal of American Oil Chemists Society, 73, Bergh, A.J. (2014). Characterisation of the sensory profile of Cyclopia intermedia and the optimisation of fermentation parameters for improved product quality. MSc Thesis, University of Stellenbosch, Stellenbosch, South Africa. Bester, C. (2013). A model for commercialisation of honeybush tea, an indigenous crop. In: II All Africa Horticulture Congress. Pp September Skakuza, Kruger National Park, South Africa. Brand-Jonker, N. (2014). Unieke name van SA kry vir die eerste keer beskerming. Rapport Sake, July 27, Careri, M., Mangia, A., Barbieri, G., Bolzoni, L., Virgili, R. & Parolari, G. (1993). Sensory property relationships to chemical data of Italian-type dry-cured ham. Journal of Food Science, 58, Cartier, R., Rytz, A., Lecomte, A., Poblete, F., Krystlik, J., Belin, E. & Martin, N. (2006). Sorting procedure as an alternative to quantitative descriptive analysis to obtain a product sensory map. Food Quality and Preference, 17, Chollet, S., Leliévre, M., Abdi, H. & Valentin, D. (2011). Sort and beer: Everything you wanted to know about the sorting task but did not dare to ask. Food Quality and Preference, 22, Drake, M.A. & Civille, G.V. (2002). Flavour lexicons. Comprehensive Reviews in Food Science and Food Safety, 2, Du Toit, J. & Joubert, E. (1998). The effect of pre-treatment on the fermentation of honeybush tea (Cyclopia maculata). Journal of the Science of Food and Agriculture, 76, Du Toit, J. & Joubert, E. (1999). Optimization of the fermentation parameters of honeybush tea (Cyclopia). Journal of Food Quality, 22,
19 Du Toit, J., Joubert, E. & Britz, J. (1998). Honeybush tea A rediscovered indigenous South African herbal tea. Journal of Sustainable Agriculture, 12:2-3, Frank, I.E. & Kowalski, B.R. (1984). Prediction of wine quality and geographic origin from chemical measurements by partial least-squares regression modelling. Analytica Chimica Acta, 162, Gawel, R., Oberholster, A. & Francis, L. (2000). A mouth-feel wheel : terminology for communicating the mouth-feel characteristics of red wine. Australian Journal of Grape and Wine Research, 6, Jolley, B. (2014). Development of quality control tools and a taste prediction model for rooibos. MSc Thesis, University of Stellenbosch, Stellenbosch, South Africa. Joubert, E., Joubert, M.E., Bester, C., De Beer, D. & De Lange, J.H. (2011). Honeybush (Cyclopia spp.): From local cottage industry to global markets The catalytic and supporting role of research. South African Journal of Botany, 77, Koch, I.S., Muller, M., Joubert, E., Van der Rijst, M. & Næs, T. (2012). Sensory characterisation of rooibos tea and the development of a rooibos sensory wheel and lexicon. Food Research International, 46, Lawless, H.T. (1999). Descriptive analysis of complex odors: reality, model or illusion? Food Quality and Preference, 10, Lawless, H.T. & Heymann, H. (2010). Descriptive analysis. In: Sensory evaluation of food, principles and practices, 2 nd ed. New York, USA: Springer. Lee, J. & Chambers, D.H. (2007). A flavour lexicon for flavour descriptive analysis of green tea. Journal of Sensory Studies, 22, Lelièvre, M., Chollet, S., Abdi, H. & Valentin, D. (2008). What is the validity of the sorting task for describing beer? A study using trained and untrained assessors. Food Quality and Preference, 19, Noble, A.C., Arnold, R.A., Masuda, B.M., Pecore, S.D., Schmidt, J.O. & Stern, P.M. (1984). Progress towards a standardized system of wine aroma terminology. American Journal of Enology and Viticulture, 35, SAHTA. (2011). Honeybush cultivation and industry - Honeybush Industry Brochure. South African Honeybush Tea Association, South Africa. Schutte, A.L. (1997). Systematics of the genus Cyclopia Vent. (Fabaceae, Podalyrieae). Edinburgh Journal of Botany, 54, (As cited by Joubert et al., 2011). Theron, K.A. (2012). Sensory and phenolic profiling of Cyclopia species (Honeybush) and optimisation of the fermentation conditions. MSc Thesis, University of Stellenbosch, Stellenbosch, South Africa. Theron, K.A., Muller, M., Van der Rijst, M., Cronje, J.C., Le Roux, M. & Joubert, E. (2014). Sensory profiling of honeybush tea (Cyclopia species) and the development of a honeybush sensory wheel. Food Research International, 66,
20 Valentin, D., Chollet, S., Lelièvre, M. & Abdi, H. (2012). Quick and dirty but still pretty good: a review of new descriptive methods in food science. International Journal of Food Science and Technology, 47, Van de Kop, P. & Sautier, D. (2006). Rooibos tea, South Africa: the challenge of an export boom. In: Origin-based products. Lessons for pro-poor market development (edited by P. Van de Kop, D. Sautier & A. Gerz). Pp Amsterdam, Netherlands: Royal Tropical Institute (KIT). Wang, K. & Ruan, J. (2009). Analysis of chemical components in green tea in relation with perceived quality, a case study with Longjing teas. International Journal of Food Science and Technology, 44,
21 CHAPTER 2 LITERATURE REVIEW TABLE OF CONTENTS 1. Introduction 2. Honeybush industry 2.1 History 2.2 Botanical description and geographical distribution 2.3 Industry 2.4 Processing of honeybush Harvesting Fermentation Drying Grading and quality control 3. Sensory profiling 3.1 Descriptive sensory analysis 3.2 Rapid sensory methods 3.3 Sensory profile of honeybush species 4. Chemical composition of honeybush 4.1 Non-volatile compounds 4.2 Volatile compounds 4.3 Interactions between volatile and non-volatile compounds 5. Basic taste modalities and astringency and role of polyphenols 5.1 Physiology of taste and mouthfeel 5.2 Taste modulation Sweet Sour Bitter Astringency 5.3 Role of polyphenols in basic taste modalities, astringency and aroma 6. Statistical Methodologies 6.1 Analysis of DSA data 6.2 Prediction models Development of a prediction model Prediction models in the industry 7. Quality control tools for industry 7.1 Sensory lexicons 7.2 Sensory wheels 8. Conclusions 9. References 8
22 1. INTRODUCTION Honeybush tea is a traditional South African herbal tea produced from Cyclopia species (Family: Fabaceae; Tribe: Podalyrieae), belonging to the fynbos biome. To date more than 20 Cyclopia species have been described (Schutte, 1995). These species grow localised throughout the fynbos region because of their specific environmental requirements (Joubert et al., 2011). The formal honeybush industry is still very young and faces many challenges. One of these is that current production cannot supply the demand and sustain the growth of the market. The healthpromoting properties associated with honeybush and the increasing consumption of herbal teas by health-conscious consumers have led to a vast increase in demand locally and internationally (Joubert et al., 2011). For this reason commercialisation of more species is under investigation, adding to the range of herbal teas that are used in the honeybush blend normally sold to the consumer. This chapter will give an overview of the history, geographical distribution, industry, processing methods, sensory profile and chemical composition of honeybush tea. The physiology of detecting aroma, flavour, taste and mouthfeel will be discussed. The focus will also fall on the analytical methods used for analysing the sensory attributes of a product such as honeybush, providing the necessary background to methodology applied in subsequent chapters. 2. HONEYBUSH INDUSTRY 2.1 History Honeybush has a long history of local use. The earliest mention was in 1705, when it was most likely used for medicinal purposes (Du Toit et al., 1998; Joubert et al., 2011). In 1808 the genus Cyclopia was described taxonomically for the first time by Ventenant (Schutte, 1997). Known in local vernacular as Heuningtee, Bergtee, Bush tea, Boertee and Bossiestee, it remained a largely unknown product outside of the natural habitat areas until the 1990s, when it was rediscovered (Joubert et al., 2011). Most enlightening is that honeybush tea is also known as South Africa s sweetest tea. The use of species such C. genistoides and C. subternata on the Cape Peninsula and in the Caledon/George areas, respectively, was noted by Marloth (1925). Very little information is available on economic activity relating to honeybush prior to its rediscovery. Honeybush, harvested in the Kouga area in the 1930s, was sold for 1½ c per kilogram. During the war in the 1940s the price went up to 4½ c per kilogram (Anon., 2013). In the 1960s the first branded honeybush product appeared on the South African market named Caspa Cyclopia tea. It remained largely a small cottage industry, until efforts by Dr Hannes de Lange of the South African National Botanical Institute (SANBI) to create interest in the product mobilised farmers and the Agricultural Research Council, leading to the development of a formal honeybush industry. The growth of the health-promoting food market contributed to the new interest in honeybush and its health-promoting properties (Joubert et al., 2011). 9
23 A present concern is that the increasing demand for honeybush could lead to its production in other countries, which will threaten the South African honeybush industry. Some protection is afforded by recent acceptance of a geographical indication (GI) for honeybush, which will protect the name honeybush and heuningbos, after almost a decade of negotiations with the European Union (EU) (Brand-Jonker, 2014). GI indicates that a product is produced in a certain place, which contributes to the characteristics of the product. GI differs from a trademark, as enterprises use trademarks to distinguish their products or services from others (Table 1) (Addor & Grazioli, 2002; Van de Kop & Sautier, 2006). Table 1 Comparison of protected geographical indications and trademarks (Addor & Grazioli, 2002). Criteria Protected Geographical Indication* Trademarks Owner of right Ownership by state on behalf of all One private producer unless producers in area explicitly registered otherwise Applicant(s) Professional group or association One private producer User(s) Any producer in the area who respects One private producer the common production rules Registration National ministry, then European National trademark bureau Union Administration and Shared by public and private bodies Exclusively by the right holder control Duration No limitation 10 years Transferability Cannot be sold or licensed Can be sold or licensed *According to EU Regulation 2081/ Botanical description and geographical distribution Cyclopia species are woody shrubs with yellowish to brown twigs, hard-shelled seeds and yellow flowers. They have a low leaf-to-stem ratio and the leaves are trifoliate. The leaf form ranges between species from narrow, pin-like leaves to flattened leaves (Du Toit et al., 1998). For the purpose of this study the focus will be on C. genistoides, C. intermedia, C. maculata, C. subternata and C. longifolia (Fig. 1). They are divided into two categories according to their survival strategies, i.e. sprouters and non-sprouters (re-seeders). Sprouters, such as C. intermedia and C. genistoides, produce new coppice shoots after a fire, while non-sprouters such as C. maculata and C. subternata re-establish after fire through seedlings (Joubert et al., 2011). The species, C. longifolia, has not yet been well characterised and it seems that some plants are able to re-sprout, while others are re-seeders. Re-seeders tend to develop thick, rough stems, but if they are harvested regularly their stems are thinner (SAHTA, 2012). Cyclopia species belongs to the fynbos biome as part of the Cape Floristic Region (CFR). They grow along the coastal and mountainous regions of the Western and Eastern Cape provinces (Du Toit et al., 1998; Turpie et al., 2003). The CFR contain plant species and more than half are indigenous to the area. Sour figs and honeybush tea are the most important foods of the fynbos products harvested in this region. The wild harvest of fynbos products is decreasing, 10
.")
.")


 C.")
 C. longifolia. a) b) Fig.")
24 following the same trend as rooibos tea, which is no longer harvested in the wild (Turpie et al., 2003). Certain Cyclopia species occur only within a small area, while others are widespread (Fig. 2). Most of the bushes grow along the shady and cool southern slopes of the mountain. Cyclopia genistoides is found along the sandy and flat coastal areas and C. maculata, C. subternata and C. longifolia are mostly found in wet areas and near water (Joubert et al., 2011). a) b) c) d) e) Fig. 1 Leaves of different Cyclopia species a) C. genistoides, b) C. intermedia, c) C. maculata, d) C. subternata and e) C. longifolia. a) b) Fig. 2 a) Natural distribution of honeybush species and b) distribution of nurseries and processors (Joubert et al., 2011). 11
25 2.3 Industry The honeybush industry was originally a cottage industry and it was only used locally. The tea was harvested from the wild and varied in quality. In 1999 the South African Honeybush Tea Association (SAHTA) was established and this launched the organised honeybush industry. While cultivation trials sparked the renewed interest in honeybush, sustainable harvesting from the wild remains a priority for SAHTA (Joubert et al., 2011) as the bulk of the harvest still comes from the wild (more than 75%) in the Langkloof area. At present there are ten honeybush growers, of which seven are commercial and the other three are community-based (SAHTA, 2011). The present market for honeybush is driven in part by consumer awareness of the link between diet and disease, hence the market for products with health-promoting properties. The consumption of herbal tea drinks has increased by 15% in recent years (Bender, 2014) and the rising interest in honeybush occurred at the same time as the increase in the demand for healthpromoting food (Joubert et al., 2011). Phytoestrogen, anti-cancer, antioxidant and anti-mutagenic (Joubert et al., 2008a; Joubert et al., 2011), anti-obesity (Dudhia et al., 2013; Pheiffer et al., 2013) and anti-diabetic properties (Muller et al., 2011; Chellan et al., 2014) have received attention to date. The export of honeybush has grown tremendously, from 50 to 200 tonnes, over the past ten years (Fig. 3) and the global demand is greater than the supply at this time. The availability of plant material was limited in as a result of drought and veld fires (Joubert et al., 2011) Export volume (tons) Year Fig. 3 Total exports of honeybush from 2008 to 2012 (ARC, 2013). Honeybush is exported to many countries and the market composition changes every year; however, Germany, the Netherlands, the United States of America (USA) and the United Kingdom (UK) have been the major importers since The bulk of honeybush tea exported in 2010 went to Germany and the Netherlands (74%). In 2012 the major importers were Germany (44%), the USA (26%), the Netherlands (13%) and the UK (6%) (Fig. 4). At least 95% of the honeybush 12
26 produced by the industry is sold in bulk form and honeybush has only recently become readily available on South African supermarket shelves (Joubert et al., 2011). Honeybush is primarily sold as a herbal tea, but honeybush extracts are used in products such as cosmetics, ready-to-drink beverages, sweets and fruit juices (ARC, 2013). Honeybush differs from black and rooibos tea in that it consists of more than one species. It is seldom sold as a single Cyclopia species, because of the small quantities of individual species, and for this reason is often blended with rooibos tea (Joubert et al., 2011). Marketing of honeybush is mainly in the hands of the major rooibos marketing companies as it adds to their product range. The growing demand is threatening wild populations as a result of unsustainable harvesting practices. A breeding programme is in place to improve plant material for cultivation, largely to increase production per hectare (Bester, 2013). Expansion of cultivation, identification of new land suitable for honeybush cultivation and conservation are pressing issues faced by industry (SAHTA, 2011). 5% 2% 1% 3% 13% 6% 44% Germany USA Netherlands UK Bulgaria Belgium Canada Other 26% Fig. 4 Top importers of honeybush in 2012 (ARC, 2013). 2.4 Processing of honeybush Harvesting Traditionally harvesting was done during the flowering period as the presence of flowers was believed to increase the sweet, honey-like flavour of the tea. Flowers also served to identify the plants in the wild. As the demand for honeybush increased, so the harvesting period was extended, thus including periods when flowers are not present. Du Toit and Joubert (1999) found that honeybush without the presence of flowers still delivered a satisfactory product. 13
.")
. The sprouter, C.")
27 The harvesting method depends on the species (Fig. 5a). The shoots of sprouters are cut at soil level, stimulating new growth, while non-sprouters should not be cut back too severely to prevent dieback (Fig. 5b). Cyclopia subternata, a non-sprouter, is harvested by cutting 30 to 50 cm above the ground. Harvesting of old bushes tends to give coarse material, mainly because the plants have thicker stems. Coarse material result in slow extraction rates (Du Toit et al., 1998). The sprouter, C. intermedia, makes up most of the production of honeybush, as it is harvested in the wild and thus provides a ready supply; this species is not favoured for cultivation, mainly because it can only be harvested every two to three years after planting and it is thus uneconomical to cultivate (ARC, 2013). Cyclopia genistoides, also a sprouter, is a vigorous grower and is harvested annually. Non-sprouters, under ideal conditions, can be harvested one year after planting. With harvesting the lifespan of plants can be at least ten years for sprouters and seven to eight years for non-sprouters (Joubert et al., 2011). Cyclopia subternata and C. genistoides are the main cultivated species. Cultivation trials with C. maculata and C. longifolia are at present ongoing. After harvesting, the honeybush is cut into fine particles with mechanised fodder cutters or tobacco cutters. The tobacco cutters produce smaller particles and a more uniform cut (Du Toit et al., 1998). Du Toit and Joubert (1998b) did research on the pre-treatment of honeybush with water prior to fermentation. They found that the colour development during fermentation is enhanced if the finely cut plant material is pre-treated with water. Hot or cold water can be used, but it is more economical to use cold water (Du Toit & Joubert, 1998b). a) b) Fig. 5 Photos of a) harvesting of honeybush tea and b) a dead C. subternata bush. 14
28 2.4.2 Fermentation The term fermentation is used in the tea industry to describe the oxidation process. It originates from a time when the changes during processing of black tea (flavour and colour development) were attributed to a microbial process. Traditionally referred to as sweating, the same terminology was later adopted by the South African herbal tea industry because of the lack of a more suitable term (E. Joubert, ARC Infruitec-Nietvoorbij, Stellenbosch, South Africa, June 2013, personal communication). The characteristic sweet, honey-like flavour and dark-brown colour of honeybush develops during fermentation and is thus an essential step in the processing of this herbal tea. The initial research on the fermentation of honeybush was done by Du Toit and Joubert (1999) on C. intermedia and C. maculata (ex Du Toitskloof) (later reclassified as C. buxifolia) (Joubert et al., 2011). It was found that the fermentation of honeybush at 70 C for 60 h or 90 C for 36 h produced an acceptable end product (Du Toit & Joubert, 1999). With the increasing demand, the focus shifted to include other Cyclopia species such as C. genistoides, C. maculata and C. subternata. A range of fermentation conditions, including C/18 24 h is currently employed by the industry, irrespective of species. It was only recently that the fermentation parameters of C. genistoides, C. subternata and C. maculata were studied in an attempt to define an optimum fermentation temperature-time regime for each (Theron, 2012). Fermentation temperatures of 80 C and 90 C for 8, 16, 24 and 32 hours were investigated. It was found that the optimal sensory profile is obtained at a fermentation period of 80 C/24 h or 90 C/16 h, irrespective of species; however, subtle differences in the sensory profiles obtained for these fermentation temperature/time regimes and species were evident. It was found that C. subternata can be fermented at 80 C/24 h or 90 C/16 h, depending on whether a floral or apricot jam note is desired. Cyclopia genistoides fermented at 80 C/24 h developed a strong rose geranium aroma, with this note less prominent at 90 C. Fermentation of C. maculata at 90 C caused an increase in negative sensory attributes; however, a fermentation time of 24 h effectively reduces the intensity of the negative sensory attributes. Thus it is recommended that C. maculata be fermented at 80 C for 24 h (Theron, 2012) Drying After fermentation the plant material is dried to a moisture content below 10% to prevent fungal growth. Mechanical or sun-drying is used. The latter is preferred, because it does not require any extra equipment or costs. Honeybush dried under controlled conditions at elevated temperatures has a slightly darker colour than the sun-dried variant. Du Toit and Joubert (1998a) determined that a drying temperature of 50 C gives the best aroma. The drying time depends on the thickness of the layer of plant material and the weather conditions. It usually takes one to two days to dry (Du Toit & Joubert, 1998a). The quality of sun-dried and artificially dried honeybush did not differ significantly. 15
29 2.4.4 Grading and quality control Grading systems are developed to help standardise products and to ensure safe, consistent commercial products meeting certain quality criteria. First the quality parameters and standards of the product need to be defined. In many instances sensory qualities form part of the latter list of parameters and standards. Sensory grading systems are, however, not the same for each product as the quality parameters differ between products (Feria-Morales, 2002). The quality of tea is usually measured by trained tasters to ensure overall quality and consistency (Feria-Morales, 2002; Koch et al., 2012). The grading of rooibos tea, initiated by the Rooibos Tea Board in 1954 (Joubert, 1994) in an attempt to increase product quality and consistency, focused only on the cut, colour and aroma of the dried tea. This grading system evolved through the years so that the current system, used by the major rooibos processing and marketing company, includes grading of infusion aroma, flavour and colour. Basic grades are A, B or C reflecting strong, medium and poor quality characteristics, respectively (Koch, 2011). It is important to note that the grading system for rooibos is not standardised and each company uses its own system, especially with regard to the range of attributes considered for determining the final grade (Koch, 2011). Many of these same companies also market honeybush tea. It is thus clear that a universal grading system for honeybush has not been a high priority. The use of different Cyclopia species further complicates quality control of honeybush as there are currently no specified, industry-accepted sensory profiles available for the respective commercial species. Honeybush is typically a very coarse material, but the export markets usually want a finer product. The current South African regulations for exporting honeybush stipulate that honeybush may not contain more than 10% of coarse material and if it is packed in retail packaging it may not contain more than 1% coarse material. Coarse material is defined as the quantity of honeybush that cannot pass through a 6-gauge mesh sieve (Anon., 2000). The tea is sieved into different size categories after drying and is sold as loose tea or tea bags (Joubert et al., 2011). The honeybush industry would definitely benefit from a grading system that takes into account the aroma and flavour of the infusion. The regulations are very vague and only stipulate that the tea must have a clean and characteristic aroma and taste of honeybush (Anon., 2000). They do not define the characteristic aroma, flavour or mouthfeel of honeybush per se, or for any of the Cyclopia species. The quality control of honeybush, as governed by the export regulations, only includes the presence of insects and foreign material, pesticide levels, microbial safety, cut size and moisture content (Joubert et al., 2011). The health benefits, especially the polyphenol content of honeybush, are also not addressed in any regulation. It will definitely benefit the South African honeybush industry should specifications for polyphenol content and antioxidant activity be available, as well as standardised methods to assess and define sensory quality. 3. SENSORY PROFILING Stone and Sidel (1993) defined sensory evaluation as a scientific discipline used to evoke, measure, analyse and interpret reactions to characteristics of foods as they are perceived by the 16
30 senses of smell, taste, touch, sight and hearing. The acceptance of a food product by consumers is greatly dependent on the flavour of the product. Instrumental and chemical measures lack the ability to integrate sensory perceptions as well as the accuracy of human senses; therefore sensory analysis is considered the ultimate method to measure flavour quality (Aparicio et al., 1996). The characteristics of the product is analysed by a panel specifically trained to ensure reliable and consistent results. The analysis takes place under controlled conditions to ensure only variation within products and only their sensory attributes are determined (Stone & Sidel, 1993). Sensory analysis methodologies use well-trained panels to analyse the full range of sensory attributes associated with products, primarily to ensure reliable, consistent results (Stone & Sidel, 1993). A number of sensory profiling methodologies are available, e.g. descriptive sensory analysis (DSA), as well as registered methods such as Texture Profile Method (General Foods Technical Center, United States), Flavour Profile Method (Arthur D Little Company, United States), Spectrum method (Sensory Spectrum Inc., United States) and Quantitative Descriptive Analysis (Tragon Corporation, United States) (Meilgaard et al., 1991; Murray et al., 2001; Stone et al., 2012). DSA has been developed as a generic sensory profiling method and is mainly used within the research environment (Piggott & Jardine, 1979; Feria-Morales, 2002; Lee et al., 2008). The registered sensory profiling methods have been specifically developed for industry; these methods are quite costly, thus adding substantially to the general cost of conducting sensory profiling (Lawless & Heymann, 2010). 3.1 Descriptive sensory analysis Descriptive sensory analysis (DSA) is regarded as a primary tool when analysing food products for the full range of sensory attributes, i.e. aroma, flavour, texture and mouthfeel attributes as perceived by the human senses (Lawless, 1999). In this method of analysis a well-trained panel should be used to detect, describe and score the qualitative and quantitative sensory components of food products (Murray et al., 2001). The qualitative component refers to the perceived attribute and the quantitative component to the intensity of each attribute (Munoz & Civille, 1998). DSA is a generic methodology used by researchers world-wide and usually consists of the following three steps: train the judges in the respective sensory attributes, determine judge reproducibility in scoring the respective attributes and, lastly, allow judges to analyse the samples according to the accepted protocol (Lawless & Heymann, 2010). The panel is usually trained beforehand with foodbased or chemical reference standards, primarily to align the sensory perception of each panel member with that illustrated by the given attribute (Lawless, 1999). If the panel is not properly trained, they will analyse products based on their own personal frame of reference, and this could easily lead to variation between panel members and thus inconsistent results (Munoz & Civille, 1998). The capacity to judge intensities of a range of odours in complex mixtures can be difficult and exhausting. To ensure consistent results there should be sufficient resting time in between replications and, furthermore, the number of samples to be tested should also be limited to allow for the senses to stabilise. 17
31 One of the main strengths of DSA is that sensory intensity data can be correlated with other blocks of data, i.e. sensory data can be correlated with instrumental data to determine instrumental quality drivers of sensory quality or with consumer preference data to determine the sensory quality drivers of consumer preference (Lawless & Heymann, 2010). Correlation of data sets, using appropriate regression methodologies, are important when the research aim is to determine the predictive ability of instrumental or sensory parameters, especially in quality control, product matching, product development and sensory-chemical or sensory-preference mapping. Panel selection is essential as DSA requires a panel with a reasonable level of sensory insight and training. Prospective candidates perform a variety of tests relevant to the objectives of the project and only the ones who perform well are selected. Some of the factors that should be considered when selecting sensory panellists are allergies, health status, smoker status, dietary habits, medication, users of specific products or supplements, availability, personality, verbal creativity, education, motivation, concentration and previous experience. The two most important factors are motivation and commitment; if the panel member does not have time to attend the training and analysis sessions, they should not be selected as part of the panel. Education does not influence the ability to perceive, but it may influence the panellists ability to comprehend and carry out the analysis (Murray et al., 2001). An accurate and extensive description of the product attributes is generated during the training phase of DSA. The initial generation of vocabulary should focus on the differences between the products and not on merely compiling a list of adjectives. The selection of the final attribute list is usually a consensus exercise (Murray et al., 2001). Sensory analysis could lead to a descriptive language of the product characteristics that closely relate to the consumers perception (Seppä et al., 2012). A spin-off of DSA is the development of sensory lexicons, i.e. a list of sensory descriptors, definitions and reference standards describing and illustrating the respective attributes (Galán-Soldevilla et al., 2005; Lee & Chambers, 2007). During DSA the differences within samples might make it more difficult to detect the differences between samples. High variability between each batch, or for example each fruit, makes accurate analysis difficult. This limitation demands appropriate and robust statistical designs, as well as appropriate statistical procedures. Sorting, a rapid sensory profiling method, and/or external grading on quality attributes before conducting DSA could possibly speed up the profiling stage, but also reduce the variability within batches (Bavay et al., 2013). DSA data are usually analysed using analysis of variance to determine significant differences between treatment means. Multivariate techniques are also employed, specifically to determine association between attributes and samples, and whether the sensory attributes can act as drivers of quality or preference (Lawless & Heymann, 2010; Corollaro et al., 2013). 3.2 Rapid sensory methods Even though DSA is robust enough to provide profiling data that are valid and reliable, this method is often regarded as time-consuming and costly, especially within industry. A DSA panel usually 18
32 requires extensive training before they can be used as a calibrated sensory instrument (Cartier et al., 2006; Valentin et al., 2012). Some companies just do not have the time or resources for DSA. Within industry, there is thus a vital need for faster and more cost-effective profiling methods. There are several rapid methods available that do not require a trained panel or an extensive training phase. Rapid methods can be categorised into three classes: verbal-based methods, similarity-based methods and reference-based methods. The rapid sensory methods that fall under each class are displayed in Fig. 6 (Valentin et al., 2012). Each method has positive and negative aspects that need to be examined before usage and the final choice of method depends on the aim and expected results of the study (Delholm et al., 2012). 1. Verbalbased method Flash profile (FP) 2. Similaritybased method Free sorting 3. Referencebased method Polarised sensory positioning 'check-allthat-apply' (CATA) Projective mapping, Napping Pivot profile Fig. 6 Rapid sensory methods categorised into three groups (Valentin et al., 2012). The sorting task is regarded as one of the most popular rapid sensory methods, especially in industry (Chollet et al., 2011). It was first used with a food product in 1995, when Lawless et al. (1995) used it to create perceptual maps of cheeses. Since then it has become one of the most popular rapid methods, employed for a variety of food products, i.e. beer (Lelièvre et al., 2008), white wines (Campo et al., 2008), grape jellies (Tang & Heymann, 2002) and water (Falahee & MacRae, 1997) Sorting is a quick and easy tool that can provide valuable qualitative sensory information. The process does not require any quantitative responses and is based on categorisation, which is a natural cognitive process people use every day (Lelièvre et al., 2008). It allows a reasonable perspective of a set of stimuli to be obtained with inexperienced subjects (Faye et al., 2004). The panel member receives all the samples at the same time and is asked to form coherent and homogenous groups according to sample similarities (Chollet et al., 2011). This method produces little fatigue and boredom, and minimum training is necessary (Cartier et al., 2006). The sorting task can be followed by a description step, where the panellist is asked to assign descriptive attributes to each group (Chollet et al., 2011). A perceptual map can be generated when sorting is combined with a description step (Cartier et al., 2006). A problem that often occurs during this step is that assessors use quantitative terms, for example very, slightly, more and many, which makes data interpretation difficult (Valentin et al., 2012). The description leads to a better 19
. Sorting data can be analysed using multidimensional scaling (MDS) (Fig.")
.")
33 understanding of the global similarities and dissimilarities between products; however, if a better understanding of the sensory characteristics of individual samples is required, an additional step is necessary when each group of samples should be described with one or more descriptive sensory terms (Campo et al., 2008). Sorting data can be analysed using multidimensional scaling (MDS) (Fig. 7a), DISTATIS (Fig 7b) and correspondence analysis (CA) (Fig. 8) (Chollet et al., 2011). The former two methodologies are used when analysing sorting data, whereas CA is used when sorting is conducted using the additional descriptive step (Beh et al., 2011). MDS draws a spatial map to show the similarity of samples, where the samples are represented by points (Chollet et al., 2011). The frequency of those samples being grouped together during the sorting task is calculated to measure similarity (Tang & Heymann, 2002). DISTATIS combines MDS with STATIS, which is a multivariate statistical method based on Rv coefficients. On the DISTATIS plot similarity is also represented by the distance between the points, as for MDS (Abdi et al., 2007). CA evaluates the correspondence between the rows, which represents the samples, and the columns, which represents the attributes given to the sample (McEwan & Schlich, 1991/1992). Sorting was used by Hanekom (2012) to group 15 wines according to their sensory attributes. The groups formed are displayed on the MDS (Fig. 7a) and DISTATIS (Fig. 7b) plots. A CA plot shows the relationship between the wines and the descriptors assigned to each group by the individual judges (Fig. 8). From the CA plot (Fig. 8) it can be seen that wines 8, 13, 15 and 24 associate with fresh fruit and floral aroma attributes and wines 8 and 13 are more closely associated with the fresh fruity aroma (Hanekom, 2012). a) b) Fig. 7 Example of a) an MDS and b) a DISTATIS plot obtained from sorting of 15 wines (Hanekom, 2012). 20
, as well as characteristic honeybush (Cronje, 2010) have been used to")
34 3.3 Fig. 8 CA plot obtained from sorting of 15 wines with a descriptive step (Hanekom, 2012). Sensory profile of honeybush species Previously, the broad-based sensory terms sweet and honey-like (Du Toit & Joubert, 1999), as well as characteristic honeybush (Cronje, 2010) have been used to describe the overall sensory profile of honeybush. A few other terms such as flowery, fruity, fermented, under-fermented, over-fermented and burnt have also been used by Du Toit and Joubert (1999) to describe the sensory quality of the honeybush during the optimisation of the fermentation parameters. A more detailed, summarised version of the characteristic sensory profile of honeybush was not developed until 2012 when Theron (2012) analysed several samples of a number of Cyclopia species by DSA to characterise the generic sensory profile of honeybush. Fifty-eight honeybush samples comprising six Cyclopia species, i.e. C. sessiliflora, C. longifolia, C. genistoides, C. intermedia, C. subternata and C. maculata, were used for the sensory profiling. The full range of sensory attributes used in this research included 28 aroma, 23 flavour, 3 taste and one mouthfeel attribute, including both positive and negative attributes (Fig. 9). Negative attributes were included as the intention was the development of a sensory wheel, suitable for quality control purposes. From these results the characteristic sensory profile of honeybush was defined as floral, sweetassociated, fruity, plant-like and woody aroma with a sweet taste and a slight astringent mouthfeel (Theron et al., 2014). There were, however, specific sensory differences between the respective Cyclopia species. After the full dataset was subjected to discriminant analysis, a statistical classification method, it was clear that the respective species split into three groups according to similarity of sensory attributes (Table 2; Theron et al., 2014). Table 2 Attributes associating with each group of Cyclopia species (Theron et al., 2014). Groups Associating attributes Cyclopia genistoides, C. sessiliflora & C. intermedia Fynbos-sweet, fynbos-floral, lemon, plant-like, bitter, sour and astringent. Cyclopia longifolia & C. subternata Apricot jam, rose geranium, fruity-sweet, rose/perfume and sweet taste. Cyclopia maculata Boiled syrup, cassia/cinnamon, walnut, coconut and cooked apple. 21
35 Fig. 9 a) PCA loadings plot showing the positioning of both positive and negative sensory attributes. The letters A, F and T in front of the attributes refer to aroma, flavour and taste attributes, respectively. Cassia = Cassia/cinnamon, Rotting = Rotting plant water, Hay = Hay/dried grass, Cookedveg = Cooked vegetable. b) PCA scores plot showing the positioning of the 58 honeybush tea samples. The abbreviations Ses, Lon, Gen, t, Sub and Mac in the scores plot refer to the specific Cyclopia species; C. sessiliflora, C. longifolia, C. genistoides, C. intermedia, C. subternata and C. maculata, respectively (Theron, 2012). 22
36 4. CHEMICAL COMPOSITION OF HONEYBUSH Volatile compounds are detected by the sense of smell and non-volatile compounds by taste (Dutta et al., 2003). The flavour of a product is influenced by both the volatile and non-volatile compounds present (Dutta et al., 2003). The following sections summarise the current knowledge of the non-volatile and volatile composition of honeybush. 4.1 Non-volatile compounds Honeybush is low in tannin content and is regarded as caffeine free (Joubert et al., 2008a). The focus to date has been on its polyphenol constituents as, generally, many pharmacological and therapeutic effects are attributed to this class of phytochemicals (Masibo & He, 2008; Fraga et al., 2010; Vauzour et al., 2010). Similarly, the health-promoting properties of honeybush have been linked to its phenolic compounds (Joubert et al., 2008a). To date studies on the phenolic composition of Cyclopia species were done on C. intermedia (Ferreira et al., 1998; Kamara et al., 2003) and C. subternata (Kamara et al., 2004; De Beer et al., 2012; Kokotkiewicz et al., 2012), C. maculata (Schulze, 2013) and C. genistoides (Kokotkiewicz et al., 2013; Beelders et al., 2014). The xanthones, mangiferin and isomangiferin, the flavanone, hesperidin, and the benzophenone, iriflophenone-3-c-glucoside, are some of major compounds present in all Cyclopia species analysed (Fig. 10). A number of other compounds have been identified such as flavanones (hesperetin, naringenin, eriodictyol, eriocitrin, naringenin-5-o-β-d-glucopyranoside and eriodictyol- 5-O-β-D-glucopyranoside), flavones (luteolin, diosmetin, isosakuranetin, 5-deoxyluteolin and scolymoside), isoflavones (afrormosin, formononetin, wistin, formononetin-diglucoside, calycosin, pseudobaptigenin, fujikinetin and orobol), coumestans (sophoracoumestan, medicagol and flemmichapparin) and several flavonols (kaempferol glucosides) (De Nysschen et al., 1996; Ferreira et al., 1998; Kamara et al., 2003, 2004). Three new compounds that were previously unidentified (De Beer & Joubert, 2010) were characterised for the first time in 2012 as the benzophenone derivative, iriflophenone 3-C-β-glucoside, the flavone, isorhoifolin, and the dihydrochalcone, phloretin 3-5 -di-c-β-glucoside (Kokotkiewicz et al., 2012). Many of these compounds would have very low solubility in water. For this reason recent studies (De Beer et al., 2012; Schulze, 2013; Beelders et al., 2014) focused on aqueous extracts due to their relevance to a cup of tea. Several new compounds have also been tentatively identified in C. subternata, namely iriflophenone-di-o,c-hexoside, (R)- and (S)-eriodictyol-di-C-hexoside, vicenin-2 and 3- hydroxyphloretin-3,5 -di-c-hexoside (De Beer et al., 2012). Beelders et al. (2014) analysing C. genistoides, identified two aromatic amino acids, an iriflophenone-di-c-hexoside, one flavone, two tetrahydroxyxanthone-c-hexoside isomers, a maclurin-di-o,c-hexoside, a tetrahydroxyxanthonedi-o,c-hexoside, five glycosylated phenolic acid derivatives, two symmetric tetrahydroxyxanthone- C-hexoside dimers and nine glycosylated flavanone derivatives. An investigation of C. longifolia is currently in progress (A. Schulze, ARC Infruitec-Nietvoorbij, Stellenbosch, South Africa, April 2014, personal communication). Quantitative data for the major phenolic compounds in aqueous extracts of various species (Joubert et al., 2008b) are summarised in Fig. 11. Cyclopia genistoides 23
37
38 contribute to variation in composition (Yao et al., 2005). The geographical area was found to play an important role in the chemical composition of plants that have the same genetic make-up (Owuor et al., 2008). Processing introduces extensive changes and formation of new compounds, depending on the type of tea manufactured (Tounekti et al., 2013). Very little data on factors contributing to variation in the phenolic composition of honeybush is available. Joubert et al. (2003) found quantitative differences in the polyphenolic composition between C. genistoides from Overberg and the West Coast regions. The mangiferin content was significantly higher in the Overberg sample and the hesperidin content was less than that of the West Coast sample (Joubert et al., 2003). A study on the effect of harvest date on the accumulation of xanthones, hesperidin and iriflophenone-3-c-glucoside in the leaves of C. genistoides showed that these compounds, except hesperidin, peaked during summer, while the lowest contents were found during early spring. Hesperidin remained largely unaffected by harvested date (Joubert et al., 2014). In this case another C. genistoides seed source, the Kirstenbosch type from the southern part of the Cape Peninsula, was harvested in addition to the Overberg and West Coast types. All the plants were cultivated at the same location in the Overberg. The Overberg type, cultivated in its natural habitat, was the least affected of the types by harvest date. Seeds from the Cape Peninsula produced plants with higher responsiveness to solar radiation, water availability and temperature. This resulted in greater seasonal peaks in xanthone and benzophenone levels in the leaves of the plants from the Cape Peninsula (Joubert et al., 2014). Numerous other studies on tea and food products have demonstrated the established phenomenon that heat treatment causes a decrease in content of polyphenolic compounds. Processing conditions also play a major role in the variation of phenolic concentrations within species. Fermentation was found to decrease the content of most phenolic compounds, especially mangiferin and isomangiferin (Joubert et al., 2008b; De Beer & Joubert, 2010). A study on the pretreatment of green honeybush (C. subternata) with steam before drying showed a substantial improvement in the retention of colour and phenolic compounds (Joubert et al., 2010). The soluble solids and polyphenolic content of C. maculata (re-classified as C. buxifolia) and C. intermedia decreased with fermentation, regardless of the temperature used (Table 3) (Du Toit & Joubert, 1999). Table 3 also indicates the difference in phenolic content between C. intermedia and C. buxifolia. In 2012 Theron (2012) conducted a study on the effect of fermentation on the phenolic content of three Cyclopia species (C. genistoides, C. subternata and C. maculata). The polyphenol composition and colour (absorbance) of these species, subjected to two fermentation temperatures (80 C and 90 C) for four different time periods (8, 16, 24 and 32 h), were studied. The concentration of the soluble solid, total polyphenol and polyphenolic compounds quantified were reduced during fermentation. The mangiferin and isomangiferin content of C. genistoides deceased with fermentation, which might be associated with the decrease in bitter taste. Particular 25
39 temperature/time combinations caused less decrease in the phenolic content. The results were not constant between species and a specific temperature/time combination was recommended for each species (Theron, 2012). Table 3 Effect of fermentation time on soluble solid (SS) content of the infusion and the total polyphenol and flavonoid contents of the SS of C. intermedia and C. buxifolia infusions (Du Toit & Joubert, 1999). C. intermedia C. buxifolia Fermentation time (h) SS (g litre -1 ) TP (g kg -1 SS) Flavonoids (g kg -1 SS) SS (g litre -1 ) TP (g kg -1 SS) Flavonoids (g kg -1 SS) 24 4,41 a,b 181,92 a 149,85 a 3,6 a 192,47 a 162,75 a 36 4,59 a 175,11 a,b 141,74 a 3,89 b 179,5 b 150,25 a 48 4,48 a,b 164,63 b 129,57 b 3,69 a,b 158,56 c 126,81 b 60 4,3 b 151,17 c 113,56 c 3,32 c 147,48 c 112,92 b 72 3,74 c 127,03 d 87,1 d 2,87 d 120,68 d 85,1 c a-d Means with different letters in a column differ significantly (P>0.05) In herbal tea infusions non-volatile compounds impact mainly on the basic taste modalities (bitter, sour and sweet taste) and the mouthfeel attribute, astringency. The impact of specific compounds will be discussed in Section Volatile compounds Recent studies on the volatile fraction of honeybush tea showed that processing affects its volatile composition (Cronje, 2010; Le Roux et al., 2008). The volatile fractions of unfermented and fermented C. genistoides contained the same compounds, but major quantitative differences were observed (Table 4; adapted from Le Roux et al., 2008). A large number of saturated and unsaturated alcohols, aldehydes and methyl ketones are present in the volatile fraction of unfermented C. genistoides, whereas terpenoids comprise the major aroma compounds of the fermented plant material. The largest concentration was observed for linalool (36%) (Le Roux et al., 2008). High concentrations of the compounds contributing to the sweet, honey-like notes and low concentrations of the compounds contributing to the green notes are expected to be present in a good-quality honeybush (Le Roux et al., 2008). Le Roux et al. (2012) used gas chromatography-mass spectrometry (GC-MS) in combination with GC-O to identify and characterise the aroma-active compounds and volatiles in C. subternata. Just over 180 compounds were identified in this herbal tea variant, of which the majority were terpenoids (56%, N = 103). Another major group was aldehydes, with the remaining compounds consisting of ketones, hydrocarbons, esters, alcohols, lactones, furans, carboxylic acids, ethers and one thiazole compound (Le Roux et al., 2012). Detection frequency (DF) and aroma extract dilution analysis (AEDA) were used to identify the odour-active compounds. Out of the 183 compounds identified, 37 were found to be odour-active (FD >2). The odours of the following compounds were identified by the assessors as typically honeybush-like : (6E,8Z)- megastigma-4,6,8-trien-3-one, (6E,8E)-megastigma-4,6,8-trien-3-one, (7E)-megastigma-5,7,
40 one, epi-α-muurolol, 10-epi-γ-eudesmol and epi-α-cadinol (Le Roux et al., 2012). Cronje (2010) found that the four Cyclopia species were qualitatively very similar; however, quantitatively they differed significantly. In the latter study four Cyclopia species, i.e. C. genistoides, C. intermedia, C. longifolia and C. subternata, were compared. Included were also two samples of both C. genistoides and C. subternata originating from different areas. Table 5 lists the volatile compounds associated with the respective honeybush species, as well as samples of the same species originating from different areas. These results explain why different species have slightly different aroma profiles. It is worth noting that gas-chromatography olfactometry (GC-O), as employed by Le Roux et al. (2012), is usually conducted to determine the aroma-active compounds in complex mixtures. GC-O allows us to separate, quantify and identify the compounds in aroma fractions. This is only a starting point as the contribution of a volatile compound to aroma quality depends not only on the fact that it is present or absent, but also on the concentration of the aroma-active compound in question. One should know how the compound is perceived at a given concentration and what the perceived intensity would be if the concentration of the compound increased (Delahunty et al., 2006). Furthermore, aromas are known to enhance or mask each other (Hattori et al., 2003) and compounds with no apparent aroma (non-aroma active) and/or present in sub- and peri-thresholds can modify the sensory perception of aroma-active compound, as postulated by Ryan et al. (2008). This information has not yet been confirmed for honeybush. Table 4 Main volatile compounds identified in fermented and unfermented honeybush, C. genistoides, and their odour descriptors (Le Roux et al., 2008). Compound Unfermented Area % Fermented Area % Aroma Descriptors Hexanal Fatty, green grass 6-methyl-5-hepten-2-one Oily, green grass, herbaceous Limonene Citrus, sweet, orange, lemon 3,5-octadien-2-one trans-furanoid linalool oxide Sweet-woody, floral-woody-earthy cis-furanoid linalool oxide Sweet-woody, floral-woody-earthy 6-methyl-3,5-heptadien-2-one Warm spicy cinnamon-like Linalool Refreshing, light, clean, floral α-terpineol Fragrant, floral, sweet lilac β-cyclocitral Minty, fruity, green Nerol Sweet, floral Geraniol Sweet, floral, rose, fruity Geranyl acetone Floral, sweet-rosy, slightly green Dihydroactinidiolide Sweet, floral, tobacco 27
41 Table 5 Relative concentrations (% Area) of the most intense odour-active compounds in different Cyclopia species (Cronje, 2010). C. genistoides C. intermedia C. longifolia C. subternata Albertinia Pearly Beach Bredasdorp Genadendal Linalool (E,Z)-2,6-Nonadienal (E)-2-Nonenal Geraniol Component C (E)-β-Damascenone (E)-β-Damascone ,3-Dehydro-γ-ionone ,4-Dehydro-β-ionone (E)-β-Ionone epi-γ-Eudesmol epi-α-cadinol epi-α-muurolol (7E)-Megastigma-5,7,9-trien-4- one <0.001 <
42 4.3 Interactions between volatile and non-volatile compounds Taste and smell can be researched separately in a laboratory situation; however, during consumption they are perceived simultaneously and in many cases coupled with tactile sensations such as astringency. This constitutes the overall impression of aroma and taste (also known as flavour) as well as mouthfeel (Noble, 1996). Therefore analysing these sensory dimensions separately may not paint a clear picture of the overall flavour and mouthfeel of a product. It has also been reported that certain aromas enhance the tasted sweetness of a product, while others can suppress it; for example, the sourness of citric acid was suppressed and the sweetness of sucrose enhanced when a caramel aroma formed part of the mixture (Stevenson et al., 1999). The basic taste modalities, singularly and in combination, can also influence the overall aroma profile of a product; a study found that the fruity aroma was rated higher when analysed in a sweet-tasting medium and lower in a less sweet-tasting medium (Buettner & Beauchamp, 2010; Noble, 1996). Scharbert and Hofmann (2005) studied the relationship between aroma and taste in black tea by using nose clamps while rating the intensities of certain basic taste and mouthfeel qualities. With the nose clamps on, no aroma notes could be perceived, while the perception of astringency, bitterness and sweetness was slightly lower. This indicates that the perception of non-volatile components is different when the olfactory sense is active or inactive (Scharbert & Hofmann, 2005; Sáenz-Navajas et al., 2012). Currently, there is a drive to identify and develop flavour-modulating compounds, such as bitter-masking or sweet-enhancing compounds. Quite a number of herbal tea variants can be classified as being bitter. Modulating compounds, known to mask potential bitter tastes, are beneficial in the development of new products with bitter challenges, or when it is important to understand flavour technology (Reichelt et al., 2010). This aspect will be discussed in the next section. 5. BASIC TASTE MODALITIES AND ASTRINGENCY AND ROLE OF POLYPHENOLS 5.1 Physiology of taste and mouthfeel The sense of taste is a specialised chemosensory system (Yarmolinsky et al., 2009). There are four basic tastes: sweet, sour, bitter and salty, and some instances umami is also classified as a basic taste (Chen et al., 2011). The savoury taste associated with monosodium glutamate (MSG) is known as umami (Chen et al., 2011). Umami and sweet taste are seen as indicators of good, nutritious food, while bitter and to a certain extent sour tastes can be regarded as negatives when tasting food products. Humans taste perceptions are greatly influenced by expectations, hunger and emotions (Yarmolinsky et al., 2009). The sensation of taste takes place in the taste receptor cells (TRCs) by the interaction of the sapid molecules ( tastants ) with receptors and ion channels in the apical microvilli. TRCs are modified epithelial cells and these cells have many neuronal markers and properties. Taste buds are central collections of more or less 100 TRCs that are clustered within onion-shaped structures. The taste buds of the tongue are known as lingual buds 29
43 and are found within three types of papillae. These three types of papillae are fungiform, foliate and vallate, found at the front, sides and rear of the tongue, respectively (Gilbertson et al., 2000). The basic taste modalities are mediated by distinct groups of TRCs and since these are present in all areas of the oral cavity, contrary to previous beliefs, there is no topographic map of taste receptors on the tongue (Yarmolinsky et al., 2009). Furthermore, it was also found that receptors that detect sweet, bitter and umami taste are not just restricted to the tongue, but are distributed throughout the stomach and intestines (Trivedi, 2012). 5.2 Taste modulation Flavour is usually defined as a composite sensation consisting of aroma(s) and one or more of the basic tastes. In some instances the overall flavour is defined as a mixture of tastes, aromas and mouthfeel attributes (pain and/or astringency) as instigated by aroma compounds, taste compounds and trigeminally active compounds, respectively. Trigeminal active compounds cause the activation of free nerve endings, mainly responsible for pain detection, in the nose and mouth cavity. Aroma/aroma interactions, trigeminal/aroma interactions, aroma/taste interactions, taste/taste interactions and taste/trigeminal interactions are therefore different flavour modification types. It is well known that basic tastes influence each other (taste/taste interaction), for example, the suppression of bitterness and the reduction of sourness by sweeteners (Ley et al., 2011). The demand for flavour-modifying ingredients is increasing as the need to produce healthier alternatives increases. Several studies have been conducted to try and identify zero-kilojoule sweeteners that are similar to sugar. Positive allosteric modulators (PAMs) have been found to enhance sweetness at low concentrations while preserving the taste of sucrose (Servant et al., 2011). Certain flavonoids have also been labelled as sweetness enhancers, such as homoeriodictyol and the aglycone of hesperidin, hesperetin (Kinghorn et al., 2010). Homoeriodictyol showed 6% sweetness-enhancing activity when present at 100 ppm in a 5% w/v sucrose solution, i.e. apart from its bitternessmasking properties (Ley et al., 2008). Eriodictyol has been identified as a bitterness blocker and it is known that it does not result in any additional flavours or tastes (Ley et al., 2005) Sweet It was found that T1R2 and T1R3 function in combination as sweet receptors. They are part of the T1R class of taste-specific GPCRs. T1R1 and T1R3 receptors respond to umami taste, thus suggesting that sweet and umami taste receptors share a subunit (T1R3) (Li et al., 2002). Three different pathways that activate sweet receptors have been identified (Fig. 12d). Several hypothetical models of the ligand binding sites for sweet receptors have been developed. All of these models contain AH-B groups in which the AH group is a hydrogen donor and the B group an electro-negative group. According to this, all sweet-tasting compounds consist of a hydrogen bond donor (AH) and a hydrogen bond acceptor (B) separated by a distance of Å (Kinghorn et al., 2010). 30
44 No specific compounds linked to the sweetness of honeybush tea could be identified, although a significant negative correlation was found between sweet taste and isomangiferin and mangiferin (Theron, 2012) Sour Organic acids and ph are responsible for sour taste. Acid-sensitive TRCs are depolarised when the sour taste receptor is activated. This leads to a decrease in the intracellular ph and the release of transmitters. This causes the afferent nerve fibres of the brain cortex to react, leading to the sour taste perception (Ramos Da Conceicao Neta et al., 2007). According to Gilbertson et al. (2000), acids permeate the epithelial-type Na+ channel (ENaC) and activate cation (X+) channels while inhibiting apical K+ channels (Fig. 12b). The correlation between the polyphenolic compounds present in honeybush and sour taste was low and it was suggested that this was because small, soluble, inorganic cations are responsible for the sour taste in food (Theron, 2012) Bitter Bitterness is a sensation perceived at the back of the tongue and there are several transduction mechanisms identified for individual bitterants; however, there is no model that fits all the bitter compounds. With the exception of caffeine, flavanols are the primary source of bitterness in tea (Lesschaeve & Noble, 2005). Flavon-3-ols and their polymers are known to cause bitterness. These compounds are widely distributed, especially in fruits (Peleg et al., 1999). Phenolic compounds are also responsible for bitter taste (Arnold et al., 1980). The sensitivity to bitter taste can be inherited. Phenylthiocarbamide (PTC) and 6-npropylthiouracil (PROP) are known to be perceived as tasteless in some individuals and extremely bitter in others (Drewnowski & Rock, 1995). G proteins and G protein-coupled receptors (GPCRs) are responsible for bitter transduction. Taste-2 receptors (T2Rs) have been identified as bitter taste receptor (Chandrashekar et al., 2000). Gustducin heterotrimers are activated by T2Rs when they are exposed to bitter compounds. Phosphodiesterase (PDE) is stimulated by this activated α- gustducin and hydrolyses cyclic adenosine monophosphate (camp). The β and y subunits help to generate inositol triphosphate (IP3) by activating PLCβ2. IP3 releases Ca2+ from the internal stores, which causes the neurotransmitter release (Fig. 12e) (Gilbertson et al., 2000). Theron (2012) found that isomangiferin, hesperidin, soluble solid (SS) and total polyphenol (TP) contents correlated with bitter taste, while eriocitrin had a negative correlation with bitter taste. It was suggested that mangiferin might be responsible for the bitter taste in honeybush (Theron, 2012). 31
45 Fig. 12 Transduction mechanism in taste receptor cells (Gilbertson et al., 2000) Astringency Astringency is usually described as a dry-mouth feeling (Arnold et al., 1980). Astringency is known to occur when specific compounds precipitate proteins. A molecular weight between 500 and 3000 is required for water-soluble polyphenols to precipitate proteins and tannins with more than 3 flavon-3-ol units. Compounds that have been found to elicit astringency are flavan-3-ol monomers, dimers and trimers and hydroxybenzoic acids (Lesschaeve & Noble, 2005). Molecules that are larger in size tend to be more astringent than their smaller counterparts (Peleg et al., 1999). However, in some situations this is not the case; for example when flavonoids polymerise to tasteless compounds, i.e. during the ripening of fruit, the astringency tends to decrease. Furthermore, individuals perceive astringency different, primarily because the salivary flow rate is different in each individual. Individuals with low salivary flow rates experience the intensity of astringency more intensely than those with high salivary flow rates (Lesschaeve & Noble, 2005). It is suggested that different pathways are used by distinct astringent compounds to cause astringency. In the literature it is said that astringency is a multidimensional and complex sensation that can be influenced by a number of variables such as gustatory sensation and ph. Taste qualities such as sweet, sour, salty and bitter have been shown to physiologically and physically influence the sensation of astringency. Some studies done on astringency also included the analysis of bitterness (Peleg et al., 1999; Arnold et al., 1980; Lesschaeve & Noble, 2005). A vast number of compounds that elicit astringency are also regarded as bitter tasting. Even though 32
46 acids are known to be astringent, the ph still affects the perceived astringency. In some cases an increase in ph caused a decrease in astringency (Bajec & Pickering, 2008). PPAG is believed to cause bitterness and astringency in rooibos as it results in a bitter taste and a dry mouthfeel (astringency) when dissolved in water. Koch (2011) found that it associated with bitterness in rooibos and the only compound that significantly associated with astringency was rutin (Koch, 2011). Rutin has been described in previous studies as having astringent properties (Scharbert et al., 2004). Theron (2012) found that the xanthones, mangiferin and isomangiferin, appeared to influence bitterness and astringency in honeybush. It was suggested that at low concentration the xanthones cause bitterness and at high concentrations they are perceived as astringent (Theron, 2012). 5.3 Role of polyphenols in basic taste modalities, astringency and aroma Polyphenol compounds contribute to the taste and mouthfeel of a number of food products, amongst others, black tea (Camellia sinensis) (Millin et al., 1969; Scharbert et al., 2004; Scharbert & Hofmann, 2005), honeybush (Cyclopia species) (Theron, 2012) and rooibos tea (Aspalathus linearis) (Rabe et al., 1994; Koch, 2011). The complex chemical composition of tea, alkaloids and polyphenols has a major influence on the taste (Chen et al., 2008). Terpenoids, alkaloids and flavonoids elicit bitter taste, while tannins cause astringency (Lesschaeve & Noble, 2005). There are many variations of bitter molecules, but the strongest representatives are from the classes mentioned above: isoalpha acid, limonoids (terpenoids), nicotine, quinine, caffeine (alkaloids), neohesperidin and eppigallocatechin gallate (flavonoids). Bitterness has an extremely wide structural range; thus it is unexpected that the bitter taste is specific to isomers and similar small molecules. Minor structural variations can alter the threshold or change the taste profile (Ley, 2008). Belitz and Wieser (1985) found that bitter molecules need a hydrophobic moiety and a polar group. Bitterness prediction in the structural class of peptides found that the bitterness of the peptide is higher when the hydrophobicity of terminal amino acids of the peptide chain is higher. It was also found that if the peptide has more than three to four amino acid residues, it will be more or less tasteless, except for some sweet-tasting proteins such as lysozyme, thaumatin and brazzein (Ley, 2008). Epigallocatechin gallate (EGCG) is a catechin that is found in green tea and comprises 60% of the total catechins. Tea catechins are known to be bitter and astringent. There are a few health benefits coupled to EGCG, such as anti-carcinogenic and cardio-protective effects, but the strong bitter and astringent taste results in low consumer acceptance. The use of sweeteners, bitter taste receptor blockers and complexation with other compounds has been investigated to lessen bitterness (Bohin et al., 2013). The addition of milk in tea reduces the bitterness and astringency, because of the interaction between the milk proteins and the tea catechins (Bohin et al., 2013). Rodgers et al. (2006) studied the key structural features of bitter molecules to build a classification model. Substructural features such as highly branched carbon scaffolds and sugar moieties were identified in bitter compounds (Rodgers et al., 2006). 33
47 According to El Gharra (2009), proanthocyanidins, also known as condensed tannins, are responsible for the astringent mouthfeel of certain fruits and beverages (apples, grapes, peaches, pear, beer, wine and tea) by forming complexes with the salivary proteins. Simple, volatile phenols such as eugonal, vanillin and isoeugonal can contribute to the aroma of products, whereas some of the phenols act as aroma precursors (phenol glycosides) by releasing the phenols after hydrolysis, giving rise to aroma (Tomás-Barberán & Espín, 2001). Limited research has been done on the taste and mouthfeel properties of polyphenolic compounds present in Cyclopia species. It is believed the combination of flavonoids and other phenolic compounds are responsible for the unique taste of honeybush. The only Cyclopia polyphenols linked to taste are hesperetin and eriodictyol. Hesperetin has sweet-enhancing properties, while eriodictyol possesses bitter-masking properties (Ley et al., 2005; Ley, 2008; Reichelt et al., 2010). Hesperetin rutinoside (hesperidin) has been reported to be tasteless, while the positional isomer hesperetin neohesperidoside (neohesperidin) is perceived as very bitter (Ley, 2008). Theron (2012) studied the polyphenolic content of six Cyclopia species and its relationship to the basic tastes and mouthfeel. The study found a significant correlation between hesperidin and bitter taste, although Ley (2008) reported this compound to be tasteless. A moderate, but significant correlation between mangiferin and bitter taste indicates that this xanthone might be responsible for the bitter taste in honeybush, especially in species such as C. genistoides and C. longifolia (Theron, 2012). However, it is difficult to determine whether one compound is responsible for a specific taste, primarily because several compounds, in combination, might affect one or more of the taste modalities or may act as taste modulators (hesperetin and eriodictyol) (Ley et al., 2005; Ley, 2008; Reichelt et al., 2010). According to Theron (2012) the characteristic, sweet taste of honeybush could not be explained by the phenolic composition; thus further identification of the chemical composition, as well as its effect on taste is necessary. Similar studies have been done on black tea (Millin et al., 1969; Scharbert et al., 2004; Scharbert & Hofmann, 2005) and rooibos tea (Rabe et al., 1994; Koch, 2011). Millin et al. (1969) investigated the effect of non-volatile compounds on the taste of black tea and came to the following conclusions: the general taste of black tea was not affected by simple monomeric phenolic compounds; however, flavonol and flavanol components produced a slight metallic and astringent mouthfeel. According to these researchers, astringency was caused by theaflavin and other oxidation products. More recent studies revealed that several flavan-3-ols can potentially affect taste (Scharbert et al., 2004; Scharbert & Hofmann, 2005), i.e. nine flavonol-3-glycosides, catechin, eppigallocatechin-3-gallate and caffeine are associated with taste and astringency in black tea (Scharbert & Hofmann, 2005). Rabe et al. (1994) suggested that asphalathin, a dihydrochalcone, may be responsible for the naturally sweet taste of rooibos; however, further research indicated that asphalathin could be 34
48 associated with bitterness (Koch, 2011). Quercetin and luteolin were also found to be associated with bitterness, while enolphenylpyruvic acid-2-glucoside (PPAG), iso-orientin and quercetin-3- glucoside associated with sweetness. When PPAG is dissolved in water, the result is a bitter taste and a dry mouthfeel (astringency). It was found to associate with bitterness and sweetness in rooibos. The only compound that significantly associated with astringency was rutin (Koch, 2011). 6. STATISTICAL METHODOLOGIES 6.1 Analysis of DSA data Using the correct statistical method for analysing sensory data is extremely important for the success of the research, and within the field of sensometrics the individual differences between the assessors can often complicate the analysis. Different assessors will inevitably have different perceptions of samples and attributes, as well as a different understanding of the scales used, so the model used to analyse the data should take this into account. The model should be able to distinguish between sample-specific and assessor-specific variation (Bro et al., 2008). The data can always be seen as three-way data tables to analyse differences between samples and assessors, as well as the correlation structure among attributes. Assessors, samples and attributes represent the three dimensions (Luciano & Næs, 2009). In sensometrics the objective is to study the similarities and differences between samples and assessors, and to analyse the correlation structure among the sensory and instrumental attributes. Sensory analysis data are often simplified by using the average over the assessors. This reduces the three dimensions to one dimension and can potentially result in the loss of significant information about the individual differences among assessors. The development of three-way factor analysis that can analyse all three dimensions simultaneously, such as the parallel factor analysis (PARAFAC) and the procrustes rotation methods (Dahl et al., 2008), have been used recently to address this loss of panel information. PARAFAC and principal component analysis (PCA) produce similar results, but PARAFAC considers the fact that the assessors are not all equal, while PCA assumes there are no significant individual differences between assessors. Thus PARAFAC generates a better picture of the patterns within the data set (Bro et al., 2008). Analysis of variance (ANOVA) or multivariate analysis of variance (MANOVA) is also used to analyse data gathered from sensory panellists. ANOVA indicates whether the terms generated during training are discriminating and it is used to differentiate between samples. It also allows the panel leader to ensure that there are no significant differences between replicate testing of attributes, thus indicating that each attribute is discriminating between treatments (Wolters & Allchurch, 1994). MANOVA looks at all attributes simultaneously, testing the effect the samples and/or assessors have on all the attributes. Generalised procrustes analysis (GPA) is another method commonly used, where each assessor slice is treated as a matrix. This is followed by PCA based on a consensus matrix. GPA is based on the idea of using scaling and rotation to make each individual assessor data matrix as similar as possible. Regular PCA involves the analyses of all the individual sensory profiles and then performing an ANOVA on the most significant 35
49 components (Luciano & Næs, 2009). PCA reduces the dimensionality of the data while maintaining most of the variation in the data set. This is done by identifying directions (principal components) of maximal variation (Ringnér, 2008). When variables are classified as dependent or independent, the aim is usually to use the independent variable to predict the dependent variable. In this instance regression analysis, partial least squares (PLS), principal component regression or discriminant analysis (DA) can be used. Discriminant analysis is often used as a classification technique and might produce different patterns than PCA, because PCA simply looks for patterns of correlations, while DA looks for discrimination of products relative to the disagreement of people or error (Lawless & Heymann, 2010). There are many different methods available to analyse sensory data, as mentioned above. It is thus important to decide on the expected outcome of the experiment before deciding on a method. It is also recommended that more than one method be used as each statistical method generates a slightly different picture of the correlations in the data set (Palmer, 1974). 6.2 Prediction models Prediction models are a fairly new tool used by the industry to predict the quality of their product. During the production of the product the manufacturer strives to achieve consistent quality every time. Prediction models take into account certain aspects within the manufacturing process and try to determine the role they play in the quality of the end product (Wang & Ruan, 2009) Development of a prediction model Regression analysis is used to build prediction models by relating two data sets to each other. Some examples are spectroscopy (this is the use of spectral measurements to predict chemistry), product development (using chemistry data and relating it to sensory results), and consumer science (using the sensory data to understand consumer preference). Simple linear regression is the use of one variable (x) to predict another (y). It is often necessary to use more than one x- variable to predict y. This requires the use of multiple linear regressions (T. Næs, Nofima, Norway, December 2012, personal communication). External preference mapping (prefmap) is often used during product development. Prefmap models consumer liking using sensory profiles. The problem with this method is its poor model quality. The poor model quality is a result of the product attribute space being inadequate to the preference one (Bougeard & Cardinal, 2014). Bougeard and Cardinal (2014) found a way to enhance the model quality, applying prefmap to external attributes as well as to sensory attributes. The consumer preference (Y) is explained by sensory attributes (X1), physiochemical parameters (X2) and packaging description (X3) (Fig. 13). These explanatory variables are organised into meaningful blocks. This method is called multiblock redundancy analysis (Bougeard & Cardinal, 2014). 36
50 Potential drivers of preference Preference Products Sensory descriptors Physicochemical measurement Packaging description Consumer preference (X 1 ) (X 2 ) (X 3 ) (Y) Fig. 13 Multiblock explanatory data which aims to explain consumer preference (Bougeard & Cardinal, 2014) Prediction models in the industry The relationship between information sources of multiple measurements is usually modelled to a pre-set path using PLS. This method describes the connection between variables segregated into blocks and gives a predictive model for measurements of observations in the response block. This method was used in a study on wine to predict the individual and overall sensory scores from the chemical composition of the wine. Forty wines from two geographic origins were modelled by looking at the relationship between the chemical composition and sensory profile of the wines, as well as the role of the geographic origin. The PLS model provided valuable information about the differences in chemical components between the two wine regions, as well as the compounds responsible for the good and bad quality of the wines. The study concluded that chemical data contained sufficient information to predict the overall quality, individual sensory parameters and the origin of the wines (Frank & Kowalski, 1984). A similar study was also done on Italian-type dry-cured hams. GPA and PLS were used to analyse the data and determine the relationship between the chemical and sensory properties (Careri et al., 1993). A study on Longjing teas correlated the non-volatile compounds, volatile parameters and leaf and infusion colours with the sensory scores received from the tasting panel to formulate a prediction model (Wang & Ruan, 2009). Chen et al. (2008) measured the main catechins and caffeine in green tea by using HPLC and support vector classification (SVC) pattern recognition to predict the quality of green tea. Previous research indicated a relationship between the main catechin contents (catechin index (CI)) and green tea quality. The five main catechins (EGCG, EGC, ECG, EC and C) and caffeine levels were measured simultaneously in the green tea leaves by HPLC. SVC, a chemical pattern recognition tool, was applied to develop an identification model. The results showed that HPLC combined with SVC can be used to identify green tea quality levels (Chen et al., 2008). In another study electronic nose, electronic tongue and sensory assessments were done on Sri Lankan teas from different origins to try and distinguish between 37
51 the origins. The aim was to identify the compounds contributing to the discrimination of tea quality. All the data were combined to construct a reliable quality prediction model. The PLS method was used to evaluate the data and found a close correlation between the results obtained from sensory analysis and the results from electronic tongue analysis. This study suggested the use of a large data set to produce a reliable and robust model (Kovács et al., 2010). 7. QUALITY CONTROL TOOLS FOR INDUSTRY 7.1 Sensory lexicons Sensory lexicons are used extensively in research and industry, especially when conducting sensory profiling of products. This tool can be used to describe the aroma, flavour taste and mouthfeel of products and consists of the following: 1) a set of sensory descriptors, 2) definitions describing each descriptor, and 3) reference standards illustrating the respective attributes. An excerpt of a sensory lexicon set up for apples is shown in Table 6. The lexicon contains the list of attributes with definitions and reference standards corresponding to the scale extremities. It also lists the evaluation procedure (Corollaro et al., 2013). The following steps are usually followed to generate a lexicon for a product or product range. Firstly, collect a frame of reference for the product, then generate all possible terms to describe the product, thereafter review the terms and then develop the final list of descriptors. Several (25 to 100) products in the category are evaluated to collect a wide sample set or frame of reference of the product and the aroma, flavour and taste attributes generated become the basis of the lexicon (Drake & Civille, 2002). Each term is defined and the list of terms is reduced by removing redundant terms and merging similar terms (Lee & Chambers, 2007). It is important to source a range of treatment samples, primarily to capture a comprehensive range of potential characteristics in the product category; this will ensure that the lexicon captures all potential product variability (Drake & Civille, 2002). After the list of attributes has been generated, the terms are defined and clarified through reference standards. Reference standards can be food or nonfood products that illustrate the aroma, flavour or texture of the product (Drake & Civile, 2002). Sensory lexicons are regarded as sophisticated tools in sensory research. They can serve as a powerful, qualitative frame of reference when conducting DSA, but also when determining the broad-based quality of a product (Drake & Civille, 2002). Sensory lexicons have been developed for a variety of products (Table 7), including a sensory lexicon for rooibos (Koch et al., 2012) and honeybush (Theron et al., 2014). Sensory lexicons can be useful tools for processors, researchers, the industry and consumers (Lee & Chambers, 2007). They can also assist in the monitoring of products and product consistency for quality control as they can assist in describing a product, as well as in discriminating between products. These tools are also very useful during new product development and when profiling competitive products (Drake & Civille, 2002). 38
52 Table 6 Excerpt from an apple sensory lexicon (Corollaro et al., 2013). Category Attribute Sensory definition Evaluation procedure Reference 0 Reference 100 Appearance Green flesh The green tint of flesh Stellenbosch University Note the colour and evaluate the green gradation in white colour Printing of white colour (RGB model: red 255; green 255; blue 255) Printing of green colour (RGB model: red 207; green 253; blue 203) Appearance Yellow flesh The yellow tint of flesh Note the colour and evaluate the yellow gradation in white colour Printing of white colour (RGB model: red 255; green 255; blue 255) Printing of yellow colour (RGB model: red 252; green 237; blue 150) Texture Hardness Resistance of the sample to the first chews with molars Place the sample between the molars and press without breaking it (1 2 times), evaluating the resistance Carrot boiled for 12 min Carrot boiled for 4 min Texture Crispness Sound (pitch/intensity) produced by the sample at the first bite using the fore teeth Place the sample between the incisors, break it by a single bite and evaluate the sound Wet breakfast cereals a Dry breakfast cereals Texture Juiciness Amount of juice released during chewing (first three chews) Place the sample between the molars, chew 3 times quickly and create a depression to evaluate the amount of released juice Unripe melon Ripe melon Odour Overall odour Overall odour sensation (perceived by smelling) Open the lid of the cup, smell and quantify the intensity of all perceived odours Apple juice b diluted 1:2 Apple juice b as it is Flavour Sweet taste Sweet taste sensation Evaluate the intensity of sweet taste Fructose water solution 20 g/kg Fructose water solution 80 g/kg Flavour Bitter taste Bitter taste sensation Evaluate the intensity of bitter taste Caffeine water solution 0.15 g/kg Caffeine water solution 0.6 g/kg a 50 g breakfast honey balls extruded cereals (Miel Pops Kellogg's) were kept for 24 h at 23 C in a sealed bin together with a cup of 30 ml water. b 100% cloudy apple juice produced by Pfanner Getränke GmbH, Lauterach, Austria. 39
53 Table 7 Examples of sensory lexicons for various food and beverage products. General subject Product Authors Blueberry juice Bett-Garber & Lea, 2013 Pomegranate juice Koppel & Chambers, 2010 Beverage Coffee Hayakawa et al., 2010 White wine Pickering & Demiglio, 2008 Green tea Lee & Chambers, 2007 Grain Whole-grain rice Bett-Garber et al., 2012 Bread Elía, 2011 Apples Corollaro et al., 2013 Fruits and vegetables Mango Suwonsichon et al., 2012 Fresh leafy greens Talavera-Bianchi et al., 2010 Tomato Hongsoongnern & Chambers, 2008 Meat Beef Maughan et al., 2012 Miscellaneous Honey (floral) Galán-Soldevilla et al., Sensory wheels A sensory wheel is a simplified graphical representation of a sensory lexicon. Sensory wheels can be used as a communication tool between industries, marketers and researchers, and there are indications that the use of this type of tool has seen great success in industry. Sensory wheels usually consist of only aroma, flavour and mouthfeel attributes, or a combination of them. Sensory wheels usually consist of more than one level. The basic/general terms are located near the centre and the specific descriptive terms are located in the outer circle (Lawless & Heymann, 2010). Noble et al. (1984) developed an aroma wheel for wine to assist in the communication between winemakers and different members of the wine industry. Standardised terminology is very important in industry, for example when a winemaker describes a defect in the flavour of the wine, the winemaker and his staff should use the same terminology to ensure that the problem is recognised and solved (Noble et al., 1984). The wine industry responded positively to the latter wine aroma wheel, including wine consumers and journalists. After the initial development of this wine aroma wheel (Noble et al., 1984), it had to be standardised. The wine aroma wheel and a questionnaire were thus sent out for comments to more than 100 members in the USA wine industry. Their responses and feedback were used to standardise the wheel (Noble et al., 1987). The above-mentioned examples illustrate that the development of the sensory lexicon and wheel is a time-consuming process and requires a wide range of samples so that the full spectrum of attributes associated with the product in question is encompassed in the wheel. It is thus important that the samples should cover a wide range of variation, such as different production areas, harvesting years and seasonal effects. This will help in defining as many prospective sensory attributes as possible. 40
, olive oil (Aparicio & Morales, 1995), rooibos tea (Koch et al., 2012) and honeybush tea (Theron et al., 2014).")
54 A variety of flavour and aroma wheels have been developed for food products such as fish (Warm et al., 2000), red wine (Gawel et al., 2000), olive oil (Aparicio & Morales, 1995), rooibos tea (Koch et al., 2012) and honeybush tea (Theron et al., 2014). During the development of the rooibos sensory wheel in , 121 descriptive terms were generated by a trained panel during training sessions. The number of terms had to be reduced to about 10 or 20. Similar terms were grouped together and terms that were not used regularly were removed. The 20 flavour attributes and 7 taste and mouthfeel attributes were selected from the list based on frequency of quotation during descriptive sensory analysis (DSA). A three-tiered wheel was formed using the 27 attributes (Fig. 14) (Koch et al., 2012). The sensory wheel for honeybush (Fig. 15) consists of 28 flavour and 7 taste and mouthfeel attributes. The wheel consists of 10 sectors: floral, fruity, nutty, spicy, sweet, taste and mouthfeel, earthy, chemical and vegetative, and the attributes are grouped into two classes, positive and negative (Theron et al., 2014). The honeybush sensory wheel was developed in by the ARC in collaboration with Stellenbosch University and is used by the industry to help in tea evaluation and to compare and evaluate quality. The development of species-specific sensory wheels is being investigated, as the species differ in sensory profile. This will help to ensure a more consistent product. Fig. 14 Sensory wheel for rooibos tea (Koch et al., 2012). 41

55 Fig. 15 Sensory wheel for honeybush tea (Theron et al., 2014). 8. CONCLUSIONS Honeybush is a traditional herbal tea produced from Cyclopia species. It grows along the coastal and mountainous regions of the Eastern and Western Cape provinces of South Africa. There are more than 20 Cyclopia species. Not all of the species are used for commercial production. The rising interest in honeybush coincided with the increasing demand for health-promoting food worldwide. Honeybush contains no caffeine and has low tannin content. It contains numerous polyphenolic compounds associated with health-promoting properties. It was found that the different species differ in chemical composition, which may cause a difference in their sensory characteristics, which in turn influences the marketing of the product. The honeybush industry has the potential to become as successful as the rooibos industry. It is important that the descriptors used to describe honeybush are accurate. The product should be consistent and always taste the same. It is necessary to understand the differences between species and the factors that may influence them. Location, fermentation and environmental conditions may all influence the sensory and chemical characteristics of Cyclopia species. There is no official grading system for honeybush and the development of a generic flavour wheel and species-specific flavour wheels would help aid the development of a grading system. The use of flavour wheels is well known in the food industry. They improve communication between the different role players in the production of a product. 42
56 The fermentation of honeybush is one of the major factors that influence the sensory and phenolic profile of the tea. The conditions currently employed in industry are not optimum for all the Cyclopia species. The optimum fermentation temperature/time combination for some species has been determined in previous studies, but species such as C. longifolia need to be studied to determine the optimum temperature/time combination. The development of a prediction model for honeybush will also benefit the industry. This will assist in predicting the sensory characteristics of the product by looking at other variables such as chemical composition and processing parameters. This will be cost effective and less time consuming. 43
57 9. REFERENCES Abdi, H., Valentin, D., Chollet, S. & Chrea, C. (2007). Analysing assessors and products in sorting tasks: DISTATIS, theory and applications. Food Quality and Preference, 18, Addor, F. & Grazioli, A. (2002). Geographical indications beyond Wines and Spirits: A roadmap for a better protection for geographical indications in the WTO/TRIPS agreement. The Journal of World Intellectual Property, 5, Agricultural Research Counsel (ARC). (2013). The honeybush industry. [Internet document]. URL 23/04/2013. Anonymous. (2000). Agricultural Product Standards Act. Act no. 119 of G.N.R. 1177/2000. Johannesburg, South Africa: Lex Patria Publishers. Anonymous (2013). SAHTA. South African honeybush tea association. [Internet document]. URL 04/06/2014. Aparicio, R. & Morales, M.T. (1995). Sensory wheels : a statistical technique for comparing QDA panels - application to virgin olive oil. Journal of the Science of Food and Agriculture, 67, Aparicio, R., Morales, M.T. & Alonso, M.V. (1996). Relationship between volatile compounds and sensory attributes of olive oils by the sensory wheel. Journal of American Oil Chemists Society, 73, Arnold, R.A., Noble, A.C. & Singleton, V.L. (1980). Bitterness and astringency of phenolic fractions in wine. Journal of Agricultural and Food Chemistry, 28, Bajec, M.R. & Pickering, G.J. (2008). Astringency: mechanisms and perception. Critical Reviews in Food Science and Nutrition, 48, Bavay, C., Symoneaux, R., Maître, I., Kuznetsova, A., Brockhoff, P.B. & Mehinagic, E. (2013). Importance of fruit variability in the assessment of apple quality by sensory evaluation. Postharvest Biology and Technology, 77, Beelders, T., De Beer, D., Stander, M.A. & Joubert, E. (2014). Comprehensive phenolic profiling of Cyclopia genistoides (L.) Vent. by LC-DAD-MS and MS/MS reveals novel xanthone and benzophenone constituents. Molecules, 19, Beh, E.J., Lombardo, R. & Simonetti, B. (2011). A European perception of food using two methods of correspondence analysis. Food Quality and Preference, 22, Belitz, H-D. & Weiser, H. (1985). Bitter compounds: occurrence and structure-activity relationships. Food Reviews International, 1, Bender, A. (2014). The future of tea is green and herbal. [Internet document]. URL 06/10/2014. Bester, C. (2013). A model for commercialisation of honeybush tea, an indigenous crop. In: II All Africa Horticulture Congress. Pp September Skakuza, Kruger National Park, South Africa. 44
58 Bett-Garber, K.L. & Lea, J.M. (2013). Development of flavour lexicon for freshly pressed and processed blueberry juice. Journal of Sensory Studies, 28, Bett-Garber, K.L., Lea, J.M., Champagne, E.T. & McClung, A.M. (2012). Whole-grain rice flavor associated with assorted bran colors. Journal of Sensory Studies, 27, Bohin, M.C., Roland, W.S.U., Gruppen, H., Gouka, R.J., Van der Hijden, H.T.W.M., Dekker, P., Smit, G. & Vincken, J. (2013). Evaluation of the bitter-masking potential of food proteins for EGCG by a cell-based human bitter taste receptor assay and binding studies. Journal of Agricultural and Food Chemistry, 61, Bougeard, S. & Cardinal, M. (2014). Multiblock modelling for complex preference study. Application to European preference for smoked salmon. Food Quality and Preference,32, Brand-Jonker, N. (2014). Unieke name van SA kry vir die eerste keer beskereming. Rapport Sake, July 27, Bro, R., Qannari, E.M., Kiers, H.A.K., Næs, T. & Bom Frost, M. (2008). Multi-way models for sensory profiling data. Journal of Chemometrics, 22, Buettner, A. & Beauchamp, J. (2010). Chemical input sensory output: diverse modes of physiology-flavour interaction. Food Quality and Preference, 21, Campo, E., Do, B.V., Ferreira, V. & Valentin D. (2008). Aroma properties of young Spanish monovarietal white wines: a study using sorting task, list of terms and frequency of citation. Australian Journal of Grape and Wine Research, 14, Careri, M., Mangia, A., Barbieri, G., Bolzoni, L., Virgili, R. & Parolari, G. (1993). Sensory property relationships to chemical data of Italian-type dry-cured ham. Journal of Food Science, 58, Cartier, R., Rytz, A., Lecomte, A., Poblete, F., Krystlik, J., Belin, E. & Martin, N. (2006). Sorting procedure as an alternative to quantitative descriptive analysis to obtain a product sensory map. Food Quality and Preference, 17, Chandrashekar, J., Mueller, K.L., Hoon, M.A., Adler, E., Feng, L., Guo, W., Zuker, C.S. & Ryba, N.J.P. (2000). T2Rs function as bitter taste receptors. Cell, 100, Chellan, N., Joubert, E., Strijdom, H., Roux, C., Louw, J. & Muller, C.J.F. (2014). Aqueous extract of unfermented honeybush (Cyclopia maculata) attenuates STZ-induced diabetes and β- cell cytotoxicity. Planta Medica, 80, Chen, X., Gabitto, M., Peng, Y., Ryba, N.J.P. & Zuker, C.S. (2011). A gustotopic map of taste qualities in the mammalian brain. Science, 333, Chen, Q., Guo, Z. & Zhao, J. (2008). Identification of green tea s (Camellia sinensis (L.)) quality level according to measurement of main catechins and caffeine contents by HPLC and support vector classification pattern recognition. Journal of Pharmaceutical and Biomedical Analysis, 48,
59 Chollet, S., Leliévre, M., Abdi, H. & Valentin, D. (2011). Sort and beer: everything you wanted to know about the sorting task but did not dare to ask. Food Quality and Preference, 22, Corollaro, M.L., Endrizzi, I., Bertolini, A., Aprea, E., Demattè, M.L., Costa, F., Biasioli, F. & Gasperi, F. (2013). Sensory profiling of apple: methodological aspects, cultivar characterisation and postharvest changes. Postharvest Biology and Technology, 77, Cronje, J.C. (2010). Chemical characterisation of the aroma of honeybush (Cyclopia) species. PhD Dissertation, University of Stellenbosch, Stellenbosch, South Africa. Dahl, T., Tomic, O., Wold, J.P. & Næs, T. (2008). Some new tools for visualising multi-way sensory data. Food Quality and Preference, 19, De Beer, D. & Joubert, E. (2010). Development of HPLC for Cyclopia subternata phenolic compound analysis and application to other Cyclopia spp. Journal of Food Composition and Analysis, 23, De Beer, D., Schulze, A.E., Joubert, E., De Villiers, A., Malherbe, C.J. & Stander, M.A. (2012). Food ingredients extracts of Cyclopia subternata (honeybush): variation in phenolic composition and antioxidant capacity. Molecules, 17, Dehlholm, C., Brockhoff, P.B., Meinert, L., Aaslyng, M.D. & Bredie, W.L.P. (2012). Rapid descriptive sensory methods comparison of free multiple sorting, partial napping, napping flash profiling and conventional profiling. Food Quality and Preference, 26, Delahunty, C.M., Eyers, G. & Dulfour, J.-P. (2006). Gas-chromatography-olfactometry. Journal of Separation Science, 29, De Nysschen, A.M., Van Wyk, B-E., Van Heerden, F.R. & Schutte, A.L. (1996). The major phenolic compounds in the leaves of Cyclopia species (honeybush tea). Biochemical Systematics and Ecology, 24, Drake, M.A. & Civille, G.V. (2002). Flavour lexicons. Comprehensive Reviews in Food Science and Food Safety, 2, Drewnowski, A. & Rock, C.L. (1995). The influence of genetic taste markers on food acceptance. The American Journal of Clinical Nutrition, 62, Dudhai, Z., Louw, J., Muller, C., Joubert, E., De Beer, D., Kinnear, C. & Pheiffer, C. (2013). Cyclopia maculata and Cyclopia subternata (honeybush tea) inhibits adipogenesis in 3T3- L1 pre-adipocytes. Phytomedicine, 20, Du Toit, J. & Joubert, E. (1998a). Effect of drying conditions on the quality of honeybush tea (Cyclopia). Journal of Food Processing Preservation, 22, Du Toit, J. & Joubert, E. (1998b). The effect of pretreatment on the fermentation of honeybush tea (Cyclopia maculata). Journal of the Science of Food and Agriculture, 76, Du Toit, J. & Joubert, E. (1999). Optimization of the fermentation parameters of honeybush tea (Cyclopia). Journal of Food Quality, 22,
60 Du Toit, J., Joubert, E. & Britz, J. (1998). Honeybush tea A rediscovered indigenous South African herbal tea. Journal of Sustainable Agriculture, 12:2-3, Dutta, R., Kashwan, K.R., Bhuyan, M., Hines, E.L. & Gardner, J.W. (2003). Electronic nose based tea quality standardisation. Neural Networks, 16, El Gharra, H. (2009). Polyphenols: food sources, properties and applications a review. International Journal of Food Science and Technology, 44, Elía, M. (2011). A procedure for sensory evaluation of bread: protocol developed by a trained panel. Journal of Sensory Studies, 26, Falahee, M. & MacRae, A.W. (1997). Perceptual variation among drinking waters: the reliability of sorting and ranking data for multidimensional scaling. Food Quality and Preference, 8, Faye, P., Brémaud, D., Daubin, M.D., Courcoux, P., Giboreau, A. & Nicod, H. (2004). Perceptive free sorting and the verbalisation tasks with naïve subjects: an alternative to descriptive mappings. Food Quality and Preference,15, Feria-Morales, A.M. (2002). Examining the case of green coffee to illustrate the limitations of grading systems/expert tasters in sensory evaluation for quality control. Food Quality and Preference, 13, Ferreira, D., Kamara, B.I., Brandt, E.V. & Joubert, E. (1998). Phenolic compounds from Cyclopia intermedia (honeybush tea). Journal of Agriculture and Food Chemistry, 46, Fraga, C.G., Galleano, M., Verstraeten, S.V. & Oteiza, P.I. (2010). Basic biochemical mechanisms behind the health benefits of polyphenols. Molecular Aspects of Medicine, 31, Frank, I.E. & Kowalski, B.R. (1984). Prediction of wine quality and geographic origin from chemical measurements by partial least-squares regression modelling. Analytica Chimica Acta, 162, Galán Soldevilla, H., Ruiz-Pérez-Cacho, M.P., Jiménez, S.S., Villarejo, M.J. & Manzanares, A.B. (2005). Development of preliminary sensory lexicon for floral honey. Food Quality and Preference, 16, Gawel, R., Oberholster, A. & Francis, L. (2000). A mouth-feel wheel : terminology for communicating the mouth-feel characteristics of red wine. Australian Journal of Grape and Wine Research, 6, Gilbertson, T.A., Damak, S. & Margolskee, R.F. (2000). The molecular physiology of taste transduction. Current Opinion in Neurobiology, 10, Hanekom, E. (2012). Chemical, sensory and consumer profiling of a selection of South African Chenin blanc wines produced from bush vines. MSc Thesis, University of Stellenbosch, Stellenbosch, South Africa. 47
61 Hattori, S., Takagaki, H. & Fujimori, T. (2003). Evaluation of Japanese green tea using GC/O with original aroma simultaneously input to the sniffing port method (OASIS). Food Science and Technology Research, 9, Hayakawa, F., Kazami, Y., Wakayama, H., Oboshi, R., Tanaka, H., Maeda, G., Hoshino, C., Iwawaki, H. & Miyabayashi, T. (2010). Sensory lexicon of brewed coffee for Japanese consumers, untrained coffee professionals and trained coffee tasters. Journal of Sensory Studies, 25, Hongsoongnern, P. & Chambers, E., IV. (2008). A lexicon for texture and flavor characteristics of fresh and processed tomatoes. Journal of Sensory Studies, 23, Joubert, E. (1994). Processing of rooibos tea (Aspalathus linearis) under controlled conditions. PhD Dissertation, University of Stellenbosch, Stellenbosch, South Africa. Joubert, E., De Beer, D., Hernández, I. & Munné-Bosch, S. (2014). Accumulation of mangiferin, isomangiferin, iriflophenone-3-c-β-glucoside and hesperidin in honeybush leaves (Cyclopia genistoides Vent.) in response to harvest time, harvest interval and seed source. Industrial Crops and Products, 56, Joubert, E., Gelderblom, W.C.A., Louw, A. & de Beer, D. (2008a). South African herbal teas: Aspalathus linearis, Cyclopia spp. and Athrixia phylicoides a review. Journal of Ethnopharmacology, 119, Joubert, E., Joubert, M.E., Bester, C., de Beer, D. & De Lange, J.H. (2011). Honeybush (Cyclopia spp.): From local cottage industry to global markets The catalytic and supporting role of research. South African Journal of Botany, 77, Joubert, E., Manley, M., Maicu, C. & De Beer, D. (2010). Effect of pre-drying treatments and storage on color and phenolic composition of green honeybush (Cyclopia subternata) herbal tea. Journal of Agricultural and Food Chemistry, 58, Joubert, E., Otto, F., Grüner, S. & Weinreich, B. (2003). Reversed-phase HPLC determination of mangiferin, isomangiferin and hesperidin in Cyclopia and the effect of harvesting date on the phenolic composition of C. genistoides. European Food Research and Technology, 216, Joubert, E., Richards, E.S., Van der Merwe, J.D., De Beer, D., Manley, M. & Gelderblom, W.C.A. (2008b). Effect of species variation and processing on the phenolic composition and in vitro antioxidant activity of aqueous extracts of Cyclopia spp. (honeybush tea). Journal of Agricultural and Food Chemistry, 56, Kamara, I.B., Brand, D.J., Brandt, E.V. & Joubert, E. (2004). Phenolic metabolites from honeybush tea (Cyclopia subternata). Journal of Agricultural and Food Chemistry, 52, Kamara, I.B., Brandt, E.V., Ferreira, D. & Joubert, E. (2003). Polyphenols from honeybush tea (Cylopia intermedia). Journal of Agricultural and Food Chemistry, 51,
62 Kinghorn, A.D., Chin, Y., Pan, L. & Jia, Z. (2010). Natural products as sweeteners and sweetness modifiers. In: Comprehensive Natural Products II: Chemistry and Biology, Volume 3: Development and Modification of Bioactivity (edited by Mander, L. & Lui, H.B.). Elsevier: New York, USA, Pp Koch, I.S. (2011). Development of a sensory lexicon and sensory wheel for rooibos (Aspalathus linearis) and the role of its phenolic composition on taste and mouthfeel. MSc Thesis, University of Stellenbosch, Stellenbosch, South Africa. Koch, I.S., Muller, M., Joubert, E., Van der Rijst, M. & Næs, T. (2012). Sensory characterisation of rooibos tea and the development of a rooibos sensory wheel and lexicon. Food Research International, 46, Kokotkiewicz, A., Luczkiewics, M., Pawlowska, J., Luczkiewicz, P., Sowinski, P., Witkowski, J., Bryl, E. & Buchinski, A. (2013). Isolation of xanthone and benzophenone derivates from Cyclopia genistoides (L.) Vent. (honeybush) and their pro-apoptotic activity on synoviocytes from patients with rheumatoid arthritis. Fitoterapia, 90, Kokotkiewicz, A., Luczkiewics, M., Sowinski, P., Gorynski, K. & Buchinski, A. (2012). Isolation and structure elucidation of phenolic compounds from Cyclopia subternata Vogel (honeybush) intact plant and in vitro cultures. Food Chemistry, 133, Koppel, K. & Chambers, E., IV. (2010). Development and application of a lexicon to describe the flavor of pomegranate juice. Journal of Sensory studies, 24, Kovács, Z., Dalmadi, I., Lukács, L., Sipos, L., Szántai-Kőhegyi, K., Kókai, Z. & Fekete, A. (2010). Geographical origin identification of pure Sri Lanka tea infusions with electronic nose, electronic tongue and sensory profile analysis. Journal of Chemometrics, 24, Lawless, H.T. (1999). Descriptive analysis of complex odors: reality, model or illusion? Food Quality and Preference, 10, Lawless, H.T. & Heymann, H. (2010). Descriptive analysis. In: Sensory evaluation of food, principles and practices, 2 nd ed. New York, USA: Springer. Lawless, H.T., Sheng, N. & Knoops, S.S.C.P. (1995). Multidimensional scaling of sorting data applied to cheese perception. Food Quality and Preference, 6, Lee, J. & Chambers, D.H. (2007). A flavour lexicon for flavour descriptive analysis of green tea. Journal of Sensory Studies, 22, Lee, S.M., Chung, S., Lee, O., Lee, H., Kim, Y. & Kim, K. (2008). Development of sample preparation, presentation procedure and sensory descriptive analysis of green tea. Journal of Sensory Studies, 23, Lelièvre, M., Chollet, S., Abdi, H. & Valentin, D. (2008). What is the validity of the sorting task for describing beer? A study using trained and untrained assessors. Food Quality and Preference, 19,
63 Le Roux, M., Cronje, J.C., Burger, B.V. & Joubert, E. (2012). Characterisation of volatiles and aroma-active compounds in honeybush (Cyclopia subternata) by GC-MS and GC-O analysis. Journal of Agricultural and Food Chemistry, 60, Le Roux, M., Cronje, J.C., Joubert, E. & Burger, B.V. (2008). Chemical characterisation of the constituents of the aroma of honeybush, Cyclopia genistoides. South African Journal of Botany, 74, Lesschaeve, I. & Noble, A.C. (2005). Polyphenols: factors influencing their sensory properties and their effects on food and beverage preferences. The American Journal of Clinical Nutrition, 81, 330S-335S. Ley, J.P. (2008). Masking bitter taste by molecules. Chemosensory Perception, 1, Ley, J.P., Blings, M., Paetz, S., Kindel, G., Freiherr, K., Krammer, G.E. & Bertram, H.J. (2008). Enhancers for sweet taste from the world of non-volatiles: polyphenols as taste modifier. In: Sweetness and sweeteners biology, chemistry and psychophysics (edited by Weerasinghe, D.K. & DuBois, G.E.). New York, USA: Oxford University Press. Ley, J.P., Krammer, G., Reinders, G., Gatgield, I.L. & Bertram, H.J. (2005). Evaluation of bitter masking flavanones from Herba Santa (Eriodictyoncalifornicum (H. & A.) Torr., Hydrophyllaceae). Journal of Agricultural and Food Chemistry, 53, Ley, J., Reichelt, K. & Krammer, G. (2011). Flavor suppression and enhancement. In: Food flavors: chemical, sensory and technological properties (edited by Jeleń, H.). Boca Raton, USA: CRC Press. Li, X., Staszewski, L., Xu, H., Durick, K., Zoller, M. & Adler, E. (2002). Human receptors for sweet and umami taste. Proceedings of the National Academy of Science, USA, 99, Luciano, G. & Næs, T. (2009). Interpreting sensory data by combining principal component analysis and analysis of variance. Food Quality and Preference, 20, Marloth, R. (1925). The flora of South Africa with synoptical tables of the genera of higher plants. Darter Bros & Co, Cape Town, South Africa (As cited by Joubert et al., 2011). Masibo, M. & He, Q. (2008). Major mango polyphenols and their potential significance to human health. Comprehensive Reviews in Food Science and Food Safety, 7, Maughan, C., Tansawat, R., Cornforth, D., Ward, R. & Martini, S. (2012). Development of a beef flavour lexicon and its application to compare the flavour profile and consumer acceptance of rib steaks from grass- or grain-fed cattle. Meat Science, 90, McEwan, J.A. & Schlich, P. (1991/1992). Correspondence analysis in sensory evaluation. Food Quality and Preference, 3, Meilgaard, M.C., Civille, G.V. & Carr, B.T. (1991). Sensory evaluation techniques, 4 th ed. CRC Press. Millin, D.J., Crispin, D.J. & Swaine, D. (1969). Nonvolatile components of black tea and their contribution to the character of the beverage. Journal of Agricultural and Food Chemistry, 17,
64 Muller, C.J.F., Joubert, E., Gabuza, K., De Beer, D., Fey, S.J. & Louw, J. (2011). Assessment of the antidiabetic potential of an aqueous extract of honeybush (Cyclopia intermedia) in streptozotocin and obese insulin resistant wistar rats. In: Phytochemicals Bioactivities and Impact on Health (edited by I. Rasooli). Pp InTech Europe. Munoz, A.M. & Civille, G.V. (1998). Universal, product and attribute specific scaling and the development of common lexicons in descriptive analysis. Journal of Sensory Studies, 13, Murray, J.M., Delahunty, C.M. & Baxter, I.A. (2001). Descriptive sensory analysis: past, present and future. Food Research International, 34, Noble, A.C. (1996). Taste-aroma interactions. Trends in Food Science and Technology, 7, Noble, A.C., Arnold, R.A., Masuda, B.M., Pecore, S.D., Schmidt, J.O. & Stern, P.M. (1984). Progress towards a standardised system of wine aroma terminology. American Journal of Enology and Viticulture, 35, Noble, A.C., Arnold, R.A., Buechsenstein, J., Leach, E.J., Schmidt, J.O. & Stern, P.M. (1987). Modification of a standardised system of wine aroma terminology. American Journal of Enology and Viticulture, 38, Owuor, P.O., Obanda, M., Nyirenda, H.E. & Mandala, W.L. (2008). Influence of region of production on clonal black tea chemical characteristics. Food Chemistry, 108, Palmer, D.H. (1974). Multivariate analysis of flavour terms used by experts and non-experts for describing teas. Journal of the Science of Food and Agriculture, 25, Peleg, H., Gacon, K., Schlich, P. & Noble, A.C. (1999) Bitterness and astringency of flavon-3-ol monomers, dimers and trimers. Journal of Science of Food and Agriculture, 79, Pheiffer, C., Didhai, Z., Louw, J., Muller, C. & Joubert, E. (2013). Cyclopia maculata (honeybush tea) stimulates lipolysis in 3T3-L1 adipocytes. Phytomedicine, 20, Pickering, G.J. & Demiglio, P. (2008). The white wine mouthfeel wheel: a lexicon for describing the oral sensations elicited by white wines. Journal of Wine Research, 19, Piggott, J.R. & Jardine, S.P. (1979). Descriptive sensory analysis of whisky flavour. Journal of the Institute of Brewing, 85, Rabe, C., Steenkamp, J.A., Joubert, E., Burger, J.F.W. & Ferreira, D. (1994). Phenolic metabolites from rooibos tea. Phytochemistry, 35, Ramos Da Conceicao Neta, E., Johanningsmeier, S.D. & McFeeters R.F. (2007). The chemistry and physiology of sour taste a review. Journal of Food Science, 72, R33-R38. Reichelt, K.V., Peter, R., Paetz, S., Roloff, M., Ley, J.P., Krammer, G.E. & Engel, K-H. (2010). Characterisation of flavour modulating effects in complex mixtures via high temperature liquid chromatography. Journal of Agricultural and Food Chemistry, 58, Ringnér, M. (2008). What is principal component analysis? Nature Biotechnology, 26,
65 Rodgers, S., Glen, R.C. & Bender, A. (2006). Characterising bitterness: identification of key structural features and development of a classification model. Journal of Chemical Information and Modelling, 46, Ryan, D., Prenzler, P.D., Saliba, A.J. & Scollary, G.R. (2008). The significance of low impact odorants in global odour perception. Trends in Food Science and Technology, 19, Sáenz-Navajas, M-P., Campo, E., Avizcuri, J.M., Valentin, D., Fernández-Zurbano, P & Ferreira, V. (2012). Contribution of non-volatile and aroma fractions to in-mouth sensory properties of red wines: wine reconstitution strategies and sensory sorting task. Analytica Chimica Acta, 732, SAHTA. (2011). Honeybush cultivation & industry. Honeybush Industry Brochure. South African Honeybush Tea Association, South Africa. SAHTA. (2012). Farming with honeybush: general guidelines. South African Honeybush Tea Association, South Africa. Scharbert, S. & Hofmann, T. (2005). Molecular definition of black tea taste by means of quantitative studies, taste reconstitution and omission experiments. Journal of Agricultural and Food Chemistry, 53, Scharbert, S., Holzmann, N. & Hofmann, T. (2004). Identification of the astringent taste compounds in black tea infusions by combining instrumental analysis and human bioresponse. Journal of Agricultural and Food Chemistry, 52, Schulze, A.E. (2013). HPLC method development for characterisation of the phenolic composition of Cyclopia subternata and C. maculata extracts and chromatographic fingerprint analysis for quality control. MSc Thesis, University of Stellenbosch, Stellenbosch, South Africa. Schutte, A.L. (1995). A taxonomic study of the tribes Podalyrieae and Liparieae (Fabaceae). PhD Dissertation. Rand Afrikaans University, Johannesburg, South Africa. Schutte, A.L. (1997). Systematics of the genus Cyclopia Vent. (Fabaceae, Podalyrieae). Edinburgh Journal of Botany, 54, (As cited by Joubert et al., 2011). Seppä, L., Railio, J., Mononen, R., & Tourila, H. (2012). From profiles to practise: communicating the sensory characteristics of apples to the wider audience through simplified descriptive profiles. LWT Food Science and Technology, 47, Servant, G., Tachdjian, C., Li, X. & Karanewsky, D.S. (2011). The sweet taste of true synergy: positive allosteric modulation of the human sweet taste receptor. Trends in Pharmacological Sciences, 32, Stevenson, R.J., Prescott, J. & Boakes, R.A. (1999). Confusing tastes and smells: how odours can influence the perception of sweet and sour tastes. Chemical senses, 24, Stone, H., Bleibaum, R.N. & Thomas, H.A. (2012). Sensory evaluation practises, 4 th ed. London, UK: Academic Press. 52
66 Stone, S. & Sidel, J.L. (1993). Sensory evaluation practises, 2 nd ed. London, UK: Academic Press. Suwonsichon, S., Chambers, E., IV, Kongpensook, V. & Oupadissakoon, C. (2012). Sensory lexicon for mango as affected by cultivars and stages of ripeness. Journal of Sensory studies, 27, Talavera-Bianchi, M., Chambers, E. & Chambers D.H. (2010). Lexicon to describe flavour of fresh leafy vegetables. Journal of Sensory Studies, 25, Tang, C. & Heymann, H. (2002). Multidimensional sorting, similarity scaling and free-choice profiling of grape jellies. Journal of Sensory Studies, 17, Theron, K.A. (2012). Sensory and phenolic profiling of Cyclopia species (Honeybush) and optimisation of the fermentation conditions. MSc Thesis, University of Stellenbosch, Stellenbosch, South Africa. Theron, K.A., Muller, M., Van der Rijst, M., Cronje, J.C., Le Roux, M. & Joubert, E. (2014). Sensory profiling of honeybush tea (Cyclopia species) and the development of a honeybush sensory wheel. Food Research International, 66, Tomás-Barberán, F. A. & Espín, J.C. (2001). Phenolic compounds and related enzymes as determinants of quality in fruits and vegetables. Journal of the Science of Food and Agriculture, 81, Tounekti, T., Joubert, E., Hernández, I. & Munné-Bosch, S. (2013). Improving the polyphenol content of tea. Critical Reviews in Plant Sciences, 32, Trivedi, B.P. (2012). Hardwired for taste. Nature Outlook, 486, s7-s9. Turpie, J.K., Heydenrych, B.J., Lamberth, S.J. (2003). Economic value of terrestrial and marine biodiversity in the cape floristic region: implications for defining effective and socially optimal conservation strategies. Biological Conservation, 112, Valentin, D., Chollet, S., Lelièvre, M. & Abdi, H. (2012). Quick and dirty but still pretty good: a review of new descriptive methods in food science. International Journal of Food Science and Technology, 47, Van de Kop, P. & Sautier, D. (2006). Rooibos tea, South Africa: the challenge of an export boom. In: Origin-based products. Lessons for pro-poor market development (edited by P. van de Kop, D. Sautier & A. Gerz). Pp Amsterdam, Netherlands: Royal Tropical Institute (KIT). Vauzour, D., Rodriquex-Mateos, A., Corona, G., Oruna-Concha, M.J. & Spencer, J.P.E. (2010). Polyphenols and human health: prevention of disease and mechanisms of action. Nutrients, 2, Wang, K. & Ruan, J. (2009). Analysis of chemical components in green tea in relation with perceived quality, a case study with Longjing teas. International Journal of Food Science and Technology, 44,
67 Warm, K., Nelsen, J. & Hyldig, G. (2000). Sensory quality criteria for five fish species. Journal of Food Quality, 23, Wolters, C.J. & Allchurch, E.M. (1994). Effect of training procedure on the performance of descriptive panels. Food Quality and Preference, 5, Yao, L., Caffin, N., D arcy, B., Jiang, Y., Shi, J., Singanusong, R., Liu, X., Datta, N., Kakuda, Y. & Xu, Y. (2005). Seasonal variations of phenolic compounds in Australian-grown tea (Camellia sinensis). Journal of Agricultural and Food Chemistry, 53, Yarmolinsky, D.A., Zuker, C.S. & Ryba, N.J.P. (2009). Common sense about taste: from mammals to insects. Cell, 139,
68 CHAPTER 3 The effect of fermentation temperature and time on the sensory profile of C. longifolia TABLE OF CONTENTS Abstract 1. Introduction 2. Materials and methods Sample collection and processing of plant material Preparation of infusion Descriptive sensory analysis Training panel Testing procedure 2.4 Statistical procedures 3. Results and discussion 4. Conclusions 5. References 55
69 ABSTRACT The effect of fermentation temperature and time on the sensory characteristics of C. longifolia was investigated to establish the optimum fermentation conditions. Cyclopia longifolia harvested from three different areas were divided into batches and fermented at 80 C and 90 C for 8, 16, 24 and 32 h. Descriptive sensory analysis (DSA) was conducted to determine the effect of these fermentation conditions on the sensory profile of C. longifolia. The fermentation temperature and time combinations tested did not result in the development of any new sensory attributes; the existing positive and negative sensory attributes were merely intensified and reduced, respectively. This herbal tea became more floral with increasing fermentation time, while the green grass notes decreased considerably. Fermentation of C. longifolia at 80 C/24 h and 90 C/24 h ensured adequate formation of the positive sensory attributes and decrease of the negative sensory attributes. Fermentation for a longer time (32 h) did not result in any significant differences from the samples fermented for 24 h and hence, given the cost of heating, the time should be limited. The sensory profile of C. longifolia achieved after fermentation at 80 C/24 h and 90 C/24 h can be described as having a fynbos-floral, apricot/apricot jam, woody and fynbos-sweet aroma and flavour, a sweet taste and a slight astringent mouthfeel; furthermore, the negative attributes were effectively reduced to an acceptable level. 1. INTRODUCTION Fermented honeybush tea, produced from several species of the genus Cyclopia, is the major product sold on the local South African and global markets (Joubert et al., 2011). This product has a characteristic sensory profile that can be described as floral, fruity, plant-like, woody and sweet-associated, with a sweet taste and slight astringent mouthfeel (Theron et al., 2014). At present 23 Cyclopia species have been described, but not all of them are used for commercial production. The honeybush industry has grown tremendously over the past ten years, and with the demand exceeding supply, more Cyclopia species are being investigated for production (Joubert et al., 2011). One such species with a history of use that is currently in cultivation trials is C. longifolia. The term fermentation used in the honeybush tea industry refers to the chemical oxidation process that takes place during processing and results in the distinctive dark brown colour and characteristic sensory profile (Du Toit & Joubert, 1999; Theron 2012). The traditional practice of fermentation heaps (Marloth, 1925), baking ovens (Hofmeyer & Phillips, 1922) and sun drying have been replaced by the use of rotation drums for fermentation and drying at controlled conditions. Fermentation conditions employed should be selected to achieve optimum tea quality. This requires knowledge of the processing factors that affect the sensory quality of honeybush tea. Major factors are fermentation temperature and time (Du Toit & Joubert, 1999; Joubert et al., 2011). Du Toit and Joubert (1999) studied the effect of fermentation temperature and time on the quality of C. intermedia and C. buxifolia (previously classified as C. maculata ex Du Toit s Kloof). It 56
70 was found that higher temperatures required shorter fermentation times to produce the characteristic sweet, honey-like flavour with no negative aroma attributes such as grassy undertones. It was suggested that fermentation at 70 C for 60 h or 90 C for 36 h produced a good-quality tea (Du Toit & Joubert, 1999). A recent study by Bergh (2014) on C. intermedia confirmed that the latter fermentation conditions result in optimum sensory quality attributes when considering this species. The effect of fermentation conditions on sensory attributes of other Cyclopia species of commercial interest, i.e. C. genistoides, C. maculata and C. subternata, was investigated by Theron (2012). Varying fermentation temperatures (80 C and 90 C) and times (8, 16, 24 and 32 h) demonstrated different optimum conditions for each species. Cyclopia genistoides, fermented at 80 C/24 h, had a strong rose geranium aroma. Fermentation of C. maculata at 90 C, as opposed to 80 C, caused an increase in negative sensory attributes; however, a fermentation time of 24 h effectively reduced the intensity of the negative sensory attributes so that fermentation of C. maculata at 80 C for 24 h was recommended for optimum sensory quality. It was found that C. subternata can be fermented at 80 C/24 h or 90 C/16 h, depending on whether a floral or apricot jam note is desired (Theron, 2012). These results clearly indicate that fermentation conditions should be optimised for each Cyclopia species. In view of the above, the objective of this study was therefore to determine the effect of different fermentation temperature/time combinations on the sensory profile of C. longifolia in order to identify the optimum fermentation conditions. 2. MATERIALS AND METHODS 2.1 Sample collection and processing of plant material Three batches of C. longifolia plant material were harvested at each of the three locations in the Western and Eastern Cape provinces of South Africa (Bredasdorp, Barrydale and Tsitsikamma) from experimental and commercial plantations. A batch consisted of the shoots of more than one plant that were pooled. The weight of the batches varied between kg. The different batches of plant material were processed at the ARC, Infruitec-Nietvoorbij, Stellenbosch, South Africa according to a standardised protocol as described by Le Roux et al. (2008). Before cutting the shoots into 2-3 mm lengths with a mechanised fodder cutter, thick stems and stems without leaves were removed. The cut plant material of each batch was mixed thoroughly, divided into 1 kg sub-batches and placed into stainless steel containers (one for each temperature/time combination) and lastly superficially moistened with 250 ml water. The containers were sealed using aluminium foil, after which they were placed into temperaturecontrolled laboratory ovens (CAL 3200; CAL Controls Ltd., UK) to ferment the plant material at different temperature/time regimes (80 C and 90 C for 8, 16, 24 and 32 h). One sample was removed from each oven per time point, spread out on separate fine-mesh drying trays and dried under controlled conditions (40 C for 6 h), using a cross-flow drying tunnel. The dried samples (<10% moisture content) were sieved (200 g/30 s at 90 rpm) using a SMC Mini-sifter (JM Quality Services, Cape Town, South Africa) and the fractions <12 mesh and >40 mesh were finally 57
71 collected. The plant material was stored at room temperature in sealed glass jars, until analysed. Table 1 displays the experimental design for a total of 72 samples, with each sample being analysed in triplicate. 2.2 Preparation of infusion Freshly boiled distilled water (1000 g) was poured onto sieved plant material (12.5 g), infused for 5 min and strained through a fine-mesh stainless steel strainer into a 1 L stainless steel thermos flask (Woolworths, Bellville, South Africa). The infusion (ca. 100 ml) was served in white porcelain mugs covered with plastic lids to prevent loss of volatiles. The mugs were labelled with three-digit codes and arranged in randomised order for each panellist. Measures taken to keep the temperature of the infusions constant during serving included pre-heating of the thermos flasks and mugs before addition of the infusion and the use of temperature-controlled (65 C) scientific water baths (SMC, Cape Town, South Africa) during serving, as proposed by Koch et al. (2012). See Addendum A (Fig. 1A) for photos of the latter measures. 2.3 Descriptive sensory analysis Training panel The sensory panel consisted of ten female assessors who had extensive experience in the assessment of rooibos tea quality. From 2010 onwards the panel received extensive training in the assessment of the respective honeybush species, using descriptive sensory analysis (DSA) as test technique (Lawless & Heymann, 2010). Training sessions were conducted to generate the suitable aroma, flavour, taste and mouthfeel descriptors associated with different Cyclopia species. During each of these training sessions six honeybush samples were analysed (Theron, 2012). Six one-hour training sessions were used to train the panel for assessment of the sensory profile of C. longifolia. The list of 68 aroma, 51 flavour and taste, and mouthfeel attributes based on the sensory profiles of six Cyclopia species, generated by Theron et al. (2014), were used as a basis to generate the descriptors used to describe C. longifolia. The list of attribute descriptors for C. longifolia consists of: 22 for aroma, 16 for flavour, 3 for taste and 1 for mouthfeel (Table 2). The aroma was analysed first by removing the plastic lid, swirling the cup before smelling, followed by a discussion of the perceived aroma attributes until the panel reached consensus. The flavour, taste and mouthfeel were then analysed by sucking a mouthful of the tea infusion using a round tablespoon. Between each sample the panel were asked to cleanse their palates with unsalted water biscuits (Woolworths, Stellenbosch, South Africa) and distilled water Testing procedure After training was completed and the panellists had a good understanding of the product, the testing phase started. The panellists were asked to rate the intensities of the aroma, flavour, taste and mouthfeel attributes present in the samples. The samples were labelled with three-digit codes and presented in randomised order. The panellists rated the intensities of attributes on a unstructured line scale (0 100), using Compusense five software program (Compusense, 58
72 Guelph, Canada). The samples were analysed in triplicate in three consecutive sessions to test judge reliability. After each session the panel had a 10 min break to avoid panel fatigue. All analyses were conducted in booths fitted with controlled lighting. 2.4 Statistical procedures The data from all the assessors for each individual sample were collected and analysed. The performance of the panel was monitored using Panelcheck software (Version 1.4.0, Nofima Mat, Ås, Norway). SAS software (Version 9.2; SAS Institute Inc., Cary, USA) was used to subject the data to test-retest analysis of variance (ANOVA). The residuals were tested for non-normality by using the Shapiro-Wilk test and outliers were identified and removed in the event of significant nonnormality (p 0.05). Principal component analysis (PCA) and discriminant analysis (DA) plots were produced, using XLStat (Version , Addinsoft, New York, USA) to provide a graphical representation of the relationship between the samples and their attributes. 3. RESULTS AND DISCUSSION The characteristic dark brown colour of the tea leaves and the sweet, honey-like flavour of honeybush tea develop during the high temperature chemical oxidation process, better known as fermentation (Du Toit & Joubert, 1999). Previous studies on the Cyclopia species of commercial importance, excluding C. longifolia, demonstrated that the optimum fermentation temperature/time combination depends on the specific species (Du Toit & Joubert, 1999; Theron, 2012; Bergh, 2014). These studies also demonstrated that high-temperature fermentation is required to develop the sought-after sensory profile of honeybush. Additionally, Theron (2012) showed for C. subternata that more than one optimum fermentation temperature/time condition can exist, depending on the desired sensory profile. In this study C. longifolia was fermented at 80 C and 90 C with sampling at 8, 16, 24 and 32 hours to determine the optimum fermentation parameters. These parameters were chosen, since previous studies on C. intermedia, C. buxifolia (previously classified as C. maculata ex Du Toit s Kloof), C. genistoides, C. maculata and C. subternata showed that the optimum would most likely be reached within these conditions (Du Toit & Joubert, 1999; Theron, 2012; Bergh, 2014). A PCA plot was used to display the effect of different fermentation temperature/time combinations on the full sensory profile of C. longifolia samples (Fig. 1). The samples are split along principal component one (PC1, also Factor 1) of the scores plot (Fig. 1a), with most of the samples fermented for 8 h positioned on the left-hand side. Samples fermented for longer periods were progressively positioned to the right with all samples fermented for 24 and 32 h, except two samples fermented at 80 C for 24 h, positioned on the left side of the plot. All samples fermented at 90 C for 16 h were positioned on the far right side of the scores plot. The loadings plot (Fig. 1b) shows the positioning of the attributes corresponding with the samples on the scores plot (Fig. 1a). The positive attributes are split from the negative attributes along PC1. The samples fermented for 8 h mostly associated with the negative aroma and flavour attributes such as hay/dried grass, burnt caramel, cooked vegetable and green grass, as well as with sour and bitter taste and a 59
73 prominent astringent mouthfeel. In this study it was found that burnt caramel was associated with samples fermented for a short period. Previously, with other Cyclopia species, the presence of this attribute was associated with over-fermentation. Du Toit and Joubert (1999) found that fermentation longer that 36 h at 90 C resulted in a burnt flavour, whereas Theron (2012) found that over- and under-fermented teas were associated with the following sensory attributes: dusty, medicinal, burnt caramel, rotting plant water, cooked vegetable, green grass, hay/dried grass aroma notes and a detectable sour taste. The association of samples fermented for a short period with burnt caramel could be a result of the intensely sweet aroma of these samples, i.e. the so-called boiled syrup aroma that was noted in some under-fermented samples. The PCA plot (Fig. 1) furthermore indicates that more samples fermented at 80 C associated with negative sensory attributes, especially samples fermented for 8 h and 16 h than samples fermented at 90 C. It was also important to see how the respective treatments associated with the range of attributes when considering the positive attributes (Fig. 2) and negative attributes (Fig. 3), separately. The PCA loadings plot (Fig. 2b) displaying the positive attributes shows a clear split along the PC1. All the floral, woody and fruity attributes lie to the right side of the plot, whereas only boiled syrup and plant-like are situated on the left side of the loadings plot. The samples associated with the latter two sensory attributes, boiled syrup and plant-like, were mostly the samples fermented for 8 h and 16 h at 80 C, probably because of the absence of the other more distinctive sweet-associated attributes. Plant-like is considered a positive attribute and is defined as the slightly sour aroma associated with freshly cut fynbos plant material. Five of the samples fermented at the higher temperature of 90 C for 8 h also associated with these two attributes; however, there were exceptions, i.e. one batch from harvest set one (s1_90_8) and all three batches from harvest set two (s2_90_8). The latter 90 C/8 h samples did not show any prominent boiled syrup or plant-like notes and were thus more associated with the other positive attributes situated on the right side of the PCA plot. The PCA plot displaying the negative aroma and flavour attributes, as well as the taste and mouthfeel attributes, again shows a clear split between the samples (Fig. 3). The negative attributes hay/dried grass, green grass and cooked vegetable aroma and flavour, and a distinctive bitter taste and astringent mouthfeel lie to the right-hand side of the PCA loadings plot (Fig. 3b), again associating with most of the samples fermented for 80 C/8 h. A few samples indicated on the upper-left quadrant (Fig. 3a) seemed to associate with a dusty aroma and flavour. The reason for the development of the dusty note is not clear. Pearson s correlation coefficients (Table 3) indicate positive, moderately strong correlations between dusty and a number of positive attributes, i.e. fynbos-floral (r = 0.598), cooked apple (r = 0.637), fynbossweet (r = 0.597), cassia/cinnamon (r = 0.668), walnut (r = 0.585) and woody (r = 0.713). The maximum intensity of dusty aroma and flavour perceived in C. longifolia infusions were very low (7 and 2 out of 100, respectively) (Table 4) and would hardly be noticeable, thus possibly negating 60
74 its negative effect. At such low intensities the attribute dusty was not perceived as a negative attribute; however, if the intensity increases it might become more negative. In correlation analysis, the degree of linear association is shown by the correlation coefficient and the closer r is to 1, the stronger the linear association between the two variables is (Taylor, 1990). In PCAs, when based on the correlation matrix, attributes can lie close together on the loadings plot and also have high Pearson s correlation coefficients; however, such relationships can easily be meaningless. Talavera-Bianchi et al. (2010) concurs with this and indicates that certain attributes can change in a similar way over a large sample set and this could suggest chance attribute groupings. In our study the Pearson s correlation coefficients (Table 3) indicated significant patterns between the positive and negative aroma attributes. Fynbos-floral, one of the major positive notes in this Cyclopia species, had a strong negative correlation with most of the negative sensory attributes, i.e. burnt caramel (r = ), hay/dried grass (r = ), green grass (r = ) and cooked vegetables (r = ). Fynbos-floral also had a strong negative correlation with some of the taste and mouthfeel attributes, i.e. sour (r = ), bitter (r = ) and astringent mouthfeel (r = ). As expected, there was a strong positive (r > 0.7) correlation between two of the major positive sensory attributes, i.e. fynbos-floral and sweet taste (r = 0.919). Sweet taste was also positively correlated to some of the positive aroma notes typically associated with the Cyclopia species, i.e. rose geranium (r = 0.607), rose perfume (r = 0.667), cooked apple (r = 0.556), woody (r = 0.917) fruity-sweet (r = 0.699), fynbos-sweet (r = 0.903) and cassia/cinnamon (r = 0.619). Discriminant analysis (DA) was conducted to generate a perceptual map of all the C. longifolia samples. DA and PCA plots produce different patterns, as DA is used as a classification technique and PCA only looks for patterns of correlation (Lawless & Heymann, 2010). The DA plot (Fig. 4) indicates a split between the samples associating with the negative sensory attributes, i.e. samples fermented for 8 h at 80 C and 90 C, and samples associating with the positive sensory attributes, i.e. samples fermented for longer periods, except for one of the sample sets fermented at 90 C for 8 h (s2_90_8). Each set comes from a different area, which differs in climate, harvesting season, soil fertility and processors. In previous studies external factors were found to have an effect on the phenolic profile and sensory quality of tea (Jayasekera et al., 2014). Joubert et al. (2014) also found that seed source and harvesting time strongly affected the phenolic content (mangiferin, isomangiferin and iriflophenone-3-c-glucoside) of C. genistoides. Thus samples harvested from different geographical locations, fermented at the same temperature/time combination, can have different sensory profiles. Some samples fermented for a short period can be high in negative sensory attributes, while other samples fermented for the same period can have lower intensities of the negative sensory attributes, most probably as a result of external factors. Further analysis of the data by ANOVA gives insight into the main effects and interactions. The statistical definition of a main effect is the effect of one independent variable on the dependent 61
75 variable. If the interaction between temperature and time has a significant effect (p 0.05) on an attribute, the main effects cannot be interpreted and instead the interactions should be interpreted (Clewer & Scarisbrick, 2006). The interactions between temperature and time are summarised in Tables 5 8 and the significant interactions are highlighted in yellow. Only sensory attributes with an average intensity of more than 5 were investigated, as an intensity of 5 is barely perceptible. The main effects for those parameters showing no interactions will be discussed firstly, i.e. the effect of temperature (Fig. 5 Fig. 6), as well as the effect of time (Fig. 7 Fig. 8). The interactions between temperature and time will be discussed after that (Fig. 9 Fig. 11). Fermentation temperature had a significant effect on fynbos-floral, apricot/apricot jam, woody, fruity-sweet and fynbos-sweet aroma attributes, as well as sweet and bitter taste and astringent mouthfeel (Fig. 5). Fynbos-floral, woody and hay/dried grass flavour were also significantly affected by fermentation temperature (Fig. 6) (Tables 5 8). The intensity of all of these attributes, except bitter taste and astringency were significantly higher (p 0.05) in honeybush fermented at 90 C than when fermented at 80 C. Similar to the latter aroma attributes, fynbos-floral (Fig. 6a) and woody (Fig. 6b) flavours were significantly (p 0.05) higher in honeybush fermented at 90 C, whereas hay/dried grass (Fig. 6c) flavour was significantly (p 0.05) higher in honeybush fermented at 80 C. A study done by Theron (2012) on the influence of different fermentation temperature/time combinations on sensory and chemical profile of three Cyclopia species found that 80 C or 90 C can be used as fermentation temperature, depending on the desired sensory profile. In the latter study, the fermentation of C. subternata at 80 C resulted in a more floral honeybush tea, whereas fermentation at 90 C produced a honeybush tea with a stronger apricot/apricot jam aroma. The present study showed that C. longifolia fermented at 90 C produced a tea with stronger fynbos-floral and apricot/apricot jam aroma notes. Cyclopia longifolia fermented at 80 C produced a more bitter and astringent and less sweet tea. It is possible that, with increasing temperature, the compounds responsible for bitter taste and astringency decreased, while the compounds responsible for the sweetness increased. Fermentation time also affected aroma and flavour. Fynbos-floral, apricot/apricot jam, cooked apple, woody, fruity-sweet and fynbos-sweet aroma (Fig. 7), sweet and bitter taste, astringent mouthfeel, and fynbos-floral, woody, hay/dried grass and cooked vegetable flavour (Fig. 8) were significantly (p 0.05) affected by fermentation time (Tables 5 8). The aroma intensity of fynbos-floral (Fig. 7a), apricot/apricot jam (Fig. 7b), cooked apple (Fig. 7c), woody (Fig. 7d), fruity-sweet (Fig. 7e) and fynbos-sweet (Fig. 7f) increased significantly (p 0.05) as the fermentation time increased. For all the attributes, except for apricot/apricot jam and fruity-sweet, 24 h fermentation resulted in significantly (p 0.05) higher aroma intensities than fermentation for 16 h. There were, however, no significant (p > 0.05) differences between tea fermented for 24 h and 32 h in the above-mentioned aroma intensities (Fig. 7). Sweet taste (Fig. 8a), fynbos-floral flavour (Fig. 8d) and woody flavour (Fig. 8e) increased significantly (p 0.05) as the fermentation time increased from 8 h to 24 h, after which no significant (p > 0.05) 62
76 increase was observed. Bitter taste (Fig. 8b), astringent mouthfeel (Fig. 8c) and hay/dried grass flavour (Fig. 8f) decreased significantly (p 0.05) as fermentation time increased from 8 h to 32 h. Cooked vegetable flavour (Fig. 8g) only decreased significantly (p 0.05) as the fermentation time increased from 8 h to 16 h, with longer fermentation times having no significant effect. Previously for C. genistoides, it was found that a fermentation period of at least 16 h was necessary to decrease the negative and increase the positive average attribute intensities to an acceptable level. The same was seen for C. subternata where a fermentation period of 16 h was adequate to effectively reduce a rotting plant water aroma and a high degree of astringency (Theron, 2012). There was a significant (p 0.05) interaction between fermentation temperature and time for the following sensory attributes: rose geranium, plant-like, caramel aroma (Fig. 9) (Table 5), burnt caramel, hay/dried grass, green grass and cooked vegetable aroma (Fig. 10) (Table 6), as well as sour taste (Table 7) and green grass flavour (Fig. 11) (Table 8). Considering the positive aroma attributes, the highest aroma intensity for rose geranium (Fig. 9a) and plant-like (Fig. 9b) was obtained for tea fermented at 90 C/24 h and 80 C/8 h, respectively. The intensity of the plant-like aroma decreased over time, with the lowest intensity observed at 90 C/32 h, but not significantly different from that when the plant material was fermented at 80 C/32 h. This intensity was also not significantly different from that already reached at 16 h where fermentation took place at 90 C. Interestingly, the highest aroma intensity for this attribute was approximately 6 on a 100- point scale (Table 4), which would hardly be noticeable by consumers. The caramel aroma (Fig. 9c) of the tea decreased significantly (p 0.05) when fermentation time increased from 8 h to 16 h at 80 C, but after 16 h there was no significant difference in the aroma intensity of the samples fermented for 24 h and 32 h (p > 0.05). At 90 C the caramel aroma decreased significantly (p 0.05) when the fermentation time increased from 8 h to 16 h, but as the fermentation time increased from 16 h to 32 h the aroma intensity increased significantly (p 0.05). After 32 h the intensity was the same as after 8 h. The average intensities of the negative aroma attributes, burnt caramel (Fig. 10a), hay/dried grass (Fig. 10b), green grass (Fig. 10c) and cooked vegetable (Fig. 10d) decreased significantly (p 0.05) as the fermentation time increased from 8 h to 32 h at 80 C and 90 C. A significant decrease in the negative aroma intensities occurred as the temperature (p 0.05) increased from 80 C to 90 C at 8 h. After 16 h and 24 h no significant (p > 0.05) difference occurred in the average intensity of these negative aroma attributes at 90 C and 80 C, respectively. A similar trend was observed for green grass flavour (Fig. 11b). In all cases, except hay/dried grass the intensity of these negative attributes reached levels 5 after 16 to 24 h fermentation time. However, the attribute hay/dried grass remained at intensity levels of 10 and this tendency could have a significant impact on quality. The average intensity of sour taste (Fig. 11a) decreased significantly at 80 C as the time increased from 8 h to 24 h, but after 24 h there was no significant (p > 0.05) difference in the average intensity. Fermentation at 90 C caused a 63
77 significant decrease in the average intensity over time, but intensity, irrespective of fermentation time, was less than 5 out of 100 so its impact on sour taste would be of little importance. The effect of fermentation temperature and time on fynbos-floral, apricot/apricot jam, cooked apple, woody, fruity-sweet and fynbos-sweet aroma (Fig. 12) and sweet and bitter taste, astringent mouthfeel, fynbos-floral, rose geranium, woody, hay/dried grass and cooked vegetable flavour (Fig. 13) was also explored, even though there was no significant interaction between fermentation temperature and time (p > 0.05) for these attributes. By investigating the changes over time for a specific fermentation temperature, one can attain a clearer understanding of the development of positive attributes and decrease in intensity of negative attributes to ultimately determine optimum fermentation temperature/time combination(s). The change in intensities was more or less the same for 80 C and 90 C (Fig. 12 Fig. 13) as indicated by non-significant interactions (Tables 5-8). In most instances the major change occurred between 8 h and 16 h, with very little change observed after 16 h. In contrast, the intensity of rose-geranium flavour (Fig. 13e) peaked at 24 h for both 80 C and 90 C, whereas cooked apple aroma (Fig. 12c) increased slightly after 90 C/16 h. The intensities of the negative attributes were lower for infusions prepared from plant material fermented at 90 C, while opposite effects were observed for the positive sensory attributes. Overall, it is evident that even a short fermentation time such as 8 h caused a significant (p 0.05) decrease in the intensity of the negative attributes. As the fermentation time increased from 8 h to 32 h, the intensity of the negative attributes decreased even more. Fermentation temperature of 90 C resulted in the negative attributes having lower intensities after 8 h, compared to 80 C. A fermentation time of 24 h effectively reduced the intensities of most of the negative attributes to an acceptable level. According to Theron (2012), a fermentation temperature of 80 C/24 h was found to effectively reduce the green grass and rotting plant water aroma in C. maculata. Green grass aroma was also found to be associated with insufficiently fermented honeybush tea (Du Toit & Joubert, 1998); therefore it was expected that the green grass aroma and flavour would decrease with increasing fermentation time. Le Roux et al. (2008) found similar results during the investigation of the volatile compounds present in fermented and unfermented C. genistoides. It was found that the compounds responsible for green grass aromas (hexanal and 6-methyl-5-hepten-2-one) were significantly lower in fermented C. genistoides samples (Le Roux et al., 2008). The fermentation conditions tested (80 C and 90 C for 8, 16, 24 and 32 h) did not lead to the development of different or new sensory attributes; they only affected the average intensity of the existing attributes. The results indicated that as the fermentation temperature increased from 80 C to 90 C, the average intensity of the positive and negative attributes increased and decreased, respectively, except for plant-like. Plant-like is not perceived as a negative attribute at low intensities, but at high intensities it may be perceived as negative. Therefore it was favourable that the average intensity of plant-like decreased as the fermentation temperature 64
78 increased. The same trend was seen as the fermentation time increased from 8 h to 32 h. Similarly the intensity of the mouthfeel attribute, astringency, may determine whether it has a negative impact on the overall quality of the infusion. In this herbal tea intensities that are too high or too low may both be undesirable. A slight astringency is desirable in tea, as it is regarded as an important tactile component of flavour (Balentine et al., 1997). Green (1993) also suggested that the changes in the surface texture of the mouth, caused by astringency, are an important component of flavour. Thus if the tea had very low astringency, the flavour would be perceived as lower, and the product might be seen as weak and to bland. Mostly C. longifolia samples fermented for only 8 h were perceived as under-fermented. The under-fermented samples were high in negative sensory attributes such as hay/dried grass, green grass and cooked vegetable aroma and flavour, and bitter and sour taste and astringent mouthfeel. The positive attributes such as fynbos-floral, rose geranium fruity-sweet and fynbos-sweet aroma and flavour and sweet taste were perceived in lower intensities in these samples. Thus a fermentation time of 8 h at either processing temperatures is insufficient for the fermentation of C. longifolia. Fermentation for 16 h at 80 C and 90 C significantly (p 0.05) increased intensities of the positive attributes, but most negative attribute intensities were still high, especially bitter taste and astringent mouthfeel. Fermentation for an extra 8 h would ensure adequate formation of the positive attributes and decrease of negative attributes, especially considering that the composition of harvests could differ. In a commercial processing set up, factors such as rate of heating and fluctuations in temperature can play a pivotal role in final product quality; therefore a longer fermentation period is advised (Bergh, 2014). Bergh (2014) found that C. intermedia fermented on laboratory-scale had higher attribute intensities and the sensory profile was more fruity, whereas the samples fermented on commercial-scale were more floral. Therefore 24 h is seen as the optimum fermentation time at both 80 C and 90 C. Longer fermentation (32 h) did not result in any significant (p > 0.05) differences in average attribute intensities, so it would not be advantageous to extend the fermentation period beyond 24 h. Given the cost of heating, fermentation time should thus be limited. The fermentation temperature did overtly influence the tea quality, but at optimum fermentation times both 80 C and 90 C produced an acceptable tea. Certain positive attributes were perceived at higher intensities in samples fermented at 90 C, but in most cases the average intensity only increased significantly by approximately 5%. One would assume that most consumers might not even perceive such a slight difference in intensity. Fermentation at 90 C/24 h produced a tea with a stronger rose geranium aroma and flavour, whereas fermentation of C. longifolia at 80 C/24 h and 90 C/24 h resulted in a tea with a fynbos-floral, apricot/apricot jam, woody and fynbos-sweet aroma and flavour, a sweet taste and a slightly astringent mouthfeel, and the negative attributes were effectively reduced to an acceptable level. 65
79 4. CONCLUSIONS Extensive sensory analysis of C. longifolia identified 42 aroma, flavour, taste and mouthfeel attributes. For the fermentation period investigated, increasing fermentation time did not produce new sensory attributes, but it only resulted in an increase of most of the positive sensory attributes and a decrease of most of the negative sensory attributes. It was found that a fermentation time of 8 h was too short and resulted in relative high intensities of the hay/dried grass, green grass and cooked vegetable aroma and flavour notes and a bitter taste and an astringent mouthfeel, indicating that the tea was still under-fermented. A fermentation time of 16 h did reduce the negative sensory attributes significantly, but the reduced intensities of some of the negative attributes were still too high, resulting in an unsatisfactory tea. Fermentation for 24 h at 80 C and 90 C decreased the average intensity of the negative sensory attributes and increased the intensity of the positive sensory attributes, resulting in a satisfactory product. Further fermentation (32 h) did not lead to significant differences in the intensities of the aroma, flavour, taste and mouthfeel attributes, compared to 24 h; therefore 24 h can be recommended as the optimum fermentation time. Fermentation at both 80 C/24 h and 90 C/24 h thus produced an acceptable quality tea with low intensities of the negative attributes and high intensities of positive attributes, especially the sweet and floral notes. 66
80 5. REFERENCES Balentine, D.A., Wiseman, S.A. & Bouwens, L.C.M. (1997). The chemistry of tea flavonoids. Critical Reviews in Food Science and Nutrition, 37, Bergh, A.J. (2014). Characterisation of the sensory profile of Cyclopia intermedia and the optimisation of fermentation parameters for improved product quality. MSc Thesis, University of Stellenbosch, Stellenbosch, South Africa. Clewer, A.G. & Scarisbrick, D.H. (2006). Factorial experiments. In: Practical statistics and experimental design for plant and crop science. Pp Chichester, England: John Wiley & Sons Ltd. Du Toit, J. & Joubert, E. (1998). The effect of pretreatment on the fermentation of honeybush tea (Cyclopia maculata). Journal of the Science of Food and Agriculture, 76, Du Toit, J. & Joubert, E. (1999). Optimisation of the fermentation parameters of honeybush tea (Cyclopia). Journal of Food Quality, 22, Green, B.G. (1993). Oral astringency: a tactile component of flavour. Acta Psychologica, 84, Hofmeyer, J. & Phillips, E.P. (1922). The genus Cyclopia. Vent. Bothalia, 1, (As cited by Joubert et al., 2011). Jayasekera, S., Kaur, L., Molan, A., Garg, M.L. & Moughan, P.J. (2014). Effects of season and plantation on phenolic content of unfermented and fermented Sri Lankan tea. Food Chemistry, 152, Joubert, E., De Beer, D., Hernández, I. & Munné-Bosch, S. (2014). Accumulation of mangiferin, isomangiferin, iriflophenone-3-c-β-glucoside and hesperidin in honeybush leaves (Cyclopia genistoides Vent.) in response to harvest time, harvest interval and seed source. Industrial Crops and Products, 56, Joubert, E., Joubert, M.E., Bester, C., De Beer, D. & De Lange, J.H. (2011). Honeybush (Cyclopia spp.): from local cottage industry to global markets the catalytic and supporting role of research. South African Journal of Botany, 77, Koch, I.S., Muller, M., Joubert, E., Van der Rijst, M. & Næs, T. (2012). Sensory characterisation of rooibos tea and the development of rooibos sensory wheel and lexicon. Food Research International, 46, Lawless, H.T. & Heymann, H. (2010). Sensory evaluation of food, Principles and practices, 2 nd ed. New York, USA: Springer. Le Roux, M., Cronje, J.C., Joubert, E. & Burger, B.V. (2008). Chemical characterisation of the constituents of the aroma of honeybush, Cyclopia genistoides. South African Journal of Botany, 74, Marloth, R. (1925). The flora of South Africa with synoptical tables of the genera of higher plants. Darter Bros & Co, Cape Town, South Africa (As cited by Joubert et al., 2011). 67
81 Talavera-Bianchi, M., Chambers, E. & Chambers D.H. (2010). Lexicon to describe flavour of fresh leafy vegetables. Journal of Sensory Studies, 25, Taylor, R. (1990). Interpretation of the correlation coefficient: a basic review. Journal of Diagnostic Medical Sonography, 1, Theron, K.A. (2012). Sensory and phenolic profiling of Cyclopia species (honeybush) and optimization of the fermentation conditions. MSc Thesis, University of Stellenbosch, Stellenbosch, South Africa. Theron, K.A., Muller, M., Van der Rijst, M., Cronje, J.C., Le Roux, M. & Joubert, E. (2014). Sensory profiling of honeybush tea (Cyclopia species) and the development of a honeybush sensory wheel. Food Research International, 66,
82 Table 1 Experimental design for eight fermentation temperature/time combinations used for the nine batches of C. longifolia. Time 8 h 16 h 24 h 32 h Harvest set Temperature 80 C 90 C 80 C 90 C 80 C 90 C 80 C 90 C 1 (Bredasdorp) Batch Batch Batch (Barrydale) Batch Batch Batch (Tsitsikamma) Batch Batch Batch
83 Table 2 Attributes and definitions used for descriptive sensory analysis of C. longifolia. 70 Aroma attributes Definitions FLORAL AROMA Fynbos-floral* Sweet floral aroma note associated with the flowers of fynbos vegetation Rose geranium* Floral aroma note associated with the rose geranium plant Rose perfume* Floral aroma note associated with rose petals FRUITY AROMA Lemon/lemon grass* Aromatic associated with general impression of fresh lemons and lemon grass Apricot/apricot jam* Sweet aroma reminiscent of apricot jam Orange* Aroma reminiscent of orange peel Cooked apple* The flat, slightly sour aroma of cooked apples WOODY AROMA Plant-like* Slightly sour aromatic characteristic of freshly cut fynbos plant material Woody* Aromatic associated with dry bushes, stems and twigs of the fynbos vegetation Pine* Aroma reminiscent of pine needles SWEET AROMA Fruity-sweet Sweet aroma reminiscent of non-specific fruit especially berries and apricot jam Boiled syrup Aroma note associated with boiled syrup Caramel Sweet aromatic characteristic of molten sugar or caramel pudding Honey Aromatics associated with the sweet fragrance of fynbos honey Fynbos-sweet Aroma note reminiscent of the fynbos plant SPICY AROMA Cassia/cinnamon* The sweet, woody, spicy aroma of ground cinnamon/cassia bark NUTTY AROMA Walnut Aroma note associated with fresh (not rancid) walnuts NEGATIVE AROMA ATTRIBUTES Dusty* Earthy aromatic associated with wet hessian or wet cardboard Burnt caramel* Aromatic associated with blackened/acrid carbohydrates Hay/dried grass* Slightly sweet aromatic associated with dried grass or hay Green grass* Aromatic associated with freshly cut green grass Cooked vegetable* An overall aroma note associated with canned/cooked vegetables *Flavour attributes used for DSA of C. longifolia. The taste and mouthfeel attributes used were; sweet, sour, bitter and astringent.
84 Table 3 Pearson's correlation coefficients (r) displaying the relationship between the positive and the negative aroma attributes and taste and mouthfeel. Variables Dusty Burnt caramel Hay/dried grass Green grass Cooked vegetable Sweet Sour Bitter Astringent Fynbos-floral Rose geranium Rose perfume Lemon/lemongrass Orange Apricot/apricot jam Cooked apple Plant-like Woody Pine Fruity-sweet Boiled syrup Caramel Honey Fynbos-sweet Cassia/cinnamon Walnut Positive correlations above 0.5 are indicated in red and negative correlations higher than -0.5 are indicated in green. All values in bold are significantly different from 0 (p 0.05). 71
85 Table 4 Minimum, maximum and mean intensity ratings for each sensory attribute as scored on a 100-point scale. Aroma Taste & mouthfeel Flavour Variable Min Max Mean A_Fynbos-floral A_Rose geranium A_Rose perfume A_Lemon/lemon grass A_Orange A_Apricot/apricot jam A_Cooked apple A_Plant-like A_Woody A_Pine A_Fruity-sweet A_Boiled syrup A_Caramel A_Honey A_Fynbos-sweet A_Cassia/cinnamon A_Walnut A_Dusty A_Burnt caramel A_Hay/dried grass A_Green grass A_Cooked vegetable Sweet Sour Bitter Astringent F_Fynbos-floral F_Rose geranium F_Rose perfume F_Lemon/lemon grass F_Orange F_Apricot/apricot jam F_Cooked apple F_Plant-like F_Woody F_Pine F_Cassia/cinnamon F_Dusty F_Burnt caramel F_Hay/dried grass F_Green grass F_Cooked vegetable
86 Table 5 Interactions between fermentation temperature and time for the positive aroma attributes of C. longifolia samples. Fynbos-floral Rose geranium Apricot/apricot jam Cooked apple Plant-like Woody Fruity-sweet Caramel Fynbos-sweet Temperature < < * < < < < Time < < < < < < < < Temperature/time *Average intensity <5. Stellenbosch University Table 6 Interactions between fermentation temperature and time for the negative aroma attributes of C. longifolia samples. Burnt caramel Hay/dried grass Green grass Cooked vegetable Temperature < < < Time < < < < Temperature/time < Table 7 Interactions between fermentation temperature and time for the taste and mouthfeel attributes of C. longifolia samples. Sweet Sour Bitter Astringent Temperature < Time < < < < Temperature/time Table 8 Interactions between fermentation temperature and time for the flavour attributes of C. longifolia samples. Fynbos-floral Woody Hay/dried grass Green grass Cooked vegetable Temperature < < < * Time < < < < < Temperature/time *Average intensity <5 73
87 a) b) 74 Fig. 1 a) PCA scores plot showing the positioning of C. longifolia samples (N = 72) according to their sensory profiles. The letter s in the sample coding refers to the sample set, s1 = harvest set 1 (Bredasdorp), s2 = harvest set 2 (Barrydale) and s3 = harvest set 3 (Tsitsikamma). 80 and 90 refer to the fermentation temperature and 8, 16, 24 and 32 refer to the fermentation time (h). b) PCA loadings plot showing the positioning of the positive and negative aroma, flavour, taste and mouthfeel attributes. The letters A and F in front of the attributes refer to aroma and flavour, respectively. Apricot = Apricot/apricot jam, Lemon = Lemon/lemongrass, Cassia = Cassia/cinnamon, Hay = Hay/dried grass, Cookedveg = Cooked vegetable.
88 a) b) Fig. 2 a) PCA scores plot showing the positioning of C. longifolia samples (N = 72) according to their positive sensory profiles. The letter s in the sample coding refer to the sample set, s1 = harvest set 1 (Bredasdorp), s2 = harvest set 2 (Barrydale) and s3 = harvest set 3 (Tsitsikamma). 80 and 90 refers to the fermentation temperature and 8, 16, 24 and 32 refer to the fermentation time (h). b) PCA loadings plot showing the positioning of the positive aroma and flavour attributes. The letters A and F in front of the attributes refer to aroma and flavour, respectively. Apricot = Apricot/apricot jam, Lemon = Lemon/lemongrass, Cassia = Cassia/cinnamon. 75
89 a) b) Fig. 3 a) PCA scores plot showing the positioning of C. longifolia samples (N = 72) according to their negative sensory profiles. The letter s in the sample coding refer to the sample set, s1 = harvest set 1 (Bredasdorp), s2 = harvest set 2 (Barrydale) and s3 = harvest set 3 (Tsitsikamma). 80 and 90 refers to the fermentation temperature and 8, 16, 24 and 32 refer to the fermentation time (h). b) PCA loadings plot showing the positioning of the negative aroma and flavour attributes and the taste and mouthfeel attributes. The letters A and F in front of the attributes refer to aroma and flavour, respectively. Hay = Hay/dried grass, Cookedveg = Cooked vegetable. 76
90 a) b) 77 Fig. 4 a) DA plot illustrating the grouping of C. longifolia samples (N = 72) fermented at 80 C and 90 C for 8, 16, 24 and 32 h, according to their sensory profiles. The letter s in the sample coding refers to the sample set, s1 = harvest set 1 (Bredasdorp), s2 = harvest set 2 (Barrydale) and s3 = harvest set 3 (Tsitsikamma). 80 and 90 refer to the fermentation temperature and 8, 16, 24 and 32 refer to the fermentation time (h). b) DA variables plot showing the positioning of the positive and negative aroma, flavour, taste and mouthfeel attributes. The letters A and F in front of the attributes refer to aroma and flavour, respectively. Apricot = Apricot/apricot jam, Lemon = Lemon/lemongrass, Cassia = Cassia/cinnamon, Hay = Hay/dried grass, Cookedveg = Cooked vegetable.
91 a) A_Fynbos-floral b) A_Apricot/apricot jam c) A_Woody d) A_Fruity-sweet Average intensity (out of 100) b 80 C a 90 C Average intensity (out of 100) b 80 C a 90 C Average intensity (out of 100) a 80 C a 90 C Average intensity (out of 100) b 80 C a 90 C e) A_Fynbos-sweet f) Sweet g) Bitter h) Astringent Average intensity (out of 100) b a Average intensity (out of 100) b a Average intensity (out of 100) a b Average intensity (out of 100) a b 0 80 C 90 C 0 80 C 90 C 0 80 C 90 C 0 80 C 90 C 78 Fig. 5 Effect of fermentation temperature (80 C and 90 C) on a) fynbos-floral, b) apricot/apricot jam, c) woody, d) fruity-sweet, e) fynbos-sweet aroma, f) sweet taste, g) bitter taste and h) astringent mouthfeel of C. longifolia. A in front of the attribute name refers to aroma, except for Astringent. Different alphabetical letters indicate a significant difference in the treatment means (p 0.05).
92 a) Average intensity (out of 100) F_Fynbos-floral b a b) Average intensity (out of 100) F_Woody b a c) Average intensity (out of 100) F_Hay/dried grass a b 0 80 C 90 C 0 80 C 90 C 0 80 C 90 C Fig. 6 Effect of fermentation temperature (80 C and 90 C) on a) fynbos-floral, b) woody and c) hay/dried grass flavour of C. longifolia. F in front of the attribute name refers to flavour. Different alphabetical letters indicate a significant difference in treatment means (p 0.05). 79
93 a) Average intensity (out of 100) A_Fynbos-floral a b c a Average intensity (out of 100) b) A_Apricot/apricot jam a b ab c c) Average intensity (out of 100) A_Cooked apple a b c a d) Average intensity (out of 100) A_Woody a b c a 0 8h 16h 24h 32h 0 8h 16h 24h 32h 0 8h 16h 24h 32h 0 8h 16h 24h 32h e) A_Fruity-sweet f) A_Fynbos-sweet Average intensity (out of 100) c b ab a Average intensity (out of 100) c b a a h 16h 24h 32h 0 8h 16h 24h 32h Fig. 7 Effect of fermentation time (8, 16, 24 and 32 h) on the aroma attributes a) fynbos-floral, b) apricot/apricot jam, c) cooked apple, d) woody, e) fruity-sweet and f) fynbos-sweet of C. longifolia. A in front of the attribute name refers to aroma. Different alphabetical letters indicate a significant difference in treatment means (p 0.05).
94 a) Sweet b) Bitter c) Astringent d) F_Fynbos-floral Average intensity (out of 100) c b a a Average intensity (out of 100) a b bc c Average intensity (out of 100) a b b c Average intensity (out of 100) c b a a 0 8h 16h 24h 32h 0 8h 16h 24h 32h 0 8h 16h 24h 32h 0 8h 16h 24h 32h e) F_Woody f) F_Hay/dried grass g) F_Cooked vegetable Average intensity (out of 100) a a b c 8h 16h 24h 32h Average intensity (out of 100) a b bc c 8h 16h 24h 32h Average intensity (out of 100) a b b b 8h 16h 24h 32h 81 Fig. 8 Effect of fermentation time (8, 16, 24 and 32 h) on a) sweet taste, b) bitter taste, c) astringent mouthfeel, d) fynbos-floral, e) woody, f) hay/dried grass and g) cooked vegetable flavour of C. longifolia. "F" in front of the attribute name refers to flavour. Different alphabetical letters indicate a significant difference in treatment means (p 0.05).
95 a) A_Rose geranium b) A_Plant-like c) A_Caramel Average intensity (out of 100) a b c e c cd de e Time (hours) 80 C 90 C Average intensity (out of 100) a bc cd b de e de e Time (hours) 80 C 90 C Average intensity (out of 100) a b bc c ab c c c Time (hours) 80 C 90 C Fig. 9 The effect of temperature (80 C and 90 C) and time (8, 16, 24 and 32 h) on the average intensity of a) rose geranium, b) plant-like and c) caramel aroma. "A" in front of the attribute name refers to aroma. Values with different alphabetical letters differ significantly from each other (p 0.05). a) A_Burnt caramel b) A_Hay/dried grass c) A_Green grass d) A_Cooked vegetable Average intensity (out of 100) a b c cd d d d d Time (hours) 80 C 90 C Average intensity (out of 100) a c b d d d d d Time (hours) 80 C 90 C Average intensity (out of 100) a b c d d d d d Time (hours) 80 C 90 C Average intensity (out of 100) a b c cd d d d d Time (hours) 80 C 90 C 82 Fig. 10 The effect of temperature (80 C and 90 C) and time (8, 16, 24 and 32 h) on the average intensity of a) burnt caramel, b) hay/dried grass, c) green grass and d) cooked vegetable aroma. "A" in front of the attribute name refers to aroma. Values with different alphabetical letters differ significantly from each other (p 0.05).
96 Average intensity (out of 100) a) Sour b) a bc bc b de de cd e Time (hours) 80 C 90 C Average intensity (out of 100) F_Green grass a b c cd d d d d Time (hours) 80 C 90 C Fig. 11 The effect of temperature (80 C and 90 C) and time (8, 16, 24 and 32 h) on the average intensity of a) sour taste and b) green grass flavour. The letters F in front of the attribute name refers to flavour. Values with different alphabetical letters differ significantly from each other (p 0.05). 83
97 a) A_Fynbos-floral b) A_Apricot/apricot jam c) A_Cooked apple Average intensity (out of 100) e f ab a a d c bc Average intensity (out of 100) a a abc cd ab bc cd d Average intensity (out of 100) a ab bc c abc abc c d Time (hours) Time (hours) Time (hours) 80 C 90 C 80 C 90 C 80 C 90 C d) A_Woody e) A_Fruity-sweet f) A_Fynbos-sweet Average intensity (out of 100) d e bc d a c ab c Average intensity (out of 100) ab a bc d dc dc bc e Average intensity (out of 100) e f bc d a c ab c Time (hours) Time (hours) Time (hours) 80 C 90 C 80 C 90 C 80 C 90 C 84 Fig. 12 The effect of temperature (80 C and 90 C) and time (8, 16, 24 and 32 h) on the average intensity of a) fynbos-floral, b) apricot/apricot jam, c) cooked apple, d) woody, e) fruity-sweet and f) fynbos-sweet aroma. "A" in front of the attribute name refers to aroma. Values with different alphabetical letters differ significantly from each other (p 0.05).
98 a) Sweet b) Bitter c) Astringent d) F_Fynbos-floral Average intensity (out of 100) a ab ab d c b b e Time (hours) Average intensity (out of 100) a b c cd d d d d Time (hours) Average intensity (out of 100) a b c cd de cd de e Time (hours) Average intensity (out of 100) ab a a e d c bc f Time (hours) 80 C 90 C 80 C 90 C 80 C 90 C 80 C 90 C e) F_Rose geranium f) F_Woody g) F_Hay/dried grass h) F_Cooked vegetable Average intensity (out of 100) a ab bc ef dc de ef f Time (hours) Average intensity (out of 100) c d ab a a c Time (hours) b b Average intensity (out of 100) a b c cd d d cd d Time (hours) Average intensity (out of 100) a b c cd cd d cd d Time (hours) 80 C 90 C 80 C 90 C 80 C 90 C 80 C 90 C 85 Fig. 13 The effect of temperature (80 C and 90 C) and time (8, 16, 24 and 32 h) on the average intensity of a) sweet taste, b) bitter taste, c) astringent mouthfeel, d) fynbos-floral, e) rose geranium, f) woody, g) hay/dried grass and f) cooked vegetable flavour. "F" in front of the attribute name refers to flavour. Values with different alphabetical letters differ significantly from each other (p 0.05).
99 CHAPTER 4 Sensory profile of C. genistoides, C. maculata, C. subternata and C. longifolia and the development of quality control tools for the honeybush industry TABLE OF CONTENTS Abstract 1. Introduction 2. Materials and methods Sample collection and processing of plant material Descriptive sensory analysis (DSA) Preparation of infusions DSA training and testing procedures 2.3 Sorting Samples for sorting Sorting panel Sorting procedure 2.4 Statistical procedures Statistical analysis of DSA data Statistical analysis of sorting data 3. Results and discussion 3.1 Species-specific and generic sensory profile of honeybush Species-specific profiles of C. genistoides, C. maculata, C. subternata and C. longifolia Overall sensory profile of four honeybush species Development of quality control tools for the honeybush industry Rapid methodologies for sensory profiling Instructed sorting Uninstructed sorting 4. Conclusions 5. References 86
100 ABSTRACT Cyclopia is popular in the fynbos biome and grows along the coastal and mountainous regions of the Eastern and Western Cape provinces of South Africa. A large sample set (N = 150) differing in production year, processing, species and production area was used to capture all possible variation within honeybush. Descriptive sensory analysis (DSA) was used to determine the characteristic sensory profile of honeybush and the species-specific sensory profiles of C. genistoides, C. maculata, C. subternata and C. longifolia. The characteristic sensory profile of honeybush was defined as a fynbos-floral, woody and fynbos-sweet aroma and flavour with a sweet taste and slightly astringent mouthfeel. Cyclopia maculata and C. subternata were characterised as being reasonably similar in sensory profiles and both can be described as having caramel and other sweet-associated notes and a slightly astringent mouthfeel. Cyclopia genistoides was defined as being high in rose geranium flavour, as well as bitterness, while C. longifolia had a slightly less prominent rose geranium flavour. The latter results were used to validate the previously developed generic sensory wheel and to develop species-specific sensory wheels, which are potential quality control tools for the honeybush industry. The rapid sensory method, sorting, was investigated as an alternative to the traditional profiling method, DSA. The aim was to determine whether instructed, as well as uninstructed sorting could be used to profile three Cyclopia species in terms of broad-based sensory profiles when using an expert panel. Instructed sorting produced results similar to that of DSA, and these results suggest that instructed sorting could be viewed as a viable industry tool when the aim is to profile honeybush infusions in terms of broad-based sensory attributes. The results obtained from uninstructed sorting differed from those of DSA, indicating that free sorting is not successful in categorising honeybush samples according to species, especially when the difference between species is not clear-cut. 1. INTRODUCTION Honeybush is a South African herbal tea, produced from the leaves and stems of a number of Cyclopia species. Since the early 1990s there have been concerted efforts to develop and expand the honeybush industry, especially on a global level. Exports increased from 50 to 200 tonnes per annum, with the major importers being the Netherlands, Germany, the United Kingdom and the United States of America (Joubert et al., 2011). Cyclopia subternata, C. genistoides and C. intermedia are the main species used for the production of honeybush; however, as the current demand is higher than the supply, other Cyclopia species such as C. maculata and C. longifolia are also under investigation (Joubert et al., 2011; Theron et al., 2014). Most of the honeybush produced is the fermented product, i.e. produced through a high-temperature oxidation process. This process is essential for the development of the characteristic sensory attributes associated with honeybush (Du Toit & Joubert, 1999). According to the South African Agricultural Standards Act for the export of honeybush (Anon., 2000), this herbal tea should have a distinctive honeybush colour and a clean, characteristic aroma and taste ; however, the regulation does not expand on the specifics of 87
101 characteristic aroma and flavour. In previous research descriptive terms used for describing the sensory quality of honeybush were quite broad-based and included terms such as sweet and honey-like (Du Toit & Joubert, 1998; 1999). Cronje (2010) also used broad-based sensory descriptors such as honeybush-like, sweet-associated and rose geranium-like to distinguish between four Cyclopia species. Because of the lack of specific sensory attributes to describe the unique sensory profile of honeybush, Theron et al. (2014) researched the characteristic sensory profile of six Cyclopia species (C. genistoides, C. subternata, C. maculata, C. intermedia, C. longifolia and C. sessiliflora) using descriptive sensory analysis (DSA). In the latter study a range of sensory attributes were identified to describe the characteristic sensory profile of honeybush. Generally honeybush can be described as having a floral, sweet-associated, fruity, plant-like and woody aroma and flavour, as well as a sweet taste and slightly astringent mouthfeel. The respective honeybush species also illustrated other specific aroma, flavour and taste attributes that were typical of one or more of the species tested. The full range of sensory attributes that were associated with these six Cyclopia species was used to construct a lexicon and generic sensory wheel for honeybush, the latter being a graphical representation of the sensory attributes associated with these Cyclopia species (Theron et al., 2014). Quality tools such as these are often used in the industry to fingerprint the aroma, flavour, taste and mouthfeel of a product, or to determine to what extent different batches of a product differ from each other (Drake & Civille, 2002; Lee & Chambers, 2007). Sensory wheels can also be used as a communication tool by marketers and exporters, or when developing products for niche markets, i.e. products with specific sensory profiles that would appeal to certain groups of consumers (Aparicio & Morales, 1995). To expand the global market it is important to define the characteristic sensory profile of the respective species; however, as a retail product, honeybush rarely consists of one single Cyclopia species. Currently, the composition of blends depends on the availability of plant material as well as production yield. It is, however, important to consider the sensory profiles of the respective species when blending, primarily to ensure that it does not result in non-descript, variable profiles. Unique species-specific profiles would definitely be lost during blending. Such profiles could potentially be used to establish niche markets (Joubert et al., 2011). DSA is usually conducted when the aim is to determine the full sensory profile of a product or range of products. DSA is the best method when precision and information obtained are important. DSA uses a trained panel of assessors and this aspect can be costly and timeconsuming, especially when the experimental design has to account for sensory differences between treatments and sensory variability within treatments (Lawless & Heymann, 2010). In some instances DSA is too difficult for application by industry. In view of this, there is an obvious need for efficient, rapid sensory profiling methodologies that are cheaper, simpler to use and which can identify the most important sensory differences between products (Bavay et al., 2013). Sorting is one of the most popular rapid profiling techniques developed for industry. The sorting task is both simple and quick to perform, and the panel needs no formal training prior to performing a 88
102 sorting task and this technique is based on an innate cognitive process which humans use daily (Campo et al., 2008; Chollet et al., 2011). This method requires that a panel of judges sort a set of 10 to 20 products into groups containing similar products (Chollet et al., 2011; Lawless & Heymann, 2010). It is generally believed that items placed in a certain category do not represent that group equally, but rather contain items that share more sensory attributes with that specific group than with any other group (Ballester et al., 2008; Bavay et al., 2013). In view of the above, the objectives of this study were to 1) determine the defining aroma, flavour, taste and mouthfeel attributes of C. genistoides, C. subternata, C. maculata and C. longifolia, 2) to validate the generic sensory wheel and lexicon for honeybush and to develop species-specific sensory wheels for the respective species, and 3) to test the viability of sorting as a rapid profiling method to classify three honeybush species (C. genistoides, C. maculata and C. subternata) according to their sensory profiles. 2. MATERIALS AND METHODS A summary of the samples used for DSA and sorting, and the data analysis done on each methodology is displayed in Fig Sample collection and processing of plant material Different batches of plant material (C. genistoides, C. maculata and C. subternata) were harvested over a four-year period, i.e. 2010, 2012 and 2013, at several locations in the Western Cape Province, South Africa (Table 1). Similarly, three sets of C. longifolia plant material (Table 1) were sourced in 2013 from three locations in the Eastern and Western Cape Provinces, South Africa (Bredasdorp, Barrydale & Tsitsikamma). The C. genistoides, C. maculata and C. subternata batches represent two processing conditions, i.e. fermentation at 80 C for 24 h and 90 C for 16 h, whereas the C. longifolia represents fermentation at 80 C for 24 h and 90 C for 24 h. All four species also differed in terms of harvesting season, geographical area and producer, primarily to ensure encompassing the largest possible percentage of product variation. The samples were processed as described in Chapter Descriptive sensory analysis (DSA) Preparation of infusions The sample infusions were prepared for DSA as described in Chapter DSA training and testing procedures DSA was conducted as described in Chapter 3. For the study on C. genistoides, C. maculata and C. subternata eight one-hour training sessions were used to train the panel in the sensory assessment of the three species. After that 6 to 10 samples were analysed in triplicate in each testing session. The DSA analyses of the C. genistoides, C. maculata and C. subternata (three sample sets sourced in 2010, 2012 and 2013) were conducted in 2012 and As all the 89
103 batches of C. longifolia were sourced in 2013, this species was tested in 2013 over a three-week period. The list of descriptors generated for the respective species sourced in 2010 (C. genistoides, C. maculata and C. subternata), 2012 (C. genistoides, C. maculata and C. subternata) and 2013 (C. genistoides, C. maculata, C. subternata, as well as C. longifolia) can be seen in Table Sorting Two sorting procedures, instructed and uninstructed sorting, were conducted on two consecutive days. When conducting instructed sorting, samples are usually sorted according to guidelines or specific sensory profiles. During uninstructed sorting each panellist can sort the sample set as they see fit; no guidelines are given on how to sort or categorise the samples. The sorting step is usually concluded with a descriptive task where each judge has to assign one or more sensory attributes to describe the overall sensory profile of each of the groups of samples Samples for sorting For instructed sorting, a total of 12 samples were selected from the 2013 sample set (Table 3). This sample set consisted of four samples of C. genistoides, four of C. maculata and four of C. subternata, with each of the four samples being representative of the typical sensory profile of the Cyclopia species in question. Sorting was not conducted on C. longifolia. For uninstructed sorting, 13 samples were selected from the 2012 and 2013 sample sets of C. genistoides, C. maculata, and C. subternata. Six samples, two from each species, were selected from each year (Table 4). The selected samples represented the typical sensory profile of each species. An extra sample, consisting of a mixture of the latter three species, was added to the sample set, primarily to ascertain whether the mixed sample will be grouped on its own or together with samples of the three species. Samples of the 2013 sample set were selected to prepare this mixture, containing equal amounts of G13_90_3, M13_90_4 and S13_80_ Sorting panel The already trained DSA panel consisting of 12 female assessors was used to conduct the sorting analysis. The panel was regarded as an expert panel as they had been part of the DSA panel since 2012 and thus familiar with the sensory quality of the relevant honeybush species Sorting procedure The first day consisted of two sessions of instructed sorting. In the first session the samples were sorted according to aroma, and in the second session according to the palate attributes, i.e. the flavour, taste and mouthfeel attributes. Each panellist received 12 honeybush infusions, four of each species (C. genistoides, C. maculata and C. subternata; labelled A L; Table 3). The temperature of the honeybush infusions were controlled, as described in Chapter 3. The panel members were instructed to sort the samples into a minimum of three groups according to aroma (session 1) and palate attributes (session 2). For this they had to use the list of aroma and palate attributes associated with the respective species, as depicted in Tables 5 and 6. None of the 90
104 groups was allowed to contain more than six samples. The sorting task was concluded with a descriptive step where the judges had to assign sensory attributes to the respective sample groupings, again using the provided list of attributes (Tables 5 & 6). The questionnaires used for instructed sorting are given in Addendum B (Fig. 1B). The uninstructed sorting sessions took place on the second day. The panellists each received 13 honeybush infusions, labelled A M (Table 4). In the first uninstructed sorting session the panel was instructed to group the samples according to similar aroma attributes and in the second session according to similar flavour, taste and mouthfeel attributes. No instructions were given as to how the samples should be grouped or which attributes the panellists should use to describe each grouping of samples. The panellists were allowed to form a maximum of six groups and each group had to be described with no more than five sensory attributes. An example of the questionnaire is given in Addendum B (Fig. 2B). 2.4 Statistical procedures Statistical analysis of DSA data Univariate and multivariate analyses were conducted as described in Chapter Statistical analysis of sorting data DISTATIS was used to analyse both the instructed and uninstructed sorting data (Abdi et al., 2007). This method takes into account the data from each assessor involved in the sorting task and the resulting plots indicate whether the samples could be categorised into different groupings. Correspondence analysis (CA) was used to evaluate the similarity of samples, based on the descriptors assigned to the samples during the descriptive task (Cadoret et al., 2009). The attributes assigned to each group by the panellists for CA analysis were condensed into broader categories by using the generic honeybush sensory wheel (Theron et al., 2014). This was done to reduce the number of categorical variables, simplifying data analysis. Rv coefficients were calculated to measure the similarity between product configurations (Abdi et al., 2007). The Rv coefficients range from between 0 and 1, and the closer the values are to 1, the more similar the groupings on the respective plots (Nestrud & Lawless, 2008). Ward s cluster analysis, an example of agglomerative hierarchal clustering (AHC), was also performed (Giacalone et al., 2013) to create clusters of samples deemed similar in terms of their sensory characteristics (De Saldamando et al., 2013). This method allows for the relationships between samples to be viewed on more than two principal components. All data analyses were performed using the STATISTICA program (Statistica 10, StatSoft Inc., Tulsa, Oklahoma, USA). 3. RESULTS AND DISCUSSION According to previous research (Theron et al., 2014), the characteristic sensory profile of honeybush has recently been defined as a combination of floral, fruity, woody, plant-like and sweet-associated aromas with a sweet taste and slightly astringent mouthfeel. Theron (2012) investigated the sensory profile of 58 honeybush samples consisting of six Cyclopia species (C. 91
105 sessiliflora, C. longifolia, C. genistoides, C. intermedia, C. subternata and C. maculata) to ultimately define the overall sensory profile of honeybush and to develop a generic sensory wheel and lexicon that could be used by the honeybush industry as entry-level quality-control tools. Discriminant analysis (DA) of the latter sample set showed that the Cyclopia species could be grouped into three groups according to their sensory profiles (Fig. 2). It was, however, suggested that the latter result, i.e. the classification of samples according to similar profiles, should be verified with a larger sample set sourced over more than one production season. It was also suggested that it would be worthwhile to validate the generic sensory wheel developed by Theron et al. (2014) and, furthermore, to create species-specific sensory wheels for the honeybush industry. To achieve the latter aim, it was important to use a large data set encompassing a significant percentage of variation; thus samples harvested over more than one production year and processed according to different temperature/time regimes were used for the present study. 3.1 Species-specific and generic sensory profile of honeybush Species-specific profiles of C. genistoides, C. maculata, C. subternata and C. longifolia The sensory profile of a large sample set of C. genistoides, C. maculata and C. subternata, harvested over three production years (2010, 2012 and 2013), and C. longifolia harvested from three different production regions in 2013, was investigated. All four Cyclopia species were also processed according to two different temperature/time regimes (Table 1). These measures were taken to try and capture a significant amount of product variation. Principal component analysis (PCA) and discriminant analysis (DA) were conducted to determine the sensory profiles of the respective species, as well as their similarities and dissimilarities in terms of sensory attributes (Fig. 3 Fig. 9). PCA searches for patterns of correlation, while DA searches for the discrimination of products relative to the disagreement among judges or to error (Lawless & Heymann, 2010). The DA plots were developed by conducting forward stepwise model selection. The variable with the largest contribution to the model was added first. Then the second variable was added if its entry probability was greater than the entry threshold value. The impact of removing each variable was evaluated after the third value was added. A variable was removed from the model if the probability of the calculated statistic was greater than the removed threshold value (Friedman, 1989). In the end the DA plot was drawn up from the variables present in the model after all the variables have been added and evaluated. The PCA and DA plots for C. genistoides (Fig. 3a & Fig. 4a), C. maculata (Fig. 5a & Fig. 6a) and C. subternata (Fig. 7a & Fig. 8a) indicate a split in the samples according to production years, and not necessarily according to production regimes. The attributes associated with the samples are displayed on the respective loadings plots (Fig. 3b Fig. 8b). For each of the three species, considerable differences were noted in the sensory profiles of the respective production years. These so-called year-differences follow no specific pattern, as can be seen from Fig. 3 to Fig. 8. This could be the result of a number of factors. A study done on Sri Lankan tea suggests 92
106 that season, climate, husbandry, soil fertility and processing conditions could have an interactive influence on the phenolic profile of teas (Jayasekera et al., 2014). Joubert et al. (2014) found that seed source, harvest time as well as harvest interval affected the chemical composition of C. genistoides. Although determining the differences between production years was not the aim of this study, it was still interesting to note that per species there were sensory differences from production season to production season. As the different batches of plant material of a specific species were not harvested from the same plants on a yearly basis, the changes in the sensory profiles observed cannot be attributed solely to seasonal effects and only serve to demonstrate that, per species, unidentified factors or a combination of factors induced changes in the sensory profile. As indicated in Chapter 3, all the samples of the species C. longifolia were harvested during one production season (2013) and two of the temperature/time regimes that resulted in an acceptable sensory profile (80 C/24 h and 90 C/24 h) were chosen for the current study. The PCA scores plot (Fig. 9a) indicates a split between the samples fermented at 80 C and 90 C along PC2. The samples fermented at 90 C associate with the fynbos-floral, rose geranium, apricot/apricot jam and woody aroma and flavour attributes, while the samples fermented at 80 C associated more with the negative sensory attributes such as green grass, hay/dried grass and cooked vegetable (Fig. 9b). One of the objectives of this study was to identify the defining sensory attributes of each species, primarily to determine whether species-specific sensory wheels could ultimately be developed. The relative importance of the major sensory attributes of each species was investigated by plotting graphs displaying the occurrence of an attribute (as a percentage of the number of samples analysed) versus the average intensity of an attribute (Fig. 10). In these plots average intensities of 10 are considered worthwhile noting; however, attributes rated lower in intensity, especially negative attributes, should not be disregarded as they can still, singly or collectively, have a significant influence on the aroma and flavour of the infusion (Theron et al., 2014). All samples of the four species had fynbos-floral, woody and fynbos-sweet notes, a sweet taste and astringent mouthfeel. The average intensity of fynbos-floral was >35 in all four species, emphasising the typical but reasonably prominent floral note of this species (Theron et al., 2014). Fruity-sweet was noted for all samples of C. longifolia (Fig. 10b), C. maculata (Fig. 10c) and C. subternata (Fig. 10d), with approximately 90% of the C. genistoides (Fig. 10a) samples illustrating this attribute. It is quite clear that C. maculata and C. subternata have similar sensory profiles in terms of occurrence and average intensity of attributes. Caramel aroma was present in 41% of the C. subternata and 50% of the C. maculata samples. Bitter taste was absent in C. subternata and present in less than 2% of the C. maculata samples at extremely low average intensities (<5). In contrast, C. genistoides and C. longifolia differed from C. maculata and C. subternata as their rose geranium and apricot/apricot jam aromas were more prominent. Rose geranium 93
107 aroma was present in 66% of C. genistoides and 72% of C. longifolia samples at an average intensity >5. Rose geranium flavour could also be picked up in both C. genistoides and C. longifolia, i.e. in approximately 40% of the samples. The aroma attribute apricot/apricot jam was present in 93% of C. genistoides and 100% of C. longifolia samples at an average intensity >10. Hay/dried grass flavour was present in all the C. genistoides and C. longifolia samples at an average intensity >10. The aroma attribute hay/dried grass was also present in both species, but the occurrence differed slightly; it was present in all C. longifolia samples at an average intensity of just >10, and in C. genistoides the occurrence was 80% and average intensity approximately 10. Bitter taste was most prominent in C. genistoides; it had an average intensity >10 and was present in all the C. genistoides samples. Bitter taste was not regarded typical of the other three species, and if present, the occurrence and intensities were extremely low. The intensity of sweet taste of the different species was very similar, with an average intensity of approximately 20 for all four species. The average intensity of astringency was approximately 25 in C. genistoides and C. longifolia, and 20 in C. maculata and C. subternata. The average intensity values, along with the minimum and maximum values of each attribute for each species, can be seen in Table 7. The occurrence/intensity scatter plots (Fig. 10) for C. genistoides, C. longifolia, C. maculata and C. subternata indicate that most of the sensory attributes are present in all four species; however, the intensities of the respective attributes differ between species and this results in each species having a distinct, discernible sensory profile. Spider plots, based only on attribute intensities, can also be used to illustrate product differences. Spider plots are regarded as a simple, quick and convenient way to visualise intensity differences in sensory profiles (Koch et al., 2012). The spider plots depicted in Fig. 11 illustrate the aroma attributes, and in Fig. 12 the flavour, taste and mouthfeel attributes of the respective species. It is evident that the aroma and flavour profiles of C. maculata and C. subternata are very similar and differ from those of C. genistoides and C. longifolia. Considering the spider plots for aroma (Fig. 11), it can be noted the attributes fynbos-floral, fynbos-sweet and woody are prominent in all four species. The spider plots for the flavour, taste and mouthfeel attributes (Fig. 12) also show a similar pattern with fynbos-floral flavour, woody flavour, sweet taste and astringency being again prominent in all four species. These tendencies were also evident in the scatter plots (Fig. 10). Differences between the respective species, i.e. according to the spider plots, are mostly a result of minor attributes, most notably rose geranium aroma and flavour in C. genistoides and to a lesser extent in C. longifolia, as well as bitter taste of C. genistoides Overall sensory profile of four honeybush species The sensory data of the four species were combined to obtain further insight into the major similarities and dissimilarities between the tested Cyclopia species and the correlation of attributes when using multivariate techniques such as PCA and DA. The PCA scores plot (Fig. 13a) shows that the four species mostly overlap, with no clear grouping between C. maculata, C. subternata and C. longifolia. Cyclopia genistoides is, however, partially separated from the other three 94
108 species. The latter division could be attributed to the rose geranium aroma and flavour, as well as the bitter taste and astringent mouthfeel indicated on the right side of the PCA loadings plot (Fig. 13b). Fig. 13b also demonstrates the correlation between the aroma (orthonasal, ON) and flavour (retronasal, RN) attributes. It can be seen that most of the aroma and flavour attributes lie close together on the PCA loadings plot, which indicates that these notes are perceived similarly on the nose and palate. These associations can be justified when considering the linear association of ON and RN attributes (Talavera-Bianchi et al., 2010). The degree of linear association is shown by the correlation coefficient and the closer r is to 1, the stronger the linear association between the two variables is (Taylor, 1990). According to the Pearson s correlation coefficients (Table 8 and Table 9), there are significant correlations between most of the aroma and flavour attributes. There are strong positive correlations (r > 0.7) between aroma and flavour for the attributes, i.e. fynbos-floral (r = 0.855), rose geranium (r = 0.948), rose perfume (r = 0.859), lemon/lemongrass (r = 0.719), woody (r = 0.934), cassia/cinnamon (r = 0.955) (Table 8), burnt caramel (r = 0.761), hay/dried grass (r = 0.831), green grass (r = 0.815) and cooked vegetable (r = 0.921) (Table 9). Certain aroma attributes are also correlated with the basic taste modalities such as sweet and bitter taste. Sweet taste had a positive but low significant correlation with caramel (r = 0.456) and cassia/cinnamon (r = 0.381) (Table 8), whereas sweet taste correlated negatively with cooked vegetable (r = ) (Table 9). It is also clear that bitter taste had a strong positive correlation with rose geranium (r = 0.678) (Table 8). Noble (1996) found that the perceived intensity of an aroma can be increased by certain basic tastes. Taste intensity can also be increased by certain aromas, i.e. if they have a logical association, such as sweetness and caramel aroma. However, it is important to note that not all relationships between attributes that lie close on the PCA loadings plot and have high Pearson s correlation coefficients are meaningful, as certain attributes might change in a similar way over a large sample set, which may cause certain attribute groupings (Talavera-Bianchi et al., 2010). In the current study, it can be assumed that there is a logical association between caramel aroma and sweet taste, as a caramel aroma might enhance the perception of sweet taste. The correlation between bitter taste and rose geranium aroma is, however, not evident in this case and it is probably a factor of two attributes changing in a similar way. DA forward stepwise model selection was conducted to generate a perceptual map of the four Cyclopia species, primarily to indicate whether the respective species formed separate groups and whether specific attribute(s) were responsible for the groupings (Fig. 14). Three groups were formed on the DA plot (Fig. 14a). Cyclopia maculata and C. subternata were grouped together, indicating that these two species have similar sensory profiles when considering attribute intensities. Cyclopia genistoides and C. longifolia were grouped separately on the DA plot (Fig. 14a). It seems that C. genistoides, situated in the bottom left quadrant of the DA plot is primarily driven by rose geranium flavour and not, as expected, by bitter taste. According to Fig. 14b, C. 95
109 longifolia seems to be driven by the attributes that are generally associated with Cyclopia species per se, i.e. fynbos-floral notes, as well as woody flavour, and, not as expected, by the attributes indicated in Section This discrepancy could possibly be explained by the application of different analyses. The DA forward stepwise model selection only looks at attribute intensities, whereas the scatter plots use attributes intensities as well as occurrence. In summary, the following attributes were present in all four Cyclopia species, i.e. fynbosfloral, woody, fynbos-sweet, sweet taste and astringent. These attributes were present in 100% of the samples (Fig. 10) and the respective attributes illustrated the following average intensities for all Cyclopia species tested: fynbos-floral aroma >35, woody aroma >29, fynbossweet aroma >30, sweet taste >19 and astringent >20 (Table 7). Thus the characteristic sensory profile of honeybush can be defined as a fynbos-floral, woody, fynbos-sweet aroma with a sweet taste and slightly astringent mouthfeel. This result differs slightly from the characteristic sensory profile as defined by Theron et al. (2014), which also included fruity and plant-like. The expanded sample set used for this study, i.e. 150 samples, most probably resulted in a larger product variance and thus a slightly different generic profile (Næs et al., 2010). 3.2 Development of quality control tools for the honeybush industry Theron et al. (2014) developed the first generic sensory wheel and lexicon for honeybush consisting of 30 descriptive terms. A lexicon usually consists of a list of sensory descriptors, definitions for each descriptor, as well as food- and/or chemical-based reference standards illustrating the respective sensory attributes, whereas a sensory wheel is just a graphical representation of the descriptive terms (Drake & Civille, 2002). The three-tier sensory wheel that was developed for honeybush by Theron et al. (2014) consisted of the following attributes: 26 for flavour, 3 for taste and 1 for mouthfeel. The secondary attributes, such as fynbos-floral and fruity-sweet, formed the inner tier of the latter honeybush wheel. The middle tier consisted of ten primary descriptors that grouped together similar secondary attributes, whereas the outer tier classified the attributes according to their being positive or negative. The positive attributes are all typical of the product in question, whereas the negative attributes can be used by processors when they have to grade samples according to unacceptable or poor quality (Drake & Civille, 2002). Theron et al. (2014) furthermore suggested that the honeybush wheel could be used as a communication tool between researchers and industry, or when developing new honeybush products. As the first version of the sensory wheel was based on the results of only 58 batches of honeybush, it was suggested that this version of a generic sensory wheel should be validated with more samples and that the development of species-specific sensory wheels should also be investigated (Theron et al., 2014). Sensory wheels and lexicons have been established for a variety of products such as brandy (Jolly & Hattingh, 2001), beer (Meilgaard et al., 1979), red wine (Gawel et al., 2000), olive oil (Aparicio & Morales, 1995), floral honey (Galán Soldevilla et al., 2005), green tea (Lee & Chambers, 2007) and rooibos tea (Koch et al., 2012). The sensory wheels visually display the 96
110 range of and relationship between descriptors (Lawless & Civille, 2013). It is important that the range of descriptors are understood by experts and the general public alike (Jolly & Hattingh, 2001). Lexicons usually add to this understanding. Vázquez-Araújo et al. (2012) developed a sensory lexicon for Turrón where each reference standard, illustrating a specific sensory attribute, was accompanied by an intensity score (0 (none) - 15 (extremely strong)). Tools such as these help the industry to better understand the importance of a sensory attribute. In view of this, it was decided to investigate the inclusion of average intensity for each of the respective attributes in the second version of the sensory wheel for honeybush. When developing and validating a sensory wheel, it is important to carefully consider the size of the sample set. According to Lawless and Civille (2013), the sample set should be large enough to represent the entire product category. For the current study a large sample set spanning three production years (2010, 2012 and 2013) was sourced for three of the species (C. genistoides, C. maculata and C. subternata). These samples differed in season, climate, producer and processing conditions (80 C/24 h and 90 C/16 h), primarily to try and capture maximal sample variation. The latter processing conditions were chosen as Theron (2012) indicated in a previous study that 80 C/24 h and 90 C/16 h could be regarded as ideal processing conditions for C. genistoides, C. maculata and C. subternata, i.e. processing conditions that should result in characteristic sensory profiles when considering the latter three Cyclopia species. The C. longifolia samples were all harvested in the same year, but differed in producer and geographical area. The samples were also fermented at the two optimum temperature/time combinations (80 C/24 h and 90 C/24 h), as determined in Chapter 3. The results of the total group of 150 honeybush samples, consisting of four honeybush species, were thus used to develop the second version of the generic sensory wheel for honeybush. To capture more information two wheels were developed, one for aroma (Fig. 15) and one for flavour, taste and mouthfeel (Fig. 16). The aroma wheel for honeybush consists of 18 aroma attributes and the flavour wheel of 13 flavour, 3 taste and 1 mouthfeel attribute(s). As with the previous sensory wheel for honeybush, the new sensory wheels consist of three tiers. The outer tier represents the two quality divisions, i.e. the positive and negative attributes. The middle tier contains the primary, broad-based attributes, whereas the inner tier contains the specific, secondary attributes. A new addition to the generic sensory wheel for honeybush is that the average intensity of each of the specific attributes is indicated on the wheel; therefore each slice width corresponds with the specific intensity, thus the wider the width of the slice, the higher the average intensity of the specific attribute. Each wheel is also accompanied by bar graphs indicating the percentage occurrence of the respective attributes (Fig. 15b & c and Fig. 16b, c & d). These graphical representations make it easy to see which the most prominent attributes in honeybush are. Changes were also made to the sensory lexicon developed by Theron et al. (2014) to reflect the changes made to the wheel (Table 10). As already mentioned, the aim of this study was also to develop species-specific aroma and flavour wheels for C. genistoides, C. longifolia, C. maculata and C. subternata (Fig. 17 & Fig. 97
111 18). The species-specific wheels give an indication of the prominent attributes present in each species, but also illustrate the significant differences between species. The newly developed generic and species-specific sensory wheels will definitely be of value to the honeybush industry, i.e. in quality control or grading, where it is important to ensure consistent product quality. They can also assist during the development of species-specific honeybush products for niche markets, or when it is important to blend different species to end up with a blend with a specific sensory profile. 3.3 Rapid methodologies for sensory profiling The determination of sensory quality plays an important role in quality control. DSA is one of the most commonly used tools to determine the qualitative and quantitative sensory profile of a product (Lawless & Heymann, 2010). This method has been used effectively in the determination of the full sensory profile of herbal teas such as rooibos (Koch et al., 2012; Jolley, 2014), as well as honeybush (Theron et al., 2014). DSA is sometimes regarded as being too time-consuming and costly for the food industry, and one would assume that it would be similar for a small industry such as the honeybush industry. Rapid profiling methods such as sorting have been used on a large variety of food products (Lawless et al., 1995; Valentin et al., 2012) and they have recently been investigated for a South African herbal tea where rooibos infusions were categorised based on their perceived similarities of aroma or palate quality attributes (Jolley, 2014). The sorting task can be used to group together samples of similar sensory profiles, but the grouping of samples can be combined with a descriptive step where each grouping of samples is described with one or more sensory attributes (Chadoret et al., 2009; Chollet et al., 2011). Sorting does not result in any quantitative information, but can be used to determine the broad-based sensory profile of a product or the consistency of product quality (Chollet et al., 2011). The sorting task can be instructed or uninstructed. During instructed sorting the panellists are given a predefined set of attributes or profiles according to which the samples need to be sorted. During uninstructed sorting the panellists are given no guidelines for grouping the samples (Valentin et al., 2012). In the literature instructed sorting is known as directed sorting and uninstructed sorting as free sorting (Valentin et al., 2012). The number of assessors required for sorting has not been clearly indicated. Sorting tasks using between 8 and 22 panellists have been conducted (Abdi et al., 2007; Chollet et al., 2011). Blancher et al. (2007) suggested that the efficacy of the sorting task itself has a bigger influence on the results than the number of panellists. A trained/expert or untrained panel can be used to perform the sorting task (Cartier et al., 2006; Chollet et al., 2011), depending on the objective of the experiment. When the objective is to determine the broad-based sensory profile of a product or to group samples according to quality grades, it would be beneficial to use an expert panel, which consists of assessors with knowledge of the product profile (Louw et al., 2013; Jolley, 2014). Consumers or untrained panellists can be used when it is important to ascertain how the general consumers perceive and classify a group of samples (Cartier et al., 2006). The results 98
112 obtained from an expert sorting panel were found to be comparable to those of conventional DSA panel (Lelièvre et al., 2008; Chollet et al., 2011; Louw et al., 2013). In this study the instructed sorting task was investigated to determine if it can be used to describe the broad-based sensory profile of different Cyclopia species (C. genistoides, C. maculata and C. subternata). The objective was to compare the results of the sorting task to that obtained from DSA, primarily to determine if sorting can be used as an alternative method to DSA. If the latter is true, the honeybush industry would be able to use instructed sorting as a quick profiling method. Uninstructed sorting was also conducted to find out whether an expert panel would be able to distinguish between different species when conducting free sorting, i.e. when no instructions are given as to how the samples should be categorised Instructed sorting Instructed sorting was conducted using samples from one production year (2013) and the sample set consisted of C. genistoides, C. maculata and C. subternata. A panel of expert judges were instructed to sort the samples in two consecutive sessions according to species-specific aroma, as well as flavour, taste and mouthfeel attributes, as indicated in Tables 5 and 6, respectively. DISTATIS was firstly employed to ascertain group formations. Based on how the samples are grouped, a DISTATIS plot can show the similarities between the samples. DISTATIS does not use the mean value of panellists as is the case with multidimensional scaling or MDS (Abdi et al., 2007). DISTATIS takes into account individual panellists variances and the distance matrix for each individual panellist is integrated in the most efficient way to eliminate the effect of individual panellists error variance (Chollet et al., 2011). Cluster analysis can also be used to ascertain sample groupings. This method is a statistical classification method that makes no preceding assumptions about the important differences within a sample set (Punj & Stewart, 1983). In this study Ward s cluster analysis was also used to verify the respective groups formed on the DISTATIS plots. Ward s cluster analysis tries to keep the overall within-cluster variation low, by combining similar items (Mooi & Sarstedt, 2011). Correspondence analysis (CA), a multivariate method (McEwan & Schlich, 1991/92), was used as a graphical tool to study the symmetric association between categorical variables obtained from the descriptive step of the sorting task (Beh et al., 2011). CA is a generalised PCA, tailored for the analysis of qualitative data (Valentin et al., 2012). Cluster analysis of the data obtained from instructed sorting according to aroma profiles resulted in a dendrogram showing three distinct clusters (Fig. 19). Each cluster contains four samples from the same Cyclopia species. The results indicate that the panellists were able to sort the samples according to species: C. genistoides (G13_90_4, G13_90_3, G13_80_2 and G13_80_1), C. maculata (M13_80_2, M13_90_4, M13_90_3 and M13_80_1) and C. subternata (S13_80_1, S13_90_3, S13_80_2 and S13_90_4). The same groupings can be seen on the DISTATIS plot (Fig. 20), although the C. maculata and C. subternata groups both show one sample slightly distant from the rest of the group. C. maculata and C. subternata can have very 99
113 similar sensory profiles, as mentioned in Section 3.1, thus potentially making grouping according to species slightly difficult. The CA plot (Fig. 21) shows the same groupings as on the DISTATIS plot (Fig. 20). Each group corresponded with aroma descriptors that lie in close proximity to the samples (Fig. 21). According to instructed sorting, C. genistoides associated with apricot/apricot jam, fruity-sweet and rose geranium, C. maculata with fynbos-floral, fynbos-sweet and rose perfume, and C. subternata with cooked apple, cassia/cinnamon and caramel aroma attributes. The purpose of this study was to compare the CA results with that of DSA (Fig. 22), primarily to determine the efficacy of instructed sorting as profiling method. It can be seen on the CA (Fig. 21) and PCA (Fig. 22) plots that the samples split into three groups according to species. It is thus clear that same aroma attributes were associated with the same samples on the CA and PCA plots. It is important to note that the latter PCA plot contains only attributes that were used during sorting, and not the full sensory profile as obtained through DSA (Chapter 4, Fig. 3-8). Rv coefficients were computed to compare the similarity between sorting plots and the PCA plot obtained from DSA. The Rv coefficient, multivariate generalisation of the squared Pearson correlation coefficient, ranges between 0 and 1 and measures the similarity between two plots (Abdi, 2007; Abdi et al., 2007). The closer the Rv coefficient is to 1, the higher the similarity between the plots; however, an Rv coefficient closer to 0 indicates that two plots are less similar, thus reducing the assurance that they can both be used to illustrate the same results. Previous studies have considered various cut-off points for the Rv coefficient to indicate significant similarity. An Rv value of 0.77 was suggested by Faye et al. (2004) to indicate significant similarity, Tang and Heymann (2002) found that 0.68 indicated significant similarity, whereas Cartier et al. (2006) suggested that, as a basis of comparison, an Rv of 0.7 should indicate a good level of agreement between two configurations. The Rv coefficient indicating the similarity of groupings in the DISTATIS (Fig. 20) and CA plots (Fig. 21) was 0.91 (Table 11). When comparing the similarity of the DISTATIS (Fig. 20) and PCA plots (Fig. 22), the Rv coefficient was close to 1 (Rv = 0.94; Table 11), whereas the Rv coefficient comparing the CA and the PCA plot was also close to 1 (Rv = 0.96). These results indicate that the sample groupings in the DISTATIS, CA and PCA plots are significantly similar, indicating that it is possible to use instructed sorting as a rapid technique when grouping Cyclopia species according to diverse or reasonably similar aroma profiles. The addition of the descriptive step added to the success of this rapid profiling technique and indicated that it is possible to replace DSA with instructed sorting when the objective is to determine the broad-based aroma profile of Cyclopia species. The samples were also sorted according to species-specific flavour, taste and mouthfeel profiles (Table 6). Both the Ward s cluster analysis (Fig. 23) and DISTATIS plots (Fig. 24) indicate that the samples were grouped according to species (C. genistoides, C. maculata and C. subternata). The four samples from each species lie in close proximity on the DISTATIS plot (Fig. 24), indicating that they are similar in flavour, taste and mouthfeel attributes. A high similarity was also observed (Rv = 0.93, Table 11) between the DISTATIS (Fig. 24) and CA plots (Fig. 25), both 100
114 plots again illustrating similar group formations. The CA plot (Fig. 25) also displays descriptive terms generally associated with each species: C. genistoides associated with apricot/apricot jam, rose geranium and hay/dried grass flavour attributes, bitter taste and astringent mouthfeel, C. maculata associated with woody, pine, fynbos-floral and rose perfume flavour attributes, whereas C. subternata associated with cooked apple and cassia/cinnamon flavour attributes, a sweet taste and low degree of astringency. The Rv coefficient of the DISTATIS (Fig. 24) and PCA plots (Fig. 26); and the CA (Fig. 25) and PCA plots (Fig. 26) were 0.89 and 0.86, respectively. These results again indicate that the sample groupings in the DISTATIS, CA and PCA plots are similar, indicating that it is possible to use instructed sorting as a rapid technique when grouping Cyclopia species according to flavour, taste and mouthfeel attributes. Again, the descriptive step added to the success of this rapid profiling technique. It is important to note, however, that Rv coefficients were slightly lower when conducting instructed sorting based on the palate attributes (Rv coefficients ranged between 0.89 and 0.86) than when based on aroma attributes (Rv coefficients ranged between 0.96 and 0.94). The slight lowering of Rv values could possibly be attributed to the lower variation in the flavour, taste and mouthfeel intensities (Koch et al., 2012; Jolley, 2014). In view of this, instructed sorting according to flavour, taste and mouthfeel profiles can be more difficult. However, the Rv coefficients were still considered high enough, especially when comparing them to those obtained in other studies (Tang & Heymann, 2002; Faye et al., 2004; Cartier et al., 2006). It can thus be concluded that the results obtained from instructed sorting based on aroma, as well as palate attributes of three Cyclopia species, are similar to those obtained through DSA. Instructed sorting can therefore be viewed as a viable, rapid sensory profiling method for the honeybush industry, and possibly also a first step towards the development of a viable quality grading or quality-control tool Uninstructed sorting Uninstructed sorting was conducted on samples sourced from two production years (2012 and 2013) and three Cyclopia species (C. genistoides, C. maculata and C. subternata). This combination was chosen to introduce enough product variation within a species, as well as within the full sample set. A panel of expert judges were asked to sort the samples according to the similarity of their aroma, as well as their flavour, taste and mouthfeel attributes in two consecutive sessions. In both sessions the sorting step was concluded with a descriptive task. As this was an application of uninstructed sorting, no guidelines regarding the usage of specific attributes were given. In the first session the panellists were asked to sort the samples according to the similarity of their aroma profiles. They were also asked to explain their group formations by allocating a few descriptive attributes to each grouping of samples. No clear grouping according to species, based on Ward s cluster analysis (Fig. 27) and the DISTATIS plot (Fig. 28), could be indicated. As depicted in Fig. 27, four groups were formed: the C. genistoides samples and MIX sample grouped 101
115 together, except for G12_80_2 that were grouped with the C. subternata samples (S12_80_1, S13_80_2, and S12_90_4). M12_80_2, M12_90_3 and S13_90_3 formed a group, while M13_90_4 and M13_80_1 formed a further grouping. The CA plot (Fig. 29), illustrating the descriptive attributes assigned to respective groupings, displays three groups. Again the groupings are not according to species: S12_90_4, M13_80_1, S12_80_1, M13_90_4 and G12_80_2 grouped together and associated with fynbos-sweet, rose perfume, fynbos-floral, pine and green grass aroma attributes. Another group consisting of C. maculata and C. subternata samples were formed, consisting of S13_80_2, S13_90_3, M12_80_2 and M12_90_3. These samples associated with woody, caramel, cassia/cinnamon and cooked apple aroma attributes. The MIX sample grouped with G13_90_3, G13_80_1 and G12_90_4 and associated with apricot/apricot jam, rose geranium and hay/dried grass aroma attributes. A reasonably high similarity of groupings was obtained for the DISTATIS (Fig. 28) and CA plots (Fig. 29) (Rv = 0.82). This indicates that both analyses resulted in reasonably similar groupings; however, there was no logical pattern in the grouping of species. The sorting plots were also compared to the PCA plot (Fig. 30), obtained from DSA. The groupings illustrated in the DISTATIS plot (Rv = 0.24) and CA plot (Rv = 0.36) did not compare well with those shown in the PCA plot (Fig. 30). Note that the Rv coefficients were computed without the data of the MIX sample, as the MIX sample was not analysed during DSA (Chapter 4, Section 3.1). The panellists were also asked to sort the same samples according to the similarity of their flavour, taste and mouthfeel attributes. Both Ward s cluster analysis (Fig. 31) and DISTATIS (Fig. 32) indicate that three reasonably tight groupings were formed. All four C. genistoides samples grouped together with the MIX sample on the left side of Fig. 32. The two 2012 C. maculata samples were grouped together with all the C. subternata samples on the bottom right corner of Fig. 32, while the two 2013 C. maculata samples were placed in a separate group as indicated in the top right corner of Fig. 32. The CA plot (Fig. 33) displays the flavour, taste and mouthfeel attributes that associated with each group. It can be seen that the C. genistoides samples and the MIX sample again grouped together and associated with apricot/apricot jam, fruity-sweet, rose geranium and green grass flavour attributes, bitter taste and astringent mouthfeel, the C. subternata samples and the two 2012 C. maculata samples associated with woody, pine, cassia/cinnamon and fynbos-floral flavour and sweet taste, as well as a low astringency, while the two 2013 C. maculata samples associated with a rose perfume flavour. The Rv coefficient indicating the similarity between the DISTATIS (Fig. 32) and CA plots (Fig. 33) was 0.87, which indicates the grouping in these two plots were significantly similar. When comparing the groupings of the PCA plot (Fig. 34; data obtained from DSA) with those of the DISTATIS plot (Fig. 32) and the CA plot (Fig. 33), the Rv coefficients are 0.66 and 0.50, respectively. These reasonably low Rv coefficients indicate a poor match between the sorting and DSA plots. The above-mentioned results indicate that uninstructed sorting according to aroma, as well as flavour, taste and mouthfeel attributes, did not result in species-specific groupings. This could 102
116 possibly be attributed to the fact that different production years resulted in different profiles within a species, as already indicated (Chapter 4, Section 3.1, Fig. 3-8). Although uninstructed sorting results were not comparable with those obtained via DSA, this free sorting technique could still be used in the honeybush industry, especially when the aim is to sort samples freely according to similarities or dissimilarities, and not according to species-specific profiles (Valentin et al., 2012). 4. CONCLUSIONS The first objective of this study was to determine the generic and defining aroma, flavour, taste and mouthfeel attributes of C. genistoides, C. maculata, C. subternata and C. longifolia and to develop species-specific aroma and flavour wheels for each honeybush species. The following attributes were present in all four Cyclopia species, i.e. fynbos-floral, woody, fynbos-sweet, sweet taste and astringent. These attributes were present in 100% of the samples. The characteristic sensory profile of honeybush can thus be defined as a fynbos-floral, woody, fynbos-sweet aroma with a sweet taste and slightly astringent mouthfeel. This generic profile differs slightly from that proposed by Theron et al. (2014), possibly because the latter study included more species, but only 58 samples. The current study was able to distinguish between the four Cyclopia species in terms of sensory profiles. This resulted in species-specific aroma and flavour wheels, i.e. quality tools that could be most valuable to the honeybush industry. Cyclopia maculata and C. subternata were characterised as being reasonably similar in sensory profiles. Both can be described as having caramel and other sweet-associated notes and a slight astringent mouthfeel. Cyclopia longifolia and C. genistoides were also characterised as being reasonably similar. Cyclopia genistoides was defined as being high in rose geranium flavour, as well as bitterness, while C. longifolia had a slightly less prominent rose geranium flavour and no strong bitter taste. The second objective was to test the viability of a rapid profiling technique, sorting, to classify C. genistoides, C. maculata and C. subternata according to the similarity of their sensory profiles. It can be concluded that the results obtained from instructed sorting are similar to those obtained through the traditional profiling method, descriptive sensory analysis (DSA). Instructed sorting can therefore be viewed as a viable, rapid sensory profiling tool for the honeybush industry. Although the uninstructed sorting results were not comparable with those obtained via DSA, this free sorting technique could still be used as a valuable tool in the honeybush industry, especially when the aim is to sort samples freely according to similarities or dissimilarities, and not according to species-specific sensory profiles. 103
117 5. REFERENCES Abdi, H. (2007). RV and congruence coefficients. In: Encyclopaedia of measurement and statistics (edited by N. Salkind). Pp Thousand Oaks, CA: SAGE Publications, Inc. Abdi, H., Valentin, D., Chollet, S. & Chrea, C. (2007). Analysing assessors and products in sorting tasks: DISTATIS, theory and applications. Food Quality and Preference, 18, Anonymous. (2000). Agricultural Product Standards Act. Act no. 119 of G.N.R. 1177/2000. Johannesburg, South Africa: Lex Patria Publishers. Aparicio, R. & Morales, M.T. (1995). Sensory wheels: a statistical technique for comparing QDA panels - application to virgin olive oil. Journal of the Science of Food and Agriculture, 67, Ballester, J., Patris, B., Symoneaux, R. & Valentin, D. (2008). Conceptual vs. perceptual wine spaces: does expertise matter? Food Quality and Preference, 19, Bavay, C., Symoneaux, R., Maître, I., Kuznetsova, A., Brockhoff, P.B. & Mehinagic, E. (2013). Importance of fruit variability in the assessment of apple quality by sensory evaluation. Postharvest Biology and Technology, 77, Beh, E.J., Lombardo, R. & Simonetti, B. (2011). A European perception of food using two methods of correspondence analysis. Food Quality and Preference, 22, Blancher, G., Chollet, S., Kesteloot, R., Hoang, D.N., Cuvelier, G. & Sieffermann, J.M. (2007). French and Vietnamese: how do they describe texture characteristics of the same food? A case study with jellies. Food Quality and Preference, 18, Cadoret, M., Lê, S. & Pagès, J. (2009). A factorial approach for sorting task data (FAST). Food Quality and Preference, 20, Campo, E., Do, B.V., Ferreira, V. & Valentin D. (2008). Aroma properties of young Spanish monovarietal white wines: a study using sorting task, list of terms and frequency of citation. Australian Journal of Grape and Wine Research, 14, Cartier, R., Rytz, A., Lecomte, A., Poblete, F., Krystlik, J., Belin, E. & Martin, N. (2006). Sorting procedure as an alternative to quantitative descriptive analysis to obtain a product sensory map. Food Quality and Preference, 17, Chollet, S., Leliévre, M., Abdi, H. & Valentin, D. (2011). Sort and beer: everything you wanted to know about the sorting task but did not dare to ask. Food Quality and Preference, 22, Cronje, J.C. (2010). Chemical characterisation of the aroma of honeybush (Cyclopia) species. PhD Dissertation, University of Stellenbosch, Stellenbosch, South Africa. De Saldamando, L., Delgado, L., Herencia, J., Giménez, A. & Gastón, A. (2013). Polarised sensory positioning: do conclusions depend on poles? Food Quality and Preference, 29, Du Toit, J. & Joubert, E. (1998). The effect of pretreatment on the fermentation of honeybush tea (Cyclopia maculata). Journal of the Science of Food and Agriculture, 76,
118 Du Toit, J. & Joubert, E. (1999). Optimisation of the fermentation parameters of honeybush tea (Cyclopia). Journal of Food Quality, 22, Drake, M.A. & Civille, G.V. (2002). Flavour lexicons. Comprehensive Reviews in Food Science and Food Safety, 2, Faye, P., Brémaud, D., Daubin, M.D., Courcoux, P., Giboreau, A. & Nicod, H. (2004). Perceptive free sorting and verbalisation tasks with naïve subjects: an alternative to descriptive mappings. Food Quality and Preference, 15, Friedman, J.H. (1989). Regularised discriminant analysis. Journal of the American Statistical Association, 85, Galán Soldevilla, H., Ruiz-Pérez-Cacho, M.P., Jiménez, S.S., Villarejo, M.J. & Manzanares, A.B. (2005). Development of preliminary sensory lexicon for floral honey. Food Quality and Preference, 16, Gawel, R., Oberholster, A. & Francis, I.L. (2000). A mouthfeel wheel: terminology for communicating the mouth-feel characteristics of red wine. Australian Journal of Grape and Wine Research, 6, Giacalone, D., Dibeiro, L.M. & Frøst, M.B. (2013). Consumer-based product profiling: application of partial napping for sensory characterisation of speciality beers by novices and experts. Journal of Food Products Marketing, 19, Jayasekera, S., Kaur, L., Molan, A., Garg, M.L. & Moughan, P.J. (2014). Effects of season and plantation on phenolic content of unfermented and fermented Sri Lankan tea. Food Chemistry, 152, Jolley, B. (2014). Development of quality control tools and a taste prediction model for rooibos. MSc Thesis, University of Stellenbosch, Stellenbosch, South Africa. Jolly, N.P. & Hattingh, S. (2001). A brandy aroma wheel for South African brandy. South African Journal of Enology and Viticulture, 22, Joubert, E., De Beer, D., Hernández, I. & Munné-Bosch, S. (2014). Accumulation of mangiferin, isomangiferin, iriflophenone-3-c-β-glucoside and hesperidin in honeybush leaves (Cyclopia genistoides Vent.) in response to harvest time, harvest interval and seed source. Industrial Crops and Products, 56, Joubert, E., Joubert, M.E., Bester, C., De Beer, D. & De Lange, J.H. (2011). Honeybush (Cyclopia spp.): from local cottage industry to global markets the catalytic and supporting role of research. South African Journal of Botany, 77, Koch, I.S., Muller, M., Joubert, E., Van der Rijst, M. & Næs, T. (2012). Sensory characterisation of rooibos tea and the development of a rooibos sensory wheel and lexicon. Food Research International, 46, Lawless, H.T. & Heymann, H. (2010). Sensory evaluation of food, Principles and practices, 2 nd ed. New York, USA: Springer 105
119 Lawless L.J.R. & Civille, G.V. (2013). Developing lexicons: a review. Journal of Sensory Studies, 28, Lawless, H.T., Sheng, N. & Knoops, S.S.C.P. (1995). Multidimensional scaling of sorting data applied to cheese perception. Food Quality and Preference, 6, Lee, J. & Chambers, D.H. (2007). A flavour lexicon for flavour descriptive analysis of green tea. Journal of Sensory Studies, 22, Lelièvre, M., Chollet, S., Abdi, H. & Valentin, D. (2008). What is the validity of the sorting task for describing beer? A study using trained and untrained assessors. Food Quality and Preference, 19, Louw, L., Malherbe, S., Næs, T., Lambrechts, M., Van Rensburg, P. & Nieuwoudt, H. (2013). Validation of two napping techniques as rapid sensory screening tools for high alcohol products. Food Quality and Preference, 30, McEwan, J.A. & Schlich, P. (1991/92). Correspondence analysis in sensory evaluation. Food Quality and Preference, 3, Meilgaard, M.C., Dalgleish, C.E. & Clapperton, J.F. (1979). Beer flavour terminology. Journal of the Institute of Brewing, 85, Mooi, E. & Sarstedt, M. (2011). Cluster analysis. In: A concise guide to market research. Berlin, Germany: Springer-Verlag. Næs, T., Brockhoff, P.B. & Tomic, O. (2010). Statistics for sensory and consumer science. New York, USA: Wiley. Noble, A.C. (1996). Taste-aroma interactions. Trends in Food Science and Technology, 7, Nestrud, M.A. & Lawless, H.T. (2008). Perceptual mapping of citrus juices using projective mapping and profiling data from culinary professionals and consumers. Food Quality and Preference, 19, Punj, G. & Stewart, D.W. (1983). Cluster analysis in marketing research: review and suggestions for application. Journal of Marketing Research, 20, Talavera-Bianchi, M., Chambers, E. & Chambers D.H. (2010). Lexicon to describe flavour of fresh leafy vegetables. Journal of Sensory Studies, 25, Tang, C. & Heymann, H. (2002). Multidimensional sorting, similarity scaling and free-choice profiling of grape jellies. Journal of Sensory Studies, 17, Taylor, R. (1990). Interpretation of the correlation coefficient: a basic review. Journal of Diagnostic Medical Sonography, 1, Theron, K.A. (2012). Sensory and phenolic profiling of Cyclopia species (Honeybush) and optimisation of the fermentation conditions. MSc Thesis, University of Stellenbosch, Stellenbosch, South Africa. 106
120 Theron, K.A., Muller, M., Van der Rijst, M., Cronje, J.C., Le Roux, M. & Joubert, E. (2014). Sensory profiling of honeybush tea (Cyclopia species) and the development of a honeybush sensory wheel. Food Research International, 66, Valentin, D., Chollet, S., Lelièvre, M. & Abdi, H. (2012). Quick and dirty but still pretty good: a review of new descriptive methods in food science. International Journal of Food Science and Technology, 47, Vázquez-Araújo, L., Chambers, D. & Carbonell-Barrachina, A.A. (2012). Development of a sensory lexicon and application by an industry trade panel for Turrón, a European protected product. Journal of Sensory Studies, 27,
121 Table 1 Number of samples sourced per Cyclopia species for this study. Fermentation parameters a Batches sourced Total per species C. genistoides C. maculata C. subternata 80 C/24 h 6 batches b 8 batches b 8 batches b C/16 h 6 batches b 8 batches b 8 batches b 80 C/24 h 6 batches b 8 batches b 8 batches b C/16 h 6 batches b 8 batches b 8 batches b 80 C/24 h 6 batches b 8 batches b 8 batches b C/16 h 6 batches b 8 batches b 8 batches b C. longifolia 80 C/24 h batches b C/24 h batches b a Optimum fermentation conditions as determined by Theron (2012) for C. genistoides, C. maculata and C. subternata. Optimum conditions for C. longifolia as determined in Chapter 3 of this study. b A batch consists of the shoots of more than one plant that were pooled. 108
122 Table 2 Attributes used for descriptive sensory analysis of C. genistoides, C. maculata and C. subternata b in 2010, 2012 and 2013, and C. longifolia a in Primary aroma attributes Floral C. genistoides, C. maculata and C. subternata b Cyclopia longifolia (2013) a 2010 b 2012 c 2013 Fynbos-floral d, Rose geranium, Rose perfume Fynbos-floral, Rose geranium, Rose perfume Fynbos-floral, Rose geranium, Rose perfume Fynbos-floral, Rose geranium, Rose perfume Fruity Lemon, Orange, Cooked apple, Apricot jam, Cherry Citrus, Cooked apple, Apricot jam, Cherry essence Lemon/lemongrass, Cooked apple, Apricot/apricot jam Lemon/lemongrass, Cooked apple, Apricot/apricot jam, Orange Plant-like Rooibos, Plant-like, Woody, Pine Woody, Pine Woody, Pine Woody, Pine, Plant-like Sweet Fruity-sweet, Boiled syrup, Caramel, Honey, Fynbos-sweet Fruity-sweet, Caramel, Honey, Fynbos-sweet Fruity-sweet, Caramel, Honey, Fynbossweet Fruity-sweet, Boiled syrup, Caramel, Honey, Fynbos-sweet Spicy Cassia/cinnamon Cassia/cinnamon Cassia/cinnamon Cassia/cinnamon Nutty Coconut, Walnut Coconut Walnut, Coconut Walnut Negative Flavour attributes Dusty, Yeasty, Medicinal, Burnt caramel, Rotting plant water, Hay/dried grass, Green grass, Cooked vegetable Dusty, Medicinal, Burnt caramel, Rotting plant water, Hay/dried grass, Green grass, Cooked vegetable Dusty, Medicinal, Burnt caramel, Rotting plant water, Hay/dried grass, Green grass, Cooked vegetable Dusty, Burnt caramel, Hay/dried grass, Green grass, Cooked vegetable Floral Fynbos-floral, Rose geranium, Rose perfume Fynbos-floral, Rose geranium, Rose perfume Fynbos-floral, Rose geranium, Rose perfume Fynbos-floral, Rose geranium, Rose perfume Fruity Lemon, Orange, Cooked apple, Apricot jam, Cherry Citrus, Apricot jam Lemon/lemongrass, Apricot/apricot jam, Cooked apple Lemon/lemongrass, Cooked apple, Apricot/apricot jam, Orange Plant-like Rooibos, Plant-like, Woody, Pine Woody, Pine Woody, Pine Woody, Pine, Plant-like Spicy Cassia/cinnamon Cassia/cinnamon Cassia/cinnamon Cassia/cinnamon Nutty Coconut, Walnut Coconut Coconut Walnut Negative Dusty, Yeasty, Medicinal, Burnt caramel, Rotting plant water, Hay/dried grass, Green grass, Cooked vegetable Stellenbosch University Dusty, Medicinal, Burnt caramel, Rotting plant water, Hay/dried grass, Green grass, Cooked vegetable Dusty, Medicinal, Burnt caramel, Rotting plant water, Hay/dried grass, Green grass, Cooked vegetable Dusty, Burnt caramel, Hay/dried grass, Green grass, Cooked vegetable Taste and mouthfeel attributes Taste Sweet, Sour, Bitter Sweet, Sour, Bitter Sweet, Sour, Bitter Sweet, Sour, Bitter Mouthfeel Astringent Astringent Astringent Astringent a Attributes mentioned in Chapter 3 were used to analyse C. longifolia; b Attributes generated by Theron (2012); c Attributes generated by Koch (unpublished). d Fynbos is natural 109 shrubland vegetation occurring in the Western Cape, South Africa.
123 Table 3 Cyclopia species samples used for instructed sorting. C. genistoides C. maculata C. subternata 80 C 90 C 80 C 90 C 80 C 90 C G13_80_1 G13_90_3 M13_80_1 M13_90_3 S13_90_1 S13_90_3 G13_80_2 G13_90_4 M13_80_2 M13_90_4 S13_90_2 S13_90_4 Table 4 Cyclopia species samples used for uninstructed sorting. C. genistoides C. maculata C. subternata 80 C 90 C 80 C 90 C 80 C 90 C 2013 G13_80_1 G13_90_3 M13_80_1 M13_90_4 S13_80_2 S13_90_ G12_80_2 G12_90_4 M12_80_2 M12_90_3 S12_80_1 S12_90_4 Mix sample G13_90_3 M13_90_4 S13_80_2 Table 5 Typical aroma profiles of three Cyclopia species. C. genistoides C. maculata C. subternata Apricot/apricot jam Fruity-sweet Honey Rose geranium Fynbos-floral Rose perfume Woody Fynbos-sweet Cassia/cinnamon Cooked apple Caramel Coconut Table 6 Typical flavour, taste and mouthfeel profiles of three Cyclopia species. C. genistoides C. maculata C. subternata Rose geranium Apricot/apricot jam Hay Bitter taste Strong astringency Woody Fynbos-floral Rose perfume Cassia/cinnamon Cooked apple Sweet taste Low astringency 110
124 Table 7 Minimum, maximum and mean intensity DSA ratings for each sensory attribute per species. Aroma Flavour Taste & mouthfeel C. genistoides C. maculata C. subternata C. longifolia Variable Min Max Mean Min Max Mean Min Max Mean Min Max Mean Fynbos-floral Rose geranium Rose perfume Lemon/lemongrass Apricot/apricot jam Cooked apple Woody Pine Fruity-sweet Caramel Honey Fynbos-sweet Cassia/cinnamon Dusty Burnt caramel Hay/dried grass Green grass Cooked vegetable Fynbos-floral Rose geranium Rose perfume Lemon/lemongrass Apricot/apricot jam Woody Pine Cassia/cinnamon Burnt caramel Hay/dried grass Green grass Cooked vegetable Dusty Sweet Sour Bitter Astringent
125 Table 8 Pearson's correlation coefficients (r) displaying the relationship between the positive aroma and flavour, and taste and mouthfeel attributes of all samples (N = 150). Variables Sweet Sour Bitter Astringent F_Fynbos-floral F_Rose geranium F_Rose perfume F_Lemon a F_Apricot b F_Woody F_Pine F_Cassia c A_Fynbos-floral A_Rose geranium A_Rose perfume A_Lemon a A_Apricot b A_Cooked apple A_Woody A_Pine A_Fruity-sweet A_Caramel A_Honey A_Fynbos-sweet A_Cassia c Correlations above 0.7 are indicated in red. All values in bold are significantly different from 0 (p 0.05) The letter A and F in front of the attributes descriptors refer to the aroma and flavour attributes, respectively. a Lemon = lemon/lemongrass; b Apricot = apricot/apricot jam; c Cassia = cassia/cinnamon 112
126 Table 9 Pearson's correlation coefficients (r) displaying the relationship between the negative aroma and flavour, and taste and mouthfeel attributes for all samples (N = 150). Variables Sweet Sour Bitter Astringent F_Burnt caramel F_Hay/dried grass F_Green grass F_Cooked vegetable F_Dusty A_Dusty A_Burnt caramel A_Hay/dried grass A_Green grass A_Cooked vegetable Correlations above 0.7 are indicated in red. All values in bold are significantly different from 0 (p 0.05). The letter A and F in front of the attributes descriptors refer to the aroma and flavour attributes, respectively. 113
127 Table 10 Sensory lexicon describing aroma characteristics of honeybush. Attributes Definition Reference standard a Floral Fruity Plant-like Sweet Spicy Stellenbosch University Fynbos-floral b Sweet, floral aroma note associated with the flowers of fynbos Honeybush tea prepared from C. intermedia (3 g/100 ml) vegetation Rose geranium Floral aroma note associated with the rose geranium plant Fresh rose geranium leaf (10 mm x 10 mm)/rose geranium oil (0.005%) Rose perfume Floral aroma note associated with rose petals Crushed petals of one rose Lemon/lemongrass Aromatics associated with general impression of fresh lemons Lemon juice (5%) or lemongrass Apricot/apricot jam Sweet-sour aroma reminiscent of apricot jam Superfine apricot jam (15 g/100 ml hot water) Cooked apple The flat, slightly sour aroma of cooked apples Apple puree (2.5 g/100 ml) Plant-like Slightly sour aromatic characteristic of freshly cut fynbos plant Honeybush prepared from C. sessiliflora (3 g/100 ml) material Woody Aromatics associated with dry bushes, stems and twigs of the Honeybush tea prepared from C. maculata (3 g/100 ml) fynbos vegetation Pine Aroma reminiscent of pine needles Fresh pine needles Fruity-sweet Sweet-sour aromatic reminiscent of non-specific fruit, Superfine apricot jam and strawberry jam (5 g each/100 ml hot water) especially berries and apricot jam Caramel Sweet aromatics characteristic of molten sugar or caramel Caramel, Natural flavour (0.4%) pudding Honey Aromatics associated with the sweet fragrance of fynbos honey Wild flower honey Fynbos-sweet Aroma note reminiscent of the fynbos plant Honeybush tea prepared from C. intermedia (3 g/100 ml) Cassia/ The sweet, woody, spicy aromatic of ground cinnamon/cassia Soak cinnamon/cassia bark in water overnight cinnamon bark Nutty Walnuts Aroma note associated with fresh walnuts (not rancid) Freshly chopped walnuts Coconut Aromatics associated with desiccated coconut Desiccated coconut Negative Dusty Earthy aroma associated with wet hessian or wet cardboard or dry dirt road Old, dry tree bark (Jacaranda mimosifolia) (1 piece/100 ml hot water, infuse for 5 min filter) Medicinal Aromatic characteristic of Band-aid, disinfectant-like Place a Band-aid adhesive bandage in a petri dish and cover (phenolic) Rotting plant water Slightly sour aromatic characteristic of rotting plant water Grass (Pennisetum clandestinum) (30 shredded blades/100 ml hot water. Store 1 week, filter) Hay/dried grass Slightly sweet aroma associated with dried grass or hay Hay or dried grass Green grass Aroma associated with freshly cut green grass Cooked vegetable An overall aroma note associated with canned/cooked Cis-3-hexen-1-ol (0.005%)/Green grass (Pennisetum clandestinum Brine from canned green beans (5%) vegetables Burnt caramel Aroma associated with blackened/acrid carbohydrates Caramel, Natural flavour (0.4%) a Reference standards determined by Theron et al. (2014). b Fynbos is natural shrubland vegetation occurring in the Western Cape, South Africa. 114
128 Table 11 Rv coefficients comparing the results for instructed sorting of 12 honeybush samples [(DISTATIS and CA plots) and DSA]. Plot 1 Plot 2 Rv coefficient p-value DISTATIS (Ses 1; Aroma) (Fig. 20) DSA (Aroma) (Fig. 22) CA (Ses 1; Aroma) (Fig. 21) DSA (Aroma) (Fig. 22) DISTATIS (Ses 1; Aroma) (Fig. 20) CA (Ses 1; Aroma) (Fig. 21) DISTATIS (Ses 2; Flavour, taste and mouthfeel) (Fig. 24) DSA (Aroma) (Fig. 22) CA (Ses 2; Flavour, taste and mouthfeel) (Fig. 25) DSA (Aroma) (Fig. 22) DISTATIS (Ses 1; Aroma) (Fig. 20) DSA (Flavour) (Fig. 26) CA (Ses 1; Aroma) (Fig. 21) DSA (Flavour) (Fig. 26) DISTATIS (Ses 2; Flavour, taste and mouthfeel) (Fig. 24) DSA (Flavour) (Fig. 26) CA (Ses 2) (Flavour, taste and mouthfeel) (Fig. 25) DSA (Flavour) (Fig. 26) DISTATIS (Ses 2; Flavour, taste and mouthfeel) (Fig. 24) CA (Ses 2; Flavour, taste and mouthfeel) (Fig. 25) Ses 1 and 2 refer to consecutive analysis sessions conducted on one day. 115
129 Table 12 Rv coefficients comparing the results for uninstructed sorting of 12 honeybush samples [(DISTATIS and CA plots) and DSA]. Plot 1 Plot 2 Rv coefficient p-value DISTATIS (Ses 1; Aroma) (Fig. 28) DSA (Aroma) (Fig. 30) CA (Ses 1; Aroma) (Fig. 29) DSA (Aroma) (Fig. 30) DISTATIS(Ses 1; Aroma) (Fig. 28) CA (Ses 1; Aroma) (Fig. 29) DISTATIS (Ses 2; Flavour, taste and mouthfeel) (Fig. 32) DSA (Aroma) (Fig. 30) CA (Ses 2; Flavour, taste and mouthfeel) (Fig. 33) DSA (Aroma) (Fig. 30) DISTATIS (Ses 1; Aroma) (Fig. 28) DSA (Flavour) (Fig. 34) CA (Ses 1; Aroma) (Fig. 29) DSA (Flavour) (Fig. 34) DISTATIS (Ses 2; Flavour, taste and mouthfeel) (Fig. 32) DSA (Flavour) (Fig. 34) CA (Ses 2; Flavour, taste and mouthfeel) (Fig. 33) DSA (Flavour) (Fig. 34) DISTATIS (Ses 2; Flavour, taste and mouthfeel) (Fig. 32) CA (Ses 2; Flavour, taste and mouthfeel) (Fig. 33) Ses 1 and 2 refer to consecutive analysis sessions conducted on one day. 116
![Full DISTATIS, sample set 2010 samples C. genistoides [12] C.](/docs-images/73/69359379/images/130-0.jpg "maculata [12] 36 samples C.")
![subternata [12] Stellenbosch University https://scholar.sun.ac.](/docs-images/73/69359379/images/130-2.jpg "za Rapid profiling methodologies for industry 2012 samples C.")
![genistoides [16] C.](/docs-images/73/69359379/images/130-4.jpg "maculata [16] 48 samples Select 6 samples from 2012 & 6 from 2013 Uninstructed")
![sorting Ward s Cluster, DISTATIS, CA & PCA C. subternata [16] 2013 samples C.](/docs-images/73/69359379/images/130-5.jpg "maculata [16] 48 samples C.")
![subternata [16] Select 12 samples Instructed sorting Ward s Cluster, DISTATIS,](/docs-images/73/69359379/images/130-7.jpg "CA & PCA 2013 samples C.")
130 Full DISTATIS, sample set 2010 samples C. genistoides [12] C. maculata [12] 36 samples C. subternata [12] Stellenbosch University Rapid profiling methodologies for industry 2012 samples C. genistoides [16] C. maculata [16] 48 samples Select 6 samples from 2012 & 6 from 2013 Uninstructed sorting Ward s Cluster, DISTATIS, CA & PCA C. subternata [16] 2013 samples C. genistoides [16] C. maculata [16] 48 samples C. subternata [16] Select 12 samples Instructed sorting Ward s Cluster, DISTATIS, CA & PCA 2013 samples C. longifolia 18 samples DSA [150 samples] PCA & DA Sensory Wheels (Generic & Species-specific) 117 Fig. 1 Layout of samples, sensory analyses, data analysis procedures and outputs towards developing quality control tools for the honeybush industry.
131
132 a) b) Fig. 3 a) PCA scores plot showing the positioning of Cyclopia genistoides samples (N = 44) from three production years (2010, 2012 and 2013). The abbreviation G refers to the Cyclopia species; C. genistoides, while 80 and 90 refer to the fermentation period, 80 C/24 h and 90 C/16 h. b) PCA loadings plot showing the positioning of the positive and negative aroma, flavour, taste and mouthfeel attributes. The letters A and F in front of the attributes refer to aroma and flavour, respectively. Apricot = Apricot/apricot jam, Lemon = Lemon/lemongrass, Cassia = Cassia/cinnamon, Hay = Hay/dried grass, Rotting = Rotting plant water, Cookedveg = Cooked vegetable. 119
133 a) b) 120 Fig. 4 a) Selected DA plot illustrating groupings of Cyclopia genistoides samples from three production years (2010, 2012 and 2013). The abbreviation G refers to Cyclopia genistoides, while 80 and 90 refer to the fermentation period, 80 C/24 h and 90 C/16 h. b) DA variable loadings plot showing the positioning of the positive and negative aroma, flavour, taste and mouthfeel attributes. The letters A and F in front of the attributes refer to aroma and flavour, respectively. Apricot = Apricot/apricot jam, Lemon = Lemon/lemongrass, Cassia = Cassia/cinnamon, Hay = Hay/dried grass, Rotting = Rotting plant water, Cookedveg = Cooked vegetable.
134 a) b) 121 Fig. 5 a) PCA scores plot showing the positioning of Cyclopia maculata samples (N = 44) from three production years (2010, 2012 and 2013). The abbreviation M refer to the Cyclopia species; C. maculata, while 80 and 90 refer to the fermentation period, 80 C/24 h and 90 C/16 h. b) PCA loadings plot showing the positioning of the positive and negative aroma, flavour taste and mouthfeel attributes. The letters A and F in front of the attributes refer to aroma and flavour, respectively. Apricot = Apricot/apricot jam, Lemon = Lemon/lemongrass, Cassia = Cassia/cinnamon, Hay = Hay/dried grass, Rotting = Rotting plant water, Cookedveg = Cooked vegetable.
135 a) b) 122 Fig. 6 a) Selected DA plot illustrating groupings of Cyclopia maculata samples from three production years (2010, 2012 and 2013). The abbreviation M refers to Cyclopia maculata, while 80 and 90 refer to the fermentation period, 80 C/24 h and 90 C/16 h. b) DA variable loadings plot showing the positioning of the positive and negative aroma, flavour taste and mouthfeel attributes. The letters A and F in front of the attributes refer to aroma and flavour, respectively. Apricot = Apricot/apricot jam, Lemon = Lemon/lemongrass, Cassia = Cassia/cinnamon, Hay = Hay/dried grass, Rotting = Rotting plant water, Cookedveg = Cooked vegetable.
136 a) b) 123 Fig. 7 a) PCA scores plot showing the positioning of Cyclopia subternata samples (N = 44) from three production years (2010, 2012 and 2013). The abbreviation S refer to the Cyclopia species; C. subternata, while 80 and 90 refer to the fermentation period, 80 C/24 h and 90 C/16 h. b) DA variable loadings plot showing the positioning of the positive and negative aroma, flavour taste and mouthfeel attributes. The letters A and F in front of the attributes refer to aroma and flavour, respectively. Apricot = Apricot/apricot jam, Lemon = Lemon/lemongrass, Cassia = Cassia/cinnamon, Hay = Hay/dried grass, Rotting = Rotting plant water, Cookedveg = Cooked vegetable.
137 a) b) 124 Fig. 8 a) Selected DA plot illustrating groupings of Cyclopia subternata samples from three production years (2010, 2012 and 2013). The abbreviation S refers to Cyclopia subternata, while 80 and 90 refer to the fermentation period, 80 C/24h and 90 C/16h. b) DA variable loadings plot showing the positioning of the positive and negative aroma, flavour, taste and mouthfeel attributes. The letters A and F in front of the attributes refer to aroma and flavour, respectively. Apricot = Apricot/apricot jam, Lemon = Lemon/lemongrass, Cassia = Cassia/cinnamon, Hay = Hay/dried grass, Rotting = Rotting plant water, Cookedveg = Cooked vegetable.
138 a) b) Fig. 9 a) PCA scores plot showing the positioning of Cyclopia longifolia (N = 18) samples. The abbreviation L refer to the Cyclopia species; C. longifolia, while 80 and 90 refer to the fermentation period, 80 C/24 h and 90 C/24 h. b) PCA loadings plot showing the positioning of the positive and negative aroma, flavour, taste and mouthfeel attributes. The letters A and F in front of the attributes refer to aroma and flavour, respectively. Apricot = Apricot/apricot jam, Lemon = Lemon/lemongrass, Cassia = Cassia/cinnamon, Hay = Hay/dried grass, Cookedveg = Cooked vegetable. 125
139 a) b) Fig. 10 Scatter plot showing the percentage of samples exhibiting a certain attribute vs. the average intensity of the specific attribute. a) Cyclopia genistoides and b) C. longifolia. The letters "A" and "F" in front of the attribute refer to aroma and flavour, respectively, except for astringent. 126
140 c) d) Fig. 10 continued Scatter plot showing the percentage of samples exhibiting a certain attribute vs. the average intensity of the specific attribute. c) C. maculata and d) C. subternata. The letters "A" and "F" in front of the attribute refer to aroma and flavour, respectively except for astringent. 127
141
142
143 a) b) Fig. 13 a) PCA scores plot showing the positioning of Cyclopia samples (N = 150) consisting of four species. The abbreviations G, L, M and S refer to the Cyclopia species; C. genistoides, C. longifolia, C. maculata and C. subternata, respectively, while 80 and 90 refer to the fermentation temperature/time combinations. b) PCA loadings plot showing the positioning of the positive and negative aroma, flavour, taste and mouthfeel attributes. The letters A and F in front of the attributes refer to aroma and flavour, respectively. Apricot = Apricot/apricot jam, Lemon = Lemon/lemongrass, Cassia = Cassia/cinnamon, Hay = Hay/dried grass, Cookedveg = Cooked vegetable. 130
144 a) b) 131 Fig. 14 a) DA plot illustrating groupings of four Cyclopia species. The abbreviations G, L, M and S refer to the Cyclopia species; C. genistoides, C. longifolia, C. maculata and C. subternata, respectively, while 80 and 90 refer to the fermentation temperature/time combinations. b) DA variable loadings plot showing the positioning of the positive and negative aroma, taste and mouthfeel attributes. The letters A and F in front of the attributes refer to aroma and flavour, respectively. Apricot = Apricot/apricot jam, Lemon = Lemon/lemongrass, Cassia = Cassia/cinnamon, Hay = Hay/dried grass, Cookedveg = Cooked vegetable.
145
 Generic honeybush sensory")

, c) and d) illustrate")

146 a) b) c) d) 133 Fig. 16 a) Generic honeybush sensory wheel illustrating the mean intensities of the flavour, taste and mouthfeel attributes. Graphs b), c) and d) illustrate the average percentage that each attribute appeared in the honeybush infusions during the study.


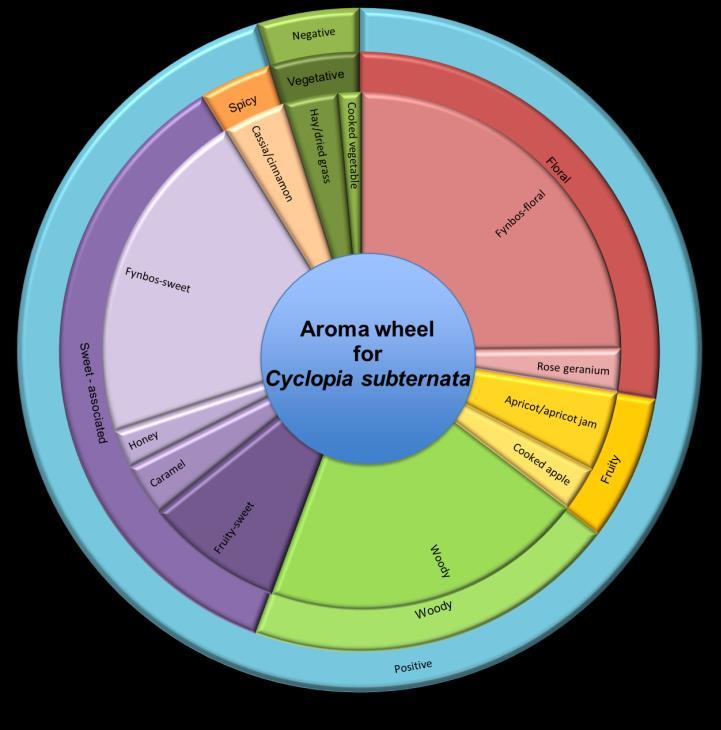
147 134 Fig. 17 Species-specific sensory wheels illustrating the mean intensities of the aroma attributes.

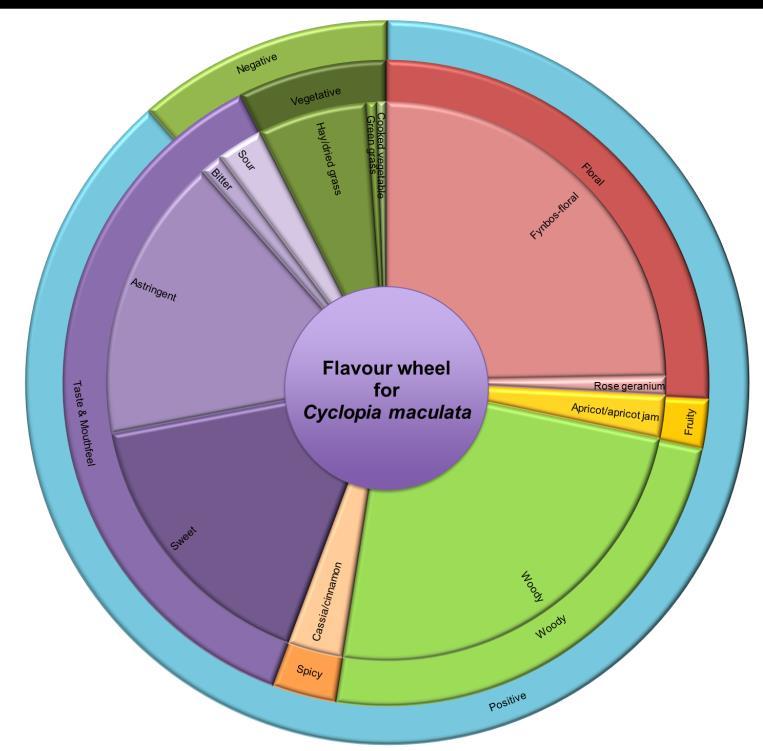
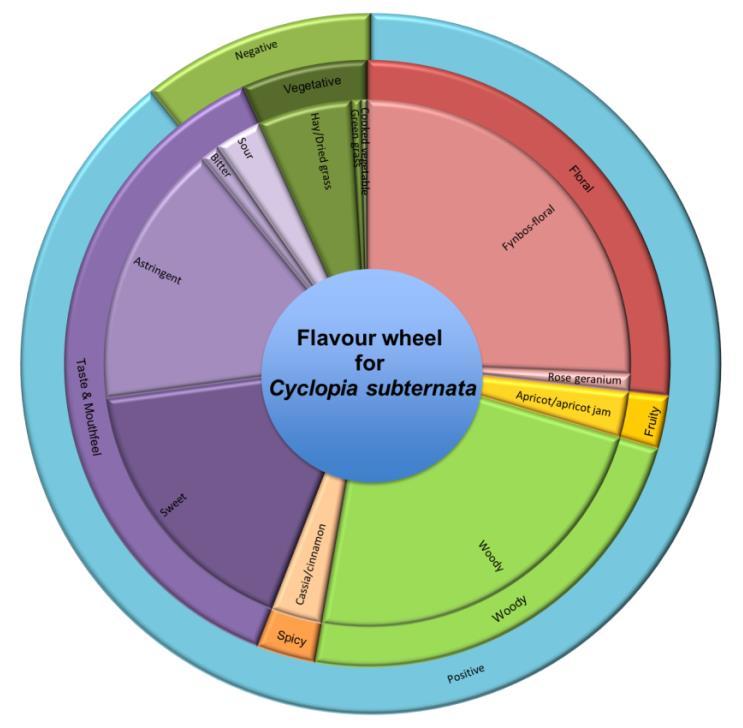

148 135 Fig. 18 Species-specific sensory wheels illustrating the mean intensities of the flavour, taste and mouthfeel attributes.
149 Cluster analysis using Ward's method on first 3 components Ward`s method Euclidean distances M13_80_2 M13_90_4 M13_90_3 M13_80_1 S13_80_1 S13_90_3 S13_80_2 S13_90_4 G13_90_4 G13_90_3 G13_80_2 G13_80_ Linkage Distance Fig. 19 Cluster analysis of instructed sorting data based on the aroma of three Cyclopia species M13_80_2 M13_90_4 M13_90_3 0.2 M13_80_1 PC2(28.9%) G13_80_1 G13_90_3G13_80_2 G13_90_4 S13_90_4 S13_80_1 S13_80_2 S13_90_ PC1(39.9%) Fig. 20 DISTATIS plot showing the position of three Cyclopia species sorted according to their aroma profile during instructed sorting. 136
150 0.8 Dimension 2; Eigenvalue: (27.87% of Inertia) G13_90_3 G13_90_4 apricot / apricot jam G13_80_1 fruity sweet rose geranium G13_80_2 honey cooked apple S13_80_1 caramel S13_80_2 cassia / cinnamon S13_90_3 S13_90_4 woody fynbos floral M13_90_3 M13_90_4 M13_80_2 M13_80_1 fynbos sweet rose perfume Dimension 1; Eigenvalue: (68.24% of Inertia) Fig. 21 CA plot showing the position of three Cyclopia species sorted according to their aroma profile during instructed sorting. A_Rose / Perfume A_Fynbos Sweet A_Fynbos Floral A_Honey A_Woody M13_80_1 M13_80_2 M13_90_3 M13_90_4 A_Rose Geranium PC 2(34%) S13_90_3 S13_90_4 S13_80_1 S13_80_2 G13_80_2 G13_90_3 G13_80_1 G13_90_4 A_Apricot / Apricot Jam A_Cassia/Cinnamon A_Caramel A_Cooked Apple A_Fruity sweet PC 1(61%) Fig. 22 PCA bi-plot obtained from DSA showing the position of honeybush samples with the corresponding aroma attributes. The same samples were used for instructed sorting. 137
151 Cluster analysis using Ward's method on first 3 components Ward`s method Euclidean distances S13_90_4 S13_80_1 S13_80_2 S13_90_3 G13_80_2 G13_80_1 G13_90_3 G13_90_4 M13_80_2 M13_80_1 M13_90_3 M13_90_ Linkage Distance Fig. 23 Cluster analysis of instructed sorting data based on the flavour, taste and mouthfeel of three Cyclopia species M13_80_2 M13_90_3 M13_80_1 0.2 M13_90_4 PC2(31.7%) S13_90_3 S13_80_2 S13_80_1 S13_90_ G13_90_3 G13_90_4 G13_80_2 G13_80_ PC1(37.7%) Fig. 24 DISTATIS plot showing the position of three Cyclopia species sorted according to their flavour, taste and mouthfeel profile during instructed sorting. 138
152 cooked apple Dimension 2; Eigenvalue: (31.44% of Inertia) low astringency S13_80_1 S13_80_2 cassia / cinnamon S13_90_4 S13_90_3 sweet M13_90_4 woody pine M13_90_3 fynbos floral M13_80_1 M13_80_2 rose perfume hay / dried grass G13_90_4 apricot / apricot jam G13_80_1 bitter G13_80_2 G13_80_3 rose geranium astringent Dimension 1; Eigenvalue: (59.10% of Inertia) Fig. 25 CA plot showing the position of three Cyclopia species sorted according to their flavour, taste and mouthfeel profile during the instructed sorting. ASTRINGENT F_Fynbos floral F_Rose/Perfume F_Rose/Geranium F_Apricot / Apricot Jam BITTER G13_90_3 M13_80_1 M13_90_3 M13_90_4 M13_80_2 F_Woody PC 2(32%) G13_80_2 G13_80_1 G13_90_4 SWEET S13_80_1 S13_90_3 S13_80_2 S13_90_ PC 1(60%) Fig. 26 PCA bi-plot obtained from DSA showing the position of honeybush samples with the corresponding palate attributes. The same samples were used for instructed sorting where the analysis was done in terms of the flavour, taste and mouthfeel attributes. 139
153 Cluster analy sis using Ward's method on f irst 4 components Ward`s method Euclidean distances S12_90_4 S13_80_2 S12_80_1 G12_80_2 M13_80_1 M13_90_4 M12_80_2 M12_90_3 S13_90_3 G13_90_3 G13_80_1 G12_90_4 MIX Linkage Distance Fig. 27 Cluster analysis of uninstructed sorting data based on the aroma of three Cyclopia species. 0.3 S12_80_1 0.2 S13_80_2 S12_90_4 G12_80_2 0.1 M13_90_4 G12_90_4 MIX PC2(15.5%) S13_90_3 M13_80_1 G13_90_3 G13_80_ M12_80_2 M12_90_ PC1(24.6%) Fig. 28 DISTATIS plot showing the position of three Cyclopia species sorted according to their general aroma profile during uninstructed sorting. 140
154 0.8 Dimension 2; Eigenvalue: (20.00% of Inertia) M12_90_3 cassia / cinnamon cooked apple fynbos sweet S12_80_1 rose perfume fynbos floral M13_80_1 G12_80_2 S12_90_4 pine M13_90_4 honey woody caramel S13_80_2 S13_90_3 M12_80_2 green grass fruity sweet hay / dried grass G12_90_4 MIX rose geranium G13_90_3 G13_80_1 apricot / apricot jam Dimension 1; Eigenvalue: (52.37% of Inertia) Fig. 29 CA plot showing the position of three Cyclopia species sorted according to their general aroma profile during the uninstructed sorting. A_Fruity sweet A_Apricot / Apricot Jam A_Rose Geranium G12_90_4 G13_90_3 G13_80_1 S12_80_1 S12_90_4 PC 2(33%) A_Honey G12_80_2 M12_90_3 M12_80_2 M13_90_4 M13_80_1 S13_80_2 S13_90_3 A_Rose / Perfume A_Caramel PC 1(47%) A_Woody Fig. 30 PCA bi-plot obtained from DSA showing the position of honeybush samples with the corresponding aroma attributes. The same samples were used for uninstructed sorting where the analysis was done in terms of aroma profile, however, the MIX sample was not included in the principal component analysis. 141
155 Cluster analysis using Ward's method on first 4 components Ward`s method Euclidean distances G12_80_2 G12_90_4 G13_80_1 Mix G13_90_3 S12_90_4 S13_80_2 S12_80_1 S13_90_3 M12_80_2 M12_90_3 M13_90_4 M13_80_ Linkage Distance Fig. 31 Cluster analysis of uninstructed sorting data based on the flavour, taste and mouthfeel of three Cyclopia species M13_80_1 M13_90_ PC2(17.3%) G13_80_1 G13_90_3 Mix S12_80_1 S12_90_4 S13_80_ G12_90_4 G12_80_2 S13_90_3 M12_80_2 M12_90_ PC1(25.2%) Fig. 32 DISTATIS plot displaying the position of three Cyclopia species sorted according to their general flavour, taste and mouthfeel profile during uninstructed sorting. 142
156 1.0 Dimension 2; Eigenvalue: (17.75% of Inertia) caramel apricot / apricot jam S13_90_3 Mix low astringency G13_80_1 bitter fruity sweet hay / dried grass M12_80_2 cassia / cinnamon G13_90_3 low woody M12_90_3 G12_80_2 S13_80_2 sweet G12_90_4 rose geranium woody astringent fynbos floral green grass M13_90_4 M13_80_1 rose perfume S12_80_1 pine S12_90_ Dimension 1; Eigenvalue: (49.77% of Inertia) Fig. 33 CA plot showing the position of three Cyclopia species sorted according to their general flavour, taste and mouthfeel profiles during uninstructed sorting. ASTRINGENT F_Woody BITTER G13_90_3 PC 2(22%) SOUR G12_80_2 G12_90_4 G13_80_1 S12_80_1 S12_90_4 M13_80_1 M13_90_4 S13_90_3 S13_80_2 M12_80_2 M12_90_3 F_Hay/Dried grass SWEET PC 1(65%) Fig. 34 PCA bi-plot obtained from DSA showing the position of honeybush samples with the corresponding palate attributes. The same samples were used for uninstructed sorting, i.e. according to the flavour, taste and mouthfeel attributes, however, the principal component analysis was done without the MIX sample. 143
157 CHAPTER 5 Chemical composition of C. genistoides, C. longifolia, C. maculata and C. subternata as potential predictors of taste and mouthfeel TABLE OF CONTENTS Abstract 1. Introduction 2. Materials and methods 2.1 Samples and sample preparation 2.2 Descriptive sensory analysis 2.3 Chemicals 2.4 Total polyphenol content 2.5 Soluble solids content 2.6 Quantification of individual phenolic compounds 2.7 Statistical analysis 3. Results 3.1 Phenolic content and sensory intensities 3.2 Association between samples, compositional parameters and sensory attributes 3.3 Prediction of taste and mouthfeel based on phenolic composition Cyclopia genistoides Cyclopia longifolia Cyclopia maculata Cyclopia subternata Combined Cyclopia species data set 4. Discussion of results 4.1 Phenolic content and sensory intensities 4.2 Prediction of taste and mouthfeel based on phenolic composition 5. Conclusions 6. References 144
158 ABSTRACT The aim of this study was to identify the phenolic compounds that most likely contribute to the taste and mouthfeel attributes (sweet, sour, bitter and astringent) of C. genistoides, C. longifolia, C. maculata and C. subternata infusions and to develop a prediction model that could be used in future as a preliminary screening tool to predict the intensities of the basic tastes and astringency of tea infusions. A large sample set, spanning a number of production seasons and different fermentation conditions, was used. HPLC-DAD analysis was conducted to compare the phenolic composition of all the infusions qualitatively and quantitatively. The data obtained from HPLC-DAD and sensory (taste and mouthfeel) analyses were subjected to multivariate (PCA and PLS) and step-wise regression analyses. Differences in phenolic composition between species were demonstrated. Of the compounds identified and present in detectable quantities, only mangiferin, isomangiferin, hesperidin and vicenin-2 were present in the infusions of all four Cyclopia species. Other compounds present in three of the four species were iriflophenone-3-c-glucoside-4-oglucoside and eriocitrin. Step-wise regression analysis used different combinations of phenolic compounds for the different Cyclopia species to predict the intensities of the respective taste and mouthfeel attributes. The regression model was able to explain 74% and 73% of the variation in the bitter attribute of C. genistoides and C. longifolia, respectively. For C. longifolia 60% and 69% of the variation in the sweet and astringent attribute intensities, respectively, could be explained. For C. maculata and C. subternata the model was able to predict less than 40% of the variation in the taste and mouthfeel attribute intensities. The overall regression model for Cyclopia, based on the combined data set, was able to predict 50%, 81% and 69% of the variation in the intensity of the typical palate modalities sweet, bitter and astringent, respectively, implying good prediction of bitter taste and astringency, based on phenolic composition. 1. INTRODUCTION Phenolic compounds are among the most abundant groups of plant secondary metabolites and form an important part of the human diet (Bravo, 1998). Interest in the biological effects of phenolic compounds and their importance in the human diet resulted in a considerable growth in the market for these health-promoting ingredients (Becker, 2013). Beverages such as tea can make a substantial contribution to the daily polyphenol intake of consumers (Chun et al., 2007). Whilst desirable from a health-promoting perspective, many polyphenols could impart negative taste sensations such as bitterness and astringency, limiting their potential benefit in food products and beverages. In addition to polyphenols, other classes of non-volatile compounds that could influence the taste (sweet, sour and bitter) and mouthfeel (astringency) of tea are amino acids, purine alkaloids, nucleotides, organic acids, carbohydrates and ions. Tea polyphenols, especially catechins, are known to have an effect on bitterness and astringency (Yu et al., 2014). An increase in the concentration of the catechins causes an increase in bitter taste and astringency (Narukawa et al., 2010). Non-volatile components also affect the aroma perception and the overall flavour volatility, perception and release of volatile compounds (Aronson & Ebeler, 2004). Previous 145
159 studies have found that polyphenols can interact non-covalently with flavours in a solution (King & Solms, 1982). The sense of taste is a specialised chemosensory system (Yarmolinsky et al., 2009). The mechanism of taste sensation is complex and it was found that the sensation of taste takes place in the taste receptor cells (TRCs) by the interaction of the sapid molecules ( tastants ) with receptors and ion channels in the apical microvilli. The basic taste modalities are mediated by distinct groups of TRCs (Yarmolinsky et al., 2009). TRCs are not just restricted to the tongue, and receptors that detect sweet and bitter taste are distributed throughout the stomach and intestines (Trivedi, 2012). Detection of sweet taste is attributed to T1R2 and T1R3 receptors (Li et al., 2002). Different pathways that activate sweet receptors have been identified and several hypothetical models of the ligand binding sites for sweet receptors have been developed. Kinghorn et al. (2010) suggest that all of these models contain AH-B groups, where the AH group is a hydrogen donor and the B group an electro-negative group, thus indicating that all sweet tasting compounds consist of a hydrogen bond donor (AH) and a hydrogen bond acceptor (B), separated by a distance of Å (Kinghorn et al., 2010). Studies suggested that ph and organic acids are responsible for the sour taste of products. Acid-sensitive TRCs are depolarised when the sour taste receptor is activated, leading to a decrease in the intracellular ph and the release of transmitters. This causes the afferent nerve fibres of the brain cortex to react, leading to the sour taste perception (Ramos Da Conceicao Neta et al., 2007). Bitterness, a sensation perceived by taste receptors at the back of the tongue, is often confused with astringency, which is the dry, puckering feeling perceived throughout the oral cavity (Arnold et al., 1980; Peleg et al., 1999). These two sensations are seen as twin sensations, as almost all phenolic compounds that cause astringency are also bitter (Bajec & Pickering, 2008). Several mechanisms for bitter transduction have been identified, but there is no model that fits all the bitter compounds (Lesschaeve & Noble, 2005). A recent study by Roland et al. (2013) on the structural features responsible for bitterness of flavonoids and isoflavonoids used 3D-pharmacophore modelling to understand which chemical characteristics influence bitter receptor interaction. The model indicated that two (or three) hydrogen bond donor sites, one hydrogen bond acceptor site, and two aromatic ring structures, of which one had to be hydrophobic, are needed to activate some bitter receptors. The perception of astringency is not instantaneous; it has a slow onset and can have a lingering effect. Astringency is believed to be caused by many compounds; however, the chemical definition of astringency is the ability to precipitate proteins (Peleg et al., 1999). Green (1993) suggested that astringency is largely a tactile sensation. At first it was believed that astringency occurred as a result of de-lubrication of saliva, but this mechanism is no longer thought to be the main cause, as astringency may be caused by binding of polyphenols to the oral epithelial cells (Payne et al., 2009). Perceived astringency varies between individuals; it is believed to be the result of the difference in protein composition and flow rate of saliva of each individual (Gawel, 1998). Molecular size influences 146
160 bitterness and astringency, with bitterness decreasing and astringency increasing as the molecular size increases (Peleg et al., 1999). Investigation into the sensory profile of the infusions of Cyclopia species has shown that some species are more sweet, bitter and/or astringent than others (Theron, 2012). Similarly qualitative and quantitative differences in the phenolic composition of different Cyclopia species have also been demonstrated (Joubert et al., 2008; De Beer & Joubert, 2010; De Beer et al., 2012; Beelders et al., 2014b; Schulze et al., 2014). Hesperetin and eriodictyol, examples of Cyclopia polyphenols, have been linked to taste. Reichelt et al. (2010) has identified hesperetin as a flavour modulating compound with sweet-enhancing properties, while eriodictyol has bitter-masking properties (Ley et al., 2005; Ley, 2008). Theron (2012) determined the phenolic composition of infusions of C. sessiliflora, C. longifolia, C. genistoides, C. intermedia, C. subternata and C. maculata and found bitter taste to correlate with mangiferin and isomangiferin concentration. Cyclopia genistoides, shown to be bitter, had the highest concentrations of mangiferin ( mg/l) and isomangiferin (47.95 mg/l) of the species studied. In this study no specific compounds could be identified as being linked to sweetness; however, the taste modality sweetness was significantly negatively correlated to compounds associated with bitterness (Theron, 2012). The objective of the present study was to develop a prediction model for the basic taste modalities (sweet, sour and bitter) and mouthfeel (astringency) of the infusions of C. genistoides, C. longifolia, C. maculata and C. subternata, based on their phenolic composition, soluble solids (SS) and total polyphenols (TP). To confirm the results of Theron (2012), a comprehensive sample set was used for analyses and model building. Prediction models for individual sensory attributes, based on phenolic content, were developed for each species separately, as well as for the combined data set, using the compositional data (Fig. 1). 2. MATERIALS AND METHODS A summary of the samples and the different analyses conducted are displayed in Fig Samples and sample preparation The samples used in this study (N = 204) were the same as those used in Chapter 3 and Chapter 4. The C. genistoides, C. maculata and C. subternata samples were processed according to two temperature/time regimes (80 C/24 h and 90 C/16 h), whereas C. longifolia was processed according to eight temperature/time regimes (80 C and 90 C for 8, 16, 24 and 32 h). The same infusions prepared for descriptive sensory analysis (Chapters 3 and 4) were also used for compositional analysis. A 100 ml aliquot of each of the latter infusions was filtered through Whatman No. 4 filter paper and allowed to cool. The filtrate was used to determine the soluble solids content and the remaining filtrate was transferred to 2 ml microfuge tubes and stored at 18 C until required for total polyphenol and high-performance liquid chromatography (HPLC) analyses. 147
161 2.2 Descriptive sensory analysis Descriptive sensory analysis (DSA) was conducted to determine the full sensory profile (aroma, flavour, taste and mouthfeel) of C. longifolia (Chapter 3) and C. genistoides, C. maculata and C. subternata (Chapter 4), using an unstructured line scale ranging from 0 (zero intensity) to 100 (prominent intensity). Only data for the three taste modalities (sweet, sour and bitter) and mouthfeel (astringency) were used in this study to relate to the compositional data of the respective Cyclopia species. 2.3 Chemicals Folin-Ciocalteau s phenol reagent (Merck Millipore, Darmstadt, Germany), anhydrous sodium carbonate (Merck Millipore) and gallic acid (Sigma Aldrich, St. Louis, USA) were used for the quantification of the total polyphenol content. The solvents used for preparation of the mobile phases for HPLC analysis were sourced from Merck Millipore and Sigma-Aldrich. The following reference standards (purity > 95%) were sourced: hesperidin (Sigma-Aldrich), mangiferin, eriocitrin, luteolin (Extrasynthese, Genay, France) and isomangiferin (Chemos, Regenstauf, Germany). Aspalathin (3-hydroxyphloretin-3 -C-glucoside) and nothofagin (phloretin-3 -Cglucoside) were obtained from PROMEC (Medical Research Council of South Africa, Tygerberg, South Africa). Iriflophenone-3-C-glucoside-4-O-glucoside and maclurin-3-c-glucoside were isolated by Beelders et al. (2014a) and iriflophenone-3-c-glucoside was obtained from Sigma Aldrich. An Elix water purification system (Merck Millipore) was used to prepare deionised water and the water was further purified for HPLC analysis using a Milli-Q Academic water purification system (Merck Millipore). 2.4 Total polyphenol content The total polyphenol (TP) content was determined using the Folin-Ciocalteau method as described by Arthur et al. (2011). The sample was defrosted and diluted to obtain a soluble solid content between 0.2 and 0.3 mg/ml. This is necessary to obtain absorbance values within the range of the calibration curve. A calibration curve from 1 mg/l to 10 mg/l gallic acid in the final reaction volume was prepared. Twenty µl of each standard, sample and control (deionised water) were transferred into a clear 96-well flat bottom plate (in triplicate) and 100 µl Folin-Ciocalteau s phenol reagent (10 x diluted) and 80 µl sodium carbonate solution (7.5% w/v) were added. The reaction mixtures were then mixed mechanically, using an Eppendorf MixMate (Merck Millipore). The plates were incubated (30 C/2 h) in a temperature-controlled laboratory oven. After incubation, the absorbance was measured at 765 nm, using a Biotek Synergy HT multiplate reader (BioTek Instruments, Winooski, USA). The TP content was expressed as mg gallic acid equivalents (GAE)/L infusion. 2.5 Soluble solids content The soluble solids (SS) content of the infusion filtrate was determined gravimetrically. A twenty ml aliquot of the filtrate was pipetted, in triplicate, into weighed nickel moisture dishes, after which the 148
162 water was evaporated on a steam bath. The remaining moisture was removed by drying the residue in a laboratory oven at 100 C for 1 h. The moisture dishes were cooled in a desiccator before re-weighing. The soluble solids content was expressed in mg/l infusion. 2.6 Quantification of individual phenolic compounds Analyses were conducted on an Agilent 1200 series HPLC instrument, consisting of a quaternary pump, autosampler, column thermostat, in-line degasser and diode array detector (DAD), controlled by Chemstation software (Agilent Technologies Inc., Santa Clara, CA). Stock solutions of standards were prepared using dimethylsulfoxide (DMSO) and were frozen at -20 C until analysis. After defrosting the standards and samples, an aqueous ascorbic acid solution was added (final ascorbic acid concentration of 5 mg/l and 9 mg/l for standards and samples, respectively) to prevent oxidative degradation during analysis. Following direct filtration into HPLC autosampler vials, using 0.22 µm pore-size Millihex-HV syringe filters (Millipore, Bedford, USA), the filtrates were injected. Different injection volumes were employed to accommodate the varying levels of the compounds in the infusions. The injection volumes were µl for the standards, 60 µl for minor and 5 µl for major compounds (mangiferin and isomangiferin) in C. genistoides (Beelders et al., 2014b), 10 µl for C. maculata (Schulze et al., 2014), 15 µl for C. subternata (De Beer et al., 2012) and 25 µl for C. longifolia (Schulze, unpublished). Separation was carried out at 30 C and a flow rate of 1 ml/min for all species. The column, mobile phase and gradient profile used to analyse each of the four species (C. genistoides, C. maculata, C. subternata and C. longifolia) are displayed in Table 1. All columns were supplied by Phenomenex (Santa Clara, CA, USA). The notations for the phenolic compounds identified are displayed in Table 2. Where no authentic standards were available, compounds of similar class (e.g. aspalathin for 3- hydroxyphloretin-3',5'-di-c-hexoside) were used for quantification and results expressed as equivalent values. 2.7 Statistical analysis SAS statistical software (Version 9.2, SAS institute Inc., Cary, USA) and XLStat (Version , Addinsoft, France) were used to analyse the data. The sensory data set (Chapter 3 & 4) was pre-processed to confirm panel reliability (Næs et al., 2010). The Shapiro-Wilk test was performed on the sensory and compositional data to test for normality (Shapiro & Wilk, 1965). Outliers were removed when the standardised residual for an observation deviated by more than three standard deviations from the model value. Pearson s correlation analysis was performed to determine the closeness of the linear relationships between the compositional parameters and sensory variables (Snedecor & Cochran, 1989). Principal component analysis (PCA), using the correlation matrix, was performed to determine the linear association of samples, sourced from different production seasons, and the full range of sensory attributes and compositional parameters (Næs et al., 2010). Partial least squares regression (PLS) was conducted to determine the association between the compositional 149
163 parameters and the three basic taste modalities and the mouthfeel attribute, astringency (Abdi, 2007; Jolliffe, 2002). Last, step-wise regression analysis was performed for selecting the best subset of predictor variables from the full set of individual compositional parameters that contribute significantly to the model, developed to predict the intensity of each individual dependent variable (sweet, sour, bitter and astringent). The aim was thus to develop a simple model with good predictive ability. 3. RESULTS 3.1 Phenolic content and sensory intensities The minimum, maximum, mean and standard deviation values of the sensory attributes (taste and mouthfeel), soluble solids content, total polyphenol content and content of individual phenolic compounds of the respective Cyclopia species are summarised in Table 3. Large qualitative and quantitative differences were observed for the content of individual phenolic compounds when comparing species. Not all compounds were present in all species, and the concentration of compounds in the infusions also varied extensively between species, in particular that of mangiferin. Cyclopia genistoides had the highest mean mangiferin (X1) content at mg/l and C. longifolia the second highest at mg/l. Other major compounds present in C. genistoides were isomangiferin (X2), iriflophenone-3-c-glucoside-4-o-glucoside (B1) and iriflophenone-3-c-glucoside (B4), with mean content values of 38.71, 31.64, mg/l, respectively. Excluding mangiferin (X1), compounds present at the highest mean content values in C. longifolia included iriflophenone-3-c-glucoside-4-o-glucoside (B1) (27.64 mg/l), hesperidin (Fl3) (10.72 mg/l) and isomangiferin (X2) (31.54 mg/l). In C. maculata infusions, mangiferin (X1) (16.40 mg/l), isomangiferin (X2) (12.21 mg/l) and hesperidin (Fl3) (16.91 mg/l) were present at mean concentrations of more than 10 mg/l. The only compound present at a mean concentration of more than 10 mg/l in C. subternata was iriflophenone-3-c-glucoside-4-o-glucoside (B1) (21.26 mg/l), while hesperidin (Fl3), eriocitrin (Fl4) and scolymoside (Fv2) were present at mean concentrations of ca. 5 mg/l. Only four compounds, of those quantified, were present in all species, namely mangiferin (X1), isomangiferin (X2), hesperidin (Fl3) and vicenin-2 (Fv1). In contrast, limited variation was observed in the taste and mouthfeel attributes, scored on a 100-point intensity scale (Table 3). Sweet taste varied between 19 and 22 for all four Cyclopia species, indicating an extremely narrow range. Bitter taste was the only attribute that differed considerably between species: the mean intensity value was for C. genistoides, while it was less than 5 for the other three Cyclopia species. The mean intensity values for astringency ranged between 21 and 27 for the four species, again representing a fairly limited range. Furthermore, given the intensity scale (0 100) these values are low, especially considering that intensity values below 5 are usually regarded as being barely perceptible. The data obtained for the respective Cyclopia species were combined and the minimum, maximum, mean and standard deviation values for the intensities of the sensory attributes (taste and mouthfeel) and phenolic content, as well as soluble solids content of the full data set are 150
164 summarised in Table 4. The intensity ranges for the sensory attributes sour ( ), bitter (0 25.7) and astringent ( ), were acceptable, but still relatively small for sweet ( ). The ranges for the phenolic content showed considerable variation, especially for iriflophenone-3-c-glucoside-4-o-glucoside (B1) ( ), iriflophenone-3-c-glucoside (B4) ( ), mangiferin (X1) ( ) and isomangiferin (X2) ( ) [Table 4]. Addendum C (Tables 1C 4C) summarising the means per sample, indicates the variation between samples within species. 3.2 Association between samples, compositional parameters and sensory attributes The association between C. genistoides samples (harvested in 2010, 2012 and 2013 and processed according to two different fermentation regimes), their compositional parameters (individual phenolic compounds, SS and TP) and the sensory attributes (basic taste modalities and mouthfeel) are illustrated in Fig. 2. The PCA scores plot (Fig. 2a) indicates that, with the exception of two samples, the 2012 samples were separated from the 2010 and 2013 samples. The PCA loadings plot (Fig. 2b) displays the corresponding compositional parameters and sensory attributes. The four sensory attributes were separated from the compositional parameters along the first principal component (PC1, also Factor 1), indicating that the samples on the left side of the PCA scores plot (Fig. 2a) scored higher for the sensory attributes, while those on the right side of the PCA scores plot scored higher for the compositional parameters. Separation of the 2012 C. genistoides samples from the others on the PCA scores plot (Fig. 2a) could possibly be attributed to their high scores for bitter taste. The 2012 C. genistoides samples scored highest for bitter taste, but marginally lower for most of the phenolic compounds. The average mangiferin content of the 2012 samples ( mg/l) was lower than that of the 2010 ( mg/l) and 2013 ( mg/l) samples (Addendum C, Table 1C). The C. longifolia samples were fermented at eight different temperature/time combinations (80 C and 90 C for 8, 16, 24 and 32 h) and the association between all samples, based on composition (individual phenolic compounds, SS and TP) and sensory attributes is displayed in Fig. 3. The samples did not split according to processing conditions (Fig. 3a). The attributes sour taste, bitter taste and astringency separated from sweet taste along PC1 (Fig. 3b). The compositional parameters also lie on the same side of the PCA plot as bitter taste, sour taste and astringency, indicating some form of association between the composition and the latter sensory attributes. Although there was no clear split in samples based on the processing conditions, it does seem that a number of samples, processed for 8 h and situated in the right bottom quadrant of Fig. 3a, associate with bitter taste and astringent mouthfeel. According to data summarised in Addendum C (Table 2C), several of the C. longifolia samples processed for only 8 h had high intensities (>10) for bitter taste, indicating that under-fermentation could easily result in infusions with a bitter taste. The PCA scores plot for C. maculata samples, harvested over three production years and processed according to two production regimes, indicate no clear split between the samples 151
165 according to production year or processing conditions (Fig. 4a). The PCA loadings plot displays the corresponding compositional parameters and taste and mouthfeel attributes (Fig. 4b), with the samples on the right side of the PCA scores plot (Fig. 4a) associating with the compositional parameters and taste attributes on the right side of the PCA loadings plot (Fig. 4b). Similar to the other Cyclopia species, C. subternata did not indicate a clear split according to production season and processing conditions (Fig. 5a). The PCA loadings plot indicates that sweet taste, sour taste, bitter taste and astringency split from the compositional parameters along the PC1 (Fig. 5b). The sensory attributes associated with the majority of the 2012 and 2013 samples, whereas the compositional parameters associated more closely with the 2010 samples. All the data of the four Cyclopia species were combined to provide a data set encompassing a larger range for individual parameters. The PCA scores plot (Fig. 6a) shows that the samples of each species more or less clustered in groups. From the PCA loadings plot (Fig. 6b) it is evident that all the samples of C. maculata and C. subternata associated with sweet taste. The phenolic compounds, 3-hydroxyphloretin-3-5 -di-c-hexoside (D1) and phloretin-3-5 -di-cglucoside (D2), lie close to sweet taste on the PCA loadings plot (Fig. 6b) and associated with C. subternata. The vast majority of the C. longifolia samples, and especially the C. genistoides samples, associated with the other compositional parameters and sensory attributes (especially bitter taste and astringent mouthfeel) situated on the right side of the PCA loadings plot (Fig. 6b). 3.3 Prediction of taste and mouthfeel based on phenolic composition The predictive value of individual phenolic compounds, TP and SS (independent variables) for specific taste and mouthfeel attributes was assessed using Pearson s correlation analysis, PLS and step-wise regression analysis. PLS was employed to determine the association between each individual sensory attribute and the full range of independent variables, whereas step-wise regression analysis determined the simultaneous contribution of the independent variables, whether positive or negative (i.e. according to the parameter estimates), towards predicting the variation within the taste and mouthfeel attributes (Snedecor & Cochran, 1989). In order to achieve the latter, these three methods were applied to the data set of each Cyclopia species individually, as well as to the combined data sets Cyclopia genistoides Pearson s correlation coefficients for C. genistoides are summarised in Table 5. Significant (p 0.05) but low negative correlations were obtained between sweet taste and naringenin-o-hexosedeoxyhexose B (Fl2) (r = ), hesperidin (Fl3) (r = ) and mangiferin (X1) (r = ). Similarly, significant (p 0.05) but low to moderate negative correlations between sour and 3- hydroxyphloretin-3-5 -di-c-hexoside (D1) (r = ), naringenin-o-hexose-o-deoxyhexose A (Fl1) (r = ), naringenin-o-hexose-o-deoxyhexose B (Fl2) (r = ) and hesperidin (Fl3) (r = ) were observed. Significant positive correlations (p 0.05) were obtained between bitter taste and maclurin-di-o,c-hexoside (B2) (r = 0.496) and vicenin-2 (Fv1) (r = 0.459). In contrast, four moderately strong significant negative correlations were observed between bitter 152
166 taste and 3-hydroxyphloretin-3-5 -di-c-hexoside (D1) (r = ), naringenin-o-hexose-odeoxyhexose A (Fl1) (r = ), naringenin-o-hexose-o-deoxyhexose B (Fl2) (r = ), and hesperidin (Fl3) (r = ). Astringency correlated negatively but moderately with tetrahydroxyxanthone-c-hexoside isomer A (X3) (r = ), tetrahydroxyxanthone-c-hexoside isomer B (X4) (r = ) and SS (r = ). All the significant correlations were negative, except for maclurin-di-o,c-hexoside (B2) and vicenin-2 (Fv1) that correlated positively with bitter taste. PLS regression analysis was conducted next to determine the relative association between the full range of compositional parameters of C. genistoides and its sensory attributes (Fig. 7). Fig. 7 indicates that the individual sensory attributes did not strongly associate with any specific phenolic compounds, TP or SS; however, the phenolic compounds indicated as being negatively correlated with the four sensory attributes (Table 5) are all situated on the far left side of dimension 1 of the PLS plots (Fig. 7). The two compounds that were positively correlated (r > 0.45) with bitter taste (B2 & Fv1) as indicated in Table 5, also associated with bitter taste as shown in Fig. 7c. The results for step-wise regression analysis are summarised in Table 6. The model R- square value was the highest for bitter taste (0.7422) and the second highest for sour taste (0.5755). The model R-square value for astringent was a moderate , and that for sweet taste a very low Naringenin-O-hexose-O-deoxyhexose B (Fl2), although negatively correlated according to the parameter estimates, explained only 13.32% of the variance in sweet taste. Hesperidin (Fl3), naringenin-o-hexose-o-deoxyhexose A (Fl1), 3-hydroxyphloretin-3-5 -di- C-hexoside (D1) and TP content explained 57.55% of the variation in sour taste intensity. Seventy-four percent (74.22%) of the variance in bitter taste intensity was explained by hesperidin (Fl3), soluble solids (SS), naringenin-o-hexose-o-deoxyhexose A (Fl1) and mangiferin (X1) content, while tetrahydroxyxanthone-c-hexoside isomer A (X3), maclurin-di-o,c-hexoside (B2) and naringenin-o-hexose-o-deoxyhexose B (Fl2) content explained 47.48% of the variance in the intensity of astringency. According to step-wise regression analysis, hesperidin (Fl3) and naringenin-o-hexose-o-deoxyhexose A (Fl1) both contributed significantly to explaining the variance in sour and bitter taste, while naringenin-o-hexose-o-deoxyhexose B (Fl2) contributed significantly to explaining the variance in both sweet taste and astringency. As indicated in Table 6, some of the compositional parameters contributed positively to the model and some negatively. For example, the variation in the bitter taste intensity of C. genistoides infusions was explained by four variables, negatively by the compounds hesperidin (Fl3) and naringenin-o-hexose-odeoxyhexose A (Fl1), and positively by the SS and mangiferin (X1) Cyclopia longifolia The results of Pearson s correlation analysis of C. longifolia data are summarised in Table 7. Sweet taste correlated negatively with a number of compounds. These correlations were significant (p 0.05), but low for vicenin-2 (Fv1) (r = ), mangiferin (X1) (r = ), isomangiferin (X2) (r = ) and tetrahydroxyxanthone-di-o,c-hexoside (X5) (r = ). 153
167 Significant, low positive correlations (p 0.05) were observed between sour taste and eriocitrin (Fl4) (r = 0.256), vicenin-2 (Fv1) (r = 0.329), mangiferin (X1) (r = 0.425), isomangiferin (X2) (r = 0.411) and tetrahydroxyxanthone-di-o,c-hexoside (X5) (r = 0.242). Low to moderate positive correlations (p 0.05) were observed between all the phenolic compounds quantified in C. longifolia infusions, as well as bitter taste and astringent mouthfeel, except for scolymoside (Fv2). The parameters, TP and SS, also correlated significantly with bitter taste and astringency. The strongest correlation was observed between mangiferin (X1) and bitter taste (r = 0.800), and mangiferin (X1) and astringent mouthfeel (r = 0.779). Isomangiferin (X2) also had a strong positive correlation with bitter taste (r = 0.728) and astringent mouthfeel (r = 0.724). Mangiferin (X1) and isomangiferin (X2) thus had a positive correlation (p 0.05) with sour taste, bitter taste and astringency, while both compounds correlated negatively to sweet taste (p 0.05). PLS regression analysis revealed no association between the compositional parameters (Fig. 8) and the three taste modalities and astringency. Table 8 displays the results for the step-wise regression analysis for C. longifolia. Moderate R-square values were obtained for sweet taste (0.6025), bitter taste (0.7305) and astringency (0.6896), while a low model R-square value was obtained for sour taste (0.2675). Mangiferin (X1) and scolymoside (Fv2) both contributed negatively to the prediction of sweet taste, whereas both iriflophenone-3-c-glucoside (B4) and vicenin-2 (Fv1) contributed positively, explaining 60.25% of the variance within the intensity of this sensory attribute. In the case of bitter taste, 73.05% of the variance in its intensity was explained by mangiferin (X1), eriocitrin (Fl4) (negative contribution) and iriflophenone-3-c-glucoside (B4) (positive contribution). For astringency, 68.96% of the variance in this attribute s intensity is predicted by mangiferin (X1), eriocitrin (Fl4), iriflophenone-3-c-glucoside (B4) and SS content. In this instance only mangiferin (X1) and SS added positively to the model. Prediction of the sour taste intensity depended on the positive and negative contribution of mangiferin (X1) and iriflophenone-3-c-glucoside (B4), respectively. However, these compounds explained only 26.75% of the variance in sour taste intensity. According to the step-wise regression analysis, both mangiferin (X1) and iriflophenone- 3-C-glucoside (B4) contributed significantly to explaining the variance in the respective prediction models for the sensory attributes; however, in some instances the contribution of these two compounds was positive and in others negative. These results are not clear and require further investigation Cyclopia maculata Table 9 displays the results of Pearson s correlation analysis for C. maculata. Low to moderate positive correlations (p 0.05) were observed between sweet taste and hesperidin (Fl3) (r = 0.499), eriocitrin (Fl4) (r = 0.414), vicenin-2 (Fv1) (r = 0.380), mangiferin (X1) (r = 0.560), isomangiferin (X2) (r = 0.528) and total polyphenols (r = 0.313). Sour taste correlated positively with mangiferin (X1) (r = 0.477), isomangiferin (X2) (r = 0.455) and total polyphenols (r = 0.445), however; these significant (p 0.05) correlations were all relatively low. The attributes, bitter taste 154
168 and astringency correlated positively with mangiferin (X1) (r = 0.411) and eriodictyol-o-glucoside (Fl5) (r = 0.492), respectively. Low, negative correlations (p 0.05) were also observed between astringency and mangiferin (X1) (r = ), isomangiferin (X2) (r = ) and total polyphenols (r = ). According to the PLS regression analysis, no clear compositional drivers of sweet, bitter and sour taste (Fig. 9 a-c) were evident. In contrast, astringency (Fig. 9d) associated with eriodictyol-o-glucoside (Fl5) on dimension 1. This association is also evident in the Pearson s correlation table (Table 9). According to step-wise regression analyses (Table 10), all four sensory attributes had low model R-square values (R-square < 0.4). Furthermore, a small number of compounds were used to explain variation in the intensities of the respective sensory attributes, most probably as a result of only six phenolic compounds being quantified for this species (Table 3). The model R-square values for sweet taste and astringency were and , respectively. The model R- square values for sour and bitter taste were even lower, at and , respectively. The model indicated that mangiferin (X1) contributed positively to sweet taste, sour taste and bitter taste of C. maculata, explaining 31.4%, 22.77% and 16.88% of the variance in these three taste modalities, respectively. Hesperidin (Fl3) positively explained a further 8.0% of sweet taste. Eriodictyol-O-glucoside (Fl5) positively explained 24.23% of the variance in astringency, whereas isomangiferin (X2) negatively explained 13.56% of the variance in astringency Cyclopia subternata Pearson s correlation analysis results for C. subternata are summarised in Table 11. A small number of low to moderate negative correlations (p 0.05) were observed between the compositional parameters and sweet taste, sour taste and astringent mouthfeel. No significant positive correlations were observed for any of the latter attributes. Mangiferin and isomangiferin correlated negatively with sweet taste (r > 0.5). None of the compositional parameters showed significant (p 0.05) correlations with bitter taste. PLS plots for sweet taste, sour taste and astringency (Fig. 10a, b and d, respectively) indicate similar associations as that found for Pearson s correlation analysis (Table 11), i.e. specific phenolic compounds and the SS variable associated negatively with these sensory attributes. According to PLS (Fig. 10c), no clear association between the compositional parameters and bitter taste existed, a result also evident from Table 11. Step-wise regression analysis (Table 12) did not identify any predictors of the bitter taste intensity of C. subternata, i.e. none of the variables met the 0.05 significance level for entry into the model. In the case of astringency 9% of the variation in astringency was explained by SS (Table 12). The model R-square values for sweet taste and sour taste were and , respectively. Mangiferin (X1) explained 40.68% of the variance in the intensity of sweet taste, albeit negatively. For sour taste, 3-hydroxyphloretin-3-5 -di-c-hexoside (D1), hesperidin (Fl3) and 155
169 phloretin-3-5 -di-c-glucoside (D2) explained 33.22% of the variance, with the first two compounds contributing negatively (D1 & Fl3) and the third compound (D2) contributing positively to the model Combined Cyclopia species data set The combined data set of the Cyclopia species was analysed similarly to the individual data sets. Table 13 displays the Pearson s correlation results of the combined data set. As expected with a much larger data set, there were a number of significant (p 0.05) correlations between the compositional parameters and sensory attributes. Only significant correlations larger than 0.3 will be discussed from this point on. A range of low to high negative correlations (p 0.05) were observed between sweet taste and iriflophenone-3-c-glucoside-4-o-glucoside (B1) (r = ), maclurin-di-o,c-hexoside (B2) (r = ), maclurin-3-c-glucoside (B3) (r = ), iriflophenone-3-c-glucoside (B4) (r = ), naringenin-o-hexose-o-deoxyhexose A (Fl1) (r = ), naringenin-o-hexose-o-deoxyhexose B (Fl2) (r = ), vicenin-2 (Fv1) (r = ), mangiferin (X1) (r = ), isomangiferin (X2) (r = ), tetrahydroxyxanthone-c-hexoside isomer A (X3) (r = ), tetrahydroxyxanthone-chexoside isomer B (X4) (r = ), tetrahydroxyxanthone-di-o,c-hexoside (X5) (r = ), soluble solids (r = ), and total polyphenols (r = ). Only four positive correlations (r > 0.3; p 0.05) were observed between sweet taste and the phenolic compounds, i.e. 3- hydroxyphloretin-3-5 -di-c-hexoside (D1) (r = 0.308), phloretin-3-5 -di-c-glucoside (D2) (r = 0.388), eriocitrin (Fl4) (r = 0.317) and scolymoside (Fv2) (r = 0.315). Similarly, sour taste had low (r > 0.3), but positive correlations with only two compounds, i.e. maclurin-di-o,c-hexoside (B2) (r = 0.340) and mangiferin (X1) (r = 0.312). Low to strong positive correlations were obtained between bitter taste and iriflophenone-3-c-glucoside-4-oglucoside (B1) (r = 0.468), maclurin-di-o,c-hexoside (B2) (r = 0.737), maclurin-3-c-glucoside (B3) (r = 0.706), iriflophenone-3-c-glucoside (B4) (r = 0.633), naringenin-o-hexose-o-deoxyhexose A (Fl1) (r = 0.408), naringenin-o-hexose-o-deoxyhexose B (Fl2) (r = 0.437), mangiferin (X1) (r = 0.755), isomangiferin (X2) (r = 0.644), tetrahydroxyxanthone-c-hexoside isomer A (X3) (r = 0.656), tetrahydroxyxanthone-c-hexoside isomer B (X4) (r = 0.664) and total polyphenols (r = 0.312). Bitter taste also correlated negatively with eriocitrin (Fl4) (r = ) and scolymoside (Fv2) (r = ). Astringency formed a strong positive correlation (p 0.05) with iriflophenone-3-cglucoside-4-o-glucoside (B1) (r = 0.527), iriflophenone-3-c-glucoside (B4) (r = 0.500), vicenin-2 (Fv1) (r = 0.649), mangiferin (X1) (r = 0.674), isomangiferin (X2) (r = 0.701) and tetrahydroxyxanthone-di-o,c-hexoside (X5) (r = 0.639), soluble solids (SS) (r = 0.606) and total polyphenols (TP) (r = 0.630). Low, negative (p 0.05) correlations were observed between astringency and 3-hydroxyphloretin-3-5 -di-c-hexoside (D1) (r = ), phloretin-3-5 -di-cglucoside (D2) (r = ) and eriodictyol-o-glucoside (Fl5) (r = ). The PLS plot for sweet taste (Fig. 11a) shows its association with phloretin-3-5 -di-cglucoside (D2), 3-hydroxyphloretin-3-5 -di-c-hexoside (D1), scolymoside (Fv2), eriodictyol-o- 156
170 glucoside (Fl5) and eriocitrin (Fl4), as indicated on dimension 1. This indicates that the samples that scored high for sweet taste also contained high levels of these phenolic compounds in the infusions. Interestingly, these compounds are all situated on the left side of dimension 1 of Fig. 11b, 11c and 11d, indicating a lesser association with the attributes sour taste, bitter taste and astringency, respectively. The results obtained from the step-wise regression analysis are summarised in Table 14. In this case a larger number of variables were entered into the model than when models for each species were developed. Furthermore, in two instances two compounds were removed from the model, i.e. when other compounds were able to contribute more effectively to the model. The model R-square values were for sweet taste, for sour taste, for bitter taste and for astringency. Mangiferin (X1), iriflophenone-3-c-glucoside (B4) and scolymoside (Fv2) explained a moderate 50.74% of the variance in sweet taste intensity. Of these predictors, mangiferin (X1) content had an inverse effect. Only 27.83% of the variance in sour taste intensity was explained by mangiferin (X1), naringenin-o-hexose-o-deoxyhexose A (Fl1), tetrahydroxyxanthone-di-o,c-hexoside (X5), hesperidin (Fl3), iriflophenone-3-c-glucoside-4-oglucoside (B1) and SS. Of these parameters only mangiferin (X1) and SS contributed positively to the sour taste model. Mangiferin (X1), maclurin-di-o,c-hexoside (B2), naringenin-o-hexose-odeoxyhexose A (Fl1), SS and tetrahydroxyxanthone-c-hexoside isomer B (X4) explained a reasonably high percentage (81.40%) of the variance in bitter taste intensity. Of the latter variables, only mangiferin (X1), maclurin-di-o,c-hexoside (B2), and tetrahydroxyxanthone-chexoside isomer B (X4) contributed positively to the bitter taste model, especially mangiferin with a substantial partial R-square value of For the astringency model, the compounds tetrahydroxyxanthone-di-o,c-hexoside (X5), eriocitrin (Fl4), mangiferin (X1), tetrahydroxyxanthone-c-hexoside isomer B (X4) and maclurin-di-o,c-hexoside (B2) explained a reasonably high percentage (69.54%) of the variance. Of these, only tetrahydroxyxanthone-di- O,C-hexoside (X5), mangiferin (X1) and maclurin-di-o,c-hexoside (B2) contributed positively to the astringency model. 4. DISCUSSION OF RESULTS Enjoyment of a cup of honeybush tea depends on its aroma, flavour and taste. Cronje (2010) recently identified a number of aroma-impact volatile compounds. To date little is known about the non-volatile compounds that contribute to the taste and astringency of this beverage. Theron (2012) indicated that mangiferin might contribute to the bitter taste of honeybush infusions. A limited number of phenolic compounds have been quantified, i.e. mangiferin, isomangiferin, eriocitrin, narirutin and hesperidin with compounds A, B, C and F, quantified but unidentified (Theron, 2012). Since then advances have been made in phenolic characterisation of several Cyclopia species and other major phenolic compounds belonging to the sub-classes benzophenones and dihydrochalcones have been identified (De Beer et al., 2012; Beelders et al., 2014a, b; Schulze et al., 2014). In view of this, a large sample set, consisting of four Cyclopia 157
171 species of commercial importance, was sourced (Fig. 1) for the present study, primarily to identify compounds that could potentially predict the intensities of the basic taste modalities and astringency. Different statistical methodologies were therefore investigated to identify potential candidate predictors of the basic taste modalities and astringency in the respective Cyclopia species. 4.1 Phenolic content and sensory intensities Substantial variation was observed between the SS content, TP content and phenolic composition of the infusions of the different Cyclopia species, as expected from previous studies showing both quantitative and qualitative differences between a number of Cyclopia species (Joubert et al., 2003, 2008; De Beer & Joubert, 2010; Theron, 2012). In the present study several compounds could be quantified in the infusions of Cyclopia species tested that were previously unidentified (Beelders et al., 2014 a, b). Only mangiferin (X1) and isomangiferin (X2), both xanthones, hesperidin (Fl3), a flavanone, and vicenin-2 (Fv1), a flavone, were present in all four Cyclopia species (Table 3). The species included in the present study ensured a large variation in the content of some of the phenolic compounds, in particular mangiferin and isomangiferin. Cyclopia genistoides and C. longifolia represented species containing high levels of these xanthones, while C. maculata and C. subternata contained intermediate and low levels, respectively. Variation in the phenolic content within a Cyclopia species could be a result of external factors such as different harvesting times, harvest frequency, seed sources and variation in climate as indicated by Joubert et al. (2014). Although the role of such factors on sensory quality was not the purpose of this study, samples were specifically selected to include possible causes of variation in the phenolic content to aid model building. In addition, samples subjected to different fermentation conditions were included as processing conditions have been shown to affect composition (Du Toit & Joubert, 1999; Theron, 2012). Notwithstanding the large variation in the content of some of the phenolic compounds, the average intensity ranges for the respective sensory attributes were relatively small (<10) for the different Cyclopia species (Table 3). The only exception was the bitter intensity of C. genistoides and C. longifolia, i.e. an approximate mean range of 20 on a 100-point scale. In sensory analysis terms, a range of 20 on a 100-point scale is considered quite substantial. When considering the combined data set (Table 4), comprising data of the four Cyclopia species, the average range for the intensities of sweet taste and sour taste was quite similar to that of the individual species, i.e. 10, whereas the mean intensity range for astringency increased to approximately 17 and that of bitterness to approximately 25. The mean intensities of the respective sensory attributes also differed per species. The mean intensity of bitterness in C. genistoides was more than 12, measured on a 100-point scale and less than 5 in the other three species (Table 3). This clearly indicates that mangiferin content alone is not responsible for the bitterness of its infusions. The mean intensities of astringency were quite similar in all four Cyclopia species, ranging between for C. subternata and
172 for C. longifolia. The mean intensities of sweet taste were also quite similar in the four Cyclopia species, ranging between for C. genistoides and for C. subternata. The mean intensity of sour was 5 (barely perceptible) in all four species, and is thus considered of limited importance (Table 3). 4.2 Prediction of taste and mouthfeel based on phenolic composition To potentially identify candidate predictors of sweet taste, sour taste, bitter taste, as well as astringency, in the respective Cyclopia species, based on composition, Pearson s correlation analysis, PLS and step-wise regression analysis were conducted. Pearson s correlation analysis was performed to determine the correlation between the phenolic compounds and the respective taste and mouthfeel attributes. In most instances the correlations were not significant (p > 0.05), especially in C. genistoides, C. maculata and C. subternata. When significant, the r-values were mostly low (+ 0.30) or moderate (+ 0.50), indicating that the respective phenolic compounds did not correlate strongly with the four sensory attributes. There were, however, a few reasonably high r-values (r > 0.70) indicating a strong correlation between individual composition parameters and sensory attributes, especially when considering C. longifolia (Table 7) and the combined species (Table 13). In C. longifolia the compounds mangiferin (X1) and isomangiferin (X2) correlated strongly with bitter taste, as well as astringency. When combining the data sets of the four Cyclopia species, bitter taste correlated strongly with mangiferin (X1), maclurin-di-o,c-hexoside (B2) and maclurin-3-c-glucoside (B3), while astringency correlated strongly with isomangiferin (X2). Although the concentrations of the respective phenolic compounds within a Cyclopia species, or over species, varied considerably, and are therefore ideal for correlation analysis, the low r-values could possibly be attributed to the limited variation in the intensities of the individual sensory attributes. Partial least squares (PLS) regression was also performed to ascertain the association of each individual sensory attribute with the full range of compositional parameters within a species, as well as over species. The PLS plots illustrate the correlation between the respective taste or mouthfeel attribute and all the compositional parameters. PLS takes into account the correlation of all the compositional parameters and not just one at a time, as done by Pearson s correlation analysis and step-wise regression analysis. When considering the individual Cyclopia species separately, the respective PLS plots (Fig. 7 10) indicated that the individual sensory attributes did not strongly associate with any specific compositional parameters. More associations were established, however, when the data sets of the four Cyclopia species were combined. In this case the PLS plots (Fig. 11) showed that five phenolic compounds, phloretin-3-5 -di-c-glucoside (D2), 3-hydroxyphloretin-3-5 -di-c-hexoside (D1), scolymoside (Fv2), eriodictyol-o-glucoside (Fl5) and eriocitrin (Fl4) associated positively with sweet taste on the right side of the PLS plot (Fig. 11a), showing some sort of predictive ability. For sour taste (Fig. 11b), bitter taste (Fig. 11c) and astringency (Fig. 11d), these five compounds had a negative association with the latter three sensory attributes, i.e. all five compounds were situated on the opposite side of the respective PLS 159
173 plots on dimension 1. This illustrates that in this sample set (N = 204), high levels of D1, D2, Fv2, Fl4 and Fl5 correlate with low intensities of sour taste, bitter taste, as well as astringency. Finally step-wise regression analysis was used to investigate the predictive value of the phenolic compounds, SS and TP, for the intensity of each sensory attribute, within species, but also for the combined data set of the four Cyclopia species. This procedure first selects the independent variable (compositional parameters) for which the regression has the highest R- squared. The P-value must be below the tolerance level chosen in advance. At the next and each following step, the variable that increases R-squared the most is selected. After each step in which a variable is added, all variables in the model are checked for significance below the specified tolerance level. This process continues until none of the remaining variables increase the R- squared of the model below the specified tolerance level (Snedecor & Cochran, 1989). A concern to be kept in mind when interpreting step-wise regression model results is that the procedure yields a single final model, although in practice there are often several equally good models available (Snedecor & Cochran, 1989). Another concern is that collinearity in the data may result in different models using different selection criteria. For example, when two phenolic compounds are highly correlated to each other and to the dependent variable, the step-wise regression procedure will only select one of the compounds to be present in the model. It must also be considered that the compounds present in the model do not necessarily correlate positively with the dependent variable, as indicated by the parameter estimates, but they are responsible for explaining the variation in the dependent variable. For example, a compound such as mangiferin has previously been associated with bitter taste (Theron, 2012). In a model with sufficient variance for sweet taste, a compound such as mangiferin should have a negative parameter estimate, indicating that the presence of this compound in the infusion will not increase the sweet taste of the product in question, but predict a lower intensity value. In this study the respective step-wise regression models, Table 6 (C. genistoides), Table 8 (C. longifolia), Table 10 (C. maculata) and Table 12 (C. subternata), as well as Table 14 (based on all four species), show that an assortment of compounds were used to build each model; in some instances the independent variables (compositional parameters) had negative parameter estimates and in other instances positive parameter estimates. The prediction model for C. genistoides (Table 6) and C. longifolia (Table 8) resulted in relatively high model R-square values for bitter taste, indicating that 74.22% of the variation in the bitter intensity of C. genistoides could be explained by hesperidin (Fl3), SS, naringenin-o-hexose-o-deoxyhexose A (Fl1) and mangiferin (X1), while mangiferin (X1), eriocitrin (Fl4) and iriflophenone-3-c-glucoside (B4) explained 73.05% of the variation within the bitter intensity of C. longifolia. The fact that mangiferin (X1) had a positive parameter estimate in the model for bitter taste of C. genistoides, and a negative parameter estimate in that of C. longifolia shows that a combination of variables build the model and collectively predict the intensity of a specific sensory attribute. 160
174 Furthermore, the final model R-square values of the respective dependent variables (sensory attributes) differed considerably (Tables 6, 8, 10, 12 and 14). The latter is clearly illustrated in Table 14, which shows that the final model R-square value for sour taste was low (0.2783), whereas that of bitter taste was substantially higher (0.8140). This difference can possibly be attributed to the fact that the intensity range for sour taste over all species was fairly narrow (0.5 to 10.17), whereas the intensity range for bitter taste over all species was substantially wider (0.0 to 25.7). Similar tendencies were observed in a study on rooibos, where it was indicated that a limited sensory intensity range, as well as other factors such as variation in plant material or processing conditions, resulted in very low model R-square values (Jolley, 2014). Although the prediction models of the current study cannot be guaranteed to be optimal in any specific case, it is expected that for future sample sets, the percentage of variance explained would be reasonably similar to that found in the present study. It is, however, suggested that these models should be validated with a new data set, large enough to capture sufficient variation, before use. A preliminary validation was conducted using 24 randomly selected batches as validation set to ascertain how well the validation sample could be predicted using the model values of the training set. It was confirmed that the percentage variance explained in test and validation sets were similar (results not shown) (Addendum D; Fig. 1D Fig. 4D). In view of the above, it is clear that the step-wise regression model used in this study only identified a combination of compositional parameters potentially influencing (positively and/or negatively) the variation in the respective sensory attribute intensities. The fact that most of the model R-square values were low indicates that other factors are definitely influencing the predictive ability of the model. When the bitter intensity is plotted against the sum of mangiferin (X1) and isomangiferin (X2) concentrations (mg/l), i.e. including data of all four Cyclopia species (Fig. 12), it is clear that C. maculata and C. subternata are both low in bitter intensity, as well as mangiferin (X1) and isomangiferin (X2) concentration. This is, however, not true for the other two Cyclopia species, C. genistoides and C. longifolia, while the respective processing treatments within species show noticeable variable bitter intensities and mangiferin (X1) and isomangiferin (X2) concentrations. Short fermentation times (8h), in particular, contributed to C. longifolia samples having high xanthone concentrations and high scores for bitter intensity. Several C. longifolia samples had high xanthone concentrations (>200 mg/l) yet low bitter intensity (<10), indicating that other factors also play a role. Similar results are indicated when bitter intensity is plotted against the benzophenone concentration (mg/l) (Fig. 13). The diverse patterns of bitter intensity versus compound concentration thus indicate that external factors come into play. It is possible that certain compounds can work as taste modulators, or that compounds can work in combination with one another to produce certain taste and mouthfeel attributes (Reichelt et al., 2010). Hesperidin is the precursor of the aglycone, hesperetin and was previously identified as a sweetness enhancer (Ley et al., 2008; 2011), as well as a bitter-masking compound (Reichelt et al., 2010), while the aglycone of eriocitrin, eriodictyol, is a bitter-masking compound (Kinghorn et 161
175 al., 2010). The dihydrochalcone aglycone, phloretin, has been demonstrated to modulate bitterness, but could also impart bitterness at high concentrations (Ley et al., 2012). It is clear that the model cannot account for the correlations between compounds or the modulating effects of certain compounds. It is furthermore possible that non-phenolic compounds such as amino acids can result in a bitter taste (Solms, 1969). Solms (1969) found that leucine, tryptophan, phenylalanine and tyrosine all elicit bitter taste in their L-form, but are sweet in the D-form, thus indicating that small changes in the structure of a compound can influence a basic taste modality. Beelders et al. (2014b) were the first group to identify the two aromatic amino acids, tyrosine and phenylalanine, in C. genistoides and the genus Cyclopia. Several other factors such as compound size and structure could also influence the taste and mouthfeel of a compound (Peleg et al., 1999). As mentioned, these are all factors that the model cannot take into account. In future other statistical methods should also be investigated to determine if a better model can be produced (Snedecor & Cochran, 1989). 5. CONCLUSIONS This study investigated the phenolic composition of four Cyclopia species and their relationship with the taste and mouthfeel attributes within species and over all four species. It was observed that the phenolic compounds present differed between Cyclopia species. Hesperidin (Fl3), vicenin- 2 (Fv1), mangiferin (X1) and isomangiferin (X2) were the only phenolic compounds present in the infusions of all four species in sufficient levels to be quantified by HPLC-DAD. Cyclopia genistoides and C. longifolia had the highest content of the xanthone, mangiferin (X1), as well as the highest bitter intensities. Different statistical methods were used to determine the potential phenolic predictors of the taste (sweet, sour and bitter) and mouthfeel attributes. The respective statistical methodologies were reasonably successful in identifying potential candidate predictors, but further studies are essential to confirm their predictive ability and to validate the step-wise regression models obtained in this study. Validation would require the use of a large, new sample set, comprising sufficient variation, both in composition and intensity of the sensory attributes. Limitations of the step-wise regression method were detected and discussed in this study and it is suggested that other statistical methods be investigated. On a composition level, studies should also be undertaken to identify taste-active phenolic compounds and to determine their contribution to the taste and mouthfeel properties of the Cyclopia infusions. Furthermore, expanding the range of intensities used during descriptive sensory analysis might also improve the prediction ability based on composition. 162
176 6. REFERENCES Abdi, H. (2007). Partial least square regression, PLS regression. In: Niel Salkind (Ed.) Encyclopaedia of Measurement and Statistics. Thousand Oaks (CA): Sage, USA. Arnold, R. A., Noble, A.C. & Singleton, V.L. (1980). Bitterness and astringency of phenolic fractions in wine. Journal of Agricultural and Food Chemistry, 28, Aronson, J. & Ebeler, S.E. (2004). Effect of polyphenol compounds on the headspace volatility of flavors. American Journal of Enology and Viticulture, 55, Arthur, H., Joubert, E., De Beer, D., Malherbe, C. J. & Witthuhn, R. (2011). Phenylethanoid glucosides as major antioxidants in Lippia multiflora herbal infusion and their stability during steam pasteurisation of plant material. Journal of Food Chemistry, 127, Bajec, M.R. & Pickering, G.J. (2008). Astringency: mechanisms and perception. Critical Reviews in Food Science and Nutrition, 48, Becker, M. (2013). Market maturation: innovation and science drive antioxidants forward. Nutraceutical World, 16, Beelders, T., Brand, D.J., De Beer, D., Malherbe, C.J., Sithandiwe, E.M, Muller, C.J.F. & Joubert, E. (2014a). Benzophenone C- and O-glucosides from Cyclopia genistoides (honeybush) inhibit mammalian α-glucosidase. Journal of Natural Products, doi.org/ /np , 10 October Beelders, T., De Beer, D., Stander, M.A. & Joubert, E. (2014b). Comprehensive phenolic profiling of Cyclopia genistoides (L.) vent. by LC-DAD-MS and MS/MS reveals novel xanthone and benzophenone constituents. Molecules, 19, Bravo, L. (1998). Polyphenols: chemistry, dietary sources, metabolism, and nutritional significance. Nutrition Reviews, 56, Chun, O.K., Chung, S.J. & Song, W.O. (2007). Estimated dietary flavonoid intake and major food sources of U.S. adults. Journal of Nutrition, 137, Cronje, J.C. (2010). Chemical characterisation of the aroma of honeybush (Cyclopia) species. PhD Dissertation, University of Stellenbosch, Stellenbosch, South Africa. De Beer, D. & Joubert, E. (2010). Development of HPLC for Cyclopia subternata phenolic compound analysis and application to other Cyclopia spp. Journal of Food Composition and Analysis, 23, De Beer, D., Schulze, A.E., Joubert, E., De Villiers, A., Malherbe, C.J. & Stander, M.A. (2012). Food ingredients extracts of Cyclopia subternata (honeybush): variation in phenolic composition and antioxidant capacity. Molecules, 17, Du Toit, J. & Joubert, E. (1999). Optimization of the fermentation parameters of honeybush tea (Cyclopia). Journal of Food Quality, 22, Gawel, R. (1998). Red wine astringency: a review. Australian Journal of Grape and Wine Research, 4,
177 Green, B.G. (1993). Oral astringency: a tactile component of flavour. Acta Psychologica, 84, Jolley, B. (2014). Development of quality control tools and a taste prediction model for rooibos. MSc Thesis, University of Stellenbosch, Stellenbosch, South Africa. Jolliffe, I.T. (2002). Principal component analysis, 2 nd edition. New York: Springer-Verslag. Joubert, E., De Beer, D., Hernández, I. & Munné-Bosch, S. (2014). Accumulation of mangiferin, isomangiferin, iriflophenone-3-c-β-glucoside and hesperidin in honeybush leaves (Cyclopia genistoides Vent.) in response to harvest time, harvest interval and seed source. Industrial Crops and Products, 56, Joubert, E., Otto, F., Grüner, S. & Weinreich, B. (2003). Reversed-phase HPLC determination of mangiferin, isomangiferin and hesperidin in Cyclopia and the effect of harvesting date on the phenolic composition of C. genistoides. European Food Research and Technology, 216, Joubert, E., Richards, E.S., van der Merwe, J.D., De Beer, D., Manley, M. & Gelderblom, W.C.A. (2008). Effect of species variation and processing on phenolic composition and in vitro antioxidant activity of aqueous extracts of Cyclopia spp. (honeybush tea). Journal of Agricultural and Food Chemistry, 56, King, B., & J. Solms. (1982). Interactions of volatile flavor compounds with propyl gallate and other phenols as compared to caffeine. Journal of Agricultural and Food Chemistry, 30, Kinghorn, A.D., Chin, Y., Pan, L. & Jia, Z. (2010). Natural products as sweeteners and sweetness modifiers. In: Comprehensive Natural Products II: Chemistry and Biology, Volume 3: Development and Modification of Bioactivity (edited by Mander, L. & Lui, H.B.). Elsevier: New York, USA, Pp Lesschaeve, I. & Noble, A.C. (2005). Polyphenols: factors influencing their sensory properties and their effects on food and beverage preferences. The American Journal of Clinical Nutrition, 81, 330S-335S. Ley, J.P. (2008). Masking bitter taste by molecules. Chemosensory Perception, 1, Ley, J.P., Dessoy, M., Paetz, S., Blings, M., Hoffmann-Lücke, P., Reichelt, K.V., Krammer, G.E., Pienkny, S., Brandt, W. & Wessjohann, L. (2012). Identification of enterodiol as a masker for caffeine bitterness by using a pharmacophore model based on structural analogues of homoeriodictyol. Journal of Agricultural and Food Chemistry, 60, Ley, J., Kindel, G., Paetz, S., Riess, T., Haug, M., Schmidtmann, R. & Kramer, G. (2008). Use of hesperetin for enhancing the sweet taste. US Patent 2008/ A1. Ley, J., Kindel, G., Paetz, S., Schmidtmann, R., Riess, T., Haug, M. & Kramer, G. (2011). Use of hesperetin for enhancing the sweet taste. EP A2. Ley, J.P., Krammer, G., Reinders, G., Gatgield, I.L. & Bertram, H.J. (2005). Evaluation of bitter masking flavanones from Herba Santa (Eriodictyoncalifornicum (H. & A.) Torr., Hydrophyllaceae). Journal of Agricultural and Food Chemistry, 53,
178 Li, X., Staszewski, L., Xu, H., Durick, K., Zoller, M. & Adler, E. (2002). Human receptors for sweet and umami taste. Proceedings of the National Academy of Science, USA, 99, Næs, T., Brockhoff, P.B. & Tomic, O. (2010). Statistics for sensory and consumer science. New York, USA: Wiley. Narukawa, M., Kimata, H., Noga, C. & Watanabe, T. (2010). Taste characterisation of green tea catechins. International Journal of Food Science and Technology, 45, Payne, C., Bowyer, P.K., Henderich, M. & Bastian, S.E.P. (2009). Interaction of grape seed procyanidins with oral epithelial cells. Food Chemistry, 115, Peleg, H., Gacon, K., Schlich, P. & Noble, A.C. (1999). Bitterness and astringency of flavan-3-ol monomers, dimers and trimmers. Journal of the Science of Food and Agriculture, 79, Ramos Da Conceicao Neta, E., Johanningmeier, S.D. & McFeeters, R.F. (2007). The chemistry and physiology of sour taste a review. Journal of Food Science, 72, R33-R38. Reichelt, K.V., Peter, R., Paetz, S., Roloff, M., Ley, J.P., Krammer, G.E. & Engel, K-H. (2010). Characterisation of flavour modulating effects in complex mixtures via high temperature liquid chromatography. Journal of Agricultural and Food Chemistry, 58, Roland, W.S.U., Van Buren, L., Gruppen, H., Driesse, M., Gouka, R.J., Smit, G. & Vincken, J-P. (2013). Bitter taste receptor activation by flavonoids and isoflavonoids: modelled structural requirements for activation of htas2r14 and htas2r39. Journal of Agricultural and Food Chemistry, 61, Schulze, A. E., De Beer, D., De Villiers, A., Manley, M. & Joubert, E. (2014). Chemometric analysis of chromatographic fingerprints shows potential of Cyclopia maculata (Andrews) kies for production of standardised extracts with high xanthone content. Journal of Agricultural and Food Chemistry, 62, Shapiro, S.S. & Wilk, M.B. (1965). An analysis of variance test for normality (complete samples). Biometrika, 52, Snedecor, G.W. & Cochran, W.G. (1989). Statistical methods. Iowa State University Press, USA. Solms, J. (1969). The taste of amino acids, peptides, and proteins. Journal of Agriculture and Food Chemistry, 17, Theron, K.A. (2012). Sensory and phenolic profiling of Cyclopia species (Honeybush) and optimisation of the fermentation conditions. MSc Thesis, University of Stellenbosch, Stellenbosch, South Africa. Trivedi, B.P. (2012). Hardwired for taste. Nature Outlook, 486, s7-s9. Yarmolinsky, D.A., Zuker, C.S. & Ryba, N.J.P. (2009). Common sense about taste: from mammals to insects. Cell, 139, Yu, P., Yeo, A.S.-L., Low, M.-Y. & Zhou, W. (2014). Identifying key non-volatile compounds in ready-to-drink green tea and their impact on taste profile. Food Chemistry, 155,
179 Table 1 Column, mobile phase and gradient profile for HPLC analysis of infusions of C. genistoides, C. maculata, C. subternata and C. longifolia. Species Column Mobile phase Gradient profile C. genistoides a Kinetex column (150 x 4.6 mm ID, 2.6 µm; Phenomenex) C. maculata b Gemini-NX C18 column (150 x 4.6 mm; 3 µm; Phenomenex) C. subternata c Gemini-NX C18 column (150 x 4.6 mm; 3 µm; Phenomenex) C. longifolia d Kinetex C18 column (150 x 4.6 mm; 2.6 µm; Phenomenex) a Beelders et al. (2014a). b Schulze et al. (2014). c De Beer et al. (2012). d Schulze (unpublished). A = methanol B = acetronitrile C = 1% formic acid A = acetronitrile B = 2% acetic acid A = acetronitrile B = 2% acetic acid A = acetonitrile B = 0.1% formic acid 0 min - 2.5% solvent A; 2.5% solvent B 5 min - 2.5% solvent A; 2.5% solvent B 45 min % solvent A; 12.5% solvent B 55 min - 25% solvent A; 25% solvent B 56 min - 25% solvent A; 25% solvent B 57min - 2.5% solvent A; 2.5% solvent B 65 min - 2.5% solvent A; 2.5% solvent B 0 min - 8% solvent A 2 min - 8% solvent A 31 min - 38% solvent A 32 min - 50% solvent A 33 min - 50% solvent A 34 min - 8% solvent A 44 min - 8% solvent A 0 min - 8% solvent A 2 min - 8% solvent A 27 min - 38% solvent A 28 min - 50% solvent A 29 min - 50% solvent A 30 min - 8% solvent A 40 min - 8% solvent A 0 min - 4.5% solvent A 4 min - 4.5% solvent A 22 min - 8% solvent A 49 min - 20% solvent A 51 min - 50% solvent A 52 min - 50% solvent A 53 min - 4.5% solvent A 59 min - 4.5% solvent A 166
180 Table 2 Notations used to indicate individual phenolic compounds, total polyphenols and soluble solids in Tables and Figures. Notations used in Tables and Figures Class Compositional parameters B1 Benzophenone Iriflophenone-3-C-glucoside-4-O-glucoside B2 Benzophenone Maclurin-di-O,C-hexoside a B3 Benzophenone Maclurin-3-C-glucoside B4 Benzophenone Iriflophenone-3-C-glucoside D1 Dihydrochalcone 3-Hydroxyphloretin-3-5 -di-c-hexoside b D2 Dihydrochalcone Phloretin-3-5 -di-c-glucoside c Fl1 Flavanone Naringenin-O-hexose-O-deoxyhexose A d Fl2 Flavanone Naringenin-O-hexose-O-deoxyhexose B d Fl3 Flavanone Hesperidin Fl4 Flavanone Eriocitrin Fl5 Flavanone Eriodictyol-O-glucoside Fv1 Flavone Vicenin-2 e (apigenin-6,8-di-c-glucoside) Fv2 Flavone Scolymoside (luteolin-7-o-rutinoside) X1 Xanthone Mangiferin X2 Xanthone Isomangiferin X3 Xanthone Tetrahydroxyxanthone-C-hexoside isomer A f X4 Xanthone Tetrahydroxyxanthone-C-hexoside isomer B f X5 Xanthone Tetrahydroxyxanthone-di-O,C-hexoside f TP Total polyphenols g SS Soluble solids h a Quantified as maclurin-3-c-glucoside equivalents. b Quantified as aspalathin equivalents. c Quantified as nothofagin equivalents. d Quantified as narirutin equivalents. e Quantified as luteolin equivalents. f Quantified as mangiferin equivalents. g Quantified as galic acid equivalents. Stellenbosch University h Gravametric mass.
181 Table 3 Minimum, maximum, mean and standard deviation for the intensities of the respective sensory attributes (scored on a 100 point scale), as well as the compositional parameters a (mg/l in water) for each species. C. genistoides C. longifolia C. maculata Variable Minimum Maximum Mean Std. deviation Sweet Sour Bitter Astringent SS TP B B B B D Fl Fl Fl Fv X X X X Sweet Sour Bitter Astringent SS TP B B B Fl Fl Fv Fv X X X Sweet Sour Bitter Astringent SS TP Fl Fl Fl Fv X X
182 C. subternata Sweet Sour Bitter Astringent SS TP B D D Fl Fl Fv Fv X X a The notations used for the compositional parameters are explained in Table
183 Table 4 Minimum, maximum, mean and standard deviation for the intensities of the respective sensory attributes (scored on a 100 point scale), as well as the compositional parameters a (mg/l in water) for the full data set, i.e. all four Cyclopia species. Variable Minimum Maximum Mean Std. deviation Sweet Sour Bitter Astringent SS TP B B B B D D Fl Fl Fl Fl Fl Fv Fv X X X X X a The notations used for the compositional parameters are explained in Table
184 Table 5 Pearson's correlation table for taste, mouthfeel and compositional parameters a of C. genistoides infusions. Variables Sweet Sour Bitter Astringent SS TP B1 B2 B3 B4 D1 Fl1 Fl2 Fl3 Fv1 X1 X2 X3 X4 Sweet Sour Bitter Astringent SS TP B B B B D Fl Fl Fl Fv X X X X Values in bold are significantly different from 0 (p = 0.05). Significant correlations between the taste and mouthfeel attributes and the other parameters are highlighted in yellow. a The notations used for the compositional parameters are explained in Table
185 Table 6 Step-wise regression model indicating the percentage variation in sweet, sour and bitter taste and astringent mouthfeel explained by the compositional parameters of C. genistoides infusions. Sensory attributes Step Variable entered Parameter estimate Partial R-square Model R-square Sweet taste 1 Naringenin-O-hexose-O-deoxyhexose B (Fl2) Sour taste Bitter taste Astringent mouthfeel The final model R-square value is highlighted in yellow. Stellenbosch University 1 Hesperidin (Fl3) Naringenin-O-hexose-O-deoxyhexose A (Fl1) Hydroxyphloretin-3-5 -di-c-hexoside (D1) Total polyphenols (TP) Hesperidin (Fl3) Soluble solids (SS) Naringenin-O-hexose-O-deoxyhexose A (Fl1) Mangiferin (X1) Tetrahydroxyxanthone-C-hexoside isomer A (X3) Maclurin-di-O,C-hexoside (B2) Naringenin-O-hexose-O-deoxyhexose B (Fl2)
186 Table 7 Pearson's correlation table for taste, mouthfeel and compositional parameters a of C. longifolia infusions. Variables Sweet Sour Bitter Astringent SS TP B1 B3 B4 Fl3 Fl4 Fv1 Fv2 X1 X2 X5 Sweet Sour Bitter Astringent SS TP B B B Fl Fl Fv Fv X X X Values in bold are significantly different from 0 (p = 0.05). Significant correlations between the taste and mouthfeel attributes and the other parameters are highlighted in yellow. a The notations used for the compositional parameters are explained in Table
187 Table 8 Step-wise regression model indicating the percentage variation in sweet, sour and bitter taste and astringent mouthfeel explained by the compositional parameters of C. longifolia infusions. Sensory attributes Step Variable entered Parameter estimate Partial R-square Model R-square 1 Mangiferin (X1) Sweet taste 2 Iriflophenone-3-C-glucoside (B4) Scolymoside (Fv2) Vicenin-2 (Fv1) Sour taste 1 Mangiferin (X1) Iriflophenone-3-C-glucoside (B4) Mangiferin (X1) Bitter taste 2 Eriocitrin (Fl4) Iriflophenone-3-C-glucoside (B4) Mangiferin (X1) Astringent mouthfeel 2 Eriocitrin (Fl4) Soluble solids (SS) Iriflophenone-3-C-glucoside (B4) The final model R-square value is highlighted in yellow. Stellenbosch University 174
188 Table 9 Pearson's correlation table for taste, mouthfeel and compositional parameters a of C. maculata infusions. Variables Sweet Sour Bitter Astringent SS TP Fl3 Fl4 Fl5 Fv1 X1 X2 Sweet Sour Bitter Astringent SS TP Fl Fl Fl Fv X X Values in bold are significantly different from 0 (p = 0.05). Significant correlations between the taste and mouthfeel attributes and the other parameters are highlighted in yellow. a The notations used for compositional parameters are explained in Table
189 Table 10 Step-wise regression model indicating the percentage variation in sweet, sour and bitter taste and astringent mouthfeel explained by the compositional parameters of C. maculata infusions. Sensory attributes Step Variable entered Parameter estimate Partial R-square Model R-square Sweet taste 1 Mangiferin (X1) Hesperidin (Fl3) Sour taste 1 Mangiferin (X1) Bitter taste 1 Mangiferin (X1) Astringent mouthfeel 1 Eriodictyol-O-glucoside (Fl5) Isomangiferin (X2) The final model R-square value is highlighted in yellow. Stellenbosch University 176
190 Table 11 Pearson's correlation table for taste, mouthfeel and compositional parameters a of C. subternata infusions. Variables Sweet Sour Bitter Astringent SS TP B1 D1 D2 Fl3 Fl4 Fv1 Fv2 X1 X2 Sweet Sour Bitter Astringent SS TP B D D Fl Fl Fv Fv X X Values in bold are significantly different from 0 (p = 0.05). Significant correlations between the taste and mouthfeel attributes and the other parameters are highlighted in yellow. a The notations used for the compositional parameters are explained in Table
191 Table 12 Step-wise regression model indicating the percentage variation in sweet, sour and bitter taste and astringent mouthfeel explained by the compositional parameters of C. subternata infusions. Sensory attributes Step Variable entered Parameter estimate Partial R-square Model R-square Sweet taste 1 Mangiferin (X1) Sour taste Bitter taste 1 3-Hydroxyphloretin-3-5 -di-c-hexoside (D1) Hesperidin (Fl3) Phloretin-3-5 -di-c-glucoside (D2) No variable met the 0.05 significance level for entry into the model Astringent mouthfeel 1 Soluble solids (SS) The final model R-square value is highlighted in yellow. Stellenbosch University 178
192 Table 13 Pearson's correlation table for taste, mouthfeel and compositional parameters a of all four Cyclopia species. Variables SS TP B1 B2 B3 B4 D1 D2 Fl1 Fl2 Fl3 Fl4 Fl5 Fv1 Fv2 X1 X2 X3 X4 X5 Sweet Sour Bitter Astringent SS TP B B B B D D Fl Fl Fl Fl Fl Fv Fv X X X X X Values in bold are significantly different from 0 (p = 0.05). Significant correlations between the taste and mouthfeel attributes and the other parameters are highlighted in yellow. a The notations used for the compositional parameters are explained in Table
193 Table 14 Step-wise regression model indicating the percentage variation in sweet, sour and bitter taste and astringent mouthfeel explained by the compositional parameters of all four Cyclopia species. Sensory attributes Sweet taste Sour taste Bitter taste Astringent mouthfeel Step Variable entered Parameter estimate Variable removed Partial R- square Model R- square 1 Mangiferin (X1) Iriflophenone-3-C-glucoside (B4) Scolymoside (Fv2) Maclurin-di-O,C-hexoside (B2) Mangiferin (X1) Naringenin-O-hexose-O-deoxyhexose A (Fl1) Tetrahydroxyxanthone-di-O,C-hexoside (X5) Hesperidin (Fl3) Maclurin-di-O,C-hexoside (B2) Iriflophenone-3-C-glucoside-4-O-glucoside (B1) Soluble solids (SS) Mangiferin (X1) Maclurin-di-O,C-hexoside (B2) Naringenin-O-hexose-O-deoxyhexose A (Fl1) Soluble solids (SS) Tetrahydroxyxanthone-C-hexoside isomer B (X4) Isomangiferin (X2) Tetrahydroxyxanthone-di-O,C-hexoside (X5) Eriocitrin (Fl4) Mangiferin (X1) Isomangiferin (X2) Tetrahydroxyxanthone-C-hexoside isomer B (X4) Maclurin-di-O,C-hexoside (B2) The final model R-square value is highlighted in yellow. Stellenbosch University 180


194 Cyclopia genistoides samples samples 44 samples samples Cyclopia maculata samples samples 44 samples samples Cyclopia subternata samples samples 44 samples samples Cyclopia longifolia samples Compositional analyses HPLC DAD Soluble solids Total polyphenols Descriptive sensory analysis Taste and mouthfeel Data analysis: PCA PLS Step-wise regression Fig. 1 Summary of sample set, sample analysis, data analysis and outcome. Prediction models: Modelling per species Modelling over all four species 181
195 a) b) 182 Fig. 2 a) PCA scores plot showing the position of C. genistoides samples (N = 44) and the relation of these samples with each other. The abbreviation G in the sample name refers to the species, C. genistoides, 80 and 90 refer to the fermentation parameters, 80 C/16 h and 90 C/24 h, respectively and 10, 12 and 13 refer to the production years, 2010, 2012 and 2013, respectively. b) PCA loadings plot illustrating the relationship between the compositional parameters and the taste and mouthfeel attributes. The notations for the phenolic compounds are explained in Table 2.
196 a) b) Fig. 3 a) PCA scores plot showing the position of C. longifolia samples (N = 72) and the relation of these samples with each other. The abbreviation L in the sample name refers to the species, C. longifolia, 80 and 90 refer to the fermentation temperature, 80 C and 90 C, respectively and 8, 16, 24 and 32 refer to the fermentation time (h). b) PCA loadings plot illustrating the relationship between the compositional parameters and the taste and mouthfeel attributes. The notations for the phenolic compounds are explained in Table
197 a) b) Fig. 4 a) PCA scores plot showing the position of C. maculata samples (N = 44) and the relation of these samples with each other. The abbreviation M in the sample name refers to the species, C. maculata, 80 and 90 refer to the fermentation parameters, 80 C/16 h and 90 C/24 h, respectively and 10, 12 and 13 refer to the production years, 2010, 2012 and 2013, respectively. b) PCA loadings plot illustrating the relationship between the compositional parameters and the taste and mouthfeel attributes. The notations for the phenolic compounds are explained in Table
198 a) b) Fig. 5 a) PCA scores plot showing the position of C. subternata samples (N = 44) and the relation of these samples with each other. The abbreviation S in the sample name refers to the species, C. subternata, 80 and 90 refer to the fermentation parameters, 80 C/16 h and 90 C/24 h, respectively and 10, 12 and 13 refer to the production years, 2010, 2012 and 2013, respectively. b) PCA loadings plot illustrating the relationship between the compositional parameters and the taste and mouthfeel attributes. The notations for the phenolic compounds are explained in Table
199 a) b) Fig. 6 a) PCA scores plot showing the position of all samples of four Cyclopia species (N = 204) and the relation of these samples with each other. The abbreviations Gen, Mac, Sub and Lon refer to C. genistoides, C. maculata, C. subternata and C. longifolia, respectively. b) PCA loadings plot illustrating the relationship between compositional parameters and the taste and mouthfeel attributes. The notations for the phenolic compounds are explained in Table
200 a) b) c) d) 187 Fig. 7 PLS regression plots for C. genistoides displaying the relation between compositional parameters and a) sweet, b) sour, c) bitter, d) astringent attributes, respectively. The notations for the phenolic compounds used are explained in Table 2.
201 a) b) c) d) 188 Fig. 8 PLS regression plots for C. longifolia displaying the relation between compositional parameters and a) sweet, b) sour, c) bitter, d) astringent attributes, respectively. The notations for the phenolic compounds used are explained in Table 2.
202 a) b) c) d) 189 Fig. 9 PLS regression plots for C. maculata displaying the relation between compositional parameters and a) sweet, b) sour, c) bitter, d) astringent attributes, respectively. The notations for the phenolic compounds used are explained in Table 2.
203 a) b) c) d) 190 Fig. 10 PLS regression plots for C. subternata displaying the relation between compositional parameters and a) sweet, b) sour, c) bitter, d) astringent attributes, respectively. The notations for the phenolic compounds used are explained in Table 2.
204 a) b) c) d) 191 Fig. 11 PLS regression plots for all four Cyclopia species displaying the relation between compositional parameters and a) sweet, b) sour, c) bitter, d) astringent attributes, respectively. The notations for the phenolic compounds used are explained in Table 2.
205
206 193 Fig. 13 A scatter plot illustrating the mean concentration of benzophenones (B1 B4) present in four Cyclopia species, as well as the mean intensity of bitter taste. The abbreviations G, L, M and S refer to C. genistoides, C. longifolia, C. maculata and C. subternata, respectively, while 80 and 90 next to G, M and S refer to the fermentation parameters 80 C/24 h and 90 C/16 h, respectively. For C. longifolia (L) 80 and 90 refer to fermentation temperature 80 C and 90 C, respectively, while 8, 16, 24 and 32 refer to the fermentation time (h).
207 CHAPTER 6 GENERAL DISCUSSION AND CONCLUSIONS 1. INTRODUCTION Food quality is a multifaceted concept that involves meeting the expectations laid down by consumers (Cardello, 1995; Van Boekel, 2008) and can be described as the combination of attributes or characteristics of a product that have significance in determining the degree of acceptability of the product to a user (Cardello, 1995). The success of a food product usually depends largely on its sensory quality, but also on its consistency. Therefore, ensuring food quality on a day-to-day basis is of the utmost importance to guarantee customer loyalty and market growth (Van Boekel, 2008). For effective quality control and assessment of food products, it is necessary to have knowledge both of attributes responsible for perceived quality and tools to measure quality. The present study focused on honeybush tea, a traditional South African herbal tea, for which retail markets have been developed only during the past 20 years (Joubert et al., 2011). Poor and inconsistent product quality has been a concern since the development of the honeybush industry (Du Toit et al., 1998). Implementation of factory-based processing played a major role in improving product quality, yet it does not always guarantee good quality. Bergh (2014) pointed out that factors such as factory management, experience of processors and the type of processing equipment all have an impact on product quality. Other challenges faced by the honeybush industry are the number of species used for production of honeybush tea and the small volumes produced. Processing conditions therefore need to be optimised for each species (Theron, 2012; Bergh, 2014). Cyclopia intermedia, C. genistoides and C. subternata are most commonly used when producing honeybush, but with increasing consumer demand, the commercial potential of other species, i.e. C. maculata and C. longifolia, are currently being investigated (Joubert et al., 2011). Studies have found that the respective Cyclopia species have differing sensory profiles, opening the door for the production of different niche market products, with each product having its own unique sensory profile (Theron et al., 2014). However, as a result of limited production yields and increased consumer demand, the respective honeybush species are often substituted with one another or blended without considering the effect of this on the resultant sensory profiles (Joubert et al., 2011). Furthermore, environmental conditions, varying growth localities, along with inherent species differences, can lead to considerable differences in the volatile and non-volatile chemical profiles (De Beer & Joubert, 2010; Cronje, 2010; Theron, 2012; Joubert et al., 2014) and thus also the sensory profiles of commercially produced honeybush. With the growing interest in health-promoting food products, the consumption of herbal tea drinks has increased by 15% over the past few years (Bender, 2014). The characteristic sensory 194
208 profile of honeybush, i.e. an herbal tea with floral, fruity, woody and sweet-associated sensory notes (Theron et al., 2014), as well the fact that it contains no caffeine and has a low tannin content (Joubert et al., 2011), makes honeybush an ideal product for the fast-growing herbal tea market. It is therefore vitally important to define the specific sensory profiles of the commercially viable Cyclopia species and to determine optimum processing conditions for the current, but also the emerging Cyclopia species. Recent attainment of a geographical indication (GI) for honeybush (Anon., 2013) places product characteristics, an essential element of GI, again in the spotlight. To maintain the GI status, it is important to produce honeybush tea of good, consistent quality; therefore, it is vital to have procedures in place that will ensure product quality. Most honeybush products are sold in the so-called fermented form, produced through a high-temperature oxidation process required for development of the characteristic sweetassociated flavour and dark-brown colour of the traditional product. A range of processing conditions is currently being used by the honeybush industry (Joubert et al., 2011; Bergh, 2014). It was only recently that Theron (2012) defined the effect of fermentation conditions on the sensory profiles of C. genistoides, C. maculata and C. subternata and established that the two optimum fermentation temperature/time regimes, 80 C/24 h and 90 C/16 h, deliver subtle differences in the sensory profiles of the respective species. Fermentation of C. genistoides at 80 C/24 h resulted in a stronger rose geranium aroma than fermentation at 90 C/16 h. It was recommended that C. maculata be fermented at 80 C/24 h to effectively reduce the intensity of negative sensory attributes such as haylike. The fermentation of C. subternata at 80 C/24 h resulted in a more floral note, while a stronger apricot jam note was perceived at 90 C/16 h (Theron, 2012). Optimum fermentation conditions and the specific sensory profile required are therefore speciesdependent. It is thus important to also determine the optimum fermentation parameters of Cyclopia species currently being investigated for commercialisation, e.g. C. longifolia. Whilst the distinct flavour profiles of herbal teas are responsible for their market appeal, a major driver of their increasing market share is the growing consumer awareness of the positive health impact associated with these products. This trend has also provided the honeybush industry with leverage to boost its market share (Joubert et al., 2011). The health-promoting properties of honeybush have been linked to its phenolic compounds (Joubert et al., 2008a). High levels of these bioactive compounds, in addition to tea quality, are one of the selection criteria used in the breeding and selection of improved honeybush plant material by the Agricultural Research Council (Infruitec-Nietvoorbij) of South Africa (Bester, 2013). Theron (2012), studying several Cyclopia species, linked a limited number of compounds to the taste and mouthfeel attributes of honeybush infusions. Most prominently was the correlation of the bioactive xanthones, mangiferin and isomangiferin with bitter taste and astringency, indicating that sensory quality may be compromised when high levels of these bioactive compounds are present. Consumer and marketing studies revealed that taste, as opposed to health value, is one of the major key influences when selecting food (Drewnowski & Gomez-Carneros, 2000). In a study by Theron 195
209 (2012) on the potential link between phenolic compounds and the basic taste modalities, no compounds could be linked to sweet taste or the other basic taste modalities, and it was recommended that a larger sample set be used, encompassing more plant material variation, as well as processing variation to ultimately develop a prediction model that could indicate the chemical drivers of taste and astringency (Theron, 2012). In view of the above, the objectives of this study were thus as follows: 1) to investigate the effect of different temperature/time fermentation regimes on the sensory profile of C. longifolia in order to identify the optimum fermentation conditions for this Cyclopia species; 2) to determine the defining aroma, flavour, taste and mouthfeel attributes of C. genistoides, C. subternata, C. maculata and C. longifolia and using these results to validate the generic sensory wheel and lexicon for honeybush developed by Theron et al. (2014) and to further develop species-specific sensory wheels for the respective Cyclopia species, 3) to test the viability of a rapid sensory profiling technique, sorting, as a potential quality control tool suitable for industry use, and lastly, 4) to evaluate the phenolic content of four Cyclopia species as potential predictors of the taste and mouthfeel attributes of honeybush infusions. 2. ESTABLISHING OF PROCESSING PARAMETERS FOR C. LONGIFOLIA The sensory profile of seventy-two (N = 72) C. longifolia samples, fermented at eight temperature/time regimes (80 C and 90 C for 8, 16, 24 and 32 h), were investigated using descriptive sensory analysis (DSA). It was seen in this study and in other studies (Bergh, 2014; Theron, 2012) that fermentation resulted in an increase of the positive sensory attributes, and a decrease of the negative sensory attributes of various Cyclopia species. For the fermentation conditions tested, no new sensory attributes developed during fermentation; however, fermentation time is critical as fermentation for 8 h at 80 C or 90 C resulted in under-fermented products, with intense green grass and hay-like aromas and flavours. It was found that a fermentation time of 24 h at 80 C or 90 C effectively reduced the intensity of the negative sensory attributes. The sensory profile of tea fermented at 80 C/24 h was similar to the sensory profile of tea fermented at 90 C/24 h; however certain positive attributes such as rose geranium, apricot/apricot jam and fruity-sweet aroma were perceived at higher intensities in samples fermented at 90 C. Thus, it was found that C. longifolia can be fermented at 80 C/24 h or 90 C/24 h to produce a tea of good sensory quality. 3. DEVELOPMENT OF QUALITY-CONTROL TOOLS FOR THE HONEYBUSH INDUSTRY 3.1 Generic and species-specific wheels for honeybush To validate the generic sensory wheel developed by Theron et al. (2014), a large set of honeybush tea samples was sourced (N = 150). The diverse sample set consisted of three Cyclopia species (C. genistoides, C. maculata and C. subternata), harvested and processed over a four-year period, 196
210 as well as selected samples from the fermentation study of C. longifolia. The latter plant material was harvested in 2013 only. The samples came from different production regions and were processed according to different processing regimes, thus ensuring that natural sample variation was accommodated. For all species only those samples processed at optimum conditions were used. This was a major difference to the approach followed by Theron et al. (2014). In the latter study both commercial and experimental samples were employed and many were of poor quality, specifically included to fully characterise the negative sensory attributes. Theron et al. (2014) defined the characteristic sensory profile of honeybush as having a floral, sweet-associated, fruity, plant-like and woody aroma and flavour, and a sweet taste and slightly astringent mouthfeel. The latter results were based on six Cyclopia species (C. genistoides, C. subternata, C. maculata, C. intermedia, C. longifolia and C. sessiliflora); however, the full sample set of plant material included only 58 individual sample batches. In the current study the characteristic or primary sensory profile of all four honeybush species was expanded and defined as having fynbos-floral, woody, fynbos-sweet aroma and flavour notes, as well as a sweet taste and slightly astringent mouthfeel. All of the 150 samples investigated illustrated these eight sensory attributes at perceptible intensities. This newly-established generic sensory profile of honeybush differs slightly from that proposed by Theron et al. (2014), most probably because the present study included more samples and thus more sample variation. It was furthermore established that the respective Cyclopia species could be classified according to their own unique set of sensory attributes, i.e. the so-called species-specific sensory profiles. Cyclopia longifolia and C. genistoides had reasonably similar sensory profiles. Cyclopia genistoides was defined by a prominent rose geranium note and perceptible bitter taste. The rose geranium note was less prominent in C. longifolia, when fermented at optimum processing conditions (80 C or 90 C for 24 h). Furthermore, these samples had no perceptible bitter taste. Cyclopia maculata and C. subternata were also characterised as being reasonably similar. Both species can be described as having caramel and other sweet-associated notes and a slightly astringent mouthfeel. Theron et al. (2014) found a prominent cassia/cinnamon note in C. maculata; however, this note was more prominent in some C. subternata samples prepared for the present study. Breeding of plants that would consistently deliver this spicy aroma note could pose an interesting challenge for plant breeders. Using the above-mentioned results, two generic aroma and flavour wheels were developed for honeybush, as well as two species-specific aroma and flavour wheels for each of the four Cyclopia species. Apart from the revision of the sensory attributes, the newly developed generic sensory wheels reflect the relative intensity of each attribute, depicted by the thickness of the slice in the wheel. To provide the user with an indication of the expected occurrence of the major sensory attributes in honeybush tea, bar graphs indicating the percentage occurrence of each sensory attribute have been added to the generic aroma and flavour wheels. The new generic aroma wheel for honeybush consists of 18 aroma attributes and the flavour wheel of 13 flavour, 3 197
211 taste and 1 mouthfeel attributes. Similar to the first generic wheel, developed by Theron et al. (2014), the new aroma and flavour wheels have also been constructed in three tiers, with each tier depicting different classes of sensory quality. The species-specific wheels, one aroma and one flavour wheel for each of the four Cyclopia species, were developed in a similar fashion. The lexicon developed by Theron et al. (2014), i.e. a full list of sensory attributes, as well as a description of each attribute, was updated to include the changes made to the sensory wheels. These sensory tools can be used by the industry during quality control or grading, i.e. where it is important to ensure consistent product quality. The use of standardised terminology throughout the industry would improve communication between various individuals involved in honeybush production, lessening the possibility of producing fermented products of poor quality. The species-specific sensory wheels can assist in the development of species-specific honeybush products for niche markets or during the blending of different species to produce blends with a specific sensory profile. It is, however, important to note that these wheels need to be validated by industry. Such a validation exercise was recently completed for the newly developed sensory wheels for rooibos, another indigenous herbal tea in South Africa (Jolley, 2014). The rooibos wheels were validated using direct input from industry during a workshop. Reference standards consisting of tea samples and chemical reference standards were tested during the workshop and the input of the industry was used to finalise the rooibos sensory wheels (Jolley, 2014). 3.2 Rapid profiling methods for an industry environment Descriptive sensory analysis (DSA) is one of the most effective methods that can be used for determining the sensory profile of a product (Lawless & Heymann, 2010). DSA is usually conducted in a research environment and has been used extensively for the sensory profiling of South African herbal teas, rooibos (Koch et al., 2012; Jolley, 2014) and honeybush (Bergh, 2014; Theron et al., 2014). DSA usually results in a vast set of qualitative and quantitative data that can be correlated with instrumental or other types of data using standard univariate and multivariate analyses. Even though DSA is a very effective method and results in a full sensory profile, it is sometimes viewed as being too time-consuming and expensive, especially within an industry environment when a large number of production samples need to be analysed in a short period of time. In food and beverage industries several rapid profiling methods have been investigated to determine faster alternatives for DSA (Valentin et al., 2012). Sorting is one of the most popular rapid profiling methods currently used (Lawless et al., 1995; Valentin et al., 2012) and has recently been used for the profiling of commercial rooibos samples in terms of positive and negative sensory attributes (Jolley, 2014). The sorting task groups samples according to their similarities, but it does not provide quantitative information (Chollet et al., 2011). Both instructed and uninstructed sorting were investigated in this study to ascertain whether samples can be grouped according to species (C. genistoides, C. maculata and C. subternata). During instructed sorting 198
212 the panellists are given a pre-defined set of attributes or sensory profiles according to which the samples need to be sorted, while no guidelines for grouping of samples are given during uninstructed sorting (Valentin et al., 2012). In the present study C. genistoides, C. maculata and C. subternata samples, harvested in the same production year (2013), were used for instructed sorting, primarily to ascertain whether the samples could be grouped according to the sensory attributes generally associated with the respective species. An expert panel was used for the task, i.e. assessors with experience of the product in question. The results indicated that the assessors were able to group the samples according to species. Three or four sensory attributes were used to describe each grouping of samples. These provided further insight into the decision-making process and allowed some comparison with the results of DSA. The groupings of samples obtained from the instructed sorting experiment was similar to that obtained with DSA, as indicated by the Rv coefficients. For both methodologies similar attributes were used to describe the sensory profiles of the respective Cyclopia species. Instructed sorting can therefore be viewed as a possible rapid sensory profiling tool for the honeybush industry, especially when sample batches need to be classified or screened according to a list of sensory attributes that form part of a specification sheet. The samples used for uninstructed sorting spanned two production seasons (2012 and 2013). However, it was found that the variation within species over two production seasons was too high, making grouping according to species difficult. Therefore, the results obtained from uninstructed sorting did not compare well with those obtained from DSA, especially when considering the low Rv coefficients. However, this free sorting technique can still be viewed as a possible tool for the honeybush industry, i.e. when the aim is only to sort a group of samples freely according to similarities and thus to ascertain the natural categorisation of samples within a broader sample set. The sorting method is easy to understand and implement and can therefore be used by small-scale farmers or processors to quickly identify the profile of the tea samples to ensure consistent blending. Sorting also has the potential to differentiate between products within a broader product range, typically a large sample set of honeybush teas can be categorised to identify groupings of samples that could be developed into potential niche markets. 3.3 Prediction of taste and mouthfeel attributes based on phenolic composition As a reasonably encompassing sample set with a large amount of natural variation in sensory quality and phenolic content was available, a further attempt to that of Theron (2012) was made to identify phenolic compounds which associate with the basic taste modalities (sweet, sour and bitter taste), as well as the mouthfeel attribute astringency, to ultimately develop a prediction model for these sensory attributes. The focus fell on the phenolic compounds as this class of compounds has been shown to contribute to taste, in particular bitter taste, as well as astringency of many food products (Drewnowski & Gomez-Carneros, 2000). Whilst some flavonoids can activate bitter taste 199
213 receptors (Roland et al., 2013), others such as the dihydrochalcones (Ley et al., 2012) and flavanones (Ley et al., 2005) are known to mask bitterness. Bitterness and astringency can also co-exist in polyphenols such as in catechins (Hayashi et al., 2010). The phenolic composition differed between the honeybush species tested. This was also seen by Theron (2012) as well as in several other studies where the phenolic composition of an array of Cyclopia species was quantified (Joubert et al., 2003; 2008b; De Beer & Joubert, 2010). Hesperidin, vicenin-2, mangiferin and isomangiferin were the only four phenolic compounds present in all four Cyclopia species. The variation in the phenolic composition of the different Cyclopia species definitely depends on the species in question; however, external factors could also contribute to this variation, especially the variation within species across production years. Other external factors, such as climate, harvesting areas and soil conditions have also been found to influence the phenolic content of Camellia sinensis (Owour et al., 2008; Jayasekera et al., 2014) and C. genistoides (Joubert et al., 2014). Processing conditions, such as fermentation temperature and time can also result in variation of the phenolic composition (Du Toit & Joubert, 1999). In this study it was observed that C. genistoides and C. longifolia had the highest content of the xanthones, mangiferin and isomangiferin, and both Cyclopia species also illustrated the most intense bitter taste. In the case of C. longifolia the bitter taste was prominent only in the samples fermented for a short period, while those fermented at the optimum conditions were not perceived as being bitter. Certain samples had a high mangiferin and isomangiferin concentration, but were not perceived as bitter. This could be a result of the presence of modulating compounds which can mask the bitterness or enhance the sweetness of the product. The large sample set (N = 204) was furthermore analysed using Pearson s correlation analysis, partial least squares (PLS) and step-wise regression analysis (Abdi, 2007; Snedecor & Cochran, 1989), primarily to ascertain the correlation between the chemical compounds and sensory attributes and whether individual polyphenols can predict taste and mouthfeel. The results could not clearly identify the phenolic drivers of the individual taste and mouthfeel attributes, especially within species-specific context. The species-specific stepwise-regression analyses resulted in moderately low model R-square values for all four sensory attributes, indicating a reasonably poor predictive ability of the models, especially for C. maculata and C. subternata. This can be a result of the natural variation between plant material batches, lack of variation between the phenolic compounds, the narrow intensity range of some of the taste and mouthfeel attributes, or a combined effect of several compounds such as taste-modulating effects which the model cannot take into account. In contrast, the model based on the combined data of all four Cyclopia species resulted in considerably higher prediction values, especially for the two attributes bitter taste and astringency, thus confirming the statement that more variation leads to a better prediction model. Even though the model identified groups of potential candidate predictors, it is important to remember that these phenolic compounds are not necessarily the only compounds responsible for specific taste and mouthfeel attributes. When interpreting the results of the step-wise 200
214 regression models, it should be kept in mind that this procedure yields only one final model, although in practice there can be several equally good models. The collinearity of the data should also be taken into account, as it may result in very different models with different selection criteria. For example, when two phenolic compounds are highly correlated to each other and to the dependent variable, the step-wise regression procedure will select only one of the compounds to be present in the model. One of the limitations of the step-wise regression model, as well as PLS and Pearson s correlation analysis, is the fact that it cannot account for interaction between phenolic compounds or take into account the modulating effects of the compounds (Soares et al., 2013). In view of the above, other statistical methodologies such as multiblock analysis (Næs et al., 2013) could be considered, i.e. to ultimately indicate the phenolic drivers of the sensory quality attributes in question. There are, however, also other options when the aim is to identify potential candidate predictors. Single phenolic compounds might not be responsible for specific taste and mouthfeel attributes, as compounds could influence each other or work in combination to elicit certain basic tastes and/or an astringent mouthfeel. Thus it might be beneficial to fractionate the infusions, identify the compounds within each fraction and then analyse the respective fractions using standard sensory analysis (Reichelt et al., 2012). Furthermore, one could also investigate the taste and mouthfeel attributes of individual phenolic compounds, and their threshold effects (Scharbert et al., 2004), or use omission experiments to identify compounds contributing to taste and astringency (Yu et al., 2014). Knowledge of the impact of individual compounds on taste modalities and astringency may aid in building a model that includes only the so-called tasteactive compounds. In view of the above, the following are recommended for future studies: As optimum processing conditions for each species were only tested on laboratory scale, it is important to test the respective temperature/time regimes identified in this study on a commercial scale, primarily to determine if similar aroma and flavour profiles are obtained on a commercial scale and whether these fermentation temperature/time regimes are indeed viable processing parameters for industry. The sorting task needs to be validated, firstly by testing more samples to determine the stability of the procedure and secondly by including more than two replicate sessions to determine whether this rapid profiling method is reproducible. The step-wise regression models obtained in this study need to be validated using a new sample set encompassing sufficient sample variation. Other statistical methods should also be investigated to determine the accuracy and validity of the model obtained in this study. The intensity ranges of two of the sensory attributes were quite narrow, whereas the concentration ranges of the phenolic compounds were noticeably larger. By expanding scale usage, and thus broadening the mean intensity ranges of the respective sensory attributes, a better model may 201
215 ultimately be developed. Furthermore, targeted analysis of the phenolic compounds themselves might give some insight into their potential modulating effects or the relationship between phenolic compounds. Analyses such as these might identify predictor compounds, thereby developing improved targeted tools for the honeybush industry. 202
216 4. REFERENCES Abdi, H. (2007). Partial least square regression, PLS regression. In: Niel Salkind (Ed.) Encyclopaedia of Measurement and Statistics. Thousand Oaks (CA): Sage, USA. Anonymous. (2013). Final prohibition on the use of certain words. Notice 988. Merchandise Marks Act (Act 17 of 1941). Government Gazette 4 October 2013, South Africa. Bender, A. (2014). The future of tea is green and herbal. [Internet document]. URL 06/10/2014. Bergh, A.J. (2014). Characterisation of the sensory profile of Cyclopia intermedia and the optimisation of fermentation parameters for improved product quality. MSc Thesis, University of Stellenbosch, Stellenbosch, South Africa. Bester, C. (2013). A model for commercialisation of honeybush tea, an indigenous crop. In: II All Africa Horticulture Congress. Pp September Skakuza, Kruger National Park, South Africa. Cardello, A.V. (1995). Food quality: relativity, context and consumer expectations. Food Quality and Preference, 6, Chollet, S., Leliévre, M., Abdi, H. & Valentin, D. (2011). Sort and beer: everything you wanted to know about the sorting task but did not dare to ask. Food Quality and Preference, 22, Cronje, J.C. (2010). Chemical characterisation of the aroma of honeybush (Cyclopia) species. PhD Dissertation, University of Stellenbosch, Stellenbosch, South Africa. De Beer, D. & Joubert, E. (2010). Development of HPLC for Cyclopia subternata phenolic compound analysis and application to other Cyclopia spp. Journal of Food Composition and Analysis, 23, Drewnowski, A. & Gomez-Carneros, C. (2000). Bitter taste, phytonutrients, and the consumer: a review. American Journal for Clinical Nutrition, 72, Du Toit, J. & Joubert, E. (1999). Optimization of the fermentation parameters of honeybush tea (Cyclopia). Journal of Food Quality, 22, Du Toit, J., Joubert, E. & Britz, J. (1998). Honeybush tea A rediscovered indigenous South African herbal tea. Journal of Sustainable Agriculture, 12:2-3, Hayashi, N., Chen, R., Hiraoka, M., Ujihara, T. & Ikezaki, H. (2010). β-cyclodextrin/surface plasmon resonance detection system for sensing bitter-astringent taste intensity of green tea catechins. Journal of Agricultural and Food Chemistry, 58, Jayasekera, S., Kaur, L., Molan, A., Garg, M.L. & Moughan, P.J. (2014). Effects of season and plantation on phenolic content of unfermented and fermented Sri Lankan tea. Food Chemistry, 152,
217 Jolley, B. (2014). Development of quality control tools and a taste prediction model for rooibos. MSc Thesis, University of Stellenbosch, Stellenbosch, South Africa. Joubert, E., De Beer, D., Hernández, I. & Munné-Bosch, S. (2014). Accumulation of mangiferin, isomangiferin, iriflophenone-3-c-β-glucoside and hesperidin in honeybush leaves (Cyclopia genistoides Vent.) in response to harvest time, harvest interval and seed source. Industrial Crops and Products, 56, Joubert, E., Gelderblom, W.C.A., Louw, A. & De Beer, D. (2008a). South African herbal teas: Aspalathus linearis, Cyclopia spp. and Athrixia phylicoides a review. Journal of Ethnopharmacology, 119, Joubert, E., Joubert, M.E., Bester, C., De Beer, D. & De Lange, J.H. (2011). Honeybush (Cyclopia spp.): from local cottage industry to global markets the catalytic and supporting role of research. South African Journal of Botany, 77, Joubert, E., Otto, F., Grüner, S. & Weinreich, B. (2003). Reversed-phase HPLC determination of mangiferin, isomangiferin and hesperidin in Cyclopia and the effect of harvesting date on the phenolic composition of C. genistoides. European Food Research and Technology, 216, Joubert, E., Richards, E.S., Van der Merwe, J.D., De Beer, D., Manley, M. & Gelderblom, W.C.A. (2008b). Effect of species variation and processing on phenolic composition and in vitro antioxidant activity of aqueous extracts of Cyclopia spp. (honeybush tea). Journal of Agricultural and Food Chemistry, 56, Koch, I.S., Muller, M., Joubert, E., Van der Rijst, M. & Næs, T. (2012). Sensory characterisation of rooibos tea and the development of a rooibos sensory wheel and lexicon. Food Research International, 46, Lawless, H.T. & Heymann, H. (2010). Descriptive analysis. In: Sensory evaluation of food, principles and practices, 2 nd ed. New York, USA: Springer. Lawless, H.T., Sheng, N. & Knoops, S.S.C.P. (1995). Multidimensional scaling of sorting data applied to cheese perception. Food Quality and Preference, 6, Ley, J.P., Dessoy, M., Paetz, S., Blings, M., Hoffmann-Lücke, P., Reichelt, K.V., Krammer, G.E., Pienkny, S., Brandt, W. & Wessjohann, L. (2012). Identification of enterodiol as a masker for caffeine bitterness by using a pharmacophore model based on structural analogues of homoeriodictyol. Journal of Agricultural and Food Chemistry, 60, Ley, J.P., Krammer, G., Reinders, G., Gatgield, I.L. & Bertram, H.J. (2005). Evaluation of bitter masking flavanones from Herba Santa (Eriodictyoncalifornicum (H. & A.) Torr., Hydrophyllaceae). Journal of Agricultural and Food Chemistry, 53, Næs, T., Tomic, O., Afseth, N.O., Segtnan, V. & Måge, I. (2013). Multi-block regression based on combinations of orthogonalisation, PLS-regression and canonical correlation analysis. Chemometrics and Intelligent Laboratory Systems, 124,
218 Owuor, P.O., Obanda, M., Nyirenda, H.E. & Mandala, W.L. (2008). Influence of region of production on clonal black tea chemical characteristics. Food Chemistry, 108, Reichelt, K.V., Hoffmann-Lücke, P., Hartmann, B., Weber, B., Ley, J.P., Krammer, G.E., Swanepoel, K.M., Engel, K.-H. (2012). Phytochemical characterisation of South African bush tea (Athrixia phylicoides DC.). South African Journal of Botany, 83, 1-8. Roland, W.S.U., Van Buren, L., Gruppen, H., Driesse, M., Gouka, R.J., Smit, G. & Vincken, J-P. (2013). Bitter taste receptor activation by flavonoids and isoflavonoids: modulated structural requirements for activation of htas2r14 and htas2r39. Journal of Agricultural and Food Chemistry, 61, Schabert, S., Jezussek, M. & Hofmann, T. (2004). Evaluation of the taste contribution of theaflavins in black tea infusions using the taste activity concept. European Food Research and Technology, 218, Snedecor, G.W. & Cochran, W.G. (1989). Statistical methods. Iowa State University Press, USA. Soares, S., Kohl, S., Thalmann, S., Mateus, N., Meyerhof, W. & de Freitas, V. (2013). Different phenolic compounds activate distinct human bitter taste receptors. Journal of Agricultural and Food Chemistry, 61, Theron, K.A. (2012). Sensory and phenolic profiling of Cyclopia species (Honeybush) and optimisation of the fermentation conditions. MSc Thesis, University of Stellenbosch, Stellenbosch, South Africa. Theron, K.A., Muller, M., Van der Rijst, M., Cronje, J.C., Le Roux, M. & Joubert, E. (2014). Sensory profiling of honeybush tea (Cyclopia species) and the development of a honeybush sensory wheel. Food Research International, 66, Valentin, D., Chollet, S., Lelièvre, M. & Abdi, H. (2012). Quick and dirty but still pretty good: a review of new descriptive methods in food science. International Journal of Food Science and Technology, 47, Van Boekel, M.A.J.S. (2008). Kinetic modelling of food quality: a critical review. Comprehensive Reviews in Food Science and Food Safety, 7, Yu, P., Yeo, A.S.-L., Low, M.-Y. & Zhou, W. (2014). Identifying key non-volatile compounds in ready-to-drink green tea and their impact on taste profile. Food Chemistry, 155,
219 ADDENDA 206
220 ADDENDUM A Photographs illustrating the preparation of honeybush infusions for descriptive sensory analysis (DSA) 207


 Infusions were served in the labelled mugs and")
221 a) b) c) Fig. 1A a) 12.5 g of tea infused in 1 L freshly boiled distilled water for 5 min before being strained into preheated stainless steel flasks. b) Preheated, labelled white porcelain mugs. c) Infusions were served in the labelled mugs and placed in a scientific water bath at 65 C to maintain temperature. 208
5. Supporting documents to be provided by the applicant IMPORTANT DISCLAIMER
 Guidance notes on the classification of a flavouring substance with modifying properties and a flavour enhancer 27.5.2014 Contents 1. Purpose 2. Flavouring substances with modifying properties 3. Flavour
DEVELOPMENT OF QUALITY CONTROL TOOLS AND A TASTE PREDICTION MODEL FOR ROOIBOS. Bianca Jolley
 DEVELOPMENT OF QUALITY CONTROL TOOLS AND A TASTE PREDICTION MODEL FOR ROOIBOS Bianca Jolley Thesis presented in partial fulfilment of the requirements for the degree of Master of Science in Food Science
COMPARISON OF THREE METHODOLOGIES TO IDENTIFY DRIVERS OF LIKING OF MILK DESSERTS
 COMPARISON OF THREE METHODOLOGIES TO IDENTIFY DRIVERS OF LIKING OF MILK DESSERTS Gastón Ares, Cecilia Barreiro, Ana Giménez, Adriana Gámbaro Sensory Evaluation Food Science and Technology Department School
Intracultural study of European* Consumer Acceptability of Hibiscus sabdariffa L. Drinks.
 Intracultural study of European* Consumer Acceptability of Hibiscus sabdariffa L. Drinks. *Portugal, United Kingdom and France M. I. Franco, Geneviève Fliedel, Aurelie Bechoff, Corinne Rumney, M. Q. Freitas,
Hops II Interfacing with the Hop Industry Role of a Hops Supplier. Tim Kostelecky John I. Haas, Inc ASBC Meeting June 6, 2017
 Hops II Interfacing with the Hop Industry Role of a Hops Supplier Tim Kostelecky John I. Haas, Inc. 2017 ASBC Meeting June 6, 2017 Overview of a Hops Supplier Hops from own farm Products, Services for
Effects of Capture and Return on Chardonnay (Vitis vinifera L.) Fermentation Volatiles. Emily Hodson
 Fermentation Volatiles. Emily Hodson") Effects of Capture and Return on Chardonnay (Vitis vinifera L.) Fermentation Volatiles. Emily Hodson Thesis submitted to the faculty of the Virginia Polytechnic Institute and State University in partial
Effects of Capture and Return on Chardonnay (Vitis vinifera L.) Fermentation Volatiles. Emily Hodson Thesis submitted to the faculty of the Virginia Polytechnic Institute and State University in partial
Session 4: Managing seasonal production challenges. Relationships between harvest time and wine composition in Cabernet Sauvignon.
 Session 4: Managing seasonal production challenges Relationships between harvest time and wine composition in Cabernet Sauvignon Keren Bindon Cristian Varela, Helen Holt, Patricia Williamson, Leigh Francis,
More information at Global and Chinese Pressure Seal Machines Industry, 2018 Market Research Report
 Report Information More information at https://www.htfmarketreport.com/reports/1320915 Global and Chinese Pressure Seal Machines Industry, 2018 Market Research Report Report Code: HTF1320915 Pages: 150
Plant root activity is limited to the soil bulbs Does not require technical expertise to. wetted by the water bottle emitter implement
 Case Study Bottle Drip Irrigation Case Study Background Data Tool Category: Adaptation on the farm Variety: Robusta Climatic Hazard: Prolonged dry spells and high temperatures Expected Outcome: Improved
PRELIMINARY FINDINGS AND INTRODUCTION TO THE CASE STUDY OF ETHIOPIA
 PRELIMINARY FINDINGS AND INTRODUCTION TO THE CASE STUDY OF ETHIOPIA Stakeholder Outreach Workshop Addis Ababa, Ethiopia Tuesday March 7, 2017 and executed by DEVELOPMENT Solutions. Any views expressed
Relationship between Mineral Nutrition and Postharvest Fruit Disorders of 'Fuerte' Avocados
 Proc. of Second World Avocado Congress 1992 pp. 395-402 Relationship between Mineral Nutrition and Postharvest Fruit Disorders of 'Fuerte' Avocados S.F. du Plessis and T.J. Koen Citrus and Subtropical
D Lemmer and FJ Kruger
 D Lemmer and FJ Kruger Lowveld Postharvest Services, PO Box 4001, Nelspruit 1200, SOUTH AFRICA E-mail: fjkruger58@gmail.com ABSTRACT This project aims to develop suitable storage and ripening regimes for
Shaping the Future: Production and Market Challenges
 Call for Papers Dear Sir/Madam At the invitation of the Ministry of Stockbreeding, Agriculture, and Fisheries of the Oriental Republic of Uruguay, the 41th World Congress of Vine and Wine and the 16 th
GI Protection in Europe
 GI Protection in Europe Product approach Currently 4 kinds of goods can be protected under the EU quality schemes: Wines (Regulation 1308/2013) Aromatized wines (Regulation 251/2014) Spirit drinks (Regulation
ICC September 2018 Original: English. Emerging coffee markets: South and East Asia
 ICC 122-6 7 September 2018 Original: English E International Coffee Council 122 st Session 17 21 September 2018 London, UK Emerging coffee markets: South and East Asia Background 1. In accordance with
MBA 503 Final Project Guidelines and Rubric
 MBA 503 Final Project Guidelines and Rubric Overview There are two summative assessments for this course. For your first assessment, you will be objectively assessed by your completion of a series of MyAccountingLab
ACOS ETHIOPIA CASE STUDY
 OUR HISTORY It was only 2005 when Acos Ethiopia came to light from a pioneering idea of forward thinking people, the Pedon family. Ethiopia then was an even more challenging environment than it is now,
COTECA Coffee - a sensory pleasure with high quality standards
 COTECA Coffee - a sensory pleasure with high quality standards Nora Ohnesorge M.Sc. Food Science October 11 th 2018 Quality According to Duden, QUALITY means all characteristics of a product o Quality
2nd working meeting of the Regional Expert Advisory Working Group on Wine in South Estern Europe 14/12/ /12/2015, Skopje, Macedonia
 2nd working meeting of the Regional Expert Advisory Working Group on Wine in South Estern Europe 14/12/2015 16/12/2015, Skopje, Macedonia EU legislation - Implementing Regulation COMMISSION REGULATION
Sustainability Initiatives in Other Tropical Commodities Dr. Jean-Marc Anga Director, Economics and Statistics Division
 0 International Cocoa Organization Sustainability Initiatives in Other Tropical Commodities Dr. Jean-Marc Anga Director, Economics and Statistics Division 1 Sustainable Development 1983: Brundtland Commission
Lamb and Mutton Quality Audit
 Lamb and Mutton Quality Audit rmrdsaonline.co.za/lamb-and-mutton-quality-audit/ By admin 10/08/2018 South African Retail Lamb and Mutton Quality Audit Industry Sector: Cattle and Small Stock Research focus
VQA Ontario. Quality Assurance Processes - Tasting
 VQA Ontario Quality Assurance Processes - Tasting Sensory evaluation (or tasting) is a cornerstone of the wine evaluation process that VQA Ontario uses to determine if a wine meets the required standard
DETERMINANTS OF DINER RESPONSE TO ORIENTAL CUISINE IN SPECIALITY RESTAURANTS AND SELECTED CLASSIFIED HOTELS IN NAIROBI COUNTY, KENYA
 DETERMINANTS OF DINER RESPONSE TO ORIENTAL CUISINE IN SPECIALITY RESTAURANTS AND SELECTED CLASSIFIED HOTELS IN NAIROBI COUNTY, KENYA NYAKIRA NORAH EILEEN (B.ED ARTS) T 129/12132/2009 A RESEACH PROPOSAL
Generation w-y-ne Consumer insights & Chenin blanc wine style preferences
 Generation w-y-ne Consumer insights & Chenin blanc wine style preferences Inneke Bester MSc Wine Biotechnology Institute for Wine Biotechnology STELLENBOSCH UNIVERSITY Chenin blanc Conference, Stellenbosch,
Coffee Eco-labeling: Profit, Prosperity, & Healthy Nature? Brian Crespi Andre Goncalves Janani Kannan Alexey Kudryavtsev Jessica Stern
 Coffee Eco-labeling: Profit, Prosperity, & Healthy Nature? Brian Crespi Andre Goncalves Janani Kannan Alexey Kudryavtsev Jessica Stern Presentation Outline I. Introduction II. III. IV. Question at hand
Flavour Legislation Past Present and Future or From the Stone Age to the Internet Age and Beyond. Joy Hardinge
 Flavour Legislation Past Present and Future or From the Stone Age to the Internet Age and Beyond Joy Hardinge PAST Pre 1988 No EU legislation Each Member State had the possibility have their own legislation.
Sunflower seed COMMODITY PROFILE
 Contents 1. Description of the industry............................ 1 2. Marketing structure................................. 3 3. Strategic challenges................................ 6 4. Other information..................................
GENERAL AGREEMENT ON TARIFFS AND TRADE
 GENERAL AGREEMENT ON TARIFFS AND TRADE RESTRICTED COM.TD/W/140/Add.2 8 November 1971 Limited Distribution Group on Residual Restrictions Original: English INFORMATION ON ADDITIONAL PRODUCTS SUGGESTED FOR
Handbook for Wine Supply Balance Sheet. Wines
 EUROPEAN COMMISSION EUROSTAT Directorate E: Sectoral and regional statistics Unit E-1: Agriculture and fisheries Handbook for Wine Supply Balance Sheet Wines Revision 2015 1 INTRODUCTION Council Regulation
Contents 1. Introduction Chicory processing Global Trends in Production, Producer Prices and Trade of Chicory...
 i ii Contents 1. Introduction... 1 2. Chicory processing... 1 3. Global Trends in Production, Producer Prices and Trade of Chicory... 3 4. SA s Production, Producer Prices, Gross Value and Trade Patterns
MARKET NEWSLETTER No 127 May 2018
 Olive growing in Argentina At the invitation of the Argentine authorities, the 107th session of the Council of Members will be held in Buenos Aires (Argentina) from 18 to 21 June 2018. Argentina was the
The state of the European GI wines sector: a comparative analysis of performance
 The state of the European GI wines sector: a comparative analysis of performance Special Report November 2017 1. Overview of a growing global wine market Wine is one of the most globalised products. The
QUALITY DESCRIPTOR / REPRESENTATIONS GUIDELINES FOR THE
 QUALITY DESCRIPTOR / REPRESENTATIONS GUIDELINES FOR THE AUSTRALIAN FRUIT JUICE INDUSTRY Adopted 30 September 2005 Reviewed 12 January 2007 CODE OF PRACTICE QUALITY DESCRIPTOR/REPRESENTATIONS GUIDELINES
Ideas for group discussion / exercises - Section 3 Applying food hygiene principles to the coffee chain
 Ideas for group discussion / exercises - Section 3 Applying food hygiene principles to the coffee chain Activity 4: National level planning Reviewing national codes of practice and the regulatory framework
Valeria Panzeri Renée Crous(MSc) Dr Hélène Nieuwoudt
 Dr Hélène Nieuwoudt") Sensory Characterisation of oldvine Chenin blanc wine A Scientific Perspective on thein-mouth sensations in old-vine Chenin blanc wines and sensory profiling of this category Valeria Panzeri Renée Crous(MSc)
Sensory Characterisation of oldvine Chenin blanc wine A Scientific Perspective on thein-mouth sensations in old-vine Chenin blanc wines and sensory profiling of this category Valeria Panzeri Renée Crous(MSc)
Grape Growers of Ontario Developing key measures to critically look at the grape and wine industry
 Grape Growers of Ontario Developing key measures to critically look at the grape and wine industry March 2012 Background and scope of the project Background The Grape Growers of Ontario GGO is looking
Can You Tell the Difference? A Study on the Preference of Bottled Water. [Anonymous Name 1], [Anonymous Name 2]
![Can You Tell the Difference? A Study on the Preference of Bottled Water. [Anonymous Name 1], [Anonymous Name 2]](/thumbs/78/76759741.jpg "Can You Tell the Difference? A Study on the Preference of Bottled Water. [Anonymous Name 1], [Anonymous Name 2]") Can You Tell the Difference? A Study on the Preference of Bottled Water [Anonymous Name 1], [Anonymous Name 2] Abstract Our study aims to discover if people will rate the taste of bottled water differently
Can You Tell the Difference? A Study on the Preference of Bottled Water [Anonymous Name 1], [Anonymous Name 2] Abstract Our study aims to discover if people will rate the taste of bottled water differently
Avocado sugars key to postharvest shelf life?
 Proceedings VII World Avocado Congress 11 (Actas VII Congreso Mundial del Aguacate 11). Cairns, Australia. 5 9 September 11 Avocado sugars key to postharvest shelf life? I. Bertling and S. Z. Tesfay Horticultural
FREQUENTLY ASKED QUESTIONS (FAQS)
") FREQUENTLY ASKED QUESTIONS (FAQS) Table of Contents CAS FAQ... 4 1.1... CAS FAQ 4 2 1.1.1 What is Coffee Assurance Services (CAS)? 4 1.1.2 What is the vision of Coffee Assurance Services? 4 1.1.3 What
FREQUENTLY ASKED QUESTIONS (FAQS) Table of Contents CAS FAQ... 4 1.1... CAS FAQ 4 2 1.1.1 What is Coffee Assurance Services (CAS)? 4 1.1.2 What is the vision of Coffee Assurance Services? 4 1.1.3 What
North America Ethyl Acetate Industry Outlook to Market Size, Company Share, Price Trends, Capacity Forecasts of All Active and Planned Plants
 North America Ethyl Acetate Industry Outlook to 2016 - Market Size, Company Share, Price Trends, Capacity Forecasts of All Active and Planned Plants Reference Code: GDCH0416RDB Publication Date: October
donors forum: Project development/ funding AND Partnership Fair
 122ND SESSION OF THE INTERNATIONAL COFFEE COUNCIL AND ASSOCIATED MEETINGS donors forum: Project development/ funding AND Partnership Fair 18 SEPTEMBER 2018, 14:30-16:30 INTERNATIONAL MARITIME ORGANIZATION
Reliable Profiling for Chocolate and Cacao
 Reliable Profiling for Chocolate and Cacao Models of Flavour, Quality Scoring and Cultural Profiling Dr. Alexander Rast University of Southampton Martin Christy Seventy% Dr. Maricel Presilla Gran Cacao
Global Foodservice Equipment Market: Industry Analysis & Outlook ( )
") Industry Research by Koncept Analytics Global Foodservice Equipment Market: Industry Analysis & Outlook ----------------------------------------- (2017-2021) September 2017 1 Executive Summary The foodservice
Industry Research by Koncept Analytics Global Foodservice Equipment Market: Industry Analysis & Outlook ----------------------------------------- (2017-2021) September 2017 1 Executive Summary The foodservice
The aim of the thesis is to determine the economic efficiency of production factors utilization in S.C. AGROINDUSTRIALA BUCIUM S.A.
 The aim of the thesis is to determine the economic efficiency of production factors utilization in S.C. AGROINDUSTRIALA BUCIUM S.A. The research objectives are: to study the history and importance of grape
QUALITY, PRICING AND THE PERFORMANCE OF THE WHEAT INDUSTRY IN SOUTH AFRICA
 QUALITY, PRICING AND THE PERFORMANCE OF THE WHEAT INDUSTRY IN SOUTH AFRICA 21 September 2015 Dr Johnny van der Merwe Lecturer / Agricultural economics (Prof HD van Schalkwyk and Dr PC Cloete) So what motivated
STATE OF THE VITIVINICULTURE WORLD MARKET
 STATE OF THE VITIVINICULTURE WORLD MARKET April 2015 1 Table of contents 1. 2014 VITIVINICULTURAL PRODUCTION POTENTIAL 3 2. WINE PRODUCTION 5 3. WINE CONSUMPTION 7 4. INTERNATIONAL TRADE 9 Abbreviations:
Work Sample (Minimum) for 10-K Integration Assignment MAN and for suppliers of raw materials and services that the Company relies on.
 for 10-K Integration Assignment MAN and for suppliers of raw materials and services that the Company relies on.") Work Sample (Minimum) for 10-K Integration Assignment MAN 4720 Employee Name: Your name goes here Company: Starbucks Date of Your Report: Date of 10-K: PESTEL 1. Political: Pg. 5 The Company supports the
Work Sample (Minimum) for 10-K Integration Assignment MAN 4720 Employee Name: Your name goes here Company: Starbucks Date of Your Report: Date of 10-K: PESTEL 1. Political: Pg. 5 The Company supports the
WORLDWIDE SYMPOSIUM ON GEOGRAPHICAL INDICATIONS
 WORLDWIDE SYMPOSIUM ON GEOGRAPHICAL INDICATIONS 20 22 OCTOBER 2015 BUDAPEST TRADE MARKS AND GEOGRAPHICAL INDICATIONS FLEURETTE COETZEE (MS) SENIOR MANAGER: TRADE MARKS CIPC 20 OCTOBER 2015 CONTENT INTRODUCTION
THE WINEMAKER S TOOL KIT UCD V&E: Recognizing Non-Microbial Taints; May 18, 2017
 THE WINEMAKER S TOOL KIT UCD V&E: Recognizing Non-Microbial Taints; May 18, 2017 Sue Langstaff, Sensory Scientist Applied Sensory, LLC The first difficulty that tasters encounter is to find and to translate
World of Wine: From Grape to Glass
 World of Wine: From Grape to Glass Course Details No Prerequisites Required Course Dates Start Date: th 18 August 2016 0:00 AM UTC End Date: st 31 December 2018 0:00 AM UTC Time Commitment Between 2 to
Is Fair Trade Fair? ARKANSAS C3 TEACHERS HUB. 9-12th Grade Economics Inquiry. Supporting Questions
 9-12th Grade Economics Inquiry Is Fair Trade Fair? Public Domain Image Supporting Questions 1. What is fair trade? 2. If fair trade is so unique, what is free trade? 3. What are the costs and benefits
PRODUCT REGISTRATION: AN E-GUIDE
 PRODUCT REGISTRATION: AN E-GUIDE Introduction In the EU, biocidal products are only allowed on the market if they ve been authorised by the competent authorities in the Member States in which they will
Reaction to the coffee crisis at the beginning of last decade
 2000-2010 AND BEYOND: A PATH TO SUSTAINABILITY IN THE COFFEE SECTOR Andrea Illy Guatemala City Feb 28, 2010 Reaction to the coffee crisis at the beginning of last decade In order to resist the possible
Grower Summary TF 170. Plums: To determine the performance of 6 new plum varieties. Annual 2012
 Grower Summary TF 170 Plums: To determine the performance of 6 new plum varieties Annual 2012 Disclaimer AHDB, operating through its HDC division seeks to ensure that the information contained within this
(No. 238) (Approved September 3, 2003) AN ACT
 (Approved September 3, 2003) AN ACT") (H. B. 651) (No. 238) (Approved September 3, 2003) AN ACT To add Sections 2-A and 2-B to Act No. 60 of June 19, 1964, as amended, to specify the parameters and characteristics of Puerto Rican gourmet coffee
(H. B. 651) (No. 238) (Approved September 3, 2003) AN ACT To add Sections 2-A and 2-B to Act No. 60 of June 19, 1964, as amended, to specify the parameters and characteristics of Puerto Rican gourmet coffee
J / A V 9 / N O.
 July/Aug 2003 Volume 9 / NO. 7 See Story on Page 4 Implications for California Walnut Producers By Mechel S. Paggi, Ph.D. Global production of walnuts is forecast to be up 3 percent in 2002/03 reaching
The European Hemp Industry: Cultivation, processing and applications for fibres, shivs, seeds and flowers
 The European Hemp Industry: Cultivation, processing and applications for fibres, shivs, seeds and flowers Authors: Michael Carus, Luis Sarmento April 2016 Hemp is a multi-purpose crop, delivering fibres,
Proposal for the Approval of a New Subdivision of the. Okanagan Valley Geographical Indication NARAMATA BENCH SUB-GI.
 Proposal for the Approval of a New Subdivision of the Okanagan Valley Geographical Indication NARAMATA BENCH SUB-GI 23 April 2018 Prepared by the Sub-GI Committee, Naramata Bench Introduction This document
Canada-EU Free Trade Agreement (CETA)
") Canada-EU Free Trade Agreement (CETA) The Issue: Following 5-years of negotiation, CETA was signed in principle on October 18, 2013, and signed officially by Prime Minister Trudeau on October 29, 2016,
Canada-EU Free Trade Agreement (CETA) The Issue: Following 5-years of negotiation, CETA was signed in principle on October 18, 2013, and signed officially by Prime Minister Trudeau on October 29, 2016,
2. The proposal has been sent to the Virtual Screening Committee (VSC) for evaluation and will be examined by the Executive Board in September 2008.
 for evaluation and will be examined by the Executive Board in September 2008.") WP Board 1052/08 International Coffee Organization Organización Internacional del Café Organização Internacional do Café Organisation Internationale du Café 20 August 2008 English only Projects/Common
WP Board 1052/08 International Coffee Organization Organización Internacional del Café Organização Internacional do Café Organisation Internationale du Café 20 August 2008 English only Projects/Common
COLORADO REVISED STATUTES, TITLE 35, AGRICULTURE
 COLORADO REVISED STATUTES, TITLE 35, AGRICULTURE ARTICLE 29.5: COLORADO WINE INDUSTRY DEVELOPMENT ACT Section 35-29.5-101. Short title. 35-29.5-101.5. Legislative declaration. 35-29.5-102. Definitions.
WP Council 264/ February 2016 Original: English. Guidelines for the preparation of country coffee profiles
 WP Council 264/16 15 February 2016 Original: English E International Coffee Council 116 th Session 9 11 March 2016 Addis Ababa, Ethiopia Guidelines for the preparation of country coffee profiles Background
Washington Wine Commission: Wine industry grows its research commitment
 PROGRESS EDITION MARCH 22, 2016 10:33 PM Washington Wine Commission: Wine industry grows its research commitment HIGHLIGHTS New WSU Wine Science Center a significant step up for industry Development of
This document is a preview generated by EVS
 TECHNICAL REPORT ISO/TR 12591 First edition 2013-12-15 White tea Definition Thé blanc Définition Reference number ISO 2013 COPYRIGHT PROTECTED DOCUMENT ISO 2013 All rights reserved. Unless otherwise specified,
Tea Statistics Report 2015
 Tea Statistics Report 215 Introduction This report presents the scope and scale of the UTZ tea program in 215. Throughout this report tea also includes rooibos unless otherwise specified. The statistics
INVESTIGATIONS INTO THE RELATIONSHIPS OF STRESS AND LEAF HEALTH OF THE GRAPEVINE (VITIS VINIFERA L.) ON GRAPE AND WINE QUALITIES
 ON GRAPE AND WINE QUALITIES") INVESTIGATIONS INTO THE RELATIONSHIPS OF STRESS AND LEAF HEALTH OF THE GRAPEVINE (VITIS VINIFERA L.) ON GRAPE AND WINE QUALITIES by Reuben Wells BAgrSc (Hons) Submitted in fulfilment of the requirements
INVESTIGATIONS INTO THE RELATIONSHIPS OF STRESS AND LEAF HEALTH OF THE GRAPEVINE (VITIS VINIFERA L.) ON GRAPE AND WINE QUALITIES by Reuben Wells BAgrSc (Hons) Submitted in fulfilment of the requirements
CHAPTER 1 INTRODUCTION
 CHAPTER 1 INTRODUCTION 1.1. Background Bread is one of the most widely-consumed food products in the world and breadmaking technology is probably one of the oldest technologies known. This technology has
Michigan Grape & Wine Industry Council Annual Report 2012
 Michigan Grape & Wine Industry Council Annual Report 2012 Title: Determining pigment co-factor content in commercial wine grapes and effect of micro-oxidation in Michigan Wines Principal Investigator:
LEARNING AS A MACHINE CROSS-OVERS BETWEEN HUMANS AND MACHINES
 LEARNING AS A MACHINE CROSS-OVERS BETWEEN HUMANS AND MACHINES Mireille Hildebrandt Faculty of Law & Criminology, Vrije Universiteit Brussel Faculty of Science, Radboud University Nijmegen 27 April 2016
Palm Oil Q&A. 1. What is palm oil? 2. Why does Ferrero use palm oil? 3. Does palm oil have adverse health effects? 4. Why don't you replace palm oil?
 Palm Oil Q&A 1. What is palm oil? Palm oil is produced from the fruit pulp of the oil palm tree (Elaeis guineensis). The fruit is about the size of a large olive, rich in oil (45%-65%) and is naturally
Market demand study on fresh products and derived products of banana, jackfruit, and cashew nut in Phnom Penh market
 Market demand study on fresh products and derived products of banana, jackfruit, and cashew nut in Phnom Penh market SOK Pisith, Dr. HUL Seingheng Department of Food Technology and Chemical Engineering,
Fromage Frais and Quark (Dairy and Soy Food) Market in Australia - Outlook to 2020: Market Size, Growth and Forecast Analytics
 Market in Australia - Outlook to 2020: Market Size, Growth and Forecast Analytics") Fromage Frais and Quark (Dairy and Soy Food) Market in Australia - Outlook to 2020: Market Size, Growth and Forecast Analytics Fromage Frais and Quark (Dairy and Soy Food) Market in Australia - Outlook
Fromage Frais and Quark (Dairy and Soy Food) Market in Australia - Outlook to 2020: Market Size, Growth and Forecast Analytics Fromage Frais and Quark (Dairy and Soy Food) Market in Australia - Outlook
(A report prepared for Milk SA)
") South African Milk Processors Organisation The voluntary organisation of milk processors for the promotion of the development of the secondary dairy industry to the benefit of the dairy industry, the consumer
South African Milk Processors Organisation The voluntary organisation of milk processors for the promotion of the development of the secondary dairy industry to the benefit of the dairy industry, the consumer
Market, Regulatory & Policy Update for Plant-based Ingredients
 Market, Regulatory & Policy Update for Plant-based Ingredients 11th PROTEIN SUMMIT, Lille, 24-26 October 2018 Yves Goemans, Chairman EUVEPRO, European Vegetable Protein Association OUTLINE I. Introducing
Wine-Tasting by Numbers: Using Binary Logistic Regression to Reveal the Preferences of Experts
 Wine-Tasting by Numbers: Using Binary Logistic Regression to Reveal the Preferences of Experts When you need to understand situations that seem to defy data analysis, you may be able to use techniques
Identification of Adulteration or origins of whisky and alcohol with the Electronic Nose
 Identification of Adulteration or origins of whisky and alcohol with the Electronic Nose Dr Vincent Schmitt, Alpha M.O.S AMERICA schmitt@alpha-mos.com www.alpha-mos.com Alpha M.O.S. Eastern Analytical
GREAT WINE CAPITALS GLOBAL NETWORK MARKET SURVEY FINANCIAL STABILITY AND VIABILITY OF WINE TOURISM BUSINESS IN THE GWC
 GREAT WINE CAPITALS GLOBAL NETWORK MARKET SURVEY 2010-2011 FINANCIAL STABILITY AND VIABILITY OF WINE TOURISM BUSINESS IN THE GWC June 2011 2 / 6 INTRODUCTION This market survey has focused on how the economic
The European Hemp Industry: Cultivation, processing and applications for fibres, shivs, seeds and flowers
 The European Hemp Industry: Cultivation, processing and applications for fibres, shivs, seeds and flowers Authors: Michael Carus 2017-03-26 Introduction Hemp is a multi-purpose crop, delivering fibres,
WORKING GROUP ON TEA TRADE AND QUALITY. Intersessional Meeting of the Intergovernmental Group on Tea Rome, 5-6 May 2014
 WORKING GROUP ON TEA TRADE AND QUALITY Intersessional Meeting of the Intergovernmental Group on Tea Rome, 5-6 May 2014 Intersessional Meeting of the FAO/IGG ON TEA WORKING GROUP ON TEA TRADE & QUALITY
Bottled Water Category Overview
 Bottled Water Category Overview 2014-2015 Disclaimer The following information is offered in good faith and represents an unqualified interpretation of a range of industry commentary and market data. It
The supply and demand for oilseeds in South Africa
 THIS REPORT CONTAINS ASSESSMENTS OF COMMODITY AND TRADE ISSUES MADE BY USDA STAFF AND NOT NECESSARILY STATEMENTS OF OFFICIAL U.S. GOVERNMENT POLICY Required Report - public distribution Date: GAIN Report
RESOLUTION OIV-ECO
 RESOLUTION OIV-ECO 563-2016 TRAINING PROGRAMS FOR OENOLOGISTS THE GENERAL ASSEMBLY, based on the work of the FORMAT Expert Group, CONSIDERING the resolution OIV-ECO 492-2013 providing the definition of
Tanzania. Coffee Annual. Tanzania Coffee Annual Report
 THIS REPORT CONTAINS ASSESSMENTS OF COMMODITY AND TRADE ISSUES MADE BY USDA STAFF AND NOT NECESSARILY STATEMENTS OF OFFICIAL U.S. GOVERNMENT POLICY Required Report - public distribution Date: GAIN Report
Condensed tannin and cell wall composition in wine grapes: Influence on tannin extraction from grapes into wine
 Condensed tannin and cell wall composition in wine grapes: Influence on tannin extraction from grapes into wine by Rachel L. Hanlin Thesis submitted for Doctor of Philosophy The University of Adelaide
NAMC Presentation 8 MARCH Sharron Marco-Thyse Chairperson
 NAMC Presentation 8 MARCH 2012 Sharron Marco-Thyse Chairperson 1 The wine industry contributes some R163 billion a year to South Africa s GDP An additional R4.2 billion is generated annually through wine
World of Wine: From Grape to Glass Syllabus
 World of Wine: From Grape to Glass Syllabus COURSE OVERVIEW Have you always wanted to know more about how grapes are grown and wine is made? Perhaps you like a specific wine, but can t pinpoint the reason
ANALYSIS OF THE EVOLUTION AND DISTRIBUTION OF MAIZE CULTIVATED AREA AND PRODUCTION IN ROMANIA
 ANALYSIS OF THE EVOLUTION AND DISTRIBUTION OF MAIZE CULTIVATED AREA AND PRODUCTION IN ROMANIA Agatha POPESCU University of Agricultural Sciences and Veterinary Medicine, Bucharest, 59 Marasti, District
Using Growing Degree Hours Accumulated Thirty Days after Bloom to Help Growers Predict Difficult Fruit Sizing Years
 Using Growing Degree Hours Accumulated Thirty Days after Bloom to Help Growers Predict Difficult Fruit Sizing Years G. Lopez 1 and T. DeJong 2 1 Àrea de Tecnologia del Reg, IRTA, Lleida, Spain 2 Department
Wine Clusters Equal Export Success
 University of Wollongong Research Online Faculty of Commerce - Papers (Archive) Faculty of Business 2004 Wine Clusters Equal Export Success D. K. Aylward University of Wollongong, daylward@uow.edu.au Publication
2016 China Dry Bean Historical production And Estimated planting intentions Analysis
 2016 China Dry Bean Historical production And Estimated planting intentions Analysis Performed by Fairman International Business Consulting 1 of 10 P a g e I. EXECUTIVE SUMMARY A. Overall Bean Planting
GUIDELINES TO DETERMINE THE EFFECT OF FUNGICIDAL AGRICULTURAL REMEDIES ON FERMENTATION PROCESSES AND WINE QUALITY
 GUIDELINES TO DETERMINE THE EFFECT OF FUNGICIDAL AGRICULTURAL REMEDIES ON FERMENTATION PROCESSES AND WINE QUALITY Issued by the Registrar: Act No. 36 of 1947, Private Bag X343, Pretoria 0001, Republic
PRODUCTION OF PARTICLE BOARD FROM AGRICULTURAL WASTE ~.
 PRODUCTION OF PARTICLE BOARD FROM AGRICULTURAL WASTE ~.. USING THE COMPOSITE OF COCONUT (Cocos 'nucijera) ANJJ PALM KERNEL SHELLS (Elaeis guineesis) WITH GUM ARABIC AS BINDING RESINS BY ADEGBEMI, JACOB
TRAINING MODULE ABOUT GEOGRAPHICAL INDICATIONS Amman, Jordan, Febr , Didier CHABROL
 TRAINING MODULE ABOUT GEOGRAPHICAL INDICATIONS Amman, Jordan, Febr. 22-23, 2011 Didier CHABROL Introduction to the GI concept History Characteristics Key terms Antiquity In the Roman empire, some wines
Oregon Wine Advisory Board Research Progress Report
 Grape Research Reports, 1996-97: Fermentation Processing Effects on Anthocyanin and... Page 1 of 10 Oregon Wine Advisory Board Research Progress Report 1996-1997 Fermentation Processing Effects on Anthocyanin
TECHNOLOGY PROBLEMS AND ISSUES ENCOUNTERED BY THE SRI LANKAN TEA SMALL HOLDING SECTOR, A CASE STUDY BASED ON SOUTHERN SRI LANKA
 TECHNOLOGY PROBLEMS AND ISSUES ENCOUNTERED BY THE SRI LANKAN TEA SMALL HOLDING SECTOR, A CASE STUDY BASED ON SOUTHERN SRI LANKA Gonapinuwela Vithanage Shelton Jayarathna 10/9011 Degree of Master of Business
STATE OF THE VITIVINICULTURE WORLD MARKET
 STATE OF THE VITIVINICULTURE WORLD MARKET April 2018 1 Table of contents 1. VITICULTURAL PRODUCTION POTENTIAL 3 2. WINE PRODUCTION 5 3. WINE CONSUMPTION 7 4. INTERNATIONAL TRADE 9 Abbreviations: kha: thousands
Geographical Indications (Wines and Spirits) Registration Amendment Bill Initial Briefing to the Primary Production Select Committee
 Registration Amendment Bill Initial Briefing to the Primary Production Select Committee") Geographical Indications (Wines and Spirits) Registration Amendment Bill 2015 Initial Briefing to the Primary Production Select Committee 5 May 2016 1. Introduction 1. This briefing sets out the purpose
Geographical Indications (Wines and Spirits) Registration Amendment Bill 2015 Initial Briefing to the Primary Production Select Committee 5 May 2016 1. Introduction 1. This briefing sets out the purpose
Development and characterization of wheat breads with chestnut flour. Marta Gonzaga. Raquel Guiné Miguel Baptista Luísa Beirão-da-Costa Paula Correia
 Development and characterization of wheat breads with chestnut flour Marta Gonzaga Raquel Guiné Miguel Baptista Luísa Beirão-da-Costa Paula Correia 1 Introduction Bread is one of the oldest functional
IMSI Annual Business Meeting Amherst, Massachusetts October 26, 2008
 Consumer Research to Support a Standardized Grading System for Pure Maple Syrup Presented to: IMSI Annual Business Meeting Amherst, Massachusetts October 26, 2008 Objectives The objectives for the study