Investor Presentation
|
|
|
- Margaret Bishop
- 5 years ago
- Views:
Transcription


1 Investor Presentation


2 COMPANY OVERVIEW

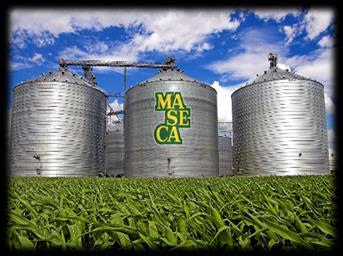
3 GRUMA IS THE WORLD S LARGEST CORN FLOUR AND TORTILLA PRODUCER, WITH OPERATIONS IN THE UNITED STATES, MEXICO, CENTRAL AMERICA, EUROPE, ASIA AND OCEANIA Family: 52% Float: 48% Subsidiaries GRUMA USA Products Corn flour Tortillas, other % Sales % EBITDA GRUMA, S.A.B. de C.V. BMV: GRUMAB GIMSA GRUMA EUROPE Corn flour Corn flour, grits Tortillas, other Sales: US$3.7 billion EBITDA 2 : US$601 million Market Cap: US$5.2 billion 3 GRUMA CENTROAMÉRICA GRUMA ASIA-OCEANÍA MISSION MEXICO TECHNOLOGY AND SERVICES ELIMINATIONS 1 Convenience translation at an average exchange rate of Ps /dollar for Corn flour, other Tortillas, other EBITDA = Operating income + depreciation, amortization and impairment of long lived assets +(-) expenses (income) unrelated to core business operations. 3 As of March 9, 2018
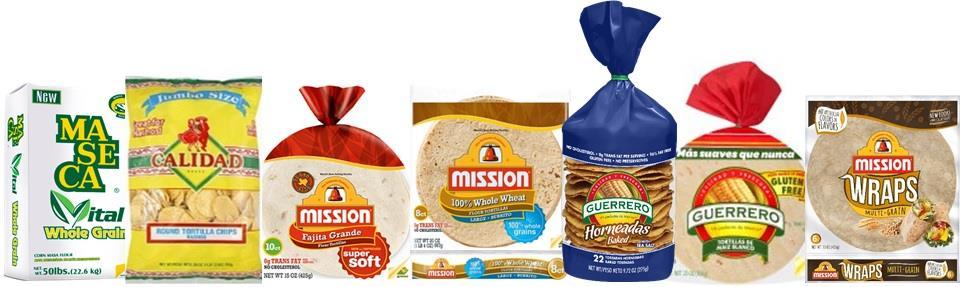
4 GRUMA S LEADING BRANDS SHOW STRONG AWARENESS AND CONSUMER LOYALTY REGION BRANDS PRODUCTS POSITION UNITED STATES CORN FLOUR TORTILLAS TORTILLAS FIRST FIRST SECOND MEXICO CORN FLOUR FIRST CENTRAL AMERICA CORN FLOUR TORTILLAS TORTILLAS FIRST FIRST SECOND EUROPE TORTILLAS THIRD ASIA & OCEANIA TORTILLAS FIRST 4


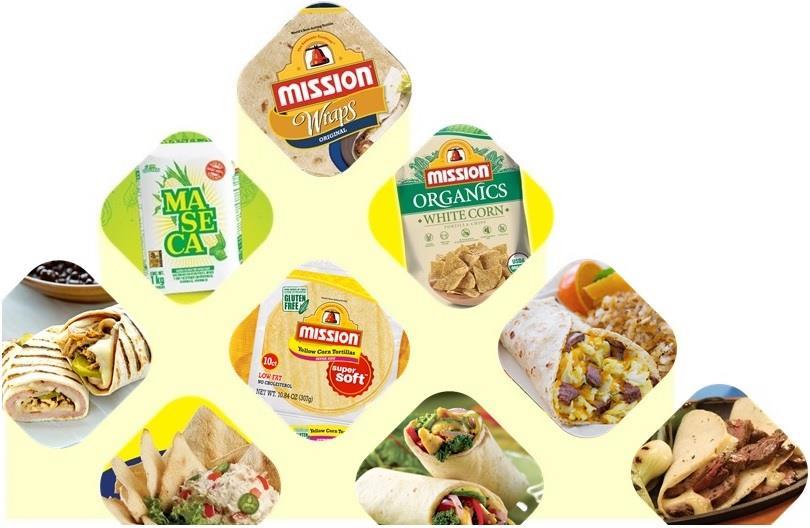
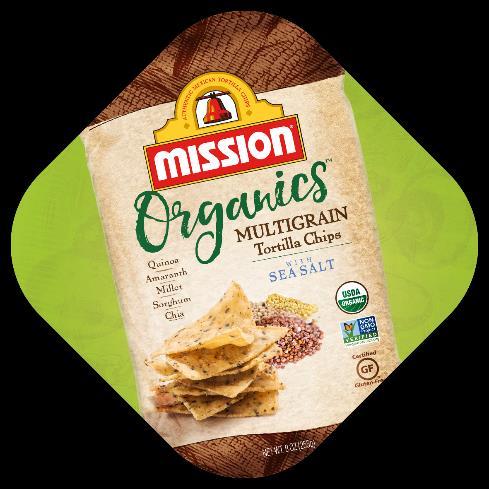
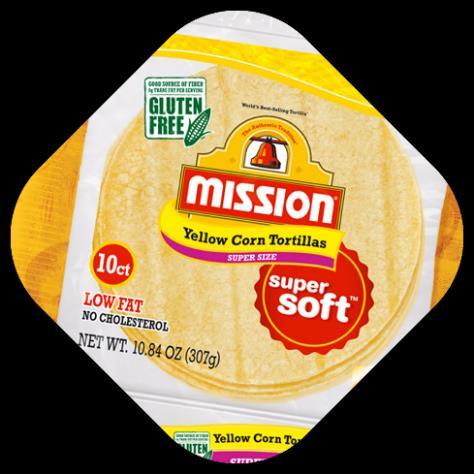
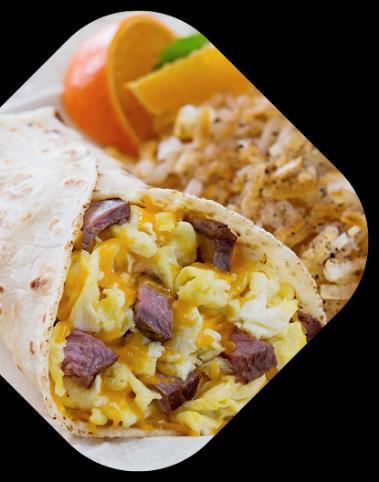
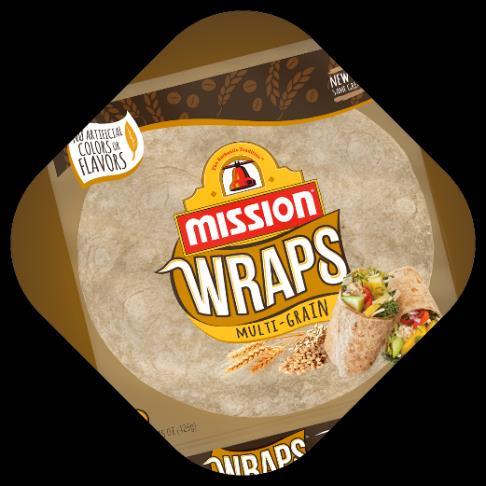
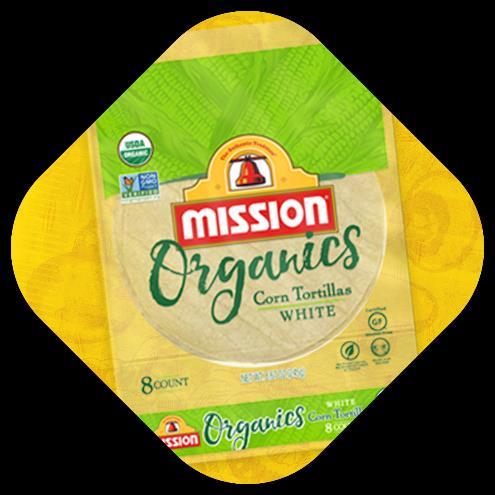
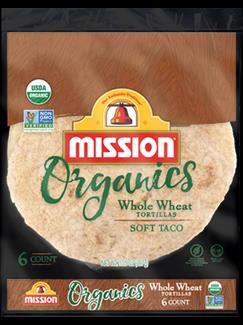
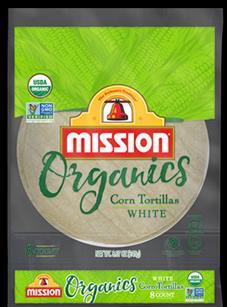
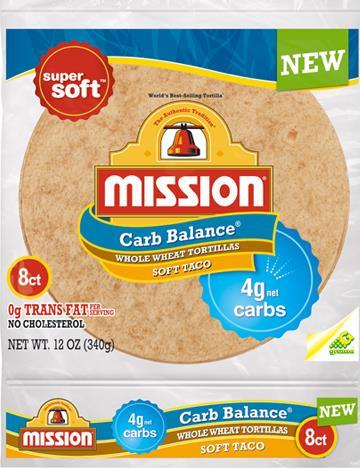
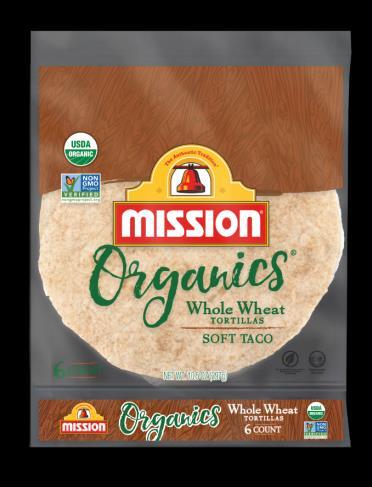
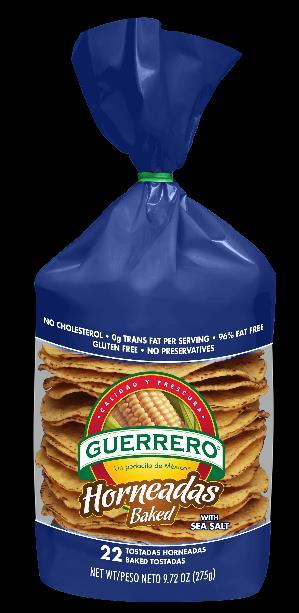
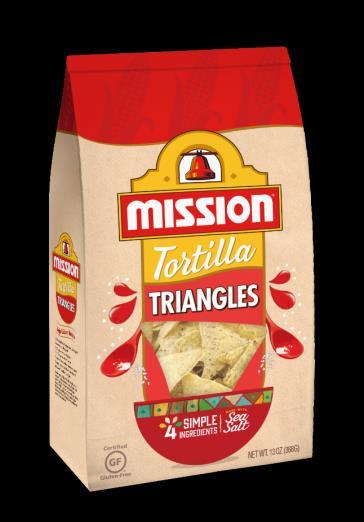
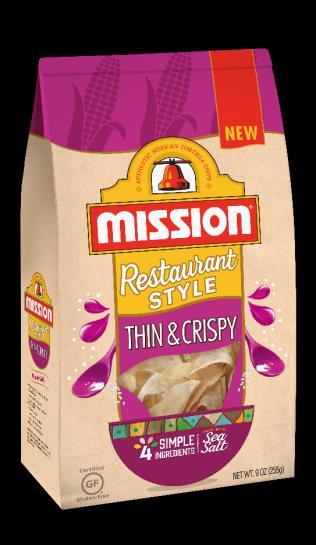
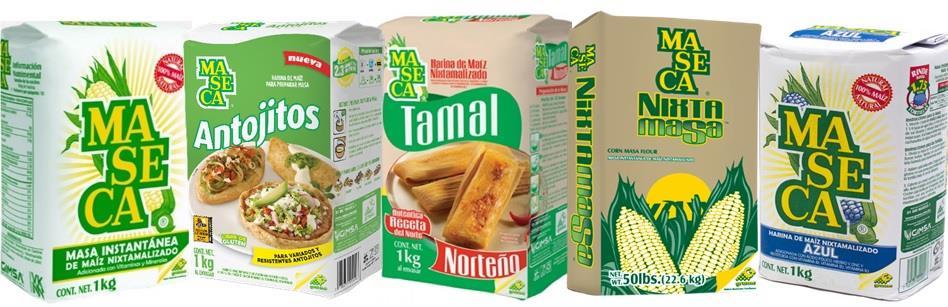
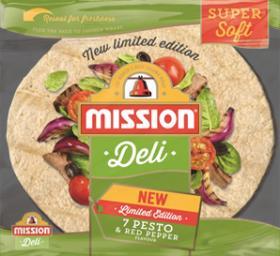
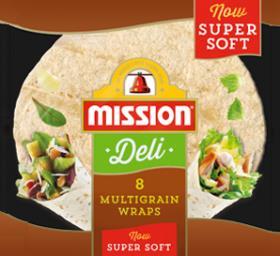
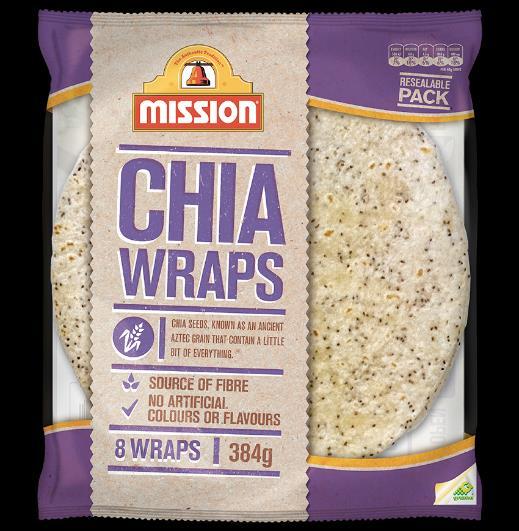
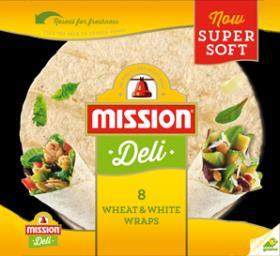
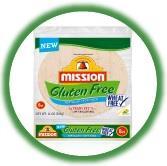
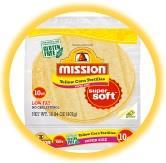
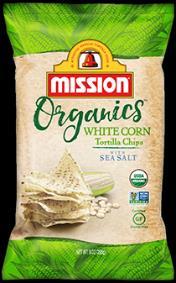
5 GRUMA IS LEADING IMPORTANT PRODUCT INNOVATION TO SATISFY THE GROWING MARKET OF HEALTH-ORIENTED CONSUMERS Consumers replacing breads with wraps Increased popularity of healthier snack options, such as gluten-free organic corn chips To satisfy these megatrends, GRUMA offers a line of healthier alternatives, such as: Organic Gluten-free Carb-balance Whole-wheat Multi-grain Fat-free Chia and quinoa wraps Baked tostadas As a result, our healthier product lines are generating low double-digit sales growth 5


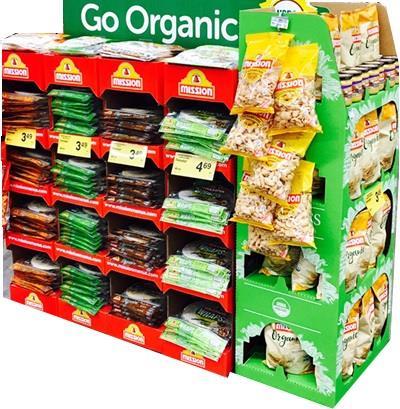

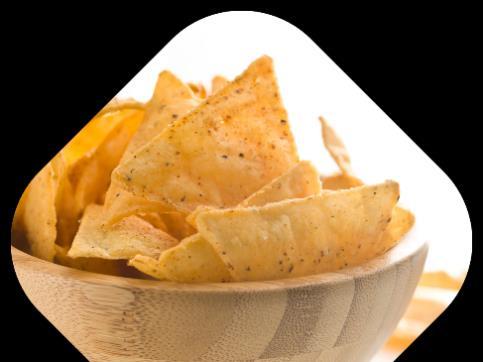
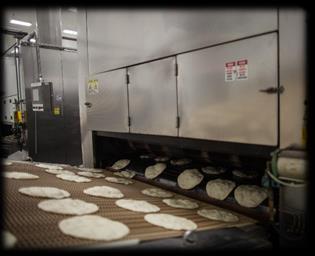
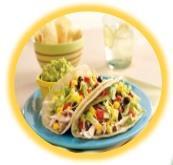
6 6 NEW PRODUCT LAUNCHINGS AND COLORFUL IN-STORE DISPLAYS ENHANCE SALES OF VALUE-ADDED AND HIGHER-MARGIN PRODUCTS
7 GRUMA HAS ACHIEVED CONSISTENT GROWTH IN NET SALES DRIVEN MAINLY BY THE U.S. OPERATIONS GRUMA Net Sales (millions of pesos) CAGR: 14 17: 12% GRUMA Volume (thousand metric tons) CAGR: 14 17: 3% 58,279 68,206 70,581 3,674 3,831 3,959 4,009 49,
8 EBITDA GENERATION HAS INCREASED AT A HIGHER RATE THAN NET SALES BASED ON MARGIN IMPROVEMENTS, ALSO LARGELY DRIVEN BY THE U.S. OPERATIONS 7,493 GRUMA EBITDA (millions of pesos) CAGR: 14 17: 15% 9,139 10,964 11, EBITDA Mg (%)
9 BETTER EBITDA GENERATION HAS CONTRIBUTED TO GRUMA S SOLID FINANCIAL POSITION GRUMA Debt (millions of US$) GRUMA Net Debt/EBITDA (times) 1, DEC'14 DEC'15 DEC'16 DEC'17 DEC'14 DEC'15 DEC'16 DEC'17 9
10 GRUMA ENJOYS A COMFORTABLE DEBT MATURITY PROFILE GRUMA Debt 1 Maturity Profile As of December 31, 2017 (millions of US$) Weighted average interest rate as of December 31, 2017 is 3.96%.
11 THIS HEALTHY FINANCIAL STRUCTURE HAS ENABLED GRUMA TO BECOME A DIVIDEND-PAYING COMPANY GRUMA Dividend Payments (millions of pesos) 1.7 % 1.0 % 0.8 % 0.8 % 1, Total Dividend Payment ($) Dividend Yield 11


12 MAIN SUBSIDIARIES

13 GRUMA USA
14 GRUMA USA IS THE LARGEST SUBSIDIARY, AND THE LEADING CORN FLOUR AND TORTILLA PRODUCER IN THE UNITED STATES Net Sales 2017: US$2.1 billion Fife, WA GRUMA USA McMinnville, OR Hayward, CA Madera, CA Fresno, CA Panorama City, CA Olympic, CA Rancho Cucamonga, CA Albuquerque, NM Tempe, AZ Pueblo, CO San Antonio, TX Corn flour mills (6) Tortilla plants (20) * Temporarily closed New Brighton, MN Plainview, TX * Omaha, NE Amarillo, TX Edinburg, TX Dallas, TX Houston, TX Evansville, IN Henderson, KY Jefferson, GA Mountain Top, PA Goldsboro, NC Lawrenceville, GA Lakeland, FL Tortilla Operations 80% 20 Plants in the U.S. Installed Capacity: 960,000 Metric tons/year Corn flour tortillas Wheat flour tortillas Corn chips Other related products Corn Flour Operations 20% 6 Mills in the U.S. Installed Capacity: 800,000 Metric tons/year Tortilla corn flour Chip corn flour 14
15 THERE IS GROWTH POTENTIAL FOR THE U.S. TORTILLA AND CORN FLOUR INDUSTRIES Growth Drivers Hispanic Population 1 18% of total U.S. population, out of which 63% are Mexican Hispanic population increased 63% between 2000 and 2016, accounting for half of total U.S. population growth Popularity of Mexican Food Non-Hispanics account for the majority of Mexican food service purchases The number of Mexican food restaurants continues to grow More restaurants are featuring Mexican dishes in their menus Estimated U.S. Markets Tortillas/Tortilla chips US$5 billion Corn Flour 2 US$1.3 billion Adoption of tortillas in non-mexican dishes (wraps) Wraps, burritos, tacos, quesadillas, nachos, etc. becoming mainstream foods 15 1 United States Census Bureau, updated as of July Includes traditional method
16 GRUMA USA S RESULTS ARE REFLECTING THE COMPANY S EFFORTS TO ENHANCE VALUE CREATION GRUMA USA Net Sales (millions of US$) CAGR: 14 17: 2% GRUMA USA EBITDA (millions of US$) CAGR: 14 17: 9% 1,915 1,989 2,024 2, EBITDA Mg (%)
17 GIMSA
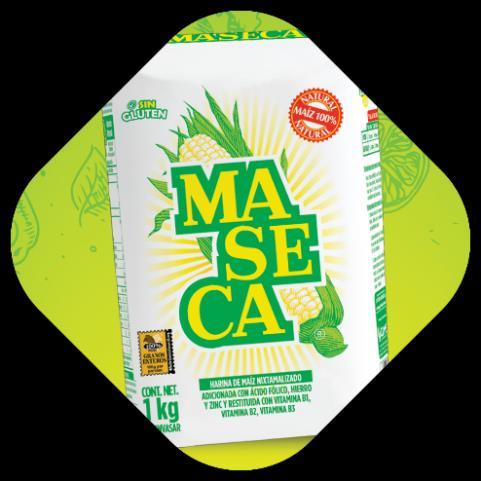
18 GIMSA IS GRUMA S SECOND LARGEST SUBSIDIARY AND THE LEADER OF THE CORN FLOUR INDUSTRY IN MEXICO Mexicali GIMSA Chihuahua Net Sales 2017: US$1 billion 1 Obregón Río Bravo 18 plants, with total annual capacity of 2.4 million metric tons of corn flour La Paz Culiacán Nuevo León Tampico Acaponeta Bajío * México Jalisco Celaya Veracruz Chalco Mérida GIMSA s market share within the corn flour industry is approximately 74% Chinameca Corn flour mills (18) * Temporarily closed Chiapas 18 1 Convenience translation at an average exchange rate of Ps /dollar for 2017.


19 CORN FLOUR IS ONLY USED TO PRODUCE 34% OF THE TORTILLAS IN MEXICO, THUS THERE IS A GREAT POTENTIAL FOR LONG-TERM GROWTH Potential Corn Flour Market in Mexico 7.3 Million Metric Tons of Corn Flour 1 US$4.1 billion 2 Corn Flour Market in Mexico 2.5 Million Metric Tons of Corn Flour 1 US$1.4 billion 2 GIMSA 25% HARIMASA 3% MINSA 20% MINSA 7% HARIMASA 1% OTHERS 2% CARGILL 1% GIMSA 74% CORN 66% OTHERS 1% 19 1 One corn flour metric ton = 1.8 tortilla metric tons. 2 Based on an average exchange rate of Ps /dollar for 2017.
20 GIMSA S SALES GROWTH MAINLY REFLECTS COMMERCIAL INITIATIVES AIMED AT STRENGTHENING CUSTOMER SERVICE GIMSA Net Sales (millions of pesos) CAGR: 14 17: 9% GIMSA EBITDA (millions of pesos) CAGR: 14 17: 3% 15,074 15,871 17,866 19,508 2,828 2,942 2,964 3, EBITDA Mg (%)


21 GRUMA EUROPE
22 GRUMA EUROPE IS THE COMPANY S THIRD LARGEST SUBSIDIARY, FOCUSED MAINLY ON THE TORTILLA BUSINESS Net Sales 2017: US$285 million 1 GRUMA Europe Corn flour mills (3) Tortilla plants (6) Tortilla Operations 70% 6 Plants in Europe England (2) The Netherlands Russia Spain (2) Installed Capacity: 169,000 Metric tons/year Wheat flour tortillas Corn chips Flatbreads Other related products Corn Milling Operations 30% 3 Mills in Europe Italy Ukraine Turkey Installed Capacity: 345,000 Metric tons/year Tortilla corn flour Chip corn flour Grits 22 1 Convenience translation at an average exchange rate of Ps /dollar for 2017.
23 THERE IS GROWTH POTENTIAL FOR THE TORTILLA MARKET IN EUROPE Growth Drivers Estimated European Markets Adoption of tortillas in non-mexican dishes (wraps) Wraps, burritos, tacos, quesadillas, nachos, etc. becoming mainstream foods Popularity of Mexican food The number of Mexican food restaurants continues to grow More restaurants are including Mexican dishes in their menus Tortillas/Tortilla chips US$1.2 billion Corn Milling US$400 million 23
24 GRUMA EUROPE IS WORKING TO IMPROVE ITS SALES MIX BY STRENGTHENING ITS PRESENCE IN THE RETAIL CHANNEL, THEREBY TEMPORARILY IMPACTING MARGINS DUE TOHIGHER SG&A EXPENSES GRUMA EUROPE Net Sales (millions of EUR$) CAGR: 14 17: 4% GRUMA EUROPE EBITDA (millions of EUR$) CAGR: 14 17: 6% EBITDA Mg (%)


25 ALL OF GRUMA S SUBSIDIARIES HAVE BEEN IMPLEMENTING INITIATIVES TO ENHANCE VALUE CREATION. WE HAVE SEEN, AND CONTINUE TO EXPECT, STRONGER EBITDA GENERATION ACROSS THE COMPANY
26 Contact Information Rogelio Sánchez +52 (81) Lilia Gómez +52 (81) Investor Relations +52 (81)
Investor Presentation
 Investor Presentation COMPANY OVERVIEW GRUMA IS THE WORLD S LARGEST CORN FLOUR AND TORTILLA PRODUCER, WITH OPERATIONS IN THE UNITED STATES, MEXICO, CENTRAL AMERICA, EUROPE, ASIA AND OCEANIA Family: 52%
GRUMA IS THE WORLD S LARGEST CORN FLOUR AND TORTILLA PRODUCER, WITH OPERATIONS IN THE UNITED STATES, MEXICO, CENTRAL AMERICA, EUROPE, ASIA AND OCEANIA
 COMPANY OVERVIEW GRUMA IS THE WORLD S LARGEST CORN FLOUR AND TORTILLA PRODUCER, WITH OPERATIONS IN THE UNITED STATES, MEXICO, CENTRAL AMERICA, EUROPE, ASIA AND OCEANIA Family: 52% Float: 48% Subsidiaries
I. COMPANY I. OVERVIEW
 I. COMPANY I. OVERVIEW GRUMA IS THE WORLD S LARGEST CORN FLOUR AND TORTILLA PRODUCER, WITH OPERATIONS IN THE UNITED STATES, MEXICO, CENTRAL AMERICA, EUROPE, ASIA AND OCEANIA S U B S I D I AR I E S P R
Investor Presentation
 Investor Presentation COMPANY OVERVIEW GRUMA IS THE WORLD S LARGEST CORN FLOUR AND TORTILLA PRODUCER, WITH OPERATIONS IN THE UNITED STATES, MEXICO, CENTRAL AMERICA, EUROPE, ASIA AND OCEANIA Family: 52%
... AND IT OWNS AN 8.8% 8% STAKE IN GRUPO FINANCIERO BANORTE, WHICH HAS A MARKET VALUE OF AROUND US$750 MILLION
 NOVEMBER 2010 I. COMPANY OVERVIEW GRUMA IS THE WORLD S LARGEST CORN FLOUR AND TORTILLA PRODUCER, WITH OPERATIONS IN THE UNITED STATES, MEXICO, VENEZUELA, CENTRAL AMERICA, EUROPE, ASIA, AND OCEANIA... RGB
DRIVING THE TORTILLA INDUSTRY GROWTH PRIVATE SECTOR INTERNSHIPS AND LINK
 DRIVING THE TORTILLA INDUSTRY GROWTH PRIVATE SECTOR INTERNSHIPS AND LINK MAY, 2014 TABLE OF CONTENTS I. MISSION FOODS DESCRIPTION II. INTERNSHIP PROGRAMS III. INNOVATION IMPACT ON CPG S HR I. MISSION FOODS
$ BUY STARBUCKS CORPORATION (SBUX) Rena Kaufman. Valuation Methodology. Market Data. Financial Summary (7/1/2018) Profile. Financial Analysis
 Rena Kaufman. Valuation Methodology. Market Data. Financial Summary (7/1/2018) Profile. Financial Analysis") STARBUCKS CORPORATION (SBUX) Market Data Market Cap (intraday): $69,991M Enterprise Value (Aug 9, 2018): $74,898M Enterprise Value/EBITDA (ttm): 14.97x Rena Kaufman $51.88 - BUY Valuation Methodology Method
STARBUCKS CORPORATION (SBUX) Market Data Market Cap (intraday): $69,991M Enterprise Value (Aug 9, 2018): $74,898M Enterprise Value/EBITDA (ttm): 14.97x Rena Kaufman $51.88 - BUY Valuation Methodology Method
International Beverage. Frank van Oers
 International Beverage Frank van Oers Long-term Growth Will Come from Single-Serve and Instants FY08 $3.2 Billion 6% 7% 8% 11% 18% 12% 38% 4% 24% 12% 3% 56% 1% 2 Multi-Serve (ex. Brazil) Single-Serve Instants
2016 was Telepizza Group s best year for chain sales 1 and EBITDA growth over the last decade
 Telepizza Full-Year Results for 2016 2016 was Telepizza Group s best year for chain sales 1 and EBITDA growth over the last decade Chain sales 1 grew by 7% to 517M while Underlying EBITDA rose by 10% to
C O R P O R AT E S T R AT E G Y U P D AT E. October, 2018
 C O R P O R AT E S T R AT E G Y U P D AT E October, 2018 FORWARD LOOKING STATEMENTS This presentation contains forward-looking statements, that should be considered as good faith estimates. Such statements
Value increase in the alcohol market
 Value increase in the alcohol market Warsaw, June 2018 Get to know AMBRA AMBRA Group is a leading manufacturer, importer and distributor of wines and other alcohol beverages in the Central-Eastern Europe.
Access to Recycling & Composting: Paper Food Service Items
 Access to Recycling: Foam Polystyrene Food Service Items Access to Recycling & Composting: Paper Food Service Items 50 most populous US Cities & 50 most populous CA Cities June 2013* *This report was revised
Financial Results for Fiscal Year Ending December 31, February 13, 2017 Suntory Beverage & Food Limited
 2017 SUNTORY 2013 BEVERAGE SUNTORY BEVERAGE & FOOD & LIMITED. Limited. All Rights All Reserved Rights Reserved. Financial Results for Fiscal Year Ending December 31, 2016 February 13, 2017 Suntory Beverage
Three-month sales. April 19, 2018 Nestlé three-month sales 2018
 Three-month sales 1 Disclaimer This presentation contains forward looking statements which reflect Management s current views and estimates. The forward looking statements involve certain risks and uncertainties
More information from: https://www.wiseguyreports.com/reports/ global-online-food-delivery-and-takeaway-marketanalysis-by-order-type
 Report Information More information from: https://www.wiseguyreports.com/reports/1079744-global-online-food-delivery-and-takeaway-marketanalysis-by-order-type Global Online Food Delivery and Takeaway Market
Pizza Pizza Royalty Corp. ANNUAL GENERAL MEETING May 29, 2013
 Pizza Pizza Royalty Corp. ANNUAL GENERAL MEETING May 29, 2013 1 Elizabeth Wright, Board Chair 2 Forward-Looking Statement This presentation will contain forward-looking statements. Investors should be
Financial Results for H1 Fiscal Year Ending December 31, August 6, 2015 Suntory Beverage & Food Limited
 Financial Results for H1 Fiscal Year Ending December 31, 2015 August 6, 2015 Suntory Beverage & Food Limited 2015 SUNTORY 2013 BEVERAGE SUNTORY BEVERAGE & FOOD & LIMITED. Limited. All Rights All Reserved
Table of Contents. Contact Information
 Case Study 2015 Table of Contents The Challenge.......................................................................... 1 Pizza Hut and the U.S. Pizza Market...................................................
Strengthening our coffee leadership
 Strengthening our coffee leadership Nestlé enters agreement for the perpetual global licensing rights of Starbucks consumer and foodservice products May 7, 2018 Mark Schneider François-Xavier Roger Chief
Yum! Brands Drive Profitable International Expansion. Graham Allan YRI President
 Yum! Brands Drive Profitable International Expansion Graham Allan YRI President Yum! International Division Agenda... 2006 Results/2007 Outlook Building Our Global Brands Future Growth Another Strong Year
Financial Results for Fiscal Year Ending December 31, February 12, 2016 Suntory Beverage & Food Limited
 2016 SUNTORY 2013 BEVERAGE SUNTORY BEVERAGE & FOOD & LIMITED. Limited. All Rights All Reserved Rights Reserved. Financial for Fiscal Year Ending December 31, 2015 February 12, 2016 Suntory Beverage & Food
Autumn Press Conference October 19, Name of chairman
 Autumn Press Conference October 19, 2006 Disclaimer This presentation contains forward looking statements which reflect Management s current views and estimates. The forward looking statements involve
This is Haruhisa Inada. I will explain the financial results of the first quarter of FY 2018.
 This is Haruhisa Inada. I will explain the financial results of the first quarter of FY 2018. 1 Compared to the previous year, revenue was 277.1 billion yen, up 3.3%, operating income was 26.6 billion
multibrand units in the U.S. NEW multibrand units in Multibrand units make up more than 17% of our total restaurant base in the U.S.
 A world of choice Yum! is the undeniable world leader in Multibranding innovation with over 3,000 combination restaurants in the U.S. accounting for an estimated $330 million in restaurant profits and
January 2015 WORLD GRAPE MARKET SUPPLY, DEMAND AND FORECAST
 January 2015 WORLD GRAPE MARKET SUPPLY, DEMAND AND FORECAST Table of Contents Executive Summary... 4 1. VARIETIES OF GRAPES... 6 1.1. White table grapes... 6 1.2. Red table grapes... 6 2. WORLD DEMAND
Overview of the Manganese Industry
 39th Annual Conference Istanbul, Turkey 2013 Overview of the Manganese Industry International Manganese Institute Alberto Saavedra Market Research Manager June, 2013 Introduction Global Production Supply,
2012 CORPORATE PRESENTATION
 2012 CORPORATE PRESENTATION Forward-Looking Statements Statements made in this presentation that could relate to Andina s future performance or financial results are forward-looking statements and are
3 rd Quarter & 9 Months 2014 Financial Results 10 November 2014
 3 rd Quarter & 9 Months 2014 Financial Results 10 November 2014 Disclaimer The presentation is prepared by Super Group Ltd ( Super or the Group ) and is solely for the purpose of corporate communication
INVESTOR PRESENTATION. Post FY2017 Volume Announcement
 v INVESTOR PRESENTATION Post FY2017 Volume Announcement FORWARD-LOOKING STATEMENTS This presentation may contain certain forward-looking statements concerning our future performance and should be considered
Preliminary unaudited financial results for the full year ended 30 June Amount for this reporting period
 Marlborough Wine Estates Group Limited Results for Announcement to the Market Preliminary unaudited financial results for the full year ended 30 June 2017 Reporting Period 1st July to 30th June 2017 Previous
General Mills Overview 2010
 General Mills Overview 2010 Trusted brands the world over Our brands are known around the world for quality, beginning with Gold Medal flour in 1880, which to this day remains the No. 1 selling flour in
Outline. o Global Dairy Overview o U.S Milk Production o Dairy Product Production, Stocks, Trade o Outlook. Copyright 2017 Daily Dairy Report, Inc.
 Outline o Global Dairy Overview o U.S Milk Production o Dairy Product Production, Stocks, Trade o Outlook 2 Global Milk Production: Select Countries (in billion pounds) In Billion Pounds 21 67 216 333
Corporate Presentation May 2017
 Corporate Presentation May 2017 I. Concha y Toro: At a Glance 2 Viña Concha y Toro Today Largest Chilean and Latin American Winery. Top 10 world s winery in volume commercialized. Unique business model
John Culver. group president, Global Retail
 John Culver group president, Global Retail Starbucks has delivered strong growth globally GLOBAL RETAIL CONSOLIDATED REVENUE USD BILLIONS OPERATING INCOME USD BILLIONS CAGR 12% CAGR 17% $13.0 $18.5 $2.8
The. Strauss Group. Company Presentation April 2015
 The Strauss Group Company Presentation April 2015 Strauss Group - Overview A food and beverage company active in More than 20 countries with a strong home base Israel s second-largest food group The world
Global UHT Milk Market Will Reach USD billion in 2019: Persistence Market Research. Persistence Market Research
 Persistence Market Research Global UHT Milk Market Will Reach USD 137.7 billion in 2019: Persistence Market Research Persistence Market Research 1 Persistence Market Research Released New Market Report
Global Considerations
 What Does Being a Global Player Mean to the U.S. Dairy Sector? Global Considerations 2 1 A Decade of Change $8, 4,5 $7, 4, (Million $) $6, $5, $4, $3, $2, $1, 3,5 3, 2,5 2, 1,5 1, 5 (Million Lbs.) $ 23
Record exports from Brazil weigh heavy on the coffee market
 Record exports from Brazil weigh heavy on the coffee market Coffee exports from Brazil reached a record high of 36.8 million bags in crop year 2014/15 (April to March), fuelled by domestic stocks and encouraged
Outlook for the. ASEAN INTERNATIONAL SEMINAR ON COFFEE June 2012 Kuta, Bali, Indonesia
 Outlook for the World Coffee Market ASEAN INTERNATIONAL SEMINAR ON COFFEE 12 13 June 212 Kuta, Bali, Indonesia José Sette Head of Operations ICO Composite Indicator Price (in current terms) Monthly averages:
U.S. Retail Coffee. Joe Stanziano Senior Vice President and General Manager, Coffee
 U.S. Retail Coffee Joe Stanziano Senior Vice President and General Manager, Coffee 1 Our Coffee Vision Build BELOVED COFFEE BRANDS that ignite the senses and inspire passions every day. OUR STRATEGIC PRIORITIES
bottled water market trends and 2017 global congress
 bottled water market trends and 2017 global congress Richard Hall Chairman, Zenith Matt Wilton Commercial Director, Zenith Webinar 6 September 2017 1 2017 Global Bottled Water Congress Richard Hall Chairman,
Leading the Category Driving Growth Creating Value. Fiona KENDRICK Head of Coffee and Beverages Strategic Business Unit
 Leading the Category Driving Growth Creating Value Fiona KENDRICK Head of Coffee and Beverages Strategic Business Unit Disclaimer This presentation contains forward looking statements which reflect Management
Nestlé three-month sales: 3.9% organic growth, 3.0% real internal growth, full-year outlook confirmed
 Press release Vevey, 14 April 2016 Follow today's event live 08:30 CEST Investor call audio webcast Full details: http://www.nestle.com/media/mediaeventscalendar/allevents/2016-3m-sales Nestlé three-month
China s Export of Key Products of Pharmaceutical Raw Materials
 China s Export of Key Products of Pharmaceutical Raw Materials During the period of the 62nd API China& INTERPHEX CHINA, China Pharmaceutical Industry Association released its annual Report on Analysis
GLOBAL DAIRY UPDATE KEY DATES MARCH 2017
 MARCH 2017 GLOBAL DAIRY UPDATE European milk production decreased for the seventh consecutive month, while the US remains strong. The rate of decline in New Zealand production is easing. US exports continue
COOKIES AND SWEET BISCUITS
 International Markets Bureau AMERICAN EATING TRENDS REPORT COOKIES AND SWEET BISCUITS Unless otherwise stated, all of the information in this report was derived from the NPD Group s National Eating Trends
Corporate Presentation July 2016
 Corporate Presentation July 2016 I. Concha y Toro: At a Glance 2 Viña Concha y Toro Today Largest Chilean and Latin American Winery. Top 10 world s winery in volume commercialized. Unique business model
Nestlé nine-month sales: broad-based organic growth of 4.5% in a volatile environment
 Press release Vevey, 16 October 2014 Nestlé nine-month sales: broad-based organic growth of 4.5% in a volatile environment Sales of CHF 66.2 billion, organic growth of 4.5%, real internal growth of 2.3%
The alcoholic beverage market in Mexico. Consumption and trends
 The alcoholic beverage market in Mexico. Consumption and trends According to figures from INEGI, revenue from the alcoholic beverage market not including beer rose from 3,061 million pesos in the first
Three-month sales April 20, 2017 Nestlé three-month sales 2017
 Three-month sales 2017 1 Disclaimer This presentation contains forward looking statements which reflect Management s current views and estimates. The forward looking statements involve certain risks and
Financial results 2014/2015. Strategy and development perspectives
 Financial results 2014/2015 Strategy and development perspectives Warsaw, September 2015 1 Agenda Strategy of the AMBRA Group Wine market in Poland Financial results and KPIs for 2014/2015 Development
OVERVIEW. General Mills
 OVERVIEW General Mills 2011 Trusted brands the world over Our brands are known around the world for quality, beginning with Gold Medal flour in 1880, which to this day remains the No. 1 selling flour in
Press release Vevey, October 18, Nestlé reports nine-month sales for 2018
 Press release Vevey, October 18, 2018 Follow today's event live 14:00 CEST Investor call audio webcast Full details: https://www.nestle.com/media/mediaeventscalendar/allevents/2018-nine-month-sales Nestlé
MEXICO WATER REPORT. Bottled Water in Mexico: Second & Growing
 Issue 2 Spring 2011 Editor: Vince Lencioni General Manager Contributors: Claire Carranza, Alejandro Vega MEXICO WATER REPORT Bottled Water in Mexico: Second & Growing In 2009, Mexican bottled water volumes
Nestlé Investor Seminar 2014
 Nestlé Investor Seminar 2014 Beverage Nestlé USA Rob Case Nestlé Beverage Division President June 3 rd & 4 th, Liberty Hotel, Boston, USA Disclaimer This presentation contains forward looking statements
The state of the European GI wines sector: a comparative analysis of performance
 The state of the European GI wines sector: a comparative analysis of performance Special Report November 2017 1. Overview of a growing global wine market Wine is one of the most globalised products. The
2, multibranded units in the U.S. Multibrand average unit volumes are typically $250,000 a year higher than single-brand restaurants.
 multibrand power Today, we re changing the industry with Multibrand innovation and providing the choice and convenience our customers prefer. Yum! is the undeniable world leader in multibranding with over
Chile. Tree Nuts Annual. Almonds and Walnuts Annual Report
 THIS REPORT CONTAINS ASSESSMENTS OF COMMODITY AND TRADE ISSUES MADE BY USDA STAFF AND NOT NECESSARILY STATEMENTS OF OFFICIAL U.S. GOVERNMENT POLICY Required Report - public distribution Date: GAIN Report
Dairy Market. May 2016
 Dairy Market R E P O R T Volume 19 No. 5 May 2016 DMI NMPF Overview Increased production per cow and expectations for additional milk production growth is dampening the outlook for milk prices for the
Welcome to the Nine-Month Sales Conference
 Welcome to the Nine-Month Sales Conference Disclaimer This presentation contains forward looking statements which reflect Management s current views and estimates. The forward looking statements involve
Coffee prices rose slightly in January 2019
 Coffee prices rose slightly in January 2019 In January 2019, the ICO composite indicator rose by 0.9% to 101.56 US cents/lb as prices for all group indicators increased. After starting at a low of 99.16
World Cocoa Conference Nov 2012
 World Cocoa Conference 19-23 Nov 2012 Situation and prospects for cocoa supply & demand Laurent Pipitone Director of Economics & Statistics Division 1 Improving market information and transparency One
Strong Holiday Performance Drives 5% Global Comp Growth, Global Traffic Increases 2%
 Starbucks Delivers Record Q1 Revenue and EPS Strong Holiday Performance Drives 5% Global Comp Growth, Global Traffic Increases 2% Revenues rise 13% to a record $4.8 billion; EPS of $1.30 includes a gain
Mango Retail Performance Report 2017
 Mango Retail Performance Report 2017 1 Table of Contents Pages 3-9 Pages 10-15 Pages 16-34 Pages 35-44 Pages 45-51 Pages 52-54 Executive Summary Fruit and Tropical Fruit Performance Whole Mango Performance
Bottled Water Category Overview
 Bottled Water Category Overview 2014-2015 Disclaimer The following information is offered in good faith and represents an unqualified interpretation of a range of industry commentary and market data. It
What Does Being a Global Player Mean to the U.S. Dairy Sector?
 What Does Being a Global Player Mean to the U.S. Dairy Sector? Global Considerations Copyright of Daily Dairy Report, Inc. 2 A Decade of Change $8,000 4,500 $7,000 4,000 (Million $) $6,000 $5,000 $4,000
HISTORY CHILE S LEADING WINE PRODUCER. Public company since Main ownership in two families with a long-term vision and passion for wine.
 C O R P O R AT E P R E S E N TAT I O N 2 0 1 8 HISTORY CHILE S LEADING WINE PRODUCER Public company since 1933. Main ownership in two families with a long-term vision and passion for wine. FOUNDED IN PIRQUE
Armenian Alcoholic Beverages Market and Industry Overview
 Avenue Consulting Group Strategy Operations Legal and Tax Armenian Alcoholic Beverages Market and Industry Overview Yerevan, 2015 Content Why This Report is Prepared 3 Armenian Alcoholic Beverages Market
Outline. o Global Dairy Overview o U.S Milk Production o Dairy Product Production, Stocks, Trade o Outlook 12/7/2016
 Outline o Global Dairy Overview o U.S Milk Production o Dairy Product Production, Stocks, Trade o Outlook 2 1 A View From Abroad Germany 1983 2 Germany 1983 Japan 1984 3 Japan 1984 Kobe Cow Calf Show 4
K+S Acquires Leading South American Salt Producer
 Kassel, A New Position in the Worldwide Salt Business: K+S Acquires Leading South American Salt Producer On Saturday, 22 April 2006, K+S signed the agreement to acquire Chilean salt producer Sociedad Punta
Foodservice EUROPE. 10 countries analyzed: AUSTRIA BELGIUM FRANCE GERMANY ITALY NETHERLANDS PORTUGAL SPAIN SWITZERLAND UK
 Foodservice EUROPE MARKET INSIGHTS & CHALLENGES 2015 2016 2017 2020 Innovative European Foodservice Experts 18, avenue Marcel Anthonioz BP 28 01220 Divonne-les-Bains - France 10 countries analyzed: AUSTRIA
Prices for all coffee groups increased in May
 Prices for all coffee groups increased in May In May 2018, the ICO composite indicator increased by 0.7% to an average of 113.34 US cents/lb, following three months of declines. Prices for all coffee groups
9 Months Sales Roddy Child-Villiers Head of Investor Relations. 22 October 2009
 9 Months Sales 2009 Roddy Child-Villiers Head of Investor Relations 22 October 2009 Disclaimer This presentation contains forward looking statements which reflect Management s current views and estimates.
Food Manufacturing in New Jersey Industry Report FOOD MANUFACTURING IN NEW JERSEY
 FOOD MANUFACTURING IN NEW JERSEY 1 1.4% 1.3% 1% 6.2% Number of NJ Food Manufacturing Establishments by Subsector FIGURE 1 6.7% 6.7% 7.2% 13.5% 56% Bakeries and Tortilla Manufacturers Other Food Manufacturing
Agenda for today. Demand as driver for a mainstream sustainable coffee sector. Introduction to Sara Lee
 Demand as driver for a mainstream sustainable coffee sector February 27, 2010 Agenda for today Introduction to Sara Lee Our efforts in sustainability Certified coffee and the role demand plays A model
Germany is the largest importer of cheese and UK and Italy are the second- and third-largest importers.
 EXTRACTSFROMTHEREPORT 1.Introduction 1.1. Background The cheese market has been one of the most dynamic food segments in the last 20 year with steady growth in production, consumption and international
Mexico Milk Cow Numbers and Milk Production per Cow,
 TABLE OF CONTENTS 1. Mexico 1.1. Mexico Milk Market Introduction 1.1.1. Dairy Market Structure and Supply Chain in Mexico 1.1.2. Mexico Cow Milk Market Production and Fluid Milk Consumption by Volume,
World vitiviniculture situation
 World vitiviniculture situation Surface area Grape Wine Global grape production Production Consumption Trade 2016 FAO-OIV Focus: Table and Dried Grapes 2 Global area under vines Area under vines in the
PRESS KIT 2017 Recognized wine portfolio
 PRESS KIT 2017 Recognized wine portfolio Viña Concha y Toro's portfolio demonstrates its vocation for excellence and quality, producing superior-level wines that are recognized and have received important
ETHIOPIA. A Quick Scan on Improving the Economic Viability of Coffee Farming A QUICK SCAN ON IMPROVING THE ECONOMIC VIABILITY OF COFFEE FARMING
 ETHIOPIA A Quick Scan on Improving the Economic Viability of Coffee Farming 1 OBJECTIVES OF STUDY Overall objective Identify opportunities for potential benefits to coffee farmers from improved farm profitability
Business Update DECEMBER 2018
 Business Update DECEMBER 2018 Disclaimer This presentation may contain forward-looking statements and projections. There can be no certainty of outcome in relation to the matters to which the forward-looking
much better than in As may be seen in Table 1, the futures market prices for the next 12 months
 Dairy Outlook December 2009 By Jim Dunn Professor of Agricultural Economics, Penn State University Market Psychology prices are higher than last month, especially Class IV. The outlook for dairy prices
Consistently higher production and more exportable supplies from Thailand are major factors in the decline in world rice prices in 2014 and continued
 Rice Consistently higher production and more exportable supplies from Thailand are major factors in the decline in world rice prices in 2014 and continued lower levels over the next ten years. Part of
Sales for 9 months to 31 March 2008: 5,091 million
 Sales for 9 months to 31 March 2008: 5,091 million Highly dynamic sales (+9.3% nine month cumulative organic growth) Continuing strong growth in the 3 rd quarter: (+7.1% organic growth) Confirmed profit
For personal use only
 SEPTEMBER 216 GLOBAL DAIRY UPDATE European milk production has decreased for the first time since early 215, with volumes in June down 2 compared to last year. Last week we announced our annual results,
HONDURAS. A Quick Scan on Improving the Economic Viability of Coffee Farming A QUICK SCAN ON IMPROVING THE ECONOMIC VIABILITY OF COFFEE FARMING
 HONDURAS A Quick Scan on Improving the Economic Viability of Coffee Farming 1 OBJECTIVES OF STUDY Overall objective Identify opportunities for potential benefits to coffee farmers from improved farm profitability
Networkers Business Update. December 2014
 Networkers Business Update December 2014 Agenda Forecast Milk Price Global markets V3 Strategy Growing our share of New Zealand milk Page 2 Forecast Milk Price 110 100 2012/13 2013/14 2014/15 Forecast
July 2010 Barry Callebaut - Roadshow presentation
 Barry Callebaut 9-month key sales figures 2009/10 July 2010 July 2010 Barry Callebaut - Roadshow presentation Agenda Barry Callebaut at a glance Highlights 9 months 2009-2010 Outlook July 2010 Barry Callebaut
Global Cocoa Butter Equivalent (CBE) Market - Volume and Value Analysis By Type, By Region, By Country: Opportunities and Forecast ( )
 Market - Volume and Value Analysis By Type, By Region, By Country: Opportunities and Forecast ( )") Global Cocoa Butter Equivalent (CBE) Market - Volume and Value Analysis By Type, By Region, By Country: Opportunities and Forecast (2017-2022) By Type - Shea Butter, Other Specialty Fats) By Region- APAC,
Global Cocoa Butter Equivalent (CBE) Market - Volume and Value Analysis By Type, By Region, By Country: Opportunities and Forecast (2017-2022) By Type - Shea Butter, Other Specialty Fats) By Region- APAC,
DEVELOPMENTS IN TURKISH STEEL INDUSTRY AND OUTLOOK
 DEVELOPMENTS IN TURKISH STEEL INDUSTRY AND OUTLOOK Dr. Veysel YAYAN Secretary General Turkish Iron and Steel Producers Association OECD Steel Commitee Meeting 17-18 May 2007, İstanbul 1 Crude steel production
Cocoa -key for our future growth. Steven Retzlaff President Global Cocoa
 Cocoa -key for our future growth Steven Retzlaff President Global Cocoa October, 2014 Agenda Cocoa Market Terminal market Supply & Demand Combined ratio Powder market Global Cocoa business Strategic reasons
exclusive investment offering
 exclusive investment offering Lee & Associates LA North/Ventura, Inc. Corporate ID #01191898 A Member of the Lee & Associates Group of Companies 15250 Ventura Blvd., Suite 100 Sherman Oaks, CA 91403 P:
2018/19 expected to be the second year of surplus
 2018/19 expected to be the second year of surplus Coffee year 2018/19 is expected to be the second consecutive season of surplus, as global output, estimated at 167.47 million bags, exceeds world consumption,
DELIVERING REFRESHING SOFT DRINKS
 BEVERAGES DIVISION DELIVERING REFRESHING SOFT DRINKS Swire Beverages manufactures, markets and distributes refreshing soft drinks to consumers in Hong Kong, Taiwan, Mainland China and the USA. 46 215 PERFORMANCE
Zurich Pensions Fund specific projection rates
 Zurich Pensions Fund specific projection rates This document lists the funds available through the Sterling Investment Bond and the fund specific projection rates used in our illustrations. Examples Where
For personal use only
 7 December 2017 FONTERRA REVISES 2017/18 FORECAST FARMGATE MILK PRICE Fonterra Co-operative Group Limited today reduced its forecast Farmgate Milk Price for the 2017/18 season from $6.75 to $6.40 per kgms
Strategy and development perspectives
 Strategy and development perspectives Warsaw, 5 June 2017 AMBRA in brief 1992 establishment of AMBRA S.A. 1995 leader of the sparkling wines segment 1997 acquisition of the CIN&CIN brand 2005 IPO and formation
North America Ethyl Acetate Industry Outlook to Market Size, Company Share, Price Trends, Capacity Forecasts of All Active and Planned Plants
 North America Ethyl Acetate Industry Outlook to 2016 - Market Size, Company Share, Price Trends, Capacity Forecasts of All Active and Planned Plants Reference Code: GDCH0416RDB Publication Date: October
Global Sugar Substitute Market: An Analysis
 Global Sugar Substitute Market: An Analysis ----------------------------------------- 2013 Executive Summary The sugar substitute market mainly consists of high fructose syrup (HFCS), high intensity sweetener