WASHINGTON SWEET CHERRY CHARACIERISTICS: FRUIT SIZE AND CULLAGE RATES
|
|
|
- Theresa Holly Andrews
- 5 years ago
- Views:
Transcription


1 Farm Business Management Reports \ EB 1544 WASHINGTON SWEET CHERRY CHARACIERISTICS: FRUIT SIZE AND CULLAGE RATES R. Thomas Schotzko Cooperative Extension College of Agriculture and Home Economics Washington State University Pullman, Washington
2 Washington Sweet Cherry Characteristics: Fruit Size and Cullage Rates R. Thomas Schotzko Extension Economist BACKGROUND During the 1980s the Washington sweet cherry industry began a concerted effort to adapt to changing market conditions. Real fresh prices, with the exception of the years , had been steadily declining. 1 The growing array of products being offered in ret a i1 produce sections was creating greater competition for cherries. There was concern within the industry that lack of change would result in a decline in the industry. Two possible solutions were suggested by industry members: increased niche marketing and, higher grade standards. The niche marketing advocates argued that greater segregation of cherries by fruit size would generate better grower returns. 2 The predominant practice in the industry has been to market fruit in two size categories. The bulk of the fresh shipments have been of the size category classified as 12-row and larger. These fruit are bulk packed in 20-lb. boxes. The other size category is 13- row and container size for these cherries is 12 1 bs. There are some deviations from the predominant practice with respect to size of fruit and size of container, but the norm continues to be 12-row and larger, and 13-row fruit packs. Row size is determined by the number of fruit placed shoulder to shoulder that are needed to cover the distance across a 20-lb. container. The width of that container traditionally was 10.5 inches. It follows that a 10 1/2 row cherry is essentially 1 inch in diameter. Twelve-row fruit are smaller because 12 cherries are required to fill that 10.5 inch distance. 1 See for example, Schotzko, R.T., et.al. Demand for Fresh Sweet Cherries, Research Bulletin XB College of Agriculture and Home Economics Research Center, Washington State University, Pullman, WA Swanson and Schotzko reported substantial price differences by size for the 1983 and 1984 crops. See Swanson, D.S. and R.T. Schotzko, The Impact of Row Size and Destination on the F.O.B. Pricing of Washington Fresh Bing Cherries. Extension Bulletin 1502, Cooperative Extension, Washington State University, Pullman, WA, July, 1988.


3 2 During the discussion of the value of offering a greater number of size categories for sale, a question arose as to the volume of fruit in the various size categories. No data had been accumulated on a regular basis to determine the distribution of fruit size and the implications that distribution would have for marketing. Since niche marketing by fruit size was legal within the grade standards, the industry began to actively evaluate the level of occurrence of various defects and their causes while the va 1 ue of niche marketing continued to be debated. The Washington Cherry Marketing Committee funded the eva 1 uat ion of defect levels at the receiving point in the New York metropolitan market. 3 During this period the marketing committee also increased the minimum fruit size allowed to be shipped fresh. There were two reasons for this change. Previously the actual allowable diameters associated with 13-row fruit were less than the diameter associated with row size as defined above. The idea was to make the legal row size the "true" row size. The other reason was that eating quality (as yet undefined by the industry) was assumed to be positively correlated with size. Increasing the minimum allowable diameters was assumed to marginally improve eating quality of fresh marketed fruit. 4 Also during this period, research was also conducted at shipping point to determine the causes of the major defects and methods of reducing current defect levels. Given the information collected at receiving point, the research at shipping point could be used to reduce the occurrence of defects. While the shipping point research is generating very useful information that can be used by packers to improve handling methods, it cannot be extrapolated to reflect industry wide imp:acts. No effort has been made to systematically collect cullage data on a broad basis in the industry. Baseline data are needed for evaluation purposes should the industry change generally acceptable handling and packing methods or change grade standards to reduce defect levels at receiving point. 3 The Washington Cherry Marketing Committee is composed of cherry producers and shippers, and is responsible for administering the cherry market order. The committee has the authority to fund research. Details of the authority of the committee are available from the Cherry Marketing Committee office in Yakima, Wa. 4 This is based on persona 1 observation by the author at marketing committee meetings.
 were identified that measured the size of the fruit in samples taken from each lot of fruit delivered to the shed.")

 varies from house to house. However, most pools are 3 to 7 days long, except for weather related pools.")
4 3 This report describes information on fruit size distribution and cullage rates for five crop years. Seven firms (with a total of 10 packing sheds or distinctly identified growing areas) were identified that measured the size of the fruit in samples taken from each lot of fruit delivered to the shed. When this survey began, the participating firms were the only firms identified by industry personnel that systematically collected detailed size information. Those firms agreed to provide information that included pounds of fruit by row size, cullage, the volume of briners, and total fruit handled. This information was provided on a pool by pool basis. Pools in this case are returns pools and are based on date of delivery of field run fruit to the packing house. The amount of time associated with each pool (number of days) varies from house to house. However, most pools are 3 to 7 days long, except for weather related pools. There has been a tendency over time for the pool periods to be lengthened. In 1983, the number of days used per pool period when the individual house data were combined was three. In 1987, seven days per pool period were used. The figures containing information by pool period have been adjusted chronologically so that the dates are approximately the same across years. Five years of data were accumulated covering the time period 1983 to 1987, inclusive. Three firms are located in Yakima and four in Wenatchee. The firms typically used roller sizers, making size comparisons and combining of data valid. The shape of cherries, particularly larger fruit, influences the measurement of size. Large fruit are not round, but are rather oval shaped at the shoulders (the point of greatest diameter). Roller sizers (two long rollers placed side by side and tilted so that one end of the rollers is higher and the distance between the rollers widens from top to bottom) measure the minimum distance across the oval at the shoulders of the fruit-the smallest diameter at the shoulders. The other common method of measuring size is the use of plastic cards with holes of various sizes. This method measures maximum diameter of each fruit. Since all cooperators used roller sizers, the data are consistent across firms. There are, however, biases in the 9-row data and 13-row data. Not all firms reported the volume of 9-row fruit or the volume of 13-row fruit. Where the firm did not separate out 9-row fruit, 9- and 10-row fruit are combined, so that for those firms the actual volume of 10-row fruit is overstated by the unknown amount of 9-row fruit in the samples.


5 4 For those firms that did not record 13-row fruit there is an inherent bias in the percentages of fruit in all the size categories. This is caused by the reduction in the tot a 1 vo 1 ume of row size fruit. The percentages were determined by the amount by weight of fruit in each size category divided by the total weight of fruit that was sized. Culls and brines were not included in the total unless size was explicitly specified by the firms. If 13-row fruit are not inc 1 uded in the denominator, the percentages for each row size wi 11 be greater because the denominator is smaller that it should be. Because of the small volumes of 13-row fruit the bias is not severe. The volume commercially shipped fresh by all growers in the Washington market order area and the volume of fresh market fruit from the sample firms is compared in Table 1. Percent of total volume shipped fresh that came from the sample firms ranged from 32.7% in 1985 to 44.3% in With the exception of 1985, all samples during this time period represented at least one third of the commercially marketed fresh fruit. Table 1: Washington Commercial Fresh Cherry Volume and Sample Size Fresh Volume Sample Tons* Tons % ,986 21, ,788 13, ,557 6, ,660 16, ,105 19, * Source: Washington Cherry Marketing Committee FRUIT SIZE Average fruit size for each of the five years in the study and the five-year average are shown in Figure 1. Average fruit size is calculated in the following manner: Average size = (9 x %9-row fruit) + (10 x %10-row) + (11 x %11-row) + (12 x %12-row) + (13 x %13-row) 100 Each percent in the equation is calculated by dividing the weight of fruit in each row size by the total volume of row sized fruit. Given that method of measuring average fruit size the lower the number the larger the fruit.
6 5 The 1986 crop had the largest average fruit size for the five-year period (Figure 1). The year 1987 ranked second. The 1985 crop had the smallest fruit. The 1983 and 1984 crops were between 1985 and the average for the five years. Weather is a factor in determining average size. Weather during the 1984 and 1985 growing seasons was less conducive to large fruit. While the weighted average row size is one measure of fruit size, it does not show how the fruit are distributed around that average nor is it immediately obvious how sensitive average size as calculated here is to changes in that distribution. The distribution becomes important in an explicit fashion should a greater number of shippers begin to offer more row size categories for sale. The distribution provides an indication of the volume of fruit available by size category. The fruit size distribution for each of the five years is shown in Figure 2. In all years, the peak fruit size (the size category with the greatest volume of fruit) was 11-row (Table 2). However, the distribution around that peak size fluctuated substantially from year to year. The 1983 record volume crop had a supply of 10-row fruit that was greater than the volume of 12 -row fruit. The weather affected years of 1984 and 1985 had a relatively short supply of larger fruit. Less than 20% of the volume was 10-row or larger. In 1986 and, to a lesser extent, 1987, fruit size was large and the volume of 10-row fruit was higher than in earlier years. The volume of 10-row and larger fruit ranged from 15.7% in 1984 to 39.3% in Table 2: Percent of Sized Volume by Row Size* % % % % % 9 row row row row row Avg. row size *The numbers are rounded and may not add to 100. One must be careful about looking at patterns over time in terms of the change in the distribution that appears to have occurred because of the weather

 early in the season and then begins to drop toward the horizontal axis.")
7 6 effects in 1984 and A simple projection suggests that average fruit size has been increasing over time. However, the number of years included in this survey are inadequate to truly determine whether, in fact, an increase in size has actually occurred. Average row size by pool period is contained in Figure 3. Fruit size tends to decline very early in the season and then increases until later in the season. Then size again tends to decline. In Figure 3, this is shown by the way the curve increases (moves upward) early in the season and then begins to drop toward the horizontal axis. After the initial decline in size, the curve has an approximate U shape. Figure 4 shows the daily shipments for 1985, 1986, and Note how shipments start out slowly, accelerate, reach a peak, and then decline as the season progresses. The beginning of harvest changes from year to year depending on weather conditions. However, the geographic sequence of harvest is the same from year to year. Given current marketing conditions, there is strong economic justification to exp 1 a in the change in average size through the season. Growers in those districts where the fruit mature in the earliest part of the harvest will tend to allow their fruit to hang on the tree to be sure that the bulk of the fruit will have minimum size and color. Then other growers in the early districts who do not have the earliest harvest dates will tend to rush harvest in hopes of having their fruit marketed before the usual price decline begins. (See Figure 5 for a graphical representation of those price patterns.) Moving through the season, prices go through their typical decline and growers in mid-season tend to delay harvest to increase yield. At the very tail end of the season, prices do not usually recover to early season levels as supplies dwindle and retailer interest shifts to other summer fruits, so growers tend to harvest without waiting for additional size. The other factor tha~ may play a role in the difference in size between early and late season is that shippers in the Wenatchee area generally market a larger number of row size categories and grower returns are more heavily influenced by fruit size distribution than in the Yakima Valley. 5 The 5-year average fruit size distribution for each packing house is shown in Figure 6. The first five packing houses from the left are located in Yakima; 5 Based on personal observation of packing operations and discussions with industry personnel.
8 7 the rest are in Wenatchee. Generally speaking, those houses in Wenatchee have a greater percentage of 10-row fruit than do those in Yakima. The difference in average fruit size for that 5-year period between Yakima and Wenatchee is shown in Figure 7. It is obvious from this figure that Wenatchee District growers have larger fruit to market than do Yakima Valley growers, on the average. The early season price decline adversely affects grower returns in the Yakima Valley, particularly in the earliest districts. That early price decline in the recent past has occurred in only a few days. By the time harvest is in full swing most of the price decline has occurred. 6 (See Figure 5) A recent unpublished study analyzed the potential effect on grower returns in the earlier districts of leaving the fruit on the tree longer to improve size. 7 Because of the rapid decline in market price that occurs during the early part of the season, a grower who delays harvest to improve size generally will receive lower returns than one who harvests as soon as his fruit makes grade. There is one exception to this finding. There is a small market window during the earlier part of the season when it appears that waiting for larger fruit can generate better returns for the grower. Identifying precisely when that period exists is not possible because it tends to change from year to year. There does appear to be a relationship between the entrance of The Dalles, Oregon, fruit into the market and the closing of that window. So, while one may correctly infer that fruit size from the Wenatchee district is larger than Yakima fruit, it is not economically rational to assume that the Wenatchee district approach to marketing is suitable for the early districts in the Yakima Valley. It should be noted that the focus of this survey was fruit size and no attempt was made to corre 1 ate size with qua 1 ity. To the extent that qua 1 ity is positive 1 y correlated with fruit size, the evaluation of the data provided in this report would need to be altered to recognize explicitly that correlation. 6 A good description of price patterns is contained in O'Rourke, A.D., and E.0. As ante. Pacific Northwest 1983 Fresh Sweet Cherry Market. Research Bulletin XB0945, Agricultural Research Center, Washington State University, Pullman, WA Tucker, Kelly A., An Economic Analysis of Sweet Cherry Size and Yield. Unpublished Master's Thesis, Department of Agricultural Economics, Washington State University, Pullman, WA, May, 1987.
, the fruit were physiologically mature and had less")

9 8 CULLAGE Percent cullage of the sample firms as a group for each of the five years and the 5-year average is shown in Figure 8. The weather effects of 1984 and 1985 are immediately obvious. There was a long cold spring in 1984 and by the time harvest started (the first pool period in 1984 was for cherries shipped prior to June 19), the fruit were physiologically mature and had less shelf life than normal. In 1985, major frosts hit in late April and early May nearly wiping out the crop in the Yakima Valley and shortening the crop in the Wenatchee District. Cullage was substantially higher than normal in each of those two years. Conversely, the 1983 crop, which had very good growing conditions and record volumes, had low cullage. In 1986, a crop with very large fruit, cullage was almost as low as in The percent cullage by pool period is shown in Figure 8. It is difficult to identify a typical cull age pattern during the market season. Cull age is expected to fall during the early part of the season because the earlier districts tend to harvest as soon as possible resulting in increased cullage due to lack of color and size. That is not always true as evidenced by the 1984 crop. Cullage actually started out low relative to the middle part of the season and increased until very late in the season when it dropped off. The 1983 crop had very low cullage early in the season and during the heaviest movement period, and then moved up substantially as some rain damage occurred in the Wenatchee District. The effect of those small volumes with high cull age is quite small on the overall average. Other than the tendency for cullage to drop as one moves into the middle of the season, there is no major discernible pattern. The other comparison that can be made is cullage between regions (Figure 10). In 1983, Yakima had slightly less cullage than Wenatchee although both districts had very low cullage rates. In 1984, both districts had high cullage rates. Again, 1985 reflects the major frost damage that occurred in Yakima that year. The 1986 and 1987 cullage rates were lower, again reflecting the better growing conditions that existed for those two crop years.
10 9 SUMMARY The primary purpose of this report has been to describe cherry fruit size as measured by seven firms in the industry and, secondarily, to report fruit cullage for the five years for which the data were collected. In three years out of five, the volum~ of 10-row and larger fruit was at least 25%. However, two of the five years had less than 20% 10 row and larger fruit. The range in percentages for the large fruit (18.8% to 39.3%) suggest enough variation in volume from year to year to be a potential problem in developing industry-wide marketing strategies in support of selling larger fruit separately. Average fruit size increases from early to mid-season, and then declines late in the season. Increasing the minimum allowable size would have the biggest effect on growers in the earliest and latest districts. A likely response by growers in the early districts would be to delay harvest to increase fruit size. The result of that delay would be an increased volume of fruit to be marketed. Heavier supplies could well result in lower mid-season prices. Results of the study by Schotzko, et. al. suggest that each 1% increase in fresh volume reduces price by 1.8%. Although small incremental increases on the minimum size would have small price effects, some price decline would occur (assuming constant quality). Tightening the grade standards would likely increase the cullage rate, at least in the short run. Based on the data reported here, it seems likely that growers in the Yakima Valley would see a greater increase in cullage. Although the higher cullage rates may cause growers to assume returns are lower, the opposite may be the case. Just as a 1% increase in volume reduces price 1.8%, a 1% reduction increases price by 1.8%. Since the change in price is greater than the change in volume, the end result is an increase in total revenue to the industry. The d i stri but ion of the increased revenues may favor growers in Wenatchee because of the anticipated smaller increase in cullage in that producing region. Changing marketing strategies or tightening defect levels on the market order standards have different implications for returns to the industry and the distribution of those effects. Because of these differential effects, making changes to improve market returns may be difficult. Equitable treatment of all growers may require research to identify more precisely the direction of the effects of changes and the magnitude of those effects.


11 FIGURE 1: SAMPLE AVERAGE FRUIT SIZE Row Size by Year Row Size 11.5 ~ ~ ~ ~ ~ ~ ~ Ave. Row Size Year

12 FIGURE 2: PERCENT OF SAMPLE FRUIT by Row Size Percent 60% ~ , 50% 40% 30% 20% 10% 0% Ll --'"""""'"""""-'""" row ~ 10 row I U 111 row ~ 12 row 1987 ~ 13 row Eiliiliilil Year


13 FIGURE 3: SAMPLE FRUIT SIZE By Pool Average Size 12.0 ~ , o.o ~~~~~~~~~~~~~~~~~~~~~~~~~~ Pool --*"- 5 Yr. Ave.
14 FIGURE 4: FRESH SWEET CHERRY SHIPMENTS By Day No. of 10,000 lb. Units 300 ~ ~ Q I I I I I I I I I I I I I I I I I I I I I I I I I I I I I I I I I Y I IT I T-fV I i) T1S-f<J/rf j ~ June July Date j *- 1987


15 FIGURE 5: DAILY FRESH SWEET CHERRY PRICE Price 30 ~~ r o ~~~~~~~~~~~~~~~~~~~~~~~~~~~~~~~~~ June July Date Source: USDA,AMS, Market News Service


16 FIGURE 6: ROW SIZE DISTRIBUTION BY HOUSE Five Year House Ave. Percent 60 ~ , I E2<3 t.j Yakima House Wenatchee.. 9 Row ~ 10 Row li 111 Row ~ 12 Row ~ 13 Row

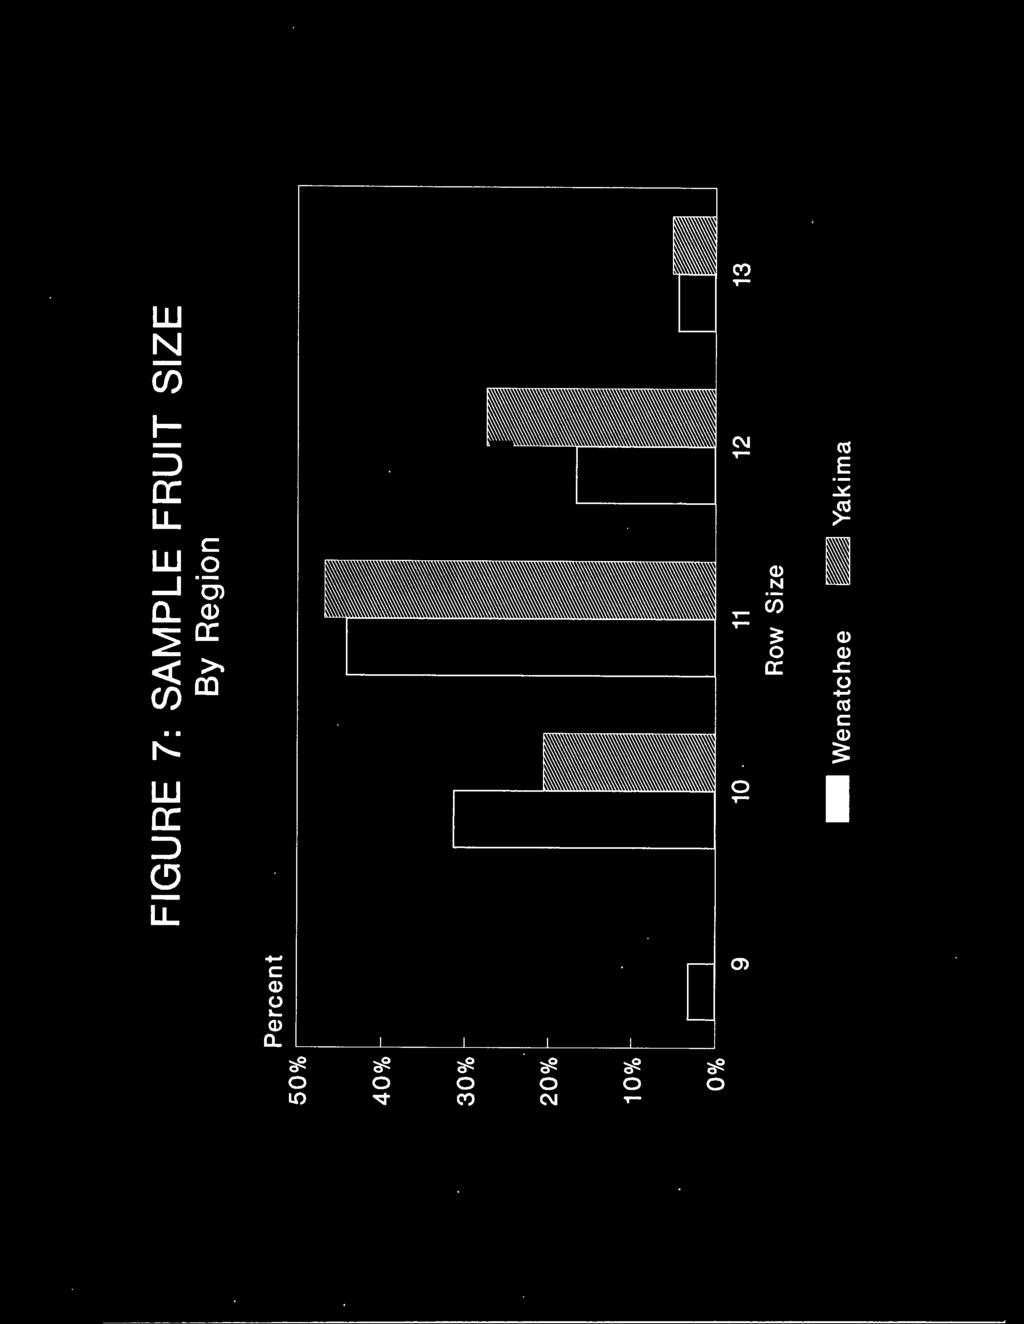
17 FIGURE 7: SAMPLE FRUIT SIZE By Region Percent 60% ~ ~ 40% 30% 20% 10% 0% Row Size Wenatchee - Yakima
18 FIGURE 8: AVERAGE CULLAGE By Year ;_ P=e~rc~e~n~t~ ~ Ave. Year - Cullage


19 FIGURE 9: CULLAGE BY POOL PERIOD Percent 20 ~ ~ o ~~~~~~~~~~~~~~~~~~~~~~~~~~ Pool *-- 5 Yr. Ave.
20 Percent FIGURE 10: CHERRY CULLAGE By Region 25 ~ , Year Wenatchee - Yakima - Average

21 Issued by Washington State University Cooperative Extension, F.L. Poston, Director, and the U.S. Department of Agriculture in furtherance of the Acts of May 8 and June 30, Cooperative Extension programs and policies are consistent with federal and state laws and regulations on nondiscrimination regarding race, color, national origin, religion, gender, age, disability, and gender preference. October
Influence of GA 3 Sizing Sprays on Ruby Seedless
 University of California Tulare County Cooperative Extension Influence of GA 3 Sizing Sprays on Ruby Seedless Pub. TB8-97 Introduction: The majority of Ruby Seedless table grapes grown and marketed over
Buying Filberts On a Sample Basis
 E 55 m ^7q Buying Filberts On a Sample Basis Special Report 279 September 1969 Cooperative Extension Service c, 789/0 ite IP") 0, i mi 1910 S R e, `g,,ttsoliktill:torvti EARs srin ITQ, E,6
Economic Contributions of the Florida Citrus Industry in and for Reduced Production
 Economic Contributions of the Florida Citrus Industry in 2014-15 and for Reduced Production Report to the Florida Department of Citrus Alan W. Hodges, Ph.D., Extension Scientist, and Thomas H. Spreen,
Sorghum Yield Loss Due to Hail Damage, G A
 1 of 8 6/11/2009 9:27 AM G86-812-A Sorghum Yield Loss Due to Hail Damage* This NebGuide discusses the methods used by the hail insurance industry to assess yield loss due to hail damage in grain sorghum.
Labor Requirements and Costs for Harvesting Tomatoes. Zhengfei Guan, 1 Feng Wu, and Steven Sargent University of Florida
 Labor Requirements and Costs for ing Tomatoes Zhengfei Guan, 1 Feng Wu, and Steven Sargent University of Florida Introduction Florida accounted for 30% to 40% of all commercially produced fresh-market
Whether to Manufacture
 Whether to Manufacture Butter and Powder or Cheese A Western Regional Research Publication Glen T. Nelson Station Bulletin 546 November 1954 S S De&dim9 S Whether to Manufacture Butterand Powder... or
THE EFFECT OF ETHYLENE UPON RIPENING AND RESPIRATORY RATE OF AVOCADO FRUIT
 California Avocado Society 1966 Yearbook 50: 128-133 THE EFFECT OF ETHYLENE UPON RIPENING AND RESPIRATORY RATE OF AVOCADO FRUIT Irving L. Eaks University of California, Riverside Avocado fruits will not
UPPER MIDWEST MARKETING AREA THE BUTTER MARKET AND BEYOND
 UPPER MIDWEST MARKETING AREA THE BUTTER MARKET 1987-2000 AND BEYOND STAFF PAPER 00-01 Prepared by: Henry H. Schaefer July 2000 Federal Milk Market Administrator s Office 4570 West 77th Street Suite 210
COMPARISON OF CORE AND PEEL SAMPLING METHODS FOR DRY MATTER MEASUREMENT IN HASS AVOCADO FRUIT
 New Zealand Avocado Growers' Association Annual Research Report 2004. 4:36 46. COMPARISON OF CORE AND PEEL SAMPLING METHODS FOR DRY MATTER MEASUREMENT IN HASS AVOCADO FRUIT J. MANDEMAKER H. A. PAK T. A.
7. LOCALIZATION OF FRUIT ON THE TREE, BRANCH GIRDLING AND FRUIT THINNING
 The Division of Subtropical Agriculture. The Volcani Institute of Agricultural Research 1960-1969. Section B. Avocado. Pg 60-68. 7. LOCALIZATION OF FRUIT ON THE TREE, BRANCH GIRDLING AND FRUIT THINNING
OF THE VARIOUS DECIDUOUS and
 (9) PLAXICO, JAMES S. 1955. PROBLEMS OF FACTOR-PRODUCT AGGRE- GATION IN COBB-DOUGLAS VALUE PRODUCTIVITY ANALYSIS. JOUR. FARM ECON. 37: 644-675, ILLUS. (10) SCHICKELE, RAINER. 1941. EFFECT OF TENURE SYSTEMS
EFFECTS OF HIGH TEMPERATURE AND CONTROLLED FRUITING ON COTTON YIELD
 Chapter 6 57 EFFECTS OF HIGH TEMPERATURE AND CONTROLLED FRUITING ON COTTON YIELD Carl F. Ehlig USDA-ARS Brawley, California INTRODUCTION The fruit load is the primary cause for mid-season decreases in
Acreage Forecast
 World (John Sandbakken and Larry Kleingartner) The sunflower is native to North America but commercialization of the plant took place in Russia. Sunflower oil is the preferred oil in most of Europe, Mexico
Grape Growers of Ontario Developing key measures to critically look at the grape and wine industry
 Grape Growers of Ontario Developing key measures to critically look at the grape and wine industry March 2012 Background and scope of the project Background The Grape Growers of Ontario GGO is looking
FACTORS DETERMINING UNITED STATES IMPORTS OF COFFEE
 12 November 1953 FACTORS DETERMINING UNITED STATES IMPORTS OF COFFEE The present paper is the first in a series which will offer analyses of the factors that account for the imports into the United States
Harvesting Charges for Florida Citrus, 2016/17
 Harvesting Charges for Florida Citrus, 2016/17 Ariel Singerman, Marina Burani-Arouca, Stephen H. Futch, Robert Ranieri 1 University of Florida, IFAS, CREC, Lake Alfred, FL This article summarizes the charges
UNITED STATES STANDARDS FOR WHOLE DRY PEAS¹
 UNITED STATES STANDARDS FOR WHOLE DRY PEAS¹ Terms Defined 401 Definition of whole dry peas. Threshed seeds of the garden type pea plant (Pisum sativum L. and Pisum sativum var. arvense (L.) Poir.), which
Peanut Meal as a Protein. Fattening Hogs in the Dry Lot. Supplement to Corn for AGRICULTURAL EXPERIMENT STATION ALABAMA POLYTECHNIC INSTITUTE
 BULLETIN No. 224 AUGUST, 1924 Peanut Meal as a Protein Supplement to Corn for Fattening Hogs in the Dry Lot By J. C. GRIMES AND W. D. SALMON AGRICULTURAL EXPERIMENT STATION of the ALABAMA POLYTECHNIC INSTITUTE
What Went Wrong with Export Avocado Physiology during the 1996 Season?
 South African Avocado Growers Association Yearbook 1997. 20:88-92 What Went Wrong with Export Avocado Physiology during the 1996 Season? F J Kruger V E Claassens Institute for Tropical and Subtropical
Dairy Market. May 2016
 Dairy Market R E P O R T Volume 19 No. 5 May 2016 DMI NMPF Overview Increased production per cow and expectations for additional milk production growth is dampening the outlook for milk prices for the
PROPOSED DRAFT STANDARD FOR AUBERGINES (At Step 5/8)
") E REP16/FFV APPENDIX III PROPOSED DRAFT STANDARD FOR AUBERGINES (At Step 5/8) JOINT FAO/WHO FOOD STANDARDS PROGRAMME CODEX ALIMENTARIUS COMMISSION 39 th Session Rome, Italy, 27 June 01 July 2016 REPORT
E REP16/FFV APPENDIX III PROPOSED DRAFT STANDARD FOR AUBERGINES (At Step 5/8) JOINT FAO/WHO FOOD STANDARDS PROGRAMME CODEX ALIMENTARIUS COMMISSION 39 th Session Rome, Italy, 27 June 01 July 2016 REPORT
AGRICULTURAL EXPERIMENT STATION Oregon State College Uta. A. Schoenfeld, Director Corvallis. Circular of Information No.
 AGRICULTURAL EXPERIMENT STATION Oregon State College Uta. A. Schoenfeld, Director Corvallis Circular of Information No. 341 May 1944 YOUTH LABOR EFFICIENCY IN HARVESTING SWEET CHERRIES WILLAMETTE VALLEY,
1
 Niche Market Shell Bean Variety Trial Carol Miles, Liz Nelson, Lydia Garth, and Erin Klingler Washington State University, Vancouver Research & Extension Unit, 1919 NE 78 th Street, Vancouver, WA 98665
Quality of Canadian oilseed-type soybeans 2016
 ISSN 1705-9453 Quality of Canadian oilseed-type soybeans 2016 Véronique J. Barthet Program Manager, Oilseeds Section Contact: Véronique J. Barthet Program Manager, Oilseeds Section Tel : 204 984-5174 Email:
Regression Models for Saffron Yields in Iran
 Regression Models for Saffron ields in Iran Sanaeinejad, S.H., Hosseini, S.N 1 Faculty of Agriculture, Ferdowsi University of Mashhad, Iran sanaei_h@yahoo.co.uk, nasir_nbm@yahoo.com, Abstract: Saffron
Canada-EU Free Trade Agreement (CETA)
") Canada-EU Free Trade Agreement (CETA) The Issue: Following 5-years of negotiation, CETA was signed in principle on October 18, 2013, and signed officially by Prime Minister Trudeau on October 29, 2016,
Canada-EU Free Trade Agreement (CETA) The Issue: Following 5-years of negotiation, CETA was signed in principle on October 18, 2013, and signed officially by Prime Minister Trudeau on October 29, 2016,
WHOLESALE BUYERS GUIDE TO WASHINGTON GRAPEVINE QUARANTINES
 WHOLESALE BUYERS GUIDE TO WASHINGTON GRAPEVINE QUARANTINES By Michelle Moyer, Statewide Viticulture Extension Specialist, Department of Horticulture, WSU Irrigated Agriculture Research and Extension Center,
ALBINISM AND ABNORMAL DEVELOPMENT OF AVOCADO SEEDLINGS 1
 California Avocado Society 1956 Yearbook 40: 156-164 ALBINISM AND ABNORMAL DEVELOPMENT OF AVOCADO SEEDLINGS 1 J. M. Wallace and R. J. Drake J. M. Wallace Is Pathologist and R. J. Drake is Principle Laboratory
Fungicides for phoma control in winter oilseed rape
 October 2016 Fungicides for phoma control in winter oilseed rape Summary of AHDB Cereals & Oilseeds fungicide project 2010-2014 (RD-2007-3457) and 2015-2016 (214-0006) While the Agriculture and Horticulture
G Soybean Yield Loss Due to Hail Damage
 Extension Historical Materials from University of Nebraska-Lincoln Extension University of Nebraska Lincoln Year 1985 G85-762 Soybean Yield Loss Due to Hail Damage Charles A. Shapiro T.A. Peterson A.D.
Soybean Seeding Date Effects on Productivity Jane Froese 1, Bruce Brolley 2 and Derek Lewis 1
 Soybean Seeding Date Effects on Productivity Jane Froese 1, Bruce Brolley 2 and Derek Lewis 1 1 Dept. of Plant Science, University of Manitoba, Winnipeg, MB R3T 2N2 E-mail: jane_froese@umanitoba.ca, derek_lewis@umanitoba.ca
The University of Georgia
 The University of Georgia Center for Agribusiness and Economic Development College of Agricultural and Environmental Sciences A Survey of Pecan Sheller s Interest in Storage Technology Prepared by: Kent
Retailing Frozen Foods
 61 Retailing Frozen Foods G. B. Davis Agricultural Experiment Station Oregon State College Corvallis Circular of Information 562 September 1956 iling Frozen Foods in Portland, Oregon G. B. DAVIS, Associate
Lack of irrigation in 2002 reduced Riesling crop in Timothy E. Martinson Finger Lakes Grape Program
 Lack of irrigation in 2002 reduced Riesling crop in 2003 Timothy E. Martinson Finger Lakes Grape Program Lailiang Cheng, Alan Lakso, Thomas Henick-Kling and Terry Acree Depts. Horticulture Ithaca, Horticultural
EFFECT OF TOMATO GENETIC VARIATION ON LYE PEELING EFFICACY TOMATO SOLUTIONS JIM AND ADAM DICK SUMMARY
 EFFECT OF TOMATO GENETIC VARIATION ON LYE PEELING EFFICACY TOMATO SOLUTIONS JIM AND ADAM DICK 2013 SUMMARY Several breeding lines and hybrids were peeled in an 18% lye solution using an exposure time of
PLANTING WHEAT SEED DAMAGED BY FROST BEFORE HARVEST
 PLANTING WHEAT SEED DAMAGED BY FROST BEFORE HARVEST Neal R. Foster, Lowell A. Burchett, and Gary M. Paulsen* Frosts associated with cold fronts during late spring damage winter wheat in Kansas in many
Dairy Market R E P O R T
 Volume 17 No. 5 Dairy Market R E P O R T May 2014 DMI NMPF Overview Many key milk and dairy product prices continued to set records in April. And while the dairy futures markets indicate that prices will
QUARTELY MAIZE MARKET ANALYSIS & OUTLOOK BULLETIN 1 OF 2015
 QUARTELY MAIZE MARKET ANALYSIS & OUTLOOK BULLETIN 1 OF 2015 INTRODUCTION The following discussion is a review of the maize market environment. The analysis is updated on a quarterly 1 basis and the interval
Quality of Canadian oilseed-type soybeans 2017
 ISSN 2560-7545 Quality of Canadian oilseed-type soybeans 2017 Bert Siemens Oilseeds Section Contact: Véronique J. Barthet Program Manager, Oilseeds Section Grain Research Laboratory Tel : 204 984-5174
PROCEDURE million pounds of pecans annually with an average
 SOUTHERN JOURNAL OF AGRICULTURAL ECONOMICS JULY, 1972 THE CONSUMER MARKET FOR PECANS AND COMPETING NUTS F. W. Williams, M. G. LaPlante, and E. K. Heaton Pecans contribute significantly to agricultural
The supply and demand for oilseeds in South Africa
 THIS REPORT CONTAINS ASSESSMENTS OF COMMODITY AND TRADE ISSUES MADE BY USDA STAFF AND NOT NECESSARILY STATEMENTS OF OFFICIAL U.S. GOVERNMENT POLICY Required Report - public distribution Date: GAIN Report
MANGO PERFORMANCE BENCHMARK REPORT
 MANGO PERFORMANCE BENCHMARK REPORT 2015-2016 TABLE OF CONTENTS Page 3 Page 5 Page 12 Page 15 Page 27 Page 36 Page 46 Approach and Data Set Parameters Overview and Mango Trend-Spotting Fruit and Tropical
Soybean Yield Loss Due to Hail Damage*
 1 of 6 6/11/2009 9:22 AM G85-762-A Soybean Yield Loss Due to Hail Damage* This NebGuide discusses the methods used by the hail insurance industry to assess yield loss due to hail damage in soybeans. C.
RESTAURANT OUTLOOK SURVEY
 Reference Period: Fourth Quarter 2016 RESTAURANT OUTLOOK SURVEY Prepared by Chris Elliott, Senior Economist January 23, 2017 Q2-2011 Restaurant Outlook Survey Fourth Quarter 2016 1 Highlights The share
GALA SPLITTING WASHINGTON TREE FRUIT POSTHARVEST CONFERENCE. March 13 th & 14 th, 2001, Wenatchee, WA PROCEEDINGS, Gala Splitting page 1 of 6
 March 13 th & 14 th, 21, Wenatchee, WA GALA SPLITTING Preston K. Andrews Department of Horticulture & Landscape Architecture Washington State University Pullman, WA 99164-6414 59-335-363 (office) andrewsp@wsu.edu
FRUIT GROWTH IN THE ORIENTAL PERSIMMON
 California Avocado Society 1960 Yearbook 44: 130-133 FRUIT GROWTH IN THE ORIENTAL PERSIMMON C. A. Schroeder Associated Professor of Subtropical Horticulture, University of California at Los Angeles. The
Reading Essentials and Study Guide
 Lesson 1 Absolute and Comparative Advantage ESSENTIAL QUESTION How does trade benefit all participating parties? Reading HELPDESK Academic Vocabulary volume amount; quantity enables made possible Content
Dairy Market. Overview. Commercial Use of Dairy Products
 Dairy Market Dairy Management Inc. R E P O R T Volume 21 No. 6 June 2018 DMI NMPF Overview U.S. dairy markets received a one-two punch during the first weeks of June in the form of collateral damage from
Effects of Preharvest Sprays of Maleic Hydrazide on Sugar Beets
 Effects of Preharvest Sprays of Maleic Hydrazide on Sugar Beets F. H. PETO 1 W. G. SMITH 2 AND F. R. LOW 3 A study of 20 years results from the Canadian Sugar Factories at Raymond, Alberta, (l) 4 shows
Growing divergence between Arabica and Robusta exports
 Growing divergence between Arabica and Robusta exports In April 218, the ICO composite indicator decreased by.4% to an average of 112.56, with the daily price ranging between 11.49 and 114.73. Prices for
Influence of Cultivar and Planting Date on Strawberry Growth and Development in the Low Desert
 Influence of Cultivar and Planting Date on Strawberry Growth and Development in the Low Desert Michael A. Maurer and Kai Umeda Abstract A field study was designed to determine the effects of cultivar and
Dairy Market. October 2016
 Dairy Market Dairy Management Inc. R E P O R T Volume 19 No. 10 October 2016 DMI NMPF Overview Milk prices continued a generally solid recovery from their late-spring low through August, when the U.S.
MARKET NEWSLETTER No 93 April 2015
 Focus on OLIVE OIL IMPORT TRENDS IN RUSSIA Russian imports of olive oil and olive pomace oil grew at a constant rate between 2/1 and 213/14 when they rose from 3 62 t to 34 814 t (Chart 1). The only exceptions
2017 FINANCIAL REVIEW
 2017 FINANCIAL REVIEW In addition to activity, strategy, goals, and challenges, survey respondents also provided financial information from 2014, 2015, and 2016. Select results are provided below: 2016
Wine-Tasting by Numbers: Using Binary Logistic Regression to Reveal the Preferences of Experts
 Wine-Tasting by Numbers: Using Binary Logistic Regression to Reveal the Preferences of Experts When you need to understand situations that seem to defy data analysis, you may be able to use techniques
2017 Hop Harvest Timing
 217 Hop Harvest Timing Dr. Heather Darby, UVM Extension Agronomist John Bruce, Scott Lewins UVM Extension Crops and Soils Technicians (82) 524-651 Visit us on the web at http://www.uvm.edu/extension/cropsoil
Mango Retail Performance Report 2017
 Mango Retail Performance Report 2017 1 Table of Contents Pages 3-9 Pages 10-15 Pages 16-34 Pages 35-44 Pages 45-51 Pages 52-54 Executive Summary Fruit and Tropical Fruit Performance Whole Mango Performance
Salem Cider Convention
 Tim Larsen 277 S Ward Ave East Wenatchee, WA 98802 Phone: 509.885.2734 E-Mail: larsenrud@gmail.com Web: SnowdriftCider.com Salem Cider Convention Report on Federal Regulations Concerning Cider February
SELF-POLLINATED HASS SEEDLINGS
 California Avocado Society 1973 Yearbook 57: 118-126 SELF-POLLINATED HASS SEEDLINGS B. O. Bergh and R. H. Whitsell Plant Sciences Dept., University of California, Riverside The 'Hass' is gradually replacing
Orange Forecast. By: Taylor Erlbaum Sadamitsu Sakoguchi Ika Widyawardhani
 Orange Forecast By: Taylor Erlbaum Sadamitsu Sakoguchi Ika Widyawardhani Amazing Facts People in Nepal almost never peel their oranges, but eat them rind and all. Spain has over 35,000,000 orange trees.
Federal Milk Market Administrator U.S. Department of Agriculture. H. Paul Kyburz, Market Administrator
 Federal Milk Market Administrator U.S. Department of Agriculture UPPER MIDWEST DAIRY NEWS H. Paul Kyburz, Market Administrator Volume 9, Issue 7 Upper Midwest Marketing Area, Federal Order No. 30 July
Napa County Planning Commission Board Agenda Letter
 Agenda Date: 7/1/2015 Agenda Placement: 10A Continued From: May 20, 2015 Napa County Planning Commission Board Agenda Letter TO: FROM: Napa County Planning Commission John McDowell for David Morrison -
Wine Australia Wine.com Data Report. July 21, 2017
 Wine Australia Wine.com Data Report July 21, 2017 INTRODUCTION Wine Opinions is a wine market research company focusing on the attitudes, behaviors, and taste preferences of U.S. wine drinkers. Wine Opinions
western Canadian flaxseed 2003
 Quality of western Canadian flaxseed 2003 Douglas R. DeClercq Program Manager, Oilseeds Services James K. Daun Section Head, Oilseeds and Pulses Contact: Douglas R. DeClercq Program Manager, Oilseeds Services
Identifying Soybean Growth Stages
 AGR-223 Identifying Soybean Growth Stages Carrie A. Knott and Chad Lee, Plant and Soil Sciences University of Kentucky College of Agriculture, Food and Environment Cooperative Extension Service Accurate
Dairy Market. June 2016
 Dairy Market Dairy Management Inc. R E P O R T Volume 19 No. 6 June 2016 DMI NMPF Overview U.S. milk production was 1.2 percent higher in April than a year earlier, interrupting the pattern of the three
Weekly Produce Update
 Weekly Produce Update Northwest Apples Shippers still have most varieties available. Red del market continues to rise with the steady movement. All other varieties are moving well & are getting good monies
Quality of western Canadian pea beans 2011
 ISSN 1920-9096 Quality of western Canadian pea beans 2011 Ning Wang Program Manager, Pulse Research Contact: Ning Wang Program Manager, Pulse Research Tel : 204 983-2154 Email: ning.wang@grainscanada.gc.ca
DERIVED DEMAND FOR FRESH CHEESE PRODUCTS IMPORTED INTO JAPAN
 PBTC 05-04 PBTC 02-6 DERIVED DEMAND FOR FRESH CHEESE PRODUCTS IMPORTED INTO JAPAN By Andreas P. Christou, Richard L. Kilmer, James A. Stearns, Shiferaw T. Feleke, & Jiaoju Ge PBTC 05-04 September 2005
CODEX STANDARD FOR LIMES (CODEX STAN , AMD )
") CODEX STAN 213 Page 1 of 5 1. DEFINITION OF PRODUCE CODEX STANDARD FOR LIMES (CODEX STAN 213-1999, AMD. 3-2005) This Standard applies to commercial varieties of limes grown from Citrus latifolia Tanaka
CODEX STAN 213 Page 1 of 5 1. DEFINITION OF PRODUCE CODEX STANDARD FOR LIMES (CODEX STAN 213-1999, AMD. 3-2005) This Standard applies to commercial varieties of limes grown from Citrus latifolia Tanaka
2011 Regional Wine Grape Marketing and Price Outlook
 Center for Crop Diversification Survey CCD-SV-1 2011 Regional Wine Grape Marketing and Price Outlook Timothy Woods and Matthew Ernst Dr. Woods is an Extension Professor at the University of Kentucky. Mr.
Final Report to Delaware Soybean Board January 11, Delaware Soybean Board
 Final Report to Delaware Soybean Board January 11, 2017 Delaware Soybean Board (susanne@hammondmedia.com) Effect of Fertigation on Irrigated Full Season and Double Cropped Soybeans Cory Whaley, James Adkins,
TEMPERATURE CONDITIONS AND TOLERANCE OF AVOCADO FRUIT TISSUE
 California Avocado Society 1961 Yearbook 45: 87-92 TEMPERATURE CONDITIONS AND TOLERANCE OF AVOCADO FRUIT TISSUE C. A. Schroeder and Ernest Kay Professor of Botany. University of California, Los Angeles;
Using Growing Degree Hours Accumulated Thirty Days after Bloom to Help Growers Predict Difficult Fruit Sizing Years
 Using Growing Degree Hours Accumulated Thirty Days after Bloom to Help Growers Predict Difficult Fruit Sizing Years G. Lopez 1 and T. DeJong 2 1 Àrea de Tecnologia del Reg, IRTA, Lleida, Spain 2 Department
Testing Tomato Hybrids for Heat Tolerance at West Tennessee Experiment Station, Jim E. Wyatt and Craig H. Canaday. Interpretative Summary
 Testing Tomato Hybrids for Heat Tolerance at West Tennessee Experiment Station, 2000 Jim E. Wyatt and Craig H. Canaday Interpretative Summary The highest yielding early tomato hybrid in both spring and
EVALUATION OF AIRLEG SORTING. Kathy Kelley, Bill Olson, Steve Sibbett, Ron Snyder
 EVALUATION OF AIRLEG SORTING Kathy Kelley, Bill Olson, Steve Sibbett, Ron Snyder ABSTRACT To evaluate the possible economic benefit of on-farm dry side airleg sorting, 74 lots of walnuts comprising six
Monthly Economic Letter
 Monthly Economic Letter Cotton Market Fundamentals & Price Outlook RECENT PRICE MOVEMENT After falling in the days surrounding the release of last month s USDA report, NY futures and the A Index were mostly
What Effect do Nitrogen Fertilization Rate and Harvest Date Have on Cranberry Fruit Yield and Quality?
 What Effect do Nitrogen Fertilization Rate and Harvest Date Have on Cranberry Fruit Yield and Quality? Bernadine Strik, Professor of Horticulture Extension Berry Crops Specialist, Oregon State University
VEGETABLES. May 23, 2018
 May 23, 2018 Corn: Florida s Spring Sweet Corn Crop is finishing in the next couple weeks. Georgia is starting this week with very limited availability. At this time volume and quality are projected to
May 10, By Amerifresh May 4, 2018
 May 10, 2018 By Amerifresh May 4, 2018 NORTHWEST APPLES Movement continues to be very steady for the most. Large varietal supplies are demanding bigger money. There's various deals as shippers continue
Dairy Market. Overview. Commercial Use of Dairy Products. U.S. Dairy Trade
 Dairy Market Dairy Management Inc. R E P O R T Volume 21 No. 7 July 2018 DMI NMPF Overview Fallout from the developing tariff conflict between the United States and some of its major trading partners has
Peach and Nectarine Cork Spot: A Review of the 1998 Season
 Peach and Nectarine Cork Spot: A Review of the 1998 Season Kevin R. Day Tree Fruit Farm Advisor Tulare County University of California Cooperative Extension Along with many other problems, fruit corking
Comparing canola and lupin varieties by time of sowing in the Northern Agricultural Region
 Comparing canola and lupin varieties by time of sowing in the Northern Agricultural Region Martin Harries and Greg Shea, DPIRD Key messages Lupin yielded 3.0 t/ha and canola 2.0 t/ha from late May emergence.
Science of Tray Dried Raisins Bill Peacock and Pete Christensen*
 University of California Cooperative Extension Tulare County Grape Notes Volume II, Issue 4 August 05 Science of Tray Dried Raisins Bill Peacock and Pete Christensen* Raisin drying is mostly an "art" based
SYLLABUS. Departmental Syllabus. Food Production II CULN0140. Departmental Syllabus. Departmental Syllabus. Departmental Syllabus
 DATE OF LAST REVIEW: 02/2013 CIP CODE: 12.0505 SYLLABUS SEMESTER: COURSE TITLE: COURSE NUMBER: Food Production II CULN0140 CREDIT HOURS: 4 INSTRUCTOR: OFFICE LOCATION: OFFICE HOURS: TELEPHONE: EMAIL: KCKCC
Further investigations into the rind lesion problems experienced with the Pinkerton cultivar
 Further investigations into the rind lesion problems experienced with the Pinkerton cultivar FJ Kruger and SD Mhlophe Agricultural Research Council Institute for Tropical and Subtropical Crops Private
J / A V 9 / N O.
 July/Aug 2003 Volume 9 / NO. 7 See Story on Page 4 Implications for California Walnut Producers By Mechel S. Paggi, Ph.D. Global production of walnuts is forecast to be up 3 percent in 2002/03 reaching
GRAPES. Stop watering the end of August or first of September to harden off grape vines for winter. Keep foliage dry - don't overhead water.
 222 N Havana Spokane WA 99202 (509) 477-2181 e-mail: mastergardener@spokanecounty.org http://extension.wsu.edu/spokane/master-gardener-program/home-lawn-and-garden/ GRAPES C053 Not all grape cultivars
PRO*ACT QUALITY CONTROL. June 18, 2008
 PRO*ACT QUALITY CONTROL MARKET REPORT June 18, 2008 2008, Pro*Act, LLC *** COMMODITY ALERT *** Tomatoes: The FDA website shows Baja California Norte as cleared for tomato shipments to the US. A certificate
University of California Cooperative Extension Tulare County. Grape Notes. Volume 3, Issue 7 November 2006
 University of California Cooperative Extension Tulare County Grape Notes Volume 3, Issue 7 November 2006 Red Globe Pruning, Bud Fruitfulness and Crop Load Study Bill Peacock, Anthony Tartaglia and Matt
STATE OF THE VITIVINICULTURE WORLD MARKET
 STATE OF THE VITIVINICULTURE WORLD MARKET April 2015 1 Table of contents 1. 2014 VITIVINICULTURAL PRODUCTION POTENTIAL 3 2. WINE PRODUCTION 5 3. WINE CONSUMPTION 7 4. INTERNATIONAL TRADE 9 Abbreviations:
2015 Hard Red Wheat / Hard White Wheat. Crop Quality Report
 2015 Hard Red Wheat / Hard White Wheat Crop Quality Report California Wheat California's wheat growing regions are defined by climate, value of alternative crops, and distinct differences in variety selection.
2016 STATUS SUMMARY VINEYARDS AND WINERIES OF MINNESOTA
 IN PARTNERSHIP WITH THE NORTHERN GRAPES PROJECT, AN USDA SPECIALITY CROPS RESEARCH INITIATIVE PROGRAM, NIFA 2016 STATUS SUMMARY VINEYARDS AND WINERIES OF MINNESOTA Brigid Tuck and William Gartner INTRODUCTION
D Lemmer and FJ Kruger
 D Lemmer and FJ Kruger Lowveld Postharvest Services, PO Box 4001, Nelspruit 1200, SOUTH AFRICA E-mail: fjkruger58@gmail.com ABSTRACT This project aims to develop suitable storage and ripening regimes for
Fruit and Tree Nuts Outlook
 United States Department of Agriculture Electronic Outlook Report from the Economic Research Service www.ers.usda.gov FTS-323 July 26, 2006 Fruit and Tree Nuts Outlook Susan Pollack and Agnes Perez Crops
Peach and nectarine varieties for New York State
 NEW YORK'S FOOD AND LIFE SCIENCES BULLETIN NO. 34, MAY 1973 NEW YORK STATE AGRICULTURAL EXPERIMENT STATION, GENEVA, A DIVISION OF THE NEW YORK STATE COLLEGE OF AGRICULTURE AND LIFE SCIENCES, A STATUTORY
FACTORS AFFECTING BUTTERFAT PRICES IN KANSAS
 FACTORS AFFECTING BUTTERFAT PRICES IN KANSAS Dairying is the third largest source of income for Kansas farmers. In most years from 6 to 12 percent of the state's total agricultural income is from the
POTATOES USA / SNAC-INTERNATIONAL OUT-OF-STORAGE CHIP QUALITY MICHIGAN REGIONAL REPORT
 POTATOES USA / SNAC-INTERNATIONAL OUT-OF-STORAGE CHIP QUALITY 2015-2016 MICHIGAN REGIONAL REPORT Chris Long and Aaron Yoder, Michigan State University Procedure: The 2015 Potatoes USA / SNAC-International
in California Jim Lapsley (with thanks to Julian Alston and Dan Sumner)
") Wine Background and Issues in California Jim Lapsley (with thanks to Julian Alston and Dan Sumner) Calabria, June 2008 Topics Production of grapes and wine in California Global l context Structure of the
Wine Background and Issues in California Jim Lapsley (with thanks to Julian Alston and Dan Sumner) Calabria, June 2008 Topics Production of grapes and wine in California Global l context Structure of the
India. Oilseeds and Products Update. August 2012
 THIS REPORT CONTAINS ASSESSMENTS OF COMMODITY AND TRADE ISSUES MADE BY STAFF AND NOT NECESSARILY STATEMENTS OF OFFICIAL U.S. GOVERNMENT POLICY Required Report - public distribution Oilseeds and Products