Pall Oenoflow XL Cross-Flow Filter Efficiency Study. E & J Gallo Modesto Winery. Major Qualifying Project. submitted to the Faculty
|
|
|
- Christal Lindsey
- 6 years ago
- Views:
Transcription
1 Project Number: NKK 04 Pall Oenoflow XL Cross-Flow Filter Efficiency Study E & J Gallo Modesto Winery Major Qualifying Project submitted to the Faculty of Worcester Polytechnic Institute in partial fulfillment of the requirements for a Bachelor of Science Degree in the field of Chemical Engineering by Corey Binette Kyle Flynn Date: February 29, 2008 Approved: Professor N. K. Kazantzis, Advisor of Record Professor H. W. Nowick, Co-Advisor
2 Acknowledgements We would, first, like to thank our project advisors, Professors H.W. Nowick and N.K. Kazantzis of Worcester Polytechnic Institute for their support and guidance throughout our project at E&J Gallo Wineries in Modesto, California. We are also grateful for the assistance provided to us by all employees of the Gallo Cellar. We would specifically like to thank Brian French and Rene Ramirez for answering our questions and providing direction during a time of year where their schedules seemed most demanding. We would like to thank Mark Kollmeyer for his input in the capital justification as well as in designing the production dashboard, Dana St. John for answering our daily operation questions and Trudy Amador for her transportation assistance. Their assistance in completion of this project was greatly appreciated. We would also like to thank Pall Field Service Manager Jim Pinto and Pall Field Engineer Don Acebedo for their continuous in-person and phone support throughout our daily operations of the Oenoflow XL. We lastly wish extend thanks to everyone that expressed interest in and assisted with our project and the Gallo employees that made our stay in the Modesto cellar a valuable experience. 2
3 Abstract This WPI MQP project evaluated the impact of purchasing and installing an additional Pall Oenoflow Cross-flow XL Filter for the Gallo Winery Cellar in Modesto, California. During the project a demonstration model filter was operated and benchmarked on site to determine its filtration performance, and mainly the average flow rate, which was used to evaluate the economic feasibility of investing in a similar wine filtration system. Additionally the engineering framework for an online production dashboard to measure filter downtime and capacity was designed. 3
4 Executive Summary For the past two years, the E & J Gallo Modesto Cellar has used Pall Oenoflow Crossflow Filtration Systems to clarify wine and beverage products prior to bottling. Cross-flow filtration has largely reduced Diatomaceous Earth (DE) pressure leaf filters through its consistent quality, ease of use, and cost effectiveness. Currently the cellar has six 34-module cross-flow filtration systems operating, each capable of running at an average flow rate of 4,000 gallons per hour. However, due to recent shifts in the wine production patterns, an increasing amount of filtration jobs are now smaller than 20,000 total gallons, which makes it difficult to achieve the 4,000 GPH flow rate. This results in a drop in total cellar filtration capacity, and also creates problems finding empty tanks. To help alleviate the problem Gallo Cellar management has been considering investing in a smaller, more flexible Pall cross-flow unit to be used on batches that do not meet the targeted 20,000 gallon threshold. This newer filtration system, the Pall Cross-flow 4A-XL, was tested on site for a period of a month. The MQP team was responsible for learning how to operate the filter system, as well as recording data on filtration flow rate, cleaning cycle times, process losses and overall performance. To assist the team in learning how to operate the filter, a Pall Corporation representative was available during the first week to demonstrate the use of the filter. Over the course of four weeks, ten separate batches were filtered, ranging in size from 1,000 gallons to slightly over 20,000 gallons. Data was recorded on filtration times, volume of concentrate produced, and differential membrane pressures. All data was recorded in a spreadsheet to determine flow rate based on the type of wine filtered. Filtered batches were also tested for quality control standards, including dissolved oxygen content and turbidity 4
5 measurements to ensure clarity. This data was then used to develop a capital project request to purchase a cross-flow XL filtration system. The capital project was based on the premise that a newer cross-flow XL filter would help to replace industrial filter 3, which uses DE filter media. Although the smaller cross-flow unit would not have the overall capacity to completely replace the industrial filter, it would still generate a reasonable amount in yearly savings from smaller wine losses and DE associated costs. Also included in the capital project request was the associated cost of operating an additional XL filter, including utilities such as hot and cold soft water, nitrogen, compressed air, and electricity. Cleaning chemicals used to regenerate the membranes were also included in the projection as an additional cost. Three separate capital project requests were submitted to Gallo as drafts, justifying the purchase of a 4A-XL, 6A-XL, and 8A-XL filter. The only major differences between these three units are the number of modules they utilize, and their expected flow rate. During 2008 the majority of Gallo s capital expenditures budget was already approved for other projects, so a 25% internal rate of return (IRR) would be required to approve a new cross-flow purchase. This hurdle was not obtainable at the time of project completion; therefore, Gallo requested a draft version of the project request form, to be used at a later time. Along with helping the cellar optimize scheduling and filtering capacity, the MQP team assisted with the creating of a web based production dashboard. This production dashboard will allow the Modesto Cellar to track the status of each filter, including downtime, and calculate and display overall efficiency. To help with the design of the dashboard the team was tasked with designing the overall appearance of the application, as well as designing specific data points that 5
6 would be collected from each cross-flow unit. These data points, or tags, were then used in the dashboard framework to calculate and display the required variables. Along with helping to detail the setup and overall appearance of the production dashboard, the MQP team was able to make recommendations as to how the dashboard would be manipulated by the operators. Several suggestions were included with the dashboard framework, such as the automatic input of batch data from the filter schedule, and logins for filter operators to increase accountability. The final stage of the project involved working with a sensitivity analysis software package to determine the effect that an additional cross-flow filter would have on tank utilization and filtering capacity. Because of the complexity of writing rules required to run the simulation, the team was assisted in modifying the software to include an XL filter system. It was assumed that all batches smaller than 50,000 gallons would be assigned to the smaller cross-flow filter, while the remaining batches would be divided up between the larger 34-module filters. The data provided by this type of analysis was helpful in predicting the capacity requirements for the Modesto Cellar in the next 5 years. 6
7 Table of Contents Acknowledgements... 2 Abstract... 3 Executive Summary... 4 Table of Contents... 7 Table of Figures... 9 Table of Tables Introduction Background The Wine Making Process Growing and Harvesting Pressing Fermentation Aging and Clarification Bottling Table Wines Sparkling Wines Dessert Wines Methods of Filtration Diatomaceous Earth Filters Cross-flow Filter Systems Operating the Oenoflow XL 4-module Cross-flow Filter Methodology Benchmarking the Oenoflow XL Filter System Gathering Production Data Developing a Capital Project Justification Developing a Production Dashboard Creating a Sensitivity Analysis Tool Results and Discussion Cross-flow XL Cycle Times Cross-flow XL Average Flow Rate Cross-flow XL Process Loss Percentage Error Analysis
8 4.5 Cross-flow XL Capital Project Justification Oenoflow 4A-XL Project Request Oenoflow 6A-XL Project Request Oenoflow 8A-XL Project Request Production Dashboard Proficy Historian Excel Add-In Production Dashboard Concept Design Sensitivity Analysis Tool Conclusions and Recommendations Justifying the Cost of the Cross-flow XL Filter Production Dashboard Sensitivity Analysis Works Cited Appendix A: Batch Data Sheet Appendix B: 4A-XL Project Request Form Appendix C: 6A-XL Project Request Form Appendix D: 8A-XL Project Request Form Appendix E: Tag List & Descriptions Appendix F: Filter Status Indicators
9 Table of Figures Figure 1: Cutaway of a Horizontal Tank Filter with Dry-Cake-Discharge Figure 2: Visual Representation of Hollow Fiber Membrane Filtration. (Porter 1990) Figure 3: Diffusion across a Semi-Permeable Membrane (Cussler 1997) Figure 4: Steady-State Diffusion across a Thin Film (Cussler 1997) Figure 5: Osmotic Pressure (Cussler 1997) Figure 6: Cutaway of a Pall Hollow Fiber Module. (Robert H. Perry 1997) Figure 7: Picture of the 4-module Oenoflow XL Cross-flow Filter Figure 8: Oenoflow XL Filtration Process Flow Diagram Figure 9: Proficy Portal Flowchart Figure 10: Search Tags Figure 11: Search Tags Dialog Box Figure 12: Current Values Query Figure 13: Current Values Query Dialog Box Figure 14: Current Values Query Output Figure 15: Raw Data Query Figure 16: Raw Data Query Dialog Box Figure 17: Calculated Data Query Figure 18: Calculated Data Query Dialog Box Figure 19: Operator Input Form Figure 20: Operator Input Downtime Pop-up Figure 21: Production Dashboard Concept Diagram Figure 22: Sample Centrifuge Production Dashboard Figure 23: Sample Equipment Status Summary
10 Table of Tables Table 1: 4A-XL Measured Cleaning Cycle Times Table 2: Oenoflow 4A-XL Expected Flow Rate Table 3: Oenoflow 4A-XL Worst Case Flow Rate Table 4: Oenoflow 6A-XL Expected Flow Rate Table 5: Oenoflow 6A-XL Worst Case Flow Rate Table 6: Oenoflow 8A-XL Expected Flow Rate Table 7: Oenoflow 8A-XL Worst Case Flow Rate Table 8: Comparison of Expected Filter Capacity Table 9: Oenoflow XL Process Loss Percentage Table 10: Cross-flow XL Filter Skid Cost Estimates Table 11: 4A-XL Summary of Benefits and Costs Table 12: 6A-XL Summary of Benefits and Costs Table 13: 8A-XL Summary of Benefits and Costs Table 14: Search Tags Output Table 15: Data Query Parameters Table 16: Raw Data Query Output Table 17: Calculated Data Query Output
11 1.0 Introduction For over 4500 years, civilizations have been cultivating, harvesting, and fermenting grapes to make wine. Records dating back as far as 2500 BC indicate that the Ancient Egyptians were well familiar with the use of grapes to make wine. Furthermore wine is frequently referenced in the Old Testament, and was even incorporated into the religious ceremony of Christian churches following the fall of the Roman Empire; a practice which some historians believe helped to maintain the industry. (HoneyCreek Vineyard and Orchard 2004) Essentially, the history of wine is almost as old as history itself. Despite humanity s long history of making wine, the complex chemical process by which wine is produced, fermentation, has been understood for only a little more than 150 years. A more complete understanding of how sugars are converted into alcohols by living organisms, yeasts, allowed winemakers to modernize, and improve, the methods by which wine is produced. (MacNeil 2001) Constantly evolving technology has furthered the ability of wineries to create larger batches of wine, while helping to ensure quality, and even crafting a desired aroma, flavor, texture, and finish to the final product. E&J Gallo Winery, based in Modesto, California, is one of many modern wineries to embrace new technology and developments in wine making, a business strategy that has enabled it to become the world s largest family-owned winery. (MacNeil 2001) Annually, E&J Gallo produces close to 70 million cases a year about the same as the entire country of Portugal. (MacNeil 2001) As the wine industry continues to grow and change, E & J Gallo must also change, by constantly reinventing and refining their manufacturing methods. A recent change in the technology employed at E&J Gallo involved the installation of six separate 34 module Pall 11
12 Oenoflow cross-flow filter systems, to replace the pressure-leaf filters that utilized diatomaceous earth (DE) as the filter media. These filter systems work very successfully if provided with large enough batches of wine where a 4,000 gallon per hour (GPH) flow rate can be achieved. Typically, this means that the batch of wine must be in excess of 20,000 gallons. Recently, however, changes in E&J Gallo s business and production patterns have resulted in smaller batches of wine, where it is difficult to attain a 4,000 GPH flow rate. This project focused on the evaluation of a smaller, 4-module Pall Oenoflow XL cross-flow filter system, for use in filtering smaller batches of wine. The WPI MQP team will be responsible for bench marking the performance of the 4-module system, and developing a capital project justification for the unit. Furthermore, the team will be working with E & J Gallo to create a production dashboard for the six filters already in place, and developing a sensitivity analysis tool to help predict the impact of future changes in production. The production dashboard will utilize GE s Proficy Portal software to display and record the real time status of each filter system, so Gallo cellar staff can analyze and report production data more efficiently. 12
13 2.0 Background 2.1 The Wine Making Process The commercial production of wine involves several stages and the use of large vessels and equipment to accommodate the larger batch volumes. Wineries oversee and control every aspect of the wine-making, or vinification process from the growing of the grapes to the bottling of the final product. The processes for the production of the varieties of wines vary according to the characteristics of the wine desired and the targeted consumer market Growing and Harvesting The quality of a wine is a direct consequence of the care taken in producing it. Great wine starts with careful handling and harvesting of the grapes at the perfect stage in their development. The optimum time for harvest varies with the grape variety as well as the type of wine to be produced. From harvest, the grapes must be handled carefully including their transport to the winery. Proper wine grapes and their juices need to be kept cool in transport and must arrive in good condition with undamaged skins and little juice leakage. In some cases, stemming and crushing will occur before transport to the winery but it is also common practice to ship the grapes on the stem and process them on site. The stemming and crushing process frees the juices in the grapes and facilitates extraction in later stages. The ease with which grapes can be stemmed and crushed depends on the variety. Several types of grapes have particularly tough skins or long stems that can prove problematic to the moving, mechanical parts of wine making equipment. The crushed grape product (known as a must ) is collected and treated with sulfur dioxide (SO 2 ). The sulfur dioxide is added to control unwanted 13
14 microorganisms and inhibit the harmful browning enzymes within the fruits. SO 2 is also responsible for the wine s healthy antioxidants. (Amerine and Singleton 1977) Pressing All stages before fermentation take place in rapid succession. As soon as the must is treated with SO 2, it is ready for pressing. The goal of the pressing process is the removal of the solids (pomace) from the must and the extraction of the juices for the wine making. The timing of the pressing stage varies for the type of wine desired. For white wines, the pressing occurs directly after the production of the must; for red wines, the solids remain for an extended period and are removed after fermentation using the same pressing equipment. By increasing pressure on the must, for example along the length of a screw press, the juices are extruded and collected for fermentation. (Amerine and Singleton 1977) Fermentation For the production of white wines, fermentation begins soon after pressing. The extruded juices from the grapes are fed with a wine yeast inoculation to a large fermenting container. For red wines, the must from the harvest is fed to a container in the same manner. Special care is taken to leave enough head space in the container to allow for the CO 2 produced by the yeast and the expansion of volume. As the yeast work exothermically on converting the fruit sugars to ethanol, a particular concern with the temperature within the container arises. Careful regulation and cooling of the fermentors ensures that the yeasts cannot create undesirable flavors which can occur during the generation of large amounts of heat and subsequent increases in temperature. (Amerine and Singleton 1977) 14
15 2.1.4 Aging and Clarification The final steps in the preparation of wine for bottling are filtration and clarification. The sediments of yeast and remaining grape solids are allowed to settle while the wine is stored in large barrels and racked. The yeasts remain active in this stage and allowance is made for the yeast-produced CO 2 to escape without exposing the wine to the air. Pressure relief bungs are installed in the barrels for this purpose. The storage barrels are often made of oak specifically for its diffusive properties and its ability to allow in minimal amounts of air over time and naturally age the wine while creating complex flavors. (Amerine and Singleton 1977) After a sufficient settling and aging period, the wine is thoroughly filtered in order to produce the resultant clear product for bottling. Unsightly yeast and particle sediment is removed to suit common consumer preference Bottling Wine is ready for bottling after a final polishing filtration and the addition of a small amount of sulfur dioxide or other desirable antioxidants. Wineries often choose dark, tinted bottles to counter the sun s harmful effects on the liquid. The bottling process is carried out mechanically under sterile conditions. Bottles are filled with CO 2 or nitrogen gas to prevent exposing the product to the air. The bottles are then sealed under vacuum with screw caps or with cork, if the wine is intended for further aging. The winery can then store the bottles for 6 months as a quality control measure and may prolong the storage for aging or may immediately affix the bottles with labels and ship them out to distributors. (Amerine and Singleton 1977) 15
16 2.1.6 Table Wines Most processes previously discussed apply directly to standard wines known as table wines. Produced from grapes grown in cooler growing regions, table wines are distinguished by fresh, fruity flavors and are normally classified as dry or sweet. White table wines are most often made from white grapes but paler varieties of red grapes may be used to produce the white wine s characteristic pale, golden color. The white grape varieties used in the production of white wine are particularly susceptible to browning if mishandled. For this reason, sulfur dioxide is added immediately to the must before the wine making processes continue. (Amerine and Singleton 1977) Fermentation for white table wines is a particularly long process. To prevent off-flavors caused by excessive heat and exposure to air, the fermentation process is carried out in a cooled, temperature controlled, closed, and often inerted fermentation tank. The cooling slows the ethanol production and the fermentation must be allowed to run for four to six weeks. The production of rosé table wines is more similar to the white wine process than it is to the production of red table wines. Rosé table wines are typically bright pink to light red in color and, like white table wines, are considered light, fruity, moderately sweet wines. Grapes used for rosé wines tend to be paler red varieties and wines made with the ideal type of grape tend to be of better quality overall than those produced by blending. Rosé grapes tend to be slightly less susceptible to the browning enzymes that make the proper handling of delicate white wine grapes so important. (Amerine and Singleton 1977) Brief fermentation over the grape skins produces the distinctive pinkish color of rosé wines. 16
17 Red table wines are typically produced from sweeter varieties of grapes. Red table wines tend to be more robust in flavor and are richer in color. Fermentation of red table wines takes place on the grape skins. The color of the grape is extracted for a prolonged period and, as a result, the wine has higher tannin content. Red table wines are aged in previously used oak barrels so as not to introduce any off-flavors. (Amerine and Singleton 1977) Sparkling Wines Sparkling wines, often known as champagne, are a class of wine that have high carbon dioxide (CO 2 ) levels and the distinctive sparkle of tiny bubbles. The high CO 2 is normally produced with one of two methods: artificial carbonation or yeast fermentation. A stock wine (often a white, dry table variety) is artificially carbonated by passing a moderately pressurized stream of CO 2 at low temperatures through it and bottling the wine immediately. Yeast fermentation is more preferable, however, because the exposure to off-flavors is reduced. Still laden with active yeasts, sparkling wines may be carbonated in stoppered bottles. Strong, thick glass bottles are filled with the wine and wired tightly shut with cork in order to withstand the increased pressure of the CO 2 production in the wine. The bottles are racked horizontally for a period until the carbonation level meets standards. (Amerine and Singleton 1977) Most hand labor involved in the sparkling wine production comes from the need to remove the sediment from the newly sparkling wines. Bottles are subjected to riddling, where a sharp spin of the bottle promotes the settling of the sediment in a fine layer on the cork. Bottles are stored neck down for this procedure. A process of disgorging is then used to rapidly remove the cork and sediment without wasting the CO 2. The wine, still in its original bottle, is then 17
18 dosaged with sugar syrup in order to bring the sparkling wine up to the desired sweetness level. (Amerine and Singleton 1977) An alternative to costly hand labor of sparkling wine production is the transfer process. Several wine bottles at a time, having already endured the riddling process, are discharged into a large, closed tank for removal of the sediment by filtration. By way of mixing in the tank, a uniform wine product is then bottled in the previously used, washed bottles. Through increased exposure to air, a transfer-processed bottle of sparkling wine is often thought inferior than a fermented-in-this-bottle wine. (Amerine and Singleton 1977) Therefore, when premium wine is desired, the bulk filtration process is used mainly for pink or red wines that would prove difficult to clarify otherwise Dessert Wines Dessert wines or fortified wines are a variety that have been injected with wine spirits, producing an increased alcohol-by-volume percentage. The introduction of higher alcohol levels enables the production of specialty products that would not otherwise be microbiologically produced. Distilled wine spirits are added just before fermentation is complete. Fermentation immediately ceases and the wine is left with very sweet flavor. (Amerine and Singleton 1977) The production of dessert wines is linked to sweeter grape varieties and producers can normally be found in hotter grape-growing regions. The production of different shades of wines remains the same for dessert wines as it did for table wines. Pink wines produced by blending and red wines produced by prolonged fermentation over the skins are fortified once the desired color is attained and just prior to the 18
19 completion of fermentation. Stored in wooden cooperage, dessert wines may be aged for up to six years. (Amerine and Singleton 1977) 2.2 Methods of Filtration During the clarification process, wine is filtered to remove suspended particles and colloidal matter left over from fermentation. If left unfiltered, tables wines, and white wines in particular, can appear cloudy or hazy which, to today s common consumer, is undesirable. Also if yeast is not removed prior to bottling, there is the possibility of a second fermentation taking place in the bottle, as remaining residual sugars are converted to alcohol. Modern wineries have several methods of filtration available for use, including diatomaceous earth (DE) filters, and more modern cross-flow filtration systems Diatomaceous Earth Filters Diatomaceous earth (DE) is a widely used industrial mineral which is composed primarily of the skeletal remains of microscopic aquatic plants, or diatoms. Diatoms have the unique ability to readily extract silica from water to form their own skeletal structures. Under certain conditions diatom deposits accumulate, the water recedes and the deposits become available to mine. (Alar Engineering Corp 2007) Diatomaceous earth is mostly composed of silica (86%), but also contains sodium (5%), magnesium (3%), and iron (2%). (Maiorano and Martinelli 2007) Because DE is chemically inert, and leaves no detectable taste or odor, it is ideally suited for use as a filtering media in almost all industrial applications, including the wine industry. Furthermore, the use of diatomaceous earth as a filter media typically does not necessitate the use of a coagulant chemical. Filtering with DE is achieved by first placing a solid cake of the 19
20 material on the filter leaves, which allows a thin layer of DE to collect on the filter septum. This is called pre-coat filtration, and is important because this is where the primary separation of the particulate matter will occur. Once pre-coating is completed, the process fluid is pumped through the filter, along with a small amount of DE. During filtration particulate matter is collected and adsorbed into the filter media, resulting in a gradual increase in pressure. Once the maximum pressure drop is reached, the filtration process is stopped, and the filter is backwashed to clean the cake from the septum. The cake is disposed of, and then the pre-coating process is repeated again before filtering resumes. (Bhardwaj 2001) This process of filtering with DE has been successful in the winemaking industry because of its relatively low capital cost. See Figure 1 for a schematic of a typical horizontal drum, rotary filtration system. Figure 1: Cutaway of a Horizontal Tank Filter with Dry-Cake-Discharge. 20
21 The use of diatomaceous earth has several drawbacks however. DE is classified as a group I carcinogen for humans by the IARC (International Agency for Research on Cancer), and has also been known to cause silicosis with long term inhalation. Furthermore, restrictions on the safe and costly disposal of DE vary widely, making the potential savings for eliminating the use of DE in a wine-making operation substantial.(wine Communications Group 2007) Beyond the health and safety problems associated with DE, there are other issues as well. Often times, winemakers using DE filters find that one pass through the filter does not adequately remove all of the solids, and instead they are required to make multiple passes through the filter unit for the same batch. Making multiple filter runs greatly increases production time, and thus increases production and labor costs as well Cross-flow Filter Systems Because of the mounting problems associated with the use of diatomaceous earth as a filter media, E & J Gallo winery made the decision to switch to cross-flow filtration systems. Industrial application of cross-flow filtration is not a new concept in food processing, or the wine industry in fact. Many wineries experimented with cross-flow technology during the mid 1980s, however, the units were often difficult to operate, and had the potential to damage the wine by excessive heating and allowing oxygen pickup. (Wine Communications Group 2007) Lately however, the redesigning of cross-flow filtration specifically for the wine industry has solved many of the earlier problems. One of the most attractive features of cross-flow filtration over the use of diatomaceous earth filters is the ability to filter batches of wine in a single pass. Furthermore, the cross-flow systems developed today are almost completely automated. Operators can simply set the desired parameters depending on the batch of wine being filtered, and the process will automatically 21
22 provide the desired filtration. One experiment using cross-flow filtration to clarify apple juice reduced the filtering time from 28 hours using a traditional filter, to 2 hours in a cross-flow filter. (R. Ben Amar 1990) Basic Principles of Operation of Cross-flow Filtration Cross-flow filtration is achieved over a filter membrane that is typically classified as either hollow fiber, tubular, plate-and-frame or spiral. The filter membrane contains pores, available in sizes varying from several nanometers to only a few micrometers. Often time pores can be very small, which can require a significant pressure to force liquid through the channels. Much like a typical filter, pressure is applied perpendicularly to the membrane, as the filtered liquid passes through the membrane. As filtration continues, however, the surface of the membrane collects debris, which blocks the pores of the membrane and slows the rate at which fluid can pass through. During cross-flow filtration, however, the buildup of solid particles on the surface of the membrane, also referred to as fouling, is slowed by the feed stream, which is flowing parallel to the membrane at a high velocity. This is called tangential flow filtration. During tangential flow filtration, the feed stream acts to clean the surface of the membrane and subsequently provides a higher permeate flow rate. The tangential flow filtration is also more economical since it reduces the need to buy filter membranes as often, because it extends the life of the membrane significantly Engineering Principles of Cross-Flow Filtration Filtration through the hollow fiber membrane is achieved primarily through difference in pressure across the surface of the membrane, which acts as the driving force. The nominal pore size of the cross-flow membranes is 0.17 µm and is highly uniform along the membrane (Pall Corporation 2007). Although Fickian diffusion is relevant to any membrane separation process, 22
23 advective and viscous flow dominates the process of porous membrane filtration used in crossflow units (Robert H. Perry 1997). Error! Reference source not found. shows a diagram of a typical hollow fiber membrane filtering under countercurrent conditions. Figure 2: Visual Representation of Hollow Fiber Membrane Filtration. (Porter 1990) The yield for a batch filtering process can be obtained through comparing the initial volume with the volume recovered after clarification. Y = V o V R i 1 = c c o R i 1 R i (1) R i = c b c p c b (2) Error! Reference source not found. and Error! Reference source not found. are used to determine the yield of each filtration batch, which is then converted to process loss percentage. (Rousseau 1987) In Error! Reference source not found. and Error! Reference source not found., c = solute concentration (c o, initial; c b, bulk; c p, permeate), and V = volume (V o, initial). 23
24 The underlying processes behind cross-flow filtration depend on several fluid flow forces. Each of these forces governs the membrane separation of a solvent from a solution through physical laws. A summary of the central forces can be seen visually in Error! Reference source not found.. Figure 3: Diffusion across a Semi-Permeable Membrane (Cussler 1997) The pressure gradient on opposing sides of the membrane drives the diffusion of solvent from an area of high pressure across the membrane to an area of lower pressure. In this case, the membrane is selectively permeable to the solvent and, therefore, largely prevents the crossing of the solute to the right side. The right side of the membrane is very dilute. The resulting concentration gradient across the membrane triggers osmotic flow, which counteracts the pressure-driven diffusion of the solvent across the membrane and acts opposite the pressure gradient. (Cussler 1997) An underlying understanding of Fick s Law provides the basic relationship of the processes behind mass transfer in fluid systems and the determination of flux, defined as a volume per unit time per unit area. Adolf Fick, through experimentation, defined total onedimensional flux, J i, as J i Aj i c1 AD z (3) 24
25 where A is the area for diffusion, j i is the flux per unit of area, c 1 is the concentration, z is distance and D is the diffusion coefficient. (Cussler 1997) Simplified slightly, Fick s Law for one-dimensional diffusion in Cartesian coordinates is defined as j i c1 D z (4) One-dimensional diffusion does little to completely model the complex processes concerning cross-flow filtration. There are many forces that ultimately combine to produce an accurate representative model of membrane diffusion in cross-flow filtration. One of the applicable fluid flow forces used in constructing a model of membrane separation is steady state diffusion across a thin film. Figure 4 depicts the situation of the simplest diffusion problem with discussion to follow. Figure 4: Steady-State Diffusion across a Thin Film (Cussler 1997) On both sides of a thin film, a well-mixed, dilute solution of one solute exists. Solute flows from left to right, from a region of higher concentration to one of lower concentration. As shown in Figure 4, solute diffuses across the thin film from points of higher concentration (z 0) 25
26 to points of lower concentration (z l). Consider a thin layer, z, within the film. Writing a mass balance this thin layer will lead to determination of the solute concentration profile and the flux across the thin film. (Cussler 1997) The mass balance in the thin layer is as follows For the simplest diffusion case, the process is at steady state and solute accumulation will be 0. The rates of diffusion within the formula are found by multiplying the diffusion flux by the film s area as in Error! Reference source not found.. 0 A( j j1 1 z z z ) (5) A z, yields Rearranging Error! Reference source not found. after dividing by the film s volume, 0 j j 1 z z 1 z z z z (6) As z becomes increasingly smaller and approaches 0, the equation takes the form of Error! Reference source not found. and becomes the definition of the derivative. d 0 j 1 dz (7) Combining Error! Reference source not found. with Fick s Law, 26
27 dc j 1 1 D dz (8) In the simplest case, for a constant diffusion coefficient, D d c 0 D dz (9) The two governing boundary conditions are z = 0, c 1 = c 10 z = l, c 1 = c 1l Integrating Error! Reference source not found. twice yields a general form of the concentration profile c 1 = a + bz (10) may be found. Through use of the boundary conditions, the concentration profile for the thin film case c c c l c ) 1 10 ( 1 10 z l (11) the flux Differentiating the concentration profile in Error! Reference source not found. yields dc dz D l 1 j1 D c10 c1 l (12) 27
28 With the system in steady state, the flux is constant. This mathematical operation proves fairly simple in the case of the thin film. However, with cross-flow filtration through hollowfiber, porous membranes, the case for finding the concentration profile and flux is complicated slightly. (Cussler 1997) The same mass balance from Error! Reference source not found. is subject to more complex boundary conditions in the case of membrane diffusion. z = 0, c 1 = HC 10 z =l, c 1 = HC 1l H, defined as the partition coefficient, must be introduced to account for the fact that the membrane is chemically different from the solutions on either side. The partition coefficient is mathematically defined as the value of the concentration in the membrane divided by that in the adjacent solution. In order to apply the partition coefficient, it must be assumed that the system is in equilibrium. (Cussler 1997) Applying the new boundary conditions to the general concentration profile in Error! Reference source not found. yields the concentration profile for the case of a porous membrane, Error! Reference source not found.. c HC H C l C ) 1 10 ( 1 10 z l (13) The flux is then determined as before. 28
29 dc dz D 1 eff j1 Deff C10 C1 l l H (14) In the case of the thin film, a quantity, D, defined as the one-dimensional diffusion coefficient was incorporated into Fick s Law. In the case of a porous membrane however, allowance for diffusion through the membrane s pores is not included in a one-dimensional diffusion coefficient. A new term defined as the effective diffusion coefficient, D eff, is therefore introduced in order to account for diffusion through the tubular pores. The effective diffusion coefficient accounts for the local geometry of the membrane s pores and encompasses the necessary tortuosity factors. (Cussler 1997) For the diffusion of a dilute solution across a thin membrane at constant temperature and pressure, the term C 1l becomes 0 and leads to the flux equation. dc dz D 1 eff 1 Deff C10 j l H (15) Diffusion across a thin membrane also involves the concept of osmotic pressure. Osmotic pressure gradients arise in the thin membrane separation of solvent from solute where the membrane is permeable to the solvent yet impermeable to the solute. 29
30 Figure 5: Osmotic Pressure (Cussler 1997) Chemical potential is constant at equilibrium so when applying the concept of osmotic pressure to Error! Reference source not found., this consideration must be taken into account. Osmotic pressure in relation to chemical potential may be expressed as Error! Reference source not found. µ 2 (T,p) = µ 2 (T,p + ) (16) where µ 2 is chemical potential and represents the osmotic pressure gradient. On the pure solvent side of the membrane, the chemical potential is at standard state. Adjustments must be made, however, to represent the chemical potential on the solution side. Solute concentration and pressure must be incorporated into Error! Reference source not found. and Error! Reference source not found.. (Cussler 1997) µ 2 o (T,p) = µ 2 o (T,p + ) + RT ln x 2 (17) µ 2 o is the chemical potential at standard state and x 2 is the concentration of the solvent. µ 2 o (T,p) = µ 2 o (T,p) +V 2 + RT ln (1 x 1 ) (18) 30
31 Incorporating V 2, the partial molar volume of the solvent, allows for determination of a relationship between osmotic pressure and solute concentration to be determined for an ideal solution. This relationship is presented in Error! Reference source not found.. V 2 = -RT ln (1 - x 1 ) (19) Integrating the concept of osmotic pressure into Error! Reference source not found. yields an important relationship between flux and osmotic pressure. Determining this relationship begins with setting the osmotic pressure difference,, equal to RT(C 10 )and defining a term for solute permeability, ω, with the same units as a mass transfer coefficient. (Cussler 1997) DH lrt (20) ω defined in Error! Reference source not found. can then be placed with in Error! Reference source not found. and form a new relationship between flux and osmotic pressure shown as Error! Reference source not found.. j 1 (21) In addition to diffusion and osmotic pressure, solvent transport presents a third facet of a complete cross-flow filtration model. Consider a case where pure water is pushed through a membrane solely by a pressure difference. The water flux would then be expressed as: j v volume _ water / time area _ membrane v 2 31
32 where j v is a volumetric flux. The water flux j v can then be attributed to diffusion or to flow through the membrane s pores. (Cussler 1997) If the water flux is attributed to diffusion, the flux is given by Error! Reference source not found.. D j v l 2 C2 j c2 (22) where C 2 is the water concentration outside of the membrane and c 2 is the water concentration gradient within the membrane. Equilibrium is assumed across each membrane-solution interface, so the pressure and chemical potential of water are each constant. Equating the solvent and membrane sides of the boundary yields Error! Reference source not found.. o * * 2 V o 2 p RT ln C2 2 V2 p RT ln c 2 (23) where the superscript o refers to the solvent and * refers to the membrane phases. When rearranged, Error! Reference source not found. yields Error! Reference source not found. c o * He( V2 V2 )( p p) RT C 2 2 / (24) where H is the partition coefficient at some average reference pressure, p. H e o * 2 2 ( V2 o 2 * V ) p / RT (25) Expansion of these relations in a Taylor series of pressure distribution leads to Error! Reference source not found.. (Maiorano and Martinelli 2007) c V V 1 C RT o * H ( p p) 2 (26) 32
33 Through simplification, Error! Reference source not found. yields Error! Reference source not found.. c 2 o HC2 ( V2 V2 RT * ) p (27) where p represents the pressure difference across the membrane, p p. (Maiorano and Martinelli 2007) When Error! Reference source not found. is combined with the volumetric flux equation, Error! Reference source not found., the result is Error! Reference source not found.. j v o DH( Vs V2 RTl * ) p (28) Consolidation of the bracketed terms of Error! Reference source not found. into one term, L p, for a coefficient of solvent permeability yields Error! Reference source not found.. j v L p p (29) Error! Reference source not found. describes solvent transport across the membrane solely through diffusion. In the case of a porous membrane containing small tubes of diameter, d, the flux is calculated in a different manner. The velocity across the membrane could be modeled simply as fluid flow through a cylinder and would be governed by the Hagen-Pouiseuille law, Error! Reference source not found.. v 2 2 pd p l 32 (30) 33
34 In comparing Error! Reference source not found. and Error! Reference source not found., it is apparent that the parameters which contribute to solvent permeability through pores differ greatly from those in diffusion transport. Identifying which of the types of solvent transport is applicable is often difficult. Determination of the partition coefficient and pore size of a thin selective layer is very difficult and often presents complications. (Maiorano and Martinelli 2007) Reverse osmosis is often accurately described by solvent transport solely through diffusion. For cross-flow filtration, the assumption holds that the membranes contain pores and should be described using the Hagen-Pouiseuille equation (Error! Reference source not found.) and corrections made with the appropriate tortuosity factors. It is more common when working with porous hollow-fiber membranes (as in the Oenoflow systems) to use the Hagen- Pouiseuille equation to best model the fluid behavior. (Maiorano and Martinelli 2007) Total flux equations for membrane transport can be developed through a combination of the actions of osmotic pressure, solute diffusion and solvent transport. The total flux, j v, for the solvent involves the combination of the pressure-driven solvent transport and its counteracting force, osmotic pressure. jv L p ( p ) (31) In Error! Reference source not found., σ represents the reflection coefficient with specific characteristics of the membrane. If the membrane is completely impermeable to the solute but permeable to the solvent, then σ equals 1. If the membrane is equally soluble to both the solute and solvent, then σ will equal zero. (Maiorano and Martinelli 2007) 34
 C1 j v (32) where C 1 is the average solute concentration [(C 10 +C 1l )/2] and σ is the transport coefficient. Despite the theoretical merit of Error! Reference source not found. and Error!")
35 The total solute flux, j 1, involves combining solute diffusion and convection across the membrane into Error! Reference source not found. j1 ( 1 ') C1 j v (32) where C 1 is the average solute concentration [(C 10 +C 1l )/2] and σ is the transport coefficient. Despite the theoretical merit of Error! Reference source not found. and Error! Reference source not found., these relationships have proved to be inconvenient and difficult to implement in practice. (Cussler 1997) Therefore, within industry and specifically at E & J Gallo Wineries, theoretical calculation is supplanted by experimentation with small-scale testing equipment and direct observation Pall Oenoflow XL 4-Module Cross-Flow Filter System The 4-module Pall Oenoflow XL filter is different from the 34-module filters already installed in the Gallo cellar in several ways. The 34-module cross-flow filters contain membranes each with 8.2 m 2 of surface area available for filtration. Each module on the 34- module system is 1.17 meters in length and 0.19 meters in diameter. Figure 6: Cutaway of a Pall Hollow Fiber Module. (Robert H. Perry 1997) 35

36 The 4 modules on the Oenoflow XL filter each contain approximately 19.7 m 2 of effective filtration area, which is roughly 2.4 times the surface area of the 34-module unit filters. See Error! Reference source not found. for a diagram of a Pall hollow fiber membrane. The Oenoflow XL unit is estimated to provide a filtration rate of 5, L/hr. (Pall Corporation 2007) Furthermore the XL unit is designed to have a smaller footprint than the 34-module filters, because it requires fewer modules to operate. Although the unit that will be delivered to E & J Gallo in December will have 4-modules, Pall manufactures Oenoflow XL systems with as many as 30 modules, and also has the capability to design larger units upon request. (Pall Corporation 2007) (See Figure 7) Figure 7: Picture of the 4-module Oenoflow XL Cross-flow Filter. 36
37 2.3 Operating the Oenoflow XL 4-module Cross-flow Filter Operating the Oenoflow XL filter is similar to operating the currently installed 34- module filters located in the Cellar. Both units require the same utilities to operate; three phase power, soft, hot and cold water, nitrogen, and compressed air. Cleaning cycles are also very similar between the two machines, as well as the different production modes used during operation. One difference that prevented the current operators from assisting with the Oenoflow XL unit was the different software installed on the smaller unit. On the 34-module units Gallo replaced the original manufacturer software with a specially designed version to suit the company s specific needs. Because the 4-module unit is a Pall demonstration model it included Pall s software package which was unfamiliar to the cross-flow operators. The Oenoflow XL filter is controlled through the use of a touch screen LCD panel, a type of Human-Machine Interface (HMI). Using the HMI operators are able to set the specific production program they want the filter to run, and indicate variables such as backflush settings, flow rate, and batch size. Cleaning cycles are also selected in a similar manner, using preprogrammed cleaning routines. Operators also have the option of creating a unique cleaning routine using the Oenoflow XL software. All production and cleaning cycles are started using the green play button and the bottom of the screen. One advantage of the Oenoflow XL is the addition of a pause feature, which allows the operator to pause a cleaning cycle or production cycle if changes need to be made. Operators than can resume the cycle by pressing play again. The 34-module filters do not have this feature available, and must be stopped completely if settings need to be adjusted, which takes valuable time away from production. 37
38 3.0 Methodology Evaluating the Oenoflow XL filtration system occurred in three different steps, each with its own timeline and Gallo requested deliverables. First, the Oenoflow XL skid was bench marked for a period of three weeks, with the on-site and phone support of Pall personnel. The data gathered during the testing phase was used to evaluate whether it was economically feasible for E & J Gallo to invest in an Oenoflow XL system for their cellar. The second section of the project entailed the design and initial development of a production dashboard for the six Oenoflow systems already in place, so equipment operators will have easy access to information regarding the performance of the units, including downtime, flow rate, and operating pressures. The final part of the project was focused on creating a sensitivity analysis tool to help determine how future changes in production would affect filtration capability. 3.1 Bench Marking the Oenoflow XL Filter System Bench marking the Oenoflow XL filter system took place in two separate stages. First, production data was gathered using the 4-module filter over a period of three weeks. This production data was carefully logged and analyzed to provide an average filtration rate and process loss percentage, two important production variables employed at E & J Gallo. The second stage involved analyzing the production data obtained from experimentation and extrapolating the data in order to create a capital project justification, to determine if it is financially advantageous for Gallo to invest in an Oenoflow XL unit Gathering Production Data Bench marking the operation of the Oenoflow 4A-XL cross-flow filter system occurred over a period of four weeks, the first of which a Pall field engineer was on site at the plant to 38
39 provide training for the MQP team. When the team arrived at the winery, the Oenoflow XL filter skid was already in place, but was not connected with utilities such as hot soft water, cold soft water, nitrogen, and compressed air. Pall representatives assisted with setting up the filtering unit, and then demonstrating the various rinse and chemical cleaning cycles available on the filter. This allowed the team to get timings on how long each cleaning procedure took so that they could be used when calculating average flow rate later. The week of January 14 th 18 th, 2008 was dedicated to training the team to operate the filter. During this time period 3 batches of wine were filtered; 15,000 gallons of Twin Valley Merlot, 1,300 gallons of Mirassou Pinot Noir, and 13,000 gallons of Dancing Bull Merlot. Between each batch different cleaning procedures were used to regenerate the filter membranes, and to help the team become familiar with proper cleaning routines. During each run, data was recorded every minutes, using the log sheet (See Appendix A: Batch Data Sheet). Key variables to measure included: Trans-membrane pressure (ΔpT) Pressure difference across the module (ΔpM) Temperature of raw wine in (T 1 ) Temperature of filtrate out (T 2 ) Filtrate flow rate Total filtrate volume Feed pressure. During filtering runs, quality assurance tests were conducted as well, which measured NTU and PPM, both used to measure suspended particles in wine. Oxygen concentration tests were also carried out to determine oxygen pick up during filtration. These quality tests were 39
40 taken from three sampling ports for each run: feed tank (unfiltered wine), tank 2 on the Oenoflow XL unit (freshly filtered wine), and at the product tank. Figure 8 shows the process flow diagram, including the location of sampling ports. Taking measurements at different locations allowed the team to determine if transporting the wine from the filter to the product tank had any impact on quality, which would not be attributed to the filter system itself. Figure 8: Oenoflow XL Filtration Process Flow Diagram During the week of January 21 st 25 th, 2008, the MQP team was responsible for running the XL filter system independently, without Pall support. During this period three more small batches were filtered, including; a 38,000 gallon batch of Turning Leaf White Zinfandel, a 12,000 gallon batch of Turning Leaf Chardonnay, and a 6,500 gallon batch of Mirassou Merlot. 40
41 The large batch of white zinfandel was broken into two smaller batches, approximately 19,000 gallons each, and filtered on separate consecutive days both for convenience and in order to ensure adherence to the project scope of 20,000 gallon batches. The next week of testing the Oenoflow XL filter was January 28 th February 1 st, During this week, two more batches of wine were filtered, a 33,000 gallon batch of Gallo Family Cabernet/Zinfandel blend, and a 41,000 gallon batch of Twin Valley White Wine. Because both of these batches were above the 20,000 gallon limit that was the basis for the project, data was collected for only the first 20,000 gallons filtered, and the remaining volume was filtered by swing shift operators under direction of the WPI project team. Swing shift operators were provided with verbal instruction and given contact information for the WPI project team should any problems have surfaced. The final week of testing was February 4 th February 8 th, During this time period 30,000 gallons of Gallo Family Zinfandel was filtered early in the week. Because the filter was scheduled to be moved and trialed at another company site on Wednesday, February 13 th, it was determined that the Gallo Family Zinfandel batch would be the last work order the unit would complete. After the filtration, the unit was cleaned and rinsed with phosphoric acid to preserve the membranes during transport Developing a Capital Project Justification The MQP team was responsible for constructing capital project justifications for the purchase of a 4A-XL, 6A-XL, and 8A-XL Oenoflow Cross-flow Filter. The 6A-XL and 8A-XL models were very similar to the 4A-XL model tested during the four week trial period, except that they had more modules (6 and 8 respectively), and therefore were capable of providing a 41
42 higher flow rate. For each filter system, a Gallo Project Request Form and a Gallo Financial Model were completed. For the project to be approved in 2008, an internal rate of return (IRR) of at least 25% would be required to approve the filter purchase. This unusually high return rate was due to the large amount of capital that had already been invested by E&J Gallo in After data was gathered on the 4A-XL cross-flow unit, it was entered into a spreadsheet so that all process variables could be calculated. An average flow rate was calculated by dividing the total filtered gallons by the total operating time, including time used to clean the filter after each batch. Average flow rate was also estimated for the 6A-XL and 8A-XL models by assuming that the 6A-XL would have the ability to filter wine 50% faster than the 4A-XL filter. A similar assumption was made for the 8A-XL model, that it would filter 100% faster than the 4A-XL. This only affected the time spent filtering however, and did not change the time required to clean. It was assumed that cleaning cycles were similar enough in length on all XL models to be considered identical. Pall engineer Don Acebedo later confirmed that the only differences between cleaning cycles would be the slight variation in time required to fill the larger 6 or 8 module systems with water. Error! Reference source not found. below shows how average flow rate would be calculated for the 4A-XL for a 15,000 gallon batch of wine that filtered for 6 hours and cleaned for 2 hours. Error! Reference source not found. and Error! Reference source not found. show the average flow rate calculations for the 6A-XL and 8A-XL units respectively. 15,000 gal 6 filter rs+2 clean rs = 1,875 GPH (33) 15,000 gal 6 filter rs +2 clean rs 1.5 = 2,500 GPH (34) 42
43 15,000 gal 6 filter rs +2 clean rs 2 = 3,000 GPH (35) Average process loss percentage was also calculated for the 4A-XL skid, which is a measure of the volume of concentrate pumped to grape distillation material (DM) compared to total volume of wine filtered. Because the 4A-XL, 6A-XL, and 8A-XL filters all use the same single module final concentration process, it was assumed that the process loss percentage would be similar for each filter system. The next step towards completing the capital project justification was estimating the overall initial project cost, expected project savings, and expected costs to be incurred by running an additional filter. Budgetary estimates on purchase costs for the 4A-XL, 6A-XL, and 8A-XL filters were provided by Pall representative Steve Mullen, however these estimates were not configured to include the additional software and hardware that Gallo would require on a crossflow filter. To compensate for this, an expense of 25% was added to the base cost of the filter. Additional expenses such as installation and transportation were also not included, and had to be accounted for on the financial model as well as a contingency expense. Expected project savings were calculated based on the reduced amount of DE filter media that would be utilized on filter #3, and the savings in wine loss. These savings were estimated to be significant because each time filter #3 is operated, 250 gallons of wine is lost as holdup volume, and 1,500 pounds of DE is consumed, as well as about $100 in pre-filtering materials. (Kollmeyer 2008) The average cost for DE was calculated based on January Cellar Material Inventory Reports, and the average cost of wine was taken from a previous project justifying cross-flow filtration. (Ramirez 2007) 43
44 Finally, the costs of operating the filter were calculated as well, which primarily included utilities such as compressed air, nitrogen, hot soft water, cold soft water, and electricity. The cost of cleaning chemicals such as caustic sodium hydroxide (50% NaOH), citric acid (50%), and hydrogen peroxide (35% H 2 O 2 ), were also factored in. 3.2 Developing a Production Dashboard Concurrently with the capital project justification, the development of a production dashboard for use by filter operators and managers began. Using sophisticated software, namely GE FANUC s Proficy Portal and Proficy Historian, a visual, interactive dashboard was designed to give filter operators remote viewing access to important process variables for purposes of monitoring the six Oenoflow 34-module systems. Data from each skid s Programmable Logic Controller (PLC) is collected by Proficy Historian. Process variables within the filter s PLC are marked with tags in order to facilitate collection by Historian. The process data is logged on servers, where it is accessible over the plant network via Proficy Portal or Microsoft Excel for data analysis and reporting. Such data analysis tools are collected in the production dashboard interface. Ultimately, tag data from the skids will be used to analyze process trends and help eliminate crippling bottlenecks in production. See Error! Reference source not found. for a visual representation of the data collecting and logging process. 44

45 Figure 9: Proficy Portal Flowchart The production dashboard itself is a software interface that displays updated equipment status and process variables in real-time. Several indicators allow users with proper access credentials to monitor differential pressure, flow rates and other gauges of performance. Links are provided within the panel through which, users are brought to trend screens showing up-todate visual representations of performance. Differential pressure can be monitored on the trend screens to see if the membranes are beginning to become plugged. A measure of the flow of water through the membranes on cleaning cycles, known as water flux or, more commonly, H 2 O flux, may also be monitored via trend screens. Reductions in H 2 O flux values often warrant adjustment of cleaning practices. Also included within these screens are trends for average flow rate, turbidity measurements, and equipment status summaries including down-time. Development of the dashboard began with bench marking the 4-module Oenoflow XL system. Familiarity with the Oenoflow XL system made apparent the important process 45
46 variables and enabled use of the same process variables with analyzing the larger 34-module Oenoflow systems. Knowledge of which data values to collect and analyze is crucial in creating a valuable tool such as a production dashboard. A list of the important variables including equipment status, differential pressure, flow rates and volumes in/out was generated. Initial design for integration of the process tags into the production dashboard was completed using a spreadsheet. A visual map of the conceptual production dashboard interface and its utilities was completed at this stage in order to communicate the desired outcome to programmers. Programmers were then tasked with developing the code for acquiring the desired process tags from the PLC of each skid and integrating them with information from separate resources into a functional production dashboard. Integration of several data sources and cooperation of several departments has been recommended for the development of an effective production dashboard. It has been recommended that the Wine Process Management group integrate its filtration scheduling within the production dashboard, enabling data logging and analysis with the inclusion of information directly from the filter schedule. Though it may prove unrealistic, it is also recommended that filtration scheduling be completed automatically through a computer equipped with desired heuristics. Though scheduling may remain a manual task, automatic scheduling would make data analysis and the recommendations that come from it more effective. If automatic scheduling is not a viable option, there is a form within the dashboard dedicated to input of the filter schedule by the Process Management group. With key information from the schedule, the production dashboard, ideally, would then be able to visually queue work orders, display scheduled tasks and enable logging of the wine description for analysis of average flow rate by wine type. 46
47 An input form for filter operators has also been included within the plan for the production dashboard. Within the already existing Human-Machine Interface (HMI) on each filter, cellar operators are able to select the current work order on-screen from those that are queued via the filter schedule. In an effort to increase accountability, filter operators will also be required to login and take responsibility for each filter at the start of each shift. Accurate time logging will be made possible as operators will be required to enter down-time reason codes within the interface in order to analyze the largest source of process bottlenecks, unscheduled down-time, etc.. Down-time descriptors will also be automatically updated by each filter s PLC for reasons such as rinsing, concentration and product recovery. Measures of efficiency will be included within the production dashboard and reports can be generated for viewing of results. As the relationship between actual production output and a skid s potential output, percent utilization is often a good measure of total operating efficiency. Extremely high percent utilization figures cause fears of overutilization. Actual production converges on potential output and leaves little room for fluctuations in demand. Often, high percent utilization figures can be used to justify purchase of an additional filter or expansion in tank farm capacity. Low percent utilization figures may point to ineffective scheduling of filter resources or excessive unscheduled down-time. Overall Equipment Effectiveness (OEE) is another numerical efficiency indicator calculated within the production dashboard. OEE is defined as follows: OEE = Availability x Performance x Quality where Availability = Operating Time / Planned Production Time 47
48 Performance = (Total Pieces / Operating Time) / Ideal Run Rate Quality = Good Pieces / Total Pieces. The Quality calculation requires the definition of a piece of output. In the case of Gallo Wineries, the piece would be a gallon of filtered wine while good pieces would be those gallons that are ready for bottling as-is and would not require extra, unscheduled filtering to meet quality standards. By industry and especially Gallo standards, the quality value should always be at least 99.99% On the production dashboard interface, current OEE will be compared with average OEE and world-class figures as defined by Vorne Industries, Inc. It is important to note that OEE is not itself a definitive measure of performance but its components must also be taken into consideration (Vorne Industries, Inc. 2008) 3.3 Creating a Sensitivity Analysis Tool The final stage of the project was centered on working with a sensitivity analysis tool. A sensitivity analysis tool is often used to study the outcome of a model when variation is introduced in one or more of the inputs. In other words, it is a study of the sensitivity of a model or system to foreseeable changes in variables such as capacity, addition of equipment or demand changes. This study is very useful in determining present production capacity of an operation as well as raising any concerns over predicted future trends. A sensitivity analysis tool was developed for Gallo Wineries in order to help determine the impact of forecasted production requirements (i.e. demand, capacity) on the proposed addition of an Oenoflow XL system into Cellar Operations. 48
49 The sensitivity analysis was completed through the assistance of the Operations Research department at Gallo of Modesto. Using complex software packages, namely AIMMS Modeling Software by Paragon Decision Technology, the engineers in Operations Research were able to insert the 4-module Oenoflow XL filter into the current state of production and view sensitivity results based on forecasted demand. The analysis centered on determining the sensitivity of production capability and tank farm capacity when a new piece of equipment was introduced into the system. Within AIMMS, the utilization of each filter is governed by set rules and heuristics. The software was configured in such a way that all forecasted jobs with batch volume less than 50,000 gallons would be assigned to the XL filter, if available, or else to a larger 34-module cross-flow system. Such a rule was built into the program s heuristics in order to realize a sufficient increase in efficiency for the larger cross-flow units and also maximize the reduction in the use of DE filters. Operations Research provided data for changes in necessary tank capacity as well as changes in the percent utilization for each of the cellar s filter resources. These data were incorporated into determining the effect of the addition of an Oenoflow XL system on the cellar s handling of future demand. 49
50 4.0 Results and Discussion After benchmarking the Pall 4A-XL Oenoflow Filter, data was compiled into a single Microsoft Excel workbook, where all process variables such as cycle times, flow rate, and wine loss were calculated. Because of the wide variety of table wines filtered during the four week trial period, average values were taken which included all runs. 4.1 Cross-flow XL Cycle Times The cleaning cycle times for the 4A-XL cross-flow filter were experimentally determined during the first week the filter was operated at Gallo. Error! Reference source not found. shows the values recorded for the 4A-XL model; however, they are assumed close enough to be accurate for the 6A-XL and 8A-XL models as well. Table 1: 4A-XL Measured Cleaning Cycle Times 4A-XL Measured Cleaning Cycle Times Cycle Time (hr:min) Cold Rinse 0:26 Hot Rinse 0:28 Solo Backflush 0:04 Double Backflush 0:08 Drain System 0:08 Clean in Place 2:50 During a cold rinse, the system is filled with approximately 150 gallons of cold soft water, and the water is circulated throughout the membranes before being drained. A hot rinse is similar, except hot soft water is used instead of cold water. During a solo backflush, the filtrate side of the system is filled with cold soft water, while the membrane tubes are filled with pressurized air. Then the cold water is forced backwards through the membrane to dislodge any 50
51 particles trapped on the surface of the membrane. A double backflush simply repeats this procedure twice. A clean in place (CIP) cycle is used to chemically clean the wine residue and particulate matter from the filter membranes after production. Typically, Gallo recommends a complete CIP when switching from a red to white wine, to prevent the red color from being carried over into the white wine. CIP is also used at the end of the week, to store the machine over the weekend, or when the flux rate becomes too low to continue filtering at a reasonable rate. A CIP involves filling the system with soft water, dosing caustic (NaOH) and hydrogen peroxide (H 2 O 2 ), and allowing the chemicals to circulate around the system for an extended period of time. Then, the caustic is neutralized by citric acid, diluted by more soft water. 4.2 Cross-flow XL Average Flow Rate Using the data collected from the 4A-XL model cross-flow filter, average flow rates were calculated for all three filter models being compared. For each filter, two flow rates were obtained. The expected flow rate was the value that Gallo operators could anticipate if they ran the XL filter similarly to the 34-module filters already in place. This assumed one rinse after each job and an average of two CIP procedures each week. Error! Reference source not found. shows the expected average flow rate for the 4A-XL cross-flow filter. The flow rate was calculated based on 10 different filter jobs, each below or around 20,000 gallons. The average flow rate was calculated at 1,739 GPH, which resulted in an average yearly capacity of 7.8 million gallons, assuming 75% uptime and 50 operating weeks per year. In each case, average flow rate was taken as the sum of the filtered gallons, divided by the sum of the total time taken to filter and clean. 51
52 Table 2: Oenoflow 4A-XL Expected Flow Rate Oenoflow 4A-XL (Expected Case) Wine Type Volume Filter Time Total Time Flow Rate Gal Hr hr GPH Merlot 15, , Pinot Noir Merlot 12, , White Zin 20, , White Zin 18, , Chardonnay 12, , Merlot 6, Cabernet 20, , White 22, , Zinfandel 11, Avg Flow 1,739 The second flow rate calculated was the worst case scenario, in which it was assumed that after each job a full CIP procedure was required, which could be the result of either a switch in blends, or a low water flux rate after filtration. Under normal operating conditions, the worst case scenario would not be reached; however, it provided a good method in which to judge the range of the filter. Error! Reference source not found. shows the lowest conceivable operating flow rate for the 4A-XL filter, which was calculated at 1,390 GPH. This resulted in an average yearly capacity of 6.3 million gallons of wine. 52
53 Wine Type Table 3: Oenoflow 4A-XL Worst Case Flow Rate Oenoflow 4A-XL (Worst Case) Filter Total Volume Time Time Flow Rate Gal Hr hr GPH Merlot 15, , Pinot Noir Merlot 12, , White Zin 20, , White Zin 18, , Chardonnay 12, , Merlot 6, Cabernet 20, , White 22, , Zinfandel 11, Avg Flow 1,390 For the Oenoflow 6A-XL filter system, it was assumed that the flow rate during production would be 50% higher than the 4A-XL, due to the increase in membrane surface area. Cleaning cycle times would remain the same between each unit however, which implied that the average flow rates from the 4A-XL to the 6A-XL would not see the same 50% increase. Error! Reference source not found. shows the predicted filter times (6A-XL Time), and total filtration and cleaning times (Total Time) for the 6A-XL filter. The average flow rate was calculated at 2,541 GPH, which corresponds to an average yearly capacity of 11.4 million gallons of wine. 53
54 Wine Type Table 4: Oenoflow 6A-XL Expected Flow Rate Oenoflow 6A-XL (Expected Case) 4A-XL 6A-XL Total Volume Time Time Time Flow Rate gal hr hr Hr GPH Merlot 15, , Pinot Noir Merlot 12, , White Zin 20, , White Zin 18, , Chardonnay 12, , Merlot 6, , Cabernet 20, , White 22, , Zinfandel 11, Avg Flow 2,541 For the 6A-XL model filter, the worst case flow rate was calculated as well. Error! Reference source not found. shows the results, with the average flow rate at 1,829 GPH or 8.2 million gallons per year of average capacity. 54
55 Wine Type Table 5: Oenoflow 6A-XL Worst Case Flow Rate Oenoflow 6A-XL (Worst Case) 4A-XL 6A-XL Total Volume Time Time Time Flow Rate gal hr hr Hr GPH Merlot 15, , Pinot Noir Merlot 12, , White Zin 20, , White Zin 18, , Chardonnay 12, , Merlot 6, Cabernet 20, , White 22, , Zinfandel 11, Avg Flow 1,829 For the 8A-XL model filter, the average flow rate was calculated based on the assumption that it would filter 100% faster than the 4A-XL unit. As with the 6A-XL the cleaning times remained unchanged. Error! Reference source not found. shows the calculated filter times, as well as the average flow rate at 3,302 GPH, or 14.9 million gallons per year of capacity. 55
56 Wine Type Table 6: Oenoflow 8A-XL Expected Flow Rate Oenoflow 8A-XL (Expected Case) 4A-XL 8A-XL Total Volume Time Time Time Flow Rate gal hr hr Hr GPH Merlot 15, , Pinot Noir Merlot 12, , White Zin 20, , White Zin 18, , Chardonnay 12, , Merlot 6, , Cabernet 20, , White 22, , Zinfandel 11, , Avg Flow 3,302 Error! Reference source not found. shows the calculated worst case flow rate for the 8A-XL filter unit, which is estimated at 2,172 GPH, or 9.8 million gallons of average yearly capacity. Wine Type Table 7: Oenoflow 8A-XL Worst Case Flow Rate Oenoflow 8A-XL (Worst Case) 4A-XL 8A-XL Total Volume Time Time Time 56 Flow Rate gal hr hr Hr GPH Merlot 15, , Pinot Noir Merlot 12, , White Zin 20, , White Zin 18, , Chardonnay 12, , Merlot 6, Cabernet 20, , White 22, ,670.87
57 Zinfandel 11, Avg Flow 2,172 The total expected filtration flow rate, and yearly capacity for each filter model is shown below in Error! Reference source not found.. Table 8: Comparison of Expected Filter Capacity Filter Model Typical Worst Typical Case Worst Case GPH GPH million GPY million GPY 4A-XL 1,739 1, A-XL 2,541 1, A-XL 3,302 2, Cross-flow XL Process Loss Percentage Calculating process loss percentage was accomplished by measuring the volume of concentrate that was pumped into DM (distillation materials) tank after each filtration. Using a tape measure, the team was able to determine the level in the DM tank and multiply that by 3.5 gallons per inch. The volume of concentrate was then divided by the total batch size, and multiplied by 100 to convert it into a percentage. Error! Reference source not found. shows the calculated process loss percentages for each filter job, as well as the average process loss percentage, which was calculated to be 0.03% of the total filtered volume. 57
58 Wine Type Table 9: Oenoflow XL Process Loss Percentage Oenoflow XL Process Loss Concentrate Volume Volume Process Loss Percentage Gal gal % Merlot 15, Merlot 12, White Zin 20, White Zin 18, Chardonnay 12, Merlot 6, Cabernet 20, White 22, Zinfandel 11, Avg Process Loss % Error Analysis Throughout the testing of the Pall 4A-XL filter system, error was controlled as best as possible by carefully recording data using the same procedures each time. This helped to ensure consistency and accuracy so that data from different runs could be compared with a reasonably small degree of uncertainty. However, during several runs there were problems that occurred when the filter stopped, either due to an error message or a pause command from an operator. Stop times were recorded as best as possible, as well as the time the filter was restarted, so that the downtime could be removed from calculations. This leaves room for error because the filter was checked every 15 minutes during operation, so it was not always possible to determine the exact stop time. Because an average flow rate was determined based on the entirety of the batches filtered, the team does not believe that the difference in stop times would have a large effect on the flow rate calculation. 58
59 4.5 Cross-flow XL Capital Project Justification Because purchasing an Oenoflow XL filter unit would require spending capital project funds, Gallo required a capital project request form to be completed, which serves to demonstrate the project savings and clearly states all assumptions used to calculate yearly savings. For a capital project to be approved in 2008 Gallo budgetary constraints requires that a capital project had to provide an internal rate of return of at least 25%, because of the large capital expenditures already having taken place this year. Because none of the filter skids would be able to meet the required IRR to be considered in 2008, the team was asked to provide a draft of the project request form which could be submitted for approval sometime in the future. The initial filter skid cost estimates were provided by Pall Corporation; however they did not include the cost of retrofitting the filters to include Gallo standard pumps, valves, and software. (Mullen 2008) To estimate the cost of retrofitting the filters the base cost was multiplied by 25%. Cost to install the filters was assumed around $100,000 each, regardless of filter size. Contingency costs were calculated as an additional 10% of the total cost, including filter cost, retrofit cost, and installation. Below Error! Reference source not found. shows the total first year spending estimated for each filter skid. Table 10: Cross-flow XL Filter Skid Cost Estimates Filter Model Base Cost Retrofit Installation Contingency Total 4A-XL $215,000 $53,750 $100,000 $36,875 $405,625 6A-XL $232,000 $58,000 $100,000 $39,000 $429,000 8A-XL $257,000 $64,250 $100,000 $42,125 $463,375 For each filter model, the estimated savings was based on the assumption that filter jobs currently run on the DE pressure-leaf filter 3 would be moved to the cross-flow XL filter. This 59
60 would generate a savings in filter powder (DE), wine loss, prefilter materials, and reduced downtime. The filter jobs completed in 2007 on filter 3 were used as a basis to estimate the volume and quantity of future work orders. In 2007 filter 3 completed 209 work orders ranging in size from 5,800 gallons to 1,000,000 gallons. Although the XL filters could not reach the overall total yearly volume capacity of filter 3, a cross-flow skid could remove some of the smaller jobs from the filter, resulting in savings from raw materials and wine loss. To determine how many jobs a particular model cross-flow filter would be able to remove from filter 3, the smallest batches from the 2007 work orders were added together until the expected yearly capacity of each filter was met Oenoflow 4A-XL Project Request The estimated capital savings used to justify the purchase of a 4A-XL model cross-flow filter were based on the assumption that the skid would be able to remove 122 work orders from filter 3 in the average operating year. These 122 work orders range from 5,800 gallons to 137,000 gallons in size, and total 7.8 million gallons, the expected total yearly capacity of the 4- module filter. Each filter job is assumed to run an average of 1.5 cycles, with each cycle using approximately $100 in prefiltering materials, 1500 lbs of DE, and contributing to an average of 250 gallons of wine lost. 122 jobs 1.5 cycles job = 183 cycles (36) 183 cycles $100 prefilter materials = $18,300 (37) 183 cycles 1,500 lbs DE $0.14 per lb = $38,430 (38) 183 cycles 250 gal wine lost $1.61 gal 60 = $73,658 (39)
61 Error! Reference source not found., Error! Reference source not found., Error! Reference source not found., and Error! Reference source not found. show the calculations for total yearly savings based on the available 2007 filter data. This results in a total of $130,388 per year in material and wine savings. Also included in the financial model calculations are the added costs that would be incurred from operating an additional cross-flow filter. These costs include electricity, hot and cold soft water, nitrogen, and compressed air kw 20 r day 5 days wk wks 50 yr kw = 97,500 yr (40) 97,500 kw yr $ per kw = $6,689 (41) Error! Reference source not found. and Error! Reference source not found. show the total cost of electricity on a yearly basis, which was calculated to cost an average of $ per kwh. (Avery 2008) 150 gal rinse 3 rinses day 5 days wk wks 50 yr gal = 112,500 yr (42) 112,500 gal yr $ gal = $189 (43) Error! Reference source not found. and Error! Reference source not found. show the calculated costs associated with hot soft water, assuming 3 hot rinse cycles are carried out per day on average. The value of $1.68 per 1000 gallons of hot soft water was estimated at double the cost of cold soft water, because no recent data was available. 150 gal rinse 3 rinses day 5 days wk wks 50 yr gal = 112,500 yr (44) 61
62 112,500 gal yr $ gal = $95 (45) Error! Reference source not found. and Error! Reference source not found. demonstrate the calculated estimate costs for the usage of cold soft water, which is priced at $0.84 per 1000 gallons. (French 2008) Again 3 cold rinses per day were assumed, which, depending on batch size, is a reasonably accurate estimation. 5 ft 3 N min 2 60 min r 20 r day 5 days wk 50 wks yr = 1,500,000 ft 3 yr (46) 1,500,000 ft 3 $4.18 = $6,270 (47) yr 1000ft 3 Error! Reference source not found. and Error! Reference source not found. show the calculated cost estimate for the additional nitrogen that would be utilized by the filter. The cellar is supplied with a significant amount of N 2 by the Gallo glass manufacturing plant, however additional nitrogen is purchased for $4.18 per 1000 ft 3. Here we have assumed that all additional nitrogen used by the XL filter will need to be purchased, however, this may not always be the case. Therefore although the expected cost for nitrogen is high, it is most likely an overestimation. There was some consideration for inerting the wine storage tanks with Nitrogen, which would require future on-site generation capability. 0.5 ft 3 min min 60 r 20 r day 5 days wk 50 wks yr = 150,000 ft 3 yr (48) 150,000 ft 3 $0.023 = $3,450 (49) yr 1ft 3 The expected costs for compressed air for use opening and closing the pneumatic valves on the cross-flow XL was calculated using Error! Reference source not found. and Error! 62
63 Reference source not found.. The cost for compressed air was provided at $0.023 per cubic foot. (Avery 2008) Along with utilities, the cost of additional cleaning chemicals was also included. Chemicals using in cleaning routines include; caustic (NaOH), citric acid and hydrogen peroxide. For each CIP procedure it was assumed that 150 gallons of water would be used to dilute the cleaning solutions. Pall recommends using a 1.5% strength NaOH solution, a 1% strength citric acid solution, and a 1% strength H 2 O 2 solution. 150 gal H 2 O gal NaOH gal H 2 O = 2.25 gal NaOH (50) 2.25 gal NaOH 1 gal caustic 0.5 gal NaOH = 4.5 gal caustic per CIP (51) 4.5 gal 2 CIP wk 50 CIP wk yr = 450 gal yr (52) 450 gal $1.07 = $482 (53) yr gal Error! Reference source not found. and Error! Reference source not found. demonstrate that 4.5 gallons of 50% NaOH solution is required per clean in place cycle. Assuming a twice weekly cleaning schedule, Error! Reference source not found. and Error! Reference source not found. calculate that 450 gallons of caustic solution will be consumed annually, costing an additional $482. Chemical pricing data was taken from current cellar material invoices. 150 gal H 2 O 0.01 gal Citric Acid gal H 2 O = 1.5 gal Citric Acid (54) 63
64 1.5 gal Citric Acid 1 gal Citric 0.5 gal Citric Acid = 3 gal Citric per CIP (55) 3 gal 2 CIP wk 50 CIP wk yr = 300 gal yr (56) 300 gal $3.41 = $1,023 (57) yr gal Using Error! Reference source not found. and Error! Reference source not found. we calculated that each CIP would require 3 gallons of 50% strength citric acid. Error! Reference source not found. and Error! Reference source not found. give the annual cost of citric acid at $1,023 assuming a cost of $3.41 per gallon. (French 2008) 150 gal H 2 O 0.01 gal H 2O 2 gal H 2 O = 1.5 gal H 2 O 2 (58) 1.5 gal H 2 O 2 1 gal Triax 0.35 H 2 O 2 = 4.3 gal Triax per CIP (59) 4.3 gal 2 CIP wk 50 CIP wk yr = 429 gal yr (60) 429 gal $12.56 = $5,383 (61) yr gal Using Error! Reference source not found. and Error! Reference source not found. we calculated that each CIP would require 4.3 gallons of 35% hydrogen peroxide solution. Error! Reference source not found. and Error! Reference source not found. estimate the yearly cost at $5,383 using the current chemical prices from the cellar material inventory. The total cost for yearly utilities is estimated at $16,692, and chemicals are expected to cost another $6,887 annually. The total estimated operating cost per year is $23,
65 Error! Reference source not found. below summarizes the project benefits and costs for the 4A-XL filter purchase on a yearly basis. 65
66 Table 11: 4A-XL Summary of Benefits and Costs Summary Table (4A-XL) Prefilter Savings $18, DE Savings $38, Wine Loss Savings $73, Total Savings $130, Electricity Cost ($6,688.50) Hot Soft Water Cost ($189.00) Cold Soft Water Cost ($94.50) Nitrogen Cost ($6,270.00) Compressed Air Cost ($3,450.00) Total Utilities Cost ($16,692.00) Caustic Cost ($481.50) Citric Acid Cost ($1,023.00) Hydrogen Peroxide Cost ($5,382.86) Total Chemical Cost ($6,887.36) Total Operating Cost ($23,579.36) Please refer to Appendix B: 4A-XL Project Request Form for the completed draft of the project request form Oenoflow 6A-XL Project Request The capital savings used to justify the purchase of a 6A-XL filter were similar to the assumptions used for the 4A-XL model; however more savings were expected because of the larger yearly capacity. Both the 4A-XL and 6A-XL use the same tank sizes, therefore rinse volume is assumed to be identical between the two models. This resulted in no extra costs incurred through additional use of nitrogen, hot or cold soft water, compressed air, or chemicals. Because the 6A-XL has an average yearly capacity of 11.4 million gallons of wine, it would require 145 filter jobs from the 2007 filter 3 data to be running at full capacity. Error! 66
67 Reference source not found. shows that this would result in an average of cycles on filter jobs 1.5 cycles job = cycles (62) cycles $100 prefilter materials = $21,750 (63) cycles 1,500 lbs DE $0.14 per lb = $45,675 (64) cycles 250 gal wine lost $1.61 gal = $87,544 (65) Error! Reference source not found., Error! Reference source not found. and Error! Reference source not found. calculate the total expected yearly savings at $154,969 for the 6A- XL unit. Below, Error! Reference source not found. summarizes the cost and benefits of a 6A-XL filter. Because the utilities cost are identical to the 4A-XL filter, the equations have been omitted. Table 12: 6A-XL Summary of Benefits and Costs Summary Table (6A-XL) Prefilter Savings $21, DE Savings $45, Wine Loss Savings $87, Total Savings $154, Electricity Cost ($6,688.50) Hot Soft Water Cost ($189.00) Cold Soft Water Cost ($94.50) Nitrogen Cost ($6,270.00) Compressed Air Cost ($3,450.00) Total Utilities Cost ($16,692.00) Caustic Cost ($481.50) Citric Acid Cost ($1,023.00) Hydrogen Peroxide Cost ($5,382.86) 67
68 Total Chemical Cost ($6,887.36) Total Operating Cost ($23,579.36) Please refer to Appendix C: 6A-XL Project Request Form for the completed draft of the project request form Oenoflow 8A-XL Project Request Calculating the total yearly savings for the 8A-XL model filter was similar to the previous modes, however because it was calculated to reach a 14.9 million gallon yearly capacity, it was able to compensate for 163 of the filter jobs from industrial filter 3. Error! Reference source not found. shows that cycles would be required in completing these work orders. 163 jobs 1.5 cycles job = cycles (66) cycles $100 prefilter materials = $24,450 (67) cycles 1,500 lbs DE $0.14 per lb = $51,345 (68) cycles 250 gal wine lost $1.61 gal = $98,411 (69) Error! Reference source not found., Error! Reference source not found. and Error! Reference source not found. calculate the total expected project benefit to be $174,206 for the 8A-XL skid. The capital project request for the 8A-XL filter was slightly different from 4A-XL and 6A-XL models because of the differences in tank volume between the units. Although the 4A- 68
69 XL and 6A-XL share the same tank dimensions, the 8A-XL is slightly larger, and therefore uses 175 gallons of water per rinse or cleaning cycle. This difference, although relatively small, had to be accounted for, as it affected several utilities and all cleaning chemical costs. 175 gal rinse 3 rinses day 5 days wk wks 50 yr gal = 131,250 yr (70) 131,250 gal yr $ gal = $221 (71) Error! Reference source not found. and Error! Reference source not found. calculate the cost of hot soft water at $221 per year, compared to $189 annually for the 4A-XL model. 175 gal rinse 3 rinses day 5 days wk wks 50 yr gal = 131,250 yr (72) 131,250 gal yr $ gal = $110 (73) Error! Reference source not found. and Error! Reference source not found. calculate the expected cost of cold soft water at $110 per year, compared to $95 annually with the 4A-XL filter. 175 gal H 2 O gal NaOH gal H 2 O = gal NaOH (74) gal NaOH 1 gal caustic 0.5 gal NaOH = 5.25 gal caustic per CIP (75) 5.25 gal 2 CIP wk gal 50 = 525 CIP wk yr yr (76) 525 gal $1.07 = $562 (77) yr gal 69
70 Error! Reference source not found. and Error! Reference source not found. calculate that each CIP will require 5.25 gallons of 50% NaOH, compared with 4.5 gallons for the smaller units. Error! Reference source not found. and Error! Reference source not found. determine the annual cost of caustic solution at $562 per year, as opposed to $482 for the 4A-XL. 175 gal H 2 O 0.01 gal Citric Acid gal H 2 O = 1.75 gal Citric Acid (78) 1.75 gal Citric Acid 1 gal Citric 0.5 gal Citric Acid = 3.5 gal Citric per CIP (79) 3.5 gal 2 CIP wk 50 CIP wk yr = 350 gal yr (80) 350 gal $3.41 = $1,194 (81) yr gal Using Error! Reference source not found. and Error! Reference source not found. it was determined that the larger filter would require 3.5 gallons of citric acid per cleaning cycle, as compared to 3.0 for the smaller units. Error! Reference source not found. and Error! Reference source not found. calculate the annual cost for citric acid at $1,194, as compared to $1, gal H 2 O 0.01 gal H 2O 2 gal H 2 O = 1.75 gal H 2 O 2 (82) 1.75 gal H 2 O 2 1 gal Triax 0.35 H 2 O 2 = 5.0 gal Triax per CIP (83) 5.0 gal 2 CIP wk 50 CIP wk yr = 500 gal yr (84) 500 gal $12.56 = $6,280 (85) yr gal 70
71 Error! Reference source not found. and Error! Reference source not found. determine that 5.0 gallons of hydrogen peroxide solution would be required per cleaning cycle on the 8A-XL filter, compared with 4.3 gallons. Error! Reference source not found. and Error! Reference source not found. calculate the annual cost of hydrogen peroxide at $6,280 for the larger filter, compared with $5,383 with the smaller units. Below, Error! Reference source not found. shows the expected costs and benefits for the 8A-XL model filter. Overall the 8A-XL is expected to cost $1,196 more per year to operate, however the expected return would compensate for the additional operating costs. 71
72 Table 13: 8A-XL Summary of Benefits and Costs Summary Table (8A-XL) Prefilter Savings $24, DE Savings $51, Wine Loss Savings $98, Total Savings $174, Electricity Cost ($6,688.50) Hot Soft Water Cost ($220.50) Cold Soft Water Cost ($110.25) Nitrogen Cost ($6,270.00) Compressed Air Cost ($3,450.00) Total Utilities Cost ($16,739.25) Caustic Cost ($561.75) Citric Acid Cost ($1,193.50) Hydrogen Peroxide Cost ($6,280.00) Total Chemical Cost ($8,035.25) Total Operating Cost ($24,774.50) Please refer to Appendix D: 8A-XL Project Request Form for a completed draft of the project request. 4.6 Production Dashboard During the testing of the 4A-XL model filter, the MQP team was also working to determine how to best develop the production dashboard for the current cellar operations. Running the XL filter provided the team with a valuable first-hand experience in operating crossflow equipment, which provided an invaluable perspective when designing what would become the central operating point for all cellar cross-flow units Proficy Historian Excel Add-In The exercise in producing a production dashboard for use by shift managers and filter operators began with bench marking the Oenoflow XL 4-module system. Status indicators deemed necessary for operation were recorded and a list of necessary tags was generated. The list of tags may be found in Appendix E: Tag List & Descriptions where tag names and 72

73 descriptions highlighted in blue are, as of yet, not currently programmed for collection but have been recommended and will need to be added. Once tag names and descriptions are programmed within each filter s PLC and are subsequently programmed to be collected by Proficy Historian, data analysis can begin with the Proficy Historian Microsoft Excel Add-in. The basic order of operations for collecting and analyzing data within Microsoft Excel is to, first, search for applicable tags on the server, add them into the worksheet, and begin querying data. The first step in analyzing data with Microsoft Excel is to search for tags. The Proficy Historian Add-in inserts a menu within the top menu bar of Microsoft Excel that includes each function of the add-in in a drop-down menu as shown in Figure 10. next page. Figure 10: Search Tags Clicking the Search Tags item brings up the Search Tags Dialog box in Figure 11 on the 73

74 Figure 11: Search Tags Dialog Box The selected tags within the right-hand-side of the dialog box will yield the flow rates collected from Cross Flow Filter #21. Notice how in the Output Display section, the Tagname and Description items are highlighted. Table 14 shows the output of the selected items in the selected Output Range. Table 14: Search Tags Output Once the desired tags have been found, the querying of data from a chosen tag will allow for process monitoring and reporting. The Historian add-in is used to query several types of data from the Historian server. 74

75 To begin querying data, one must select a Tag Name to gather data from and a time frame for which to monitor as in Table 15. For purposes of this exercise, Cellar Cross Flow Filter #21 Filtrate at Filters Flow was chosen and monitored for a period of 24 hours beginning on February 21. Table 15: Data Query Parameters There are several different modes with which the Historian Add-in can gather and display relevant filter information. One of the most useful, for an instantaneous look at the process, is the Current Value Query. Figure 12: Current Values Query Selected from the Historian drop-down menu as shown in Figure 12, the Query Current Values item will output the most recent collected data point for a given tag name. The dialog box for entering such a query is shown in Figure
 or ignored (Bad). The output for the dialog in Figure 13 is shown in Figure 14.")
76 Figure 13: Current Values Query Dialog Box As shown in the Output Display portion of Figure 163, the current values to be displayed will be Tag Name, Timestamp, Value and Quality. The Quality parameter is always a useful tool to determine whether a given data value may be trusted (Good) or ignored (Bad). The output for the dialog in Figure 13 is shown in Figure 14. Figure 14: Current Values Query Output The trending capabilities of the Historian Add-in and, ultimately, the production dashboard rely heavily on collecting and recording data from given sources as time progresses. A Raw Data Query will output all data collected for a given tag within a given time period. To query raw data, one must choose the Query Raw Data item under the Historian drop-down menu as in Figure


77 Figure 15: Raw Data Query Within the Raw Data dialog box, one may select the tag name, time frame and desired output for the given query, as shown in Figure 16. The desired output as in most data querying cases will be Tag Name, Timestamp, Value and Quality. Figure 16: Raw Data Query Dialog Box Partial output for the raw data query given above is shown in Table


78 Table 16: Raw Data Query Output Raw data queries typically return vast quantities of data that are important to log for record keeping and provide the data necessary for real-time trending. The large amounts of data, however, prove daunting when quickly in search of a chosen metric. As shown in Table 16, with data for the chosen tag collected every 5 seconds, the amount of data for a 24-hour period can quickly become overwhelming and excessive. The Query Calculated Data item under the Historian drop-down menu provides a much clearer and transparent view of process events. Figure 17: Calculated Data Query Selecting the Query Calculated Data item brings up the Calculated Data Query dialog box in Figure

79 Figure 18: Calculated Data Query Dialog Box The Calculated Data Query function within the Historian Add-in can provide a bevy of tools for analyzing current process trends over a selected period of time. Several functions within the dialog box include measuring the average value over a given interval, the maximum/minimum value and standard deviations. Selecting to display the Average hourly flow data for a given 23-hour period with 1 hour intervals will output a display similar to Table

80 Table 17: Calculated Data Query Output As shown with the data queries the Historian Add-in is a powerful utility and analysis of Historian-collected data can be completed within Microsoft Excel. Users familiar with the trending and graphing capabilities within the program can, after manually adding tags and querying data, graph and display the desired process metrics. A production dashboard built upon the Historian add-in, provides the same functionality but once set up, eliminates the need for repeated manual data queries Production Dashboard Concept Design The design of the production dashboard was carried out within a Microsoft Excel spreadsheet. The concept design will serve as a guide throughout programming and development of the fully functional production dashboard interface. Data collected for the production dashboard display is supplied through a specially configured spreadsheet using the Microsoft Excel Historian add-in. 80

81 Human-Machine Interface Through the cooperation and effort of filter operators, the HMI of each filter will serve to supply Proficy Historian with data about the current process job. Operators will be required, at the start of each job, to fill in several input fields within the HMI. Such an HMI interface would be constructed as seen in Figure 19. Figure 19: Operator Input Form Operators would be required to enter the necessary process data into the Input Fields whenever required and the information would then be exported as the respective tags listed within Figure 19. The Operator Name Input Field will need to have the capability to be changed mid-production in order to accommodate shift changes and to facilitate accurate accountability records. In the same vein, the HMI will be programmed to prompt the operator via pop-up input screen, to select an applicable downtime reason code from a list. Such a pop-up would be programmed, albeit within necessary HMI constraints and requirements, as shown in Figure 20. Figure 20: Operator Input Downtime Pop-up The list of 12 downtime reason codes that an operator may choose from within the HMI is shown in Appendix F: Filter Status Indicators. In order to maximize accuracy, downtime logs will also be updated from the filter s PLC (as FT24_Downtime_Rsn_Cd_2) for downtime events inherent with production such as back-pulsing and cycle interim. Processing times will also be logged via tag (FT24_Active_Program) in order for analysis and comparison. 81

82 Production Dashboard Concept The production dashboard will be the interface accessible through Proficy Portal to anyone with the necessary network credentials. It brings together all relevant data collected by Proficy Historian and displays it in a clear, real-time representation of all process conditions on the cellar floor. As such, the design for such an interface must include all aspects of a process that one would need to view remotely and understand the current state. Figure 21 shows a conceptual design of the dashboard. Figure 21: Production Dashboard Concept Diagram All important process variables for each filter will be displayed here in a large table. The lower portion of the screen will provide a single-glance view of the status of each filter along with flow rate, and estimated time to completion. Links along the lower left side will lead to screens for trends and analysis. Tag names and resources have been included under Source titles in order to demonstrate the source location of the relevant data. Though rough and far-fromconcrete, the concept diagram closely resembles a sample, fully functional dashboard that can be seen in Figure 22 82
83 Production Dashboard Completion Though development of the full production dashboard is beyond the scope of this project, the design described has been an exercise in planning the necessary components in the completion of such a project. Adjustments to the design can and will be made in the process of creating the final product. Following along with the design, the next step in producing the functional dashboard will be the programming responsibilities. Programmers, given enough input and direction should be able to transform the concept diagram in Figure 21 to a working interface such as the example in Figure

84 Figure 22: Sample Centrifuge Production Dashboard Real-time tag data is pulled, processed and collected in one clean, clear display through Proficy Portal. Figure 22 shows the finished product of a production dashboard for centrifuge operations at the Gallo Livingston location. Given full functionality, the dashboard design for the Modesto cellar will behave similarly. The Microsoft Excel Historian Add-in will provide the basic calculations for displaying the required trends and summaries. Trend Screen buttons will bring the user to an interface where graphs of average flows, pressures and outputs can be viewed for given time frames. Equipment Status Screen buttons will bring the user to equipment status summaries such as Figure

85 Figure 23: Sample Equipment Status Summary It is within these trend screens and status summaries that the full value of the production dashboard will be realized. Downtime analysis and efficiency reporting will be based on these screens and will be provided the most accurate, up-to-date data possible. 4.7 Sensitivity Analysis Tool As of the writing of this report, a sensitivity analysis on the addition of an Oenoflow XL system into Cellar Operations was incomplete. An unforeseeable problem with the modeling routines of AIMMS and the difficulty of remedying such an involved snag made the timely collection of data through Operations Research impossible. The significance of such critical data 85
86 and the late hour at which the problem came to pass has, consequently, left proving assumptions and forming any conclusions a remote possibility. It had been assumed that just as the ability of the tank farm to handle the added capacity would suffer, the cellar s filter efficiencies would, almost without a doubt, increase with the additional Oenoflow XL unit. Unfortunately, without data to apply assumptions and form conclusions, there were no results to report for sensitivity analysis. Gallo s plans for completing a sensitivity analysis were being worked out as of this writing. Fixing the programming bug appeared to be a daunting task and would continue to prove a formidable obstacle in obtaining any meaningful results. After scheduling and allotting the required amount of time to address the programming issue, the Operations Research department will continue where the previous attempt failed and obtain the results for use at a future date. 86
87 5.0 Conclusions and Recommendations After working with many different aspects of the Modesto Cellar cross-flow filtering operation the team made several recommendations to the staff. With the goal of continuing the expansion of cross-flow filtration, one of the major recommendations was to gather more data to justify the purchase of a cross-flow XL filter. 5.1 Justifying the Cost of the Cross-flow XL Filter Although having a smaller cross-flow XL unit on site in the Modesto Cellar would make filtering smaller batches of wine more efficient, it was unable to be financially justified due in part to the high internal rate of return necessary to approve the project in To help approve the purchase of the smaller filter skid in the future, the MQP team recommends that more data be collected on the wine loss issues associated with DE filtration. In particular, the wine losses associated with plugging finish filters prior to bottling was unable to be quantitatively expressed with enough certainty to be included in the financial assumptions. However, if plugging issues following DE filtration continue to persist it may prove to be a valuable part of justifying the purchase of at least one additional cross-flow filter to help remove DE filtration completely. Along with gathering more data on wine loss due to bottle polish filtration plugging, the team recommends further studying the values of wine lost in holdup of filter 3, to help create a more accurate capital project justification. This would include studying how much wine is lost in the filter media, as well as the volume of wine unable to be forced through the filter itself. Because of time constraints working with the Oenoflow XL filter, the team was not able to devote the necessary time to completely studying wine loss on filter 3, so widely accepted estimates were used. 87
88 5.2 Production Dashboard The production dashboard will prove, in the long run, to be a worthwhile investment. As demand for smaller batches of wine continues to increase in the future and thereby increase the need for critical improvements, an increase in the transparency and distribution of process data, ultimately, facilitates faster communication, enables quicker adjustments and makes production more efficient. Holding operators more accountable for process operations can only lead to better practices. It is recommended that the development of the production dashboard proceed as scheduled and completed as soon as possible. While programming within the PLC, it may be worthwhile to attempt to collect every possible tag, even those not called for in the design, in order to facilitate possible future expansion. Collecting as much data as possible yields more accurate expectations and better prepares managers for informed decisions. 5.3 Sensitivity Analysis The calculation of sensitivity analysis did not happen as planned and, therefore, there is little to conclude. Without proper simulation, it can only be assumed that the additional Oenoflow XL would, in fact, increase cellar efficiency and facilitate production. It is recommended that the simulation using AIMMS be completed as time allows. Running the simulation with the addition of an Oenoflow XL 4-module, 6-module and 8-module system separately and in different combinations would enable the best decision on the proper action to take in the future. It would also be worthwhile to, within the model, attempt to completely replace the DE filters with new, efficient Oenoflow XLs. Though it may just be a want and not a must, thorough testing of the simulation with different combinations of new filters is one efficient method to ensure the best course of action in the future. 88
89 Works Cited Alar Engineering Corp. Applying Diatomaceous Earth Filters (accessed November 14, 2007). Amerine, Maynard A., and Vernon L. Singleton. Wine An Introduction. 2nd Edition. London: University of California Press, Ltd., Avery, Roger, interview by Kyle Flynn. Gallo Utilities Costs (February 8, 2008). Bhardwaj, Vipin. Diatomaceous Earth Filtration for Drinking Water. Tech Brief, Morgantown: National Drinking Water Clearinghouse, Cussler, E. L. Diffusion - Mass Transfer in Fluid Systems. New York: Cambridge University Press, French, Brian, interview by Kyle Flynn. Gallo Utilities Cost (February 6, 2008). HoneyCreek Vineyard and Orchard (accessed November 3, 2007). Kollmeyer, Mark, interview by Kyle Flynn and Corey Binette. Cross-flow XL Purchase Meeting (February 13, 2008). MacNeil, Karen. The Wine Bible. New York: Workman Publishing Company, Inc., Maiorano, Ashley E, and Shawana E Martinelli. The In Line Injection of Bentonite Slurry to Pall Cross Flow Filter Systems. MQP Report, Worcester: Worcester Polyechnic Institute, Mullen, Steve, interview by Kyle Flynn. XL Filter Skid Specifics (January 24, 2008). Pall Corporation. Pall Food and Beverage (accessed December 11, 2007). Porter, M. C. Handbook of Industrial Membrane Technology. Westwood: Noyes Publications, R. Ben Amar, B. B. Gupta, M. Y. Jaffrin. "Apple Juice Clairification using Mineral Membranes: Fouling Control by Backwashing and Pulsating Flow." Journal of Food Science, November 1990: Ramirez, Rene. Cross-Flow Throughput Improvement: Analyze Tollgate, (February 1, 2007) Robert H. Perry, Don W. Green. Perry's Chemical Engineers' Handbook. New York: McGraw- Hill, Rousseau, Ronald W. Handbook of Separation Process Technology. New York: John Wiley and Sons,
90 Sutcliffe, Serena. The Art of the Wine Maker. London: QED Publishing Limited, Tullio, Paolo. Filtering Wine (accessed November 15, 2007). Turton, Richard, Richard C. Bailie, Wallace B. Whiting, and Joseph A. Shaewitz. Analysis, Synthesis, and Design of Chemical Processes. 2nd Edition. Upper Saddle River, New Jersey: Prentice Hall PTR, Vorne Industries, Inc. Fast Guide to OEE (accessed February 19, 2008). Wine Communications Group. Crossflow Filtration Systems (accessed November 14, 2007). 90
91 Appendix A: Batch Data Sheet Operator: Winery: OenoFlow System: Modules/Filter Area: What is the volume of wine to be filtered? What type of wine? Has the wine been fined? (e.g. bentonite, PVPP, carbon, gelatin) if yes, with what? (product and conc.) Has the wine been pre-treated? (racked, barrel aged, rough filtered, etc.) Is this wine typical of its kind? In not, why? (e.g. high in bret, ML bacteria, etc.) Time Feed Pressure Retentate Pressure Temperature Filtrate Flow rate Total Filtrate Volume (Min) (PSI) (PSI) ( F) (GPM) (Gal) Comments Final Concentrate Volume: % Solids Final Concentrate: 91
92 Appendix B: 4A-XL Project Request Form
93 93
94 94
95 95

96 Appendix C: 6A-XL Project Request Form 96
97 97
98 98
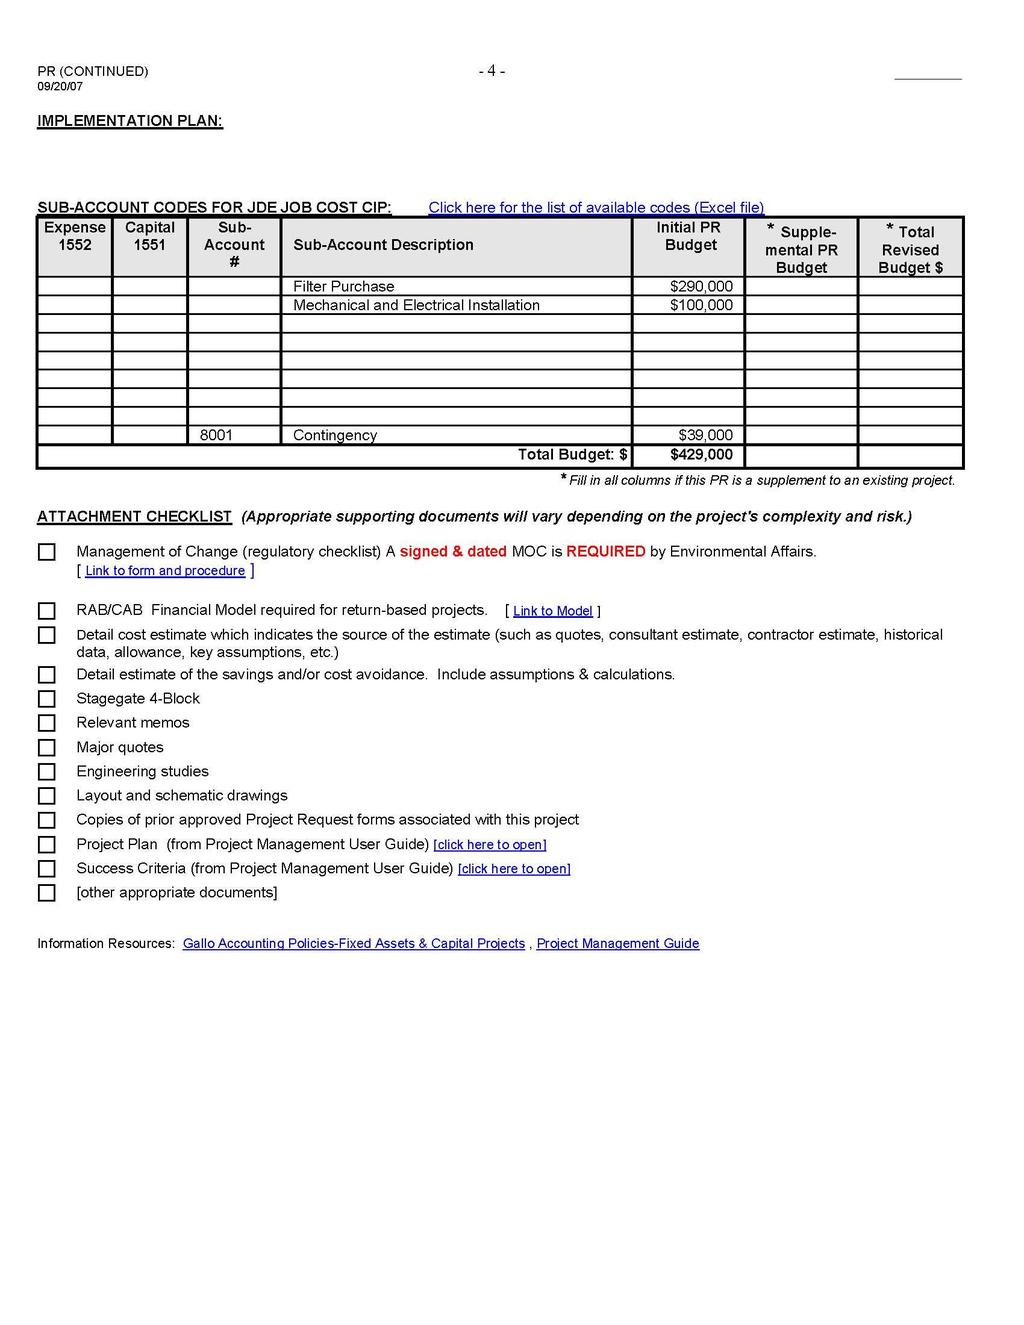
99 99

100 Appendix D: 8A-XL Project Request Form 100
2009 Australian & New Zealand Winemakers P/L
 2009 Australian & New Zealand Winemakers P/L TECHNICAL ARTICLE Seital Centrifuge: Supreme Clarification For Today s Environment The Seital range of centrifuges represents over 20 years of development and
WineEng - NZ Winery Resources Future Challenges. The National Conference & Exhibition of the WEA
 WineEng - NZ 2018 Winery Resources Future Challenges The National Conference & Exhibition of the WEA Striving to be DE Free in the Winery PALL Corporation 2011 WEA 2018 Ragan Wood Systems Sales Specialist
Wine Preparation. Nate Starbard Gusmer Enterprises Davison Winery Supplies August, 2017
 Wine Preparation Nate Starbard Gusmer Enterprises Davison Winery Supplies August, 2017 Contents Intro Clarification methods Sheets, Lenticulars, Crossflow Final influences of filterability Filterability
JUICE EXTRACTION AND FILTRATION JUICE EXTRACTION METHOD AND EQUIPMENT
 College of Agricultural Engineering and Technology Dept. of Agricultural Processing and Food Engineering Course : Dairy and Food Engineering Chapter 11 JUICE EXTRACTION AND FILTRATION (Juice extraction
EFFECT OF TOMATO GENETIC VARIATION ON LYE PEELING EFFICACY TOMATO SOLUTIONS JIM AND ADAM DICK SUMMARY
 EFFECT OF TOMATO GENETIC VARIATION ON LYE PEELING EFFICACY TOMATO SOLUTIONS JIM AND ADAM DICK 2013 SUMMARY Several breeding lines and hybrids were peeled in an 18% lye solution using an exposure time of
ON-SITE TECHNICAL INFORMATION
 WINE BEFORE VA REMOVAL HIGH PRESSURE DIAPHRAGM PUMP NANOFILTRATION MEMBRANES ACID ABSORBTION COLUMN CONCENTRATED WINE STREAM WINE AFTER VA REMOVAL DE-ACIDIFIED PERMEATE STREAM RECOMBINED WINE WITH 30%
AWRI Refrigeration Demand Calculator
 AWRI Refrigeration Demand Calculator Resources and expertise are readily available to wine producers to manage efficient refrigeration supply and plant capacity. However, efficient management of winery
The Economics Surrounding Premium Wine Production
 The Economics Surrounding Premium Wine Production by Trent Ball 1 and Ray Folwell 2 1 Vineyard and Winery Technology Program, Chair, Yakima Valley Community College, and Partner, 2 Agri-Business Consultants
The Pall Oenofine XL System. Single Step Protein Stabilization and Clarification Eric Bosch Winery Engineers Association June 2012
 The Pall Oenofine XL System Single Step Protein Stabilization and Clarification Eric Bosch Winery Engineers Association June 2012 Presentation Content What is the Oenofine XL System Traditional Protein
2017 PWGT Spring Workshop. Christian BUTZKE Professor of Enology Purdue Wine Grape Team
 2017 PWGT Spring Workshop Christian BUTZKE Professor of Enology Purdue Wine Grape Team Filtrosophy Filtration Systems Pad/Cartridge/DE Membrane Cross Flow Particle Filtration Reverse Osmosis Filterability
(a) Dead-end/conventional filtration fluid flow perpendicular to the filter medium. (b) Crossflow filtration fluid flow parallel to the filter
 Dead-end/conventional filtration fluid flow perpendicular to the filter medium. (b) Crossflow filtration fluid flow parallel to the filter") FILTRATION (a) Dead-end/conventional filtration fluid flow perpendicular to the filter medium. (b) Crossflow filtration fluid flow parallel to the filter medium. Filtration Generally carry out in the early
FILTRATION (a) Dead-end/conventional filtration fluid flow perpendicular to the filter medium. (b) Crossflow filtration fluid flow parallel to the filter medium. Filtration Generally carry out in the early
Acta Chimica and Pharmaceutica Indica
 Acta Chimica and Pharmaceutica Indica Research Vol 7 Issue 2 Oxygen Removal from the White Wine in Winery VladimirBales *, DominikFurman, Pavel Timar and Milos Sevcik 2 Faculty of Chemical and Food Technology,
The Premium Benefits of Steam Infusion UHT Treatment
 EDITORIAL October 2012 The Premium Benefits of Steam Infusion UHT Treatment UHT, or Ultra High Temperature, treatment uses high temperature for a short time to kill micro-organisms in a food or beverage
The delicate art of wine making. Alfa Laval Foodec decanter centrifuges in the wine industry
 The delicate art of wine making Alfa Laval Foodec decanter centrifuges in the wine industry Wine making is both a huge growth industry and a delicate, specialist art. It takes versatility to provide technology
Water Technologies & Solutions. wine processing. 21 st century membrane technology
 Water Technologies & Solutions wine processing 21 st century membrane technology the nature of winemaking a combination of art and science The appreciation of fine wines traditionally brings people together.
DR. RENEE THRELFALL RESEARCH SCIENTIST INSTITUTE OF FOOD SCIENCE & ENGINEERING UNIVERSITY OF ARKANSAS
 Challenges in Muscadine Juice and Wine Production DR. RENEE THRELFALL RESEARCH SCIENTIST INSTITUTE OF FOOD SCIENCE & ENGINEERING UNIVERSITY OF ARKANSAS RTHRELF@UARK.EDU Muscadine juice and wine production
INTRODUCTION TO CUSTOM FABRICATED STRAINERS
 INTRODUCTION TO CUSTOM FABRICATED STRAINERS Nothing Too Big, Too Small or Too Special When unwanted solid material has to be removed from flowing fluids in order to protect equipment, a HAYWARD Strainer
NZQA registered unit standard version 1 Page 1 of 5
 Page 1 of 5 Title Demonstrate knowledge of equipment, gasses, and chemicals used in a commercial wine cellar operation Level 3 Credits 8 Purpose This unit standard covers introductory level knowledge for
Micro-brewing learning and training program
 Micro-brewing learning and training program (LdV Beer School) Program izobraževanja v mikro-pivovarstvu (projektno gradivo) Beer styles Raw materials Brewhouse technology - mashing and mashing in - lautering
Dr. Christian E. BUTZKE Enology Professor PURDUE UNIVERSITY
 Dr. Christian E. BUTZKE Enology Professor PURDUE UNIVERSITY butzke@purdue.edu (765) 49-46500 www.butzke.com Filtrosophy Filtration Systems Pad/Cartridge/DE Membrane Cross Flow Particle Filtration Reverse
Dr. Christian E. BUTZKE Enology Professor Indiana Wine Grape Council. (765) FS Room
 FS Room") Dr. Christian E. BUTZKE Enology Professor Indiana Wine Grape Council butzke@purdue.edu (765) 49-46500 FS Room 1261 www.butzke.com Filtrosophy Filtration Systems Pad/DE Membrane Cross Flow Particle Filtration
Dr. Christian E. BUTZKE Enology Professor Indiana Wine Grape Council butzke@purdue.edu (765) 49-46500 FS Room 1261 www.butzke.com Filtrosophy Filtration Systems Pad/DE Membrane Cross Flow Particle Filtration
MBA 503 Final Project Guidelines and Rubric
 MBA 503 Final Project Guidelines and Rubric Overview There are two summative assessments for this course. For your first assessment, you will be objectively assessed by your completion of a series of MyAccountingLab
For Beer with Character
 Yeast technology For Beer with Character Yeast technology Fresh yeast for Beer with Character The raw material yeast plays a crucial role in breweries. A wide range of flavors can be produced in beer using
Environmental Monitoring for Optimized Production in Wineries
 Environmental Monitoring for Optimized Production in Wineries Mounzer SALEH Applications Engineer Agenda The Winemaking Process What Makes a great a Wine? Main challenges and constraints Using Technology
Product Consistency Comparison Study: Continuous Mixing & Batch Mixing
 July 2015 Product Consistency Comparison Study: Continuous Mixing & Batch Mixing By: Jim G. Warren Vice President, Exact Mixing Baked snack production lines require mixing systems that can match the throughput
Napa County Planning Commission Board Agenda Letter
 Agenda Date: 7/1/2015 Agenda Placement: 10A Continued From: May 20, 2015 Napa County Planning Commission Board Agenda Letter TO: FROM: Napa County Planning Commission John McDowell for David Morrison -
CONCENTRATION OF AROMA AND VITAMIN RICH FRUIT JUICES BY COMPLEX MEMBRANE TECHNOLOGY
 CONCENTRATION OF AROMA AND VITAMIN RICH FRUIT JUICES BY COMPLEX MEMBRANE TECHNOLOGY Gyula VATAI Corvinus University of Budapest, Department of Food Engineering, H-1118 Menesi ut 44., Budapest, Phone: (36)1-482-6232,
Innovations for a better world. Ingredient Handling For bakeries and other food processing facilities
 Innovations for a better world. Ingredient Handling For bakeries and other food processing facilities Ingredient Handling For bakeries and other food processing facilities From grain to bread Ingredient
GEA Wine Decanter. Make every grape count
 GEA Wine Decanter Make every grape count 3 Give your winery a boost Make every harvested grape count by adding a GEA Wine Decanter this season. You'll see the payback year after year. More wine produced
Introduction to Measurement and Error Analysis: Measuring the Density of a Solution
 Introduction to Measurement and Error Analysis: Measuring the Density of a Solution Introduction: Most of us are familiar with the refreshing soft drink Coca-Cola, commonly known as Coke. The formula for
Brewhouse technology
 Brewhouse technology For Beer with Character Brewhouse technology The best quality wort for the best quality beer The brewhouse is the heart of every brewery and therefore crucial to the quality of the
WINE; OTHER ALCOHOLIC BEVERAGES; PREPARATION THEREOF (beer
 CPC - C12G - 2017.08 C12G WINE; OTHER ALCOHOLIC BEVERAGES; PREPARATION THEREOF (beer C12C) Relationships with other classification places C12H deals only with pasteurisation, sterilisation, preservation,
POSITION DESCRIPTION
 POSITION DESCRIPTION Position Title: Cellar Hand Incumbent: Date: Location: Marlborough Reports to: Senior Cellar Supervisor SECTION 1 POSITION SUMMARY To assist the winemaking and cellar teams in the
Salem Cider Convention
 Tim Larsen 277 S Ward Ave East Wenatchee, WA 98802 Phone: 509.885.2734 E-Mail: larsenrud@gmail.com Web: SnowdriftCider.com Salem Cider Convention Report on Federal Regulations Concerning Cider February
Grape Growers of Ontario Developing key measures to critically look at the grape and wine industry
 Grape Growers of Ontario Developing key measures to critically look at the grape and wine industry March 2012 Background and scope of the project Background The Grape Growers of Ontario GGO is looking
Wega Mininova 2003 Installation Instructions
 Wega Mininova 2003 Installation Instructions Thank you for purchasing a Wega Espresso Product. We are sure you will be happy with your purchase and the quality of coffee produced by our machines and grinders.
EXACT MIXING EXACT MIXING. Leaders in Continuous Mixing solutions for over 25 years. BY READING BAKERY SYSTEMS
 EXACT MIXING Leaders in Continuous Mixing solutions for over 25 years. EXACT MIXING BY READING BAKERY SYSTEMS Continuous Mixing equipment and expertise for perfect product every time. Whatever you make,
1. Continuing the development and validation of mobile sensors. 3. Identifying and establishing variable rate management field trials
 Project Overview The overall goal of this project is to deliver the tools, techniques, and information for spatial data driven variable rate management in commercial vineyards. Identified 2016 Needs: 1.
EXTRACTION. Extraction is a very common laboratory procedure used when isolating or purifying a product.
 EXTRACTION Extraction is a very common laboratory procedure used when isolating or purifying a product. Extraction is the drawing or pulling out of something from something else. By far the most universal
Application & Method. doughlab. Torque. 10 min. Time. Dough Rheometer with Variable Temperature & Mixing Energy. Standard Method: AACCI
 T he New Standard Application & Method Torque Time 10 min Flour Dough Bread Pasta & Noodles Dough Rheometer with Variable Temperature & Mixing Energy Standard Method: AACCI 54-70.01 (dl) The is a flexible
Baker Perkins Inc 3223 Kraft Ave SE Grand Rapids, MI USA. Baker Perkins Ltd Manor Drive Paston Parkway Peterborough PE4 7AP United Kingdom
 Baker Perkins Ltd Manor Drive Paston Parkway Peterborough PE4 7AP United Kingdom T: +44 1733 283000 F: +44 1733 283004 E: bpltd@bakerperkinsgroup.com I: www.bakerperkinsgroup.com Baker Perkins Inc 3223
Buying Filberts On a Sample Basis
 E 55 m ^7q Buying Filberts On a Sample Basis Special Report 279 September 1969 Cooperative Extension Service c, 789/0 ite IP") 0, i mi 1910 S R e, `g,,ttsoliktill:torvti EARs srin ITQ, E,6
Michael T. Frow Susan L. Kerr. ChE 4273 Dr. Miguel Bagajewicz
 Michael T. Frow Susan L. Kerr ChE 4273 Dr. Miguel Bagajewicz Overview Problem Definition Process Overview Consumer Satisfaction and Preference Application of Model Business Model Conclusions Recommendations
Liquids Handling in Bakeries.
 Liquids Handling in Bakeries. Competence from grain to bread. Ingredient handling from a single source. Raw materials preparation by Bühler. Liquids handling with maximum hygiene. Process solutions supplied
BREAKTHROUGH TECHNOLOGY FOR A BETTER BOTTOM LINE PENTAIR FOODSERVICE EMEA.
 BREAKTHROUGH TECHNOLOGY FOR A BETTER BOTTOM LINE PENTAIR FOODSERVICE EMEA EVERPURE CLARIS ULTRA The Everpure Claris Ultra is the world s first filter cartridge family designed using a new, patent-pending
Application Note CL0311. Introduction
 Automation of AOAC 970.16 Bitterness of Malt Beverages and AOAC 976.08 Color of Beer through Unique Software Control of Common Laboratory Instruments with Real-Time Decision Making and Analysis Application
GEORGIA DEPARTMENT OF CORRECTIONS Standard Operating Procedures
 Policy Number: 409.04.31 Effective Date: 10/24/17 Page Number: 1 of 7 I. Introduction and Summary: It is the policy of the Food and Farm Services Subdivision to establish and outline standard operating
GEA Plug & Win. Triple win centrifuge skids for craft brewers
 GEA Plug & Win Triple win centrifuge skids for craft brewers 2 GEA PLUG & WIN GEA PLUG & WIN 3 No Limits for New Beers All around the world, creative brewers are turning craft beers into spectacular success
SENIOR NUTRITION SERVICES WORKER
 PERSONNEL COMMISSION Class Code: 5071 Salary Range: 11 (C1) SENIOR NUTRITION SERVICES WORKER JOB SUMMARY Under general supervision, prepare, package and serve hot and cold menu items at an assigned school
INFLUENCE OF ENVIRONMENT - Wine evaporation from barrels By Richard M. Blazer, Enologist Sterling Vineyards Calistoga, CA
 INFLUENCE OF ENVIRONMENT - Wine evaporation from barrels By Richard M. Blazer, Enologist Sterling Vineyards Calistoga, CA Sterling Vineyards stores barrels of wine in both an air-conditioned, unheated,
White Paper. Dry Ingredient Chilling for Bakery Manufacturers.
 White Paper. Dry Ingredient Chilling for Bakery Manufacturers. 02 Dry Ingredient Chilling for Bakery Manufacturers. Abstract Bakery manufacturers know that controlling dough temperature in the mixer is
Activity 10. Coffee Break. Introduction. Equipment Required. Collecting the Data
 . Activity 10 Coffee Break Economists often use math to analyze growth trends for a company. Based on past performance, a mathematical equation or formula can sometimes be developed to help make predictions
FLOTTWEG CENTRIFUGES FOR WINE PRODUCTION Maximum Purity, Improved Quality, Higher Yields
 FLOTTWEG CENTRIFUGES FOR WINE PRODUCTION Maximum Purity, Improved Quality, Higher Yields FLOTTWEG DECANTER CENTRIFUGES AND DISC STACK CENTRIFUGES FOR THE WINE INDUSTRY Optimum Yield, Improved Product Quality
COFFEE BASICS SCAA. The Elements of Proper Brewing and Creating an Ideal Coffee Drinking Experience
 COFFEE BASICS The Elements of Proper Brewing and Creating an Ideal Coffee Drinking Experience SCAA WATER THE ELEMENTS OF PROPER BREWING Fresh, good-tasting water is essential since it makes up more than
Module 6: Overview of bakery machinery: mixers, forming machines and ovens.
 Paper No. 09 Paper Title: Bakery and Confectionery Technology Module 6: Overview of bakery machinery: mixers, forming machines and ovens. Introduction Bakery units can be classified as manual, semi-automatic
Separating the Components of a Mixture
 Separating the Components of a Mixture Introduction: Mixtures are not unique to chemistry; we encounter them on a daily basis. The food and drinks we consume, the fuel we use in our vehicles, building
California Wine Community Sustainability Report Chapter 12 SOLID WASTE REDUCTION AND MANAGEMENT
 California Wine Community Sustainability Report 2004 Chapter 12 SOLID WASTE REDUCTION AND MANAGEMENT Background In 1989, the State of California passed AB939, mandating communities to reduce their waste
Lecture 4. Factors affecting ripening can be physiological, physical, or biotic. Fruit maturity. Temperature.
 Lecture 4. Factors affecting ripening can be physiological, physical, or biotic. Physiological factors relate to fruit maturity or environmental factors, which affect the metabolism of fruit and banana.
Elderberry Ripeness and Determination of When to Harvest. Patrick Byers, Regional Horticulture Specialist,
 Elderberry Ripeness and Determination of When to Harvest Patrick Byers, Regional Horticulture Specialist, byerspl@missouri.edu 1. Ripeness is an elusive concept for many people a. Ripeness is often entirely
Tartrate Stability. Mavrik North America Bob Kreisher, Ph.D
 Tartrate Stability Mavrik North America Bob Kreisher, Ph.D Tartrate Stability Potassium bitartrate = KHT Tartrate Stability: Absence of visible crystals (precipitation) after extended time at a reference
During this November trip 9 wineries have been visited 5 wineries had been audited in March and 4 were new to join the program.
 INTRODUCTION During this November trip 9 wineries have been visited 5 wineries had been audited in March and 4 were new to join the program. Some wineries are already producing sparkling wines and some
TEMPERATURE CONDITIONS AND TOLERANCE OF AVOCADO FRUIT TISSUE
 California Avocado Society 1961 Yearbook 45: 87-92 TEMPERATURE CONDITIONS AND TOLERANCE OF AVOCADO FRUIT TISSUE C. A. Schroeder and Ernest Kay Professor of Botany. University of California, Los Angeles;
The new improver time
 The new improver time The Polish bakery goods manufacturer Inter Europol produces large volumes of starter doughs for wheat and rye bakery products using equipment supplied by Daxner An important success
When quality comes first. Solutions for craft brewers
 When quality comes first Solutions for craft brewers Tradition and innovation Craft brewing is a unique combination of tradition, passion and innovation. Firmly rooted in centuries-old techniques, brewers
IMPORTANT SAFEGUARDS. 3. To protect against fire, electric shock and injury to persons do not immerse cord, plug or unit in water or other liquid.
 IMPORTANT SAFEGUARDS When using electrical appliances, basic precautions should always be followed, including the following: 1. Read all instructions. 2. Make sure that your outlet voltage corresponds
Determination of Alcohol Content of Wine by Distillation followed by Density Determination by Hydrometry
 Sirromet Wines Pty Ltd 850-938 Mount Cotton Rd Mount Cotton Queensland Australia 4165 www.sirromet.com Courtesy of Jessica Ferguson Assistant Winemaker & Chemist Downloaded from seniorchem.com/eei.html
Notes on pressure fermentation
 Notes on pressure fermentation Geoff Dye During World War II the fermenting room at Coopers Brewery, Southampton, received a direct hit which put it completely out of action, but left the brewhouse (wort
AST Live November 2016 Roasting Module. Presenter: John Thompson Coffee Nexus Ltd, Scotland
 AST Live November 2016 Roasting Module Presenter: John Thompson Coffee Nexus Ltd, Scotland Session Overview Module Review Curriculum changes Exam changes Nordic Roaster Forum Panel assessment of roasting
Heron Bay Ultra Premium 6 Week Wine Kit
 Heron Bay Ultra Premium 6 Week Wine Kit 1. PRIMARY FERMENTER: Food grade plastic bucket of at least 30 litres (8 US GAL.) capacity. Use a lid to cover. 2. CARBOY: 23 litre (6 US GAL.) glass, narrow necked
SIMPLEX STRAINER MODEL 90
 The Eaton Model 90 Fabricated Simplex Strainer has been designed for manufacturing flexibility. It can be made for pipeline sizes from 1 to 48 in carbon steel or stainless steel although other materials
Effect of Yeast Propagation Methods on Fermentation Efficiency
 Effect of Yeast Propagation Methods on Fermentation Efficiency Chris Richards Ethanol Technology 4 th European Bioethanol Technology Meeting Detmold, Germany April 16, 2008 Objective of Propagation To
Coffee Filter Chromatography
 Here is a summary of what you will learn in this section: Solutions can be separated by filtration, paper chromatography, evaporation, or distillation. Mechanical mixtures can be separated by sorting,
End to End Chilled Water Optimization Merck West Point, PA Site
 End to End Chilled Water Optimization Merck West Point, PA Site Michael Nyhan, PE Associate Director at Merck Travis Smith, PE Principal at Smith Engineering Dan Shirley Utilities Engineer at Thermo Systems
BOKELA BACKFLUSH FILTER
 BOKELA BACKFLUSH FILTER BOKELA Ingenieurgesellschaft für Mechanische Verfahrenstechnik mbh 76131 Karlsruhe Germany Phone +49 (721) 9 64 56-0 Fax -10 e-mail: bokela@bokela.com Iwww.bokela.com 3 / 2009 e
Help in Addressing the Challenges to Entering the Vineyard and Winery Industry
 Help in Addressing the Challenges to Entering the Vineyard and Winery Industry Part 4 Iowa State University Value Added Agriculture Program United States Department of Agriculture Risk Management Agency
Robinsons factory tour From empty bottle to pallet in 15 minutes
 Robinsons factory tour From empty bottle to pallet in 15 minutes Welcome to the world s biggest squash factory Originally the home of an 11th century Benedictine monastery, this location houses two Robinsons
The Effect of Almond Flour on Texture and Palatability of Chocolate Chip Cookies. Joclyn Wallace FN 453 Dr. Daniel
 The Effect of Almond Flour on Texture and Palatability of Chocolate Chip Cookies Joclyn Wallace FN 453 Dr. Daniel 11-22-06 The Effect of Almond Flour on Texture and Palatability of Chocolate Chip Cookies
Separation of a Mixture
 Separation of a Mixture The isolation of pure components of a mixture requires the separation of one component from another. Chemists have developed techniques for doing this. These methods take advantage
The Purpose of Certificates of Analysis
 207/SOM2/SCSC/WRF/020 The Purpose of Certificates of Analysis Submitted by: FIVS 7 th Wine Regulatory Forum -2 May 207 The Purpose of Certificates of Analysis Greg Hodson, Ph.D. President, FIVS Wine Institute
INFLUENCE OF THIN JUICE ph MANAGEMENT ON THICK JUICE COLOR IN A FACTORY UTILIZING WEAK CATION THIN JUICE SOFTENING
 INFLUENCE OF THIN JUICE MANAGEMENT ON THICK JUICE COLOR IN A FACTORY UTILIZING WEAK CATION THIN JUICE SOFTENING Introduction: Christopher D. Rhoten The Amalgamated Sugar Co., LLC 5 South 5 West, Paul,
HOW TO ACHIEVE A SUCCESSFUL PRISE DE MOUSSE
 HOW TO ACHIEVE A SUCCESSFUL PRISE DE MOUSSE A good preparation of a Prise de Mousse is multifactorial. The composition of the base wine is essential, but many other parameters will have an impact. All
Thermal Hydraulic Analysis of 49-2 Swimming Pool Reactor with a. Passive Siphon Breaker
 Thermal Hydraulic Analysis of 49-2 Swimming Pool Reactor with a Passive Siphon Breaker Zhiting Yue 1, Songtao Ji 1 1) China Institute of Atomic Energy(CIAE), Beijing 102413, China Corresponding author:
MW Exam Review Day. Paper Two. Prepared by Neil Tully MW. 3rd November 2009
 MW Exam Review Day Paper Two Prepared by Neil Tully MW 3rd November 2009 Theory Paper Two - This is a technical paper therefore a sound and detailed knowledge of the core syllabus is essential Questions
Prepare and serve wines. unit 614
 unit 614 Prepare and serve wines There s a lot more to serving wine than simply taking the cork out of the bottle and filling up the glass. This unit will help guide you through what you need to know and
FOOD FOR THOUGHT Topical Insights from our Subject Matter Experts LEVERAGING AGITATING RETORT PROCESSING TO OPTIMIZE PRODUCT QUALITY
 FOOD FOR THOUGHT Topical Insights from our Subject Matter Experts LEVERAGING AGITATING RETORT PROCESSING TO OPTIMIZE PRODUCT QUALITY The NFL White Paper Series Volume 5, August 2012 Introduction Beyond
The Art of Winemaking: The Cellar
 The Art of Winemaking: The Cellar Having discussed the importance of terroir, vineyard management and harvesting in our series on The Art of Winemaking, we now turn to the cellar. While the basic principles
Downloaded from Quick Start Guide D512. Smart Decanter
 Quick Start Guide D52 Smart Decanter Contents Safety Precaution Cleaning Technical Data Correct Disposal of This Product Connecting Power Rechargeable Battery Installation Your isommelier 0 04 05 isommelier
Separations. Objective. Background. Date Lab Time Name
 Objective Separations Techniques of separating mixtures will be illustrated using chromatographic methods. The natural pigments found in spinach leaves, β-carotene and chlorophyll, will be separated using
Introduction. 12 CO H 2 O = C 12 H 22 O O 2 carbon dioxide + water = sucrose + oxygen
 Sugar cane Introduction What we call sugar, the chemist knows as 'sucrose', one of the family of sugars otherwise known as saccharides in the grouping called carbohydrates Sucrose, C 12 H 22 O 11, is a
The Dumpling Revolution
 1 Engineering Design 100 Section 10 Introduction to Engineering Design Team 4 The Dumpling Revolution Submitted by Lauren Colacicco, Ellis Driscoll, Eduardo Granata, Megan Shimko Submitted to: Xinli Wu
ECOBULK WINE-STORE-AGE HIGHEST FOOD SAFETY AND COST-EFFECTIVENESS IN WINE PRODUCTION
 ECOBULK WINE-STORE-AGE HIGHEST FOOD SAFETY AND COST-EFFECTIVENESS IN WINE PRODUCTION Discover the new way of getting perfect results with your wine. Storage containers and technology have always been a
Certified Home Brewer Program. Minimum Certification Requirements
 Certified Home Brewer Program Minimum Certification Requirements SCA's Minimum Certification Requirements for Coffee Brewers 1. Coffee Volume: The volume of the brew basket must be sized in proportion
5KEK1322 W A_v08.indd 1 5/13/16 2:25 PM
 5KEK1322 W10878653A_v08.indd 1 PARTS AND FEATURES PARTS AND ACCESSORIES Tea steeper lid (center section of lid with handle) Kettle lid (outer section) Stainless steel lime scale filter Removable stainless
Temperature effect on pollen germination/tube growth in apple pistils
 FINAL PROJECT REPORT Project Title: Temperature effect on pollen germination/tube growth in apple pistils PI: Dr. Keith Yoder Co-PI(): Dr. Rongcai Yuan Organization: Va. Tech Organization: Va. Tech Telephone/email:
ACME Fluid Systems. Strainer Selection Guidelines Web:
 ACME Fluid Systems Strainer Selection Guidelines E-mail: info@strainersindia.com Web: www.strainersindia.com Introduction This document provides a general introduction to the parameters to be kept in mind
Award winning winemaker Teusner Wines recently invested in two Kaeser SK 25
 June 2018 A crushing success for Kaeser and Teusner Wines Award winning winemaker Teusner Wines recently invested in two Kaeser SK 25 rotary screw compressors, which are responsible for delivering a reliable
HONEY. Food and Agriculture Organization of the United Nations
 HONEY Food and Agriculture Organization of the United Nations HONEY 1.- Honey General Information Honey has a fluid, crystallized (total or partially) consistence. Present a high viscosity and density
Novozymes & Gusmer Enterprises WINE ENZYMES SOLUTIONS
 Novozymes & Gusmer Enterprises WINE ENZYMES SOLUTIONS Flotation and VinoClear Classic Presented by Adam Vart and Bill Merz 3 What is Flotation Originally developed for Water treatment 1st applications
BREWERS ASSOCIATION CRAFT BREWER DEFINITION UPDATE FREQUENTLY ASKED QUESTIONS. December 18, 2018
 BREWERS ASSOCIATION CRAFT BREWER DEFINITION UPDATE FREQUENTLY ASKED QUESTIONS December 18, 2018 What is the new definition? An American craft brewer is a small and independent brewer. Small: Annual production
Peach and Nectarine Cork Spot: A Review of the 1998 Season
 Peach and Nectarine Cork Spot: A Review of the 1998 Season Kevin R. Day Tree Fruit Farm Advisor Tulare County University of California Cooperative Extension Along with many other problems, fruit corking