YEMEN Market Watch Report
|
|
|
- Lenard Summers
- 6 years ago
- Views:
Transcription


1 Issue No. 21 February 2018 Highlights The Yemeni Riyals continued to suffer from rapid depreciation, and lost about 220% of its pre-crisis value. The poor supply and scarcity of basic imported food and fuel commodities persisted in February Most of the governorates are affected by the continued shortage of essential goods in markets. Retail prices of basic food items continued rising in February 2018 following worsened scarcity of commodities in local markets, the rapidly depreciating Yemeni Riyal, high cost of transportation due to high prices of fuel, double customs taxation, and restrictions of movements. Food prices increased between 32% and 98% in February 2018 compared to the pre-crisis period, while fuel prices were still more than double (105%-115% higher than in precrisis time). YEMEN Market Watch Report Macroeconomic Situation As the war continues, Yemen is struggling with near-collapsing economy. Even before the current conflict, years of mismanagement, corruption, and depletion of natural resources, both oil and water, had led to chronic poverty and underdevelopment, with minimal access to basic services such as electricity, water, and health care in much of the country. The conflict has only exacerbated those issues. The ongoing war has halted Yemen s exports, pressured the currency s exchange rate, accelerated inflation, severely limited food and fuel imports, and caused widespread damage to infrastructure. The conflict has also created a severe humanitarian crisis - the world s largest cholera outbreak currently stands at over one million cases, more than 7 million people at risk of famine, and more than 80% of the population in need of humanitarian assistance. In addition, civil service salaries are being paid irregularly, miring many workers in poverty, and worsening food security situation for millions of Yemenis. The sharp depreciation of Yemeni Riyals (YER) in the market exchange rate against foreign currencies has continued despite Saudi Arabia recently injecting USD 2 billion into Yemen s central bank. The national monthly average exchange rate in February 2018 stood at 474 YER/USD, and hugely lost its pre-crisis value by an average of 220% which means that the purchasing power of YER much below half of what it used to buy three years ago. The exchange rates in several governorates exceeded the national average, and Taiz experienced the worst (Chart 1). Chart 1: Average exchange rate (YER/USD) in February 2018 and previous months The average cost of the monthly minimum food basket in February increased by nearly 2% and 8% from January 2018 and December 2017, respectively, and 58% higher than in pre-crisis period. The Alert for Price Spikes (ALPS) indicators for all basic food items and the cost of food basket remained at crisis situation in February Contacts Stephen Anderson Country Director stephen.anderson@wfp.org Endalkachew Alamnew Vulnerability Analysis and Mapping Officer endalkachew.alamnew@wfp.org

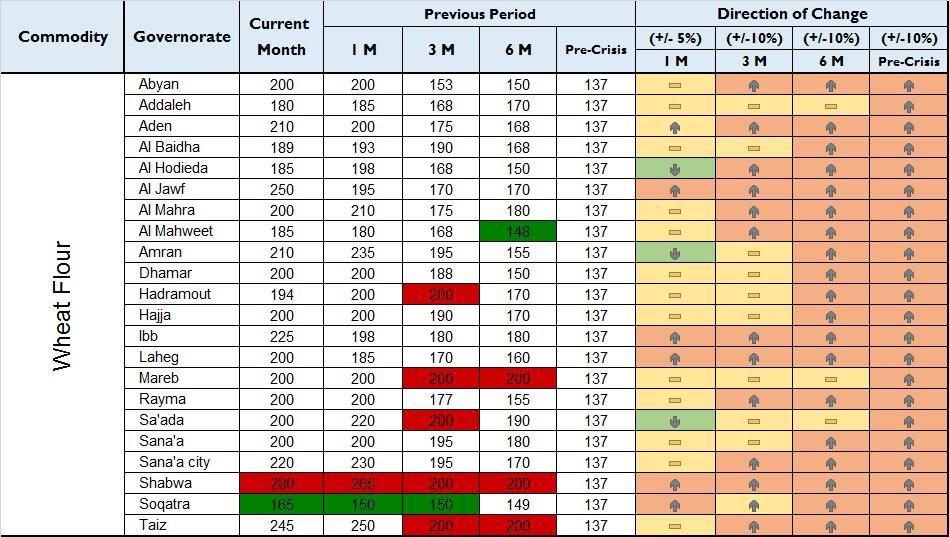
2 Yemen Issue August YemenMarket IssueNo. August No.4 4 MarketWatch WatchReport Report Yemen Market Watch Report Issue No. 21 February 2018 Food and Fuel Supply and Availability After the temporary blockade of key sea ports was lifted by the SLC around late December 2017, approximately a total of over 800,000 MT of food commodities have been imported into Yemen between January and February As informally confirmed by the major importers, this amount of food together with the previous estimated in-country carry-over stock is anticipated to likely cover the country s food requirement for about three months starting from March Moreover, according to some informal sources on import statistics indicate that approximately 279,000 MT of fuel was imported in January 2018 and around 224,000 MT was imported in February 2018, which marked a significant improvement on fuel imports compared to the level reported during the months before the blockade. However, the widespread scarcity of food and fuel commodities continued in local markets and further deteriorated in February 2018 across most of the governorates of Yemen, worse than in the previous months (Table 1). Table 1: Availability of basic commodities during current month (February 2018) and previous months Some of the main reasons associated to the poor supply and scarcity of commercial food and fuel commodities in local 1: markets reportedly include disruption of (YER/Unit) financial systems and bank services, lack of foreign currencies Chart Price Trend of Main Food Commodities National average prices of wheat flour, for importers, the continued liquidity crisis, lack of credits for small traders/retailers, additional customs taxation sugar, vegetable oil and red beans in in Sana a on commodities that come through Aden and southern sea ports, August shortages andwere high25%, prices24%, of fuel %affecting and transportations, hoarding of goods by traders, restricted movements of commodities insecurity by the 60% higher due thantothose beforecaused the crisis, escalated conflicts/airstrikes that affected the main supply routes in respectively. the northern parts country, and Someof the governorates deterioration of exchange rates that created uncertainties among traders including who are selling importedmareb, food items. Taiz, Shabwa, Al Jawf, Hajja and Sa ada where conflicts still ongoing, Food continued to suffer from high Retail Prices of Food Commodities and Cost of Minimum Basket prices of goods. Prices in Soqatra also The retail prices of basic imported food commodities continued its steady increasing trend in February Poor rose significantly caused by poor supply level of imports coupled with malfunctioning of the market systems is contributing to the high and rising food prices. due to the rough waves on the sea ; (Annex 2 & 3). Yemen Market Watch Report Issue No. 21 February 2018 Page 2

.")
3 Yemen Market Watch Report Issue No. 21 February 2018 Chart 2: Price Trend of Main Food Commodities (YER/Unit In February 2018, the national average retail prices of wheat flour, sugar, vegetable oil, and red beans were 51%, 41%, 32%, and 98%, respectively, higher than in pre-crisis period. During the month of reporting, average prices wheat flour and sugar slightly increased by 1%, vegetable oil by 2.5% and red beans by 2.6% (Chart 2). The continued escalation of food prices mainly attributed to the poor supply of food commodities in local markets as well as many other factors that reportedly include lack of foreign currency in banks and heavy reliance of importers on parallel foreign exchange markets; rapidly depreciating of the local currency (Yemeni Riyal); high demurrage charges on importers due to long delays of offloading shipments at ports; hoarding of commodities and speculation of prices by opportunistic traders; continued double customs taxation in Sana a on commodities coming through southern ports; increased transportation costs due to shortages and high prices of fuel; and movement restrictions and insecurity associated with the ongoing conflicts and airstrikes that resulted in disintegration of markets. The northern governorates including Taiz, Hajja, Hodieda, Sa ada, Sana a, and Al Baidha are particularly affected by the combined impacts of double taxation, demurrage charges, and escalated conflicts/airstrikes, and thus continued to suffer from higher prices of basic commodities compared to those in the south. As a result of the high escalation of food prices, the national average monthly per capita cost of minimum food basket slightly by 1.6% during the reporting period compared to the previous month (increased from 3,664 YER in January to 3,721 YER in February 2018), and 58% higher than it was during the pre-crisis period. In February 2018, the monthly cost of minimum food basket in Shabwa, Taiz, Al Jawf, Sana a city and Ibb governorates significantly exceeded the national average suggesting that markets in those governorates become more disintegrated which in turn negatively affecting the supply of food commodities that led to increasingly high prices (Chart 3). Consequently, the food security situation of vulnerable households (in those governorates with high cost of living) may deteriorate further. Chart 3: Average Cost of Minimum Food Basket (in YER/Person/month) February 2018 and previous months Yemen Market Watch Report Issue No. 21 February 2018 Page 3
 Between January and February 2018, the prices of petrol and diesel have generally remained unchanged, while prices of")
4 Yemen Market Watch Report Issue No. 4 August 2016 Yemen Market Watch Report Issue No. 21 February 2018 Retail Prices of Fuel Chart 4: Price Trend of Fuel (YER/Unit) Between January and February 2018, the prices of petrol and diesel have generally remained unchanged, while prices of cooking gas increased by 3.2% in February compared to those in January (Chart 4). However, compared to the pre-crisis period, the national average prices of fuel commodities in February 2018 were more than double prices of cooking gas, petrol and diesel were 111%, 105% and 115% higher, respectively, than the prices during the month prior to the crisis (Feb. 2015). With the exception of Al Mahra, Mareb, Hadramout and Soqatra, all governorates continued to experience severe scarcity and high prices of fuel. Those governorates under active conflicts and/or intensified airstrikes including Taiz, Sa ada, Hajja, Hodieda, Al Jawf, Al Baidha and Shabwa persistently suffer the most (Annex 2 and Annex 3). Alert for Price Spikes (ALPS) The Alert for Price Spikes (ALPS) indicator was developed for each of the basic commodities in Yemen using historical market data on the monthly national averages from January 2011 to February The results of the ALPS analysis reflect the changes in the prices and availability of the essential food commodities as well as the cost of the minimum food basket. According to the results of the analysis for February 2018, the ALPS indicators for all the basic food commodities (wheat flour, vegetable oil, red beans, and sugar) persistently remained at their crisis level since last month (Charts 5, 6, 7, and 8). As a result of the deteriorating conditions on all indicators, the ALPS indicator for the monthly cost of minimum food basket maintained the crisis situation (Chart 9). The continued cumulative impacts of the war are being reflected on all socio-economic indicators of the country. The most worrisome trend of worsening cost of living is further fueled up by the rapidly depreciating Yemeni Riyals against foreign currencies. Given the fact that the livelihoods and income sources of millions of Yemenis have been seriously disrupted or vanished during the prolonged war, vulnerable households are no longer able to meet their needs with own means. Chart 5: ALPS for Wheat Flour February 2018 and monthly trends since 2011 Yemen Market Watch Report Issue No. 21 February 2018 Page 4


5 Yemen Market Watch Report Issue No. 4 August 2016 Yemen Market Watch Report Issue No. 21 February 2018 Chart 6: ALPS for Vegetable Oil February 2018 and monthly trends since 2011 Chart 7: ALPS for Sugar February 2018 and monthly trends since 2011 Chart 8: ALPS for Red Beans February 2018 and monthly trends since 2014 Chart 9: ALPS for Basic Food Basket Cost February 2018 and monthly trends since 2011 Yemen Market Watch Report Issue No. 21 February 2018 Page 5

6 Yemen Market Watch Report Issue No. 4 August 2016 Yemen Market Watch Report Issue No. 21 February 2018 Annex 1: Methodology Market information is collected on a weekly basis from all the 22 governorates of Yemen. WFP collects market data remotely through key informants located at capitals of all governorates as well as partners operating in different parts of the country. Data are then cleaned and consolidated. Monthly averages are used for the Yemen Monthly Watch Report. Map 1 shows the locations of markets (yellow pinned) current information collected from. Map 1: Locations of markets monitored by WFP The report is produced based on the Automated Market Analysis Tool (AMAT). The AMAT is an agile market monitoring tool that was developed for Yemen Country Office (CO) and is aimed at storing raw data collected from selected major markets of governorates capitals, and creating contextualized analyses. The tool analyzes trends of main food and fuel commodities, minimum food basket, and provides indications about how much the markets are integrated across governorates. Food and fuel prices are analyzed against previous periods, including key baselines, such as the pre-crisis values of February The AMAT also includes information regarding the availability, which is collected by field monitors and key informants. The classification of the availability is based on the monthly averages. A commodity is classified as Available when it is found available at every visit in all markets of a specific governorate; Widely Available when for only one visit the availability is not full; Sparsely Available when in at least half of the visits, the commodity is recorded as rare in the market; a commodity is Mostly Not Available when it was found only in rare cases in a governorate during the analyzed month; finally a commodity is classified as Not Available when it is not found in any market of a governorate at any time. The minimum food basket monitored by WFP contains five main food commodities. The quantities are adjusted against the survival caloric intake needs. The five commodities are wheat flour, sugar, red beans, vegetable oil and onion. The Alert for Price Spikes (ALPS) is a WFP-developed indicator calculated as follows ALPS=(Price it Season it)/σ ε. It is computed for each month (t) by dividing the difference between the observed and estimated seasonal price (automatically derived from historical data and constantly updated) of a specific commodity (i) by the standard deviation of the error term (σ ε). The results of the analysis are presented in the report in the form of charts using four categories Situation on a given market: based on the ALPS thresholds describing the market situation either as normal, alert, stress, or crisis. ALPS thresholds: Normal ALPS < 0.25 Alert 0.25 ALPS < 1 Stress 1 ALPS < 2 Crisis ALPS 2 Yemen Market Watch Report Issue No. 21 February 2018 Page 6

 and previous months Yemen Market")
7 Yemen Market Watch Report Issue No. 18 October and 1st half of Dec Yemen Market Watch Report Issue No. 21 February 2018 Annex 2: Average retail prices of basic commodities by governorate February 2018 (current month) and previous months Yemen Market Watch Report Issue No. 21 February 2018 Page 7


 and")

8 Yemen Market Watch Report Issue No. 21 February 2018 Annex 3: Average retail prices by commodity during current month (February 2018) and previous months Yemen Market Watch Report Issue No. 21 February 2018 Page 8
Price Monitoring for Food Security in the Kyrgyz Republic
 Issue 6 February 2016 Price Monitoring for Food Security in the Kyrgyz Republic Monthly monitoring and outlook of basic food prices in the Kyrgyz Republic Highlights Domestic prices of wheat flour have
JULY 2017 ISSUE 32. In July 2017, the national average cost of a standard food basket 1 (group of essential food commodities) was SYP 32,770.
 was SYP 32,770.") SYRIA COUNTRY OFFICE KET PRICE WATCH BULLETIN Y 217 ISSUE 32 Highlights: A: Standard Food Basket Chart 1: Min. vs. Max. National Cost of Food Basket (in ) In Ar-Raqqa city bread prices are higher by more
SYRIA COUNTRY OFFICE KET PRICE WATCH BULLETIN Y 217 ISSUE 32 Highlights: A: Standard Food Basket Chart 1: Min. vs. Max. National Cost of Food Basket (in ) In Ar-Raqqa city bread prices are higher by more
Price Monitoring for Food Security in the Kyrgyz Republic
 Issue 4 December 2015 Price Monitoring for Food Security in the Kyrgyz Republic Highlights Monthly monitoring and outlook of basic food prices in the Kyrgyz Republic The price of first grade wheat flour
Dairy Market. Overview. Commercial Use of Dairy Products
 Dairy Market Dairy Management Inc. R E P O R T Volume 21 No. 6 June 2018 DMI NMPF Overview U.S. dairy markets received a one-two punch during the first weeks of June in the form of collateral damage from
Price Monitoring for Food Security in the Kyrgyz Republic
 Issue 12 October 216 Price Monitoring for Food Security in the Kyrgyz Republic Highlights Monthly monitoring and outlook of basic food prices in the Kyrgyz Republic Global wheat supply for 216/17 has raised
Volatility returns to the coffee market as prices stay low
 Volatility returns to the coffee market as prices stay low Daily coffee prices hit their lowest level in 19 months during August, as commodity markets worldwide were negatively affected by currency movements
MONTHLY COFFEE MARKET REPORT
 E MONTHLY COFFEE MARKET REPORT May 2014 After five consecutive months of rising prices, the coffee market reversed lower in May. From a high of 179 cents/lb in April, the daily price of the ICO composite
Coffee prices rose slightly in January 2019
 Coffee prices rose slightly in January 2019 In January 2019, the ICO composite indicator rose by 0.9% to 101.56 US cents/lb as prices for all group indicators increased. After starting at a low of 99.16
GLOBAL DAIRY UPDATE KEY DATES MARCH 2017
 MARCH 2017 GLOBAL DAIRY UPDATE European milk production decreased for the seventh consecutive month, while the US remains strong. The rate of decline in New Zealand production is easing. US exports continue
QUARTELY MAIZE MARKET ANALYSIS & OUTLOOK BULLETIN 1 OF 2015
 QUARTELY MAIZE MARKET ANALYSIS & OUTLOOK BULLETIN 1 OF 2015 INTRODUCTION The following discussion is a review of the maize market environment. The analysis is updated on a quarterly 1 basis and the interval
THIS REPORT CONTAINS ASSESSMENTS OF COMMODITY AND TRADE ISSUES MADE BY USDA STAFF AND NOT NECESSARILY STATEMENTS OF OFFICIAL U.S.
 THIS REPORT CONTAINS ASSESSMENTS OF COMMODITY AND TRADE ISSUES MADE BY USDA STAFF AND NOT NECESSARILY STATEMENTS OF OFFICIAL U.S. GOVERNMENT POLICY Required Report - public distribution Date: GAIN Report
Downward correction as funds respond to increasingly positive supply outlook
 Downward correction as funds respond to increasingly positive supply outlook Coffee prices fell sharply at the end of April as institutional investors sold off their positions. The coffee market continues
STATE OF THE VITIVINICULTURE WORLD MARKET
 STATE OF THE VITIVINICULTURE WORLD MARKET April 2015 1 Table of contents 1. 2014 VITIVINICULTURAL PRODUCTION POTENTIAL 3 2. WINE PRODUCTION 5 3. WINE CONSUMPTION 7 4. INTERNATIONAL TRADE 9 Abbreviations:
WFP MONTHLY MARKET UPDATE
 WFP MONTHLY MARKET UPDATE SUDAN, MAY 218 Highlights The national average retail price of sorghum significantly increased by 9.7 percent, in WFP areas, compared to the previous month. The retail prices
MONTHLY COFFEE MARKET REPORT
 E MONTHLY COFFEE MARKET REPORT February 2014 February 2014 has seen significant developments in the coffee market, with prices shooting upwards at a startling rate. The ICO composite daily price has increased
MARKET ANALYSIS REPORT NO 1 OF 2015: TABLE GRAPES
 MARKET ANALYSIS REPORT NO 1 OF 215: TABLE GRAPES 1. INTRODUCTION The following text is a review of the table grapes marketing environment. This analysis is updated on a quarterly 1 basis. The interval
RESTAURANT OUTLOOK SURVEY
 Reference Period: Fourth Quarter 2016 RESTAURANT OUTLOOK SURVEY Prepared by Chris Elliott, Senior Economist January 23, 2017 Q2-2011 Restaurant Outlook Survey Fourth Quarter 2016 1 Highlights The share
QUARTERLY REVIEW OF THE PERFORMANCE OF THE DAIRY INDUSTRY 1
 QUARTERLY REVIEW OF THE PERFORMANCE OF THE DAIRY INDUSTRY 1 The information in this document is from sources deemed to be correct. Milk SA, the MPO and SAMPRO are not responsible for the results of any
Monitoring EU Agri-Food Trade: Development until September 2018
 Monitoring EU Agri-Food Trade: Development until September 2018 September 2018: Slowdown in EU export performance; imports from Brazil and US still on the rise The monthly value of EU agri-food trade in
MONTHLY COFFEE MARKET REPORT
 E MONTHLY COFFEE MARKET REPORT June 2013 Coffee prices fell sharply in June 2013, as market fundamentals, combined with an uncertain macroeconomic outlook, drove the ICO composite indicator price to its
Coffee market continues downward trend
 Coffee market continues downward trend Since August 2017, the ICO composite indicator price has declined in each month except January 2018. The composite indicator decreased by 1.1% in March 2018 to an
THIS REPORT CONTAINS ASSESSMENTS OF COMMODITY AND TRADE ISSUES MADE BY USDA STAFF AND NOT NECESSARILY STATEMENTS OF OFFICIAL U.S.
 THIS REPORT CONTAINS ASSESSMENTS OF COMMODITY AND TRADE ISSUES MADE BY USDA STAFF AND NOT NECESSARILY STATEMENTS OF OFFICIAL U.S. GOVERNMENT POLICY Required Report - public distribution Date: 5/16/2016
Coffee market remains volatile but lacks direction
 Coffee market remains volatile but lacks direction Prices fluctuated significantly during August, with the ICO composite indicator dropping by 10 cents before jumping back up another 12 cents by the end
Agriculture and Food Authority
 Agriculture and Food Authority Presentation by: SOLOMON ODERA Interim Head of Sugar Directorate Agriculture and Food Authority November, 2017 KENYA SUGARCANE INDUSTRY OUTLINE 1) Introduction 2) Kenyan
IN THIS ISSUE FEBRUARY Financial Calendar: Late September 2014 Annual Results Announced. 26 March 2014 Interim Results Announced
 FEBRUARY 2014 Welcome to our latest Global Dairy Update. This update is part of Fonterra s commitment to informing our farmers and wider stakeholders about the global dairy market, trends in New Zealand
2016 China Dry Bean Historical production And Estimated planting intentions Analysis
 2016 China Dry Bean Historical production And Estimated planting intentions Analysis Performed by Fairman International Business Consulting 1 of 10 P a g e I. EXECUTIVE SUMMARY A. Overall Bean Planting
Economic Contributions of the Florida Citrus Industry in and for Reduced Production
 Economic Contributions of the Florida Citrus Industry in 2014-15 and for Reduced Production Report to the Florida Department of Citrus Alan W. Hodges, Ph.D., Extension Scientist, and Thomas H. Spreen,
Citrus: World Markets and Trade
 United States Department of Agriculture Foreign Agricultural Service Citrus: World Markets and Trade Oranges Global orange production for 2012/13 is forecast to drop over 4 percent from the previous year
January 2017 Volume 16
 January 2017 Volume 16 Figure 1: Main Staple Food Commodities Informally Traded Across Selected Borders in Eastern Africa in the third quarter of 2016. Source: FEWSNET and EAGC Maize grain was the most
Good staple grain harvests and available job opportunities in coffee-growing activities facilitate food access
 EL SALVADOR, HONDURAS, AND NICARAGUA Remote Monitoring Update February 2018 Good staple grain harvests and available job opportunities in coffee-growing activities facilitate food access KEY MESSAGES Most
WEEKLY OILSEED REPORT 31 OCTOBER 2018
 WEEKLY OILSEED REPORT 31 OCTOBER 218 Unigrain (Pty) Ltd Tel. No. : +27 11 692 44 Fax. No. : +27 11 412 1183 INTERNATIONAL MARKET Table 1: CME Soybean prices and weekly change (cents/bushel) Currently 24/1/218
ECONOMICS OF COCONUT PRODUCTS AN ANALYTICAL STUDY. Coconut is an important tree crop with diverse end-uses, grown in many states of India.
 ECONOMICS OF COCONUT PRODUCTS AN ANALYTICAL STUDY Introduction Coconut is an important tree crop with diverse end-uses, grown in many states of India. Coconut palm is the benevolent provider of the basic
MONTHLY COFFEE MARKET REPORT
 1 E MONTHLY COFFEE MARKET REPORT March 2014 Ongoing uncertainty over the Brazilian coffee crop has caused significant fluctuations in coffee prices during March, with monthly volatility of the International
Downward correction in coffee market as supply prospects improve
 Downward correction in coffee market as supply prospects improve The recent rally in coffee prices underwent a notable reversal in November 2016, attributed to improved weather prospects in Brazil and
LETTER FROM THE EXECUTIVE DIRECTOR COFFEE MARKET REPORT. November 2004
 International Coffee Organization Organización Internacional del Café Organização Internacional do Café Organisation Internationale du Café E LETTER FROM THE EXECUTIVE DIRECTOR COFFEE MARKET REPORT November
China s Export of Key Products of Pharmaceutical Raw Materials
 China s Export of Key Products of Pharmaceutical Raw Materials During the period of the 62nd API China& INTERPHEX CHINA, China Pharmaceutical Industry Association released its annual Report on Analysis
For personal use only
 SEPTEMBER 216 GLOBAL DAIRY UPDATE European milk production has decreased for the first time since early 215, with volumes in June down 2 compared to last year. Last week we announced our annual results,
STATE OF THE VITIVINICULTURE WORLD MARKET
 STATE OF THE VITIVINICULTURE WORLD MARKET April 2018 1 Table of contents 1. VITICULTURAL PRODUCTION POTENTIAL 3 2. WINE PRODUCTION 5 3. WINE CONSUMPTION 7 4. INTERNATIONAL TRADE 9 Abbreviations: kha: thousands
Economic Losses from Pollution Closure of Clam Harvesting Areas in Machias Bay
 Economic Losses from Pollution Closure of Clam Harvesting Areas in Machias Bay Kevin Athearn, Ph.D. University of Maine at Machias June 8, 2012 Tora Johnson (UMM) and Brian Beal (UMM) assisted with this
PEEL RIVER HEALTH ASSESSMENT
 PEEL RIVER HEALTH ASSESSMENT CONTENTS SUMMARY... 2 Overall River Health Scoring... 2 Overall Data Sufficiency Scoring... 2 HYDROLOGY... 3 Overall Hydrology River Health Scoring... 3 Hydrology Data Sufficiency...
Fresh Deciduous Fruit (Apples, Grapes, & Pears): World Markets and Trade
: World Markets and Trade") Million MT United States Department of Agriculture Foreign Agricultural Service December 21 Fresh Deciduous Fruit (Apples, Grapes, & Pears): World Markets and Trade 21/11 Forecast: World Apple Trade Declines;
Million MT United States Department of Agriculture Foreign Agricultural Service December 21 Fresh Deciduous Fruit (Apples, Grapes, & Pears): World Markets and Trade 21/11 Forecast: World Apple Trade Declines;
Dairy Market. May 2016
 Dairy Market R E P O R T Volume 19 No. 5 May 2016 DMI NMPF Overview Increased production per cow and expectations for additional milk production growth is dampening the outlook for milk prices for the
February Restaurant Business Conditions Report
 Larry Miller larry@millerpulse.com 404-661-6363 Robert Sanders robert@millerpulse.com 404-849-6717 February 2014 Restaurant Business Conditions Report Is The Other Shoe Finally Dropping? QSR same store
Figure 1: Quartely milk production and gross value
 Million Litres Million Rands QUARTERLY DAIRY MARKET ANALYSIS BULLETIN 1 OF 215 1. INTRODUCTION The following discussion is a review of the dairy market environment. The analysis is updated on a quarterly
Fungicides for phoma control in winter oilseed rape
 October 2014 Fungicides for phoma control in winter oilseed rape Summary of HGCA fungicide project 2010 2014 (RD-2007-3457) While the Agriculture and Horticulture Development Board, operating through its
EMBARGO TO ON FRIDAY 16 SEPTEMBER. Scotch Whisky Association. Exports of Scotch Whisky; Year to end of June 2016 (2016 H1)
") EMBARGO TO 00.01 ON FRIDAY 16 SEPTEMBER Scotch Whisky Association Exports of Scotch Whisky; Year to end of June 2016 (2016 H1) VOLUME UP 3.1% to 531 MILLION bottles VALUE DOWN SLIGHTLY BY 1.0% TO 1.70
EMBARGO TO 00.01 ON FRIDAY 16 SEPTEMBER Scotch Whisky Association Exports of Scotch Whisky; Year to end of June 2016 (2016 H1) VOLUME UP 3.1% to 531 MILLION bottles VALUE DOWN SLIGHTLY BY 1.0% TO 1.70
THIS REPORT CONTAINS ASSESSMENTS OF COMMODITY AND TRADE ISSUES MADE BY USDA STAFF AND NOT NECESSARILY STATEMENTS OF OFFICIAL U.S.
 THIS REPORT CONTAINS ASSESSMENTS OF COMMODITY AND TRADE ISSUES MADE BY USDA STAFF AND NOT NECESSARILY STATEMENTS OF OFFICIAL U.S. GOVERNMENT POLICY Required Report - public distribution Date: GAIN Report
Record exports from Brazil weigh heavy on the coffee market
 Record exports from Brazil weigh heavy on the coffee market Coffee exports from Brazil reached a record high of 36.8 million bags in crop year 2014/15 (April to March), fuelled by domestic stocks and encouraged
UPPER MIDWEST MARKETING AREA THE BUTTER MARKET AND BEYOND
 UPPER MIDWEST MARKETING AREA THE BUTTER MARKET 1987-2000 AND BEYOND STAFF PAPER 00-01 Prepared by: Henry H. Schaefer July 2000 Federal Milk Market Administrator s Office 4570 West 77th Street Suite 210
THIS REPORT CONTAINS ASSESSMENTS OF COMMODITY AND TRADE ISSUES MADE BY USDA STAFF AND NOT NECESSARILY STATEMENTS OF OFFICIAL U.S.
 THIS REPORT CONTAINS ASSESSMENTS OF COMMODITY AND TRADE ISSUES MADE BY USDA STAFF AND NOT NECESSARILY STATEMENTS OF OFFICIAL U.S. GOVERNMENT POLICY Voluntary - Public Date: 4/24/2013 GAIN Report Number:
2018/19 expected to be the second year of surplus
 2018/19 expected to be the second year of surplus Coffee year 2018/19 is expected to be the second consecutive season of surplus, as global output, estimated at 167.47 million bags, exceeds world consumption,
North Carolina Exports by Quarter (in constant 2Q 2013 dollars)
") P. 1/6 in Billions in Billions 1 North Carolina Trade Report 1, First Half of 2013 Exports from North Carolina play an increasingly important role in the state s economic recovery and job growth. That
P. 1/6 in Billions in Billions 1 North Carolina Trade Report 1, First Half of 2013 Exports from North Carolina play an increasingly important role in the state s economic recovery and job growth. That
Fresh Deciduous Fruit (Apples, Grapes, & Pears): World Markets and Trade
: World Markets and Trade") United States Department of Agriculture Foreign Agricultural Service Fresh Deciduous Fruit (Apples, Grapes, & Pears): World Markets and Trade 9 1, MT Deciduous Fruit on Seasonal Cycles 6 Northern Hemisphere
United States Department of Agriculture Foreign Agricultural Service Fresh Deciduous Fruit (Apples, Grapes, & Pears): World Markets and Trade 9 1, MT Deciduous Fruit on Seasonal Cycles 6 Northern Hemisphere
Record exports in coffee year 2017/18
 Record exports in coffee year 2017/18 Total coffee exports increased each year since 2010/11 with a new record reached in 2017/18 at 121.86 million bags, 2% higher than 2016/17. In the twelve months ending
JAPAN COUNTRY FACT SHEET: General information. Unemployment rate: 4,3% BBP: 4237,8 billion BBP per capita: Official language(s):
:") General information Capital: Surface area: Official language(s): Currency: Key macroeconomic indicators Tokyo 377.835 km² Japanese Japanese Yen Population: 126,5 million Unemployment rate: 4,3% BBP: 4237,8
General information Capital: Surface area: Official language(s): Currency: Key macroeconomic indicators Tokyo 377.835 km² Japanese Japanese Yen Population: 126,5 million Unemployment rate: 4,3% BBP: 4237,8
Lebanon s Balance of Trade: H Update
 BLOMINVEST BANK. Yearly Evolution of Trade Deficit by H1 August 18, 2017 Contact Information Research Assistant: Dina Antonios Dina.antonios@blominvestbank.com Head of Research: Marwan Mikhael marwan.mikhael@blominvestbank.com
Dairy Market. July The U.S. average all-milk price rose by $0.20 per hundredweight in May from a
 Dairy Market Dairy Management Inc. R E P O R T Volume 20 No. 6 July 2017 DMI NMPF Overview The U.S. average all-milk price rose by $0.20 per hundredweight in May from a month earlier, and the June federal
M03/330/S(2) ECONOMICS STANDARD LEVEL PAPER 2. Wednesday 7 May 2003 (morning) 2 hours INSTRUCTIONS TO CANDIDATES
 ECONOMICS STANDARD LEVEL PAPER 2. Wednesday 7 May 2003 (morning) 2 hours INSTRUCTIONS TO CANDIDATES") c PROGRAMA IB DIPLOMA PROGRAMME PROGRAMME DU DIPLÔME DU BI DEL DIPLOMA DEL BI M03/330/S(2) ECONOMICS STANDARD LEVEL PAPER 2 Wednesday 7 May 2003 (morning) 2 hours INSTRUCTIONS TO CANDIDATES! Do not open
c PROGRAMA IB DIPLOMA PROGRAMME PROGRAMME DU DIPLÔME DU BI DEL DIPLOMA DEL BI M03/330/S(2) ECONOMICS STANDARD LEVEL PAPER 2 Wednesday 7 May 2003 (morning) 2 hours INSTRUCTIONS TO CANDIDATES! Do not open
WEEKLY MAIZE REPORT 11 JULY 2018
 28 29 21 211 212 213 214 215 216 217 218 WEEKLY MAIZE REPORT 11 JULY 218 Unigrain (Pty) Ltd Tel. No. : +27 11 692 44 Fax. No. : +27 11 412 1183 INTERNATIONAL MARKET Table 1: CME Maize prices and weekly
Coffee market ends 2015/16 in deficit for the second consecutive year
 Coffee market ends 2015/16 in deficit for the second consecutive year The coffee market settled up by 5.5% in September, mostly driven by a steady increase in Robusta prices supported by concerns over
The Contribution made by Beer to the European Economy. Poland - January 2016
 The Contribution made by Beer to the European Economy Poland - January 2016 Europe Economics is registered in England No. 3477100. Registered offices at Chancery House, 53-64 Chancery Lane, London WC2A
UNDERSTANDING CHINA: THE PECAN EXPORT MARKET & TOTAL CONSUMPTION
 UNDERSTANDING CHINA: THE PECAN EXPORT MARKET & TOTAL CONSUMPTION INSHELL PECAN IMPORTS BY CHINA UNITED STATES SOUTH AFRICA MEXICO U.S. INSHELL AND PECAN KERNEL EXPORTS TO CHINA (MT) (12 Month Comparison:
Investment Wines. - Risk Analysis. Prepared by: Michael Shortell & Adiam Woldetensae Date: 06/09/2015
 Investment Wines - Risk Analysis Prepared by: Michael Shortell & Adiam Woldetensae Date: 06/09/2015 Purpose Look at investment wines & examine factors that affect wine prices over time We will identify
Cocoa Prepared by Foresight December 5, 2017
 Cocoa Prepared by Foresight December 5, 2017 TABLES Cocoa Bean Price Forecast... P. 4 World Cocoa Supply/Demand, Crop Year... P. 7 World Cocoa Production... P. 8 Cocoa Crops in Major Producing Countries...
1. Expressed in billions of real dollars, seasonally adjusted, annual rate.
 ROUTPUT -- Real GNP/GDP 1. Expressed in billions of real dollars, seasonally adjusted, annual rate. 2. First Monthly Vintage: 1965:M11 First Quarterly Vintage: 1965:Q4 3. First Observation: 1947:Q1 4.
Fruit and Vegetables: Q1/2013
 20 May 2013 1100 hrs 097/2013 In the first quarter, the reported volume of fresh fruit and vegetables advanced by 19.4 per cent, whereas the wholesale value declined by 11.6 per cent when compared to the
Networkers Business Update. December 2014
 Networkers Business Update December 2014 Agenda Forecast Milk Price Global markets V3 Strategy Growing our share of New Zealand milk Page 2 Forecast Milk Price 110 100 2012/13 2013/14 2014/15 Forecast
ASIA FRANCHISE BUSINESS UNIT (FBU) Siddharth Varma, Managing Director
 Siddharth Varma, Managing Director") ASIA FRANCHISE BUSINESS UNIT (FBU) Siddharth Varma, Managing Director Yum! Asia FBU: Partnering For Growth China = 3,900 units Thailand = 480 units Asia FBU = 4,500+ units Asia FBU Asia FBU: Collection
ASIA FRANCHISE BUSINESS UNIT (FBU) Siddharth Varma, Managing Director Yum! Asia FBU: Partnering For Growth China = 3,900 units Thailand = 480 units Asia FBU = 4,500+ units Asia FBU Asia FBU: Collection
SOME ASPECTS OF FOREIGN TRADE RELATIONS
 SOME ASPECTS OF FOREIGN TRADE RELATIONS OF THE AMUR-OKHOTSK REGION S COUNTRIES MISHINA NATALIAV. Pacific Institute of Geography, Far Eastern Branch, Russian Academy of Sciences Present-day transformation
Germany is the largest importer of cheese and UK and Italy are the second- and third-largest importers.
 EXTRACTSFROMTHEREPORT 1.Introduction 1.1. Background The cheese market has been one of the most dynamic food segments in the last 20 year with steady growth in production, consumption and international
FACT SHEET MOLASSES FOR BIOENERGY AND BIO-BASED PRODUCTS
 FACT SHEET MOLASSES FOR BIOENERGY AND BIO-BASED PRODUCTS Brussels, 27 September 2017 WHAT IS MOLASSES? Molasses is a thick, sweet syrup obtained during the manufacture of beet or cane sugar. Molasses contains
Growing divergence between Arabica and Robusta exports
 Growing divergence between Arabica and Robusta exports In April 218, the ICO composite indicator decreased by.4% to an average of 112.56, with the daily price ranging between 11.49 and 114.73. Prices for
WEEKLY OILSEED REPORT 27 JUNE 2018
 WEEKLY OILSEED REPORT 27 JUNE 218 Unigrain (Pty) Ltd Tel. No. : +27 11 692 44 Fax. No. : +27 11 412 1183 INTERNATIONAL MARKET Table 1: CME Soybean prices and weekly change (cents/bushel) Currently 2/6/218
Brazil Milk Cow Numbers and Milk Production per Cow,
 TABLE OF CONTENTS 1. Brazil 1.1. Brazil Milk Market Introduction 1.1.1. Brazil Cow Milk Market Production and Fluid Milk Consumption by Volume, 1.1.2. Brazil Milk Cow Numbers and Milk Production per Cow,
The directors report in
 The directors report in The directors' report in the the spotlight spotlight An An English English summary summary of the of Dutch the Dutch publication: Het publication: bestuursverslag Het in bestuursverslag
WEEKLY OILSEED REPORT 22 NOVEMBER 2018
 WEEKLY OILSEED REPORT 22 NOVEMBER 2018 Unigrain (Pty) Ltd Tel. No. : +27 11 692 4400 Fax. No. : +27 11 412 1183 INTERNATIONAL MARKET Table 1: CME Soybean prices and weekly change (cents/bushel) Currently
CRISIS IN THE INDIAN SUGAR INDUSTRY: INDIAN SUGAR MILLS ASSOCIATION
 CRISIS IN THE INDIAN SUGAR INDUSTRY: INDIAN SUGAR MILLS ASSOCIATION Indian sugar industry: contribution to the economy 2 5 crore farmers and their families directly dependent Rs.65,000 crore of cane price
MONTHLY REPORTS PULSES JUNE - JULY 2016
 MONTHLY REPORTS PULSES Monthly Prices Movement Pulses prices overall remained firm throughout the month amid expectation of lower output, delayed Monsoon despite strict government measures to control price
GENERAL DESCRIPTION OF INDUSTRY AND COMPANY
 Appendix G Appendix Sample G: Import Business Business Plan: Otoro Plan: Import Company Otoro Import Company EXECUTIVE SUMMARY Otoro Imports is a spice importing and marketing corporation established in
The Contribution made by Beer to the European Economy. Czech Republic - January 2016
 The Contribution made by Beer to the European Economy Czech Republic - January 2016 Europe Economics is registered in England No. 3477100. Registered offices at Chancery House, 53-64 Chancery Lane, London
Seasonal trends in hectares planted, sales volumes on markets and market prices. Pieter van Zyl, Potatoes South Africa
 Seasonal trends in hectares planted, sales volumes on markets and market prices Pieter van Zyl, Potatoes South Africa Producers plant between 5 and 54 hectares of potatoes each year. According to Figure
Thailand Packaging Machinery Market. Jorge Izquierdo VP Market Development PMMI
 Thailand Packaging Machinery Market Jorge Izquierdo VP Market Development PMMI jizquierdo@pmmi.org www.pmmi.org/global www.pmmi.org/research Today General Economic and Political Highlights Current Packaging
Markets and Economic Research Centre
 Markets and Economic Research Centre Food Price Monitor November Issue/2016 MEDIA RELEASE FOOD PRICE MONITOR: Nov 2016 EXECUTIVE SUMMARY In October 2016, the Consumer Price Index (CPI) released by Statistics
Dairy Market. June 2016
 Dairy Market Dairy Management Inc. R E P O R T Volume 19 No. 6 June 2016 DMI NMPF Overview U.S. milk production was 1.2 percent higher in April than a year earlier, interrupting the pattern of the three
Eden Valley Wine Region. Regional summary report WINEGRAPE UTILISATION AND PRICING SURVEY 2007
 Eden Valley Wine Region Regional summary report 2007 WINEGRAPE UTILISATION AND PRICING SURVEY 2007 57 58 Eden Valley Vintage overview Vintage report Average winter rainfall for the Eden Valley region is
Fungicides for phoma control in winter oilseed rape
 October 2016 Fungicides for phoma control in winter oilseed rape Summary of AHDB Cereals & Oilseeds fungicide project 2010-2014 (RD-2007-3457) and 2015-2016 (214-0006) While the Agriculture and Horticulture
Economics Higher level Paper 2
 Economics Higher level Paper 2 Wednesday 4 November 2015 (morning) 1 hour 30 minutes Instructions to candidates ydo not open this examination paper until instructed to do so. yyou are not permitted access
United Nations Conference on Trade and Development
 United Nations Conference on Trade and Development 10th MULTI-YEAR EXPERT MEETING ON COMMODITIES AND DEVELOPMENT 25-26 April 2018, Geneva Cocoa Boom & Bust: A Review of Cocoa Market Developments By Laurent
Milk and Milk Products. Price and Trade Update: October
 October Milk and Milk Products Price and Trade Update Weekly Newsletter Milk and Milk Products Price and Trade Update: October 1 INTERNATIONAL PRICES: Weak import demand causes prices to fall International
Global Foodservice Equipment Market: Industry Analysis & Outlook ( )
") Industry Research by Koncept Analytics Global Foodservice Equipment Market: Industry Analysis & Outlook ----------------------------------------- (2017-2021) September 2017 1 Executive Summary The foodservice
Industry Research by Koncept Analytics Global Foodservice Equipment Market: Industry Analysis & Outlook ----------------------------------------- (2017-2021) September 2017 1 Executive Summary The foodservice
World coffee consumption increases but prices still low
 World coffee consumption increases but prices still low The coffee market stabilised slightly in February, but prices remain at very low levels. A lack of news regarding fundamentals with expectations
WEEKLY MAIZE REPORT 06 FEBRUARY 2019
 WEEKLY MAIZE REPORT 06 FEBRUARY 2019 Unigrain (Pty) Ltd Tel. No. : +27 11 692 4400 Fax. No. : +27 11 412 1183 INTERNATIONAL MARKET Table 1: CME Maize prices and weekly changes (cents/bushel) Currently
ICC September 2018 Original: English. Emerging coffee markets: South and East Asia
 ICC 122-6 7 September 2018 Original: English E International Coffee Council 122 st Session 17 21 September 2018 London, UK Emerging coffee markets: South and East Asia Background 1. In accordance with
Dairy Market. May 2017
 Dairy Market Dairy Management Inc. R E P O R T Volume 20 No. 4 May 2017 DMI NMPF Overview The rate of milk production growth began to moderate during the first quarter, but additional milk production continues
Red wine consumption in the new world and the old world
 Red wine consumption in the new world and the old world World red wine market is expanding. In 2012, the total red wine trade was over 32 billion dollar,most current research on wine focus on the Old World:
Dairy Market R E P O R T
 Volume 17 No. 5 Dairy Market R E P O R T May 2014 DMI NMPF Overview Many key milk and dairy product prices continued to set records in April. And while the dairy futures markets indicate that prices will
FACTORS DETERMINING UNITED STATES IMPORTS OF COFFEE
 12 November 1953 FACTORS DETERMINING UNITED STATES IMPORTS OF COFFEE The present paper is the first in a series which will offer analyses of the factors that account for the imports into the United States
TURKEY ICAC RESEARCH ASSOCIATE PROGRAM 6-16 APRIL 2009 WASHINGTON D.C./USA SOME FACTS ABOUT SOME FACTS ABOUT SOME FACTS ABOUT
 ICAC RESEARCH ASSOCIATE PROGRAM TURKEY - Geographically, Turkey straddles two continents, Europe in the west and Asia in the east. - The two continents are divided by Istanbul and Dardanelles straits.
Dairy Market R E P O R T
 Volume 18 No. 8 Dairy Market R E P O R T August 2015 DMI NMPF Overview Milk prices in many major milk-producing countries have plummeted to levels that are producing severe financial stress for their farmers.
LETTER FROM THE EXECUTIVE DIRECTOR
 E LETTER FROM THE EXECUTIVE DIRECTOR COFFEE MARKET REPORT December 2008 Price levels in December confirmed the downward trend recorded in the coffee market since September 2008. The monthly average of