Appendix. Credit: FARMERS GUARDIAN please contact
|
|
|
- Dorothy Russell
- 6 years ago
- Views:
Transcription

1 Appendix Credit: FARMERS GUARDIAN please contact
2 Appendix Table of Contents American Malting Barley Association Prospective Planting Report Application of Biotechnology to Barley Variety Development By Mike Davis American Malting Barley Association Beer Institute Beer Industry Economic Impact in Montana Beer Production and Malt Consumption by State The Big Picture of Small Brewers by Charlie Papazian Contacts Referenced The Economic Contribution of Craft Brewing in Montana Economic Significance of Barley The Future of Malting Barley in North America, Keeping Barley Competitive With Other Crops IBS World Industry Report Malt Production in the US Industrial/ Commercial Malting Companies websites Know Your 2013 Malting Barley Varieties List of Montana Brewers and Contact Information Montana Barley for Malt 2012 Marketing Year, USDA Montana Barley Varieties 2013 Total U.S. Beer Industry, Major Brewers & Importers USDA Barley States- Barley Price Useful Links and Articles

3 American Malting Barley Association, Inc. GLEANINGS March 31, 2014 PROSPECTIVE PLANTINGS REPORT Producers intend to seed 3.17 million acres of barley for the 2014 crop year, down 9 percent from the previous year. If realized, this will be the third smallest seeded area on record. State 2014 Prospective Barley Planting Summary Planted 2011 Planted 2012 (Acres) Planted 2013 Indicated for Planting 2014 Ind. Planting 2014 as a % of 2013 Minnesota 70, ,000 90, , % North Dakota 400,000 1,060, , ,000 86% South Dakota 25,000 34,000 34,000 30,000 88% Three States 495,000 1,209, , ,000 88% California 100, ,000 90,000 95, % Colorado 66,000 58,000 63,000 64, % Idaho 520, , , , % Montana 700, , , ,000 91% Oregon 38,000 56,000 63,000 45,000 71% Washington 125, , , ,000 67% Wyoming 75,000 75,000 80,000 80, % Seven States 1,624,000 2,004,000 2,111,000 1,974,000 94% Other 440, , , ,000 85% Total U.S. 2,559,000 3,637,000 3,480,000 3,165,000 91% Source: UDSA/NASS/Agriculture Statistics Board, March 31, 2014 Prospective Plantings Report. 740 North Plankinton Avenue, Suite 830 / Milwaukee, WI / (414) / Fax: (414) /
4 Page 2 March 31, 2014 State 2014 Prospective Barley Plantings All States Planted 2011 Planted 2012 Planted 2013 (Acres) Indicated for Planting 2014 Ind. Planting 2014 as a % of 2013 Arizona 65,000 48,000 75,000 45,000 60% California 100, ,000 90,000 95, % Colorado 66,000 58,000 63,000 64, % Delaware 35,000 38,000 43,000 30,000 70% Idaho 520, , , , % Kansas 9,000 10,000 17,000 10,000 59% Maine 16,000 17,000 20,000 15,000 75% Maryland 50,000 60,000 75,000 60,000 80% Michigan 10,000 11,000 10,000 10, % Minnesota 70, ,000 90, , % Montana 700, , , ,000 91% New York 10,000 10,000 11,000 12, % North Carolina 22,000 23,000 19,000 20, % North Dakota 400,000 1,060, , ,000 86% Oregon 38,000 56,000 63,000 45,000 71% Pennsylvania 65,000 65,000 75,000 70,000 93% South Dakota 25,000 34,000 34,000 30,000 88% Utah 35,000 44,000 40,000 48, % Virginia 90,000 65,000 67,000 58,000 87% Washington 125, , , ,000 67% Wisconsin 33,000 33,000 33,000 33, % Wyoming 75,000 75,000 80,000 80, % Total U.S. 2,559,000 3,637,000 3,480,000 3,165,000 91% Source: UDSA/NASS/Agriculture Statistics Board, March 31, 2014 Prospective Plantings Report.


5
6 Million Acres US Barley Acreage
7 14.0 Canadian Barley Acreage


8 US Barley Use % Malting 57.3% 51.1% Feed 30.7% 22.7% Exports 4.6% 3.1% Seed 3.8% 1.3% Food 3.6% Malting Feed Exports Seed Food

9 US Barley Production & Malt Use CO, ID, MN, MT, ND, WY Total Malting Use
10 Why Has Barley Acreage Declined? Static domestic malt use, limited barley & malt exports Decline in use for feed = primary secondary use Competition from abundant supplies of corn and dried distillers grain (DDGs) Static & limited food use although has FDA Healthy Heart Claim USDA Barley Health Benefits Project AMBA/NBIC lobbying High risk crop many chances for failure in making malting grade Good return as malting, low or no return as feed Risks: Fusarium head blight (scab), other diseases, drought & heat stress, quality requirements Competition with other crops GROWERS HAVE OTHER OPTIONS Corn, soybeans, canola = large and growing markets Substantial investment by biotech seed companies, including GM variety development, in these crops and now wheat
11 Expenditures: Crop Protection and Seeds and Traits Bayer, Syngenta, BASF, DOW and DuPont were the firms that spent the most on Crop Protection R&D. Monsanto dominates the seeds and traits sector Comparative R&D Expenditures Wheat about 70c/acre/year GM Row crops: $10/acre/year Expenditures in billions Bayer CropScience Dow DuPont Monsanto Syngenta Seeds and traits Crop protection Slide courtesy Dr. Bill Wilson, NDSU
12 Why Has Barley Acreage Declined? Biotech Crops with improved traits, including GM, have pushed barley out of higher rainfall areas into more marginal, dry ones What happens to barley when it faces competition from GM drought tolerant corn, wheat and other crops that are being developed? Barley research & variety development primarily in public sector State and provincial universities; USDA ARS and Agriculture & Agri Food Canada Limited and declining public sector investment Limited variety development by companies US = Two brewers, one maltster, one private sector company all traditional breeding minor part of their business, driven to meet needs, not profit depend on public sector for other research needs Little or no interest by biotech seed companies in barley Low acreage compared to other major crops Substantial cost to commercialize a GM variety
13 Discovery, Development and Deregulation Category Discovery Costs of a GM Trait Cost ($ million) Number of responses Early discovery Late discovery Total cost Construct optimization Commercial event production & selection Introgression breeding and wide area testing Regulatory science Deregulation and regulatory affairs Total $136.0 $105 w/o Discovery Phillips McDougall, September 2011
14 US Malting Barley Variety Development Programs Montana State University North Dakota State University Oregon State University University of California Davis University of Minnesota University of Nebraska USDA-ARS, Aberdeen, ID USDA-ARS, Raleigh, NC Utah State University Virginia Polytech & State University Washington State University AB-InBev Malteurop MillerCoors Limagrain AMBA member Funded by AMBA
15 Other US Malting Barley Research Biochemistry, Genomics, Molecular Biology, Physiology Diseases, Insects, Quality, Management, Variety Trials Programs listed for malting barley variety development plus: Colorado State University Cornell University (NY) Michigan State University North Carolina State University Ohio State University Pennsylvania State University Texas A&M University University of Idaho University of Maryland University of Vermont University of Wisconsin University of Wyoming USDA ARS, Fargo, ND USDA ARS, Madison, WI USDA ARS, Manhattan, KS USDA ARS, Pullman, WA USDA ARS, Stillwater, OK USDA ARS, St. Paul, MN AMBA funding
16 Canadian Malting Barley Variety Development Programs Primary AAFC, Brandon, MB University of Saskatchewan Alberta Agriculture and Rural Development Secondary Sapporo Breweries Ltd. Syngenta US Varieties are entered into Canadian testing system for potential registration and production Brewing & Malting Barley Research Institute (BMBRI) AMBA s Canadian Counterpart
17 GM Barley? Current Status & Considerations Experimental GM barley lines have been developed Lines with various genes for resistance to Fusarium head blight (scab) USDA-ARS US Wheat & Barley Scab Initiative funded researchers High beta-glucanase lines to improve chicken feed Washington State University None commercialized GM lines grown in hydroponic cultivation in geothermal greenhouses in Iceland for commercial production of pure proteins for research (Cell Sciences) No commercial field production of GM barley Strong support for development of GM barley by barley grower organizations - Growers are experienced in growing GM crops and feel GM barley is needed to keep barley competitive with other crops
18 GM Barley? Current Status & Considerations Growing consumer resistance and concerns about GM Mixed views of malting, brewing, distilling, and food end-users Strongly opposed - to neutral - to supportive Thus no clear signal to biotech seed companies to pursue Developmental costs of GM barley too high to recover investment Low acreage compared to major crops and thus limited seed sale potential A unique trait, with exclusive IP rights, and substantial economic benefits (e.g. drought tolerance, major disease resistance) that could be used worldwide, may provide viable market
19 American Malting Barley Association Biotechnology Policy Statement Prior to June, 2009 The American Malting Barley Association, Inc. (AMBA) provides funding for basic barley research in plant physiology, biochemistry and fundamental genomics as well as for more applied research in barley variety development. In addition, AMBA is involved in various federal programs funding barley biotechnology research to ensure access to current science and to keep barley competitive with other crops. At this time, there are no commercially available GM barley varieties in North America. AMBA is opposed to the commercial release of GM barley varieties. JUNE, The American Malting Barley Association, Inc. (AMBA) provides funding for basic barley research in plant physiology, biochemistry and fundamental genomics as well as for more applied research in barley variety development. In addition, AMBA is supportive of various federal and state programs funding barley biotechnology research to ensure scientific advancement and to keep barley competitive with other crops.
20 GM Barley Conclusions No commercial GM barley expected in foreseeable future Cost of commercialization precludes public sector university or federal research agency commercialization Would require Biotech seed company to commercialize none appear interested at this time If work was initiated now, and gene discovery & construction, gene transfer, and utility already demonstrated, it would still take an estimated 10 years+ to complete the process to a commercially approved GM barley
21 GM WHEAT Strong grower support combined with change of view of many end-users (e.g. millers, bakers, food companies) from opposition to support due to concerns about declining wheat acreage and competition with GM crops Accordingly, biotech seed companies are now working on wheat, often in collaboration with the public sector universities that have the varieties needed for gene trait introgression Current estimate for first commercial GM wheat = 6 Years Considerations for malting, brewing, and distilling industries Production of wheat products if you want to be non-gm Comingling of GM wheat with non-gm barley Most barley farmers also grown wheat Wheat & barley grown in same area move through same elevator & transportation systems
22 Barley Biotechnology Tool Box X - No GM variety development Targeted genetic improvements without being transgenic (GM) Induce base pair gene changes by the plant not through gene transformation technology Rapid Trait Development system (RTDS) - Cibus (considered mutagenesis technology by USDA) Doubled Haploid (DH) Barley Line Development Rapid development of genetically homozygous varieties
23 Barley Biotechnology Toolbox Gene tracking Technology (genotyping) Initial methodology = one gene Current technology = tens of thousands of genes at one time Current major genotyping technology Based on Single Nucletotide Polymorphisms (SNPs) Illumina BeadXpress system (old) Illumina iselect system (new) Exome capture sequencing Next generation technology for genotyping Genotyping by Sequencing (GBS) Gene tracking applications Marker Assisted Selection (MAS) Track introgression of one or a few genes Genomic Selection (GS) Track thousands of genes to develop lines with desired agronomic & quality traits
24 Barley Biotechnology Challenge $$$ - Most all funding from limited public sector sources vs billions being invested by biotech seed companies in other crops State universities & USDA-ARS research locations USDA-ARS Small Grains Genotyping Laboratories (4) Fargo, ND; Manhattan, KS; Raleigh, NC; Pullman, WA Created through earmarks AMBA/NBIC & wheat stakeholder lobbying USDA-ARS US Wheat & Barley Scab Initiative grant program USDA-NIFA Agriculture & Food Research Initiative (AFRI) Competitive Grant Program Grants to individual scientists Large grants to multi-researcher, discipline, and institution coordinated projects Triticeae (barley & wheat) Agricultural Coordinated Project (TCAP) $25 million ($5M/year):


25 Triticeae-CAP: improving barley & wheat germplasm for changing environments PIs Jorge Dubcovsky UC Davis and Gary Muehlbauer University of Minnesota 56 funded participants, 28 institutions, 21 states Project direction Database, web resources & tools Genotyping labs Education coordination Wheat and barley National Small Grain Collection Industry liaison coordination

26 Traits Disease resistance Stem and stripe rust Spot blotch, spot-form net blotch and leaf scald Low temperature tolerance Water and Nitrogen use efficiency, yield, agronomic traits
27 Outline of TCAP work flow Genotyping OPA platforms iselect platform 384-custom platform GBS Exome capture sequencing Germplasm MAS NSGC Collections NAM populations Wild barley introgression population Data management Triticeae Toolbox (T3) Data analysis GWAS QTL mapping GS Barley and wheat improvement Elite AM panels Gene cloning Phenotyping Yield Disease resistances NUE, WUE LTT
28 Keeping Barley Competitive With Other Crops Barley biotechnology research in of itself is not enough to keep barley competitive with biotech seed crops Coordinated research in many disciples is needed Breeding, genetics, molecular biology, biochemistry, physiology, pathology, management Adequate & effective national public sector barley research infrastructure Stakeholder funding, direction, and collaboration American Malting Barley Association (AMBA) Brewing & Malting Barley Research Institute (BMBRI, Canada) Brewers Association (BA) Individual malting & brewing companies State barley grower organizations
29 AMBA National Coordinator of US Malting Barley Research Facilities Funding AMBA, BA Federal, State, Growers, Brewers, Maltsters Adequate & Effective National Public Sector Barley Research Infrastructure Personnel Direction AMBA lobbies Congress, Federal Agencies, and State Universities to positively impact all these research infrastructure components AMBA also lobbies with barley growers for favorable federal farm program provisions (e.g. crop insurance)
30 American Malting Barley Association, Inc. (Founded in 1938 as the Malt Research Institute) MISSION: The primary purpose of AMBA is to encourage and support an adequate supply of high quality malting barley for the malting, brewing, distilling and food industries and increase our understanding of malting barley. VISION: To be the leader in improvement, development, and understanding of malting barley in the US. PRIMARY OBJECTIVE: Develop six-row and two-row malting barley varieties broadly adapted for the barley production areas of North America with suitable agronomic, malting, and brewing performance.
31 American Malting Barley Association, Inc. REGULAR MEMBERS (21) AB-InBev Bell s Brewery Boston Beer Briess Malt & Ingredients Brooklyn Brewery Brown-Forman Cargill Malt Craft Brew Alliance Deschutes Brewery Dogfish Head Craft Brewery Gambrinus Company Great Western Malting InteGrow Malt Malteurop MillerCoors New Belgium Brewing New Glarus Brewing Rahr Malting Schell s Brewing Sierra Nevada Brewing Summit Brewing
32 American Malting Barley Association, Inc. ASSOCIATE MEMBERS (40) Abita Brewing Alaskan Brewing Allagash Brewing Anchor Brewing Avery Brewing Bear Republic Brewing Blacklands Malt Boulevard Brewing Cold Spring Brewing Corsair Artisan Distillery Farm Boy Farms Firestone Walker Brewing Flying Dog Brewery Founders Brewing Full Sail Brewing Harpoon Brewery Langunitas Brewing Lakefront Brewery Left Hand Brewing Leopold Bros Distillery
33 American Malting Barley Association, Inc. ASSOCIATE MEMBERS (40) Long Trail Brewing Lost Coast Brewery Malterie Frontenac Matt Brewing Odell Brewing Oskar Blues Brewery Rahr & Sons Brewing Real Ale Brewing Rogue Ales Russian River Brewing Saint Arnold Brewing Schlafly Beer Smuttynose Brewing Storz Brewing Stone Brewing Troegs Brewing Urban Chestnut Brewing Valley Malt Victory Brewing Wachusett Brewing


34 Beer Industry Economic Impact in Montana National Economic Impact In 2012, the U.S. beer industry s total economic impact stood at more than $246.5 billion. It directly and indirectly employs more than 2 million Americans, paying $78.9 billion in wages and benefits. Of the 2 million American employees, more than 1 million are directly employed by brewers, importers, distributors and retailers. Beer Industry Direct and Total Economic Contribution in Montana Direct Economic Impact Brewing Distributing Retail Total Jobs Wages Economic Contribution 220 $4,526,700 $50,528, ,010 5,060 $32,533,400 $77,852,000 $114,912,100 $73,355,200 $161,531,500 $285,414,900 The majority of hard-working men and women directly employed by the brewers, importers and beer distributors receive good wages and company-provided benefits, including healthcare. Beer sales also contribute to the profitability of more than 576,000 licensed retail outlets in the U.S. The industry contributed $49 billion in business, personal and consumption taxes, including excise taxes and sales, gross receipts and other taxes. Industry-Related Jobs (by thousands) Agriculture Business and Personal Services Construction 40 Finance Insurance and Real Estate 460 Manufacturing General Retail 340 Transportation and Communication 230 Travel and Entertainment 410 Wholesale 130 Other 200 Total: 3,470 Taxes Paid Federal Excise $17,329,100 State Excise $4,209,200 Other State/Local $0 Total $21,538,300 Taxes Generated Federal $54,962,200 State/Local $43,646,400 Total $98,608,600 Establishments Brewing 38 Distributing 44 Retail 3,246 Total Economic Impact jobs 8,530 wages $219,846,300 contribution $655,941,300


35 Beer Serves America Brewers, importers, beer distributors, and retailers are proud to serve America through economic contributions, responsibility initiatives, and community involvement. Responsibility Brewers, beer importers and distributors share a longstanding commitment to help ensure that their products are enjoyed responsibly. The American beer industry has more than 130 different alcohol awareness and education programs designed to help prevent alcohol abuse, including underage drinking and drunk driving. Government statistics show drunk driving and underage drinking have declined over the past three decades. For example, the 2012 Monitoring the Future study reports declining drinking rates among 8 th, 10 th and 12 th graders. And 2011 drunk-driving declined to a record-low level, down 53 percent since first measured in The number of fatalities from drunk driving also continues to decline. Community Involvement The beer industry initiates and supports numerous alcohol awareness and education efforts, recycling programs and philanthropy programs. The industry is also committed to preserving and protecting the environment. America s beer distributors have begun to use alternative fuels in their delivery trucks and renewable energy in their warehouses. Brewers and suppliers use aluminum beverage cans and promote aluminum and glass recycling programs. Today, they are implementing innovations to significantly reduce the amount of water and energy needed to produce and package beer. These are just some of the many beer industry initiatives to enhance sustainability in communities across the nation. 122 C Street, NW, Suite 350 Washington, DC King Street, Suite 600 Alexandria, VA
36 State Craft Beer Production (Barrels) Malt Consumption (pounds) Malt Consumption (Short Tons) Specialty Malt (pounds) Specialty Malt (Short Tons) Spent on pale malt Spent on specialty malt California 2,453, ,773,787 72,387 21,716,068 10,858 $43,070,202 $17,372,854 Pennsylvania 1,626,116 95,940,844 47,970 14,391,127 7,196 $28,542,401 $11,512,901 Colorado 1,291,771 76,214,489 38,107 11,432,173 5,716 $22,673,810 $9,145,739 Ohio 980,969 57,877,171 28,939 8,681,576 4,341 $17,218,458 $6,945,261 Oregon 764,226 45,089,334 22,545 6,763,400 3,382 $13,414,077 $5,410,720 New York 724,984 42,774,056 21,387 6,416,108 3,208 $12,725,282 $5,132,887 Texas 713,712 42,109,008 21,055 6,316,351 3,158 $12,527,430 $5,053,081 New Hampshire 588,111 34,698,549 17,349 5,204,782 2,602 $10,322,818 $4,163,826 Michigan 438,383 25,864,597 12,932 3,879,690 1,940 $7,694,718 $3,103,752 Wisconsin 398,811 23,529,849 11,765 3,529,477 1,765 $7,000,130 $2,823,582 Minnesota 308,370 18,193,830 9,097 2,729,075 1,365 $5,412,664 $2,183,260 Massachusetts 291,206 17,181,154 8,591 2,577,173 1,289 $5,111,393 $2,061,738 Washington 291,107 17,175,313 8,588 2,576,297 1,288 $5,109,656 $2,061,038 Missouri 268,003 15,812,177 7,906 2,371,827 1,186 $4,704,123 $1,897,461 Maine 249,158 14,700,322 7,350 2,205,048 1,103 $4,373,346 $1,764,039 Vermont 204,693 12,076,887 6,038 1,811, $3,592,874 $1,449,226 Delaware 180,794 10,666,846 5,333 1,600, $3,173,387 $1,280,022 Alaska 170,610 10,065,990 5,033 1,509, $2,994,632 $1,207,919 Louisiana 169,484 9,999,556 5,000 1,499, $2,974,868 $1,199,947 North Carolina 159,033 9,382,947 4,691 1,407, $2,791,427 $1,125,954 Maryland 154,650 9,124,350 4,562 1,368, $2,714,494 $1,094,922 Georgia 153,218 9,039,862 4,520 1,355, $2,689,359 $1,084,783 Montana 118,528 7,000,000 3,500 1,050, $2,082,500 $840,000 Utah 110,025 6,491,475 3, , $1,931,214 $778,977 Arizona 93,103 5,493,077 2, , $1,634,190 $659,169 Florida 92,512 5,458,208 2, , $1,623,817 $654,985 Illinois 87,993 5,191,587 2, , $1,544,497 $622,990 Indiana 87,321 5,151,939 2, , $1,532,702 $618,233 Virginia 84,059 4,959,481 2, , $1,475,446 $595,138 Tennessee 54,077 3,190,543 1, , $949,187 $382,865 New Mexico 48,213 2,844,567 1, , $846,259 $341,348 Nevada 45,761 2,699,899 1, , $803,220 $323,988 Connecticut 40,947 2,415,873 1, , $718,722 $289,905 New Jersey 37,468 2,210,612 1, , $657,657 $265,273 Kentucky 36,532 2,155,388 1, , $641,228 $258,647 South Carolina 34,496 2,035,264 1, , $605,491 $244,232 Idaho 31,000 1,829, , $544,128 $219,480 Hawaii 27,906 1,646, , $489,820 $197,574 Kansas 27,063 1,596, , $475,023 $191,606 Iowa 21,754 1,283, , $381,837 $154,018 Nebraska 21,228 1,252, , $372,604 $150,294 Oklahoma 16, , , $282,999 $114,151 Mississippi 14, , , $256,073 $103,290 Wyoming 14, , , $245,735 $99,120 Alabama 7, , , $127,677 $51,500 Arkansas 5, , , $98,979 $39,924 South Dakota 3, , , $69,052 $27,853 West Virginia 3, , , $65,857 $26,564 North Dakota , ,593 4 $15,060 $6,075 Total 13,747, ,100, , ,665,137 60,833 $241,302,521 $97,332,109

37 By Charlie Papazian COMMENTARY DEPARTMENT The Big Picture of Small Brewers By the time you read this, the number of brick and mortar breweries in the U.S. will probably surpass 2,700. That s a wow number for sure, and in the minds of everyone who assesses this indicator there are thousands of ways to imagine what it means now and for the future. Earlier this year I received an invitation from Sen. Max Baucus (D-Mont), chair of the Senate Committee on Finance, to participate in the Economic Development Summit in Montana in mid-september. I accepted the opportunity to lead a panel discussion titled Exploring Growth in Montana s Craft Beer Industry. With the help of the Senator s staff and Montana Brewers Association executive director Tony Herbert, we put together a panel that included Jim Devine of Wibaux s Beaver Creek Brewery, Max Pigman from Helena s Lewis and Clark Brewing Company, and Neal Leathers from Missoula s Big Sky Brewing Company. Also invited to participate were Ed Brandt of Bozeman s Cardinal Distributing (Anheuser-Busch In- Bev, MillerCoors, and craft house) and Mark Black, field manager for Malteurop s Great Falls malthouse. Here is a snapshot of my introduction of the panel. I ve been at this Association business since For 35 years, every year I hear soothsayers warn that small brewing is doomed to failure, collapse, or has a gnat s ass chance of succeeding. One of these years they ll get it right and they ll gloat and tell us, I told you so. Meanwhile There are many reasons small businesses fail. Most of them have to do with the management, or rather mismanagement, of growth, employees/people/workplace, cash, debt, expectations, quality, customer loyalty, Montana Brewers Association executive director Tony Herbert and Charlie Papazian. and relations. This is the case for small brewers as well as all small companies. But the odds for small breweries succeeding as a business are much better than your average small business. Why? My thoughts on this aren t new. One of the most important reasons is the development of a craft beer and brewers community. The collaborative spirit of the American small brewing community is the envy of the entire world of small brewers. Nowhere else in the world does the competitive spirit of the marketplace co-exist so positively with the Nowhere else in the world do you see marketing directors from different breweries discussing strategies and tactics together in a panel discussion. communal spirit of concern for others. For the vast majority of small breweries, there is a spirit of collaboration, helpfulness, assistance, sharing of wisdom, and concern for quality and presentation. This spirit is admired abroad but does not exist to the extent it does in the U.S. Nowhere else in the world do you see marketing directors from different breweries discussing strategies and tactics together in a panel discussion. Nowhere else in the world are brewers as welcome in competing breweries. Small, but Big Enough The differences in economies of scale between the 100-million-barrel international brewing corporations and small brewers are so immense as to be incomprehensible. If individual small companies were adrift with no tangible community to represent their best national and regional interests, small business breweries would be overwhelmed. I have no doubt about this, having observed what has happened to other small business sectors that have been swallowed or compromised; having no collaborative community to help make a stand and lend moral and practical support. Small brewers have developed an effective system of collaboration and communication. At the same time, they remain competitive with each other and have a great deal of respect, awareness, and street smart intelligence of the dynamics of the marketplace s horizontal tier and vertical tier. BrewersAssociation.org The New Brewer November/December

38 master must succeed in addressing dramatic challenges in order to maintain quality and succeed in continued sales of their beer. These challenges cannot be overlooked or minimized. A standing-room-only crowd attended the panel discussion in Montana. By horizontal tier, I mean other breweries large and small with whom small brewers compete. By vertical tier, I mean the incoming supply chain of materials, technology, and services, and the downstream tiers of distribution, retail, and the customer/beer drinker. The Extended Economic Impact American small brewers have created more than 110,000 jobs in the U.S. Beer in America is a $99 billion business. In 2012, American craft brewers produced 6.5 percent of the 200 million barrels of beer enjoyed in the U.S. They generated 10.2 percent of the dollars, or $10.1 billion of the $99 billion. The Montana Brewers Association reports from 2011 data that the state s brewers created (mostly directly) 434 jobs, and breweryrelated output accounted for about $50 million to the Montana economy. But the extended economic impact is far greater than the direct impact consider merchandise manufacturers, mobile cooks at events, T-shirt and merchandise printing, glassware, tap handles, beer snacks, order fulfilling, software development, hardware, vehicles, restaurant success, hop farms, barley farms, harvesting equipment, brewery tour companies, the lunch shop next door, etc. More recent data and assessment by the Brewers Association indicates that Montana s small breweries had a much larger impact. In 2012, the impact was more than $300 million for the state, creating more than 3,500 jobs and generating around $100 million in wages. This impact is calculated by looking at direct contribution of craft brewers, beer distributors, and retail sales. Also included is the indirect supplier and induced impacts of the direct contributions, both in-state and out-of-state influences (for example 70 grain farming jobs in Montana created by craft brewers in other states). Numbers are simply indicators. They do not reveal why small brewers are succeeding. For every brewery location in the U.S., there is a unique set of circumstances that helps brewers set their course. The extent of their success is how well they navigate those circumstances, challenges, and opportunities. Snapshot of Small Brewery Businesses To put things in a more accurate and local perspective, if you take the top 50 small and independent brewers out of the statistics: The average production of an American brewpub is 769 barrels a year. The average production of a small American packaging brewery is 1,704 barrels a year. Principally there are two different kinds of small brewery business models: 1. Breweries that aspire to grow. 2. Breweries that aspire to simply make a living. Every brewery must make the decision at some point: to export or not to export. There are varying degrees of exporting beer: 1. Exporting beer in growlers for takehome enjoyment from the brewery. 2. Exporting a keg out of the brewery to the restaurant or bar across the street. 3. Exporting beer into the immediate community s retail opportunities. 4. Exporting beer to other points within the state. 5. Exporting beer to other states. 6. Exporting beer to other countries. In 2012, American craft brewers exported 189,000 barrels of beer outside of the U.S. That represented $94.5 million and about 75-percent growth over Whether a brewery exports their beer across the street or to another continent, both the brewing company and the brew- Brand Development Almost all breweries export to some degree. The importance of brand development is important. There are several kinds of brands that are important to develop: 1. The brewing company s own brand. 2. The town/city brand (I ve often heard that Missoula is the craft beer center of Montana, for example.) 3 The brand of Montana beer and Montana craft brewers brewed in Montana. 4. The brand of American craft beer from American craft brewers. Branding is a necessity at all levels. Companies have their own brand strategy. American craft brewers have successfully collaborated to attract regional, state, and national recognition. The development of various brand recognition has an economic impact on city, state, and national tourism; think brewery tours and thematic craft beer tastings. With developed regional pride, other extended businesses are aided: small scale hop farming, barley growing, malting, extended tap handles at retail, packaging, promotion and advertising, and distribution. Revitalizing America Five recent headlines highlight the role craft brewers have in revitalizing Main Street America. 1. Six cities breweries helped transform. (AP) 2. Build a craft brewery, urban revival will come. (USA Today) 3. Craft breweries help transform cities across the country. (Huffington Post) 4. Small Batch Beer Co.: Revitalizing 5th Street, Winston-Salem. (Kickstarter) 5. Oakland: Craft beer trend helps rebuild neighborhoods. (Mercury News) Montana brewers had plenty of their own community revival/transformational stories that they shared with the standingroom-only attendees during the Exploring Growth in Montana s Craft Beer Industry panel discussion. The panel of three brewers, a beer distributor, a malting company, and Herbert continued the discussion, providing unique real-life experiences and insight about how small brewers as small businesses are manufacturing economic development and jobs in their state of Montana. Charlie Papazian is president of the Brewers Association. 8 The New Brewer November/December 2013 BrewersAssociation.org
39 Tony Herbert MBA Contacts Referenced Brad Simshaw, Partner Blackfoot Tim Chisman, Head Brewer/Co-General Manager-Production Blackfoot Collin Waters MT Wheat and Barley Comm. Dave Tweet MT Wheat and Barley Comm. Tom Blake Montana Malting (mini malter) 1214 N. Pinecrest Drve Bozeman, MT Andy Stohlmann Montana Malting (micro malthouse) Howie Moore, Rep Madison River Brewing Madison River Brewing Company Frontage Rd Belgrade, MT Mathew Muth, brewer/owner 406 Brewing 101 East Oak, Suite D Bozeman, MT info@406brewingcompany.com Todd Daniels Montana Manufacturing Extension Center tdaniels@coe.montana.edu
40 Sorenson & Morgan The Economic Contribution of Craft Brewing in Montana that they would prefer to buy more supplies from within Montana, but they were unable to obtain some of their inputs locally. Providing health insurance and other benefits is clearly a high priority for many breweries in the state. Figure 3 shows the number of breweries that offer various benefits to their employees. UM-BBER 4
41 Sorenson & Morgan The Economic Contribution of Craft Brewing in Montana Paid vacation is the most common employee benefit, which is offered by 16 of the breweries in Montana. Health insurance is offered by 12 breweries. The next most common benefit is retirement, followed by dental insurance, life insurance, short-term disability, and long-term disability. While many benefits are not offered at a majority of breweries, the larger and more established breweries tend to offer more comprehensive benefits packages. Therefore, the majority of employees working in the industry are employed at breweries that do offer benefits. For example, of the 320 Montana employees working in the industry in 2011, 78 percent worked at breweries offering health insurance, 65 percent worked at breweries offering retirements benefits, and 57 percent worked at breweries offering dental insurance. However, the survey did not identify the number of employees receiving benefits at each brewery, and it should be noted that not all employees at breweries that offer benefits work enough hours to qualify for benefits. Other benefits offered at breweries include funds for health savings accounts, ski passes, cell phones, merchandise discounts, and flexible work schedules. Economic Impact Results Results from the REMI economic impact simulation are summarized in Table 2. This study finds that because the craft brewing industry exists in Montana, the state economy is larger and more prosperous. Government revenues are also higher as a result of the industry. Because of the operations of the craft brewing industry: There is an employment impact of 434 jobs across various sectors of the state economy; In addition to the jobs in the manufacturing sector, there are significant impacts in the construction, health care, and retail trade sectors; There are employment and output (private sector sales) impacts throughout the five regions of the state, though they are concentrated in the northwest region; UM-BBER 5
42 Sorenson & Morgan The Economic Contribution of Craft Brewing in Montana Because of the brewing industry, output (private sector sales) is $48.4 million higher than would otherwise be the case; Private non-farm compensation and government compensation are $9.8 and $1.8 million higher, respectively, than they would be without the existence of craft brewing in Montana; Population in the state is 36 people higher than it would be without the Montana craft brewing industry; State government revenues are $1.5 million higher than they would be without the Montana craft brewing industry. UM-BBER 6
43 Sorenson & Morgan The Economic Contribution of Craft Brewing in Montana Impacts by Industry Sector and Montana Region Economic impacts of the brewing industry are spread across several industry sectors and also dispersed across the state. Clearly, the manufacturing sector, which includes the brewing industry, holds the largest share of the employment impacts, as shown in Figure 4. However, the employment impacts of the brewing industry are revealed in several other sectors as well. This includes 29 jobs in state and local government, 24 jobs in construction, 14 jobs in retail trade, 10 jobs in health care, and 38 additional jobs in other sectors. Output impacts (Fig 5.), measured by private sector gross sales total $48.4 million, $39.5 million of which can be attributed to the manufacturing industry. UM-BBER 7
44 Sorenson & Morgan The Economic Contribution of Craft Brewing in Montana While concentrated in the more populous regions of the state, economic impacts due to craft brewing extend into each region of the state. For the purpose of the analysis, impacts were split into five Montana regions (Figure 6). As of the end of calendar year 2011, there were 12 breweries in northwest Montana, seven in southwest Montana, four in north central Montana, eight in south central Montana, and two in eastern Montana. Figures 7 and 8 show output and the employment impacts by region, respectively. UM-BBER 8
45 Sorenson & Morgan The Economic Contribution of Craft Brewing in Montana UM-BBER 9
46 Sorenson & Morgan The Economic Contribution of Craft Brewing in Montana Conclusion Based on the data collected from Montana breweries, the industry grew rapidly from 2010 to Production rose 18 percent, sales were up 20 percent, employment (both full- and part-time) was up 39 percent, compensation increased 23 percent, and expenditures were up 21 percent. Operations of craft brewers produce a significant impact on the state economy. More than 430 jobs, nearly $50 million in private sector sales, $9.8 million in private non-farm compensation, $1.8 million in government compensation, and $1.5 million in state government revenues exist in the economy due to craft brewing operations in Montana. Jobs are spread across a wide spectrum of the economy, and impacts recur every year the brewing industry operates. UM-BBER 10
47 Sorenson & Morgan The Economic Contribution of Craft Brewing in Montana This work has developed a baseline economic impact of the brewing industry on Montana s economy. In the future, additional research could be conducted to monitor changes in the economic impact of the industry over time. Furthermore, the effects of legislative changes could be modeled to inform policymakers on the impact of changing legislation on the Montana economy. UM-BBER 11
48 Sorenson & Morgan The Economic Contribution of Craft Brewing in Montana Appendix Montana Brewing Survey Montana Brewing Economic Impact Study The Montana Brewers Association has commissioned a study on the economic contribution of brewing in the state of Montana. The study is being conducted by the Bureau of Business and Economic Research (BBER) of the School of Business Administration at The University of Montana. To be able to estimate the commercial craft brewing industry s economic impact in Montana, the BBER needs to ask a few questions regarding your business income and expenditures. Our goal is 100% participation by Montana brewers. Your participation is appreciated and very important because it will allow us to accurately present the economic impact of the brewing industry in Montana. Individual firm responses will be kept confidential by the BBER and only aggregated results will be presented. Please return survey by Aug 6, 2012 via , fax, telephone, or the post. Note: if you have more than one brewing location, please provide the total for all locations. If you have questions, please contact Colin Sorenson or Todd Morgan at ) Brewery name: 2) Contact person: Title: 3) What was your company s total beer production (barrels)? ) What was the sales value from your beer sales? ) What was the average number of employees who worked for your company? Count as the average number of individuals both full and part-time not FTEs ) What were your total compensation costs (payroll + benefits)? UM-BBER 12
49 Sorenson & Morgan The Economic Contribution of Craft Brewing in Montana 7) What were your company's total expenditures, excluding labor but including vendor purchases and capital costs? ) Please estimate the percentage of your total expenditures, excluding labor, that occurred in Montana. This includes direct purchases from an office or warehouse in Montana, despite where goods were ultimately sourced % 2011 % 9) Does your business offer employees these benefits? Please indicate YES or NO for each. YES NO Health Insurance Dental Insurance Life Insurance Retirement Short-Term Disability Long-Term Disability Paid Vacation Other Please describe other benefits: Thank you for your participation in this important study. All participating Montana brewers will receive a copy of the final report, and we will be presenting the results at the October 7-8, 2012 Montana Brewers Conference in Missoula. UM-BBER 13
50 Ron Uhland Northern Seed LLC 8 West Park St Suite 210 Butte, MT Northernseedllc.com Jon McKee, distiller/owner Headframe Spirits 21 S Montana Street Butte, MT john@headframespirits.com Larry Bonderud, Mayor City of Shelby larry@shelbymt.com Melissa Lewis, Government affairs consultant City of Shelby Melissa@mlewisassoc.com Chris Aageson CTA Seattle chrisa@ctagroup.com x1870 Ken Richardson CTA Missoula Kenr@ctagroup.com Marty Byrnes CTA Great Falls martyb@ctagroup.com
51 The Economic Contribution of Craft Brewing in Montana October 2012 By: Colin B. Sorenson Todd A. Morgan BUREAU OF BUSINESS ECONOMIC RESEARCH AND Prepared for: Montana Brewers Association
52 Introduction The Bureau of Business and Economic Research (BBER) was commissioned by the Montana Brewers Association (MBA) to study the economic contribution of the craft brewing industry, a growing sector of manufacturing activity in Montana. The project involved working with MBA as well as member and nonmember breweries to gather data on production, compensation (wages and salaries plus benefits), expenditures, and other basic operating information for craft breweries in Montana. These data were used in conjunction with an economic impact modeling software package. The research culminated with summarizing and presenting the overall economic impact of craft brewing in the state. The research was designed to answer the question, What does the craft brewing industry contribute to the Montana economy? To begin the analysis, it was critical to obtain accurate data on the income flows that the industry itself produces. The BBER utilized a well-respected economic model, Regional Economic Models, Inc. (REMI), to project the economy with and without brewing industry activities. A nine-question survey was administered during summer 2012 via and phone to all Montana brewers. Data were collected for 2010 and 2011 production, sales, employment, compensation,

53 Sorenson & Morgan The Economic Contribution of Craft Brewing in Montana expenditures, and benefits, with 97 percent of brewers (30 of 31) that were in operation by the end of 2011 responding to the survey 1. Survey data were aggregated and input into REMI by economic region within the state. As depicted in Figure 1, this research compares an economy where the industry never existed in Montana (Alternative) versus the economy with brewing (Baseline). All impacts presented compare a with brewing scenario to a without brewing scenario. The differences between the Baseline and Alternative economies represent the total contribution of the operations of craft brewers to the Montana economy. 1 This does not include 2 breweries that began operating in December 2011, but did not have operational data to report for that month, so they were excluded from the survey data collection process. There were actually 33 breweries in business in Montana by the end of calendar year UM-BBER 2
 to nearly 103,000 bbl from 2010 to 2011 an 18 percent increase.")
54 Sorenson & Morgan The Economic Contribution of Craft Brewing in Montana Survey Data The survey data collected by BBER are presented in Table 1. Production increased from just over 87,000 barrels (bbl) to nearly 103,000 bbl from 2010 to 2011 an 18 percent increase. Beer sales increased from just under $22 million to more than $26 million from 2010 to 2011 a 20 percent increase. Employment, including both full- and part-time jobs, increased from 231 to 320 from 2010 to 2011 a 39 percent increase. Compensation (wages and salaries plus the value of benefits packages) increased from $5.2 million to $6.4 million from 2010 to 2011 a 23 percent increase. Expenditures (excluding labor) increased from $15.6 million to $18.8 million from 2010 to 2011 a 21 percent overall increase. As shown in Figure 2, brewers were asked what portion of their expenditures, other than employee compensation, occurred in Montana. Overall, expenditures rose by 21 percent, from $15.6 million to $18.8 million. The Montana portion of expenditures rose from $6 million (38 percent of total expenditures) in 2010 to $7.5 million (40 percent of total expenditures) in The percentage of expenditures made within the state varied widely amongst brewers, and brewers reported that anywhere from 2 percent to 90 percent of their expenditures were in Montana. Some brewers noted UM-BBER 3


55 Sorenson & Morgan The Economic Contribution of Craft Brewing in Montana that they would prefer to buy more supplies from within Montana, but they were unable to obtain some of their inputs locally. Providing health insurance and other benefits is clearly a high priority for many breweries in the state. Figure 3 shows the number of breweries that offer various benefits to their employees. UM-BBER 4
56 Sorenson & Morgan The Economic Contribution of Craft Brewing in Montana Paid vacation is the most common employee benefit, which is offered by 16 of the breweries in Montana. Health insurance is offered by 12 breweries. The next most common benefit is retirement, followed by dental insurance, life insurance, short-term disability, and long-term disability. While many benefits are not offered at a majority of breweries, the larger and more established breweries tend to offer more comprehensive benefits packages. Therefore, the majority of employees working in the industry are employed at breweries that do offer benefits. For example, of the 320 Montana employees working in the industry in 2011, 78 percent worked at breweries offering health insurance, 65 percent worked at breweries offering retirements benefits, and 57 percent worked at breweries offering dental insurance. However, the survey did not identify the number of employees receiving benefits at each brewery, and it should be noted that not all employees at breweries that offer benefits work enough hours to qualify for benefits. Other benefits offered at breweries include funds for health savings accounts, ski passes, cell phones, merchandise discounts, and flexible work schedules. Economic Impact Results Results from the REMI economic impact simulation are summarized in Table 2. This study finds that because the craft brewing industry exists in Montana, the state economy is larger and more prosperous. Government revenues are also higher as a result of the industry. Because of the operations of the craft brewing industry: There is an employment impact of 434 jobs across various sectors of the state economy; In addition to the jobs in the manufacturing sector, there are significant impacts in the construction, health care, and retail trade sectors; There are employment and output (private sector sales) impacts throughout the five regions of the state, though they are concentrated in the northwest region; UM-BBER 5

57 Sorenson & Morgan The Economic Contribution of Craft Brewing in Montana Because of the brewing industry, output (private sector sales) is $48.4 million higher than would otherwise be the case; Private non-farm compensation and government compensation are $9.8 and $1.8 million higher, respectively, than they would be without the existence of craft brewing in Montana; Population in the state is 36 people higher than it would be without the Montana craft brewing industry; State government revenues are $1.5 million higher than they would be without the Montana craft brewing industry. UM-BBER 6

58 Sorenson & Morgan The Economic Contribution of Craft Brewing in Montana Impacts by Industry Sector and Montana Region Economic impacts of the brewing industry are spread across several industry sectors and also dispersed across the state. Clearly, the manufacturing sector, which includes the brewing industry, holds the largest share of the employment impacts, as shown in Figure 4. However, the employment impacts of the brewing industry are revealed in several other sectors as well. This includes 29 jobs in state and local government, 24 jobs in construction, 14 jobs in retail trade, 10 jobs in health care, and 38 additional jobs in other sectors. Output impacts (Fig 5.), measured by private sector gross sales total $48.4 million, $39.5 million of which can be attributed to the manufacturing industry. UM-BBER 7
59 Sorenson & Morgan The Economic Contribution of Craft Brewing in Montana While concentrated in the more populous regions of the state, economic impacts due to craft brewing extend into each region of the state. For the purpose of the analysis, impacts were split into five Montana regions (Figure 6). As of the end of calendar year 2011, there were 12 breweries in northwest Montana, seven in southwest Montana, four in north central Montana, eight in south central Montana, and two in eastern Montana. Figures 7 and 8 show output and the employment impacts by region, respectively. UM-BBER 8


60 Sorenson & Morgan The Economic Contribution of Craft Brewing in Montana UM-BBER 9
61 Sorenson & Morgan The Economic Contribution of Craft Brewing in Montana Conclusion Based on the data collected from Montana breweries, the industry grew rapidly from 2010 to Production rose 18 percent, sales were up 20 percent, employment (both full- and part-time) was up 39 percent, compensation increased 23 percent, and expenditures were up 21 percent. Operations of craft brewers produce a significant impact on the state economy. More than 430 jobs, nearly $50 million in private sector sales, $9.8 million in private non-farm compensation, $1.8 million in government compensation, and $1.5 million in state government revenues exist in the economy due to craft brewing operations in Montana. Jobs are spread across a wide spectrum of the economy, and impacts recur every year the brewing industry operates. UM-BBER 10
62 Sorenson & Morgan The Economic Contribution of Craft Brewing in Montana This work has developed a baseline economic impact of the brewing industry on Montana s economy. In the future, additional research could be conducted to monitor changes in the economic impact of the industry over time. Furthermore, the effects of legislative changes could be modeled to inform policymakers on the impact of changing legislation on the Montana economy. UM-BBER 11
63 Sorenson & Morgan The Economic Contribution of Craft Brewing in Montana Appendix Montana Brewing Survey Montana Brewing Economic Impact Study The Montana Brewers Association has commissioned a study on the economic contribution of brewing in the state of Montana. The study is being conducted by the Bureau of Business and Economic Research (BBER) of the School of Business Administration at The University of Montana. To be able to estimate the commercial craft brewing industry s economic impact in Montana, the BBER needs to ask a few questions regarding your business income and expenditures. Our goal is 100% participation by Montana brewers. Your participation is appreciated and very important because it will allow us to accurately present the economic impact of the brewing industry in Montana. Individual firm responses will be kept confidential by the BBER and only aggregated results will be presented. Please return survey by Aug 6, 2012 via , fax, telephone, or the post. Note: if you have more than one brewing location, please provide the total for all locations. If you have questions, please contact Colin Sorenson or Todd Morgan at ) Brewery name: 2) Contact person: Title: 3) What was your company s total beer production (barrels)? ) What was the sales value from your beer sales? ) What was the average number of employees who worked for your company? Count as the average number of individuals both full and part-time not FTEs ) What were your total compensation costs (payroll + benefits)? UM-BBER 12
64 Sorenson & Morgan The Economic Contribution of Craft Brewing in Montana 7) What were your company's total expenditures, excluding labor but including vendor purchases and capital costs? ) Please estimate the percentage of your total expenditures, excluding labor, that occurred in Montana. This includes direct purchases from an office or warehouse in Montana, despite where goods were ultimately sourced % 2011 % 9) Does your business offer employees these benefits? Please indicate YES or NO for each. YES NO Health Insurance Dental Insurance Life Insurance Retirement Short-Term Disability Long-Term Disability Paid Vacation Other Please describe other benefits: Thank you for your participation in this important study. All participating Montana brewers will receive a copy of the final report, and we will be presenting the results at the October 7-8, 2012 Montana Brewers Conference in Missoula. UM-BBER 13


65 ECONOMIC SIGNIFICANCE OF BARLEY One of the strengths of the U.S. economy is its crop production and agricultural based industries. Crop and value-added product exports reduce the unfavorable trade balance and generate new employment, grower income, and federal revenue. Maintenance of U.S. strength in agriculture requires continuing efforts to improve crop productivity and quality. U.S. agricultural production that can supply both domestic demands and can compete in world markets will only be accomplished by strong investments in agricultural research programs. Innovative and competitive research will keep the U.S. at the forefront of the development and implementation of new agricultural technologies. Barley is a significant U.S. crop. Barley production has averaged 218 million bushels per year with an estimated annual value of $785 million as a raw agricultural commodity ( ). Barley producers stimulate the rural economy through the purchase of fertilizer, seed, chemicals, fuel, labor, other supplies and farm equipment. These variable cash expenses averaged $524 million annually ( ). The impact of barley on the U.S. economy is even more significant if the value-added products resulting from its utilization as an animal feed, in malt beverages, and in food products are considered. The economy also benefits from exports which annually average $76 million for barley and its milled products, $229 million for malt and malt extracts, $344 million for beer, and $1.43 billion for whiskey ( ). ANNUAL FEDERAL RESEARCH INVESTMENT BARLEY BALANCE SHEET ANNUAL RETURN ON INVESTMENT $ 12.7 USDA-Agricultural Research Service (ARS)* $ 0.8 Raw agricultural commodity 2.2 USDA-NIFA Triticeae CAP Brewing industry business activity 0.0 Other USDA-NIFA Barley Funding 3.7 Federal excise tax revenue 0.0 Special Research Grants 19.1 Federal income tax NA Formula Funds 2.4 Value-added use as feed $14.9 Million NA Value-added use as food $272.6 Billion *FY2014 CR Funding Level NA: Not Available ECONOMIC CONTRIBUTION OF THE BREWING INDUSTRY Barley is a critical and primary raw material for beer. Without malting barley, there would be no beer. The economic value of the U.S. brewing industry is substantial.
66 BARLEY: ECONOMIC SIGNIFICANCE BY STATE Economic Contribution of the Brewing Industry 2 Annual 1 Crop 1 Total Bus. Malt State Production Value Employment Activity Taxes 3 Brewers Plants Other Uses (million bu) (million $) (million $) (million $) Alabama 21,660 1, Alaska , Arizona ,210 3, Livestock feed. Arkansas 11,880 1, California ,640 34,240 6, Livestock feed. Colorado ,360 14,787 2, Livestock feed. Connecticut 21,130 2, Delaware , Florida 139,190 14,151 3, Georgia 64,610 8,677 1, Hawaii 8, Idaho , Livestock feed. Illinois 86,400 10,110 1, Distillers. Indiana 38,690 3, Iowa 21,990 1, Kansas ,550 1, Livestock feed. Kentucky ,520 1, Distillers. Louisiana 32,450 2, Maine , Maryland ,670 3, Massachusetts 46,420 5,767 1, Michigan ,530 6,078 1, Livestock feed. Minnesota ,760 3, Livestock feed. Mississippi 12, Missouri 64,320 13,188 2, Montana , Livestock feed. Nebraska ,470 1, Livestock feed. Nevada ,540 1, Livestock feed. New Hampshire 10,320 1, New Jersey ,600 6,800 1, New Mexico 10, Livestock feed. New York ,190 14,036 2, Livestock feed. North Carolina ,800 7,130 1, Livestock feed. North Dakota , Livestock feed. Ohio ,730 10,016 1, Oklahoma 17,800 1, Livestock feed. Oregon ,330 2, Livestock feed. Pennsylvania ,650 8,694 1, Livestock feed. Rhode Island 5, South Carolina 26,260 2, South Dakota , Livestock feed. Tennessee 29,010 2, Distillers. Texas 160,390 21,007 4, Livestock feed. Utah ,630 1, Livestock feed. Vermont 6, Virginia ,830 7,375 1, Livestock feed. Washington ,160 4, Livestock feed. West Virginia 9, Wisconsin ,630 8,653 1, Livestock feed. Wyoming , Livestock feed. Total U.S ,015, ,566 49,124 2, Average annual production and crop values ( ). (Source: USDA\NASS). Data not available for all years for some minor states. 2 Source: Economic Impact, 2013 Prepared for the Beer Institute by John Dunham and Associates. 3 Taxes paid and generated -business, consumption & personal.
67 MAJOR & REGIONAL BREWERS IN THE UNITED STATES 1 STATE COMPANY CITY Alaska Alaskan Brewing & Bottling Co. Juneau Arizona Four Peaks Brewing Co. Tempe California Anchor Brewing Co. San Francisco Anderson Valley Brewing Co. Boonville Anheuser-Busch, Inc. Fairfield Anheuser-Busch, Inc. Los Angeles Ballast Point Brewing Co. San Diego Bear Republic Brewing Co. Healdsburg BJ s Chicago Pizza & Brewery Huntington Beach Firestone Walker Brewing Co. Paso Robles Gordon Biersch Brewing Co. San Jose Green Flash Brewing Co. San Diego Hangar 24 Craft Brewery Redlands Karl Strauss Breweries San Diego Lagunitas Brewing Co. Petaluma Lost Coast Brewery and Café Eureka Mendocino Brewing Co. Ukiah MillerCoors, LLC Irwindale North Coast Brewing Co. Fort Bragg Pyramid Breweries Berkeley Sierra Nevada Brewing Co. Chico Speakeasy Ales and Lagers San Francisco Stone Brewing Co. San Marcos Trumer Brauerei Berkeley 21 ST Amendment Brewery San Francisco Colorado Anheuser-Busch, Inc. Fort Collins Avery Brewing Co. Boulder Boulder Beer Co. Boulder Breckenridge Brewery Denver Great Divide Brewing Co. Denver Left Hand Brewing Co. Longmont MillerCoors, LLC Golden New Belgium Brewing Co. Fort Collins Odell Brewing Co. Fort Collins Oskar Blues Brewery Longmont SKA Brewing Durango Connecticut Thomas Hooker Brewing Co. Bloomfield Delaware Dogfish Head Craft Brewery Milton Fordham & Dominion Brewing Co. Dover Florida Anheuser-Busch, Inc. Jacksonville Cigar City Brewing Co. Tampa D.G. Yuengling & Son Tampa Georgia Anheuser-Busch, Inc. Cartersville MillerCoors, LLC Albany Sweetwater Brewing Co. Atlanta Terrapin Beer Co. Athens Hawaii Kona Brewing Co. Kailua-Kona Maui Brewing Co. Lahaina Illinois Goose Island Beer Co. Chicago Two Brothers Brewing Co. Warrenville 1 Breweries with production of 15,000 barrels or more in Source: Brewers Association
68 Indiana Sun King Brewing Indianapolis Three Floyds Brewing Co. Munster Kentucky Lexington Brewing & Distilling Co. Lexington Louisiana Abita Brewing Co. Abita Springs Maine Allagash Brewing Co. Portland D.L. Geary Brewing Co. Portland Shipyard Brewing Co. Portland Maryland Clipper City Brewing Co. Halethorpe Flying Dog Brewing Co. Frederick Massachusetts Berkshire Brewing Co. South Deerfield Boston Beer Co. Boston Harpoon Brewery Boston Ipswich Ale Brewery Ipswich Wachusett Brewing Co. Westminster Michigan Atwater Brewing Co. Detroit Bell s Brewery, Inc. Galesburg Founders Brewing Co. Grand Rapids New Holland Brewing Co. Holland Shorts Brewing Co. Bellaire Minnesota August Schell Brewing Co. New Ulm Cold Spring Brewery Cold Spring Summit Brewing Co. St. Paul Surly Brewing Co. Minneapolis Missouri Anheuser-Busch, Inc. St. Louis Boulevard Brewing Co. Kansas City St. Louis Brewery Maplewood Montana Big Sky Brewing Co. Missoula New Hampshire Anheuser-Busch, Inc. Merrimack Redhook Ale Brewery, Inc. Portsmouth Smuttynose Brewing Co. Portsmouth New Jersey Anheuser-Busch, Inc. Newark New York Anheuser-Busch, Inc. Baldwinsville Blue Point Brewing Co. Patchogue Brewery Ommegang Cooperstown Brooklyn Brewery Brooklyn Genesee Brewing Co. Rochester Greenpoint Beer Works Inc. Brooklyn Ithaca Beer Co. Ithaca The Matt Brewing Co. Utica Sixpoint Brewery Brooklyn Southern Tier Brewing Company Lakewood Olde Saratoga Brewing Co. Saratoga Springs North Carolina Highland Brewing Co. Ashville MillerCoors, LLC Eden New Belgium Brewing Co. Asheville Oskar Blues Brewery Brevard Sierra Nevada Brewing Co. Mills River Ohio Anheuser-Busch, Inc. Columbus Boston Beer Co. Cincinnati Great Lakes Brewing Co. Cleveland MillerCoors, LLC Trenton 1 Breweries with production of 15,000 barrels or more in Source: Brewers Association,
69 Oregon Bridgeport Brewing Co. Portland Deschutes Brewing Co. Bend Full Sail Brewing Co. Hood River Ninkasi Brewing Co. Eugene Pyramid Breweries Portland Rogue Ales Newport Widmer Brothers Brewing Co. Portland Pennsylvania Boston Beer Co. Breinigsville D.G. Yuengling Son, Inc. Pottsville The Lion Brewery, Inc. Wilkes-Barre Straub Brewery, Inc. St. Mary s Trőegs Brewing Co. Harrisburg Victory Brewing Co. Downingtown Western Pennsylvania Brewing Latrobe Yards Brewing Co. Philadelphia Rhode Island Narragansett Brewing Co. Providence Tennessee Blues City Brewing Co. Memphis Yazoo Brewing Co. Nashville Texas Anheuser-Busch, Inc. Houston MillerCoors, LLC Fort Worth Rahr and Sons Brewing Co. Fort Worth Real Ale Brewing Co. Blanco Saint Arnold Brewing Co. Houston Spoetzl Brewery, Inc. Shiner Utah Uinta Brewing Co. Salt Lake City Utah Brewers Cooperative Park City Vermont Harpoon Brewery Windsor Long Trail Brewing Co. Bridgewater Corners Magic Hat Brewing Co. South Burlington Otter Creek Brewing Co. Middlebury Virginia Anheuser-Busch, Inc. Williamsburg MillerCoors, LLC Elkton Starr Hill Brewing Co. Crozet Washington Elysian Brewing Co. Seattle Fish Brewing Co. Olympia Georgetown Brewing Co. Seattle Mac and Jack s Brewery Redmond Pyramid Breweries Seattle Redhook Ale Brewery Woodinville Wisconsin Capitol Brewing Co. Middleton City Brewing Co. La Crosse Jacob Leinenkugel Brewing Co. Chippewa Falls Lakefront Brewery Inc. Milwaukee Minhas Craft Brewery Monroe MillerCoors, LLC Milwaukee New Glarus Brewing Co. New Glarus Sprecher Brewing Co. Glendale Stevens Point Brewery Stevens Point 1 Breweries with production of 15,000 barrels or more in Source: Brewers Association
70 MALTING PLANTS IN THE UNITED STATES STATE COMPANY CITY Colorado Colorado Malting Company Alamosa MillerCoors, LLC Golden Idaho Anheuser-Busch, Inc. Idaho Falls Great Western Malting Company Pocatello InteGrow Malt Idaho Falls Illinois Mammoth Malt Thawville Massachusetts Valley Malt Hadley Michigan Michigan Malt Shepherd Minnesota Anheuser-Busch, Inc. Moorhead Malteurop North America Winona Rahr Malting Company Shakopee Montana Malteurop North America Great Falls Nevada Rebel Malt Reno New York Farmhouse Malt Newark Valley North Carolina Farm Boy Farms Pittsboro Riverbend Malt Ashville North Dakota Cargill Malt Spiritwood Oregon Christensen Farms Malting Company McMinnville Texas Blacklands Malt Leander Washington Great Western Malting Company Vancouver Wisconsin Malteurop North America Milwaukee Briess Malt & Ingredients Company Chilton Briess Malt & Ingredients Company Waterloo Cargill Malt Sheboygan
71


72
73 Million Acres US Barley Acreage
74 14.0 Canadian Barley Acreage

75 US Barley Use % Malting 57.3% 51.1% Feed 30.7% 22.7% Exports 4.6% 3.1% Seed 3.8% 1.3% Food 3.6% Malting Feed Exports Seed Food

76 US Barley Production & Malt Use CO, ID, MN, MT, ND, WY Total Malting Use
77 Why Has Barley Acreage Declined? Static domestic malt use, limited barley & malt exports Decline in use for feed = primary secondary use Competition from abundant supplies of corn and dried distillers grain (DDGs) Static & limited food use although has FDA Healthy Heart Claim USDA Barley Health Benefits Project AMBA/NBIC lobbying High risk crop many chances for failure in making malting grade Good return as malting, low or no return as feed Risks: - Fusarium head blight (scab), other diseases, drought & heat stress, quality requirements Competition with other crops GROWERS HAVE OTHER OPTIONS Corn, soybeans, canola = large and growing markets Substantial investment by biotech seed companies, including GM variety development, in these crops and now wheat
78 Expenditures: Crop Protection and Seeds and Traits Bayer, Syngenta, BASF, DOW and DuPont were the firms that spent the most on Crop Protection R&D. Monsanto dominates the seeds and traits sector Comparative R&D Expenditures Wheat about 70c/acre/year GM Row crops: $10/acre/year Expenditures in billions Bayer CropScience Dow DuPont Monsanto Syngenta Seeds and traits Crop protection Slide courtesy Dr. Bill Wilson, NDSU
79 Why Has Barley Acreage Declined? Biotech Crops with improved traits, including GM, have pushed barley out of higher rainfall areas into more marginal, dry ones What happens to barley when it faces competition from GM drought tolerant corn, wheat and other crops that are being developed? Barley research & variety development primarily in public sector State and provincial universities; USDA-ARS and Agriculture & Agri-Food Canada Limited and declining public sector investment Limited variety development by companies US = Two brewers, one maltster, one private sector company all traditional breeding - minor part of their business, driven to meet needs, not profit - depend on public sector for other research needs Little or no interest by biotech seed companies in barley Low acreage compared to other major crops Substantial cost to commercialize a GM variety
80 Discovery, Development and Deregulation Category Discovery Costs of a GM Trait Cost ($ million) Number of responses Early discovery Late discovery Total cost Construct optimization Commercial event production & selection Introgression breeding and wide-area testing Regulatory science Deregulation and regulatory affairs Total $136.0 $105 w/o Discovery Phillips McDougall, September 2011
81 GM Barley? Current Status & Considerations Experimental GM barley lines have been developed Lines with various genes for resistance to Fusarium head blight (scab) USDA-ARS US Wheat & Barley Scab Initiative funded researchers High beta-glucanase lines to improve chicken feed Washington State University None commercialized GM lines grown in hydroponic cultivation in geothermal greenhouses in Iceland for commercial production of pure proteins for research (Cell Sciences) No commercial field production of GM barley Strong support for development of GM barley by barley grower organizations - Growers are experienced in growing GM crops and feel GM barley is needed to keep barley competitive with other crops
82 GM Barley? Current Status & Considerations Growing consumer resistance and concerns about GM Mixed views of malting, brewing, distilling, and food end-users Strongly opposed - to neutral - to supportive Thus no clear signal to biotech seed companies to pursue Developmental costs of GM barley too high to recover investment Low acreage compared to major crops and thus limited seed sale potential A unique trait, with exclusive IP rights, and substantial economic benefits (e.g. drought tolerance, major disease resistance) that could be used worldwide, may provide viable market
83 American Malting Barley Association, Inc. Biotechnology Policy Statement June, 2008 The American Malting Barley Association, Inc. (AMBA) provides funding for basic barley research in plant physiology, biochemistry and fundamental genomics as well as for more applied research in barley variety development. In addition, AMBA is involved in various federal programs funding barley biotechnology research to ensure access to current science and to keep barley competitive with other crops. At this time, there are no commercially available GM barley varieties in North America. AMBA is opposed to the commercial release of GM barley varieties. JUNE, 2009 The American Malting Barley Association, Inc. (AMBA) provides funding for basic barley research in plant physiology, biochemistry and fundamental genomics as well as for more applied research in barley variety development. In addition, AMBA is supportive of various federal and state programs funding barley biotechnology research to ensure scientific advancement and to keep barley competitive with other crops.
84 GM Barley Conclusions No commercial GM barley expected in foreseeable future Cost of commercialization precludes public sector university or federal research agency commercialization Would require Biotech seed company to commercialize none appear interested at this time If work was initiated now, and gene discovery & construction, gene transfer, and utility already demonstrated, it would still take an estimated 10 years+ to complete the process to a commercially approved GM barley
85 GM WHEAT Strong grower support combined with change of view of many end-users (e.g. millers, bakers, food companies) from opposition to support due to concerns about declining wheat acreage and competition with GM crops Accordingly, biotech seed companies are now working on wheat, often in collaboration with the public sector universities that have the varieties needed for gene trait introgression Current estimate for first commercial GM wheat = 6 Years Considerations for malting, brewing, and distilling industries Production of wheat products if you want to be non-gm Comingling of GM wheat with non-gm barley Most barley farmers also grown wheat Wheat & barley grown in same area move through same elevator & transportation systems
86 Barley Biotechnology Tool Box X - No GM variety development Targeted genetic improvements without being transgenic (GM) Induce base pair gene changes by the plant not through gene transformation technology Rapid Trait Development system (RTDS) - Cibus (considered mutagenesis technology by USDA) Doubled Haploid (DH) Barley Line Development Rapid development of genetically homozygous varieties
87 Gene tracking applications Marker Assisted Selection (MAS) Track introgression of one or a few genes Genomic Selection (GS) Track thousands of genes to develop lines with desired agronomic & quality traits Barley Biotechnology Toolbox Gene tracking Technology (genotyping) Initial methodology = one gene Current technology = tens of thousands of genes at one time Current major genotyping technology Based on Single Nucletotide Polymorphisms (SNPs) Illumina BeadXpress system (old) Illumina iselect system (new) Exome capture sequencing Next generation technology for genotyping Genotyping by Sequencing (GBS)
88 Barley Biotechnology Challenge $$$ - Most all funding from limited public sector sources vs billions being invested by biotech seed companies in other crops State universities & USDA-ARS research locations USDA-ARS Small Grains Genotyping Laboratories (4) Fargo, ND; Manhattan, KS; Raleigh, NC; Pullman, WA Created through earmarks AMBA/NBIC & wheat stakeholder lobbying USDA-ARS US Wheat & Barley Scab Initiative grant program USDA-NIFA Agriculture & Food Research Initiative (AFRI) Competitive Grant Program Grants to individual scientists Large grants to multi-researcher, discipline, and institution coordinated projects Triticeae (barley & wheat) Agricultural Coordinated Project (TCAP) $25 million ($5M/year):
89 Keeping Barley Competitive With Other Crops Barley biotechnology research in of itself is not enough to keep barley competitive with biotech seed crops Coordinated research in many disciples is needed Breeding, genetics, molecular biology, biochemistry, physiology, pathology, management Adequate & effective national public sector barley research infrastructure Stakeholder funding, direction, and collaboration American Malting Barley Association (AMBA) Brewing & Malting Barley Research Institute (BMBRI, Canada) Brewers Association (BA) Individual malting & brewing companies State barley grower organizations
90 AMBA National Coordinator of US Malting Barley Research Facilities Funding AMBA, BA Federal, State, Growers, Brewers, Maltsters Adequate & Effective National Public Sector Barley Research Infrastructure Personnel Direction AMBA lobbies Congress, Federal Agencies, and State Universities to positively impact all these research infrastructure components AMBA also lobbies with barley growers for favorable federal farm program provisions (e.g. crop insurance)
91 American Malting Barley Association, Inc. (Founded in 1938 as the Malt Research Institute) MISSION: The primary purpose of AMBA is to encourage and support an adequate supply of high quality malting barley for the malting, brewing, distilling and food industries and increase our understanding of malting barley. VISION: To be the leader in improvement, development, and understanding of malting barley in the US. PRIMARY OBJECTIVE: Develop six-row and two-row malting barley varieties broadly adapted for the barley production areas of North America with suitable agronomic, malting, and brewing performance.
92 US Malting Barley Variety Development Programs (breeding, genetics, supporting and other research) Montana State University North Dakota State University Oregon State University University of California Davis University of Minnesota University of Nebraska USDA-ARS, Aberdeen, ID USDA-ARS, Raleigh, NC Utah State University Virginia Polytech & State University Washington State University AB-InBev Malteurop MillerCoors Limagrain AMBA member Funded by AMBA
93 Other US Malting Barley Research Biochemistry, Genomics, Molecular Biology, Physiology Diseases, Insects, Quality, Management, Variety Trials Programs listed for malting barley variety development plus: Colorado State University Cornell University (NY) Michigan State University North Carolina State University Ohio State University Pennsylvania State University Texas A&M University University of Idaho University of Maryland University of Vermont University of Wisconsin University of Wyoming USDA-ARS, Fargo, ND USDA-ARS, Madison, WI USDA-ARS, Manhattan, KS USDA-ARS, Pullman, WA USDA-ARS, Stillwater, OK USDA-ARS, St. Paul, MN AMBA funding
94 Canadian Malting Barley Variety Development Programs Primary AAFC, Brandon, MB University of Saskatchewan Alberta Agriculture and Rural Development Secondary Sapporo Breweries Ltd. Syngenta US Varieties are entered into Canadian testing system for potential registration and production Brewing & Malting Barley Research Institute (BMBRI) AMBA s Canadian Counterpart
95 AMBA Quality Evaluation Program Midwest Spring Six-Row ND22421 ND State University MillerCoors ND26891 ND State University AB-InBev, MillerCoors Step 1 - Micro malting USDA-ARS Cereal Crops Research Unit, Madison, WI 5,000 to 6,000 lines/year AMBA provides supporting funds Step 2 - AMBA pilot scale malting evaluations by collaborating members - Average of 35+ lines/year Step 3 AMBA Plant Scale Evaluation Program VARIETY/LINE PROGRAM BREWER TESTING Western Winter Two-Row Endeavor USDA-ARS, ID AB-InBev, MillerCoors 02Ab669 USDA-ARS, ID AB-InBev, New Glarus Western Spring Two-Row 2Ab04-X USDA-ARS, ID New Belgium, Sierra Nevada 2Ab17271 USDA-ARS, ID Briess, New Glarus Midwest Spring Two-Row 2ND25276 ND State University AB-InBev, Bell s, MillerCoors
96 AMBA 2014 Recommended Varieties ABI Voyager (2014) AC Metcalfe (2005) CDC Copeland (2007) CDC Meredith (2013) Charles* (2009) Conlon (2000) Conrad (2007) Expedition (2013) Harrington (1989) Hockett (2010) Merit (2000) Merit 57 (2010) Moravian 37 (2010) Moravian 69 (2010) Pinnacle (2011) Scarlett (2008) Wintmalt* (2013) * Winter barley (year added) Two-Row AB-InBev Agriculture & Agrifood Canada University of Saskatchewan University of Saskatchewan USDA ARS, Aberdeen, ID North Dakota State University AB-InBev Malteurop University of Saskatchewan Montana State University AB-InBev AB-InBev MillerCoors MillerCoors North Dakota State University Saatzucht Joseph Breun GdbH, Germany KWS Lochow, Germany
97 AMBA 2014 Recommended Varieties Six-Row Celebration (2011) Innovation (2014) Lacey (2000) Legacy (2001) Quest (2011) Robust (1984) Stellar-ND (2006) Tradition (2004) AB-InBev AB-InBev University of Minnesota AB-InBev University of Minnesota University of Minnesota North Dakota State University AB-InBev
98 American Malting Barley Association, Inc. Malting Variety Development Funding Allocation Goals* AMBA 2014 April, 2014 Funding * 2014 Variety & Supporting % % % % Regional % Research MIDWEST $194, Spring 2-Row 59.8% Spring 6-Row 26.1% Winter 2-Row 13.0% Winter 6-Row 1.1% Subtotal 100.0% 54.9% WEST $152, Spring 2-Row 63.7% Spring 6-Row 0.2% Winter 2-Row 35.8% Winter 6-Row 0.2% Winter (2&6) Subtotal 100.0% 42.9% East $7, Winter 2-Row 74.2% 0.8 Winter 6-Row 25.8% Subtotal 100.0% 2.1% TOTAL $353,918 Variety * 96.8% Weighted dues reported $139,932 National/Other $493,850 Total Funding
99 National Barley Research Program AMBA Strategic Goals Technology to accelerate variety development e.g. latest DNA tracking technology NOT GM Management practices Increased Yields Winter Varieties Resistance to Abiotic Stress o drought, heat, cold Lodging resistance High Test Weight Improved Quality Quality evaluation for breeding programs Preharvest sprouting Fermentability prediction Glucanase assays Flavor screening of barley
100 National Barley Research Program AMBA Strategic Goals Food Safety Increased secondary uses o Food, Feed, Straw for biofuels Insects (RWA, Bird cherry oat aphid) Disease Resistance o Ug99 Stem Rust o Fusarium head blight (scab) o Barley yellow dwarf virus o Cereal yellow dwarf virus o Bacterial leaf streak o Stripe rust o Root diseases o Net blotch o Septoria speckled leaf blotch o Spot blotch o Powdery mildew (winter barley)

")
101 Fusarium Head Blight aka Scab = DON (vomitoxin) Ug99 (African) Stem Rust
102 American Malting Barley Association, Inc. REGULAR MEMBERS (21) AB-InBev Bell s Brewery Boston Beer Briess Malt & Ingredients Brooklyn Brewery Brown-Forman Cargill Malt Craft Brew Alliance Deschutes Brewery Dogfish Head Craft Brewery Gambrinus Company Great Western Malting InteGrow Malt Malteurop MillerCoors New Belgium Brewing New Glarus Brewing Rahr Malting Schell s Brewing Sierra Nevada Brewing Summit Brewing
103 American Malting Barley Association, Inc. ASSOCIATE MEMBERS (45) Abita Brewing Alaskan Brewing Allagash Brewing Anchor Brewing Avery Brewing Bear Republic Brewing Blacklands Malt Blue Ox Malthouse Boulevard Brewing Cold Spring Brewing Colorado Malting Corsair Artisan Distillery Deer Creek Malthouse Farm Boy Farms Firestone Walker Brewing Flying Dog Brewery Founders Brewing Full Sail Brewing Gold Rush Malt Harpoon Brewery Langunitas Brewing Lakefront Brewery Left Hand Brewing Leopold Bros Distillery
104 American Malting Barley Association, Inc. ASSOCIATE MEMBERS (45) Long Trail Brewing Lost Coast Brewery Malterie Frontenac Matt Brewing Odell Brewing Oskar Blues Brewery Rahr & Sons Brewing Real Ale Brewing Riverbend Malt House Rogue Ales Russian River Brewing Saint Arnold Brewing Schlafly Beer Smuttynose Brewing Storz Brewing Stone Brewing Troegs Brewing Urban Chestnut Brewing Valley Malt Victory Brewing Wachusett Brewing
105 Malt Production in the US November Crafty brew: Rising demand from craft breweries will maintain industry growth IBISWorld Industry Report OD5947 Malt Production in the US November 2012 Olivia Tang 2 About this Industry 2 Industry Definition 2 Main Activities 2 Similar Industries 2 Additional Resources 3 Industry at a Glance 4 Industry Performance 4 Executive Summary 4 Key External Drivers 5 Current Performance 7 Industry Outlook 10 Industry Life Cycle 12 Products & Markets 12 Supply Chain 12 Products & Services 13 Demand Determinants 14 Major Markets 16 International Trade 18 Business Locations 20 Competitive Landscape 20 Market Share Concentration 20 Key Success Factors 21 Cost Structure Benchmarks 22 Basis of Competition 23 Barriers to Entry 24 Industry Globalization 25 Major Companies 25 Malteurop Group 26 Cargill Inc. 28 Operating Conditions 28 Capital Intensity 29 Technology & Systems 29 Revenue Volatility 30 Regulation & Policy 31 Industry Assistance 32 Key Statistics 32 Industry Data 32 Annual Change 32 Key Ratios 33 Jargon & Glossary info@ibisworld.com
106 Malt Production in the US November About this Industry Industry Definition Operators in this industry manufacture malt, a grain that has been steeped, germinated and dried for use in beer brewing and vinegar production. Malt is produced from a variety of grains, including barley and rye. Main Activities The primary activities of this industry are Germinating and drying grains Manufacturing barley malt Manufacturing wheat malt Manufacturing rice malt Manufacturing rye malt Manufacturing malt flour Manufacturing distiller s malt The major products and services in this industry are Malts sold to brewers Malts sold to distillers Similar Industries Wheat, Barley & Sorghum Farming in the US Wheat, barley and sorghum farmers produce coarse grains to be used in making food, animal feed, malt and other similar food products Flour Milling in the US Flour millers process wheat into flour Breweries in the US Breweries use malt, hops, yeast and other ingredients to produce alcoholic beverages. Additional Resources For additional information on this industry ambainc.org American Malting Barley Association Inc. Institute of Barley and Malt Sciences The Beverage Information Group US Department of Agriculture
107 Malt Production in the US November Industry at a Glance Malt Production in 2012 Key Statistics Snapshot Revenue $1.1bn Annual Growth % Annual Growth % Profit $45.6m Exports $262.2m Businesses 12 Market Share Malteurop Group 25.1% Cargill Inc. 19.3% Key External Drivers Price of coarse grains Demand from beverage manufacturing Trade-weighted index Per capita alcohol consumption p. 25 % change Revenue vs. employment growth Year Revenue Employment Products and services segmentation (2012) 15% Malts sold to distillers 18 Index Price of coarse grains Year SOURCE: 85% Malts sold to brewers p. 4 SOURCE: SOURCE: Industry Structure Life Cycle Stage Mature Revenue Volatility Medium Capital Intensity Medium Industry Assistance Low Concentration Level Medium Regulation Level Technology Change Barriers to Entry Industry Globalization Competition Level Medium Low Medium High Medium FOR ADDITIONAL STATISTICS AND TIME SERIES SEE THE APPENDIX ON PAGE 32
108 Malt Production in the US November Industry Performance Executive Summary Key External Drivers Current Performance Industry Outlook Life Cycle Stage Executive Summary The Malt Production industry, which dries and germinates barley and other coarse grains for use in beer production, experienced volatile, but positive growth over the past five years. Although barley costs were volatile and high, operators raised prices enough to partially counteract cost increases without significantly hurting demand, boosting revenue. Consumers had less disposable income during the recession and purchased less beer, which caused beer production volumes to decline slightly. However, the rise of craft beer maintained downstream brewers The rising popularity of craft beer and the buy local trend will keep the industry growing demand for malt; craft brewers make up a small proportion of beer production, but account for about 18.0% of malt demand. Furthermore, increasing global beer production is driving foreign breweries to source malt from the industry, lifting exports an annualized 10.4% to $262.2 million over the five years to 2012 and mitigating import competition. The industry also faced threats from growing wine popularity. Shifting consumer preferences from beer to wine due to widely accepted studies showing wine s health benefits is lowering per capita beer consumption. Nonetheless, beer is a widely accepted alcoholic beverage. Because consumption levels fluctuate only slightly, breweries are still demanding malt. Therefore, malt producers revenue is estimated to rise an annualized 5.2% to $1.1 billion in the five years to 2012, including an 11.0% jump in Although firms passed on barley cost increases to downstream buyers in the form of higher prices, the price hikes covered only part of the cost increase. For example, malt producers raised prices in 2008, when the price of malting barley grew 29.9%, according to the US Department of Agriculture (USDA). But profit still fell from 4.4% of revenue in 2007 to 4.0% in Profit is estimated to account for about 4.3% of revenue in 2012 after much fluctuation over the five-year period. In the next five years, the industry is forecast to continue growing. A larger supply of barley from farmers will temper input price increases and allow industry operators to better anticipate cost increases. Also, the rising popularity of craft beer and a trend for domestic brewers to buy local for malt inputs will further drive demand for industry products. Imports will continue to threaten the industry, but rising exports will mitigate the effect. As a result, revenue is projected to rise at an annualized rate of 2.4% to $1.2 billion in the five years to Key External Drivers Price of coarse grains Malt is manufactured from coarse grains, including barley, so a rise in the price of coarse grains negatively affects profit. Industry operators may elect to pass on these cost increases in the form of higher prices, but they risk hurting demand and revenue. This driver is expected to increase in 2013, representing a potential threat to the industry. Demand from beverage manufacturing Breweries are a major downstream markets for malt products. As consumers demand more beer, the rise in demand makes it way up the supply chain, raising demand and revenue for malt producers. This driver is expected to increase slowly in 2013, representing a potential opportunity for the industry.
109 Malt Production in the US November Industry Performance Key External Drivers continued Trade-weighted index The industry is dependent on exports to generate almost one-quarter of its revenue. Therefore, the value of the dollar relative to the currencies of United States major trading partners is crucial in determining revenue. When the value of the dollar appreciates, domestic goods become relatively more expensive on the global market and less attractive to purchase. This driver is expected to increase slowly in Per capita alcohol consumption Despite increasing overall alcohol consumption, rising consumer health consciousness is working against beer consumption. Health conscious consumers are shying away from highcalorie and carbohydrate-heavy beverages, both of which are characteristics of beer. In addition, studies showing the health benefits of consuming wine are shifting consumers from beer to wine. This driver is expected to increase slowly in Price of coarse grains 300 Trade-weighted index Index Index Year Year SOURCE: Current Performance The Malt Production industry has grown over the past five years despite challenges from volatile input prices, changing consumer trends and import competition. Malting uses a method of drying and germinating barley and other coarse grains for beer production. Although the price of barley and other coarse grain inputs has risen significantly over the past five years, producers were able to raise prices enough to cover part of the cost, which boosted revenue. Additionally, an increase in global beer production caused many breweries around the world to demand more malt from US producers, lifting exports and mitigating import competition. Therefore, revenue is expected to rise at an annualized rate of 5.2% to $1.1 billion in the five years to 2012, including an 11.0% jump in 2012 as a result of rapid export growth.
110 Malt Production in the US November Industry Performance Barley prices affect revenue and profit Because coarse grains, specifically barley, are the main ingredient for malt production, revenue performance follows the price of these inputs closely. Barley is also a substitute to corn, wheat and soybeans in animal feed production. Therefore, as corn, wheat and soybeans were increasingly allocated toward biofuel production, their prices increased dramatically, causing buyers to shift demand toward barley and other substitutes. This shift drove up the price of coarse grains 7.8% per year on average in the five years to Luckily, producers were able to raise prices to cover part of the cost increase, boosting revenue growth. For example, when the price of malting barley skyrocketed 47.5% in 2009, according to the US Department of Agriculture (USDA), revenue also jumped 12.9% in the same year. Conversely, when the price of malting barley fell slightly in 2010, industry operators lowered their product prices; coupled with lower selling volumes, revenue fell 3.6%. Although malt producers were able to raise prices in accordance with higher Although input costs rose, producers were able to raise prices to cover part of the increase barley costs, the price hikes were only able to cover a fraction of the cost, squeezing profit despite revenue gains. For example, when the price of barley rose 29.9% in 2008, profit fell from 4.4% of revenue in 2007 to 4.0% in 2008; revenue grew 7.4% in the same year. Because profit margins are highly dependent on fluctuating input prices, profit has also been volatile over the past five years; in 2012, profit is estimated to account for 4.3% of revenue. Unpredictable profitability has caused some firms to exit the industry and larger firms to merge with or acquire smaller firms. In the five years to 2012, the number of enterprises is estimated to fall from 16 to 12 companies, representing a 5.6% annualized decline. Downstream demand Beer producers remain the Malt Production industry s main downstream market. Unfortunately, high unemployment during the recession caused many consumers to cut back on beer purchases, leading breweries to produce a smaller volume of beer over the past five years. According to the Beverage Information Group, an industry information source, beer production volumes remained flat in 2008, fell 2.1% in 2009 and fell 1.9% in However, economic recovery and successful sales strategies for certain brands allowed this major downstream market to continue demanding malt through One niche segment in particular, craft breweries, performed especially well due to expanding consumer palates despite overall beer volume declines. In fact, craft brewers grew to demand about 18.0% of malt despite accounting for a small proportion of the volume produced, according to the American Malting Barley Association (AMBA). Another factor challenging the downstream breweries market is the shift in consumer preferences. Americans are becoming more health conscious and are wary of high-calorie, high-carbohydrate beverages, which are both common characteristics to beer. Furthermore, studies showing the health benefits of consuming wine is shifting consumers to demand more wine and spirits instead of beer. Per
111 Malt Production in the US November Industry Performance Downstream demand continued capita consumption of alcohol has been flat over the past five years due to an increase in wine consumption and an estimated 1.6% decline in per capita consumption of beer, according to the Beer Institute. Nonetheless, beer is a commonly accepted alcoholic beverage, and consumption changes are generally minimal, creating stable demand for malt from breweries. International trade A rise in global beer production has also contributed to high demand for the US Malt Production industry. According to the American Malting Barley Association, global beer production has risen 33.5% in the past 10 years, driving industry exports. In particular, exports to Mexico, a major beer producing country that accounts for just over half of exports, has risen at an average annual rate of 12.1% over the five years to The devaluation of the dollar during the period also drove up export demand because domestic goods were relatively less expensive to the global market. As a result of these factors, exports are estimated to rise 10.4% per year on average to $262.2 million in the five years to 2012, representing about 24.7% of revenue. Despite strong export growth, the industry faces intense competition from imports, which increased from 16.8% of domestic demand in 2007 to an estimated 24.3% in This expansion is especially astonishing in light of the dollar s devaluation. However, changing consumer tastes are % change Revenue vs. exports Year Revenue Exports driving domestic breweries to demand high-quality malt from abroad. Furthermore, the majority of imports come from Canada, which is an attractive source of imports due to its proximity to the United States and participation in the North American Free Trade Agreement (NAFTA). Consequently, imports are anticipated to rise 13.7% to $255.3 million in the five years to 2012, posing as a threat to the industry. 18 SOURCE: Industry Outlook In the next five years, the Malt Production industry s revenue is forecast to continue growing, although at a slower pace than the previous five years. Rising disposable income from economic recovery will allow consumers to increase their demand for beer, causing breweries to demand more malt; craft beers in particular are forecast to perform well and further boost demand for malt. A growing supply of barley will also temper input price volatility for malt producers, allowing producers to better anticipate costs and adjust production accordingly. Furthermore, exports will continue to grow and contribute a larger proportion of revenue to the
112 Malt Production in the US November Industry Performance Industry Outlook continued industry, although import competition will intensify. As a result of these factors, revenue is projected to rise at an annualized rate of 2.4% to $1.2 billion in the five years to 2017, starting off with a 2.6% increase in Growing supply of inputs and expanding profit The supply of barley is forecast to expand as a result of increasing farming acreage and shifting growing strategies. The acreage of malting barley is anticipated to increase in the next five years in order to continue maintaining the crop s competitiveness against substitutes, such as wheat and corn. Furthermore, barley farms may develop and grow genetically modified (GM) crops to make malting barley less sensitive to temperature in the malting process, which will be especially beneficial if the barley crops do not have enough of the natural enzymes that make it the prime ingredient for malting. Additionally, more barley farmers are shifting the growing season to the winter, producing what is known as winter malting barley varieties. In the winter, barley crops are under less stress, which leads to an increase of up to 25.0% in crop production, according to the Institute of Barley and Malt Sciences. Furthermore, less water is necessary for irrigation because the plants mature earlier and the crops hold on to moisture, especially when it snows. Therefore, a Farms will increase barley production, which will stabilize input costs for malt producers growing supply of malting barley will slow the growth of coarse grain prices to 1.4% per year on average in the five years to Slower growth of input prices will allow industry producers to anticipate cost fluctuations and adjust production and product prices as necessary, which will pad profit. Profit is also forecast to expand due to developing technology that will improve operating efficiencies, allowing firms to reduce their employee head count. The number of employees is estimated to decline 0.4% per year on average to 1,128 workers in the five years to 2017, while the average wage rises to $59,840, reflecting the need for higherskilled workers to operate the machinery. Profit is forecast to expand from 4.3% of revenue in 2012 to 5.3% in Downstream demand As the economy continues to recover in the next five years, unemployment will fall and consumers will regain disposable income, leading those who cut back on beer purchases during the recession to return to their typical level of purchases. Increasing demand for beer will prompt breweries to raise production volumes and, therefore, increase their demand for malt. Although health trends will continue to threaten demand for beer, many of which are high in calories and carbohydrates, per capita alcohol consumption is estimated to rise at an annualized rate of 0.4% in the five years to In addition to wine and spirits, premium beer will be more popular as it becomes more affordable due to rising disposable incomes, which will lift demand for malt. The growing popularity of craft beer in particular will contribute to rising beer consumption and demand for malt.
113 Malt Production in the US November Industry Performance Downstream demand continued Craft beer producers already use about one-fifth of the industry s malt. Therefore, as breweries expand their production in the next five years, this segment will grow to demand even more, benefiting industry revenue. International trade The trend for domestic breweries to buy local for inputs will be more widespread in the next five years. This trend will contribute to the slowdown in imports. However, similar to the previous five years, expanding taste preferences will continue to drive breweries to import malt from abroad. Furthermore, the dollar is forecast to appreciate, making foreign goods relatively cheaper to the US market and more attractive to purchase, lifting imports 10.3% per year on average to $417.0 million in the five years to As a result, imports will grow to represents 33.5% of domestic demand. Although exports are estimated to account for 30.5% of revenue in 2017, the appreciating dollar will hamper export The growing buy local trend and appreciating dollar are expected to slow import growth growth through the next five years. However, Mexico will continue to be a major export destination due to its significant beer production industry. Mexico and Canada s geographic proximity to the United States and participation in NAFTA will further sustain exports. Consequently, exports are estimated to grow 6.8% per year on average to $364.1 million in the five years to 2017.
114 Malt Production in the US November Industry Performance Life Cycle Stage IVA is expected to grow faster than GDP during the 10 years to 2017 The industry is experiencing consolidation through mergers and acquisitions Beer, which uses malt as an ingredient, is a commonly accepted alcoholic beverage that is part of the American lifestyle %Growthinshareofeconomy Maturity Company consolidation; level of economic importance stable QualityGrowth High growth in economic importance; weaker companies close down; developed technology and markets KeyFeaturesofaMatureIndustry Revenue grows at same pace as economy Company numbers stabilize; M&A stage Established technology & processes Total market acceptance of product & brand Rationalization of low margin products & brands 10 5 QuantityGrowth Many new companies; minor growth in economic importance; substantial technology change 0 CornFarming MaltProduction FlourMilling Wheat,Barley&SorghumFarming Corn,Wheat&SoybeanWholesaling Distilleries 5 Decline Shrinking economic importance %Growthinnumberofestablishments SOURCE:
115 Malt Production in the US November Industry Performance Industry Life Cycle This industry is Mature The Malt Production industry is expected to grow at a faster rate than the overall economy over the 10 years to IBISWorld estimates the industry s contribution to the economy, as measured by industry value added (IVA), will grow at an average annual rate of 3.9% over the 10-year period. During the same period, GDP is forecast to increase at an annualized rate of 1.8%. Although the industry is growing faster than the overall economy, it is in the mature stage of its life cycle. Similar to other mature industries, the industry has experienced consolidation. Volatile input prices have made profitability unpredictable and created harsh operating conditions for some producers. In addition, larger companies have merged with or acquired smaller firms in this industry to take advantage of economies of scale and expand their market share. Therefore, the number of producers fell from 16 in 2007 to 12 enterprises in 2012, representing an average annual decline of 5.6%. Because beer is an accepted part of adult life in the United States, the malt used to produce beer has also had a long period of existence and acceptance, which is another hallmark trait of mature industries. It is unlikely that Americans will significantly reduce beer consumption in the next five years; in fact, beer and alcohol consumption is forecast to rise moderately, maintaining malt s prevalence in the American lifestyle.
116 Malt Production in the US November Products & Markets Supply Chain Products & Services Demand Determinants Major Markets International Trade Business Locations Supply Chain KEY BUYING INDUSTRIES Breweries in the US Breweries purchase malt from industry firms for use as an input in beer production Distilleries in the US Distilleries purchase malt from industry firms for use as an input in certain kinds of liquor production. KEY SELLING INDUSTRIES Corn Farming in the US Malt producers buy corn from farmers to make corn-based malts Wheat, Barley & Sorghum Farming in the US This industry supplies malt producers with grains, such as wheat and barley, which are used in the malt production process Corn, Wheat & Soybean Wholesaling in the US Industry firms may buy wheat or corn from wholesalers instead of farmers to make malt products. Products & Services Products and services segmentation (2012) 15% Malts sold to distillers 85% Malts sold to brewers Total $1.1bn The Malt Production industry primarily sells malts to brewing and distilling companies domestically and abroad. This industry primarily sells one product malted grain which is used to make beer and whiskey. Malts are distinguished primarily by their end use in the production of beer or liquor, but also by the types of grain inputs used. The quality and type of grain used, which include barley, wheat, rye and corn, have a great SOURCE: influence on the end beer or liquor product sold. Malts sold to brewers Malts sold to brewers are estimated to account for about 85.0% of industry revenue, based on the number of brewing establishments, beer volumes and sales. Within this category, brewers loosely divide malts into base malts and specialty malts. Base malts are used during the fermentation process, while specialty
117 Malt Production in the US November Products & Markets Products & Services continued malts are used to impart color, aromas and unique flavors to beer. Popular malt varieties include pale malts, such as English pale, American pale and pilsner pale, along with various types of kilned malts used in darker beers. Over the five years to 2012, this category has increased slightly due to higher demand from craft breweries, despite the overall decline in US beer sales. Although craft beers account for a small percentage of beer volumes and sales, they use a disproportionately high 17.9% of industry malts. Consequently, the annualized double-digit growth in craft beers over the past five years has been a key driver of growth for industry firms. Additionally, the diverse range of craft beers has contributed to innovations in malt varieties, particularly for specialty malts used to give craft beers unique flavors. Malts sold to distillers Fluctuations in world grain markets first made it economically unprofitable for distillers to continue to malt grains in the 1960 s. Since then, distillers have opted for customized malts produced by industry firms. Malt producers will typically set up special supply contracts with individual distillers that spell out malt requirements and set fixed quantities. Whiskey is the primary distilled alcoholic product that uses industry malts. Malt whiskies, such as Scotch, are the most popular type and are primarily made out of malted barley. Other types include grain whiskies, such as American whiskies, which are produced using a number of different grains like wheat, corn and rye. Different grains and malts are combined in numerous ways to produce whiskey around the world. IBISWorld estimates that malts sold to distillers account for about 15.0% of industry revenue based on alcohol volumes and sales. Over the five years to 2012, this category has grown slowly despite drops in revenue during the recession. Demand Determinants Demand for malts is derived primarily from downstream brewing and distilling industries that use malt in the production of malted beverages. Malt is one of the four major ingredients used in beer production and is also used extensively in malt liquor production. Consequently, changes in demand for malted beverages from end consumers will affect demand for malt from brewers and distillers. Likewise, an increase in demand for malted beverages will generally result in higher demand for malt from brewers and distillers, who would then increase production of malted beverages to meet consumer demand. Malted beverages are mature products with fairly stable demand; consequently, malt is also considered a mature product. Demand for malted beverages also depends upon its quality and price relative to substitutes, which include liquors and some nonalcoholic beverages. Changes in consumer preferences can influence the demand for these substitutes. Consumers often substitute among alcoholic beverage categories, and wine and spirit consumption has increased moderately in recent years. As consumers educate themselves about various beverages and explore the variety of beers available to them, the malt production industry is forecast to continue to develop new malt varieties with higher nutritional contents and flavors. Consumer tastes are also an important driver of malt demand. Demand for beer and malt liquors vary geographically and depend upon the cultural and economic characteristics of a region. Over the past
118 Malt Production in the US November Products & Markets Demand Determinants continued five years, consumer trends, such as buying locally and concerns over the nutritional contents of malted beverages, have supported strong growth in the craft brews market segment. Consequently, malt producers continue to invest in research and development to develop new malt varieties that have different tastes, colors and nutritional contents. Breweries interest in sourcing local malts has also provided a boost to the industry and have helped it compete with high-quality imported malts. Demand for malt domestically is also influenced by global grain supply and demand, and international trade in the Global Malt Production industry. The economics of grain supplies vary among grain varieties, depending upon protein content, plumpness and moisture content, which affect their use by downstream brewers and distillers. Changes in the price of inputs affect malt producers production levels and pricing, which affects downstream demand from brewers and distillers domestically and abroad. Fluctuations in currency exchange rates also have an effect on imports prices, which affect the demand for industry malts against competing imports. Demand for malt domestically is also influenced by global grain supply and demand and international trade in the Global Malt Production industry. The economics of grain supplies vary between grain varieties, depending upon protein content, plumpness and moisture content which affect their use by downstream brewers and distillers. Barley, which is primarily used in malt production, tends to be oversupplied which is why food-grade barley prices tend to be significantly lower than livestock-grade barley prices. Changes in the price of inputs affect malt producers level of production and pricing, which in turn affects downstream demand from brewers and distillers domestically and abroad. Fluctuations in currency exchange rates also have an effect on the pricing of imports, which affect the demand for industry malts against competing imports. Major Markets Industry firms primarily sell malts to breweries and distilleries domestically and abroad. They also sell to food processing companies such as Kraft, Malt-O-Meal and Kellogg, but revenue from these sales are not included in this report. Malt is also increasingly recycled from the brewing and distilling processes and sold as livestock feed; however, this is also excluded from this report. Large breweries Large domestic breweries, such as those owned by Anheuser-Busch (InBev), SAB Miller, Molson, Labatts and Kirin, are the largest market segment for malt producers. While large brewing companies may be vertically integrated with farmers and malt production operations to a degree, they all still purchase malt from independent malt producers to meet their supply needs for high-volume beer production. Over the five years to 2012, this segment initially declined as beer volume sales continued to slide, but has since increased slowly because large breweries have started producing craft beers to meet changing consumer tastes. Craft breweries Craft brewers are defined as small, independent brewing operations that produce niche beers on a smaller scale than large breweries. The segment can be further divided into microbreweries,
119 Malt Production in the US November Products & Markets Major Markets continued Major market segmentation (2012) 15% Distillers 25% Small breweries 60% Large breweries Total $1.1bn brewpubs, contract brewing companies, regional breweries and regional craft breweries. These account for the majority of brewing establishments in the United States. Changing consumer tastes and preferences toward higher-quality beer have made this a fast-growing segment for malt producers over the five years to According to data from the US Brewers Association, craft brews represent just about 5.7% of US beer volume and 9.1% of its sales; however, they consume a disproportionately high 17.9% of the malt used by the brewing industry. Consumer trends such as buy local and concerns over the health benefits of mass-produced beer have helped this segment outpace growth of the overall US brewing industry. IBISWorld estimates that craft brewers account for about 25.0% of industry revenue in SOURCE: Distilleries Distilling companies, such as Jack Daniels, Jim Beam and Seagrams, are major purchasers of malts for use in malt liquors. IBISWorld estimates that distillers account for about 15.0% of industry revenue in Over the past five years, this market segment has managed muted growth. Distillers were hard hit by the recession due to liquor s high price relative to other alcohol beverages, such beer and wine. However, this segment is expected to increase in 2012 as consumer incomes improve. Exports Exports are expected to account for about 24.8% of industry revenue in Major export markets include Mexico, Canada and Japan. For further discussion of industry exports, see the International Trade section of this report.
120 Malt Production in the US November Products & Markets International Trade Level & Trend Exports in the industry are High and Increasing Imports in the industry are Medium and Increasing The Malt Production industry has a high level of exports and a moderate level of import penetration. Industry firms primarily export malt to breweries in Mexico, Canada, Japan and the Dominican Republic. At the same time, they face competition in the domestic market from malts imported from Canada, the United Kingdom, Germany and Belgium. There is a 0.3 cent / kg tax on unroasted malts and 0.42 cent / kg tax on roasted malts imported in the United States. Consequently, about 97.2% of imported malts are non-roasted largely due to their lower tax rate. Trade agreements between the United States and Canada over the past decade have encouraged the integration of the US and Canadian malting industries. Price protections were eliminated, which has resulted into significant trade in malts between the two countries. However, the malting industry in both the United States and Canada continue to compete with the European Union s $ million Industry trade balance Year Exports Imports Balance favorable export support programs for malt barley and malt. Exports Over the five years to 2012, exports have grown at a 10.4% annualized rate to about $262.2 million due to the falling value of the US dollar and growth in beer production abroad. As a share of revenue, 18 SOURCE: Exports To... 6% Other 3% Dominican 5% Republic Japan Imports From... 24% Canada 10% United Kingdom 8% Germany 2% Belgium 1% Other 62% Mexico 79% Canada Year: 2012 SIZE OF CHARTS DOES NOT REPRESENT ACTUAL DATA Total $262.2m Total $255.3m SOURCE: USITC
121 Malt Production in the US November Products & Markets International Trade continued exports rose from about 19.4% in 2007 to 24.8% in Exports to Mexico and Canada were the key drivers of growth, with exports to these countries increasing at 12.2% and 7.3% annualized rates, respectively. Imports Imports have risen at a 13.7% annualized rate over the past five years to about $255.3 million in Changing consumer tastes for beer at the retail level drove up domestic demand for high-quality foreign malts. Malts imported from Canada, which account for 79.3% of total imports, increased at a 13.4% annualized rate from 2007 to Imports of high-quality malts from the United Kingdom and Germany also grew at 22.2% and 33.7% annualized rates, respectively. Consequently, IBISWorld estimates that imports rose from about 16.9% of domestic demand in 2007 to 24.3% in 2012.
122 Malt Production in the US November Products & Markets Business Locations 2012 West AK 0.0 New England West CA 0.0 WA 5.0 MT 5.0 OR 0.0 NV 0.0 Rocky Mountains ID 20.0 UT 0.0 AZ 0.0 WY 5.0 CO 0.0 NM 0.0 ND Plains NE 0.0 MN WI SD 0.0 KS 0.0 Southwest TX 0.0 OK 0.0 IA OH IL IN VA WV KY 0.0 MO 0.0 Great Lakes 25.0 MI 0.0 PA 0.0 AR 0.0 MS 0.0 LA 0.0 TN 0.0 Southeast AL 0.0 Mid- Atlantic GA 0.0 NY NC 5.0 SC 0.0 FL ME West HI 0.0 AdditionalStates(as marked on map) 1VT 2 NH 3MA 4 RI CT 6 NJ 7DE MD DC Establishments(%) Lessthan3% 3%tolessthan10% 10%tolessthan20% 20%ormore SOURCE:
123 Malt Production in the US November Products & Markets Business Locations The distribution of malt manufacturing establishments in the United States closely follows the distribution of its suppliers and downstream brewing and distilling industries. Additionally, many companies are vertically integrated, growing input grains and processing them into malt. As a result, they locate their production facilities close to supplies to cut down on supply chain costs. Location is a key success factor for industry firms in order to profitably access raw materials and export markets. The spread of industry establishments does not change much year to year, although revenue from each region can fluctuate with changes in regional crop yields, input prices, regional downstream demand and per capita beer consumption. The Great Lakes region has about 30.0% of industry establishments. Notable industry operators Cargill, Briess Industries and Rahr Malting Co. are headquartered in the region. Wisconsin has the largest concentration of establishments in the region and the United States, accounting for about 25.0% of the industry total. Minnesota is another prominent state in the region and accounts for about 15.0% of total industry establishments. This region has historically been and continues to be the largest brewing and distilling area in the country, which is why industry firms locate here near the region s downstream buyers. The Rocky Mountains region also accounts for about 30.0% of industry establishments due to the region s favorable growing climate and concentration of barley producers. About 46.9% of domestic barley is produced in this region. States in the region get plenty of direct sunshine throughout the year, % Establishments vs. population West Great Lakes Establishments Population Mid-Atlantic New England Plains Rocky Mountains Southeast Southwest SOURCE: which makes it an ideal grain-growing climate. Idaho, the second-largest malt producing state, is located in the region and has 20.0% of industry establishments alone. The Plains region has about 20.0% of industry establishments due to its concentration of wheat producers. Although barley is the industry s largest production input, wheat is also used in malt production to varying degrees. Overall, the Plains region accounts for about 46.1% of US wheat production. Indiana has the largest concentration of establishments in the region, accounting for about 5.0% of total industry establishments. The Mid-Atlantic, Southeast and West regions account for 10.0%, 5.0% and 5.0% of industry establishments, respectively. There are no establishments in the Southwest and New England regions because of their unfavorable climates for barley and wheat production.
124 Malt Production in the US November Competitive Landscape Market Share Concentration Key Success Factors Cost Structure Benchmarks Basis of Competition Barriers to Entry Industry Globalization Market Share Concentration Level Concentration in this industry is Medium The Malt Production industry has a medium level of concentration, defined as the top four players accounting for between 40.0% and 70.0% of industry revenue. Malteurop and Cargill, the two largest malt producers, are estimated to account for a combined 44.4% of industry revenue and significant shares of the total tonnage produced and consumed in the United States. Other notable firms in the industry are Rahr Malting Co. and Briess Industries along with the malting operations of global brewer InBev (Busch Agricultural Resources). According to latest available US economic census data, the top four industry firms made up about 64.4% of 2007 industry revenue, while the top eight firms accounted for about 95.8% of 2007 industry revenue. Over the five years to 2012, IBISWorld estimates that industry market share concentration has largely remained stable. There has been a degree of consolidation and firm exits, but concentration levels have changed little. Domestic demand for malts continues to grow strongly, which has kept market shares stable despite increased import penetration. While penetration from high-quality imports sourced from Canada and Europe continues to rise due to changing US consumer tastes for beer, this has been counterbalanced by the locally grown movement, which has kept demand for domestically produced malts high among brewers. Key Success Factors IBISWorld identifies 250 Key Success Factors for a business. The most important for this industry are: Economies of scale Larger industry firms have higher bargaining power, which enables them to negotiate cheaper inputs and generate higher profit. Additionally, they are able to spread out fixed production costs over a larger volume of goods, further improving profitability. Ability to alter goods produced in favor of market conditions Industry firms that are able to develop new malt varieties are able to diversify their revenue streams and target new markets, which reduces their revenue volatility. Access to high quality inputs Major industry players are able to locate production facilities close to top barley growing regions in the United States and source high-quality inputs from Canada and Europe to better realize supply chain efficiency and higher profit. Automation reduces costs, particularly those associated with labor Successful firms depend on equipment to modify their production output in response to changing demand conditions. Firms also rely on supply chain software to improve operational efficiency. This lowers wage and distribution costs and improves profit. Supply contracts in place for key inputs Successful industry firms have supply contracts, are vertically integrated with suppliers or trade commodity futures to ensure a steady supply of input grains. Guaranteed supplies at established prices assist in minimizing costs.
125 Malt Production in the US November Competitive Landscape Cost Structure Benchmarks Because there are only 12 enterprises in the Malt Production industry, the cost structure is relevant to most industry players. Still, the largest players enjoy lower per-unit costs compared with the smallest ones in this industry. These larger companies can spread the cost of production over a larger volume of products. volume of products. Profit Profit, or earnings before interest and taxes (EBIT), accounts for about 4.3% of revenue in Profit has been highly volatile over the past five years because it depends on the prices of inputs, such as barley and other coarse grains. Although firms were able to raise product prices when the barley costs jumped, they were only able to raise product prices enough to cover a fraction of the cost. For example, when the price of barley rose 29.9% in 2008 (according to the US Department of Agriculture), profit fell from 4.4% of revenue in 2007 to 4.0% in 2008, despite revenue growth. In the past five years, profit margins have ranged from 3.2% to 5.4% of revenue. However, increased reliance on equipment and machinery has improved operational efficiencies, lowering perunit costs. Purchases Purchases make up the largest cost component, accounting for about 70.6% of revenue in Barley is the most common coarse grain used in malt production, but some firms also purchase rye or wheat to produce malt. Coarse grains, including barley, are substitutes to corn, wheat and soybeans, which have experienced skyrocketing prices as a result of increased demand from the biofuel sector. As more downstream markets turned to coarse Sectorvs.IndustryCosts Percentage of revenue AverageCostsof allindustriesin sector(2012) IndustryCosts (2012) Profit Wages Purchases Depreciation Marketing Rent&Utilities Other SOURCE:
126 Malt Production in the US November Competitive Landscape Cost Structure Benchmarks continued grains, demand rose and the price of coarse grains grew an estimated 7.8% per year on average in the five years to Therefore, this segment has grown as a share of revenue over the past five years. Other products in this segment include packaging for transport. Wages Wages make up about 5.8% of revenue in The malting process depends more on capital and other equipment rather than labor; employees generally supervise the machines and manage production processes. While wages have risen 2.1% per year on average to $61.7 million in the five years to 2012, revenue has grown at a faster rate, lowering wages from 6.8% of revenue in Other costs Other costs make up about 14.4% of revenue in This segment includes overhead, compliance with government regulations, administrative costs, distribution, and research and development (R&D). Some companies are also vertically integrated, so they are able to source, process and distribute at a lower cost than firms that are not vertically integrated. Marketing is a minor part of firms costs; firms generally have supply contracts with downstream buyers, so advertising is not significant. However, many firms have websites that are able to provide stockholders and potential investors information about company performance. Rent and utilities make up about 3.0% of revenue in To produce malt, the barley and other grains must have a large amount of room for the drying process and storage. In addition, firms are using more equipment, including heating devices and fans, to make production more efficient. Using more equipment creates more wear and tear on the machines. As a result, firms spend about 1.7% of revenue on depreciation. Basis of Competition Level & Trend Competition in this industry is Medium and the trend is Steady Competition is high in the Malt Production industry because there is a moderate level of market share concentration. The industry is in the mature phase of its life cycle, which is characterized by intense competition, pressured profit margins and a degree of consolidation. Domestic malt producers face increasing competition from imports; however, underlying domestic demand for malts continues to grow, which has kept competition levels and market shares flat. Consequently, IBISWorld estimates that the level of industry competition has remained steady over the five years to Internal competition The main basis of competition for malt producers is price. Operators also compete over product quality, range of product offerings, and relationships with upstream suppliers and downstream distributors. Other factors include marketing and branding. The ability for malt producers to secure supply and sale contracts with upstream grain producers and downstream brewers is critical for their competitive position. Companies that are able to do so can buy inputs at fixed prices to reduce cost volatility. Similarly, manufacturers invest heavily in establishing strong distribution relationships with downstream malt beverage makers. Some malt producers engage in competition through advertising campaigns to sustain established malt varieties or to encourage downstream breweries and distilleries to purchase
127 Malt Production in the US November Competitive Landscape Basis of Competition continued new malt varieties. The rise of the craft brew movement in the United States has caused the industry to invest in R&D to develop new malt varieties, which are aggressively marketed to niche brewers and distillers. External competition The US Malt Production industry competes internationally with many large, multinational agro-industrial groups. Malt is a global commodity that is traded in international markets to supply brewing and distilling industries worldwide. The key factors affecting world demand for malt are the same variables driving domestic demand. However, changes in global currency exchange rates also have a significant effect on the US market. These fluctuations can influence the price of imports and the threat they pose. In general, the economics of the global malting industry will change depending upon selected barley varieties, their protein and moisture content. Barriers to Entry Level & Trend Barriers to Entry in this industry are Medium and Steady The Malt Production industry has medium and steady barriers to entry that have not changed significantly over the past five years. The primary barrier to entry for market entrants is the level of initial capital investment. Malting requires large up-front investment in a processing plant, equipment, a malting house and initial purchases. As a result, many new market entrants will finance initial operations through lending institutions, such as banks and financing companies. However, credit has been tight and lending institutions have not lent capital in the same amounts or with favorable terms as they had prior to the recession. In addition to capital, new market entrants have to secure supply contracts of cereals grains to ensure consistent production. Without prior operating history, suppliers may be hesitant to enter into supply contracts with market entrants, which can act as a barrier. Another factor that affects new market entrants is the scale of production. Many existing industry firms are characterized by large production volumes, which minimize per-unit costs. Additionally, new market entrants have to achieve enough scale to turn an initial profit at current low grain prices. Although scale is not a barrier to entry, it may hamper BarrierstoEntrychecklist Competition Concentration Life Cycle Stage Capital Intensity Technology Change Regulation & Policy Industry Assistance Level Medium Medium Mature Medium Low Medium Low SOURCE: the success of new firm operations. At the same time, this factor is less critical for firms focusing on developing highervalued products, such as limited specialty malts, to target niche brewing markets. New market entrants would typically focus on malting certain types of grains and would have a limited product portfolio. However, they compete against multinational vertically integrated businesses. Malt producers often integrate the growing of cereal grains, processing of grains into malt and brewing malt beverages into a single company supply chain to better control production and adapt it to changes in market conditions. Vertical integration provides existing firms with greater control over margins and operations across the supply chain and can out
128 Malt Production in the US November Competitive Landscape Barriers to Entry continued potential new entrants from contracts. Therefore, established malt producers enjoy competitive advantages over firms looking to enter the market. Although this is also not a barrier to entry, it may hinder new entrants success. Industry Globalization Level & Trend Globalization in this industry is High and the trend is Increasing Like many other food and beverage industries, the Malt Production industry is affected by trends in global agricultural markets and beer and distilling industries. The industry has a high level of industry globalization, characterized by a high level of international trade and a moderate degree of foreign ownership. Imports of malts from countries such as Canada, the United Kingdom, Germany and Belgium account for 24.3% of domestic demand, while exports to countries such as Mexico, Canada and Japan make up about 24.8% of total industry revenue. Changing consumer tastes for higherquality beers has supported strong growth in the downstream domestic craft brewing industry, which has increasingly demanded new domestic malt varieties and high-quality malts from abroad. Consequently, the level of globalization has increased over the past five years. The industry is also already characterized by multinational agroindustrial companies such as Cargill and Malteurop. For example, Cargill has about 139,000 employees in 65 countries, and 10 malt production faculties spread across North America and Europe. Malteurop, which is based in France and entered the industry in 2008 with the acquisition of ADM s malting operations, has 24 malt production facilities spread across North America, Europe and Oceania to gain easier access to grains grown extensively in North America and Europe. Over the five years to 2017, IBISWorld expects industry globalization to increase due to rising international trade levels and continued cross-border consolidation in the global malting industry. International trade is a major determinant of an industry s level of globalization. Exports offer growth opportunities for firms. However there are legal, economic and political risks associated with dealing in foreign countries. Import competition can bring a greater risk for companies as foreign producers satisfy domestic demand that local firms would otherwise supply. TradeGlobalization GoingGlobal:MaltProduction Exports/Revenue Export Global Export Global MaltProduction Local Import 0 Local 2000 Import Exports/Revenue Imports/DomesticDemand Imports/DomesticDemand SOURCE:
129 Malt Production in the US November Major Companies Malteurop Group Cargill Inc. Other Companies Major players (Market share) Cargill Inc. 19.3% 55.6% Other Malteurop Group 25.1% SOURCE: Player Performance Malteurop Group Market share: 25.1% Industry Brand Names Malteurop North America Inc. The Malteurop Group is the world s leading malt producer, with annual production capacity of more than 2.2 million tons. Founded in 1984 and based in France, the group is owned by a number of agro-industrial cooperative groups in France that together form the Siclae group, the company s majority shareholder. The Malteurop Group has operations in 13 countries in Europe, North America, Oceania and Asia, with 24 production sites and about 830 employees worldwide. In 2008, the group entered the North American market by purchasing Archer Daniels Midland s (ADM) malting division, which was then the leading malt producer in the United States. ADM had average annual production of about 742,000 tons of malt and production operations in the United States, Canada, Australia and New Zealand. It has since been renamed Malteurop North America Inc. The acquisition quickly made the Malteurop Group the world s largest malt producer and gave it a presence in all major malt markets and sectors. IBISWorld estimates that the group s three production facilities in barleyintensive regions in Minnesota and Montana generated about 535,000 tons of malt in Financial performance IBISWorld estimates that Malteurop s industry-specific revenue grew at a 0.9% average annual rate to about $265.9 million from 2009 to Company operations in the United States have benefited greatly from the company s scale, financial resources and the parent company s complementary product portfolio since the acquisition. Malteurop North America has strong bargaining power with grain growers, which has lowered purchase costs and improved profitability. Additionally, it has access to high-quality raw materials from leading agricultural regions in both the United States and Europe. This TheMalteuropGroup(MalteuropNorthAmerica) financialperformance* Year Revenue ($ million) (% change) EBIT ($ million) (% change) 2009** N/C 7.3 N/C *Estimates**AcquisitionofADMMaltdivisionin2008,consolidatedresultsfirstreportedin2009 SOURCE: IBISWORLD
130 Malt Production in the US November Major Companies Player Performance continued access has allowed it to develop new malt varieties and growing itineraries to quickly adapt production volume to meet changes in consumer demand, particularly growing US consumer preferences for locally sourced craft beers. Malteurop has recently invested in a brand-new, state-of-the-art malting plant in Great Falls, MT, giving the company strategic access to one of the most intensive barley growing regions in the United States. Player Performance Cargill Inc. Market share: 19.3% Industry Brand Names Cargill Malt Cargill Inc., based in Minneapolis, is one of the largest private corporations operating in the United States. Founded in 1865, Cargill is now an international producer and marketer of agricultural, food, financial and industrial products and services, with about 139,000 employees in 65 countries. The company operates four divisions: agriculture services, food ingredients and applications, industrial, and risk management and financial. The company operates in the Malt Production industry through its malt division, which is classified under the food ingredients business segment. Cargill originates and transforms malting barley into quality malts that it sells to the global brewing, distilling and food manufacturing industries. Worldwide, Cargill operates 10 malting plants in Belgium, France, Spain, Holland, Germany, the United States and Canada. IBISWorld estimates Cargill s global malt production is about 1.5 million tons, making it one of the top five malt producers worldwide. Within the United States, Cargill operates two production centers, one of which is a key research and development center for the company. This facility is also equipped with equipment to produce specialty malts and a pilot brewery. Financial performance IBISWorld estimates that Cargill s industry-specific revenue increased at a 3.6% average annual rate to about $204.0 million over the five years to Revenue did experience small declines during the recession due to falling consumer demand for malt products at the retail level, but Cargill s diverse malt product offerings and wide complementary product portfolio kept revenue volatility low. Cargill s malt production benefits greatly from the company s scale and vertical integration across the malt supply chain. Company production plants CargillInc.(CargillMalt) financialperformance* Year Revenue ($ million) (% change) EBIT ($ million) (% change) N/C 7.9 N/C *Estimates SOURCE: ANNUAL REPORT AND IBISWORLD
131 Malt Production in the US November Major Companies Player Performance continued are strategically located near major barley growing regions in the United States, which enables the firm to source malt production inputs from company grain operations and improve profitability. Additionally, the firm is an active trader in global commodity futures markets, allowing it to more effectively manage its production input supply and malt inventories to keeps costs down. The company also has cut costs and pursued an international expansion and vertical integration strategy by acquiring downstream food processing industries that use malt. This has further contributed to reduced revenue volatility and improved profitability over the past five years. Other Companies Industry financial information and production data is limited because most firms are privately held and family owned. IBISWorld estimates that the Malt Production industry is a moderately concentrated industry with a number of large and global vertically integrated agro-industrial conglomerates operating in this industry. The market is dominated by Malteurop and Cargill, which combined are estimated to account for about 44.4% of industry revenue and a significant share of the total malt tonnage produced and consumed in the United States. Other notable firms that operate in the industry include Rahr Malting and Briess Industries along with the malt production operations of brewers such as InBev (Busch Agricultural Resources).
132 Malt Production in the US November Operating Conditions Capital Intensity Technology & Systems Revenue Volatility Regulation & Policy Industry Assistance Capital Intensity Level The level of capital intensity is Medium The Malt Production industry has a moderate level of capital intensity. On average, for every dollar industry operators spend on wages, they spend about 29.3 cents on capital, which is consistent with other intermediary agricultural production industries, such as flour milling. Depreciation expenses, an indicator of spending on capital expenses such as equipment and software, accounts for about 1.7% of total industry revenue. Cereal grain malting processes require specialized equipment because the malting process consists of two unique steps: germinating grains and drying them. These processes require investment in large, specialized facilities such as malthouses, which are designed to dry germinated seeds in perforated Capital intensity Capital units per labor unit Economy Manufacturing Malt Production Dotted line shows a high level of capital intensity SOURCE: wooden floors. Consequently, many industry firms are vertically integrated to lower fixed expenses and per-unit costs. ToolsoftheTrade:GrowthStrategiesforSuccess NewAgeEconomy Recreation,PersonalServices, HealthandEducation. Firms benefit from personal wealth so stable macroeconomic conditions are imperative. Brand awareness and niche labor skills are key to product differentiation. InvestmentEconomy Information,Communications, Mining,FinanceandReal Estate.To increase revenue firms need superior debt management, a stable macroeconomic environment and a sound investment plan. LaborIntensive TraditionalServiceEconomy WholesaleandRetail. Reliant on labor rather than capital to sell goods. Functions cannot be outsourced therefore firms must use new technology or improve staff training to increase revenue growth. FlourMilling MaltProduction Distilleries Breweries Wheat,Barley& SorghumFarming Corn,Wheat& SoybeanWholesaling OldEconomy CapitalIntensive AgricultureandManufacturing. Traded goods can be produced using cheap labor abroad. To expand firms must merge or acquire others to exploit economies of scale, or specialize in niche, high-value products. ChangeinShareoftheEconomy SOURCE:
133 Malt Production in the US November Operating Conditions Capital Intensity continued Over the past five years, automation in the industry and capital intensity levels have increased because industry firms have invested in new equipment and software that allow them to more easily adapt and manage production. As a result, malt producers have been able to reduce wages costs. Wages account for just about 5.8% of industry revenue and have steadily declined over the past five years as automation has increased. IBISWorld estimates that industry capital intensity will continue to rise over the next five years due to the continued automation of industry production processes and supply chains. Technology & Systems Level The level of Technology Change is Low The underlying malting process has changed in the past hundred years. Technology change has mainly come through automating this process to both ensure the consistency of the finished malt and reduce labor expenses. Over the five years to 2012, technology change has been low due to the industry s prior investments in automation technologies. However, this investment is increasing as firms purchase equipment to develop new malt varieties catering to craft brewers. The malting process consists of three basic stages: steeping, germination and kilning. In the first stage, grains are immersed in water to encourage growth, followed by period where the water is drained away. Moisture content typically ranges from about 12% to 45%. During germination, the wetted grain is allowed to grow under controlled conditions. Internally, the international structure of the grain is altered, sugars are produced from the grain s starches and natural enzymes develop within the grain kernel. Once the desired growth has occurred, kilning takes place. Warm air is passed through the grain to halt growth and dry the grain to a stable state. Color and flavor compounds are formed, transforming the grain into malt. The entire process takes about seven days. Today, product innovation is a key strategy for malt producers to gain market advantage. To do so, firms focus on research and development. This increases the ability of industry firms to identify the quality of raw inputs and develop new malt varieties by experimenting with new grains outside of barley such as corn, rye and wheat. The industry s adoption of new technology includes updated computer systems. In particular, e-commerce is providing industry firms with improved customer and supplier arrangements, leading to cost savings through better inventory and production planning. In some cases, e-commerce is also used to track exports. Most of the computer system adoption is confined to major players. Revenue Volatility Level The level of Volatility is Medium The Malt Production industry is characterized by a moderate level of revenue volatility, which is a function of input prices, demand from downstream buyers and exchange rates. Because malt is generally made from barley, the rising price of coarse grains forced producers to raise prices where possible, although the entire price hike was typically unable to be passed on. More specifically, the price of malting barley rose 6.3% per year on average in the five years to 2012, including a 47.5% jump in 2009, according to the US Department of Agriculture. Therefore, revenue spiked 12.9% during the same year. However,
134 Malt Production in the US November Operating Conditions Revenue Volatility continued the price of malting barley fell slightly in 2011; coupled with lower demand from breweries as consumers bought less domestic beer, revenue fell 3.6% in Furthermore, exports, which make up about one-quarter of industry revenue, grew strongly over the past five years as a result of a depreciated dollar that made domestic goods relatively cheaper to the global market. Therefore, the industry experienced an average revenue volatility of 8.0% in the past five years. A higher level of revenue volatility implies greater industry risk. Volatility can negatively affect long-term strategic decisions, such as the time frame for capital investment. When a firm makes poor investment decisions it may face underutilized capacity if demand suddenly falls, or capacity constraints if it rises quickly. Revenuevolatility*(%) VolatilityvsGrowth 1000 Hazardous Rollercoaster MaltProduction Stagnant BlueChip Fiveyearannualizedrevenuegrowth(%) * Axis is in logarithmic scale SOURCE: Regulation & Policy Level & Trend The level of Regulation is Medium and the trend is Steady Malt production is not regulated at the industry level. Nevertheless, producers of malt must adhere to various environmental, food and health regulations. This varies between industry firms depending upon their level of vertical integration. These regulations are aimed at maintaining high levels of malt quality and safeguarding end-consumers of malt beverages. Serious breaches or failure to comply with regulations, laws and other rules governing malt production can subject industry players to civil remedies and administrative penalties. It can also result in considerable negative publicity that can damage the reputation and public image of producers. Given this, non-compliance can potentially have a material effect on the earnings and competitive position of firms operating in this industry. Over the past decade, laws and regulations relating to beverage production became more stringent, resulting in increasing compliance costs for industry firms. Malt producers are primarily subject to regulations by federal agencies and state and local governments. Food and Drug Administration Malt manufacturing is chiefly regulated by the Food and Drugs Administration (FDA). This public health agency is part of the Public Health Services. The FDA s main functions can be divided into three main areas: the provision of scientific expertise to the food sector, the maintenance of food safety, and the enforcement of food laws through site inspections and legal sanctions. One of its main responsibilities is to enforce the Federal Food, Drug and Cosmetic Act although it also implements several other public health laws. Under the Federal Food, Drug and Cosmetic
135 Malt Production in the US November Operating Conditions Regulation & Policy continued Act, malt producers are required to comply with a wide range of labeling rules. These relate to matters such as the ingredients used, the presence of genetically modified raw materials, the country in which the malt was produced, and the product description on the packaging. Environmental Protection Agency The Environmental Protection Agency (EPA) is a federal agency responsible for addressing environmental issues and enforcing environmental protection laws. The EPA is responsible for enacting a number of environmental laws including the Clean Water Act (CWA), the Clean Air Act (CAA), the Pollution Prevention Act (PPA) and the Resource Conservation and Recovery Act (RCRA). Together, these statutes and laws affect the methods malt manufacturers employ to handle raw material and dispose of waste. Therefore, firms must be conscious of their processing methods so as not to hurt the environment. State and local governments State and local governments also regulate malt producers. Generally, these governments are responsible for overseeing food safety within their specific jurisdictions. In carrying out this role, state and local governments work with federal agencies to implement beverage production safety standards within their state borders. They also carry out inspections of malting facilities to establish the level of food hygiene present in processing. Industry Assistance Level & Trend The level of Industry Assistance is Low and the trend is Steady The Malt Production industry has a low and steady level of industry assistance. Imports of malt into the United States have a 0.3 cent tax on unroasted malt and a 0.42 cent tax on roasted malt. IBISWorld estimates that, based on US International Trade Association data, unroasted malt accounts for about 97.2% of all imports due to its lower tax rate. In addition to having an effect on the composition of imports, these tariffs do provide assistance to domestic malt producers, although minimal. Imports still account for about 24.8% of domestic malt demand and are projected to continue to increase over the next five years as the US dollar strengthens relative to its trading partners currencies.
136 Malt Production in the US November Key Statistics Industry Data Revenue ($m) Industry Value Added ($m) Establishments Enterprises Employment Exports ($m) Imports ($m) Wages ($m) Domestic Demand ($m) Price of Coarse Grains ( Index) , , , , , , , , , , , , , , , , , , Annual Change Revenue (%) Industry Value Added (%) Establishments (%) Enterprises (%) Employment (%) Exports (%) Imports (%) Wages (%) Domestic Demand (%) Price of Coarse Grains (%) Key Ratios IVA/Revenue (%) Imports/ Demand (%) Exports/Revenue (%) Revenue per Employee ($ 000) Wages/Revenue (%) Employees per Est. Average Wage ($) Share of the Economy (%) , , , , , , , , , , , , , , , , , , , , , , N/A Figures are inflation-adjusted 2012 dollars. SOURCE:
137 Malt Production in the US November Jargon & Glossary Industry Jargon GENETICALLY MODIFIED (GM) A technique in which changes are introduced into a plant or animal s DNA by genetic engineering techniques. GERMINATION The second step in malting barley. It is the process of soaking previously dried barley in water to allow the plant to sprout. HOPS The female flower of plant family Humulus lupulus. Hops are an ingredient to beer that adds a bitter flavor. IBISWorld Glossary BARRIERS TO ENTRY Barriers to entry can be High, Medium or Low. High means new companies struggle to enter an industry, while Low means it is easy for a firm to enter an industry. CAPITAL/LABOR INTENSITY An indicator of how much capital is used in production as opposed to labor. Level is stated as High, Medium or Low. High is a ratio of less than $3 of wage costs for every $1 of depreciation; Medium is $3 $8 of wage costs to $1 of depreciation; Low is greater than $8 of wage costs for every $1 of depreciation. CONSTANT PRICES The dollar figures in the Key Statistics table, including forecasts, are adjusted for inflation using 2012 as the base year. This removes the impact of changes in the purchasing power of the dollar, leaving only the real growth or decline in industry metrics. The inflation adjustments in IBISWorld s reports are made using the US Bureau of Economic Analysis implicit GDP price deflator. DOMESTIC DEMAND The use of goods and services within the US; the sum of imports and domestic production minus exports. EARNINGS BEFORE INTEREST AND TAX (EBIT) IBISWorld uses EBIT as an indicator of a company s profitability. It is calculated as revenue minus expenses, excluding tax and interest. EMPLOYMENT The number of working proprietors, partners, permanent, part-time, temporary and casual employees, and managerial and executive employees. ENTERPRISE A division that is separately managed and keeps management accounts. The most relevant measure of the number of firms in an industry. ESTABLISHMENT The smallest type of accounting unit within an Enterprise; usually consists of one or more locations in a state or territory of the country in which it operates. EXPORTS The total sales and transfers of goods produced by an industry that are exported. IMPORTS The value of goods and services imported with the amount payable to non-residents. INDUSTRY CONCENTRATION IBISWorld bases concentration on the top four firms. Concentration is identified as High, Medium or Low. High means the top four players account for over 70% of revenue; Medium is 40 70% of revenue; Low is less than 40%. INDUSTRY REVENUE The total sales revenue of the industry, including sales (exclusive of excise and sales tax) of goods and services; plus transfers to other firms of the same business; plus subsidies on production; plus all other operating income from outside the firm (such as commission income, repair and service income, and rent, leasing and hiring income); plus capital work done by rental or lease. Receipts from interest royalties, dividends and the sale of fixed tangible assets are excluded. INDUSTRY VALUE ADDED The market value of goods and services produced by an industry minus the cost of goods and services used in the production process, which leaves the gross product of the industry (also called its Value Added). INTERNATIONAL TRADE The level is determined by: Exports/Revenue: Low is 0 5%; Medium is 5 20%; High is over 20%. Imports/Domestic Demand: Low is 0 5%; Medium is 5 35%; and High is over 35%. LIFE CYCLE All industries go through periods of Growth, Maturity and Decline. An average life cycle lasts 70 years. Maturity is the longest stage at 40 years with Growth and Decline at 15 years each. NON-EMPLOYING ESTABLISHMENT Businesses with no paid employment and payroll are known as non-employing establishments. These are mostly set-up by self employed individuals. VOLATILITY The level of volatility is determined by the percentage change in revenue over the past five years. Volatility levels: Very High is greater than ±20%; High Volatility is between ±10% and ±20%; Moderate Volatility is between ±3% and ±10%; and Low Volatility is less than ±3%. WAGES The gross total wages and salaries of all employees of the establishment.
138 At IBISWorld we know that industry intelligence is more than assembling facts It is combining data with analysis to answer the questions that successful businesses ask Identify high growth, emerging & shrinking markets Arm yourself with the latest industry intelligence Assess competitive threats from existing & new entrants Benchmark your performance against the competition Make speedy market-ready, profit-maximizing decisions Who is IBISWorld? We are strategists, analysts, researchers, and marketers. We provide answers to information-hungry, time-poor businesses. Our goal is to provide real world answers that matter to your business in our 700 US industry reports. When tough strategic, budget, sales and marketing decisions need to be made, our suite of Industry and Risk intelligence products give you deeply-researched answers quickly. IBISWorld Membership IBISWorld offers tailored membership packages to meet your needs. Disclaimer This product has been supplied by IBISWorld Inc. ( IBISWorld ) solely for use by its authorized licenses strictly in accordance with their license agreements with IBISWorld. IBISWorld makes no representation to any other person with regard to the completeness or accuracy of the data or information contained herein, and it accepts no responsibility and disclaims all liability (save for liability which cannot be lawfully disclaimed) for loss or damage whatsoever suffered or incurred by any other person resulting from the use of, or reliance upon, the data or information contained herein. Copyright in this publication is owned by IBISWorld Inc. The publication is sold on the basis that the purchaser agrees not to copy the material contained within it for other than the purchasers own purposes. In the event that the purchaser uses or quotes from the material in this publication in papers, reports, or opinions prepared for any other person it is agreed that it will be sourced to: IBISWorld Inc. Copyright 2012 IBISWorld Inc
139 Industrial/ Commercial Malting Companies Canada Malting Rahr Malting Canada Prairie Malt Limited MillerCoors Anheuser-Busch InBev Great Western Malting Cargill Malt Malteurop Briess Malt and Ingredients Co. Colorado Malting Company Michigan Malt Co. Rebel Malting Co. Farmhouse Malt
140 Farm Boys Malt Farm Boys Malt Riverbend Malt Christensen Farms Malting Balcklands Malt
141 Know Your 2013 MALTING BARLEY VARIETIES Two-Rows AC Metcalfe (2005) CDC Copeland (2007) CDC Meredith (2013) Charles* (2009) Conlon (2000) Conrad (2007) Expedition (2013) Harrington (1989) Hockett (2010) Merit (2000) Merit 57 (2010) Moravian 37 (2010) Moravian 69 (2010) Pinnacle (2011) Scarlett (2008) Wintmalt* (2013) Six-Rows Celebration (2011) Lacey (2000) Legacy (2001) Quest (2011) Robust (1984) Stellar-ND (2006) Tradition (2004) Variety name & year first recommended *Winter These malting varieties listed in alphabetical order are recommended by AMBA for planting in When delivered to market in pure carlots of sound, bright, plump, low moisture barley in an acceptable protein range, they may command premium prices over feed barley. Growers are encouraged to contact their local elevator, grain handler or processor to gauge market demand for any variety grown in their region prior to seeding crop plantings by variety are included at the end of this publication. prepared and distributed by AMERICAN MALTING BARLEY ASSOCIATION, INC. 740 N. Plankinton Avenue, Suite 830, Milwaukee, WI
142 (% of AMBA Recommended Six-Row Malting Varieties) Six-Rows CELEBRATION * * 3.0% * 5.7% LACEY 23.4% 23.4% 34.4% 27.7% 27.3% LEGACY 10.9% 6.6% 4.7% 7.3% 3.6% QUEST * * * * 0.5% ROBUST 8.1% 5.5% 6.5% 6.4% 8.1% STELLAR-ND 11.7% 4.7% 2.3% 0.7% 1.7% TRADITION 45.9% 59.8% 49.1% 57.9% 53.1% Two-Rows (% of AMBA Recommended Two-Row Malting Varieties) AC METCALFE 27.9% 25.8% 33.7% 33.0% 27.6% CDC COPELAND 1.1% * 2.1% 1.9% 2.5% CHARLES 0.1% 1.0% 1.2% 1.0% 0.7% CONLON 17.0% 21.5% 10.3% 5.7% 8.3% CONRAD 12.0% 14.6% 16.9% 16.8% 16.7% HARRINGTON 23.7% 17.8% 9.8% 5.6% 3.6% HOCKETT * * 4.7% 6.1% 10.6% MERIT 8.7% 7.7% 7.0% 3.9% 3.6% MERIT 57 * 0.1% 0.2% 6.7% 8.2% MORAVIAN % 3.5% 0.7% 1.0% 0.5% MORAVIAN % 8.0% 12.1% 16.3% 13.3% PINNACLE * * 1.4% 2.1% 3.9% SCARLETT 0.3% * * * 0.4% * Less than 0.1% Source: USDA/NASS Barley Variety Surveys


143 VARIETY IDENTIFICATION 3 PROCEDURE VARIETY IDENTIFICATION IS NOT DIFFICULT Surveys show that in any one community there are usually not more than five or six varieties. With careful study of typical, pure kernel samples one can learn to recognize local varieties with a high degree of accuracy. GUIDES IN IDENTIFYING KERNELS OF BARLEY VARIETIES 1. Study type samples - look at the sample as a whole, not at only a few individual kernels. Line up a row of kernels pointing the base end toward the light source. 2. Use a magnifier with a good strong light - north daylight is best. 3. Know which varieties are being grown in your area - keep an eye open for any new introductions. Study varietal kernel characteristics for each new crop. 4. Do not be afraid to look and look, and look again. TO IDENTIFY A SAMPLE A. Check general appearance of the sample. A pure sample will usually appear uniform. A sample containing a mixture of varieties generally has a non-uniform appearance. B. Determine the major kernel characters as follows: 1. Six-Row or Two-Row - The lateral or side kernels in six-row varieties are twisted. Therefore, in six-row varieties, two-thirds of the kernels are twisted. In two-row varieties, which have no lateral kernels, all kernels are straight and symmetrical and none are twisted. 2. White or Blue pearl (aleurone) This is an easy character to determine with the use of a barley pearling machine. Sometimes blue varieties may have very weakly developed blue color and can be confused with white pearls. 3. Rough or Smooth Beards (awns) There are usually enough broken pieces of beard or short pieces of beard attached to the kernel so that this character can easily be determined. Most smooth or semi-smooth bearded varieties have a few barbs at the tip but have no barbs on the rest of the beard.

144 4. Long or Short Hairs on Rachilla - This is an excellent character to use but a hand magnifying lens is needed to see the rachilla hairs. The difference between long and short hairs is very pronounced and does not vary from year to year or in different areas. Some varieties have aborted rachillas, these can be seen readily with the naked eye. C. If the above characters are not sufficient to identify a variety, other characters will have to be used. The most useful are described below: 1. The basal mark can vary from a depression to a transverse crease. A depression is a smooth uniform hollow or dimple. A transverse crease is a sharp fold or line. 2. Crease shape may vary from wide, open and V-shaped from base of kernel to narrow and almost closed. In some varieties the crease is closed in the bottom half of the kernel and flaring at the tip end. This character will vary with growing conditions and plumpness of kernel Barbs on lateral veins can be seen with a magnifying glass or felt with the finger. Their number varies from none to many in different varieties. These barbs are not related to the barbs on the beards of rough bearded varieties. RACHILLA HAIRS 4. Hairs on glumes require careful observation with a hand magnifying lens to determine the length of hairs and their location on the glume. This can be a very useful character in varieties such as Foster where the glumes are covered with long hairs. 5. Kernel shape varies with growing conditions but can be of value in a local area. The relationship between length and width and fullness in different parts of the kernel are useful characters. Kernel shape may be smooth and tapered or there may be prominent bulges or other distinctive features. Rachilla hairs: left long, center short, right - aborted 6. Wrinkling of the hull varies from very fine to coarse. Many two-row varieties have numerous, very fine wrinkles. Some varieties, such as Steptoe, have very little wrinkling and may have a smooth hull. C. In any area one may find additional characters which will be of use in identifying local varieties. It is important to study locally grown samples each year as some kernel characters may vary depending on the season and location at which a variety is grown.

145 KERNEL CHARACTERS 5 Hairiness of glumes: left to right covered, in band, on midline, without hairs or smooth. GLUME HAIRS Variations in width. CREASE SHAPE crease shape and

146 KERNEL CHARACTERS 6 Basal mark: left depression, center depression tending to crease, right transverse crease. BASAL MARK Wrinkling of hulls: left slightly wrinkled, center semi-wrinkled, right wrinkled. HULL WRINKLING


147 7 SIX-ROW MALTING BARLEY VARIETIES CELEBRATION PEARL RACHILLA BEARD White Short Hairs Semi-smooth Crease is open with crease hairs. Kernel is mid-long to long. LACEY PEARL RACHILLA BEARD White Short Hairs Smooth V-shaped, narrow at base. Kernels medium large, plump, and wide at center. Veins moderately prominent. LEGACY PEARL RACHILLA BEARD White Long Hairs Smooth Crease V-shaped with crease hairs. Several barbs on lateral veins. Hull wrinkled with sharkskin in interveinal areas.


148 ROBUST PEARL RACHILLA BEARD White Short Hairs Smooth Crease V-shaped, narrow at base. Hull slightly wrinkled. Barbs on lateral veins absent. Central vein moderately prominent, lateral veins less prominent. Kernel wide at center, full on crease side. 8 STELLAR-ND PEARL RACHILLA BEARD White Long Hairs Semi-Smooth Crease V-shaped, narrow at base, flared toward beard end. Veins moderately prominent. Kernel plump with no prominent bulges. TRADITION PEARL RACHILLA BEARD White Long Hairs Semi-smooth Crease V-shaped with crease hairs and fence hairs. Kernel is midlong to long and narrow.


149 9 TWO-ROW MALTING BARLEY VARIETIES AC METCALFE PEARL RACHILLA BEARD White Long Hairs Rough Crease narrow at base, flared toward beard end. CDC COPELAND PEARL RACHILLA BEARD White Long Hairs Rough Crease narrow at the base, flared toward beard end. CHARLES PEARL RACHILLA BEARD White Short Hairs Rough Crease V-shaped and open at base.


150 10 CONRAD PEARL RACHILLA BEARD White Long Hairs Rough Ventral crease is open and lacking crease hairs. Kernel large and midlong to long. HARRINGTON PEARL RACHILLA BEARD White Long Hairs Rough Crease narrow, shallow and flared toward beard end. Barbs on lateral veins absent. Kernel broad and diamond shaped. Hull smooth to slightly wrinkled and skins easily. MERIT PEARL RACHILLA BEARD White Long Hairs Rough Crease narrow at base, flared toward beard end. Prominent lateral veins. Mid-long kernel.
151 11 SCARLETT PEARL RACHILLA BEARD White Long Hairs Rough Hull extensively wrinkled in distal half of the kernel.
152 * * * ** ** * ** * ** ** ** * ** ** ** Variety Drummond Excel Foster Lacey Legacy Rasmusson Robust Stander Stellar-ND Tradition AC Metcalfe B1202 Baronesse Bob Bowman CDC Copeland Conlon Conrad Pearl W W W W W W W W W W W W W W W W W W Beard SS S SS SS SS SS S S SS SS R R R R SS R SS R Rachilla Hairs L L L S L S S S L L L L L L L L L L Basal Mark D DC DC DC DC C DC DC D D D D D D DC D DC D KEY TO KERNEL IDENTIFICATION Hull Lateral Vein Barbs Glume- Hair Other Characters W W W W W W N N-F N F S F SIX-ROW VARIETIES C/L B/L C/L C/S B/L C/S Crease narrow at base, flared toward beard end. Kernel, midlong to long, plump, with no prominent bulges. Crease narrow at base, flared toward beard end. Long hairs on rachilla may be infrequent, fragile. Crease V-shaped, narrow at base. Crease V-shaped, narrow at base. Kernels medium large, plump, and wide at center. Veins moderately prominent. Crease V-shaped with crease hairs. Several barbs on moderately prominent lateral veins. Hull wrinkled with sharkskin in interveinal areas. Crease V-shaped, narrow at base. Kernel plump like Stander. W W S W N N-F N S C/S C/S C/L B/L Crease V-shaped, narrow at base. Central vein moderately prominent, lateral veins less prominent. Kernel wide at center, full on crease side. Crease V-shaped, narrow at base. Plump as Robust. Crease narrow at base, flaring at beard end. Kernels plump with no prominent bulges. Crease V-shaped with crease hairs and fence hairs. Kernel long and narrow. TWO-ROW VARIETIES W F C/L Crease narrow at base, flared toward beard end. W N C/L Crease narrow at base, flared toward beard end. Loose hull. W W N N C/L C/S Mid-long to long kernel. Crease narrow lower half, flared at beard end. Lateral sterile florets are extremely reduced in size vs typical two-row barley. Narrow crease, veins are prominent and hull is wrinkled in distal half of the kernel. W W W W N N-F N N B/L B/L B/L Crease narrow and shallow at base, flared toward beard end. Plump kernel, broad in relation to length. Crease narrow at base, flaring toward beard end. Crease narrow and shallow at base, flared toward beard end. Kernel plump, symmetrical, smooth with no prominent bulges. Crease is open and lacking crease hairs. Kernel mid-loang to Long.
153 Variety Pearl Beard Rachilla Hairs Basal Mark Hull Lateral Vein Barbs Glume- Hair Other Characters TWO-ROW VARIETIES (continued) * Craft W SS L DC W N B/L Gallatin W R S D W N C/S Crease narrow at base, flared toward beard end. * Garnet W R L DC W N C/L Lateral veins prominent. Kernels broad at midpoint, giving kernels a diamond shape. ** Harrington W R L D S-W N C/L Crease narrow, shallow. Loose Hull. Diamond shaped kernel. Haxby W SS L D W N-F B/L Crease narrow and shallow at base and flared toward beard end. ** Hockett W R L D W N C/L Crease narrow, shallow. Kernels finely wrinkled. Lewis W R L D W N C/L Crease narrow at base, flared toward beard end. ** Merit W R L D W F B/L Crease narrow at base, flared toward beard end. Prominent veins. Mid-long kernel. ** Moravian 37 W R L D W N C/L Crease V-shaped. Narrow at base, flared toward beard end. Radiant W R L W Crease narrow and veins prominent without pigment. Kernels long and plump and lateral sterile florets are extremely reduced in size vs typical two-row barley. ** Scarlett W R L W Hull extensively wrinkled in distal half of the kernel. Valier Xena W W R R L L D D W W N-F N C/L C/S Crease narrow lower half, flared at beard end. Prominent veins. Crease narrow in lower half, flared toward beard end. Lateral florets greatly reduced in size. **Recommended by AMBA for planting in *Recommended in previous years. ABBREVIATIONS Variety: w-winter; Pearl: W-white, B-blue; Beard: R-rough, S-smooth, SS-semi-smooth; Rachilla Hairs: S-short, L-Long; Basal Mark: D-depression, C- crease, DC-depression tending to crease; Hull: W-wrinkled, S-smooth; Lateral Vein Barbs: N-none, F-few, S-several, Nu-numerous: Glume-hair: C-Covered, B-band, M-midline, S-short, L-long.


154
155 BEAVER CREEK BREWERY PO BOX 196 WIBAUX MT FAT JACK'S TAP ROOM 3513 PRESTWICK RD BILLINGS MT HARVEST MOON BREWING PO BOX 510 BELT MT OUTLAW BREWING 3309 SUNDANCE DR BOZEMAN MT KETTLEHOUSE BREWING COMPANY 313 N 1ST ST W MISSOULA MT GLACIER BREWING COMPANY 6 10TH AVE E POLSON MT WILDWOOD BREWING INC 4018 US HIGHWAY 93 N STEVENSVILLEMT UBERBREW 1669 AUGSBURG DR BILLINGS MT ANGRY HANKS MICROBREWERY 2940 ROCKRIM LN BILLINGS MT CANYON CREEK BREWING 2460 FERN DR BILLINGS MT BILLINGS BREWING CO /2 N BROADWAY BILLINGS MT DRAUGHT WORKS 915 TOOLE AVE MISSOULA MT THE FRONT BREWING COMPANY PO BOX 2493 GREAT FALLS MT BITTER ROOT BREWING 101 MARCUS ST HAMILTON MT BOZEMAN BREWING CO INC. 504 N BROADWAY AVE BOZEMAN MT HIMMELBERGER BREWING PO BOX BILLINGS MT THE GREAT NORTHERN BREWING COMPA2 CENTRAL AVE WHITEFISH MT CARTERS BREWING 3011 COVE CREEK CIR BILLINGS MT BIG SKY BREWING COMPANY PO BOX MISSOULA MT YELLOWSTONE VALLEY BREWING CO 2123 B 1ST AVE N BILLINGS MT NEPTUNE'S BREWERY 119 N L ST LIVINGSTON MT BLACKSMITH BREWING COMPANY 114 MAIN ST STEVENSVILLEMT KETTLEHOUSE BREWING COMPANY LLC 313 N 1ST ST W MISSOULA MT LONE PEAK BREWING COMPANY PO BOX BIG SKY MT LEWIS AND CLARK BREWING COMPANY 1517 DODGE AVE HELENA MT YELLOWSTONE VALLEY BREWING COMP2123B 1ST AVE N BILLINGS MT BLACKFOOT RIVER BREWING COMPANY 66 S PARK AVE HELENA MT PHILIPSBURG BREWING COMPANY PO BOX 843 PHILIPSBURG MT BAYERN BREWING 1507 MONTANA ST MISSOULA MT QUARRY BREWING 124 W BROADWAY ST BUTTE MT MADISON RIVER BREWING COMPANY FRONTAGE RD BELGRADE MT TAMARACK BREWING COMPANY 105 BLACKTAIL RD LAKESIDE MT FLATHEAD LAKE BREWING E SHORE DR BIGFORK MT BOWSER BREWING COMPANY TH AVE S GREAT FALLS MT TAMARACK BREWING COMPANY 105 BLACKTAIL RD LAKESIDE MT RED LODGE ALES BREWING COMPANY PO BOX 2278 RED LODGE MT MISSOURI BREAKS BREWING PO BOX 654 WOLF POINT MT BREWING COMPANY 101 E OAK ST BOZEMAN MT ANGRY HANK'S MICROBREWERY 2940 ROCKRIM LN BILLINGS MT HIGHERGROUND BREWING CO 518 N 1ST ST HAMILTON MT DESERT MOUNTAIN BREWING AND DRAU220 S MONTANA ST BUTTE MT BRIDGER BREWING COMPANY 1609 S 11TH AVE BOZEMAN MT KALISPELL BREWING LLC PO BOX 1886 KALISPELL MT BADLANDS BREWERY COUNTY ROAD 33CULBERTSON MT H.A. BREWING CO 2525 GRAVE CREEK RD EUREKA MT BONSAI BREWING PROJECT 6475 US HIGHWAY 93 S WHITEFISH MT MIGHTY MO BREWING CO PO BOX 3311 GREAT FALLS MT 59403
156 Montana Barley for Malt 2012 Marketing Year Cooperating with the Montana Department of Agriculture 10 W 15 th Street, Suite 3100 Helena, MT FAX Released: September 17, Million Bushels of Montana Malt Barley Purchased During the 2012 Marketing Year Maltsters and brewers purchased 27.6 million bushels of Montana s barley crop between July 1, 2012 and June 30, 2013 to make malt. This is up 15.8 percent from the same period a year ago, according to a recent survey conducted by the USDA, NASS, Montana Field Office. The survey was requested and funded by the Montana Wheat and Barley Committee. The average protein of the purchased barley was 11.9 percent, which is slightly higher than the 11.6 percent average from a year ago. Average plumpness decreased 1 percentage point from last year to 88 percent. Montana growers planted 1,000,000 acres of barley in 2013, up 100,000 acres from Of the total, approximately 66 percent, or 660,000 acres, were planted to malting barley varieties. AC Metcalfe was the most frequently purchased variety by maltsters and brewers this year. AC Metcalfe, an Anheuser Busch variety, accounted for 32 percent of the total purchases. Hockett, Moravian 115, and Merit 57 were also commonly purchased varieties at 18, 17, and 11 percent of the total, respectively. Fifty-eight percent of all malt barley purchased was grown in North Central Montana compared with 54 percent last year and 64 percent two years ago. Fifteen percent was purchased from the South Central district, and 12 percent of the total was purchased from the Central district growers. This survey was requested and funded by the Montana Wheat and Barley Committee. Special thanks to the maltsters, brewers, and grain elevators that cooperated in furnishing data. USDA, NASS, Montana Field Office Ron Schumacher, Statistician Montana Department of Agriculture Ron de Yong, Director Montana Wheat & Barley Committee Kimberly Falcon, Executive Vice President
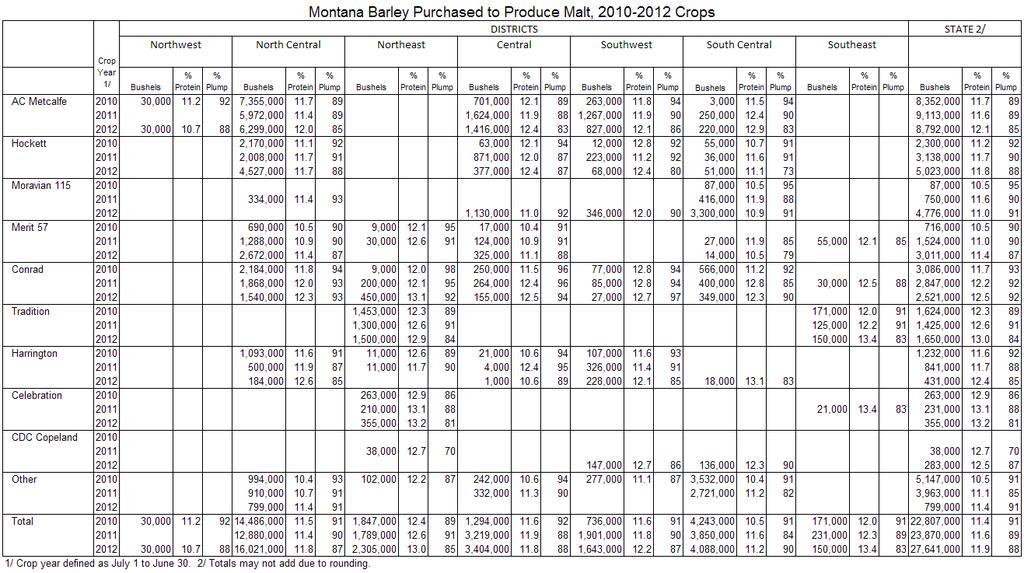
157
158 Montana Barley Varieties 2013 Cooperating with the Montana Department of Agriculture 10 W 15 th Street, Suite 3100 Helena, MT Released: July 29, 2013 The total acres of barley seeded in Montana in 2013 are reported at 1,000,000 acres, up from 900,000 acres planted in Montana now ranks first in planted barley acreage in the United States for 2013, according to the USDA National Agricultural Statistics Service, Montana Field Office. The top variety seeded in Montana for the sixth year in a row was AC Metcalfe, followed by Haxby, Hockett and Moravian 115. TOP MALTING VARIETIES AC Metcalfe continues to be the leading malting barley variety for the sixth year in a row. Montana growers seeded 300,800 acres (30.1 percent of total acres of barley planted in Montana). AC Metcalfe is a two-row malting barley developed by Agriculture and Agri-Food Canada, located in Brandon, Manitoba. It has an 8 percent higher yield, but matures one day later than Harrington. It is resistant to loose smut, and is moderately resistant to the spot-form of net blotch, surface-borne smuts, and common root rot. It has plump kernels and high test weight, but it is susceptible to scald and septoria. Hockett is the second leading malting barley variety planted in Montana producers planted 105,400 acres, accounting for 10.5 percent of the total barley acres planted this year. Hockett is a two rowed dry land variety that was developed by Montana State University (MSU) in When compared to Harrington, Hockett has a higher yield and better malt quality given dry land conditions. It is susceptible to lodging and stripe rust. Moravian 115 ranked third among malting barley varieties seeded for the 2013 crop year. A total of 78,000 acres or 7.8 percent of all barley is planted to this variety. This is a two rowed variety bred by Coors Brewing Company. It Is a small-stature, high yielding variety with high extract and moderate protein. It is a semi-dwarf barley and typically does not lodge under normal production conditions. Conrad is the fourth most common malting barley variety seeded in A total of 48,900 acres were planted, accounting for 4.9 percent of the total acres seeded. Conrad is a two-row variety released by Busch Agricultural Resources in This variety is a medium-tall plant with fair straw strength and a medium late maturity. Conrad has malt protein levels similar to Merit and Harrington. Its resistance to both scald and net blotch is slightly better than Harrington and is resistant to rust stripe. TOP FORAGE VARIETIES Haybet has been the top forage barley variety seeded for the past fourteen years. Montana farmers planted 60,700 acres, accounting for 6.1 percent of the total acres seeded in It was developed cooperatively by the Agricultural Research Service, USDA, and the Montana Agricultural Experiment Station in It is a two-rowed, hooded, white-kernel spring hay barley. Compared to Horsford hay barley, Haybet is 3 days later in heading and similar in plant height and percent lodging. Haybet is higher in hay yield than Horsford, but they are similar in yield. Hays is the second most common forage barley variety planted in 2013 with 14,900 acres or 1.5 percent of the total barley planted. It is a two-rowed hooded hay barley developed by MSU, and is a cross between Haybet and Baronesse varieties. Forage yields are similar to Haybet and higher than Westford. Hays is about three inches shorter and heads two days later than Haybet, however, the two varieties have similar test weights. TOP FEED VARIETIES Haxby remained the top feed barley variety planted for feed in 2013 for the seventh year in a row. Producers planted 112,600 acres in 2013 up from 74,900 in This variety accounts for 11.3 percent of the total barley acres planted in Montana. Haxby is a two-rowed barley developed by MSU. Yields are equal to Baronesse and Eslick and are higher than Gallatin and Valier varieties. It is medium height and maturity, and has superior performance in low moisture conditions. Haxby has high test weights in both dry land and irrigated areas. Champion is the second most common Montana feed barley variety in Montana growers planted 18,500 acres, accounting for 1.9 percent of the 2013 planted acres. Champion was developed by WestBred LLC, Bozeman, Montana in It is a cross between Baronesse and Camas. It is a two-row spring barley that has a semi-erect to intermediate growth habit. Champion has fair to good resistance to lodging and shattering. It also shows strengths to neck breaking and drought. Data compiled and summarized by the Montana Field Office of the National Agricultural Statistics Service, an agency of USDA, as a service provided for the Montana Wheat and Barley Committee Eric Sommer, Director USDA, NASS, MT Field Office Ron de Yong, Director Montana Department of Agriculture Ron Schumacher, Statistician USDA, NASS, MT Field Office
159 Barley: 2013 Seeded Acreage and Percent of Total Seeded by District South Northwest North Central Northeast Central Southwest Variety Central Southeast State Total (000) % (000) % (000) % (000) % (000) % (000) % (000) % (000) % AC Metcalfe Haxby Hockett Moravian Haybet Conrad Merit Tradition Conlon Harrington Champion Hector Hays Lavina Voyager Moravian CDC Copeland Baronesse Moravian Stockford Stark Boulder Horsford Other & Unknown All Varieties , Barley: 2012 Seeded Acreage and Percent of Total Seeded by District Variety Northwest North Central Northeast Central Southwest South Central Southeast State Total (000) % (000) % (000) % (000) % (000) % (000) % (000) % (000) % AC Metcalfe Hockett Haxby Haybet Merit Moravian Conlon Conrad Harrington Tradition Hays Merit Moravian Champion Moravian Horsford Stockford CDC Copeland Baronesse Westford Hector Gallatin Celebration Other & Unknown All Varieties Barley: Percent of Total Seeded Acreage & Seeded Acreage Percent of Total Seeded Acreage Seeded Acres (000) Variety AC Metcalfe Haxby Hockett Moravian Haybet Conrad Merit Tradition Conlon Harrington Champion Hector Hays Lavina Voyager Moravian CDC Copeland Baronesse Moravian Stockford Stark Boulder Horsford Celebration Gallatin Merit Westford Other & Unknown All Varieties ,000.0

160


161

162
BRD BREWERS RESOURCE DIRECTORY
 BRD2013-2014 BREWERS RESOURCE DIRECTORY BENCHMARKING AND BESTPRACTICES SURVEY RESULTS REWERS ASSOCIATION MEMBERS-ONLY EXCLUSIVE CONTENT BREWERS ASSOCIATION MEMBERS-ONLY EXCLUSIVE CONTENT BREWERS ASSOCIATION
BRD BREWERS RESOURCE DIRECTORY
 BRD03-04 BREWERS RESOURCE DIRECTORY BENCHMARKING AND BESTPRACTICES SURVEY RESULTS REWERS ASSOCIATION MEMBERS-ONLY EXCLUSIVE CONTENT BREWERS ASSOCIATION MEMBERS-ONLY EXCLUSIVE CONTENT BREWERS ASSOCIATION
40 TH Barley Improvement Conference. Hacienda Hotel, San Diego, California January 11-12, 2015
 40 TH Barley Improvement Conference Hacienda Hotel, San Diego, California January 11-12, 2015 Sponsors American Malting Barley Association Idaho Barley Commission Idaho Grain Producers Association Minnesota
Benchmarking and Best Practices Survey Results
 nt brewers association members-only Exclusive content brewers association members-only Exclusive content brewers association members-only Exclusive Content bre brewers resource directory 211-212 Benchmarking
ECONOMIC IMPACT OF WINE AND VINEYARDS IN NAPA COUNTY
 ECONOMIC IMPACT OF WINE AND VINEYARDS IN NAPA COUNTY An Report prepared for Jack L. Davies Napa Valley Agricultural Land Preservation Fund and Napa Valley Vintners JUNE 2005 FULL ECONOMIC IMPACT OF WINE
The State of the Craft Beer Raw Material Supply Sector; or Beer, Hops and Barley
 The State of the Craft Beer Raw Material Supply Sector; or Beer, Hops and Barley Damon Scott damon@brewersassociation.org Technical Brewing Projects Coordinator Brewers Association Brewers Association
2017 FINANCIAL REVIEW
 2017 FINANCIAL REVIEW In addition to activity, strategy, goals, and challenges, survey respondents also provided financial information from 2014, 2015, and 2016. Select results are provided below: 2016
American Malting Barley Association, Inc.
 1986 1990 1994 1998 2002 2006 2010 2014 American Malting Barley Association, Inc. 740 North Plankinton Avenue, Suite 830 / Milwaukee, WI 53203 / (414) 272-4640 / Fax: (414) 272-4631 / http://www.ambainc.org
National Retail Report-Dairy
 Dairy Market News Branch Agricultural Marketing Service National Retail Report-Dairy Websites: http://www.marketnews.usda.gov/mnp/da-home and http://www.ams.usda.gov/mnreports/dybretail.pdf Volume 85-
CIRCLE The Center for Information & Research on Civic Learning & Engagement
 FACT SHEET CIRCLE The Center for Information & Research on Civic Learning & Engagement Youth in the States during the 2004 Presidential and 2002 Midterm Elections By Carrie Donovan, Mark Hugo Lopez, and
Gecko Hospitality Survey Report 2017
 Salary Gecko Hospitality Survey Report 2017 www.geckohospitality.com Dear Restaurant Professional, On behalf of Gecko Hospitality, it s my pleasure to present our third annual Hospitality Management Salary
THE ECONOMIC IMPACT OF WINE AND WINE GRAPES ON THE STATE OF TEXAS 2015
 THE ECONOMIC IMPACT OF WINE AND WINE GRAPES ON THE STATE OF TEXAS 2015 A Frank, Rimerman + Co. LLP Report Updated January 2017 This study was commissioned by the Texas Wine and Grape Growers Association
National Retail Report-Dairy
 Dairy Market News Branch Agricultural Marketing Service National Retail Report-Dairy Websites: http://www.marketnews.usda.gov/mnp/da-home and http://www.ams.usda.gov/mnreports/dybretail.pdf Volume 86-
National Retail Report-Dairy
 Dairy Market News Branch Agricultural Marketing Service National Retail Report-Dairy Websites: http://www.marketnews.usda.gov/mnp/da-home and http://www.ams.usda.gov/mnreports/dybretail.pdf Volume 85-
DATA AND ASSUMPTIONS (TAX CALCULATOR REVISION, MARCH 2017)
") DATA AND ASSUMPTIONS (TAX CALCULATOR REVISION, MARCH 2017) Taxes on sugary drinks can generate considerable revenue for states, cities, and the nation. The revised Revenue Calculator for Sugary Drink Taxes
DATA AND ASSUMPTIONS (TAX CALCULATOR REVISION, MARCH 2017) Taxes on sugary drinks can generate considerable revenue for states, cities, and the nation. The revised Revenue Calculator for Sugary Drink Taxes
National Retail Report-Dairy
 Dairy Market News Branch Agricultural Marketing Service National Retail Report-Dairy Websites: http://www.marketnews.usda.gov/mnp/da-home and http://www.ams.usda.gov/mnreports/dybretail.pdf Volume 86-
Technical Memorandum: Economic Impact of the Tutankhamun and the Golden Age of the Pharoahs Exhibition
 Technical Memorandum: Economic Impact of the Tutankhamun and the Golden Age of the Pharoahs Exhibition Prepared for: The Franklin Institute Science Museum Prepared by: Urban Partners November 2007 Economic
PROFILE OF MARKET SERVED: Automatic Merchandiser. E-Newsletters. Marketing WEBSITE METRICS. Sessions Users Pageviews
 SOUTHCOMM ANALYTICS AUDIENCE PROFILE SOUTHCOMM BUSINESS MEDIA, LLC 1233 Janesville Ave., Fort Atkinson, WI 53538 800.547.7377 Southcomm.com For Period of July-September 2017 Automatic MERCHANDISER PROFILE
National Retail Report-Dairy
 Dairy Market News Branch Agricultural Marketing Service National Retail Report-Dairy Websites: http://www.marketnews.usda.gov/mnp/da-home and http://www.ams.usda.gov/mnreports/dybretail.pdf Volume 86-
National Retail Report-Dairy
 Dairy Market News Branch Agricultural Marketing Service National Retail Report-Dairy Websites: http://www.marketnews.usda.gov/mnp/da-home and http://www.ams.usda.gov/mnreports/dybretail.pdf Volume 83-
State Licensing of Wine Sales in Food Stores: Impact on Existing Liquor Stores
 State Licensing of Wine Sales in Food Stores: Impact on Existing Liquor Stores Prepared by American Economics Group, Inc. for Food Marketing Institute March 2004 AMERICAN ECONOMICS GROUP, Inc. 2100 M St.
State Individual Income Tax Rates
 State Individual Income Tax Rates State Low High Low High Low High Alaama 1.500 5.000 2.000 5.000 2.000 5.000 Alaska 0.000 0.000 0.000 0.000 0.000 0.000 Arizona 2.000 8.000 3.800 7.000 2.870 5.040 Arkansas
Bob Dickey. Bob Dickey. President, National Corn Growers Association Corn Grower from Laurel, Nebraska
 Bob Dickey Corn farmers in the United States are graded each year on how they respond to market demands, handle the pressure of weather extremes and improve their overall production practices. Their end
THE ECONOMIC IMPACT OF THE WINE AND GRAPE INDUSTRY IN CANADA 2015
 THE ECONOMIC IMPACT OF THE WINE AND GRAPE INDUSTRY IN CANADA 2015 Canada s Wine Economy Ripe, Robust, Remarkable A Report with special assistance from Rob Eyler, President, Economic Forensics and Analytics
Certified Organic Survey 2016 Summary
 United States Department of Agriculture National Agricultural Statistics Service Certified Organic Survey 0 Summary September 0 Contents Introduction... Page V TABLES. Farms, Land, and Value of Sales
The Economic Impact of Wine and Grapes in Lodi 2009
 The Economic Impact of Wine and Grapes in Lodi 2009 Prepared for the Lodi District Grape Growers Association and the Lodi Winegrape Commission May 2009 A S T O N E B R I D G E R E S E A R C H R E P O R
EXECUTIVE SUMMARY OVERALL, WE FOUND THAT:
 THE ECONOMIC IMPACT OF CRAFT BREWERIES IN LOS ANGELES LA s craft brewing industry generates short-term economic impacts through large capital investments, equipment purchases, and the construction of new
THE ECONOMIC IMPACT OF BEER TOURISM IN KENT COUNTY, MICHIGAN
 THE ECONOMIC IMPACT OF BEER TOURISM IN KENT COUNTY, MICHIGAN Dan Giedeman, Ph.D., Paul Isely, Ph.D., and Gerry Simons, Ph.D. 10/8/2015 THE ECONOMIC IMPACT OF BEER TOURISM IN KENT COUNTY, MICHIGAN EXECUTIVE
Sportzfun.com. Source: Joseph Pine and James Gilmore, The Experience Economy, Harvard Business School Press.
 National Extension Tourism Conference Park City, Utah Center for Agribusiness and Economic Development June 15 th, 2009 or Agribusin siness and Econ onomic Deve Center fo velopment What does Agritourism
THE ECONOMIC IMPACT OF MODEL WINERIES IN TEXAS. Industry Report
 THE ECONOMIC IMPACT OF MODEL WINERIES IN TEXAS Industry Report by Pati Mamardashvili, PhD International School of Economics at Tbilisi State University, Tbilisi, Georgia Tim Dodd, PhD Texas Tech University,
Results from the First North Carolina Wine Industry Tracker Survey
 Results from the First North Carolina Wine Industry Tracker Survey - 2009 Dr. Michael R. Evans Director and Professor of Hospitality and Tourism Management and Dr. James E. Stoddard Professor of Marketing
Need it faster? Use 2-day or overnight shipping! We re sorry, due to state laws we are unable to expedite shipping to AZ, MA or NJ.
 Delivery Information Adult Signature Required Please send your wine to a home or business address where an individual at least 21 years of age is available during regular business hours to sign. By law
The Economic Impact of the Craft Brewing Industry in Maine. School of Economics Staff Paper SOE 630- February Andrew Crawley*^ and Sarah Welsh
 The Economic Impact of the Craft Brewing Industry in Maine School of Economics Staff Paper SOE 630- February 2017 Andrew Crawley*^ and Sarah Welsh School of Economics, University of Maine Executive Summary
SPRING WHEAT FUTURES AND OPTIONS
 SPRING WHEAT FUTURES AND OPTIONS W hether it s a farmer near Minot, a trader in Minneapolis or a there is only one place to look when it comes to hard red spring WORLD S LARGEST SPRING WHEAT MARKET Since
ECONOMIC IMPACTS OF THE FLORIDA CITRUS INDUSTRY IN
 ECONOMIC IMPACTS OF THE FLORIDA CITRUS INDUSTRY IN 2007- Mohammad Rahmani and Alan W. Hodges Food and Resource Economics Department Institute of Food and Agricultural Sciences FLORIDA CITRUS INDUSTRY HIGHLIGHTS
Economic Contributions of the Florida Citrus Industry in and for Reduced Production
 Economic Contributions of the Florida Citrus Industry in 2014-15 and for Reduced Production Report to the Florida Department of Citrus Alan W. Hodges, Ph.D., Extension Scientist, and Thomas H. Spreen,
McDONALD'S AS A MEMBER OF THE COMMUNITY
 McDONALD'S ECONOMIC IMPACT WITH REBUILDING AND REIMAGING ITS RESTAURANTS IN SOUTH LOS ANGELES, CALIFORNIA A Report to McDonald's Corporation Study conducted by Dennis H. Tootelian, Ph.D. November 2010
The 2006 Economic Impact of Nebraska Wineries and Grape Growers
 A Bureau of Business Economic Impact Analysis From the University of Nebraska Lincoln The 2006 Economic Impact of Nebraska Wineries and Grape Growers Dr. Eric Thompson Seth Freudenburg Prepared for The
BREWERS ASSOCIATION CRAFT BREWER DEFINITION UPDATE FREQUENTLY ASKED QUESTIONS. December 18, 2018
 BREWERS ASSOCIATION CRAFT BREWER DEFINITION UPDATE FREQUENTLY ASKED QUESTIONS December 18, 2018 What is the new definition? An American craft brewer is a small and independent brewer. Small: Annual production
HONDURAS. A Quick Scan on Improving the Economic Viability of Coffee Farming A QUICK SCAN ON IMPROVING THE ECONOMIC VIABILITY OF COFFEE FARMING
 HONDURAS A Quick Scan on Improving the Economic Viability of Coffee Farming 1 OBJECTIVES OF STUDY Overall objective Identify opportunities for potential benefits to coffee farmers from improved farm profitability
US Barley Acreage Million Acres
 Million Acres 9.00 US Barley Acreage 8.00 7.00 6.00 5.00 4.00 3.00 2.00 1.00 0.00 1990 1993 1996 1999 2002 2005 2008 2011 2014 14.0 Canadian Barley Acreage 12.0 10.0 8.0 6.0 4.0 2.0 0.0 US Barley Production
Zoning, Manufacturing, and Alcohol, OH MY! Nancy Palmer Executive Director, Georgia Craft Brewers Guild
 Zoning, Manufacturing, and Alcohol, OH MY! Nancy Palmer Executive Director, Georgia Craft Brewers Guild Being prepared for a growing and changing industry All aspects of the alcohol industry are changing
2016 STATUS SUMMARY VINEYARDS AND WINERIES OF MINNESOTA
 IN PARTNERSHIP WITH THE NORTHERN GRAPES PROJECT, AN USDA SPECIALITY CROPS RESEARCH INITIATIVE PROGRAM, NIFA 2016 STATUS SUMMARY VINEYARDS AND WINERIES OF MINNESOTA Brigid Tuck and William Gartner INTRODUCTION
THE ECONOMIC IMPACT OF WINE AND WINE GRAPES ON THE STATE OF VIRGINIA 2015
 THE ECONOMIC IMPACT OF WINE AND WINE GRAPES ON THE STATE OF VIRGINIA 2015 A Report Updated January 2017 This study was commissioned by the Virginia Wine Board The Wine Business Center, 899 Adams St., Suite
GENERAL DESCRIPTION OF INDUSTRY AND COMPANY
 Appendix G Appendix Sample G: Import Business Business Plan: Otoro Plan: Import Company Otoro Import Company EXECUTIVE SUMMARY Otoro Imports is a spice importing and marketing corporation established in
J / A V 9 / N O.
 July/Aug 2003 Volume 9 / NO. 7 See Story on Page 4 Implications for California Walnut Producers By Mechel S. Paggi, Ph.D. Global production of walnuts is forecast to be up 3 percent in 2002/03 reaching
Grain Stocks. Corn Stocks Up 15 Percent from June 2014 Soybean Stocks Up 54 Percent All Wheat Stocks Up 28 Percent
 Grain Stocks ISSN: 949-095 Released June 30, 05, by the National Agricultural Statistics Service (NASS), Agricultural Statistics Board, United s Department of Agriculture (USDA). Corn Stocks Up 5 Percent
An Examination of operating costs within a state s restaurant industry
 University of Nevada, Las Vegas Digital Scholarship@UNLV Caesars Hospitality Research Summit Emerging Issues and Trends in Hospitality and Tourism Research 2010 Jun 8th, 12:00 AM - Jun 10th, 12:00 AM An
Washington Wine Commission: Wine industry grows its research commitment
 PROGRESS EDITION MARCH 22, 2016 10:33 PM Washington Wine Commission: Wine industry grows its research commitment HIGHLIGHTS New WSU Wine Science Center a significant step up for industry Development of
Assessment of Management Systems of Wineries in Armenia
 International Wine Conference "Global Trends and Best Practices in the Wine World: Implications and Recommendations for Armenia" November 24, 2017 Assessment of Management Systems of Wineries in Armenia
Economic and Fiscal Impacts of LiftFund:
 Economic and Fiscal Impacts of LiftFund: 2010-2015 Study Conducted By: Steven R. Nivin, Ph.D., LLC April 2016 1 I. Executive Summary LiftFund is a non-profit small business lender with the mission to provide
Grape Growers of Ontario Developing key measures to critically look at the grape and wine industry
 Grape Growers of Ontario Developing key measures to critically look at the grape and wine industry March 2012 Background and scope of the project Background The Grape Growers of Ontario GGO is looking
2010 Analysis of the U.S. Non-GMO Food Soybean Variety Pipeline. Seth L. Naeve, James H. Orf, and Jill Miller-Garvin University of Minnesota
 2010 Analysis of the U.S. Non-GMO Food Soybean Variety Pipeline Seth L. Naeve, James H. Orf, and Jill Miller-Garvin University of Minnesota Japan Soy Food Summit June 29-30, 2010 Tokyo, Japan! Sponsored
New England Middle Atlantic Region
 New England Middle Atlantic Region I. States of the New England Middle Atlantic Region: Maine - Delaware New Hampshire - New York Vermont - New Jersey Massachusetts - Pennsylvania Connecticut - Maryland
DISTILLERY REPORT. Prepared for Colorado Distillers Guild
 DISTILLERY REPORT Prepared for Colorado Distillers Guild Consumer Insights and Business Innovation Center (CiBiC) Daniels College of Business, University of Denver Intern Researcher: Federica Bologna Faculty
Total cheese output (excluding cottage cheese) was 982 million pounds, 4.2 percent above February 2017 but 10.5 percent below January 2018.
 was 982 million pounds, 4.2 percent above February 2017 but 10.5 percent below January 2018.") Dairy Products ISSN: 949-0399 Released April 4,, by the National Agricultural Statistics Service (NASS), Agricultural Statistics Board, United States Department of Agriculture (USDA). Highlights Total
Dairy Products ISSN: 949-0399 Released April 4,, by the National Agricultural Statistics Service (NASS), Agricultural Statistics Board, United States Department of Agriculture (USDA). Highlights Total
May 11, The Honorable Tom Vilsack Secretary of Agriculture U.S. Department of Agriculture 1400 Independence Avenue, SW Washington, D.C.
 May 11, 2015 The Honorable Tom Vilsack Secretary of Agriculture U.S. Department of Agriculture 1400 Independence Avenue, SW Washington, D.C. 20250 Dear Secretary Vilsack: This letter is in regard to the
WE DELIVER A Comprehensive Economic Impact Study of the U.S. Foodservice Distribution Industry.
 WE DELIVER A Comprehensive Economic Impact Study of the U.S. Foodservice Distribution Industry Introduction The foodservice distribution industry has a significant impact on communities across America.
Recipe for the Northwest
 Recipe for the Northwest States: Idaho, Montana, Oregon, Washington, and Wyoming Latitude: 41 N to 49 N Elevation: The lowest areas are at sea level along the Pacific Ocean and the Snake River in Idaho
Illinois Asphalt Pavement Association. March 12, 2013
 Illinois Asphalt Pavement Association March 12, 2013 Illinois Tollway Perspective Collaboration Common goals Comprehensive solutions Communications People will pay for value Commitment Leadership Building
Bt Corn IRM Compliance in Canada
 Bt Corn IRM Compliance in Canada Canadian Corn Pest Coalition Report Author: Greg Dunlop (BSc. Agr, MBA, CMRP), ifusion Research Ltd. 15 CONTENTS CONTENTS... 2 EXECUTIVE SUMMARY... 4 BT CORN MARKET OVERVIEW...
Total cheese output (excluding cottage cheese) was 1.08 billion pounds, 2.8 percent above August 2017 but 0.7 percent below July 2018.
 was 1.08 billion pounds, 2.8 percent above August 2017 but 0.7 percent below July 2018.") Dairy Products ISSN: 949-0399 Released October 4,, by the National Agricultural Statistics Service (NASS), Agricultural Statistics Board, United States Department of Agriculture (USDA). Highlights Total
Dairy Products ISSN: 949-0399 Released October 4,, by the National Agricultural Statistics Service (NASS), Agricultural Statistics Board, United States Department of Agriculture (USDA). Highlights Total
Title: Western New York Sweet Corn Pheromone Trap Network Survey
 Title: Western New York Sweet Corn Pheromone Trap Network Survey Project leader(s): Marion Zuefle Cooperator(s): Abstract: The New York sweet corn pheromone trap network (SCPTN) is an affiliation of extension
Total cheese output (excluding cottage cheese) was 1.10 billion pounds, 2.7 percent above March 2017 and 11.6 percent above February 2018.
 was 1.10 billion pounds, 2.7 percent above March 2017 and 11.6 percent above February 2018.") Dairy Products ISSN: 949-0399 Released May 3,, by the National Agricultural Statistics Service (NASS), Agricultural Statistics Board, United States Department of Agriculture (USDA). Highlights Total cheese
Dairy Products ISSN: 949-0399 Released May 3,, by the National Agricultural Statistics Service (NASS), Agricultural Statistics Board, United States Department of Agriculture (USDA). Highlights Total cheese
ECONOMIC IMPACT OF LEGALIZING RETAIL ALCOHOL SALES IN BENTON COUNTY. Produced for: Keep Dollars in Benton County
 ECONOMIC IMPACT OF LEGALIZING RETAIL ALCOHOL SALES IN BENTON COUNTY Produced for: Keep Dollars in Benton County Willard J. Walker Hall 545 Sam M. Walton College of Business 1 University of Arkansas Fayetteville,
Total cheese output (excluding cottage cheese) was 1.06 billion pounds, 3.1 percent above September 2017 but 2.0 percent below August 2018.
 was 1.06 billion pounds, 3.1 percent above September 2017 but 2.0 percent below August 2018.") Dairy Products ISSN: 949-0399 Released November,, by the National Agricultural Statistics Service (NASS), Agricultural Statistics Board, United States Department of Agriculture (USDA). Highlights Total
Dairy Products ISSN: 949-0399 Released November,, by the National Agricultural Statistics Service (NASS), Agricultural Statistics Board, United States Department of Agriculture (USDA). Highlights Total
Total cheese output (excluding cottage cheese) was 1.07 billion pounds, 0.9 percent above April 2017 but 3.7 percent below March 2018.
 was 1.07 billion pounds, 0.9 percent above April 2017 but 3.7 percent below March 2018.") Dairy Products ISSN: 949-0399 Released June 4,, by the National Agricultural Statistics Service (NASS), Agricultural Statistics Board, United States Department of Agriculture (USDA). Highlights Total cheese
Dairy Products ISSN: 949-0399 Released June 4,, by the National Agricultural Statistics Service (NASS), Agricultural Statistics Board, United States Department of Agriculture (USDA). Highlights Total cheese
The University of Georgia
 The University of Georgia Center for Agribusiness and Economic Development College of Agricultural and Environmental Sciences A Survey of Pecan Sheller s Interest in Storage Technology Prepared by: Kent
Total cheese output (excluding cottage cheese) was 1.09 billion pounds, 1.4 percent above May 2017 and 1.7 percent above April 2018.
 was 1.09 billion pounds, 1.4 percent above May 2017 and 1.7 percent above April 2018.") Dairy Products ISSN: 949-0399 Released July 5,, by the National Agricultural Statistics Service (NASS), Agricultural Statistics Board, United States Department of Agriculture (USDA). Highlights Total cheese
Dairy Products ISSN: 949-0399 Released July 5,, by the National Agricultural Statistics Service (NASS), Agricultural Statistics Board, United States Department of Agriculture (USDA). Highlights Total cheese
ETHIOPIA. A Quick Scan on Improving the Economic Viability of Coffee Farming A QUICK SCAN ON IMPROVING THE ECONOMIC VIABILITY OF COFFEE FARMING
 ETHIOPIA A Quick Scan on Improving the Economic Viability of Coffee Farming 1 OBJECTIVES OF STUDY Overall objective Identify opportunities for potential benefits to coffee farmers from improved farm profitability
THE ECONOMIC IMPACT OF NORTH CAROLINA WINE AND WINE GRAPES 2013
 THE ECONOMIC IMPACT OF NORTH CAROLINA WINE AND WINE GRAPES 2013 A Report May 2015 This study was commissioned by North Carolina Department of Agriculture and Consumer Services The Wine Business Center,
Cider Survey. Northwest. A collaboration between Dr. Mellie Pullman & the Northwest Cider Association, with asistance from Irvine & Co.
 Northwest Cider Survey 2015 A collaboration between Dr. Mellie Pullman & the Northwest Cider Association, with asistance from Irvine & Co., CPA s Photo credit: Richard Duval Images Previous Page Photo
VR-Business Partnership Profile
 VR-Business Partnership Profile + STARBUCKS INCLUSION ACADEMY: NEVADA ROASTING PLANT View the Starbucks Edition of the Vocational Rehabilitation- Business Partnership Profile to learn more about how the
Sprouts is a healthy grocery store offering fresh, natural and organic foods at great prices. Based on the belief that healthy food should be
 Sprouts is a healthy grocery store offering fresh, natural and organic foods at great prices. Based on the belief that healthy food should be affordable, Sprouts welcoming environment and knowledgeable
Total cheese output (excluding cottage cheese) was 1.12 billion pounds, 3.0 percent above October 2017 and 6.1 percent above September 2018.
 was 1.12 billion pounds, 3.0 percent above October 2017 and 6.1 percent above September 2018.") Dairy Products ISSN: 949-0399 Released December 4,, by the National Agricultural Statistics Service (NASS), Agricultural Statistics Board, United States Department of Agriculture (USDA). Highlights Total
Dairy Products ISSN: 949-0399 Released December 4,, by the National Agricultural Statistics Service (NASS), Agricultural Statistics Board, United States Department of Agriculture (USDA). Highlights Total
THE ECONOMIC IMPACT OF NORTH CAROLINA WINE AND WINE GRAPES 2016
 THE ECONOMIC IMPACT OF NORTH CAROLINA WINE AND WINE GRAPES 2016 A Report August 2017 This study was commissioned by North Carolina Department of Agriculture and Consumer Services The Wine Business Center,
YAKIMA VALLEY TOURISM ANNUAL REPORT
 YAKIMA VALLEY TOURISM ANNUAL REPORT 17 20 LEADERSHIP MESSAGE On behalf of the Board of Directors and staff of Yakima Valley Tourism, we are proud to present our 2017 Annual Report. Tourism means economic
Table of Contents. Contact Information
 Case Study 2015 Table of Contents The Challenge.......................................................................... 1 Pizza Hut and the U.S. Pizza Market...................................................
CASE STUDY: HOW STARBUCKS BREWS LOGISTICS SUCCESS
 CASE STUDY: HOW STARBUCKS BREWS LOGISTICS SUCCESS We love to put order in your chaos. Morai Logistics Inc. is a 3rd party logistics provider with an operating agency agreement representing Mode Transportation.
The Economic Contribution of the Colorado Wine Industry
 The Economic Contribution of the Colorado Wine Industry Doug Caskey, Exec. director CO Wine Industry Development Board Dawn Thilmany, PhD CSU Dept. of Ag and Resource Economics and CSU Extension Contributions
Sample. TO: Prof. Hussain FROM: GROUP (Names of group members) DATE: October 09, 2003 RE: Final Project Proposal for Group Project
 DATE: October 09, 2003 RE: Final Project Proposal for Group Project") Sample TO: Prof. Hussain FROM: GROUP (Names of group members) DATE: October 09, 2003 RE: Final Project Proposal for Group Project INTRODUCTION Our group has chosen Chilean Wine exports for our research
Sample TO: Prof. Hussain FROM: GROUP (Names of group members) DATE: October 09, 2003 RE: Final Project Proposal for Group Project INTRODUCTION Our group has chosen Chilean Wine exports for our research
DELIVERING REFRESHING SOFT DRINKS
 BEVERAGES DIVISION DELIVERING REFRESHING SOFT DRINKS Swire Beverages manufactures, markets and distributes refreshing soft drinks to consumers in Hong Kong, Taiwan, Mainland China and the USA. 46 215 PERFORMANCE
A. FEDERAL / NATIONAL / INTERNATIONAL B. THE COURTS C. THE STATES. Distribution and Franchise:
 A. FEDERAL / NATIONAL / INTERNATIONAL Small Brewer Federal Excise Tax Legislation Update. H.R. 1236, the Small Brewer Reinvestment and Expanding Workforce Act (Small BREW Act) introduced by Representatives
Brewers Association 2019 Hop Industry Update Hop Survey Results Inventory and National Hop Report Federal Affairs
 Brewers Association Hop Industry Update Hop Survey Results Inventory and National Hop Report Federal Affairs There is at least one point in the history of any company when you have to change dramatically
 www.brewersassociation.org The Search for a Public Malting Barley Variety Better Suited for All Malt Brewing and lessons we all learned along the way Brewers Association ~3,850 Members of over 5,439 U.S.
Total cheese output (excluding cottage cheese) was 1.08 billion pounds, 1.0 percent above November 2017 but 4.3 percent below October 2018.
 was 1.08 billion pounds, 1.0 percent above November 2017 but 4.3 percent below October 2018.") Dairy Products ISSN: 949-0399 Released February 4, 209, by the National Agricultural Statistics Service (NASS), Agricultural Statistics Board, United States Department of Agriculture (USDA). Highlights
Dairy Products ISSN: 949-0399 Released February 4, 209, by the National Agricultural Statistics Service (NASS), Agricultural Statistics Board, United States Department of Agriculture (USDA). Highlights
Project Title: Testing biomarker-based tools for scald risk assessment during storage. PI: David Rudell Co-PI (2): James Mattheis
: James Mattheis") FINAL PROJECT REPORT Project Title: Testing biomarker-based tools for scald risk assessment during storage PI: David Rudell Co-PI (2): James Mattheis Organization: TFRL, USDA-ARS Organization: TFRL, USDA-ARS
FINAL PROJECT REPORT Project Title: Testing biomarker-based tools for scald risk assessment during storage PI: David Rudell Co-PI (2): James Mattheis Organization: TFRL, USDA-ARS Organization: TFRL, USDA-ARS
Craft Brewer Definition
 Craft Brewer Definition Craft Brewer: An American craft brewer is small, independent and traditional. Small = Annual production of beer less than 6 million barrels. Beer production is attributed to a brewer
Acreage Forecast
 World (John Sandbakken and Larry Kleingartner) The sunflower is native to North America but commercialization of the plant took place in Russia. Sunflower oil is the preferred oil in most of Europe, Mexico
Work Sample (Minimum) for 10-K Integration Assignment MAN and for suppliers of raw materials and services that the Company relies on.
 for 10-K Integration Assignment MAN and for suppliers of raw materials and services that the Company relies on.") Work Sample (Minimum) for 10-K Integration Assignment MAN 4720 Employee Name: Your name goes here Company: Starbucks Date of Your Report: Date of 10-K: PESTEL 1. Political: Pg. 5 The Company supports the
Work Sample (Minimum) for 10-K Integration Assignment MAN 4720 Employee Name: Your name goes here Company: Starbucks Date of Your Report: Date of 10-K: PESTEL 1. Political: Pg. 5 The Company supports the
ENVIRONMENT INDUSTRY PEOPLE. Corporate Citizenship. do well, so we may do good
 PEOPLE INDUSTRY ENVIRONMENT Corporate Citizenship do well, so we may do good Outside The BUNN Community Outreach program encourages employees to become involved in volunteer philanthropic efforts in the
Attachments: Memo from Lisa Applebee, ACHD Project Manager PowerPoint Slides for October 27, 2009 Work Session
 Date: October 22, 2009 To: From: Re: Mayor and City Council Karen Gallagher Transportation Planner Fairview Avenue Concept Design and Access Management Plan Update and Public Outreach Plan Requested Action:
Re: Winery-Vineyard Economic Impacts
 University of Wisconsin Madison/Extension Office of Steven Deller Department of Agricultural and Applied Economics 515 Taylor Hall 247 Lorch St. Madison, WI 53706 (608) 263-6251 (fax) (608) 262-4376 scdeller@wisc.edu
THE ECONOMIC IMPACT OF NEW JERSEY WINE AND VINEYARDS 2016
 THE ECONOMIC IMPACT OF NEW JERSEY WINE AND VINEYARDS 2016 A Report December 2017 This study was commissioned by the Garden State Wine Growers Association The Wine Business Center, 899 Adams St., Suite
Quality of the United States Soybean Crop: Dr. Seth. L. Naeve and Dr. James H. Orf 2
 Quality of the United States Soybean Crop: 2007 1 Dr. Seth. L. Naeve and Dr. James H. Orf 2 Summary The American Soybean Association and the US Soybean Export Council have supported a survey of the quality
2011 Regional Wine Grape Marketing and Price Outlook
 Center for Crop Diversification Survey CCD-SV-1 2011 Regional Wine Grape Marketing and Price Outlook Timothy Woods and Matthew Ernst Dr. Woods is an Extension Professor at the University of Kentucky. Mr.
Exhibitor Prospectus
 Uniting the U.S. Beverage Industry Exhibitor Prospectus U.S. BEVERAGE INDUSTRY INDUSTRY EXPO TRADE SHOW AND CONFERENCE February 16-18, 2016 Washington, D.C. Something BIG is Happening in the Beverage Industry!
Differentiation in integrated health care policy approach an empirical analysis based on regional health life expectancy in China
 Differentiation in integrated health care policy approach an empirical analysis based on regional health life expectancy in China Mingxu Yang, Bei Lu 4 th International Conference of Long Term Care Directors
Starbucks BRAZIL. Presentation Outline
 Starbucks BRAZIL Prepared by: Aminata Ouattara Daniele Albagli Melissa Butz Matvey Kostromichev Presentation Outline Introduction Mission & Objectives PESTEL Analysis PORTER Analysis SWOT Analysis Capabilities
FINA Pre-Budget 2018 Consultation Submission. A Solution to Advance the Canadian Value-Added Wine Sector
 FINA Pre-Budget 2018 Consultation Submission EXECUTIVE SUMMARY A Solution to Advance the Canadian Value-Added Wine Sector Canada is ranked as the second most attractive market in the world for wine sales,