Vallejo Broadway Starbucks
|
|
|
- Darren McDaniel
- 5 years ago
- Views:
Transcription

1 Vallejo Broadway Starbucks Draft Initial Study and Negative Declaration Appendices Prepared by: City of Vallejo Planning Division 555 Santa Clara Street Vallejo, California July 2014
2 Appendix A Air Quality and Climate Change Data
3 CalEEMod Version: CalEEMod Page 1 of 1 Date: 7/11/ :29 PM Vallejo Broadway Starbucks San Francisco Bay Area Air Basin, Annual 1.0 Project Characteristics 1.1 Land Usage Land Uses Size Metric Lot Acreage Floor Surface Area Population Fast Food Restaurant with Drive Thru sqft , Parking Lot sqft , Other Non-Asphalt Surfaces sqft , Other Project Characteristics Urbanization Urban Wind Speed (m/s) 2.2 Precipitation Freq (Days) 64 Climate Zone 4 Operational Year 2016 Utility Company Pacific Gas & Electric Company CO2 Intensity (lb/mwhr) CH4 Intensity (lb/mwhr) N2O Intensity (lb/mwhr) User Entered Comments & Non-Default Data Project Characteristics - Land Use - Construction Phase - Sequestration - Table Name Column Name Default Value New Value tbllanduse LandUseSquareFeet 1, , tbllanduse LandUseSquareFeet 12, , tbllanduse LandUseSquareFeet 6, , tblprojectcharacteristics OperationalYear tblsequestration NumberOfNewTrees Emissions Summary 2.1 Overall Construction Unmitigated Construction N CO2 CH4 N2O CO2e Year tons/yr MT/yr e e e e e e
4 Mitigated Construction N CO2 CH4 N2O CO2e Year tons/yr MT/yr e e e e e e NBio-CO2 CO2 CH4 N20 CO2e Percent Reduction Overall Operational Unmitigated Operational N CO2 CH4 N2O CO2e Category tons/yr MT/yr Area e- Energy Waste e e- Mobile e e e e e e e e e e e e Water e e e Mitigated Operational N CO2 CH4 N2O CO2e Category tons/yr MT/yr Area e- Energy Mobile e- Waste e e e e e e e e e e e e e Water e e e NBio-CO2 CO2 CH4 N20 CO2e Percent Reduction
5 2.3 Vegetation Vegetation CO2e Category t MT o n New Trees Construction Detail Construction Phase Phase Number Phase Name Phase Type Start Date End Date Num Days Week Num Days Phase Description 1 Building Construction Building Construction 1/20/2015 6/8/ Paving Paving 6/9/2015 6/15/ Architectural Coating Architectural Coating 6/16/2015 6/22/ Acres of Grading (Site Preparation Phase): 0 Acres of Grading (Grading Phase): 0 Acres of Paving: 0 Residential Indoor: 0; Residential Outdoor: 0; Non-Residential Indoor: 12,951; Non-Residential Outdoor: 4,317 (Architectural Coating OffRoad Equipment Phase Name Offroad Equipment Type Amount Usage Hours Horse Power Load Factor Architectural Coating Air Compressors Paving Cement and Mortar Mixers Building Construction Cranes Building Construction Forklifts Paving Pavers Paving Rollers Building Construction Tractors/Loaders/Backhoes Paving Tractors/Loaders/Backhoes Trips and VMT Phase Name Offroad Equipment Count Worker Trip Number Vendor Trip Number Hauling Trip Number Worker Trip Length Vendor Trip Length Hauling Trip Length Worker Vehicle Class Vendor Hauling Vehicle Class Vehicle Class Building Construction LD_Mix HDT_Mix HHDT Paving LD_Mix HDT_Mix HHDT Architectural Coating LD_Mix HDT_Mix HHDT
6 3.1 Mitigation Measures Construction 3.2 Building Construction Unmitigated Construction On-Site N CO2 CH4 N2O CO2e Category tons/yr MT/yr Off-Road e e Unmitigated Construction Off-Site N CO2 CH4 N2O CO2e Category tons/yr MT/yr Hauling Vendor e e e e e e e e e Worker e e e e e e e e e e e e e e e e e e e Mitigated Construction On-Site N CO2 CH4 N2O CO2e Category tons/yr MT/yr Off-Road e e
7 Mitigated Construction Off-Site N CO2 CH4 N2O CO2e Category tons/yr MT/yr Hauling Vendor e e e e e e e e e Worker e e e e e e e e e e e e e e e e e e e Paving Unmitigated Construction On-Site N CO2 CH4 N2O CO2e Category tons/yr MT/yr Off-Road e e e e e e e Paving e e e e e e e e Unmitigated Construction Off-Site N CO2 CH4 N2O CO2e Category tons/yr MT/yr Hauling Vendor Worker e e e e e e e e e e e e e e e e Mitigated Construction On-Site N CO2 CH4 N2O CO2e Category tons/yr MT/yr Off-Road e e e e e e e Paving e e e e e e e e
8 Mitigated Construction Off-Site N CO2 CH4 N2O CO2e Category tons/yr MT/yr Hauling Vendor Worker e e e e e e e e e e e e e e e e Architectural Coating Unmitigated Construction On-Site N CO2 CH4 N2O CO2e Category tons/yr MT/yr Archit. Coating Off-Road e e e e e e e e e e e e e e e Unmitigated Construction Off-Site N CO2 CH4 N2O CO2e Category tons/yr MT/yr Hauling Vendor Worker e e e e e e e e e e Mitigated Construction On-Site N CO2 CH4 N2O CO2e Category tons/yr MT/yr Archit. Coating Off-Road e e e e e e e e e e e e e e e
9 Mitigated Construction Off-Site N CO2 CH4 N2O CO2e Category tons/yr MT/yr Hauling Vendor Worker e e e e e e e e e e Operational Detail - Mobile 4.1 Mitigation Measures Mobile N CO2 CH4 N2O CO2e Category tons/yr MT/yr Mitigated e e e Unmitigated e e e Trip Summary Information Fast Food Restaurant with Drive Thru , , ,827 Other Non-Asphalt Surfaces Parking Lot , , , , Trip Type Information Average Daily Trip Rate Unmitigated Mitigated Land Use Weekday Saturday Sunday Annual VMT Annual VMT Miles Trip % Trip Purpose % Land Use H-W or C-W H-S or C-C H-O or C-NW H-W or C- Fast Food Restaurant with Drive W 2.20 Thru Other Non-Asphalt Surfaces Parking Lot H-S or C-C H-O or C-NW Primary Diverted Pass-by LDA LDT1 LDT2 MDV LHD1 LHD2 MHD HHD OBUS UBUS MCY SBUS MH
10 5.0 Energy Detail 4.4 Fleet Mix Historical Energy Use: N 5.1 Mitigation Measures Energy N CO2 CH4 N2O CO2e Category tons/yr MT/yr Electricity Mitigated e e Electricity Unmitigated e e NaturalGas Mitigated e e e e e e e e NaturalGas Unmitigated e e e e e e e e Energy by Land Use - NaturalGas Unmitigated NaturalGa s Use N CO2 CH4 N2O CO2e Land Use kbtu/yr tons/yr MT/yr Fast Food Restaurant with Drive Thru Other Non-Asphalt Surfaces e Parking Lot e e e e e e e e e e e e e e e Mitigated NaturalGa s Use ROG NOx CO SO2 N CO2 CH4 N2O CO2e Land Use kbtu/yr tons/yr MT/yr Other Non-Asphalt Surfaces Parking Lot Fast Food Restaurant with Drive Thru e e e e e e e e e e e e e e e e
11 5.3 Energy by Land Use - Electricity Unmitigated Electricity Use CO2 CH4 N2O CO2e Land Use kwh/yr t o n Fast Food Restaurant with Drive Thru Other Non-Asphalt Surfaces e- Parking Lot e e- MT/yr e e e Mitigated Electricity Use CO2 CH4 N2O CO2e Land Use kwh/yr t o n Fast Food Restaurant with Drive Thru Other Non-Asphalt Surfaces e- MT/yr e Parking Lot e e e e Area Detail 6.1 Mitigation Measures Area N CO2 CH4 N2O CO2e Category tons/yr MT/yr Mitigated e e e e- Unmitigated e e e e-
12 6.2 Area by SubCategory Unmitigated N CO2 CH4 N2O CO2e SubCategory tons/yr MT/yr Architectural Coating Consumer Products Landscaping e e e e e e e e e- Mitigated N CO2 CH4 N2O CO2e SubCategory tons/yr MT/yr Architectural Coating Consumer Products Landscaping e e e e e e e e e- 7.0 Water Detail 7.1 Mitigation Measures Water CO2 CH4 N2O CO2e Category t o n MT/yr Mitigated e- Unmitigated e
13 7.2 Water by Land Use Unmitigated Land Use Mgal t o n Fast Food Restaurant with Drive Thru Other Non-Asphalt Surfaces Indoor/Out door Use / CO2 CH4 N2O CO2e MT/yr e- Parking Lot 0 / / e Mitigated Indoor/Out door Use CO2 CH4 N2O CO2e Land Use Mgal t o n Fast Food Restaurant with Drive Thru Other Non-Asphalt Surfaces / MT/yr e- Parking Lot 0 / / e Waste Detail 8.1 Mitigation Measures Waste Category/Year CO2 CH4 N2O CO2e t MT/yr o n Mitigated Unmitigated
14 8.2 Waste by Land Use Unmitigated Waste Disposed CO2 CH4 N2O CO2e Land Use tons t o n MT/yr Fast Food Restaurant with Drive Thru Other Non-Asphalt Surfaces 0 Parking Lot Mitigated Waste Disposed CO2 CH4 N2O CO2e Land Use tons t o n MT/yr Fast Food Restaurant with Drive Thru Other Non-Asphalt Surfaces 0 Parking Lot Operational Offroad Equipment Type Number Hours/Day Days/Year Horse Power Load Factor Fuel Type 10.0 Vegetation CO2 CH4 N2O CO2e Category t o n MT Unmitigated Net New Trees Species Class Number of Trees CO2 CH4 N2O CO2e t MT o n Mixed Hardwood
15 CalEEMod Version: CalEEMod Page 1 of 1 Date: 7/11/ :23 PM Vallejo Broadway Starbucks San Francisco Bay Area Air Basin, Summer 1.0 Project Characteristics 1.1 Land Usage Land Uses Size Metric Lot Acreage Floor Surface Area Population Fast Food Restaurant with Drive Thru sqft , Parking Lot sqft , Other Non-Asphalt Surfaces sqft , Other Project Characteristics Urbanization Urban Wind Speed (m/s) 2.2 Precipitation Freq (Days) 64 Climate Zone 4 Operational Year 2016 Utility Company Pacific Gas & Electric Company CO2 Intensity (lb/mwhr) CH4 Intensity (lb/mwhr) N2O Intensity (lb/mwhr) User Entered Comments & Non-Default Data Project Characteristics - Land Use - Construction Phase - Sequestration - Table Name Column Name Default Value New Value tbllanduse LandUseSquareFeet 1, , tbllanduse LandUseSquareFeet 12, , tbllanduse LandUseSquareFeet 6, , tblprojectcharacteristics OperationalYear tblsequestration NumberOfNewTrees Emissions Summary 2.1 Overall Construction (Maximum Daily Emission) Unmitigated Construction NBio- CO2 CO2 CH4 N2O CO2e Year lb/day lb/day , , , , , ,
16 Mitigated Construction NBio- CO2 CO2 CH4 N2O CO2e Year lb/day lb/day , , , , , , NBio- CO2 CO2 CH4 N20 CO2e Percent Reduction Overall Operational Unmitigated Operational NBio- CO2 CO2 CH4 N2O CO2e Category lb/day lb/day Area e e Energy e- Mobile e e- 3, , e e- 3, , , e e , Mitigated Operational NBio- CO2 CO2 CH4 N2O CO2e Category lb/day lb/day Area e e Energy e- Mobile e e- 3, , e e- 3, , , e e , NBio-CO2 CO2 CH4 N20 CO2e Percent Reduction
17 3.0 Construction Detail Construction Phase Phase Number Phase Name Phase Type Start Date End Date Num Days Week Num Days Phase Description 1 Building Construction Building Construction 1/20/2015 6/8/ Paving Paving 6/9/2015 6/15/ Architectural Coating Architectural Coating 6/16/2015 6/22/ Acres of Grading (Site Preparation Phase): 0 Acres of Grading (Grading Phase): 0 Acres of Paving: 0 Residential Indoor: 0; Residential Outdoor: 0; Non-Residential Indoor: 12,951; Non-Residential Outdoor: 4,317 (Architectural Coating OffRoad Equipment Phase Name Offroad Equipment Type Amount Usage Hours Horse Power Load Factor Architectural Coating Air Compressors Paving Cement and Mortar Mixers Building Construction Cranes Building Construction Forklifts Paving Pavers Paving Rollers Building Construction Tractors/Loaders/Backhoes Paving Tractors/Loaders/Backhoes Trips and VMT Phase Name Offroad Equipment Count Worker Trip Number Vendor Trip Number Hauling Trip Number Worker Trip Length Vendor Trip Length Hauling Trip Length Worker Vehicle Class Vendor Vehicle Class Hauling Vehicle Class Building Construction LD_Mix HDT_Mix HHDT Paving LD_Mix HDT_Mix HHDT Architectural Coating LD_Mix HDT_Mix HHDT 3.1 Mitigation Measures Construction 3.2 Building Construction Unmitigated Construction On-Site NBio- CO2 CO2 CH4 N2O CO2e Category lb/day lb/day Off-Road , , , , , ,
18 Unmitigated Construction Off-Site NBio- CO2 CO2 CH4 N2O CO2e Category lb/day lb/day Hauling Vendor e e e e e Worker e e e e e e e e Mitigated Construction On-Site NBio- CO2 CO2 CH4 N2O CO2e Category lb/day lb/day Off-Road , , , , , , Mitigated Construction Off-Site NBio- CO2 CO2 CH4 N2O CO2e Category lb/day lb/day Hauling Vendor e e e e e Worker e e e e e e e e Paving Unmitigated Construction On-Site NBio- CO2 CO2 CH4 N2O CO2e Category lb/day lb/day Off-Road Paving , , , , , ,
19 Unmitigated Construction Off-Site NBio- CO2 CO2 CH4 N2O CO2e Category lb/day lb/day Hauling Vendor Worker e e e e e e e e Mitigated Construction On-Site NBio- CO2 CO2 CH4 N2O CO2e Category lb/day lb/day Off-Road Paving , , , , , , Mitigated Construction Off-Site NBio- CO2 CO2 CH4 N2O CO2e Category lb/day lb/day Hauling Vendor Worker e e e e e e e e Architectural Coating Unmitigated Construction On-Site NBio- CO2 CO2 CH4 N2O CO2e Category lb/day lb/day Archit. Coating Off-Road e e
20 Unmitigated Construction Off-Site NBio- CO2 CO2 CH4 N2O CO2e Category lb/day lb/day Hauling Vendor Worker e e e e e e e e e e e e e e Mitigated Construction On-Site NBio- CO2 CO2 CH4 N2O CO2e Category lb/day lb/day Archit. Coating Off-Road e e Mitigated Construction Off-Site NBio- CO2 CO2 CH4 N2O CO2e Category lb/day lb/day Hauling Vendor Worker e e e e e e e e e e e e e e Operational Detail - Mobile 4.1 Mitigation Measures Mobile NBio- CO2 CO2 CH4 N2O CO2e Category lb/day lb/day Mitigated Unmitigated , , , , , ,
21 4.2 Trip Summary Information 4.3 Trip Type Information Average Daily Trip Rate Unmitigated Mitigated Land Use Weekday Saturday Sunday Annual VMT Annual VMT Fast Food Restaurant with Drive Thru , , ,827 Other Non-Asphalt Surfaces Parking Lot , , , ,827 Miles Trip % Trip Purpose % Land Use H-W or C-W H-S or C-C H-O or C-NW H-W or C- Fast Food Restaurant with Drive W 2.20 Thru Other Non-Asphalt Surfaces Parking Lot H-S or C-C H-O or C-NW Primary Diverted Pass-by LDA LDT1 LDT2 MDV LHD1 LHD2 MHD HHD OBUS UBUS MCY SBUS MH Energy Detail 4.4 Fleet Mix Historical Energy Use: N 5.1 Mitigation Measures Energy NBio- CO2 CO2 CH4 N2O CO2e Category lb/day lb/day NaturalGas Mitigated e e e NaturalGas Unmitigated e e e Energy by Land Use - NaturalGas Unmitigated NaturalGa s Use N CO2 CH4 N2O CO2e Land Use kbtu/yr lb/day lb/day Other Non-Asphalt Surfaces Parking Lot Fast Food Restaurant with e- Drive Thru e e e e e
22 Mitigated NaturalGa s Use N CO2 CH4 N2O CO2e Land Use kbtu/yr lb/day lb/day Other Non-Asphalt Surfaces Parking Lot Fast Food Restaurant with e- Drive Thru e e e e e Area Detail 6.1 Mitigation Measures Area NBio- CO2 CO2 CH4 N2O CO2e Category lb/day lb/day Mitigated e e e e e- Unmitigated e e e e e- 6.2 Area by SubCategory Unmitigated NBio- CO2 CO2 CH4 N2O CO2e SubCategory lb/day lb/day Architectural Coating Consumer Products Landscaping e e e e e e e e e e e-
23 Mitigated NBio- CO2 CO2 CH4 N2O CO2e SubCategory lb/day lb/day Architectural Coating Consumer Products Landscaping e e e e e e e e e e e- 7.0 Water Detail 7.1 Mitigation Measures Water 8.0 Waste Detail 8.1 Mitigation Measures Waste 9.0 Operational Offroad Equipment Type Number Hours/Day Days/Year Horse Power Load Factor Fuel Type 10.0 Vegetation
24 CalEEMod Version: CalEEMod Page 1 of 1 Date: 7/11/ :26 PM Vallejo Broadway Starbucks San Francisco Bay Area Air Basin, Winter 1.0 Project Characteristics 1.1 Land Usage Land Uses Size Metric Lot Acreage Floor Surface Area Population Fast Food Restaurant with Drive Thru sqft , Parking Lot sqft , Other Non-Asphalt Surfaces sqft , Other Project Characteristics Urbanization Urban Wind Speed (m/s) 2.2 Precipitation Freq (Days) 64 Climate Zone 4 Operational Year 2016 Utility Company Pacific Gas & Electric Company CO2 Intensity (lb/mwhr) CH4 Intensity (lb/mwhr) N2O Intensity (lb/mwhr) User Entered Comments & Non-Default Data Project Characteristics - Land Use - Construction Phase - Sequestration - Table Name Column Name Default Value New Value tbllanduse LandUseSquareFeet 1, , tbllanduse LandUseSquareFeet 12, , tbllanduse LandUseSquareFeet 6, , tblprojectcharacteristics OperationalYear tblsequestration NumberOfNewTrees Emissions Summary 2.1 Overall Construction (Maximum Daily Emission) Unmitigated Construction NBio- CO2 CO2 CH4 N2O CO2e Year lb/day lb/day , , , , , ,
25 Mitigated Construction NBio- CO2 CO2 CH4 N2O CO2e Year lb/day lb/day , , , , , , NBio- CO2 CO2 CH4 N20 CO2e Percent Reduction Overall Operational Unmitigated Operational NBio- CO2 CO2 CH4 N2O CO2e Category lb/day lb/day Area e e Energy e- Mobile e e- 3, , e e- 3, , , e e , Mitigated Operational NBio- CO2 CO2 CH4 N2O CO2e Category lb/day lb/day Area e e Energy e- Mobile e e- 3, , e e- 3, , , e e , NBio-CO2 CO2 CH4 N20 CO2e Percent Reduction
26 3.0 Construction Detail Construction Phase Phase Number Phase Name Phase Type Start Date End Date Num Days Week Num Days Phase Description 1 Building Construction Building Construction 1/20/2015 6/8/ Paving Paving 6/9/2015 6/15/ Architectural Coating Architectural Coating 6/16/2015 6/22/ Acres of Grading (Site Preparation Phase): 0 Acres of Grading (Grading Phase): 0 Acres of Paving: 0 Residential Indoor: 0; Residential Outdoor: 0; Non-Residential Indoor: 12,951; Non-Residential Outdoor: 4,317 (Architectural Coating OffRoad Equipment Phase Name Offroad Equipment Type Amount Usage Hours Horse Power Load Factor Architectural Coating Air Compressors Paving Cement and Mortar Mixers Building Construction Cranes Building Construction Forklifts Paving Pavers Paving Rollers Building Construction Tractors/Loaders/Backhoes Paving Tractors/Loaders/Backhoes Trips and VMT Phase Name Offroad Equipment Count Worker Trip Number Vendor Trip Number Hauling Trip Number Worker Trip Length Vendor Trip Length Hauling Trip Length Worker Vehicle Class Vendor Vehicle Class Hauling Vehicle Class Building Construction LD_Mix HDT_Mix HHDT Paving LD_Mix HDT_Mix HHDT Architectural Coating LD_Mix HDT_Mix HHDT 3.1 Mitigation Measures Construction 3.2 Building Construction Unmitigated Construction On-Site NBio- CO2 CO2 CH4 N2O CO2e Category lb/day lb/day Off-Road , , , , , ,
27 Unmitigated Construction Off-Site NBio- CO2 CO2 CH4 N2O CO2e Category lb/day lb/day Hauling Vendor e e e e e Worker e e e e e e e e Mitigated Construction On-Site NBio- CO2 CO2 CH4 N2O CO2e Category lb/day lb/day Off-Road , , , , , , Mitigated Construction Off-Site NBio- CO2 CO2 CH4 N2O CO2e Category lb/day lb/day Hauling Vendor e e e e e Worker e e e e e e e e Paving Unmitigated Construction On-Site NBio- CO2 CO2 CH4 N2O CO2e Category lb/day lb/day Off-Road Paving , , , , , ,
28 Unmitigated Construction Off-Site NBio- CO2 CO2 CH4 N2O CO2e Category lb/day lb/day Hauling Vendor Worker e e e e e e e e Mitigated Construction On-Site NBio- CO2 CO2 CH4 N2O CO2e Category lb/day lb/day Off-Road Paving , , , , , , Mitigated Construction Off-Site NBio- CO2 CO2 CH4 N2O CO2e Category lb/day lb/day Hauling Vendor Worker e e e e e e e e Architectural Coating Unmitigated Construction On-Site NBio- CO2 CO2 CH4 N2O CO2e Category lb/day lb/day Archit. Coating Off-Road e e
29 Unmitigated Construction Off-Site NBio- CO2 CO2 CH4 N2O CO2e Category lb/day lb/day Hauling Vendor Worker e e e e e e e e e e e e e e Mitigated Construction On-Site NBio- CO2 CO2 CH4 N2O CO2e Category lb/day lb/day Archit. Coating Off-Road e e Mitigated Construction Off-Site NBio- CO2 CO2 CH4 N2O CO2e Category lb/day lb/day Hauling Vendor Worker e e e e e e e e e e e e e e Operational Detail - Mobile 4.1 Mitigation Measures Mobile NBio- CO2 CO2 CH4 N2O CO2e Category lb/day lb/day Mitigated Unmitigated , , , , , ,
30 4.2 Trip Summary Information 4.3 Trip Type Information Average Daily Trip Rate Unmitigated Mitigated Land Use Weekday Saturday Sunday Annual VMT Annual VMT Fast Food Restaurant with Drive Thru , , ,827 Other Non-Asphalt Surfaces Parking Lot , , , ,827 Miles Trip % Trip Purpose % Land Use H-W or C-W H-S or C-C H-O or C-NW H-W or C- Fast Food Restaurant with Drive W 2.20 Thru Other Non-Asphalt Surfaces Parking Lot H-S or C-C H-O or C-NW Primary Diverted Pass-by LDA LDT1 LDT2 MDV LHD1 LHD2 MHD HHD OBUS UBUS MCY SBUS MH Energy Detail 4.4 Fleet Mix Historical Energy Use: N 5.1 Mitigation Measures Energy NBio- CO2 CO2 CH4 N2O CO2e Category lb/day lb/day NaturalGas Mitigated e e e NaturalGas Unmitigated e e e Energy by Land Use - NaturalGas Unmitigated NaturalGa s Use N CO2 CH4 N2O CO2e Land Use kbtu/yr lb/day lb/day Fast Food Restaurant with Drive Thru Other Non-Asphalt Surfaces e- 0 Parking Lot e e e e e
31 Mitigated NaturalGa s Use N CO2 CH4 N2O CO2e Land Use kbtu/yr lb/day lb/day Other Non-Asphalt Surfaces Parking Lot Fast Food Restaurant with e- Drive Thru e e e e e Area Detail 6.1 Mitigation Measures Area NBio- CO2 CO2 CH4 N2O CO2e Category lb/day lb/day Mitigated e e e e e- Unmitigated e e e e e- 6.2 Area by SubCategory Unmitigated NBio- CO2 CO2 CH4 N2O CO2e SubCategory lb/day lb/day Architectural Coating Consumer Products Landscaping e e e e e e e e e e e-
32 Mitigated NBio- CO2 CO2 CH4 N2O CO2e SubCategory lb/day lb/day Architectural Coating Consumer Products Landscaping e e e e e e e e e e e- 7.0 Water Detail 7.1 Mitigation Measures Water 8.0 Waste Detail 8.1 Mitigation Measures Waste 9.0 Operational Offroad Equipment Type Number Hours/Day Days/Year Horse Power Load Factor Fuel Type 10.0 Vegetation
33 Appendix B Trip Generation and Queuing Analysis

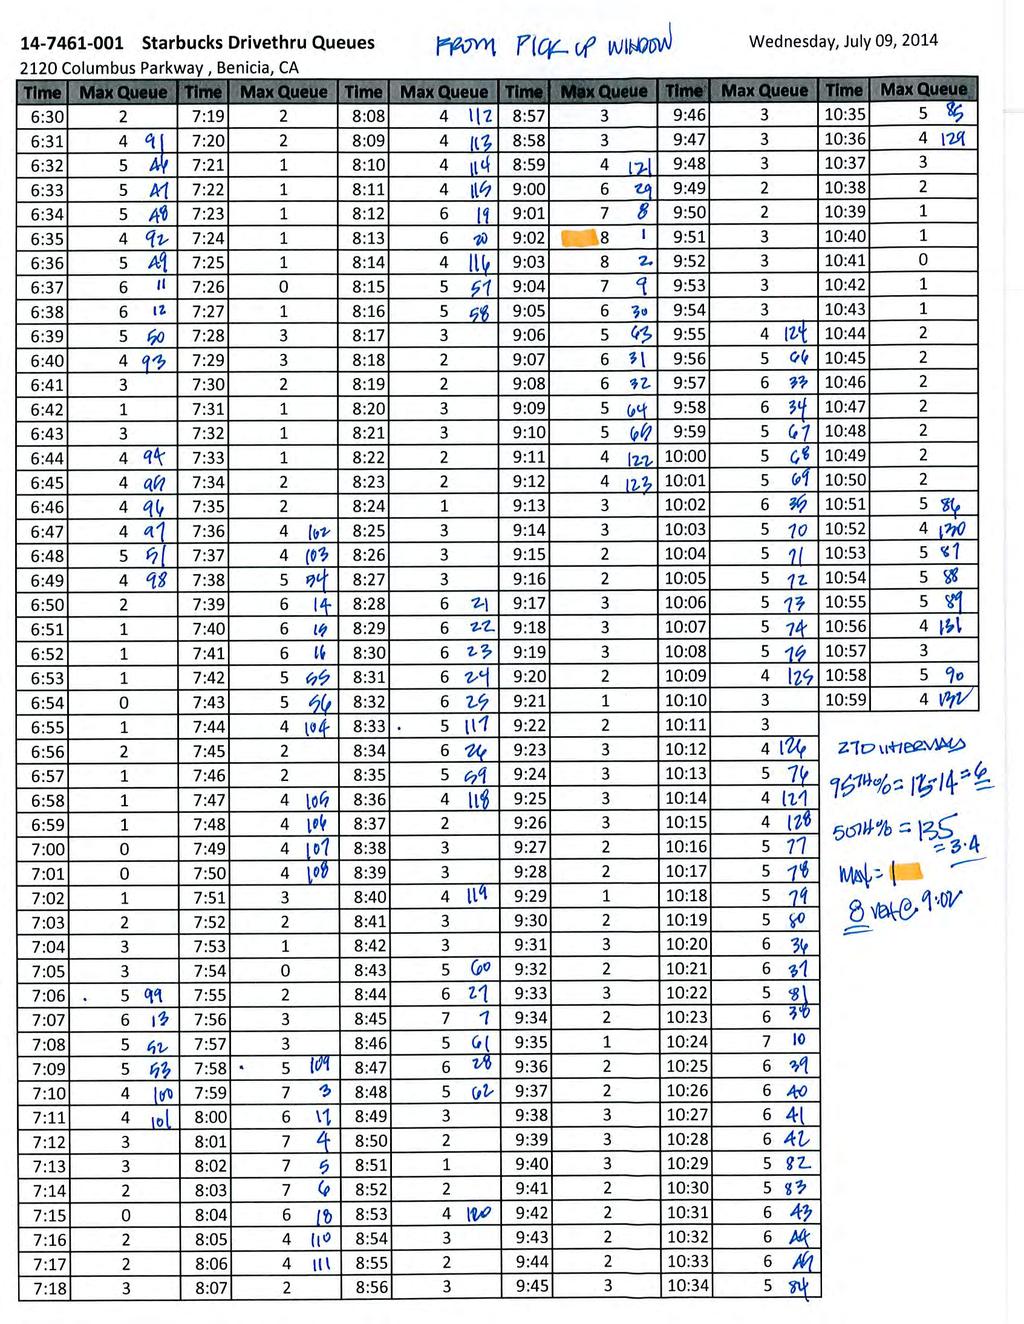
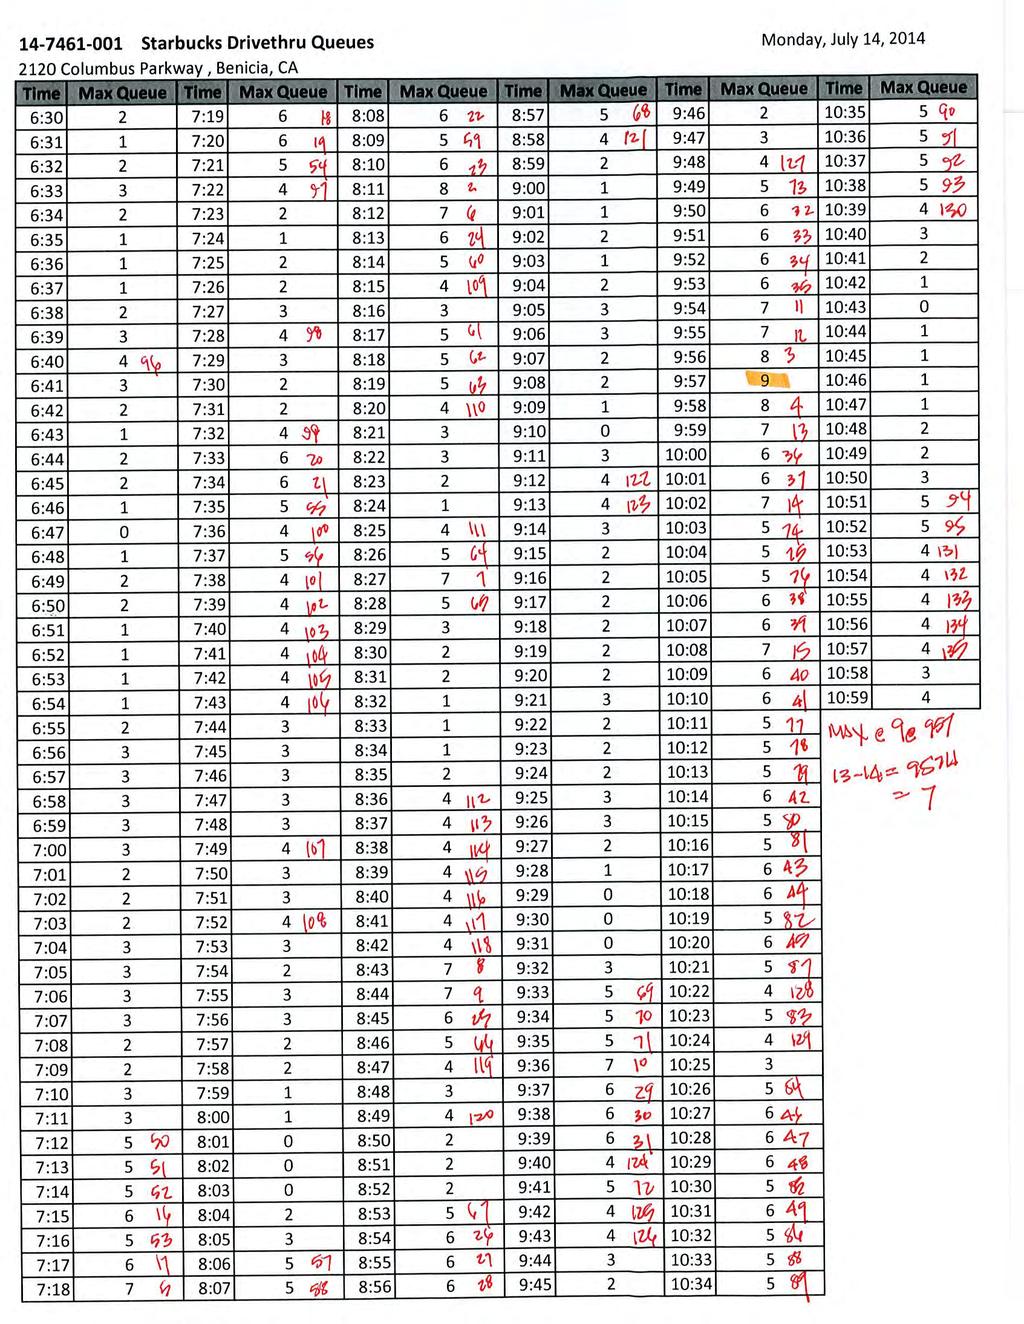
34 Transportation Engineers July 16, 2014 Mr. Brian Maloy, Project Manager ARCO MURRAY DESIGN BUILD 3110 Woodcreek Drive Downers Grove, IL RE: RESULTS OF QUEUE OBSERVATIONS AT STARBUCKS IN BENICIA CA. Dear Brian: Here are the results of our 4 days of observation for the morning queues at the Starbucks at 2120 Columbus Parkway in Benicia. As we discussed the queues were measured from the pick-up window from 6:30 a.m. to 11:00 a.m., and our results are summarized in terms of the longest queue that was seen each day, as well as the 95 th percentile queue and the 50 th percentile queue. We identified the longest queue seen during each one minute interval over the 4½ hour period and each day isolated 270 separate samples. Thus the 95 th percentile queue would have occurred for no more than 14 minutes each day. Our results are summarized in Table 1 and are attached. As shown, the longest queue observed on any day was ten (10) vehicles which occurred for one minute on Saturday. The 95 th percentile queues (i.e., length only exceeded 14 minutes each day) averaged slightly more than 7 vehicles. Half of the time the queue was 4 vehicles or less. Day Date Table 1 Queue Observation Results 50 th 95 th Queue Length (vehicles) Maximum Time of Maximum percentile percentile Wednesday July 9, :02 a.m. Saturday July 12, :05 a.m. Monday July 14, :57 a.m. Tuesday July 15, :08 a.m. Average 4 7¼ 9 Please feel free to call me if you have any questions. Sincerely yours, KD Anderson & Associates, Inc. Kenneth D. Anderson, P.E., President Enc: 3853 Taylor Road, Suite G Loomis, CA (916) FAX (916)
35

36
37

38
39


40
41
42
43
44 BACKGROUND QUEUING INFORMATION FOR STARBUCKS AT SONOMA BLVD (SR 29) / YOLANO DRIVE VALLEJO, CA KD Anderson & Associates, Inc Taylor Road, Suite G Loomis, CA (916) Fax (916)
45 Starbucks Drive-Through Queuing Assessment Observed Observed 4-day Avg # Veh. Adjacent Street Avg Veh. Q Peak Veh. Q Location entering drive-thru(1) Daily Traffic Count (2) in Drive-thru (3) in Drive-thru (3) Kirkland NE 85th Street , Kirkland 100th Ave NE , Bothell 120th Ave NE , Average 3 sites , Kingsgate Estimate (4) , :30-9:30am counts May 28-31, based on historic data from City count database 3. from order point (not pick-up window) based on observed queues Thursday 5/30/ based on queue observations at other 3 sites and Daily Traffic Count along adjacent 124th Ave NE TENW Project #4730 STARBUCKS counts and queues 7/12/2013
46 Starbucks Data Collection Summary NE 85th St. Kirkland MONDAY TUESDAY WEDNESDAY THURSDAY FRIDAY th Ave NE Kirkland MONDAY TUESDAY WEDNESDAY THURSDAY FRIDAY th Ave NE Bothell MONDAY TUESDAY WEDNESDAY THURSDAY FRIDAY TENW Project #4730 STARBUCKS counts and queues 7/11/2013
47 Starbucks Drive-Through Queuing Assessment Date: Thursday 5/30/2013 Time Begin Kirkland Location NE 85th Street Observed Queue Kirkland Location 100th Ave NE Bothell Location 120th Ave NE Average 7:00 AM :01 AM :02 AM :03 AM :04 AM :05 AM :06 AM :07 AM :08 AM :09 AM :10 AM :11 AM :12 AM :13 AM :14 AM :15 AM :16 AM :17 AM :18 AM :19 AM :20 AM :21 AM :22 AM :23 AM :24 AM :25 AM :26 AM :27 AM :28 AM :29 AM :30 AM :31 AM :32 AM :33 AM :34 AM :35 AM :36 AM :37 AM :38 AM :39 AM :40 AM :41 AM :42 AM :43 AM :44 AM :45 AM :46 AM :47 AM :48 AM TENW Project #4730 Page 3 of 10 STARBUCKS counts and queues 7/12/2013
48 7:49 AM :50 AM :51 AM :52 AM :53 AM :54 AM :55 AM :56 AM :57 AM :58 AM :59 AM Queues Max Observed th Percentile th Percentile TENW Project #4730 Page 4 of 10 STARBUCKS counts and queues 7/12/2013
49 Drive-Through Queue Generation Mike Spack, PE, PTOE, Max Moreland, EIT, Lindsay de Leeuw, Nate Hood 1.0 Introduction This report provides queuing data for businesses with drive-through services. It is intended to be an aid for site designers and reviewers, similar to the Institute of Transportation Engineers Trip Generation and Parking Generation reports. The data presentation is modeled on the Parking Generation report and data is provided based on at least six sites, similar to data sets marked as statistically significant in Trip Generation. Businesses with drive-through lanes are very common in the United States and having data that gives usage information for drive-through lanes will assist designers as well as cities in determining the appropriate amount of storage needed for proposed drive-through businesses. Data for drive-through queues was published by the ITE Technical Council Committee 5D-10 in 1995 based on information collected between the late 1960 s and the 1990 s. A paper was also published in 2009 by Mark Stuecheli, PTP giving updated information for bank and coffee shop drive-through lanes. The results from the 2009 study are incorporated into this paper (thank you Mark for your assistance). 2.0 Data Collection Data was collected using COUNTcam video recording systems at a total of 30 drive-through locations in Minneapolis, MN and several surrounding suburbs between 2010 and 2012 (26 of the 30 videos were recorded in February of 2012, which should represent peak usage in the cold Minnesota winter). Videos of drive-through lanes were collected at banks, car washes, coffee shops, fast food restaurants and pharmacies. A total of six locations were selected for each of the five different land uses. Each location was recorded for between one and five days where the majority of locations were recorded for two consecutive days. The days of the week that each video was recorded on varies. The 24-hour videos were watched at high speeds with the PC-TAS counting software and maximum queues throughout the day were noted. Most of the COUNTcams were set up such that the entire queue lane could be seen, but at a few locations the drive-through lanes wrapped around the building in a way that the entire queue length would not be able to be seen. For these situations, the COUNTcams were set up so that the ordering window and back of the queue could be seen and it was noted how many vehicles could fit between the ordering window and the front of the queue. For drive-through locations with multiple lanes, the number of lanes was noted but the maximum queue is defined as the sum of the queues at each lane for any given point in time, not the queue per lane. This approach provides overall demand, which may assist designers in determining how many drive through lanes are appropriate in addition to determining how long they should be. Drive-Through Queue Generation 1 February 2012
50 Once the maximum queue for each day at each location was determined, the data was compiled and statistics for each land use were calculated. The average maximum queue, standard deviation, coefficient of variation, range, 85 th percentile and 33 rd percentile were calculated for each land use. Data for drive-through coffee shops and banks from the Kansas City, Kansas metropolitan area was published in the 2009 paper New Drive-Through Stacking Information for Banks and Coffee Shops by Mark Stuecheli. This data is included in the analysis. 3.0 Data Analysis Based on the peak queue lengths, it is apparent that each land use will require a different minimum drive through stacking distance. The results for each land use can be found below. The peak queue lengths for each location, broken down by land use and day of the week, can be found in the Appendix. 3.1 Banks Data collection was done at six banks with drive-through services (including one credit union) in August 2011 and February Twelve days of data were collected. The banks were located in the cities of Minneapolis, Robbinsdale and St. Louis Park, MN. All of the locations had a lane with a drive-through ATM and at least two other lanes. Though service times may differ for ATM lanes compared to the regular lanes, the maximum queues were counted together. This is because based upon what was observed, vehicles would occasionally switch the lane they were in. For example, a vehicle waiting in the ATM line with a queue of three vehicles may move over to a regular line with a queue of only one vehicle. Much of what can be done at the bank s drive-through lane can also be accomplished at that bank s ATM and vice versa. Vehicles being served were counted as being in the queue. Nine days of data from the Kansas City, Kansas area is also included. This data does not factor in vehicles in ATM lanes. Table 3.1 Drive-Through Bank Maximum Queue Statistics Minnesota Data Minnesota + Kansas Data Number of Data Points Average Maximum Queue (Vehicles) Standard Deviation (Vehicles) Coefficient of Variation 32% 38% Range (Vehicles) 3 to 8 1 to 10 85th Percentile (Vehicles) rd Percentile (Vehicles) Drive-Through Queue Generation 2 February 2012
51 4 3 Frequency Maximum Queue Length (Vehicles) Figure Drive-Through Bank Maximum Queue Frequency Minnesota Data 5 4 Frequency Maximum Queue Length (Vehicles) Figure Drive-Through Bank Maximum Queue Frequency Minnesota + Kansas Data Drive-Through Queue Generation 3 February 2012
52 The data for Kansas banks was collected between 4:30pm and 6:00pm. While many of the maximum queues for the data collected in Minnesota were between these times, maximum queues occurred between 8:30am and 5:30pm so it is possible that some of the Kansas data does not capture the actual maximum queues for the day. The number of available lanes at banks, not including the ATM lane, ranged from two to seven lanes (though the most open at one time was five lanes). Even though plenty of lanes were available, cars often stacked at the lane closest to the building, thus additional lanes may not result in shorter queues. With an 85 th percentile maximum queue of eight vehicles, the data suggests that banks with drive-through lanes should be able to accommodate 160 feet of vehicle stacking. 3.2 Car Washes Data collection was done at six car washes with drive-through services (including one fullservice car wash) in February Twelve days of data were collected. The car washes were located in the cities of Falcon Heights, Hopkins, Minneapolis, Roseville and St. Louis Park, MN. Five of the six car washes (excluding the full-service car wash) were located at gas stations. Only the vehicles waiting in line were counted; vehicles being washed were not added to the queue. Table 3.2 Drive-Through Car Wash Maximum Queue Statistics Number of Data Points 12 Average Maximum Queue (Vehicles) 4.42 Standard Deviation (Vehicles) 2.31 Coefficient of Variation 52% Range (Vehicles) 1 to th Percentile (Vehicles) rd Percentile (Vehicles) 3.00 Drive-Through Queue Generation 4 February 2012
53 5 4 Frequency Maximum Queue Length (Vehicles) Figure 3.2 Drive-Through Car Wash Maximum Queue Frequency Two of the car washes had two lanes while the other four were one lane car washes. The fullservice car wash had two lanes and also produced the highest maximum queue of 10 vehicles. The maximum queues for car washes were spread throughout the afternoon from 12:30pm to 8:30pm. With an 85 th percentile maximum queue of more than six vehicles, the data suggests that car washes with drive-through lanes should be able to accommodate 140 feet of vehicle stacking throughout the day. 3.3 Coffee Shops Data collection was done at six coffee shops with drive-through services in November 2010, August 2011 and February Fourteen days of data were collected. The coffee shops were located in the cities of Edina, Hopkins, Minneapolis, Roseville and St. Louis Park, MN. Vehicles being served were counted as being in the queue. Twelve days of data from the Kansas City, Kansas area is also included. Table 3.3 Drive-Through Coffee Shop Maximum Queue Statistics Minnesota Data Minnesota + Kansas Data Number of Data Points Average Maximum Queue (Vehicles) Standard Deviation (Vehicles) Coefficient of Variation 20% 27% Range (Vehicles) 7 to 16 3 to 16 85th Percentile (Vehicles) rd Percentile (Vehicles) Drive-Through Queue Generation 5 February 2012
54 5 4 Frequency Maximum Queue Length (Vehicles) Figure Drive-Through Coffee Shop Maximum Queue Frequency Minnesota Data Frequency Maximum Queue Length (Vehicles) Figure Drive-Through Coffee Shop Maximum Queue Frequency MN + KS Data Drive-Through Queue Generation 6 February 2012
55 Coffee shops produced the longest maximum queues of any of the land uses in this study with all of the maximum queues occurring in the morning. In four of the six cases, the queues spilled out of the parking lot and into the street. These spillovers would typically only happen once or twice a day and last only a few minutes, however, one location had stacking into the street for about 15 minutes in addition to multiple periods of several minutes where cars would queue in the street. With an 85 th percentile maximum queue of 13 vehicles, the data suggests that coffee shops with drive-through lanes should be able to accommodate at least 260 feet of vehicle stacking during morning hours. 3.4 Fast Food Restaurants Data collection was done at six fast food restaurants with drive-through services in August 2011 and February Fourteen days of data were collected. The restaurants were located in the cities of Golden Valley, Hopkins, Minneapolis and St. Louis Park, MN. Vehicles being served were counted as being in the queue. Table 3.4 Drive-Through Fast Food Restaurant Maximum Queue Statistics Number of Data Points 14 Average Maximum Queue (Vehicles) 8.50 Standard Deviation (Vehicles) 2.68 Coefficient of Variation 32% Range (Vehicles) th Percentile (Vehicles) rd Percentile (Vehicles) 7.90 Drive-Through Queue Generation 7 February 2012
56 5 4 Frequency Maximum Queue Length (Vehicles) Figure 3.4 Drive-Through Fast Food Restaurant Maximum Queue Frequency The maximum queues for fast food restaurants were spread throughout the day from 8:00am to 10:00pm. With an 85 th percentile maximum queue of 12 vehicles, the data suggests that fast food restaurants with drive-through lanes should be able to accommodate 240 feet of vehicle stacking throughout the day. 3.5 Pharmacies Data collection was done at six pharmacies with drive-through services in February Twelve days of data were collected. The pharmacies were located in the cities of Hopkins, Minneapolis, New Hope and Robbinsdale, MN. Vehicles being served were counted as being in the queue. Table 3.5 Drive-Through Pharmacy Maximum Queue Statistics Number of Data Points 12 Average Maximum Queue (Vehicles) 2.92 Standard Deviation (Vehicles) 1.16 Coefficient of Variation 40% Range (Vehicles) th Percentile (Vehicles) rd Percentile (Vehicles) 2.00 Drive-Through Queue Generation 8 February 2012
57 5 4 Frequency Maximum Queue Length (Vehicles) Figure 3.5 Drive-Through Pharmacy Maximum Queue Frequency The maximum queues for pharmacies were spread throughout the day from 8:00am to 10:00pm. With an 85 th percentile maximum queue of more than 4 vehicles, the data suggests that pharmacies with drive-through lanes should be able to accommodate 100 feet of vehicle stacking throughout the day. 4.0 Conclusions The 85 th percentile maximum queue lengths for each land use are: 160 feet for banks (eight vehicles), 140 feet for car washes (seven vehicles), 260 feet for coffee shops (13 vehicles), 240 feet for fast food restaurants (12 vehicles) and 100 feet for pharmacies (five vehicles). While some of the locations observed have an excess of space dedicated to drive-through lanes (i.e. some banks and pharmacies), others could occasionally use additional space for drivethrough lanes (i.e. coffee shops in the morning). Fast food restaurants and coffee shops have the longest maximum queues of the five land uses observed. Coffee shops have a tendency for the morning queues to build so long that they spill out onto the street, though, as is expected, their afternoon and evening queues are minimal. Fast food restaurants also have large queues, but they tended to have enough dedicated space that stacking did not go beyond the designated queuing area. Drive-Through Queue Generation 9 February 2012
58 The data collected for this paper along with the data from the papers by Mark Stuecheli and the ITE Technical Committee 5D-10 (see Appendix for both of these) will hopefully provide useful data for traffic engineers and others trying to analyze drive-through queuing storage areas. 5.0 Labor Savings of the COUNTkit Deploying people in the field to perform this data collection would not have been feasible. Using the COUNTcam video system made it possible to observe the drive through lanes 24 hours a day and the PC-TAS software made the data reduction practical. One location was recorded in November 2010 for 6 hours, three locations were recorded in August 2011 for a total of 202 hours and 26 locations were recorded in February 2012 for a total of 1012 hours. These 1220 hours of video were counted with a total of 120 hours of labor, meaning the videos were watched at approximately 10x speed. Installation of a COUNTcam takes approximately 10 minutes and retrieval takes approximately 5 minutes. This whole project was completed in approximately 3 weeks. 6.0 References 1. Stuecheli, M. (2009). New Drive-Through Stacking Information for Banks and Coffee Shops. ITE 2009 Annual Meeting and Exhibit. Print. 2. ITE Technical Committee 5D-10. Queuing Areas for Drive-Thru Facilities. ITE Journal (May 1995): Print. 3. Institute of Transportation Engineers. Parking Generation. 4 th ed. Washington, DC: Institute of Transportation Engineers, Print. 4. Institute of Transportation Engineers. Trip Generation. 8 th ed. Washington, DC: Institute of Transportation Engineers, Print. 7.0 Appendix A Day of Week Maximum Queues B New Drive-Through Stacking Information for Banks and Coffee Shops C ITE Technical Committee 5D-10: Queuing Areas for Drive-Thru Facilities D Drive-Through Data Forms Drive-Through Queue Generation 10 February 2012
59 Appendix A Fast Food Car Wash Coffee Bank Pharmacy Day of Week Maximum Queues Sunday Monday Tuesday Wednesday Thursday Friday Saturday Arby's 5 5 Burger King McDonald's McDonald's 9 8 Taco Bell 10 8 White Castle 8 5 BP 6 6 BP 1 3 BP 4 3 Holiday 3 4 Mister Car Wash 10 6 Mobil 4 3 Caribou Caribou Starbucks Starbucks Starbucks Starbucks 11 Citizens Independent Bank 5 5 SharePoint Credit Union 3 3 TCF US Bank 7 7 Wells Fargo 8 6 Wells Fargo 6 CVS 1 2 CVS 4 4 CVS 2 2 Walgreens 4 5 Walgreens 3 3 Walgreens 3 2 Drive-Through Queue Generation A1 February 2012
60 Appendix B New Drive-Through Stacking Information for Banks and Coffee Shops Mark Stuecheli, PTP Abstract This paper provides updated queuing information for drive-in banks and new queuing data for coffee shops with drive-through lanes. The data is presented in a format similar to that used in the report for ITE Technical Council Committee 5D-10, originally published in Significant changes have occurred in the way that bank patrons conduct business with their banks. In recognition of those changes, ITE has adjusted the trip generation information included in the Eighth Edition of Trip Generation, an ITE Informational Report to include only data collected since 2000, and the revised trip generation totals are significantly lower than in previous editions. Clearly, the reduced trip generation figures indicate a reduction in bank drive-through business. This report summarizes queuing information included in counts taken in the Kansas City metropolitan area. In the last few years coffee shops with drive-through lanes have become prevalent throughout the country. Because those businesses were uncommon when the 1995 report was prepared, no data was gathered for those operations. This paper contains information on counts taken at those establishments, once again in the Kansas City metropolitan area. Based on the count data, recommendations are included for the minimum amount of stacking distance to require for the two types of drive-through businesses that were studied. Background ITE Technical Council Committee 5D-10 was formed in 1987 to produce a database of queuing information for various types of drive-through lanes. The report of the findings of the Committee, published in the May 1995 ITE Journal, included information on the characteristics of drive-through lane stacking for fast-food restaurants, drive-in banks, car washes, day care centers and dry cleaners. The counts that were included in the Committee report were conducted from the late 1960s through the late 1980s in a limited number of mid-western, southern and eastern states. As a former member of that Committee, and having submitted drive-through counts for the effort, I am in a position to make some observations about the change in drivethrough usage. Drive-Through Queue Generation B1 February 2012
61 Appendix B This paper analyzes two types of drive-through operations one that is greatly modified and another that is new since the original report was published. First, significant changes have occurred in the ways that bank patrons conduct business with their financial institutions. On-line banking, direct deposit and the wide usage of ATMs have resulted in greatly reduced trip generation totals for drive-in banks. In recognition of that fact, ITE adjusted the trip generation information for drive-in banks in the Eighth Edition of Trip Generation, an ITE Informational Report, to include only data collected since The trip generation rates during the p.m. peak hour for the newer data are about 44% lower than rates in the Seventh Edition. The amount of stacking provided for bank drive-through lanes often has a critical impact on the potential site design alternatives for proposed bank properties. If the information included in the 1995 Report were to be used as the basis for establishing stacking requirements, a large area would need to be allocated to the drive-through lanes. On tight sites, that limitation could preclude developing an acceptable layout. Clearly, the major drop in trip generation rates indicates that fewer customers are using drive-through lanes. That reduction in drive-through usage has an impact on queue lengths and other operational characteristics observed at those facilities. This paper includes updated information on queuing in bank drive-through lanes based on counts taken in the City of Overland Park, Kansas, a suburban community of 171,000 residents in the Kansas City metropolitan area. The second area of analysis in this paper pertains to observed queuing characteristics for coffee shops with drive-through lanes. In the last few years, drive-through coffee shops have become common throughout the country. Because those businesses were an insignificant factor when the report for ITE Technical Council Committee 5D-10 was completed, no counts were conducted for that land use category. This paper contains data on queuing for coffee shops with drive-through lanes, based on counts conducted predominantly in the Kansas suburbs of the Kansas City metropolitan area. As is the case for drive-in banks, the length of stacking required for a site has a major impact on potential site layouts. If a relatively short stacking distance is permitted, the lanes can be fit into very restricted sites or be more easily retrofitted to work with existing buildings. But if more queuing occurs than is provided for in a dedicated lane, the flow of traffic within a parking lot can be seriously restricted by that excess queue. In the worst case, if the drive-through stacking is located close to a public street and the excess queue extends into or near the street, the operation of the adjoining public street may be negatively impacted. Drive-Through Queue Generation B2 February 2012
62 Appendix B Drive-In Banks Counts were conducted at ten suburban drive-in banks located throughout Overland Park in the fall of 2008 and the spring of Both established locations and sites that were relatively new were counted, although all banks had been open for business for at least one year. All but one location had drive-through ATMs. Based on the results of counts taken at a single bank location during a mid-week lunch hour, a mid-week p.m. peak hour, a Friday lunch hour, and a Friday p.m. peak hour; the maximum queue lengths occurred during the Friday p.m. peak hour. Therefore, all counts used in the study were conducted during the Friday p.m. peak hour time period. The counting process involved noting the maximum per lane and total queues for the drive-through lanes at each location in fifteen minute increments, along with collecting information on the stacking of any drive-through ATM. In all cases the vehicles in the service positions were included in the counts. Where possible, the volumes of vehicles entering and exiting the parking lot also were tabulated. As a way to evaluate the frequency of various maximum queue lengths, the total queue lengths were noted at five minute intervals. The queuing data was analyzed in ways similar to the methods used in the 1995 Report. Table 1 lists the observed frequency of maximum queue lengths per lane. Figure 1 plots the per lane maximum queue lengths using both the 2009 data and the data that was presented in 1995 (please note that the 1995 data involved fifteen counts, compared to the ten counts in the 2009 data). Figure 2 plots the probability that the queue lengths per lane will not exceed a given maximum queue length, once again presenting both 2009 and 1995 data. Table 1 Drive-In Bank 2009 Maximum Queue Length Per Lane Queue Length Frequency Cumulative Frequency P(q N) Note: P(q N) indicates probability, based on sample, of queue length of q not exceeding length N Drive-Through Queue Generation B3 February 2012
63 Appendix B Figure 1 Drive-In Bank 1995 And 2009 Maximum Queue Length Per Lane Data Plot Figure 2 Drive-In Bank 1995 And 2009 Cumulative Maximum Queue Length Per Lane Data Plot The differences between the 1995 Report data (as noted earlier, actually based on counts conducted from the late 1960s to the late 1980s) and the 2009 counts are dramatic. The maximum per-lane queue lengths in the current counts were half what they were in the 1995 data. Drive-Through Queue Generation B4 February 2012
64 Appendix B An attempt was made to determine if such factors as adjoining major street traffic volumes or the size of the building could predict the queuing results, but no correlation was found. Observations Some banks, especially those that have been in operation for several years, have a surplus of drive-through lanes and stacking area. That is because those sites were designed to accommodate the much higher demands that existed many years ago. Consequently, they often open only a portion of the available lanes. In one case, for a main office bank location where it was possible to make a direct comparison between a count conducted in 1988 and a new count in 2008 (actually taken almost precisely 20 years apart), the difference was dramatic. The p.m. peak hour drive-through volumes for the 2008 count were 65% lower than the 1988 count, a much greater drop than would have been indicated by the reduced ITE trip generation figures discussed earlier. The maximum total number of vehicles queued and the maximum queue lengths per lane were correspondingly lower, dropping from 29 to 8 and 7 to 3, respectively. The demographics and development characteristics of the surrounding area have changed little since 1988 and the bank has continued as a stable operation. Considering all of those factors, it is reasonable to assume that the differences are associated with changes in customers banking habits. The one incidence of a four car per lane maximum stack was a single occurrence that lasted for only a few minutes. Based on that information, it is reasonable to consider the practical maximum required queue length to be three vehicles. The maximum queue lengths for ATMS ranged from two to five vehicles. Only one location experienced the longer queue lengths and only for a short time period. All other locations had maximum queue lengths of three vehicles or less. Coffee Shops With Drive-Through Lanes Counts were conducted in the fall of 2008 and the spring of 2009 at twelve coffee shops located in the Kansas suburbs of Merriam, Olathe and Overland Park in the Kansas City metropolitan area and also in suburban Kansas City, Missouri. All but two of the establishments were situated in free-standing buildings, and several were located within shopping centers. Three were drive-through-only operations and the remaining nine were full-service locations that included both drive-through lanes and inside seating facilities. Because this type of use is busiest in the morning peak hour, all counts were completed during that time period. Similar to the process used for drive-in banks, the counting process involved noting the maximum number of vehicles queued in the drive-through lane at each location for fifteen minute increments. As was done for the drive-in bank counts, the vehicle in the Drive-Through Queue Generation B5 February 2012
65 Appendix B service position was included in the counts. Information on the number of vehicles entering and leaving the parking lot was collected for full-service operations (drivethrough-only locations did not have any parking activity). The queuing information was tabulated for both the total length of queue and for the number of vehicles behind the menu board. The observed queue length was noted at five minute intervals as a way to evaluate the frequency of various queue lengths. Once again, the queuing data was analyzed in ways similar to the methods used in the 1995 Report. Table 2 lists the observed frequency of maximum queue lengths. Figure 3 plots the per-lane maximum queue lengths and Figure 4 plots the probability that the queue will not exceed a given maximum queue length. Table 2 Coffee Shop With Drive-Through Maximum Queue Length Queue Length Frequency Cumulative Frequency P(q N) Note: P(q N) indicates probability, based on sample, of queue length of q not exceeding length N Drive-Through Queue Generation B6 February 2012
66 Appendix B Figure 3 Coffee Shop With Drive-Through Maximum Queue Length Data Plot Figure 4 Coffee Shop With Drive-Through Cumulative Maximum Queue Length Data Plot Drive-Through Queue Generation B7 February 2012
67 Appendix B The total trip generation figures were compared to the a.m. peak hour ITE rates for Land Use Code 937, Coffee/Donut Shop with Drive-Through Window, and Land Use Code 938, Coffee/Donut Shop with Drive-Through Window and No Indoor Seating. The observed counts generally fell within the range of counts included in those categories, although two of the rates for the No Indoor Seating category exceeded the published range. No correlation was found between the adjoining major street traffic volumes or the size of the building and either the queuing or the trip generation results. Observations Several of the drive-through lanes were under-designed for the usage that was observed and queues spilled-out into parking lot circulation areas. In most cases the excess stacking did not result in disruptions of the operations of surrounding uses, since most other businesses were not open in the early morning. But for those sites where the end of the drive-through lane extended into the coffee shop parking lot, the excess queue often disrupted the movements of drivers who were trying to enter or exit parking spaces or the site itself. One interesting facet of the data is that the three lowest observed maximum queue lengths were for the drive-through-only locations. The highest observed queue length for those operations was seven vehicles, which occurred only once at one location and only for a very short period of time. A six vehicle maximum stack was a more common occurrence. The data shows that the volume of drive-through traffic and, therefore, the required stacking distance, is higher for full-service coffee shops than for drive-through-only operations. When total trip generation (both drive-through business and customers who park and walk in) is factored in, the full-service coffee shops did, on average, about two and one-half times the business of drive-through-only facilities. Since all of the fullservice operations were Starbucks locations, it may be possible to apply the results of those counts to other proposed suburban Starbucks locations elsewhere in the country. vehicular stacking available for a drive-through lane is an important consideration, but the location of the menu board relative to the pick-up window also impacts the efficiency of a drive-through lane operation. If the spacing is too short, stacking behind the pick-up window will extend into the menu board area, delaying ordering for those farther back in the line. In the counts conducted for this study, the pick-up window to menu board available stacking distances ranged from two to five vehicles. The operation with the two car stack between the pick-up window and menu board regularly resulted in delays for drivers waiting to order at the menu board. The location with a five car stack rarely experienced delays for those ordering. Based on field observations, if an unlimited amount of stacking were available at a proposed site, the five car spacing would be ideal. Realizing that space for stacking nearly always is limited, an acceptable alternative would be the four car spacing. Drive-Through Queue Generation B8 February 2012
68 Appendix B Conclusions Drive-in bank usage has dropped dramatically, as illustrated in the data provided in this report. Consequently, a reduced amount of stacking is required. That reduced area for drive-through stacking can provide more flexibility in the design of bank sites, allowing for development on smaller sites or the provision of increased landscaped areas. Based on the data that was gathered, the City of Overland Park has reduced its previous requirement for a minimum five car stack per lane to a three car stack (a distance of 60 feet per lane, assuming average vehicle spacing to be 20 feet). That design should be sufficient to accommodate virtually all situations. Vehicular stacking requirements for ATMs have been established, also at a minimum of three car lengths. Coffee shop drive-through lanes are most heavily used during the morning peak period, and therefore it is important to design sites to accommodate that peak demand. The following recommended minimum stacking lengths should be appropriate in most cases. The only exceptions would be situations in which excess queuing could impact a nearby street or major drive, in which case a more conservative approach should be taken. Based on the data that was gathered for drive-through-only operations, it appears reasonable to require that a dedicated drive-through lane be provided with a stack of 120 feet enough to handle six vehicles. That should be sufficient to accommodate nearly all vehicles that are likely to arrive during the morning peak hour time period. For full service establishments, a 220-foot long drive-through lane, providing eleven cars of total storage, should be adequate to handle the vast majority of the drivethrough lane volumes that might be encountered. In those cases where more than eleven vehicles were counted, the duration of the extreme queue lasted for only a few minutes. For the most efficient operation, the distance between the pick-up window and menu board should be at least 80 feet to accommodate four vehicles. References 1. Gattis, J. L., Chair of ITE Technical Council Committee 5D-10. Queuing Areas for Drive-Thru Facilities, by ITE Technical Council Committee 5D-10. ITE Journal (May 1995): Author Information Mark Stuecheli, PTP Senior Transportation Planner City of Overland Park Overland Park, KS Phone: Fax: mark.stuecheli@opkansas.org Drive-Through Queue Generation B9 February 2012
69 Appendix C Drive-Through Queue Generation C1 February 2012
70 Appendix C Drive-Through Queue Generation C2 February 2012
71 Appendix C Drive-Through Queue Generation C3 February 2012

72 Appendix C Drive-Through Queue Generation C4 February 2012

73 Appendix C Drive-Through Queue Generation C5 February 2012
8534 W Pico - Imperial County APCD Air District, Annual W Pico. Imperial County APCD Air District, Annual
 Page 1 of 31 8534 W Pico Imperial County APCD Air District, Annual 1.0 Project Characteristics 1.1 Land Usage Land Uses Size Metric Lot Acreage Floor Surface Area Population Congregate Care (Assisted Living)
Appendix E. Greenhouse Gas Emissions Assumptions and Modeling E-1
 Appendix E Greenhouse Gas Emissions Assumptions and Modeling E-1 Heacock Truck Terminal Greenhouse Gas Appendix Heacock Truck Terminal Greenhouse Gas Appendix Assumptions Heacock Truck Terminal Project
Eastgate Building I (2019 Operations (with Solar) - Passenger Cars)
 - Passenger Cars)") CalEEMod Version: CalEEMod.2016.3.2 Page 1 of 20 Date: 10/8/2018 3:49 PM Eastgate Building I (2019 Operations (with Solar) - Passenger Cars) - San Bernardino-South Coast County, Annual Eastgate Building
CalEEMod Version: CalEEMod.2016.3.2 Page 1 of 20 Date: 10/8/2018 3:49 PM Eastgate Building I (2019 Operations (with Solar) - Passenger Cars) - San Bernardino-South Coast County, Annual Eastgate Building
Appendix C. Air Quality/Greenhouse Gas Worksheets
 Appendix C Air Quality/Greenhouse Gas Worksheets Primary Greenhouse Gases (GHGs) of concern Carbon Dioxide. The global carbon cycle is made up of large carbon flows and reservoirs. Billions of tons of
APPENDIX F Goleta Valley Community Plan Update for the Eastern Goleta Valley Air / Greenhouse Gas Analysis
 Eastern Goleta Valley Community Plan EIR Appendices APPENDIX F Goleta Valley Community Plan Update for the Eastern Goleta Valley Air / Greenhouse Gas Analysis County of Santa Barbara Appendices Eastern
C.1 CRITERIA AIR POLLUTANT AND GREENHOUSE GAS EMISSIONS
 C.1 CRITERIA AIR POLLUTANT AND GREENHOUSE GAS EMISSIONS The California Emissions Estimator Model (CalEEMod) Version 2013.2.2 was used to estimate criteria air pollutant and greenhouse gas (GHG) emissions
Air Quality/Greenhouse Gas Analysis for the Green Valley Tentative Tract Map No and Project, City of Perris
 WO: 2015-0185 Technical Memorandum To: Kenneth Phung, City of Perris From: Eliza Laws, Senior Environmental Analyst Jillian Feyk-Miney, Assistant Environmental Analyst Date: February 22, 201 Re: Air Quality/Greenhouse
How to Calculate Winery Emissions for CEQA
 How to Calculate Winery Emissions for CEQA This guide is designed to be used with the Winery Excel for CEQA (SBCAPCDWineryExcelforCEQA.xlsx available online here https://www.ourair.org/land-use/#wineryresources)
Our Project file: TPI-2017P Highway 27, Vaughan, Proposed Restaurant, Parking Justification Study Letter Response to Study Peer Review
 13 February 22, 2018 c/o Ms. Nicole Sampogna Associate Planner Evans Planning Inc. 8481 Keele Street, Unit 12 Vaughan, Ontario, L4K1Z7 Our Project file: TPI-2017P004 Re: 9732 Highway 27, Vaughan, Proposed
ORLEANS GARDENS SHOPPING CENTRE 1615 ORLEANS BOULEVARD CITY OF OTTAWA, ONTARIO TRAFFIC UPDATE. Prepared for:
 ORLEANS GARDENS SHOPPING CENTRE 1615 ORLEANS BOULEVARD CITY OF OTTAWA, ONTARIO TRAFFIC UPDATE Prepared for: Orleans Gardens Shopping Centre Inc. 2851 John Street, Suite 1 Markham, ON K3R 5R7 June 12, 2015
Uniform Rules Update Final EIR APPENDIX 6 ASSUMPTIONS AND CALCULATIONS USED FOR ESTIMATING TRAFFIC VOLUMES
 APPENDIX 6 ASSUMPTIONS AND CALCULATIONS USED FOR ESTIMATING TRAFFIC VOLUMES ASSUMPTIONS AND CALCULATIONS USED FOR ESTIMATING TRAFFIC VOLUMES This appendix contains the assumptions that have been applied
Appendix A. Air Quality Management Plan
 Appendix A Air Quality Management Plan Panhandle Annexation and PUD Air Quality Mitigation Plan Ascent Environmental City of Sacramento 1 Panhandle Annexation and PUD Ascent Environmental TABLE OF CONTENTS
Jackson Ranch. Proposed 207± ac Mixed Use Highway Commercial Development. SWC Interstate 5 & Utica Ave in Kings County, CA
 Jackson Ranch Proposed 207± ac Mixed Use Highway Commercial Development Rachael Orlando 559.447.6252 rachael@retailcalifornia.com DRE # 01890236 SWC Interstate 5 & Utica Ave in Kings County, CA For additional
EMISSIONS ACTIVITY CATEGORY FORM YEAST LEAVENED BAKERY OVEN OPERATIONS
 FOR OHIO EPA USE FACILITY ID: EMISSIONS ACTIVITY CATEGORY FORM YEAST LEAVENED BAKERY OVEN OPERATIONS This form is to be completed for each yeast leavened bakery oven at commercial operations which produce
Architectural Review Board Report
 Architectural Review Board Report To: From: Subject: Architectural Review Board Architectural Review Board Meeting: August 16, 2010 Steve Traeger, Principal Urban Designer Laura Beck, ARB Liaison Agenda
Food Primary Liquor License Amendment
 City of Surrey PLANNING & DEVELOPMENT REPORT Food Primary Liquor License Amendment Proposal: Permit a food primary liquor license with hours of liquor service past midnight for a newly-approved eating
AWRI Refrigeration Demand Calculator
 AWRI Refrigeration Demand Calculator Resources and expertise are readily available to wine producers to manage efficient refrigeration supply and plant capacity. However, efficient management of winery
February 1, Project Description + Application Narrative New Commercial/Retail Development 1110 Hazeltine Boulevard Chaska, Minnesota.
 February 1, 2018 Elizabeth Hanson City Planner Community Development Department City of Chaska One City Hall Plaza Chaska, MN 55318 EHanson@chaskamn.com RE: Project Description + Application Narrative
TITLE: AMENDMENT TO STANDISH TOWN CODE, CHAPTER 181, LAND USE PART I (ZONING)
") DRAFT 11/13/12 TITLE: AMENDMENT TO STANDISH TOWN CODE, CHAPTER 181, LAND USE PART I (ZONING) ORDERED, that the Town of Standish hereby ordains the following amendments to the Land Use Ordinance, effective
DRAFT 11/13/12 TITLE: AMENDMENT TO STANDISH TOWN CODE, CHAPTER 181, LAND USE PART I (ZONING) ORDERED, that the Town of Standish hereby ordains the following amendments to the Land Use Ordinance, effective
Trip Generation at Fast Food Restaurants
 Trip Generation at Fast Food Restaurants in Saudi Arabia This study developed trip generation rates at fast food restaurants in Jeddah, Saudi Arabia. The results showed that vehicle trip rates were not
UNIVERSITY OF FLORIDA CAMPUS MASTER PLAN, : YEAR 2020 ROADWAY SYSTEM NEEDS PLAN
 UNIVERSITY OF FLORIDA CAMPUS MASTER PLAN, 2010-2020: YEAR 2020 ROADWAY SYSTEM NEEDS PLAN Prepared for: UNIVERSITY OF FLORIDA Prepared by: Revised July 2011 UF Campus Master Plan, 2010-2020, Year 2020 UF
THE ECONOMIC IMPACT OF BEER TOURISM IN KENT COUNTY, MICHIGAN
 THE ECONOMIC IMPACT OF BEER TOURISM IN KENT COUNTY, MICHIGAN Dan Giedeman, Ph.D., Paul Isely, Ph.D., and Gerry Simons, Ph.D. 10/8/2015 THE ECONOMIC IMPACT OF BEER TOURISM IN KENT COUNTY, MICHIGAN EXECUTIVE
SEMINOLE COUNTY AUDIT OF THE ALTERNATIVE FEE RATE STUDIES SEPTEMBER 2008
 SEMINOLE COUNTY AUDIT OF THE ALTERNATIVE FEE RATE STUDIES SEPTEMBER 2008 Prepared by: Internal Audit Division Clerk of the Circuit Court DISTRIBUTION LIST BOARD OF COUNTY COMMISSIONERS Ms. Brenda Carey
PLAN COMMISSION AGENDA ITEM EXECUTIVE SUMMARY
 PLAN COMMISSION AGENDA ITEM EXECUTIVE SUMMARY Project Title/Address: City Staff: General Amendment: BL District Drive-Through Facility Lot Area Ellen Johnson, Planner APPLICATION: PUBLIC HEARING 8/16/16
TYPE or PRINT IN INK. INCOMPLETE APPLICATIONS WILL BE RETURNED WITHOUT REVIEW. Permit will be sent to the address provided.
 APPLICATION TO OPERATE A TEMPORARY FOOD ESTABLISHMENT Iowa law prohibits a food establishment (including a Temporary Food Establishment) from opening or operating until a license has first been obtained
COUNTY OF SONOMA PERMIT AND RESOURCE MANAGEMENT DEPARTMENT 2550 Ventura Avenue, Santa Rosa, CA (707) FAX (707)
 FAX (707)") COUNTY OF SONOMA PERMIT AND RESOURCE MANAGEMENT DEPARTMENT 2550 Ventura Avenue, Santa Rosa, CA 95403-2829 (707) 565-1900 FAX (707) 565-8358 NOTICE OF PREPARATION OF A DRAFT ENVIRONMENTAL IMPACT REPORT
COUNTY OF SONOMA PERMIT AND RESOURCE MANAGEMENT DEPARTMENT 2550 Ventura Avenue, Santa Rosa, CA 95403-2829 (707) 565-1900 FAX (707) 565-8358 NOTICE OF PREPARATION OF A DRAFT ENVIRONMENTAL IMPACT REPORT
Post Office Box 686 Springfield, Virginia P: F:
 Fairfax County Parkway Property Address: 8249-A Backlick Rd, Lorton, VA 22079, Fairfax County Lease Terms and Information: Rent / SF / Yr + Svs: $12.00 / nnn; Terms: Negotiable; 4,047 SqFt available, with
Missoula Downtown Association
 Missoula Downtown Association 2018 Events Vendor Application Each year, the Missoula Downtown Association (MDA) hosts five major events that aim to bring our vibrant community together in the heart of
Food Primary Liquor License Amendment
 City of Surrey PLANNING & DEVELOPMENT REPORT File: Food Primary Liquor License Amendment Proposal: Amend Food Primary Liquor License to extend hours of operation for an existing restaurant. Recommendation:
PROPERTY DESCRIPTION PROPOSED CONSTRUCTION
 September 30, 2010 Project No. 10797 11A Ms. Ginger Hitzke Hitzke Development Corporation 251 Autumn Drive, Suite 100 San Marcos, CA 92069 Subject: Interpretive Report for Infiltration System Design, Proposed
Napa County Planning Commission Board Agenda Letter
 Agenda Date: 5/18/2016 Agenda Placement: 9C Napa County Planning Commission Board Agenda Letter TO: FROM: Napa County Planning Commission Charlene Gallina for David Morrison - Director Planning, Building
Winery Comparison Analysis
 L Winery Comparison Analysis Planning Commission Hearing vember 15, 2017 Summary of Location and Operation Criteria LOCATIONAL CRITERIA STAFF COMMENTS Size of Parcel 22.62 acres Proximity of Nearest Residence
ARTICLE 8 C-H, COMMERCIAL-HIGHWAY DISTRICT
 ARTICLE 8 C-H, COMMERCIAL-HIGHWAY DISTRICT SECTION 8.01 INTENT The Commercial-Highway District is established to accommodate those businesses offering a broad range of goods and services, including both
KITCHEN LAYOUT & DESIGN
 KITCHEN LAYOUT & DESIGN It is important to ensure that the cooking space is designed scientifically to achieve maximum productivity and to attain this objective the kitchen, where the all important food
THE ECONOMIC IMPACT OF WINE AND WINE GRAPES ON THE STATE OF TEXAS 2015
 THE ECONOMIC IMPACT OF WINE AND WINE GRAPES ON THE STATE OF TEXAS 2015 A Frank, Rimerman + Co. LLP Report Updated January 2017 This study was commissioned by the Texas Wine and Grape Growers Association
CST SERVICES LLC Part of the CST Brands, Inc. Family of Companies
 CST SERVICES LLC Part of the CST Brands, Inc. Family of Companies August 16, 2013 TO: City of Keller, Texas City Council Members Planning and Zoning Commission RE: Proposed Corner Store #1563 Northeast
Picturesque Russian River / Green Valley Estate
 Vineyard and Winery Sales 707-531-7914 Vineyardandwinerysales.com Wine Country Specialists Picturesque Russian River / Green Valley Estate 10201 Green Valley Road, Sebastopol Beautiful 50+/- Acre Estate
Manufactured Housing Community For Sale
 Manufactured Housing Community For Sale SEVEN PALMS MOBILE HOME PARK 42 Cherry Creek Road, Cloverdale, CA $2,650,000 Sales Price 42 MH Sites, House, & Cottage Well Managed & Maintained City Sewer & Water
FOR SALE W. Algonquin Road (Rt 62) Algonquin, IL (Formerly Fradillio s) Restaurant with Drive-Thru 5,085 SF
 Algonquin, IL (Formerly Fradillio s) Restaurant with Drive-Thru 5,085 SF") Industrial Commercial Office Land Business FOR SALE 2321 W. Algonquin Road (Rt 62) Algonquin, IL 60102 (Formerly Fradillio s) Restaurant with Drive-Thru 5,085 SF Bank-owned former masonry fast food restaurant
Industrial Commercial Office Land Business FOR SALE 2321 W. Algonquin Road (Rt 62) Algonquin, IL 60102 (Formerly Fradillio s) Restaurant with Drive-Thru 5,085 SF Bank-owned former masonry fast food restaurant
BOARD OF ZONING ADJUSTMENT STAFF REPORT Date: June 4, 2018
 # 5 BOA-000511-2018 BOARD OF ZONING ADJUSTMENT STAFF REPORT Date: June 4, 2018 CASE NUMBER 6182 APPLICANT NAME LOCATION VARIANCE REQUEST ZONING ORDINANCE REQUIREMENT ZONING AREA OF PROPERTY ENGINEERING
( ) For Company and Franchise Use 2012 Hardee s Food Systems, Inc. All rights reserved.
 For Company and Franchise Use 2012 Hardee s Food Systems, Inc. All rights reserved.") Double Lane Drive-Thru (11-26-12) For Company and Franchise Use 2012 Hardee s Food Systems, Inc. All rights reserved. Not all restaurants will be able to utilize a double drive-thru due to building layout,
Double Lane Drive-Thru (11-26-12) For Company and Franchise Use 2012 Hardee s Food Systems, Inc. All rights reserved. Not all restaurants will be able to utilize a double drive-thru due to building layout,
Annual Temporary Food License Application
 Annual Temporary Food License Application Iowa law prohibits a food establishment (including an Annual Temporary Food Establishment) from opening or operating until a license has first been obtained from
Citrus Fruits 2014 Summary
 United States Department of Agriculture National Agricultural Statistics Service Citrus Fruits 2014 Summary September 2014 ISSN: 1948-9048 Contents Utilized Citrus Production United States: 2004-2014...
Specific Plan. Final Environmental Impact Report Arrow Highway Specific Plan CITY OF GLENDORA SCH# APRIL 2018.
 APRIL 2018 Specific Plan CITY OF GLENDORA Final Environmental Impact Report Arrow Highway Specific Plan SCH# 2017041043 Prepared By: 1500 Iowa Avenue, Suite 110 Riverside, CA 92507 951-787-9222 www.migcom.com
Product Consistency Comparison Study: Continuous Mixing & Batch Mixing
 July 2015 Product Consistency Comparison Study: Continuous Mixing & Batch Mixing By: Jim G. Warren Vice President, Exact Mixing Baked snack production lines require mixing systems that can match the throughput
MOBILE FOOD VENDING TEXT AMENDMENT COMMUNITY INPUT MEETING
 MOBILE FOOD VENDING TEXT AMENDMENT COMMUNITY INPUT MEETING August 11, 2016 Welcome & Introductions Meeting Purpose Project background Review current standards and recommended standards Concerns and Feedback
Large-scale Accessory Winery Event. Large-scale accessory winery event is an event hosted by the on-site winery or off-site
 WINERY OR OFF-SITE WINE CELLAR SUPPLEMENTAL INFORMATION AND EVENT PLAN SAN JOAQUIN COUNTY COMMUNITY DEVELOPMENT DEPARTMENT 1810 E. HAZELTON AVENUE, STOCKTON CA 95205 BUSINESS PHONE: (209) 468-3121 Business
AGENDA ITEM 2 A Action Item. Brian James, Planning and Marketing Manager. Cameron Park Route Changes with Expansion of Service to El Dorado Hills
 AGENDA ITEM 2 A Action Item MEMORANDUM DATE: June 1, 2017 TO: FROM: SUBJECT: Brian James, Planning and Marketing Manager Cameron Park Route Changes with Expansion of Service to El Dorado Hills REQUESTED
Digital Menu Boards Overview
 Digital Menu Boards Overview Version: January 2013 2 Digital Menu Boards Overview Program Overview Digital Menu Boards, or DMBs, use best of breed technology, software and creative digital design to enhance
Napa County Planning Commission Board Agenda Letter
 Agenda Date: 10/15/2014 Agenda Placement: 9C Napa County Planning Commission Board Agenda Letter TO: FROM: Napa County Planning Commission Charlene Gallina for David Morrison - Director Planning, Building
DEFINITIONS: Page 1 of 6 F:\DEVSVC\Planning Application Forms\ Winery or Wine Cellar Supplemental Info & Marketing Plan. Doc (Revised )
") WINERY OR OFF-SITE WINE CELLAR SUPPLEMENTAL INFORMATION AND EVENT PLAN SAN JOAQUIN COUNTY COMMUNITY DEVELOPMENT DEPARTMENT 1810 E. HAZELTON AVENUE, STOCKTON CA 95205 BUSINESS PHONE: (209) 468-3121 Business
WINERY OR OFF-SITE WINE CELLAR SUPPLEMENTAL INFORMATION AND EVENT PLAN SAN JOAQUIN COUNTY COMMUNITY DEVELOPMENT DEPARTMENT 1810 E. HAZELTON AVENUE, STOCKTON CA 95205 BUSINESS PHONE: (209) 468-3121 Business
Notification/ Registration Certificate Number: (Attach copy of the verification of notification/ registration certificate)
") Application for Notification/Registration of Food Business For Mobile Food Businesses or Temporary Food Businesses Is this application for a mobile or temporary food business? Mobile Food Vehicle or Unit
Application for Notification/Registration of Food Business For Mobile Food Businesses or Temporary Food Businesses Is this application for a mobile or temporary food business? Mobile Food Vehicle or Unit
Acreage Forecast
 World (John Sandbakken and Larry Kleingartner) The sunflower is native to North America but commercialization of the plant took place in Russia. Sunflower oil is the preferred oil in most of Europe, Mexico
Attachments: Memo from Lisa Applebee, ACHD Project Manager PowerPoint Slides for October 27, 2009 Work Session
 Date: October 22, 2009 To: From: Re: Mayor and City Council Karen Gallagher Transportation Planner Fairview Avenue Concept Design and Access Management Plan Update and Public Outreach Plan Requested Action:
The National Association of Convenience Stores (NACS) defines a convenience store as:
 defines a convenience store as:") The National Association of Convenience Stores (NACS) defines a convenience store as: A retail business with primary emphasis placed on providing the public a convenient location to quickly purchase from
The National Association of Convenience Stores (NACS) defines a convenience store as: A retail business with primary emphasis placed on providing the public a convenient location to quickly purchase from
Standing Committee on Policy and Strategic Priorities. General Manager of Development, Buildings and Licensing
 ADMINISTRATIVE REPORT Report Date: December 6, 2018 Contact: Sarah Hicks Contact No.: 604.873.7546 RTS No.: 12753 VanRIMS No.: 08-2000-20 Meeting Date: January 30, 2019 TO: FROM: SUBJECT: Standing Committee
Irradiation of seeds of Pineapple orange resulted in the generation of a mutant,
 SEEDLESS PINEAPPLE ORANGES 4 5 7 8 9 0 Irradiation of seeds of Pineapple orange resulted in the generation of a mutant, initially identified as USDA -0-0, with reduced seed count. Horticultural characteristics
Findlay Market Brewery District Restaurant Facility, Utilities and Services
 Request for Proposal: Lease/Operation of Restaurant in Over the Rhine The Crown Building, 1739 Elm Street, Cincinnati, Ohio 45202 Contact: Kimberly Starbuck, 513-309-0191 kim@crownotr.com www.crownotr.com
New Opportunities for Toronto s Street Food Vendors
 New Opportunities for Toronto s Street Food Vendors Licensing and Standards Committee Tuesday, March 18, 2014 Tracey Cook Executive Director Carleton Grant Director, Policy & Strategic Support Municipal
End to End Chilled Water Optimization Merck West Point, PA Site
 End to End Chilled Water Optimization Merck West Point, PA Site Michael Nyhan, PE Associate Director at Merck Travis Smith, PE Principal at Smith Engineering Dan Shirley Utilities Engineer at Thermo Systems
City of Surrey PLANNING & DEVELOPMENT REPORT File:
 City of Surrey PLANNING & DEVELOPMENT REPORT PROPOSAL: Planning Report Date: July 14, 2008 Winery Special Events Area Endorsement (Liquor License) in order to permit an existing winery to host special
Memorandum for Tree Survey at the Marywood Residential Development Site in Orange, CA.
 Memorandum Date: January 22, 2015 To: From: Subject: The New Home Company Brianna Bernard, VCS Environmental Memorandum for Tree Survey at the Marywood Residential Development Site in Orange, CA. 1. Introduction
The Economic Impact of Wine and Grapes in Lodi 2009
 The Economic Impact of Wine and Grapes in Lodi 2009 Prepared for the Lodi District Grape Growers Association and the Lodi Winegrape Commission May 2009 A S T O N E B R I D G E R E S E A R C H R E P O R
Weather Sensitive Adjustment Using the WSA Factor Method
 Weather Sensitive Adjustment Using the WSA Factor Method Alternate CBLs can be requested within elrs to compensate for the temperature differences between the CBL basis days and the temperature of the
COMPILATION AND SUMMARY OF COMMERCIAL CATCH REPORT FORMS USED IN THE U.S. VIRGIN ISLANDS, 1974/75 TO 2004/05
 COMPILATION AND SUMMARY OF COMMERCIAL CATCH REPORT FORMS USED IN THE U.S. VIRGIN ISLANDS, 1974/75 TO 2004/05 Jennifer Messineo Bureau of Fisheries Division of Fish and Wildlife Department of Planning and
Technical Memorandum: Economic Impact of the Tutankhamun and the Golden Age of the Pharoahs Exhibition
 Technical Memorandum: Economic Impact of the Tutankhamun and the Golden Age of the Pharoahs Exhibition Prepared for: The Franklin Institute Science Museum Prepared by: Urban Partners November 2007 Economic
Quality of western Canadian flaxseed 2012
 ISSN 1700-2087 Quality of western Canadian flaxseed 2012 Ann S. Puvirajah Oilseeds Contact: Ann S. Puvirajah Oilseeds Tel : 204 983-3354 Email: ann.puvirajah@grainscanada.gc.ca Fax : 204-983-0724 Grain
Guidelines for Submitting a Hazard Analysis Critical Control Point (HACCP) Plan
 Plan") STATE OF MARYLAND DHMH Maryland Department of Health and Mental Hygiene 6 St. Paul Street, Suite 1301 Baltimore, Maryland 21202 Martin O Malley, Governor Anthony G. Brown, Lt. Governor John M. Colmers,
STATE OF MARYLAND DHMH Maryland Department of Health and Mental Hygiene 6 St. Paul Street, Suite 1301 Baltimore, Maryland 21202 Martin O Malley, Governor Anthony G. Brown, Lt. Governor John M. Colmers,
2. The proposal has been sent to the Virtual Screening Committee (VSC) for evaluation and will be examined by the Executive Board in September 2008.
 for evaluation and will be examined by the Executive Board in September 2008.") WP Board 1052/08 International Coffee Organization Organización Internacional del Café Organização Internacional do Café Organisation Internationale du Café 20 August 2008 English only Projects/Common
WP Board 1052/08 International Coffee Organization Organización Internacional del Café Organização Internacional do Café Organisation Internationale du Café 20 August 2008 English only Projects/Common
MARKET ANALYSIS REPORT NO 1 OF 2015: TABLE GRAPES
 MARKET ANALYSIS REPORT NO 1 OF 215: TABLE GRAPES 1. INTRODUCTION The following text is a review of the table grapes marketing environment. This analysis is updated on a quarterly 1 basis. The interval
TYPE II LAND USE APPLICATION Winery Events Special Use Permit
 LAND MANAGEMENT DIVISION Date Received: TYPE II LAND USE APPLICATION Winery Events Special Use Permit PUBLIC WORKS DEPARTMENT 3050 N. DELTA HWY, EUGENE OR 97408 Planning: 541-682-3577 For Office Use Only
TRANSPORTATION DEVELOPMENT TAX RATE SCHEDULE
 Attachment A TRANSPORTATION DEVELOPMENT TAX RATE SCHEDULE Land Use Category ITE Code Unit* Residential Single Family Detached 210 /dwelling unit $8,458 $8,706 Apartment 220 /dwelling unit $5,533 $5,696
New Centro Dining Model Starting February 5th
 February 2 nd, 2019 Valentine s Day Menus Coming Soon!. New Centro Dining Model Starting February 5th Birthday Night in GMH, Feb. 4 th. Centro will be CLOSED, Nosh will be open for Regular Service Key
PROPERTY HIGHLIGHTS PROPERTY: RESTAURANT: STORAGE:
 Corner Lot-S. Grand Blvd and Keokuk Street 34,015 SF Lot Zoning-F-Neighborhood Commercial istrict Located in the utchtown Neighborhood of St. Louis 29 Car Parking for Restaurant Large Lower Level Lot High
How Rest Area Commercialization Will Devastate the Economic Contributions of Interstate Businesses. Acknowledgements
 How Rest Area Commercialization Will Devastate the Economic Contributions of Interstate Businesses Acknowledgements The NATSO Foundation, a charitable 501(c)(3) organization, is the research and educational
Missoula Downtown Association 2019 Guest Vendor Application
 Missoula Downtown Association 2019 Guest Vendor Application Each year, the Missoula Downtown Association (MDA) hosts five major events that aim to bring our vibrant community together in the heart of Downtown
Directions for Menu Worksheet ***Updated 9/2/2014 for SY *** General Information:
 Directions for Menu Worksheet ***Updated 9/2/2014 for SY 2014-15*** Welcome to the FNS Menu Worksheet, a tool designed to assist School Food Authorities (SFAs) in demonstrating that each of the menus meets
Soybean Yield Loss Due to Hail Damage*
 1 of 6 6/11/2009 9:22 AM G85-762-A Soybean Yield Loss Due to Hail Damage* This NebGuide discusses the methods used by the hail insurance industry to assess yield loss due to hail damage in soybeans. C.
Farmers Market Food License Application
 Farmers Market Food License Application Iowa law prohibits a food establishment (including an Annual Farmers Market Food Establishment) from opening or operating until a license has first been obtained
Chisholm Trail Roundup Bar-B-Que Capital of Texas BAR-B-QUE CHAMPIONSHIP COOK OFF. Lockhart City Park, Lockhart, Texas June 2 & 3, 2017
 Chisholm Trail Roundup Bar-B-Que Capital of Texas BAR-B-QUE CHAMPIONSHIP COOK OFF Lockhart City Park, Lockhart, Texas June 2 & 3, 2017 Dear Cook, It s that time of year again! Time to fire up the pit and
CARL S JR RESTAURANT NNN INVESTMENT
 CARL S JR RESTAURANT NNN INVESTMENT CARL S JR. RESTAURANT NNN INVESTMENT 2617 Oklahoma Avenue Woodward, OK 73801 CARL S JR RESTAURANT NNN INVESTMENT CARL S JR. RESTAURANT EXECUTIVE SUMMARY PROPERTY Carl
Feasibility of Shortening the. Germination and Fluorescence Test Period. Of Perennial Ryegrass
 Feasibility of Shortening the Germination and Fluorescence Test Period Of Perennial Ryegrass Outline Background. OSU Study with over 2, samples. National referee study. Why is it important? Perennial ryegrass
A. CALL TO ORDER B. STATEMENT OF THE CHAIR C. BYLAWS D. ADJOURNMENT
 TOWN OF OLIVER Public Hearing Meeting Agenda October 10, 2017, at 7:00 PM Council Chambers Page A. CALL TO ORDER B. STATEMENT OF THE CHAIR C. BYLAWS 1. Zoning Amendment Bylaw 365 Zinfandel Avenue - Contract
Stallholders are expected to operate throughout the entire Festival, with exception to Sunday only market stallholders. The hours of operation are:
 FOOD STALLHOLDER APPLICATION FORM 2019 FESTIVAL INFORMATION Date Saturday 23 rd and Sunday 24 th February 2019 Website Times Venue www.tumbafest.com.au Saturday 23 rd February 10am 7pm Sunday 24 th February
TABLE OF CONTENTS. Page. Page
 TABLE OF CONTENTS Chapter 1 INTRODUCTION... 1-1 Background... 1-1 Planning Benefits... 1-1 Comprehensive Planning Law... 1-4 County Partnership... 1-5 Advisory Committee and Staff Structure... 1-5 Plan
ECONOMIC IMPACTS OF THE FLORIDA CITRUS INDUSTRY IN
 ECONOMIC IMPACTS OF THE FLORIDA CITRUS INDUSTRY IN 2007- Mohammad Rahmani and Alan W. Hodges Food and Resource Economics Department Institute of Food and Agricultural Sciences FLORIDA CITRUS INDUSTRY HIGHLIGHTS
Entry Form August
 Entry Form August 12-14 Competition Cost Chicken, Pork Ribs, Brisket $150.00 Jack Pot Items Jack Pot Pulled Pork $20 Jack Pot Chili $10 Electricity 20 amp 1 cord $30.00 Electricity 2 cord $65.00 Electricity
DATA AND ASSUMPTIONS (TAX CALCULATOR REVISION, MARCH 2017)
") DATA AND ASSUMPTIONS (TAX CALCULATOR REVISION, MARCH 2017) Taxes on sugary drinks can generate considerable revenue for states, cities, and the nation. The revised Revenue Calculator for Sugary Drink Taxes
DATA AND ASSUMPTIONS (TAX CALCULATOR REVISION, MARCH 2017) Taxes on sugary drinks can generate considerable revenue for states, cities, and the nation. The revised Revenue Calculator for Sugary Drink Taxes
NEEDS ASSESSMENT. Overview of Inputs Required for Apple Juice Production in Montezuma County
 1 NEEDS ASSESSMENT Overview of Inputs Required for Apple Juice Production in Montezuma County 2 Components of Overall Project Updated Market Study for Montezuma County Apples (Complete and Available) Needs
DRAFT SECTION 4(F) EVALUATION FAIRVIEW CEMETERY
 EVALUATION FAIRVIEW CEMETERY") DRAFT SECTION 4(F) EVALUATION I. DESCRIPTION OF SECTION 4(F) RESOURCE The Section 4(f) resource that could be affected by the proposed action is Fairview Cemetery. The proposed action would require the
DRAFT SECTION 4(F) EVALUATION I. DESCRIPTION OF SECTION 4(F) RESOURCE The Section 4(f) resource that could be affected by the proposed action is Fairview Cemetery. The proposed action would require the
CUP17-14 CONDITIONAL USE PERMIT REQUEST HIGHWAY 94 SOUTH
 CUP 17-14 CONDITIONAL USE PERMIT REQUEST - 2711 HIGHWAY 94 SOUTH Application: Owner: Applicant: Use Requested: Property Zoning: Area: Location: CUP17-14 Defiance Ridge Vineyards, LLC Chuck Gillentine,
Grape Growers of Ontario Developing key measures to critically look at the grape and wine industry
 Grape Growers of Ontario Developing key measures to critically look at the grape and wine industry March 2012 Background and scope of the project Background The Grape Growers of Ontario GGO is looking
Gail E. Potter, Timo Smieszek, and Kerstin Sailer. April 24, 2015
 Supplementary Material to Modelling workplace contact networks: the effects of organizational structure, architecture, and reporting errors on epidemic predictions, published in Network Science Gail E.
VENDOR APPLICATION FOR TEMPORARY EVENTS
 Eagle County Department of Environmental Health P.O. Box 179 Telephone: (970) 328-8755 500 Broadway Fax: (970) 328-8788 Eagle, Colorado 81631-0179 environment@eaglecounty.us FOOD VENDOR APPLICATION FOR
Health Effects due to the Reduction of Benzene Emission in Japan
 Health Effects due to the Reduction of Benzene Emission in Japan Hideo Kajihara 1, Akihiro Fushimi 2 1 Graduate School of Science and Technology, Niigata University, 8050, Ikarashi 2nocho, Niigata, 950-2181,
Going Round About Cycle Menus Linsey LaPlant, MS, RDN Health-e Pro Sales Manager. CSNA s Annual Conference Sacramento, CA
 Going Round About Cycle Menus Linsey LaPlant, MS, RDN Health-e Pro Sales Manager CSNA s Annual Conference Sacramento, CA What is a cycle menu? A cycle menu is a set of menus that repeat. The goal should
Letter of Determination
 SAN FRANCISCO (Clerically Amended - December 30, 2014) 1650 Mission St. Sue 400 San Francisco, CA 94103-2479 December 2, 2014 San Francisco, CA 94107 Site Address: Assessor s Block/Lot: Zoning District:
Upper Rappahannock. Load Study
 Upper Rappahannock River Basin Total Maximum Daily Load Study Rappahannock and Rapidan TAC Meetings Culpeper, Virginia February 27, 2007 Meeting Agenda Introductions and Background Katie Conaway, VA DEQ
2015 Festival of Trees
 2015 Festival of Trees Gingerbread Village Deadline for form entries: October 23, 2015 Please complete this form and return or fax to the Festival of Trees address below. Name: Address: City: State: Zip:
APPENDIX F. Lee County, FL Gasparilla Island CSRM draft integrated section 934 report & draft environmental assessment
 APPENDIX F Lee County, FL Gasparilla Island CSRM draft integrated section 934 report & draft environmental assessment I. Overview Public Access and Sharing Assessment The project is located in Lee County,