Using GPS, GIS & Remote Sensing to Understand Niagara Terroir: Pinot noir in the Four Mile Creek & St. David's Bench Sub-appellations
|
|
|
- Elijah Lyons
- 5 years ago
- Views:
Transcription
1 Using GPS, GIS & Remote Sensing to Understand Niagara Terroir: Pinot noir in the Four Mile Creek & St. David's Bench Sub-appellations by David Ledderhof, B.Eng. A Thesis submitted to the department of Biological Sciences in partial fulfillment of the requirements for the degree of Master of Science October, 2010 Brock University St. Catharines, Ontario David Ledderhof,
2 Abstract The relationships between vine water status, soil texture, and vine size were observed in four Niagara, Ontario Pinot noir vineyards in 2008 and The vineyards were divided into water status zones using geographic information systems (GIS) software to map the seasonal mean midday leaf water potential (,P), and dormant pruning shoot weights following the 2008 season. Fruit was harvested from all sentinel vines, bulked by water status zones and made into wine. Sensory analysis included a multidimensional sorting (MDS) task and descriptive analysis (DA) of the 2008 wines. Airborne multispectral images, with a spatial resolution of 38 cm, were captured four times in 2008 and three times in 2009, with the final flights around veraison. A semi-automatic process was developed to extract NDVI from the images, and a masking procedure was identified to create a vine-only NDVI image and 2009 were cooler and wetter than mean years, and the range of water status zones was narrow. Yield per vine, vine size, anthocyanins and phenols were the least consistent variables. Divided by water status or vine size, there were no variables with differences between zones in all four vineyards in either year. Wines were not different between water status zones in any chemical analysis, and HPLC revealed that there were no differences in individual anthocyanins or phenolic compounds between water status zones within the vineyard sites. There were some notable correlations between vineyard and grape composition variables, and spatial trends were observed to be qualitatively related for many of the variables. The MDS task revealed that wines from each vineyard were more affected by random fermentation effects than water status effects. This was confirmed by the DA; there were no differences between wines from the water status zones within vineyard sites for any attribute. Remotely sensed NDVI (normalized difference vegetation index) correlated reasonably well with a number of grape composition variables, as well as soil type. Resampling to a lower spatial resolution did not appreciably affect the strength of correlations, and corresponded to the information contained in the masked images, while maintaining the range of values of NDVI. This study showed that in cool climates, there is the potential for using precision viticulture techniques to understand the variability in vineyards, but the variable weather presents a challenge for understanding the driving forces of that variability. 2
3 Acknowledgments I would like to thank my colleagues and friends from CCOVI: Matthieu Marciniak, Fred DiProfio, Jim Willwerth, Amy Bowen, Vickie Tasker, Nicole Gaudette, Linda Tremblay and Gail Higenell for their help and support. I would have been lost without all of you. Of course the rest of the CCOVI family - Jenn Roberts, Barb Tatarnic and everyone else - you've helped to make this place my home. To Jamie Tam, Elizabeth DaSilva, Andy Greenwood, Brianna Greaves, Nancy England and Shawn Teskey, thank you for putting up with me, and being my best friends. Thank you to my parents and family for their support, patience, and everything that they do for me; especially encouraging this crazy idea to work in the wine industry. This project would not have been possible without the hard work of interns Dario Kreienbiihl, Marc Heumann, Tieg Lapointe, Marie LaFevre, and Katelynn Neufeld. In the heat, in the cold, and in the rain you were all troopers. Many thanks to all of my sensory panelists for their time and efforts, I know that it's not easy to stay motivated. For her expertise, advice and her laughter: many thanks to Marilyne Jollineau ofthe Department of Geography. Ralph Brown, I have appreciated all of the guidance you have given me, you have been a phenomenal supervisor and mentor. To Andy Reynolds, thank you for your support and all of your lessons in the vineyard and in the classroom. My biggest thanks go out to the staff of Coyote's Run Estate Winery and Five Rows Craft Wine of Lowrey's Vineyard. In particular, Dave Sheppard & Steve Trussler at Coyote's Run, and Wes, Howie and Wilma Lowrey of Five Rows Craft Wine. 3
4 Table of Contents Abstract... 2 Acknowledgments... 3 Table of Contents... 4 List of Tables... 7 List of Figures Symbols & Abbreviations Introduction Terroir Vine Water Status Precision Viticulture Hypotheses & Objectives Literature Review Terroir Terroir & Soil Water Status Vine Vigour Geomatics Remote Sensing Precision Agriculture Literature Cited Spatial Variability in Vineyards: The Use of Geomatics and Implications for Precision Viticulture Introduction Materials & Methods Vineyard Sites & Sentinel Vines Soil Sampling Soil Moisture
5 3.2.4 Vine Water Status Vine Size Harvest Winemaking Weather Data Berry, Must & Wine Composition Spatial Mapping Data Analysis Results & Discussion Vineyard Variability Must &Wine Analysis Weather Geomatics Conclusions Literature Cited Influence of Water Status on Sensory Profiles of Niagara, Ontario Pinot noir Introduction Materials & Methods Multidimensional Sorting Task Descriptive Analysis Statistical Methods Results Multidimensional Sorting Descriptive Analysis Discussion Multidimensional Sorting DA Panel Performance Effect of Water Status & Vineyard Location Conclusions Literature Cited Using Remote Sensing to Understand Vineyard Variability... l Introduction Materials & Methods Airborne Multispectral Images
6 5.2.2 Image Processing Data Extraction Ground-based Leaf Reflectance Statistical Methods Results Discussion Method Development Remote Sensing and Vineyard Performance Conclusions Literature Cited General Discussion & Conclusions Literature Cited Supplemental Materials
7 List of Tables Table 3-1: Means of yield components grouped by water status zone, 2008 & 2009, all four vineyards Table 3-2: Means of vineyard water status and vine size grouped by water status zone, 2008 & 2009, all four vineyards Table 3-3: Means of berry Brix, TA, ph grouped by water status zone, 2008 & 2009, all four vineyards Table 3-4: Means of berry total anthocyanins, colour intensity, hue, total phenols grouped by water status zone, 2008 & 2009, all four vineyards Table 3-5: Means of soil variables grouped by water status zone, 2008 & 2009, all four vineyards Table 3-6: Means of wine TA, ph, % ethanol, 2008 & 2009, all four vineyards Table 3-7: Means of wine total anthocyanins, colour intensity, hue and total phenols, 2008 & 2009, all four vineyards Table 3-8: Means of must TA, ph and soluble solids, 2008 & 2009, all four vineyards Table 3-9: Means of must total anthocyanins, colour intensity, hue and total phenols, 2008 & 2009, all four vineyards... : Table 3-10: Means of individual anthocyanin concentrations in wines, 2008 & 2009, all four vineyards Table 3-11: Means offlavonol-3 phenolics concentrations in wines, 2008 & 2009, all four vineyards Table 3-12: Means of non-flavonoid phenolics and stilbene concentrations in wines, 2008 & 2009, all four vineyards Table 4-1: Descriptive analysis sensory attributes, definitions, and reference standards for 2008 wines Table 4-2: Means of descriptive analysis attributes by vineyard; 2008 wines from Red Paw 1, Red Paw 2 and Lowrey's vineyards Table 4-3: Means of descriptive analysis attributes by water status zone; 2008 wines from Red Paw 1, Red Paw 2 and Lowrey's vineyards Table 5-1: Means ofndiv -red extracted from 2008 & 2009 airborne images at all four vineyards, vines grouped by water status zone, lxi, 3x3, 5x5 pixel re-sampling Table 5-2: Means ofndiv-green extracted from 2008 & 2009 airborne images at all four vineyards, vines grouped by water status zone, lxi, 3x3, 5x5 pixel re-sampling Table 5-3: Pearson correlation coefficient and p-value of vegetation indices extracted from remotely sensed images against those calculated from ground-based reflectance on individual collection dates in 2008, all four vineyards
8 Table 5-4: Pearson correlation coefficient and p-value of vegetation indices extracted from remotely sensed images against those calculated from ground-based reflectance on individual collection dates in 2009, all four vineyards Table 7-1: Summary statistics for harvest components, grape composition, and vineyard soil variables for the Red Paw 1 vineyard Table 7-2: Summary statistics for harvest components, grape composition, and vineyard soil variables for the Red Paw 2 vineyard Table 7-3: Summary statistics for harvest components, grape composition, and vineyard soil variables for the Black Paw vineyard Table 7-4: Summary statistics for harvest components, grape composition, and vineyard soil variables for Lowrey's vineyard Table 7-5: Means of yield components grouped by vigour status zone, 2008 & 2009, all four vineyards Table 7-6: Means of vineyard water status and vine size grouped by vigour status zone, 2008 & 2009, all four vineyards Table 7-7: Means of berry Brix, TA, ph grouped by vigour status zone, 2008 & 2009, all four vineyards Table 7-8: Means of berry total anthocyanins, colour intensity, hue, total phenols grouped by vigour status zone, 2008 & 2009, all four vineyards Table 7-9: Means of soil variables grouped by water status zone, 2008 & 2009, all four vineyards. 152 Table 7-10: Pearson's correlation coefficients between yield components, berry composition, and vineyard moisture and soil variables, 2008, all four vineyards Table 7-11: Pearson's correlation coefficients between yield components, berry composition, and vineyard moisture and soil variables, 2009, all four vineyards Table 7-12: Monthly rainfall for 2008, 2009 and the long-term mean Table 7-13: F-values and significance of sensory attributes for Red Paw 1 wines from the three-factor ANDV A with interactions Table 7-14: F-values and significance of sensory attributes for Red Paw 2 wines from the three-factor ANDV A with interactions Table 7-15: F-values and significance of sensory attributes for Lowrey's wines from the three-factor ANDV A with interactions Table 7-16: F-values and significance of sensory attributes for all wines from the two-factor ANDV A across vineyard site and water status zone Table 7-17: Means of descriptive analysis aroma attributes by wine; 2008 wines from Red Paw 1, Red Paw 2 and Lowrey's vineyards Table 7-18: Means of descriptive analysis flavour, taste & mouthfeel attributes by wine; 2008 wines from Red Paw 1, Red Paw 2 and Lowrey's vineyards Table 7-19: Pixel values extracted from a remotely sensed image to determine the location ofthe seeding point for data extraction
9 Table 7-20: Pixel values extracted from a remotely sensed image to show that taking the NDVI on a pixel-by-pixel basis is not equivalent to re-sampling the pixels in each waveband before calculating the NDVI Table 7-21: Means ofndiv-red extracted from 2008 & 2009 airborne images at all four vineyards, vines grouped by vigour status zone, lxi, 3x3, 5x5 pixel re-sampling... : Table 7-22: Means ofndiv-green extracted from 2008 & 2009 airborne images at all four vineyards, vines grouped by vigour status zone, lxi, 3x3, 5x5 pixel re-sampling Table 7-23: Pearson's correlation coefficients between descriptive analysis attributes, 2008 wines from Red Paw 1, Red Paw 2 and Lowrey's vineyards Table 7-24: Pearson correlation coefficient ofndvi-red extracted from airborne images against mean 'P, 2008 & 2009, lxi, 3x3, and 5x5 re-sampling Table 7-25: Pearson correlation coefficient ofndvi-green extracted from airborne images against mean 'P, 2008 & 2009, lxi, 3x3, and 5x5 re-sampling Table 7-26: Pearson correlation coefficient ofndvi-red extracted from airborne images against mean vine size, 2008 & 2009, lxi, 3x3, and 5x5 re-sampling Table 7-27: Pearson correlation coefficient ofndvi-green extracted from airborne images against mean vine size, 2008 & 2009, lxi, 3x3, and 5x5 re-sampling Table 7-28: Pearson correlation coefficient ofndvi-red extracted from airborne images against berry total phenolics, 2008 & 2009, lxi, 3x3, and 5x5 re-sampling Table 7-29: Pearson correlation coefficient ofndvi-green extracted from airborne images against berry total phenolics, 2008 & 2009, lxi, 3x3, and 5x5 re-sampling Table 7-30: Pearson correlation coefficient ofndvi-red extracted from airborne images against berry total anthocyanins, 2008 & 2009, lxi, 3x3, and 5x5 re-sampling Table 7-31: Pearson correlation coefficient ofndvi-green extracted from airborne images against berry total anthocyanins, 2008 & 2009, lxi, 3x3, and 5x5 re-sampling Table 7-32: Pearson correlation coefficients between seasonal mean vegetation indices from airborne images and yield components and berry composition; 2008, all four vineyards Table 7-33: Pearson correlation coefficients between seasonal mean vegetation indices from airborne images and yield components and berry composition; 2009, all four vineyards
10 List of Figures Figure 3-1: Sentinel vine sampling strategy in the Red Paw vineyards Figure 3-2: Sentinel vine sampling strategy in Black Paw and Lowrey's vineyards Figure 3-3: Maps of Red Paw 1,2008 & 2009 mean 'I' Figure 3-4: Maps of Red Paw 2,2008 & 2009 mean 'I' Figure 3-5: Maps of Black Paw, 2008 & 2009 mean 'I' Figure 3-6: Maps of Lowrey's, 2008 & 2009 mean 'I' Figure 3-7: pea of yield components, grape composition, and vineyard variables, 2008, all four vineyards, vines grouped by water status zone Figure 3-8: pea of yield components, grape composition, and vineyard variables, 2009, all four vineyards, vines grouped by water status zone Figure 3-9: pea of yield components, grape composition, and vineyard variables, 2008 & 2009, all four vineyards, vines grouped by water status zone Figure 4-1: Three dimensional stimulus configurations from Multidimensional Scaling of 2008 Red Paw 1 wines Figure 4-2: Three dimensional stimulus configurations from Multidimensional Scaling of2008 Red Paw 2 wines Figure 4-3: Three dimensional stimulus configurations from Multidimensional Scaling of2008 Lowrey's wines Figure 4-4: pea of descriptive analysis sensory attribute intensity of 2008 wines from all four vineyards Figure 5-1: pea of yield components, grape composition, vineyard variables and leaf reflectance, 2008, all four vineyards, vines grouped by water status zone Figure 5-2: pea of yield components, grape composition, vineyard variables and leaf reflectance, 2009, all four vineyards, vines grouped by water status zone Figure 5-3: pea of yield components, grape composition, vineyard variables and leaf reflectance, 2008 & 2009, all four vineyards, vines grouped by water status zone Figure 5-4: Maps of Lowrey's NDVI-red extracted from airborne images. 29 July 2008 & 21 August 2008; lxi, 3x3, 5x5 pixel re-sampling Figure 5-5: Trend of Pearson correlation coefficient ofndvi-red against (a)'i', (b) shoot weight, (c) total phenols and (d) total anthocyanins, 3x3 pixel re-sampling, 2008 & 2009, all four vineyards Figure 5-6: eir, NDVI and masked NDVI from a section of 1 September 2009 airborne image, Red Paw 2 vineyard Figure 5-7: Red Paw 2 vineyard, 1 September 2009: masked NDVI and map ofndvi extracted from the same image, 3x3 pixel re-sampling
11 Figure 7-1: Plot of Lowrey's vineyard 2009 actual vs. predicted shoot weight created using the multiple regression model of shoot weight using cane diameter and internode length Figure 7-2: Rainfall and data collection events for 2008 and Figure 7-3: Maps of Red Paw 1,2008, yield components, berry Brix, ph & TA Figure 7-4: Maps of Red Paw 1,2008, berry total anthocyanins, colour intensity, hue, total phenolics, shoot weight and mean soil moisture Figure 7-5: Maps of Red Paw 1 soil variables Figure 7-6: Maps of Red Paw 1,2009, yield components, berry Brix, ph & TA Figure 7-7: Maps of Red Paw 1, 2009, berry total anthocyanins, colour intensity, hue, total phenolics and mean soil moisture Figure 7-8: Maps of Red Paw 2, 2008, yield components, berry Brix, ph & TA Figure 7-9: Maps of Red Paw 2,2008, berry total anthocyanins, colour intensity, hue, total phenolics, shoot weight and mean soil moisture Figure 7-10: Maps of Red Paw 2 soil variables Figure 7-11: Maps of Red Paw 2,2009, yield components, berry Brix, ph & TA Figure 7-12: Maps of Red Paw 2,2009, berry total anthocyanins, colour intensity, hue, total phenolics and mean soil moisture... '167 Figure 7-13: Maps of Black Paw, 2008, yield components, berry Brix, ph & T A Figure 7-14: Maps of Black Paw, 2008, berry total anthocyanins, colour intensity, hue, total phenolics, shoot weight and mean soil moisture Figure 7-15: Maps of Black Paw soil variables Figure 7-16: Maps of Black Paw, 2009, yield components, berry Brix, ph & TA Figure 7-17: Maps of Black Paw, 2009, berry total anthocyanins, colour intensity, hue, total phenolics and mean soil moisture Figure 7-18: Maps of Lowrey's, 2008, yield components, berry Brix, ph & TA Figure 7-19: Maps of Lowrey's, 2008, berry total anthocyanins, colour intensity, hue, total phenolics, shoot weight and mean soil moisture Figure 7-20: Maps of Lowrey's soil variables Figure 7-21: Maps of Lowrey's, 2009, yield components, berrybrix,ph & TA Figure 7-22: Maps of Lowrey's, 2009, berry total anthocyanins, colour intensity, hue, total phenolics, shoot weight and mean soil moisture Figure 7-23: CIR image of the same portion of Red Paw 2 vineyard from 22 June 2009 and 5 August Figure 7-24: Histogram ofndvi values extracted from Red Paw 2,22 June
12 Figure 7-25: CIR and NDVI image subsection from Red Paw 2, 22 June 2009, indicating the process of locating the seed point for data extraction Figure 7-26: CIR image of a section of Red Paw 2, 1 September 2009, with a rectangle highlight to show that individual wavebands should be re-sampled before calculating the NDVI
13 Symbols & Abbreviations AN OVA AVHRR AVIRIS CCOVI CIR CV DA DN GCP GIS GPS HPLC IDW LAI LSD MDS NDVI NIR PA PCA PV RGB RMSE ROI RSQ RST TA TDR UTM VI 'I' Analysis of variance Advanced very high resolution radiometer Airborne visible/infrared imaging spectrometer Cool Climate Oenology & Viticulture Institute False-colour near-infrared Coefficient of variation Descriptive analysis Digital number Ground control point Geographic information system Global positioning system High pressure liquid chromatography Inverse distance weighting Leaf area index Least significant difference Multidimensional sorting Normalized difference vegetation index Near-infrared Precision agriculture Principal component analysis Precision viticulture Red-green-blue Root mean square error Region of interest Overall squared correlation index Rotation stretch translation Titratable acidity Time domain reflectometry Universal transverse mercator Vegetation index Leaf water potential 13
14 1.0 Introduction 1.1 Terroir In Old World winegrowing regions, the effects responsible for differences between vineyards have been collectively referred to as terroir (Van Leeuwen & Seguin 2006). This idea can be applied to any product with characteristics that are unique to its region of origin, but is perhaps most renowned for its long history associated with wine appellations of origin. There are many factors accepted to be part of terroir, and these have been subject to research around the winegrowing world. The regional climate, and the site-specific microclimate, the soil pedology or texture, soil nutrient content and uptake by the vine, and the underlying geology of a region all playa role in defining terroir (VanLeeuwen & Seguin 2006; Andres-de Prado et al. 2007). The human component of grape growing is also a factor in terroir. The traditional viticultural and winemaking practices of a region, the characteristics of sites devoted to grape growing, the crops sharing the land, and the varieties of grapes planted are influenced by tradition as well as emerging technologies (VanLeeuwen & Seguin 2006). In the New World, especially in younger regions such as the Niagara Peninsula in Ontario, there is not the history and tradition to direct the grading of wines grown from specific sites. Thus in the open market, growers are left to find and adapt new tools for understanding their vineyards. 1.2 Vine Water Status As living plants, grapevines require water, which they draw primarily from the soil. The available water is controlled by climate, irrigation, solar radiation and the water-holding capacity of the soil. These factors have been shown to impact the vegetative growth of grapevines, as well as the composition of the fruit and the organoleptic character of the wine (Koundouras et al. 2006). The increasing use of irrigation in many New World vineyards necessitates the need to understand how the application of water, or withholding water from vines, will 14
15 change the growth habits of the vine and the composition of the fruit. Conversely, where irrigation is not used, the water status of the vines may be manipulated through other cultural practices, but will ultimately be affected by variations in the soil with consequences for the composition of the fruit (Acevedo-Opazo 2008). Variable water status within a vineyard is itself a component of the terroir of that site. 1.3 Precision Viticulture The basic premise of precision agriculture (P A) is that inputs to farming practices are in response to information gathered with the intent of affecting outputs through an information feedback-loop system (Bramley et al. 2001). On a commercial scale, PA involves the collection of data on any number of specific metrics of interest, as well as ancillary data, the interpretation and analysis of those data in order to identify trends, the implementation of a management plan to accommodate or change those trends, and the collection of data to observe those results leading to a new cycle (Bramley et al. 2001). When applied to viticulture, there is a focus on understanding the spatial and temporal variability in the production of wine grapes (Hall et al. 2003). Grapegrowers have traditionally accepted the variability within vineyards as inherent to the underlying qualities of the site itself, the terroir. With many years of experience, vineyard areas have been subdivided into individually rated vineyards of higher or lower quality. The emergence of geomatics software has allowed grape growers to geographically link information from their vineyards into the P A feedback loop, and target inputs to specific regions of their vineyards. Remote sensing and geomatics tools have been used successfully in grape production in New World regions including California (Johnson et al. 2001), Australia (Hall et al. 2003; Lamb et al. 2004), and Chile (Acevedo-Opazo 2008) as well as Old World regions including Spain (Zarco-Tejada et al. 2001). 1.4 Hypotheses & Objectives This study aimed to investigate the use of precision viticulture in building understanding terroir in a New World growing region. Four individual commercial 15
16 vineyards planted to Vitis vinifera L. cv. Pinot noir in the Four Mile Creek and St. David's Bench sub-appellations, Niagara Region, Canada were the study locations. Geomatics tools can be used to understand some of the aspects of New World terroir in terms of spatial variability of soil composition and vineyard moisture status. These tools were to be tested for use in the cool climate Niagara Region. It was hypothesized that vine water status will be related to yield components and berry composition. In particular, soluble solids, ph, titratable acidity (TA), total anthocyanins, total phenolic compounds, colour intensity and hue will be affected by the water status of the vine. These effects will also be apparent in the must and wine chemical composition, and in the sensory attributes of the wines made from fruit in delineated water status zones. Additionally, it was hypothesized that information extracted from multispectral remotely sensed images can be used to identify variations in vineyard metrics and berry composition. 16
17 2.0 Literature Review 2.1 Terroir Terroir & Soil The combined effects that create innate differences between vineyards have been collectively referred to as terroir (Van Leeuwen & Seguin 2006). As a principal driver ofterroir, and the primary growth media for grapevines around the world, the soil is an important component of grape growing. Seguin (1986) made a thorough investigation into the soils of the Bordeaux region in France, finding that the complex interactions of the vine with the soil and the climate produce very difficult to predict results. There is no single ideal soil type for grape production: schist, granite, gravel, clay, marl, sandstone and sand are all associated with premium wine regions around the world (Seguin 1986; Andres-de Prado et al. 2007). The soil type, along with climatic and viticultural factors including soil tillage and rootstock selection, will affect the vine's ability to use available soil nutrients and moisture, affecting vine health and even influencing the incidence of root rot (Seguin 1986). Implicit in the discussion of terroir is that the grapes from different regions, even ifvinified in the same way by the same winemaker, will create wines that are different as a reflection of where they were grown. Guinard & Cliff (1987) used descriptive analysis to derive a sensory profile of Pinot noir wines from the Cameros region in California that was different from the wines of the Napa Valley and the larger Sonoma regions. However, the wines evaluated by Guinard & Cliff (1987) were commercially crafted wines from a number of wineries, and they may have been describing winemaking influences rather than terroir differences. The human component of grape growing is also part of terroir. The traditional viticultural practices of a region, the type of sites devoted to grape growing, and the varieties of grapes planted are influenced by tradition as well as emerging technologies (Van Leeuwen & Seguin 2006). By some definitions, the viticulturist and the winemaker themselves may be a part of terroir. 17
18 The depth and distribution of the roots is influenced by soil texture (Seguin 1986) as well as inter-row management (Morlat & Jacquet 2003). Nutrient content was found to be greater with the presence of inter-row vegetation; however, when this vegetation was permanent, the vine root systems did not spread into this space as they did without the presence of vegetation. Consequently, the vines may not have been able to uptake their nutrient requirements, and musts were found to have lower concentrations of yeastassimilable nitrogen compounds. Similarly, soil under permanent cover had higher moisture holding capacity and a higher soil nitrogen content, but the vines were unable to use this moisture or nitrogen because of reduced root growth (Morlat & Jacquet 2003). In New York State, alternative ground covers were investigated in a Pinot noir vineyard by Hostetler et a1. (2007). They found that geotextile mulches reduced weed growth, but had no positive influence on available soil moisture, vine size, yield or grape composition. Viticultural practices are a component of terroir; this may be especially true in regions where traditions, rather than innovation, govern activities in the vineyard. In the New World, especially in younger regions such as the Niagara Peninsula in Ontario, consumers are left to be the judge of a wine's value. The degree of variation within New World regions cannot be over-estimated; there is a wide range of soil parent material, slope & aspect, distance from the moderating influence of Lake Ontario and associated mesoclimate conditions in the Niagara Peninsula (Shaw 2005). The soils are predominantly Halton clay over Queenston shale and lacustrine sandy loam, with high water holding capacity. The Niagara Escarpment, the most prominent geological feature in the area, has exposed dolomite limestone cliffs with gentler slopes covered with silty and clay loams. These areas experience far better drainage, and are almost entirely northfacing (Shaw 2005). This variation, the relatively young age of the grape-growing industry, and the lack of a strict appellation of origin system means that growers and wineries are left to fmd and adapt new tools for understanding their vineyards. Reynolds et a1. (2007b) used geomatics tools to map variability in elevation, soil type, yield, and grape composition as a means of understanding how these factors of terroir express themselves in Niagara-grown Riesling. They found that both vine vigour and soil texture influenced berry composition, but expression of yield components and 18
19 some grape composition was not stable over time, suggesting the presence of other physical factors, in addition to underlying vine balance issues Water Status The effect of water stress on grapevine and fruit development has been extensively documented. The physiological impact of water stress on grapevines is largely agreed upon, but the mechanisms and effect on grape composition is not. Generally, when water loss from transpiration exceeds the available water, governed by solar radiation, temperature and relative humidity, physiological stress occurs (Hardie & Considine 1976). Water stress may result in reduced fruit set (Hardie & Considine 1976), reduced yield (Hardie & Considine 1976), increased sugar accumulation and break-down of malic acid (Koundouras et al 2006), increased concentrations of anthocyanins and total grape phenolics (Koundouras et al 2006; Sivilotti et al. 2005), and generally desirable grape composition and wine sensory attributes (Reynolds et al 2007b; Matthews et al. 1990). Stomatal openings regulate the rate of photosynthetic activity. As leaf water potential ('I') approaches -5 bar, the openings begin to narrow, and at -12 bar they close entirely (Kriedemann & Smart 1971). The timing of the water stress has been shown to affect the vine in different ways. Extreme water stress after veraison has a negative impact on the vine's ability to produce sugars, and the concentration of soluble solids in the grapes will be negatively affected (Hardie & Considine 1976). Around the period of bloom, severe water stress causes a reduction in yield by impacting fruit set (Hardie & Considine 1976). Sivilotti et al. (2005) found that moderate water stress after veraison did not impact that soluble solids, ph or TA of the berries, but increased the concentration of polymerized phenolic compounds as well as berry anthocyanins in Merlot. They attributed the discrepancies in the effect of water stress on soluble solids and TA to the different environmental conditions of research sites (Sivilotti et al 2005). They also observed that soil moisture was inconsistent with irrigation regimes, and not clearly related to wine water status. It was postulated that temperature affected transpiration, and that after a vintage of stress the vine would respond with reduced water uptake and a more negative 'I' (Sivilotti et al. 2005). 19
20 It was observed in an Oregon Pinot noir vineyard that the presence of inter-row cover crop decreased soil moisture, but did not affect vine water status. Where there was lower soil moisture observed between vintages, there was a corresponding increase in water stress (Sweet & Schreiner, 2010). While in general, soil moisture and vine water status are intuitively related, the specifics of current and previous vineyard conditions may change this relationship. Chone et al. (2001) found that the method of measuring water potential, as well as soil type, impacted the ability to detect water stress. Dawn leaf water potential and stem water potential as well as midday stem water potential were much more responsive to water stress than was midday leaf water potential, and would indicate water stress first (Chone et al. 2001). In Cabemet Sauvignon grapes in Washington state, Keller et al. (2008) found that increasing the degree of water stress through deficit irrigation did not impact vine vegetative growth, or berry composition except when the water stress was applied before fruit set. Additional contradictions were observed by Koundouras et al. (2006), who found that yield and berry size were not affected by water stress, while vegetative growth and soluble solids were affected. The timing, rather the intensity, of the water stress had the most significant impact on grape phenolics, whereas the timing of the water stress was more important for soluble solids. Skin flavonoid concentrations were increased under a deficit irrigation regime by Kennedy et al. (2002). These differences were on a by-weight basis, but not on a perberry basis. They found that there was little change in the concentration of berry anthocyanins late in ripening under water stress, but that an increase in pigmented polymers may have led others to the conclusion that anthocyanin concentrations were increasing (Kennedy et al. 2002). The physiological processes of ripening berries while subjected to water stress are not entirely understood. In terms of sensory attributes, there is a relationship between the presence of moderate water stress and hedonic liking of wines made from the Agiorgitiko grape (Koundouras et al. 2006). Conversely, Reynolds et al. (2007a) found that irrigation used 20
21 to decrease the level of water stress increased the intensity of desirable sensory attributes in Chardonnay. There is a large degree of disagreement in literature as to the effect of water stress on grapevine physiology and resulting wine characteristics and quality. These disagreements may arise from other factors influencing the vine growth, ultimately included in a broad definition of terroir Vine Vigour There have many numerous studies into the effect of fruit shading and vine vigour on grape composition and wine attributes. The sunlight exposure of the grapes is directly related to the vigour of the vines, and can be influenced by canopy management that must balance exposure with sufficient leaf area to ripen the fruit. Bergqvist et al. (2001) found that in California-grown Cabernet Sauvignon and Grenache grapes, increased sunlight exposure increased berry soluble solids, decreased the TA, and increased the concentration of phenolic compounds. Different treatments were achieved by leaf thinning, and shoot thinning or positioning as required to gain complete exposure, single or multiple layers of leaf shading, and fully shaded by more than four leaf layers. The change in berry composition was limited; there was an increase in ambient temperature resulting from the increased intensity of solar radiation, and grapes with increased exposure to afternoon sun did not experience the same degree of compositional changes (Bergqvist et al. 2001). In a more controlled environment, Cortell & Kennedy (2006) placed Oregon Pinot noir clusters in shade boxes to exclude Ijght exposure to specific clusters on the same vine as exposed clusters. They did not find a temperature increase of more than O.5 C inside the light exclusion boxes. The exposed fruit had higher concentrations of proanthocyanins, as well as the five individual anthocyanins found in Pinot noir grapes. In particular, the relative proportion of the anthocyanin delphinidin-3-0-glucoside was found to be lower in light excluded clusters in both high and low vigour vines, suggesting a direct response to sunlight exposure (Cortell & Kennedy 2006). The effect of canopy density in British Columbia Pinot noir vines on Yield and grape composition was studied by Reynolds et al. (1994). They found that in high vigour 21
22 zones, a vertically divided canopy could be used to maintain a higher number of shoots/metre of canopy, and consequently increase the total yield. It would also limit fruit shading, and improve fruit composition metrics (Reynolds et al. 1994). The increased canopy area meant that a larger crop could be successfully ripened through the larger photosynthetic active area. Additionally, the divided canopy architecture encouraged light exposure of the fruit. To separate the effect of sunlight and temperature, Spayd et al. (2002) introduced treatments in combinations of sun-exposure, shading, heating and cooling. The concentration of monomeric anthocyanins increased in exposure to sunlight, regardless of the temperature regime. Excess exposure to sun, resulting in high temperatures in the fruiting zone decreased the total anthocyanin concentrations, and higher temperatures generally resulted in lower concentrations of anthocyanins. Sunlight is required, but excess heat should be avoided for anthocyanin synthesis, especially in warm to hot viticultural regions (Spayd et al. 2002). The relationship between vigour and anthocyanin concentration in Oregon Pinot noir was studied extensively by Cortell et al. (2007a, 2007b, 2008). Vines were assigned to spatially delineated vigour zones based on shoot length, trunk cross-sectional area and leaf chlorophyll content. The yield was highest in the medium-'vigour zone, soluble solids accumulation was lower in the high-vigour zones, and TA was lower in the low vigour zones. In other words, fruit was riper in the lower vigour zones. There was higher anthocyanin accumulation in the lower vigour zones, in particular the concentrations of delphindin-3-0-glucoside and petunidin-3-0-glucoside increased. They concluded that the fruit zone microclimate was ideal in the lower and medium vigour zones, resulting in a balance of sunlight and heat, and favorable vine balance conditions (Cortell et al. 2007a). In the wines made from the fruit in these vigour zones, the high vigour zones had the lowest concentration of anthocyanins, and the medium vigour zone wines had the highest concentrations (Cortell et al. 2007b). The wines that were made as a part of that study were subjected to sensory analysis by Cortell et al. (2008). The differences between the wines were in Cl;stringency, bitterness, sour and sweet tastes, earthy and chemical flavours, and heat. The low vigour zone wines tended to have the highest intensity of perceived astringency, and this was 22
23 related to the actual tannin concentration in the fruit and skins. In a stepwise regression, the vine vigour was more important than vineyard site to explain the differences in the wines for the significantly different attributes. This was especially true of the differences in astringency, sour, chemical and bitterness (Cortell et al. 2008). There is a relationship between the vigour of the vine, fruit shading and temperature, and the sensory properties of the wine. 2.2 Geomatics Geographic information systems (GIS) is an increasingly popular means of combining layers of data linked to specific locations. This layering can take many forms, and by processing multiple layers, derived data can be produced to predict, plan or model the system. The use of global positioning systems (GPS) is needed as an ancillary technology in order to locate specific sampling points in two or three dimensions. Surface maps can be created as a tool to interpolate between sample points. Rather than treating points as individuals in a sample mean, they are treated as distinct points on a surface grid. There are many spatial prediction models, which are appropriate for use with different types of data, and with different outputs. Spatial dependence, or spatial autocorrelation, means that the value of a variable at one point is not independent of the points nearest to it (Whelan et al. 2001; Almeida-Neto & Lewinsohn 2004). The final surface is represented by a two-dimensional XY grid, where each grid node has an associated Z value for a given variable. In assigning the value to each node, global predictors use the entire sample set, whereas local predictors use only the points closest to the node. Exact interpolators assign the actual value to a grid node when a sample point is at that node. Smoothing interpolators reduce the weighting of all nodes, such that the value of the node will not necessarily be the exact measurement value to reduce sudden peaks that may result from measurement anomalies or errors. There is no single correct gridding method for any data set. The method chosen must represent the extents of the data appropriately, and create maps that are of use for their intended purpose (Whelan et al. 2001). A short description of several common methods follows. 23
24 The modified Shepard's method can be used as either a local or global quadratic interpolator. It uses inverse distance weighting; points farther from the grid node are weighted less heavily than those closer to the node. It also uses a local nearest neighbour in order to smooth harsh peaks and valleys that may result from outlying data, giving it an advantage over regular inverse distance weighting (IDW) methods (Renka 1988). In practice, it can be made a smoothing interpolator with the inclusion of a smoothing factor to reduce to effect of small-scale measurement errors. Kriging is appropriate for large data sets. It can be implemented as global or local Kriging, which use the entire data set and a moving neighbourhood of points, respectively. Computationally, it follows a least squares distance weighted model, using a covariance function to estimate the variogram (Whelan et al. 2001). The variogram is a function that predicts the spatial dependence between points, and is itself a function of the distance between sample points, or lag, the error and the variation in the data set (Almeida-Neto & Lewinson 2004). An advantage to Kriging is that the use ofthe covariance function allows for a prediction of variance at each grid node, meaning that a map of Kriging variances can be drawn as a measure of confidence in the map of the variable of interest (Whelan et al. 2001). 2.3 Remote Sensing In broad terms, remote sensing is any form of observation in which there is no contact between the target and the observer. Optical remote sensing is a particular application in which reflected light is collected by a sensor. Different surfaces have unique spectral reflectance patterns; that is, they absorb, reflect or transmit light at different proportions of incident light in the ultraviolet, visible, and infrared spectra in a predictable way (Lillesand &K.iefer 2000). The spectral resolution of an imaging system refers to the number of wavebands that can be simultaneously recorded for an area (Hall et al. 2002). Multispectral imaging typically involves a small number of wavebands, between two and 10, that may cover a large range of wavelengths. Hyperspectral imaging typically involves a large number of wavebands, greater than 10 but potentially many more, with each waveband corresponding to a narrow range of wavelengths (Hall et al. 2002). The type of optical 24
25 sensor and corresponding spectral resolution is chosen with respect to how the data will be collected, the computing power available, and the type of sensors available for the desired application. In visualizing remotely sensed images, either a grayscale single band, or a threeband representative image is used. Since the actual wavebands may come from beyond the range of human vision, these three bands are limited to red, green and blue. The bands assigned to the three possible bands may be drawn from any of the available wavebands, and will be displayed in the representative colours. In this way, selecting the red, green and blue wavebands will result in a true-colour red-green-blue (RGB) image. A false-colour near-infrared (NIR) image (CIR) is created by assigning the NIR, red and green bands to red, green and blue, respectively. The more red a pixel appears in a CIR image, the higher the NIR and lower the red reflectance in that pixel. This is typically associated with dense, healthy vegetation (Lillesand & Kiefer 2000). A spectral index takes the information from more than one waveband, and reduces it to a single value. A large number of these indices have been developed for many different purposes, tied to specific multi- and hyperspectral wavebands. They may include compensation for atmospheric and soil affects, depending on the source of the radiometric data (Jackson & Huete 1991; Zarco-Tejada et al. 2005). Vegetation indices (VI) make particular use of the large differences between red, green and NIR wavebands that occur in plants (Hall et al. 2002). The classic VI is the Normalized Difference Vegetation Index (NDVI), defmed as the difference between the red and NIR wavebands, divided by their sum, shown in Equation 2.1. NDVI = NIR-RED NIR+RED Equation 2.1 NDVI was first proposed by Rouse et al. (1973) for monitoring pastureland vegetation on the American Plains. This VI gives a value between -1 and + 1, and is a common indicator of plant vigour, biomass or health, where values approaching +1 are indicative of a large volume of vegetation, and 0 typically represents a lack of vegetation. Negative values are not expected for natural surfaces, but may occur for man-made objects (Hall et al. 2002). Gitelson et al. (1996) proposed using the green waveband to 25
26 monitor vegetative growth, and found the NDVI-green to be more sensitive to chlorophyll content of leaves. This index is identical to the standard NDVI, but the red waveband is replaced by the green. Spatial resolution depends on the sensitivity of the detector as well as the distance between the detector and the surface of interest. These two factors will contribute to the total area ( or footprint) of the image, and the size of individual pixels. There are a number of commonly used satellite-based and aircraft-mounted imaging systems with a variety of available wavebands and spatial resolutions. IKONOS is a privately-operated multiband satellite imager with a resolution of 4m. Operated by the same corporation, GeoEye-l is a commercial multiband satellite with a resolution of 1.65m ( The AVHRR (Advanced Very High Resolution Radiometer), operated by the American government, is a multiband satellite imager with wavebands operating in the upper range of the visible spectrum, and full-infrared for cloud cover observations ( A VIRIS (Airborne Visible/Infrared Imaging Spectrometer) is an aircraft-mounted Hyperspectral imaging system covering visible and infrared wavebands operated by NASA ( a low resolution satellite-based system operated by NASA with 8 wavebands in the 15-60m spatial resolution range ( There are many other aircraft and satellite based systems available, and in addition to these systems specific applications can be custom developed to capture the desired spectral and spatial resolution required. Remote sensing has been used in both plant and non-plant fields of study. In the case of mineralogical and soil analysis, it has been used in identifying surface mineral deposits (Rast et al. 1991). It has also been used to predict soil albedo, a major factor in global climate models, relating to soil colour and moisture content (Post et al. 2000). It has been used to predict soil water content in prevention of drought stress in golf courses (Dettman-Kruse et al. 2008), and in non-irrigated cotton plantations (Ben-Dor & Levin 2000). Land-cover classification is commonly achieved using remote sensing data, typically covering a large ground area for planning and land management (Lillesand & 26
27 Kiefer 2000). It was this use for remote sensing that prompted the creation ofthe NDVI by Rouse et al. (1973). In agricultural applications, remote sensing has been used as a tool in mapping weed densities (reviewed by Lamb & Brown 2001). Water use and demand have been measured in areas of high irrigation use through the use of spectral indices and remote thermal sensing (Bastiaanssen et al. 2000). The consensus of these reviews is that remote sensing has been proven in multiple scenarios as a research tool, but is lacking in industrial applications without the high cost of skilled personnel, control of image capture dates and image resolution (Lamb & Brown 2001; Bastiaanssen et al. 2000). In viticultural applications, remote sensing has been used in modeling vegetative growth, and to infer grape composition from those measurements. Wildman et al. (1983) used colour infrared film to capture aerial images of a California vineyard to monitor the spread of the phylloxera louse. They used a qualitative assessment of pictures to identify changes in canopy density, verified by field scouting. The use of digital, CIR images was introduced by Johnson et al. (1996), who found relationships between the NDVI extracted from the CIR images and the vegetative growth of the vines. In this case, vegetative growth was influenced most by two factors, the incidence of phylloxera, and the moisture holding capacity ofthe soil (Johnson et al. 1996). Again in California, Johnson et al. (2001) used remotely sensed spectral data to delineate a vineyard site of Chardonnay into small-lot production zones. Using an aircraft-mounted, multi-band imager, a single airborne image was captured after leaf expansion but before veraison. The NDVItransform of this image was used to divide the site into vigour zones. They found that the vine size was related to the vigour zones, as identified by the airborne image. The vigour zones were also related to vine water status, and grape composition variables. Thus, indirectly, remote sensing was used to predict vineyard status and grape composition, with direct implications for wine quality (Johnson et al. 2001). The relationship between VI and vegetative growth, measured using dormant pruning weights, was further explored by Dobrowski et al. (2003). Using Cabernet Sauvignon grapes planted in California with five different between-vine spacing treatments, pruning weights were measured per metre of canopy across the treatment 27
28 vines. Multiband images with 1.0 and 0.5m spatial resolution were captured postveraison in two years, with ground-cover vegetation senescent or sprayed with herbicide prior to imaging. There was a strong, positive correlation between the extracted VI and the pruning weight in both years. Additionally, the relationship established in the first season was able to predict the pruning weights in the second study vintage (Dobrowski et al. 2003). Within season changes in shoot density and leaf area were compared to the change in NDVI by Johnson (2003). Leaf area index (LAI) was estimated on target vines, and multiband satellite images with 4m pixel size were captured four times through the growing season. There was a strong correlation between the LAI and the NDVI on each imaging date, and for the pooled data (Johnson 2003). Conversely, Hall et al. (2008) found that NDVI was more closely related to canopy planimetric area, the total two-dimensional area occupied by the vine as viewed from above, than with the LAI. The Australian Cabemet Sauvignon grapevines were unconstrained by training wires and were not hedged mid-season, resulting in a large degree of lateral growth into the inter-row space. There were three multispectral image capture dates during one growing season with a 25cm spatial resolution. They found that using the pooled data of the entire growing season, the planimetric area was more highly correlated to the LAI than was the NDVI. The high resolution (small pixel size) used in this study generated values ofndvi approaching 1, and composed almost entirely of vine area. They attributed this to a saturation of the LAI, which becomes non-linear at high density (Hall et al. 2008). Extensive use of computer-aided image classification for monitoring vineyard performance was first introduced by Hall et al. (2001; 2003). Using image processing software, the vineyard was masked to eliminate non-vine pixels. This step was possible by the pre-imaging application of herbicide to the inter-row groundcover, creating a distinct bimodal distribution of vine and non-vine pixels. They created the "Vinecrawler" algorithm, which automatically extracted NDVI values from all pixels, and mapped them in vectors according to the position of the vines in UTM (Universal Transverse Mercator) and vine-row spacing co-ordinates (Hall et al. 2001; 2003). The high spatial resolution, 25cm, and the clearing of inter-row vegetation made their algorithm possible for the 28
29 extraction of extremely detailed information about canopy architecture and biomass density. The ability of remote sensing to be used to directly predict grape composition variables was explored by Lamb et al. (2004). This Australian study focused on the colour and total phenolics in Cabemet Sauvignon grapes in an irrigated, clean cultivated vineyard. Multispectral images were captured using an aircraft mounted imager with 60cm pixel size, three times through the growing season in each of two vintages. They found that re-sampling the image to a final pixel size approximately the same as the distance between rows to integrate vine size and density information into a single pixel resulted in the strongest correlations to total phenolics and colour. They also reported that the strongest correlations (most negative) between NDVI and total phenolics or colour occurred around the time of vera is on (Lamb et al. 2004). In the Languedoc region of France, Acevedo-Opazo et al. (2008) performed a study on remotely sensed VI, vine water status, and grape composition on a number of winegrape varieties in non-irrigated vineyards. Three multispectral images were captured with a 1m spatial resolution. They found temporally stable relationships between zones delineated based on NDVI and vegetative growth, vine water status, and yield. These zones were also consistent with soil type. However, the zones based on NDVI were not different for most grape composition metrics. They concluded that a combination of remotely sensed data with intimate vineyard knowledge, especially of the soil, is needed to predict grape composition and ultimately wine quality (Acevedo-Opazo et al. 2008). The use ofndvi has been researched from ground-based imaging systems. Still technically remote sensing, as there is no contact between the sensor and the vines, a vehicle-mounted sensor is driven up and down the rows of the target vineyard. GPS is used to track the location ofndvi measurements, and maps can be created of the vineyard. Drissi et al. (2009) evaluated one such system, the GreenSeeker, in Merlot vineyards in the Bordeaux region of France. They found correlations between the NDVI measured by a ground sensor and the LAI, and relations to the vine vegetative growth; however, areas of very high vigour saturated both the LAI and the NDVI, and differentiation was not possible (Drissi et al. 2009). 29
30 Overall, remote sensing has been proven as a tool for monitoring vineyard vegetative growth, and for making inferences into grape composition from the spectral measurements. 2.4 Precision Agriculture The basis of precision agriculture (P A) is that inputs to farming practices are tied to specific outputs through a feedback-loop based system (Bramley et al. 2001). On a commercial scale P A involves the collection of data on any number of specific metrics of interest, as well as ancillary data. Then the interpretation and analysis of those data in order to identify trends, and implementation of a management plan to accommodate or change those trends. Finally, this is repeated with collection of data to observe the effect of management changes (Bramley et al. 2001). Targeting agricultural inputs will, ideally, optimize production to goals of yield or quality, while reducing operational costs and waste. Functionally, precision viticulture (PV) has the same goals and feedback-loop structure with the specific application to grapevines. Grapegrowers have traditionally accepted the variability within vineyards as inherent to the underlying qualities of the site itself, the terroir. With many years of experience, vineyard areas have been subdivided into individually rated vineyards of higher or lower quality, the Burgundy region of France is considered by some to be the pinnacle of this process. In New World wine regions, there have not been generations of trial and error that led to vineyard designations, and for some growers, volume of grapes rather than quality may be the motivating factor for growing. This idea may be unromantic, but has its place in the economy of grape and wine production. A low-cost bulk grape should be fairly uniform, with minimal input costs. The emergence of geomatics software has allowed grape growers to geographically link information from their vineyards into the PV feedback loop, and target inputs to specific regions of their vineyards. Remote sensing and geomatics tools have been used successfully in grape production in New World regions including California (Johnson et al. 2001), Australia (Hall et al. 2003; Lamb et al. 2004), and Chile (Acevedo-Opazo 2008) as well as Old World regions such as Spain (Zarco-Tejada et al. 2001). 30
31 A spatial database of a vineyard may include natural factors such as soil type, topography or climate trends, as well as horticultural factors such as clone, rootstock and planting information, in addition to cultural practices including fertilizers, irrigation, pesticide spray scheduling and canopy management (Smith & Whigham 1999). The geocoding of these layers of information allows a single query to provide information about location over time or at a particular moment, as well as the spatial distributions of patterns in a vineyard. The level of detail in these databases is necessarily a trade-off between the time required to take samples, and the feasibility of adjusting the required inputs (Smith & Whigham 1999). For example, it is possible to record information about every vine, but it would require extensive data collection, and it is not currently feasible to adjust a sprayer to apply the desired treatment to each vine. Spatial trends are a far more reasonable approach to observing vineyards and creating layers of information (Smith & Whigham 1999), which can be combined with aerial images, and linked to wine composition (Bramley et al. 2001). Understanding and taking advantage of the variability in vineyard soils is a key stage in using technology to help the New World understand its terroir. Nutrient application can have a high input cost and high environmental impact. Mapping the variability in soil nutrient content and vine uptake is a direct application ofpv. Davenport & Bramley (2007) measured soil nutrients and collected petiole samples in Australian Cabernet Sauvignon and Ruby Cabernet vineyards. Petiole samples were collected at flowering and at veraison in two vintages. The soil nutrients nitrogen, phosphorus, potassium, sulfur, manganese and zinc varied significantly within vineyard sites, and between sampling dates. Analysis by k-means clustering revealed that these nutrients showed trends in terms of both spatial and temporal variability; that is, the zones with higher concentrations of these nutrients tended to remain high over time, and areas of low concentration tended to remain low through the season and between.vintages (Davenport & Bramley 2007). By creating maps of these zones, a vineyard manager would be able to apply nutrients only in areas ofthe vineyard where they are needed. In order to take full advantage of targeted inputs, it must be understood if there is spatial and temporal stability in the target variable output. Bramley & Hamilton (2004) found that there was a 10-fold range of yields in Australian Cabernet Sauvignon, Merlot 31
32 and Ruby Cabemet vineyards in a single year. This range of yields was found over several vintages, while the relative values were different between years, the range was consistently large. The yield values, recorded with a yield monitor integrated into a mechanical harvester, were normalized and plotted using a Kriging technique. The maps from all vintages were then subjected to a k-means clustering, and zones of stable yield were identified. The zones were harvested into segregated bins by the mechanical harvester, and vinified separately. There was no clear relation between the yield zone and the chemical attributes of the wines in either year (Bramley & Hamilton 2004). Bramley (2005) investigated these same vineyard sites in terms of the variability in fruit composition. He found that some attributes, in particular the anthocyanins and phenolics, were highly variable within vineyards. Other metrics such as soluble solids and ph were far less variable, although the range of values did suggest implications for the composition of the fruit from the entire site if bulked together. The spatial distribution of the grape composition variations were roughly similar from year to year, and zones were discemable using a k-means clustering ofthe interpolated surfaces. For the study of variability in grape composition, fruit was sampled manually, as there was no commercial on-the-go sensor available at the time. The general spatial trends in grape composition were noted to be similar to those of the yield in the same vineyards, and Bramley (2005) suggested that until a sensor exists for rapid sampling in the vineyard, yield alone may be a viable, if not ideal, method for fruit segregation. Using remote sensing as a tool for PV creates an additional layer of information which can be gathered quickly and across the entire vineyard. Canopy area and density were described using 25cm spatial resolution images of Australian Cabemet Sauvignon in two years (Hall et al. 2010). The strength of the correlation to total anthocyanins, phenolics, and yield increased through the growing season, even after veraison. Soluble solids, on the other hand, did not correlate well to the canopy architecture descriptors. Sampling was performed on a subset of vines at the site, both from the aerial images and for berry composition analysis (Hall et al. 2010). Aerial imaging may be a possible solution to the lack of on-the-go sensor for grape composition; identifying zones of potential grape quality may reduce in-field sampling, and allow for differential harvesting. 32
33 2.5 Literature Cited Acevedo-Opazo, C., Tisseyre, B., Guillaume, S., Ojeda, H The potential of high spatial resolution information to define within-vineyard zones related to vine water status. Precision Agric.. 9: Almeida-Neto, M., Lewinsohn, T Small-scale spatial autocorrelation and the interpretation of relationships between phonological parameters. 1. Vegetation Sci. 15: Andres-de Prado, R, Yuste-Rojas, M., Sort, X., Andres-Lacueva, c., Torres, M., and Lamue1a Raventos, R Effect of soil type on wines produced from Vitis vinifera L. Cv. Grenache in commercial vineyards. J. Agric. Food Chern. 55: Bastiaanssen, W., Molden, D., Makin, I Remote sensing for irrigated agriculture: examples from research and possible applications. Agric. Water Mgt. 46: Ben-Dor, E., Levin, N Determination of surface reflectance from raw hyperspectral data without simultaneous ground measurements: a case study of the GER 63-channel sensor data acquired over Naan, Israel. International J. Remote Sensing 21 : Bergqvist, J., Dokoozlian, N., Ebisuda, N Sunlight exposure and temperature effects on berry growth and composition of Cabernet Sauvignon and Grenache in the Central San Joaquin Valley of California. Amer. J. Enol. Vitic. 52:1-7. Bramley, R, Proffitt, T., Hamilton, R, Shearer, J., Ormesher, D., Lamb, D., Taylor, J., Precision viticulture - principles, opportunities and applications. In Proceedings: 11 th Australian Wine Industry Technical Conference, Adelaide. Bramley, R, Hamilton, R Understanding variability in winegrape production systems 1. within vineyard variation in yield over several vintages. Austral. J. Grape & Wine Res. 10: Bramley, R, Understanding variability in winegrape production systems 2. within vineyard variation in quality of several vintages. Austral. 1. Grape & Wine Res. 11 : Chone, X., VanLeeuwen, C., DuBourdieu, D., Gaudillere, J Stem water potential is a sensitive indicator of grapevine water status. Ann. Bot. 87: Cortell, J., Kennedy, J Effect of shading on accumulation of flavonoid compounds in (Vitis vinifera L.) Pinot noir fruit and extraction in a model systern. J. Agric. Food Chern. 54: Cortell, J., Halb1eib, M., Gallagher, A., Righetti, T., Kennedy, J. 2007a. Influence of vine vigour on grape (Vitis vinifera L. cv. Pinot noir) anthocyanins. 1. Anthocyanin concentration and composition in fruit. J. Agric. Food Chern. 55: Cortell, J., Halbleib, M., Gallagher, A., Righetti, T., Kennedy, J. 2007b. Influence of vine vigour on grape (Vitis vinifera L. cv. Pinot noir) anthocyanins. 2. Anthocyanins and pigmented polymers in wine. J. Agric. Food Chern. 55:
34 Cortell, J., Siversten, H., Kennedy, J., Heymann, H Influence of vine vigour on Pinot noir fruit composition, wine chemical analysis, and wine sensory attributes. Amer. J. Enol. Vitic.59:1-1O. Davenport, 1., Bramley, R Spatial and temporal variability in wine grape nutrients. In Proceedings: Western Nutrient Management Conference, Salt Lake City, UT. 7: Dettman-Kruse, J., Christians, N., Chaplin, M Predicting soil water content through remote sensing of vegetative characteristics in a turfgrass system. Crop Sci. 48: Drissi, R., Goutouly, J., Forget, D., Gaudillere, J Nondestructive measurement of grapevine leaf area by ground normalized difference vegetation index. Agronomy J. 101: Dobrowski, S., Ustin, S., Wolpert, J Grapevine dormant pruning weight prediction using remotely sensed data. Austral. J. Grape & Wine Res.. 9: Gitelson,A., Kaufman, Y., Merzlyak, M Use ofa green channel in remote sensing of global vegetation from EOS-MODIS. Remote Sensing of Environment 58: Guinard, J., Cliff, M Descriptive analysis of Pi not noir wines from Cameros, Napa and Sonoma. Amer. 1. Enol. Vitic. 38: Hall, A., Lamb, D., Holzapfel, B., Louis, J Optical remote sensing applications in viticulture - a review. Austral. J. Grape & Wine Res. 8: Hall, A., Louis, J., Lamb, D A method for extracting detailed information from high resolution multispectral images of vineyards. In Proceedings of the 6 th International Conference on Geocomputation; University of Queensland, Brisbane. Hall, A., Louis, J., Lamb, D Characterising and mapping vineyard canopy using highspatial-resolution aerial multispectral images. Computers & Geosciences 29: Hall, A., Louis, J., Lamb, D Low-resolution remotely sensed images of winegrape vineyards map spatial variability in planimetric canopy area instead ofleaf area index. Austral. J. Grape & Wine Res. 14:9-17. Hall, A., Lamb, D., Holzapfel, B., Louis, J Within-season temporal variation in correlations between vineyard canopy and winegrape composition and yield. Precision Agric.. Published online 04 February Hardie, W., Conisidine, Response of grapes to water-deficit stress in particular stages of development. Amer. J. Enol. Vitic. 27: Hostetler, G., Merwin, I., Brown, M., Padilla-Zakour, O Influence ofundervine floor management on weed competition, vine nutrition, and yields of Pi not noir. Amer. J. Enol. Vitic.58: Jackson, R., Huete, A Interpreting vegetation indices. Prevent. Vet. Medicine 11:
35 Johnson, L., Lobitz, B., Annstrong, R, Baldy, R, Weber, E., DeBenedictis, J., Bosch, D Airborne imaging aids vineyard canopy evaluation. Calif. Agric.. 50: Johnson, L., Bosch, D., Williams, D., Lobitz, B Remote sensing of vineyard management zones: implications for wine quality. Appl. Engin. Agric.. 17: Johnson, L Temporal stability of an NDVI-LAI relationship in a Napa Valey vineyard. Austral. J. Grape & Wine Res. 9: Keller, M., Smithymann, R, Mills, L Interactive effects of deficit irrigation and crop load on Cabernet Sauvignon in an arid climate. Amer. J. Enol. Vitic. 59: Kennedy, J., Matthews, M., Waterhouse, A Effect of maturity and vine water status on grape skin and wine flavonoids. Amer. J. Enol. Vitic. 53: Koundouras, S., Marinos, V., Gkoulioti, A, Kosteridis, Y., Van Leeuwen, C Influence of vineyard location and vine water status on fruit maturation of nonirrigated cv. Agiorgitiko (Vitis vinifera L.). Effects on wine phenolic and aroma components. J. Agric. Food Chern. 54: Kriedemann, P., Smart, R Effects of irradiance, temperature and leaf water potential on photosynthesis of vine leaves. Photosynthetica 5:6-15. Lamb, D., Brown, R Remote sensing and mapping of weeds in crops. J. Agric. Engin. Resources. 78: Lamb, D., Weedon, M., Bramley, R Using remote sensing to predict grape phenolics at harvest in a Cabemet Sauvignon vineyard: timing observations against vine phenology and optimizing image resolution. Austral. J. Grape & Wine Res. 10: Lillesand, T., Kiefer, R Remote Sensing & Image Interpretation 4th Ed. John Wiley & Sons, Inc. Matthews, M., Ishii, R, Anderson, M., O'Mahony, M Dependence of wine sensory attributes on vine water status. J. Sci. Food & Agric.. 51: Moriat, R, Jacquet, A Grapevine root system and soil characteristics in a vineyard maintained long-term with or without interrow sward. Amer. J. Enol. Vitic. 54: 1-7. Post, D., Fimbres, A, Matthias, A, Sano, E., Accioly, L., Batchily, A, Ferreira, L Predicting soil albedo from soil colour and spectral reflectance data. Soil Sci. Soc. Amer. J.64: Rast, M., Hook, S., Elvidge, c., Alley, R An evaluation of techniques for the extraction of mineral absorption features from high spectral resolution remote sensing data. Photogrammetric Engineering & Remote Sensing. 57: Renka, R Multivariate interpolation of large sets of scattered data. ACM Transactions on Math. Software. 14:
36 Reynolds, A., Price, S., Wardle, D., Watson, B Fruit environment and crop level effects on Pinot noir. 1. vine perfonnance and fruit composition in British Columbia. Amer. J. Enol. Vitic. 45: Reynolds, A., Lowrey, W., Tomek, L., Hakimi, J., desavigny, C. 2007a. Influence of irrigation on vine perfonnance, fruit composition, and wine quality of Chardonnay in a cool, humid climate. Amer. J. Enol. Vitic. 58: Reynolds, A., Senchuk, I., vanderreest, C., desavigny, C. 2007b. Use ofgps and GIS for elucidation of the basis for terroir: spatial variation in an Ontario Riesling vineyard. Amer.1. Enol. Vitic. 58: Rouse, J., Haas, R, Schell, J., Deering, D Monitoring vegetation systems in the Great Plains with ERTS. In Third ERTS Symposium, NASA SP-351 I, Seguin, G "Terroirs" and pedology of wine growing. Experientia. 42: Shaw, T The Niagara Peninsula viticultural area: a climatic analysis of Canada's largest wine region. J. Wine Res. 16: Sivilotti, P., Bonetto, C., Paladin, M., Peterlunger, E Effect of soil moisture availability on Merlot: from leaf water potential to grape composition. Amer. J. Enol. Vitic. 56:9-18. Smith, L., Whigham, P Spatial aspects of vineyard management and wine grape production. In Proceedings: The 11 th Annual Colloquium of the Spatial Information Research Centre, Dunedin. Spayd, S., Tarara, 1., Mee, D., Ferguson, J Separation of sunlight and temperature effects on the composition of Vi tis vinifera cv. Merlot berries. Amer. 1. Enol. Vitic. 53: Sweet, R, Schreiner, R Alleyway cover crops have little influence on Pinot noir grapevines (Vitis vinifera L.) in two Western Oregon vineyards. Amer. J. Enol. Vitic. 61: Van Leeuwen, C., Seguin, G The concept of terroir in viticulture. 1. Wine Res. 17: Whelan, B., McBratney, A., Minasny, B Vesper - spatial prediction software for precision agriculture. In Grenier, G., & Blackmore, S., eds, ECPA 2001, Proceedings ofthe 3rd European Conference on Precision Agriculture, Montpellier, France Wildman, W., Nagaoka, R, Lider, L Monitoring spread of grape phylloxera by colour infrared aerial photography and ground investigation. Amer. J. Enol. Vitic. 34: Zarco-Tejada, P., Berjon, A., Lopez-Lozano, R, Miller, 1., Martin, P., Cachorro, V., Gonzalez, M., defrutos, A Assessing vineyard condition with hyperspectral indices: leaf and canopy reflectance simulation in a row-structured discontinuous canopy. Remote Sensing of Environment. 99:
37 3.0 Spatial Variability in Vineyards: The Use of Geomatics and Implications for Precision Viticulture 3.1 Introduction In Old World wine growing regions, the effects that create differences between vineyards have been collectively referred to as terroir (Van Leeuwen & Seguin 2006). This idea can be applied to any product with characteristics that are unique to its region of origin, but is perhaps most renowned for its long history associated with wine appellations of origin. There are many factors understood to be part ofterroir, and these have been subject to research around the winegrowing world. The regional climate, and the sitespecific microclimate, the soil pedology or texture, soil nutrient content and uptake by the vine, and the underlying geology ofa region all playa role in defining terroir (Van Leeuwen & Seguin 2006; Andres-de Prado et al. 2007). In the New World, especially in younger regions such as the Niagara Peninsula in Ontario, consumers are left to be the judge of a wine's value. The degree of variation within New World regions cannot be over-estimated. In Niagara, Ontario there is a wide range of soil parent material, slope & aspect, distance from the moderating influence of Lake Ontario and associated mesoclimate conditions (Shaw 2005). The soils are predominantly Halton clay over Queenston shale and lacustrine sandy loam, with high water holding capacity. The Niagara Escarpment, the most prominent geological feature in the area, has exposed dolomite limestone cliffs with gentler slopes covered with silty and clay loams. These areas experience far better drainage, and are almost entirely northfacing (Shaw 2005). This variation, the relatively young age of the grape-growing industry, and the lack of a strict appellation of origin system means that growers and wineries are left to find and adapt new tools for understanding and managing their vineyards. As living plants, grapevines require water, which they draw primarily from the soil. Generally, when water loss from transpiration exceeds the available water, governed by solar radiation, temperature and relative humidity, physiological stress occurs (Hardie & Considine 1976). Water stress may result in reduced fruit set (Hardie & Considine 37
38 1976), reduced yield (Hardie & Considine 1976), increased sugar accumulation and break-down of malic acid (Koundouras et al. 2006), increased concentrations of anthocyanins and total grape phenolics (Koundouras et al. 2006; Sivilotti et al. 2005), and generally desirable grape composition and wine sensory attributes (Reynolds et al. 2007b; Matthews et al. 1990). The increasing use of irrigation in many New World vineyards necessitates the need to understand how the application of water, or withholding water from vines, will change the growth habits of the vine and the composition of the fruit. Conversely, where irrigation is not used, the water status of the vines may be manipulated through other cultural practices, but will ultimately be affected by variations in the soil with consequences for the composition ofthe fruit (Acevdeo-Opazo et al. 2008). Variable water status within a vineyard is itself a component of the terroir of that site. There is ongoing disagreement in literature as to the effect of water stress on grapevine physiology and resulting wine characteristics and quality. These disagreements may arise from other factors influencing the vine growth, ultimately included in a broad definition of terroir. The basic premise of precision agriculture (P A) is that inputs to farming practices are in response to information gathered with the intent of affecting outputs through an information feedback-loop system (Bramley et al. 2001). When applied as precision viticulture (PV), there is a focus on understanding the spatial and temporal variability in the production of wine grapes (Hall et al. 2003). Grapegrowers have traditionally accepted the variability within vineyards as inherent to the underlying qualities of the site itself, the terroir. With many years of experience, vineyard areas have been subdivided into individually rated vineyards of higher or lower quality. The emergence of geomatics software has allowed grape growers to geographically link information from their vineyards into the P A feedback loop, and target inputs to specific regions of their vineyards. PV has been used successfully for grape production in New World regions including California (Johnson et al. 2001), Australia (Hall et al. 2003; Lamb et al. 2004), and Chile (Acevedo-Opazo 2008) as well as Old World regions such as Spain (Zarco-Tejada et al. 2001). One purpose of this study was to validate the use of PV in building understanding terroir in a New World growing region. Four individual commercial vineyards planted to 38
39 Vilis vinifera L. cv. Pinot noir in the Four Mile Creek and st. David's Bench subappellations, Niagara Region, Canada were the study locations. It was hypothesized that vine water status would be related to yield components and berry composition. In particular, soluble solids, ph, titratable acidity, total anthocyanins, total phenolic compounds, colour intensity and hue would be affected by the water status of the vine. These effects will also be apparent in the must and wine chemical composition of the wines made from fruit in delineated water status zones. 3.2 Materials & Methods Vineyard Sites & Sentinel Vines Four commercial vineyard sites planted to Vitis vinifera L. cv. Pinot noir were identified for inclusion in this study in These sites were at Coyote's Run Estate Winery and Five Rows Craft Wine of Lowrey Vineyards, in the St. David's, Ontario area. Two of the sites were in the "Red Paw Vineyard," and one in the "Black Paw Vineyard" at Coyote's Run in the Four Mile Creek sub-appellation. The fourth site was at Five Rows Craft Wine of Lowrey Vineyards, in the St. David's Bench sub-appellation. For the purpose of this study, the vineyard sites were named "Red Paw 1," "Red Paw 2," "Black Paw," and "Lowrey's." Red Paw 1 was 0.66 ha (1.62 acres), planted in 1997/1998 with Dijon clones 115, 777 and an unknown third clone on S04 rootstock with rows oriented east-west. Vine spacing was 1.2 m and rows were spaced 2.4 m. Red Paw 2 was 0.79 ha (1.95 acres), planted in 1997/1998 with Dijon clone 115 on S04 rootstock with rows oriented northsouth. Vine spacing was the same as Red Paw 1. Both of the Red Paw Vineyard blocks had tile under-drainage in every other row. Black Paw was 0.41 ha (1.02 acres), planted in 1998 with Dijon clone 115 and two additional unknown clones on S04 rootstock with rows oriented north-south. Vine spacing was the same as Red Paw blocks. Drainage tile was installed in every other row in spring of 2009 to the Black Paw Vineyard. Red and Black Paw Vineyards were managed uniformly bya third party service hired by the winery, and were not irrigated. Protective bird netting was installed in both 2008 and 2009 after veraison. Lowrey's was 2.45 acres (0.99 ha), planted in 1987 (the five easternmost rows), 1992 (the next seven rows), and 1997 (the eight western rows), Dijon 39
40 clone 115 on S04 rootstock with rows oriented north-south. Vine spacing was 1.2 m and rows were spaced 2.4 m. Under-drainage tile was in every other row, and permanent bird netting was in place, bunched at the top wire of the trellis with shoots positioned through the netting in both 2008 and All vines were cane-pruned, and trained using vertical shoot positioning. At each vineyard site, sentinel vines were identified evenly distributed throughout the vineyard. The panel at either end of the row, and rows at the edge of vineyard were not used for sentinel vines. A single sentinel vine was in every other panel in every other row, except at Lowrey's where sentinel vines were in every third row. There were 84 sentinel vines in Red Paw 1 (52 per acre), 90 sentinel vines in Red Paw 2 (46 per acre), 52 sentinel vines in Black Paw (51 per acre), and 91 sentinel vines in Lowrey's (37 per acre). Of these, one in five sentinel vines were marked as a water status vine such that this sub-set of vines was distributed throughout the vineyard block. These vines were subsequently monitored for 'P. There were 18 in Red Paw 1 (11 per acre), 18 in Red Paw 2 (nine per acre), 11 in Black Paw (11 per acre) and 19 in Lowrey's (eight per acre). In total, there were 317 sentinel vines and 66 water status vines. Sampling strategy maps can be seen overlaid onto images of the vineyards in Figure 3-1 for the Red Paw vineyards, Figure 3-2a for the Black Paw vineyard and Figure 3-2b for Lowrey's vineyard. With the exception of harvest and pruning, all regular operations were carried out on the sentinel vines by the vineyard crews. This included but was not limited to pesticide applications, mid-season hedging and leaf-pulling, soil tilling, mowing and clusterthinning as deemed necessary by the vineyard managers. In general, clusters were thinned to one cluster per shoot at veraison, and extensive leaf removal in the fruiting zone was performed just before or after veraison. Sentinel vines were geolocated on 29 & 30 May 2008 using a Trimble GeoXT Handheld GPS, running Trimble TerraSync software (Version 2.53; Trimble Navigation Ltd., Sunnyvale, CA), with approximately 8.6m accuracy. Post-collection differential correction was performed using GPS Pathfinder Office (Version 3.10; Trimble Navigation Ltd., Sunnyvale, CA) to sub-metre accuracy using the Port Weller, Ontario base station correction. Final accuracy was in the range of30-50cm. The map projection 40
41 used was in Universal Transverse Mercator (UTM) coordinates, Zone 17N with the 1927 North America Datum Soil Sampling Soil samples were collected at each water status vine on May Samples were taken to the north of the trunk of the vine (west in the case of Red Paw 1). The ground was first leveled to roughly the same height as the inter-row space, with loose surface soil removed. A single gauge auger (Eijke1kanip Agrisearch Equipment BV, Giesbeek, NL) was vertically driven to a final depth of75 cm, the entire core was homogenized and shipped to Agri-Food Labs (Guelph, ON) for analysis of soil ph, buffer ph (when ph<6.8), organic matter (OM, %), phosphorus (ppm), potassium (ppm), magnesium (ppm), calcium (ppm), cation exchange capacity (CEC, meq/loog), and texture (% silt, sand, clay) using standard procedures Soil Moisture Vineyard soil moisture was measured by time domain reflectometry (TOR) using the Field Scout TOR 300 Soil Moisture Meter (Spectrum Technologies, Plainfield, IL). The volumetric water content mode was used, with the high clay setting for soils with more than 40% clay content. A pair of 20-cm stainless steel probes was installed for measurements at all sentinel vines. Measurements were made bi-weeklyin both 2008 and In 2008, seven sets of measurements were collected on 19 June, 2 July, 14 July, 31 July, 12 August, 27 August and 8 September. In 2009, six sets of measurements were collected on 8 July, 20 July, 5 August, 19 August, 3 September and 17 September. In each case, where possible there were at least 24 hours between the last rainfall event and data collection. Before inserting the probes, the surface soil around the base of the sentinel vine was brushed away to be level with the inter-row space. The probes were inserted vertically into the soil with care to keep the probes parallel. The first two measurements were taken on opposite sides of the trunk, within 30 cm of the vine. If the two measurements were different by more than 10% of the reading, then a third measurement was taken at roughly the midpoint between the first two measurements. The two or three measurements were averaged for a single value at each vine for that date. 41
42 3.2.4 Vine Water Status Vine water status was measured using midday 'P by the pressure chamber, or pressure bomb, technique (Soil Moisture Equipment Corp., Santa Barbara, CA) of Turner (1988). Measurements were made only at the water status vines, on the same days as the soil moisture measurements (see section above). Measurements were taken between the hours of 1000hr and 1400hr, roughly centred on solar noon under full sun. To minimize the time between removal of a leaf from the vine and measurement, the pressure bomb and gas cylinder were carried to each vine. A fully expanded leaf from a primary shoot that was fully exposed to the sun was removed from the vine. The petiole was immediately sliced with a razor blade transverse to the length of the petiole, and inserted through the lid of the pressure bomb with the cut end exposed. Nitrogen gas was used to slowly pressurize the chamber at a constant rate until sap began to flow out of the cut end of the petiole. The pressure in the canister at this moment was recorded. A second leaf, from another part of the canopy was treated in the same way. If the two pressures were more than 1.5 bar apart (approximately 15% of the reading), then a third leaf was sampled. Vine water status zones were delineated based on the seasonal mean of all pressure bomb measurements. Using the mapping techniques described in section (Spatial Mapping), the maps of'p were created for each block, and divided into zones. In 2008, the Red Paw and Black Paw vineyards were divided into high and low water status, and Lowrey's was divided into high, medium and low water status. In 2009, all four vineyards were divided into high and low water status. Since the range of values was not the same in each vineyard, a different threshold value was used to divide each of the sites. The threshold value was arbitrarily chosen near the middle of the range, without respect to actual vine water stress response at that value such that the number of vines in each zone was roughly equal. These divisions can be seen in Figure 3-3, Figure 3-4, Figure 3-5 and Figure 3-6 for Red Paw 1 & 2, Black Paw, and Lowrey's Vineyards, respectively. The consequence of the division and range of water status values observed is discussed below. 42
43 3.2.5 Vine Size Vine size was measured using donnant pruning weights. Timing of pruning, and number of buds per cane was detennined by the winery/grower. In the 2008 season, Lowrey's vineyard was pruned on 14 December 2008 and the Red Paw & Black Paw vineyards were pruned on 17 February In the 2009 season, Lowrey's vineyard was pruned on 15 December The Red Paw and Black Paw vineyards were pruned by the winery's commercial crew in early February 2010, before the sentinel vines could be pruned. In both years, Lowrey's vineyard was pruned to two canes, 10 to 12 buds each. In the 2008 season, the Red Paw and Black Paw vineyard blocks were prui:ted to 3 canes, buds each. The current season's growth was bundled and weighed in-situ using a Rapala scale (Model RSDS-50; Rapala). Attempting to replace the weight of cane pruning measurement at Coyote's Run in the 2009 season, a pair of alternate metrics was evaluated. The mean internode length on the remaining canes was measured using the length of the cane from the first to last node, and the diameter of the canes between the first and second bud was measured using digital calipers. To validate this method, measurements were taken at Lowrey's vineyard in April A standard least squares regression was perfonned, using both cane diameter and internode length as model effects. There was not a strong correlation between internode length and cane diameter against pruning shoot weight. The resulting model can be seen in the supplemental materials in Figure 7-1, the r was 0.28, and these alternate measurements were not accepted as a replacement for weight of cane pruning as a measure of vine size or vigour. Consequently, vine size was not evaluated for the three Coyote's Run vineyard sites for Harvest Harvest dates were at the discretion of the vineyard managers or winemakers. In 2008, Lowrey's vineyard was harvested on 16 September, Red Paw 1 & 2 on 29 September, and Black Paw on 30 September. In 2009, Red Paw 1 was harvest,ed first on 1 October, Lowrey's on 5 October, and Red Paw 2 & Black Paw on 6 October. All of the fruit from the sentinel vines was collected, the number of clusters per vine counted, and 43
44 the fruit from each vine weighed using a portable field scale. Mean cluster weight was calculated from this data. Fruit to be kept for winemaking was bulked by water status zone as described above. In 2008, the severe incidence of rot in the fruit necessitated extensive sorting of the fruit to reject excessive break-down. The fruit from the Black Paw vineyard was so severely affected by rot that sorting was not possible, and all fruit was accepted. In 2009, the disease pressure was much lower, and fruit sorting was not necessary for any of the vineyards Winemaking Fruit from all of the sentinel vines in each water status zone was crushed and destemmed in the teaching & research winery at the Cool Climate Oenology & Viticulture Institute (CCOVI) at Brock University into a large plastic bin. The must was mixed thoroughly, and distributed into four 20-L plastic buckets so that they contained 16kg each. 50 mgll SOz in the form of potassium metabisulfite (KMS) was added with mixing. The musts were left at 4 C for approximately 40 hours, before being allowed to warm to room temperature. Must samples of 250 ml were taken just before inoculation. The musts were inoculated with Saccharomyces cerevisiae strain RC212 (Lallemand Inc., Montreal, QC) at 0.30 gil (30 gihl), and moved into a temperature controlled room set at 25 C. Caps were punched down two or three times a day, as time permitted, and fermentations were monitored daily by measuring temperature and soluble solids by Brix hydrometry. In 2008, the Black Paw vineyard fermentations were inoculated immediately after crushing and de stemming, because ofthe severely rotten state of the fruit. Otherwise all fermentations were handled identically in both 2008 and After each of the fermentations had reached dryness, the maceration period was extended by two days, with gentle mixing of the skins. The wines were pressed from the skins into 12L glass carboys using a water bladder press, up to a pressure of two bar for five minutes, with the addition of 25 mgil of SOz. The wines were settled for four days, and then racked into clean carboys. To initiate malo-lactic fermentation (MLF), the lactic acid bacteria Oenococcus oeni VP41 (Lallemand Inc., Montreal, QC), was added at O.OlgIL. The wines were left at 23 C for two weeks, with regular protection under COz 44
45 gas, and evaluations by smell and taste. Completion of MLF was verified by thin layer chromatography following the protocols of nand et al. (2004). Wines were racked, with the addition of 50 mgll S02, and moved to a -2 C freezer for cold stabilization. After five weeks, wines were racked from the precipitated tartaric acid with another addition of 20 mgil S02. Wine samples were taken after cold stabilization. The fourth fermentation replicate from each group was used as a top-up wine for the other three fermentations, resulting in three fermentation replicates for each water status zone. In 2008, there was only a single fermentation for each of the water status zones in the Black Paw vineyard. Copper fming trials were conducted as per nand et al. (2004) to reduce the presence of reductive aromas in the wines, and 0.5mglL cif+ was added to the wines. They were racked a final time at bottling with the addition of S02 to bring each batch of wine to 45 mg/l free S02. In 2008, wines were filtered through a IJ1ll pre-filter and a 0.45 /lm fmal filter (Pall Corp., Port Washington, NY), bottled under nitrogen gas, and closed with natural cork wines were filtered and bottled in June They were then moved to the wine cellar at CCOVI for storage. The 2009 wines were prefiltered through three 0.5-/lm pad filters in March 2010 with the addition of30 mgll S02. Red Paw 1 and Black Paw wines were filtered through a 0.45-/lm membrane filter (Pall Corp., Port Washington, NY) and bottled, until the filter cartridge became clogged and lost integrity. The remaining wines were filtered a second time through three 0.5-/lm pad filters and bottled. All wines were bottled under nitrogen gas, and closed with natural cork. They were then moved for storage in the wine cellar at CCOVI Weather Data Weather data for both growing seasons was provided by Weather IN ovations Incorporated. In 2008 the nearest weather station was in Virgil, Ontario, and st. David's, Ontario in This station was installed in spring of 2009 and was the closest station to the sample vineyards at roughly 1.5km ~ Daily precipitation, maximum and minimum temperatures, relative humidity, leaf wetness, solar radiation, and wind speed and direction are recorded by the stations. Weather INovations Incorporated then compiled an annual report of the growing season describing general trends. 45
46 3.2.9 Berry, Must & Wine Composition Sample Preparation At harvest, a randomly distributed 100-berry sample was taken from each sentinel vine, placed in labelled sample bags, and frozen at -25 C until further analysis. The berry sample was weighed to determine the mean berry weight, and then placed in a 250mL beaker in a water bath at SO C for one hour to dissolve all precipitated tartaric. acid. The samples were allowed to cool, and then homogenized in a commercial juicer (Model 500; Omega Products, Harrisburg, P A). After settling, juice was decanted from the top layer of foam. Must and wine samples were treated in the same way as the berry samples after juicing. This included all centrifuging, freezing and thawing leading to measurements of soluble solids, ph, TA, colour/hue, total phenolic compounds and total anthocyanins Soluble Solids, ph, Titratable Acidity Soluble solids were measured in Brix using an Abbe benchtop refractometer (Model 10450; American Optical, Buffalo, NY). Berry ph was measured using an Accumet phlion meter and VWR SympHony electrode. Juice samples (:::= 35mL) were clarified by centrifugation at 4500g for 10 minutes to remove large particles using an IEC Centra CL2 benchtop centrifuge (International Equipment Co., Needham Heights, MA). The remainder ofthe juice (:::= 2OmL) was placed in plastic snap-top vials and returned to the -25 C freezer for colour analysis at a later date. Titratable acidity (TA) was measured on 5.0mL of the centrifuged juice, titrated to an endpoint of ph S.2 with O.lN NaOH using a PC-Titrate autotitrator (Model PC ; Man-Tech Associates, Guelph, ON) Colour/Bue, Total Anthocyanins, Total Phenolic Compounds The re-frozen samples were heated at SO C for 30 minutes, centrifuged at 10,000g at 4 C in an IEC refrigerated centrifuge (Model B-20; International Equipment Co., Needham Heights, MA) and then re-frozen. Samples were heated at SO C for 30 minutes a fmal time before analysis of colour/hue, total phenolic compounds and total anthocyanins. 46
47 Colour and hue were measured using a modification of the method reported by Mazza et al. (1999). In 2008, samples were loaded directly into a Imm pathlength quartz cuvette. Samples were darker in 2009, and so they were diluted 1:10 in 9mL of ph 3.5 buffer (O.IM citric acid and 0.2M Na2HP04), and mixed by vortexing. They were allowed to sit in the dark for one hour to equilibrate, and poured into a 10mm pathlength plastic cuvette. In both years, absorbance at 420nm and 520nm was measured using a UV -VIS spectrophotometer (Model Ultrospec 2100 pro; GE Healthcare Life Sciences, Fairfield, CT). Colour intensity was calculated as ~2o+As20, and hue (tint) as ~2o/As20. Total anthocyanins were quantified using the ph shift method of Fuleki & Francis (1968). Samples were diluted 1:10 in 9mL of ph 1.0 buffer (O.2M KCI and 0.2M HCI) and ph 4.5 buffer (1M NaOH and 1M HCI), and mixed by vortexing. The samples were allowed to sit in the dark for one hour to equilibrate. In a 10mm pathlength plastic cuvette, absorbance at 520nm was measured using a UV -VIS spectrophotometer. A standard curve was generated using six concentrations of malvidin-3-0-glucoside. Total anthocyanins were given by (AS20, phl.o-as20, ph4.5)/o.0042, in mgll malvidin equivalents. Total phenolic compounds were quantified using the Folin-Ciocalteu method (Slinkard & Singleton, 1977). Waterhouse (2001) developed a method with scaled-down volumes, reducing the volume of reagents required and the volume of waste produced. A calibration curve was created with each set of samples evaluated. The calibration curve was made with a stock solution of gallic acid (0.5g gallic acid in IOmL of ethanol, brought to a volume of 100mL with water for a final concentration of 5000mglL). The gallic acid concentrations in the standard curve were 0,50, 100, 150,250 and 500mglL. Samples were diluted 1: loin 9mL of distilled water in test tubes, and mixed by vortexing. 20J.lL of each sample or standard was pipetted into a IOmm pathlength plastic cuvette, to which 1.58mL of water was added. 100J.lL of the Folin-Ciocalteu reagent (VWR Scientific) was added to each cuvette, followed by mixing. After 30 seconds but no longer than 8 minutes, 300J.lL of20% sodium carbonate (anhydrous NaC0 3 ) was added to the cuvettes with mixing. Solutions were left in the dark for 2 hours at room temperature. Absorbance at 765nm was measured using the UV-VIS spectrophotometer. Total phenolic compounds were determined from the standard curve, corrected for the dilution in water, and expressed in mgll gallic acid equivalents (GAE). 47
48 Ethanol Ethanol content of the wines was measured using gas chromatography (GC). Wines samples were diluted, 50J..lI of wine in 1.95mL 1 % I-butanol. A standard curve was prepared using eight standards (1 %,5%, 10%, 12%, 14%, 16%, 18%,20% ethanol). All standards and samples were prepared in duplicate, and 1.0J..lL was injected twice by an Agilent autosampler. The GC unit used was an Agilent 6890 series running ChemStation software with Agilent J&W column (Agilent, Santa Clara, CA) of dimensions 30.0m x 250J..lm interior diameter x 0.25J..lm film thickness. Auto-integration of peaks of minimum width was used to find the ethanol to internal standard ratio, and ethanol content was determined from the standard curve. The carrier gas was helium, with total flow 242.7mLlmin and the split flow 237.5mLlmin at a carrier gas pressure of psi. Inlet and detector temperatures were 225 C, initial oven temperature was 60 C at time zero. Initial time was 0.00, equilibration time 0.50 minutes, post temperature was 60 C, post time was 0.50 minutes, and run time was 5.07 minutes. Temperature profile was as follows: Ramp Rate cac/min) Final Temperature cac) Final Time (off) Reverse-phase HPLC Quantification of Phenolic Compounds Reverse-phase HPLC was used to quantify individual anthocyanins and other phenolic compounds in the wines using the method of Them-Gomez et al. (2002) with flow rate modified to 1.0mL/min and a maximum pressure of 300 bar. Wines were filtered through 0.22J..lm Millipore membrane filters (Millipore Corp., Billerica, MA) before injection. A Hewlett-Packard model 1100 HPLC (Palo Alto, CA) equipped with autos ampler, diode array detector and Zorbax SB-CI8 column, 4.6x50mm, 3.5J..lm particle size (Agilent, Santa Clara, CA) at 30 C. Detector wavelengths were 280nm for quantification offlavanol-3 polyphenolics (catechin, epicatechin) and gallic acid, 320nm for cinnamic acids (caffeic acid, p-coumaric acid) and trans-resveratrol, 365nm for flavonols (quercetin), and 525 nm for anthocyanins. 48
49 Mobile phase solvents were all HPLC grade: Mobile A was 0.2% trifluoroacetic acid (TF A) in MilliQ water, and Mobile B was 0.2% TF A in acetonitrile (Caledon, Georgetown, ON). Gradient elution profile was as follows, with a linear gradient between timepoints: initial 5% B to 35% B at minute 15, 100% B at minute 16, 100% B maintained to minute 25, and 5% B at minute 26 with 10 minutes post-run at 5% B. Sample injections were 10J.1L with needle wash between samples. A computer running ChemStation (Version A.07.01; HP/Agilent) software was used for chromatographic analysis Spatial Mapping All field and berry sample measurements were tied to specific vines, and so geographic information systems (GIS) software was used to map the variables onto a two-dimensional surface. Parameters were mapped using Surfer (Version 8.05, Golden Software Inc., Golden, CO). Data were gridded using the modified Shepard's method. The modified Shepard's method was made a smoothing interpolator with the inclusion of a 0.2 smoothing factor. Variation was assumed to be isotropic, and a round search radius was used for gridding. The grid line geometry was determined independently for each site. X and Y direction maximum and minimum values were extended by several metres to create a rectangular frame around the vineyard block without any sentinel vine touching the edge of the grid. The larger direction was assigned 100 lines by default, and in the other direction the number of lines was assigned to keep the grid blocks as close to square as possible. The sizes of the grids were (X and Y, in metres): Red Paw 1, 1.82x1.96; Red Paw 2, 1.31x1.43; Black Paw, 2.20x2.01; and Lowrey'S, 1.74x1.85. Since grid node values were determined by the surrounding nodes, those at the extents of the maps were often assigned unreasonable values. A blanking file was created for each vineyard to isolate the actual sentinel vines within the larger vineyard map and eliminate the extreme values. Where unreasonable values occurred inside the vineyard block (such as a negative value for the yield), grid math was used to replace these values (in the case of yield, negative nodes were replaced with zeros). The extents of the colour 49
50 scale were adjusted for each map, and this must be considered when comparing maps of the same variable between vineyards or across vintages Data Analysis Gross variation of yield components, grape composition and vineyard variables was described using the methods of Bramley (2005). The median and coefficient of variation (CV) were calculated to express the distribution of the data points. Within a single vintage, the range (maximum and minimum values) can be used to express the variation of a variable within a vineyard. Bramley (2005) proposed the variable spread as a normalized value that can be used to compare variation across variables and vintages. The spread is defined as the range divided by the median, expressed as a percent, and acts as an indicator of the degree of variation in the parameter in a way that is potentially more valuable to a winery. Analysis of variance (ANOVA) was performed on the data collected at each vineyard site individually, for each vintage. Sentinel vines were grouped first by water status zone, and then by vigour status zone. Data were submitted to the PROC GLM in SAS (Version 9.1.3; SAS Institute, Cary, NC), with means separation by the LSD (0.=0.1). Pearson's correlation matrices were generated between all variables using PROC CORR for each vineyard individually as well as for all sentinel vines. Principal component analysis (PCA) was performed on the mean values grouped by water status zone for all vineyard sites using JMP (Version 8.0.1; SAS Institute, Cary, NC). Monthly rainfall data was compared to the long-term monthly mean from 1971 to 2000 collected by Environment Canada at the St. Catharines Airport weather station. The daily rainfall events were plotted for 2008 and 2009 along with dates of data collection for visual comparison of rainfall events and intensity in both years, and to compare phenological development between years. 50
51 3.3 Results & Discussion Vineyard Variability Within Vineyard Differences The within-vineyard gross variability of yield components, berry composition, and vineyard soil variables including soil moisture and 'P are given in supplemental materials, Table 7-1, Table 7-2, Table 7-3, and Table 7-4 for Red Paw 1, Red Paw 2, Black Paw, and Lowrey's vineyards, respectively. In all four vineyards, in both years, the berry ph had the smallest coefficient of variation and spread followed by hue and soluble solids. These three berry composition measurements had the least gross variability within each vineyard site. The crop load, vine size and total yield per vine had the highest degree of gross variation within each vineyard site. Total anthocyanins and total phenols had high coefficients of variation and spread, although not the highest. It is notable that for these two berry composition metrics, there was more variability in 2008 than in 2009 at all four vineyards. In terms of soil variables, while the texture of the soil at each site is dominantly clay, it is the sand component that is the most variable. With the exception of Red Paw 1, where the clay content had the lowest coefficient of variation and spread, the other three sites were least variable in soil ph. There was a great deal of variation in most grape composition and vine growth metrics in both vintages at all four vineyards. In grape composition, total anthocyanins, phenols and colour intensity were the most variable within each of the four vineyard sites within each vintage. Bramley (2005) found similar results, with anthocyanins and phenols being the most variable of grape composition metrics, anthocyanins having CV values from %. In this study the CV for anthocyanins ranged from %. In order to attempt to normalize the degree of variability for each metric, Bramley (2005) developed the "spread," as described above. This parameter conveys more information to a winemaker, as it indicates the magnitude of variability that can be compared across metrics, or vintages. Variables with the highest CV were also the variables with the highest spread, the advantage being that the variability is normalized for ease of companson. 51
52 A winemaker would most likely desire the fruit being delivered to their winery to be of a consistent, and high, quality, and the spread is a potential tool to convey how successfully a vineyard site has achieved this (Bramley 2005). In yield components, the total yield per vine was the most variable, while berry size was the least variable. Yield per vine varied by five-fold at the lowest in Black Paw in 2009 (Table 7-3), to over 20-fold in Lowrey's vineyard in 2008 (Table 7-4). Bramley & Hamilton (2004) also found a great deal of variation in yield, up to 10-fold variation in a single vineyard. ANOV A and means separation were performed on the water status zones within each block. These tests were performed separately for each site, such that the means of the same variable were not compared between vineyard sites. With sentinel vines grouped by water status zone, tables of means of yield components for all four sites in both years are shown in Table 3-1; means of soil moisture, 'I' and shoot weight are shown in Table 3-2; berry composition means are shown in Table 3-3 and Table 3-4; soil analysis variables are shown in Table 3-5. With sentinel vines grouped by vigour zone, tables of means of yield components for all four sites in both years are shown in Table 7-5; means of soil moisture, 'I' and vine size Table 7-6; berry composition means are shown in Table 7-7 and Table 7-8; soil analysis variables are shown in Table 7-9. As the 2009 data was incomplete, and as wine was made from water status zonings but not vine size, these tables were included in the supplemental materials. Mean separation was performed using the least significant difference (LSD) test. The alpha value was increased from the typical 0.05 to 0.1 in order to identify trends after it was noted that there were no differences where p:s0.05. Note that in the tables, a single asterisk denotes p:so.l. The division by water status zone was verified by the means of 'I' for each site, with p:so.oooi in both years (Table 3-2). There were no other variables for which there were differences between water status zones at all four sites, in either vintage. In 2008 cluster size, berry TA and colour intensity were different between water status zones in three of the four vineyards; however, for each of these metrics, the direction of the trend was not the same for all three vineyards. The low water status zone has the higher TA in the Black Paw vineyard, but it was the high water status zone with the higher TA in Red 52
53 Paw 2 and Lowrey's vineyards (Table 3-3). In 2009, there were never more than two of the four vineyards with differences between water status zones. The division by vigour status zone was verified by the means of dormant pruning weight for each site, with p,::::o.oooi for all sites in 2008 and at Lowrey's in 2009 (Table 7-6). There were no other variables for which there were differences between vigour zones at all four sites in Berry size and percent sand were different between vigour status zones in three of the four vineyards (Table 7-5 and Table 7-9). In berry size, the trend was the same in each of those three vineyards, with the high vigour status zone having the larger berries. In 2008, vines with higher vigour resulted in larger berries, but the same was not true in The trend was not consistent for all three vineyards in terms of sand. In 2009 vigour zones, there were differences for all yield components, berry TA, colour intensity, soil clay and sand, and organic matter, but this was only observed at Lowrey's vineyard Must &Wine Analysis Wines were made by water status zone in both years. The means of wine chemical attributes from all four vineyard sites in both years are shown in Table 3-6 and Table 3-7. Means of must composition chemical attributes are shown in Table 3-8 and Table 3-9. Means of individual anthocyanin concentrations for wines from all four vineyard sites in both years are shown in Table Means of concentrations of individual flavonol-3 phenolic compounds for wines from all four vineyard sites in both years are shown in Table 3-11, and means of concentrations of non-flavonoid phenolic compounds and stilbene (trans-resveratrol) for wines from all four vineyard sites in both years are shown in Table There were no chemical attributes in the musts or the wines, in either vintage, with differences between the water status zones for all four vineyards. In fact there were never more than two of the vineyards with differences between water status zones for any attribute. The same was true for individual anthocyanins and other phenolic compounds. Differences between the must soluble solids in Red Paw 1 and Lowrey's vineyards did not translate to differences in wine ethanol content, although in general, the water status group with the higher soluble solids concentration became the wine with the 53
54 higher ethanol content, as would be expected (Table 3-8 and Table 3-6). Also as expected, the concentration of anthocyanins and phenols was much higher in the wines than in the musts, as these compounds were extracted over time with increased temperatures and increasing ethanol content during fermentations (Cortell et al. 2007b). The lack of differences between the chemical attributes of the musts and wines emphasizes that there was not a great difference between water status zones in the vineyard. Reverse-phase HPLC was used to quantify the concentration of individual anthocyanins, flavonol-3 phenolics (catechin, epicatechin, quercetin) non-flavonoid phenolics (gallic acid, caffeic acid, p-coumaric acid), and trans-resveratrol in the wines. There were no differences in the concentrations of any of the compounds in all four vineyards. There were differences in Red Paw 2 wines for delphinidin and petunidin in both years, and peonidin, malvidin, caffeic acid and trans-resveratrol for 2008 (Table 3-10). Red Paw 1 high and low water status wines were different for catechin and quercetin in 2008 (Table 3-11). Wines from the Lowrey's vineyard were significantly different in delphinidin, peonidin and trans-resveratrol in 2008 (Table 3-10 and Table 3-12). Black Paw wines were significantly different in gallic acid and trans-resveratrol in 2009 (Table 3-12). All differences in individual anthocyanins were oriented intuitively, with the low water status wines having the higher concentration of the anthocyanins as was found by Koundouras et al. (2006). This same trend was not present in wines from all vineyard sites, and conclusions cannot be drawn about the influence of water status on the concentration of individual phenolic compounds~ Typical for V. vinifera, malvidin represented the largest proportion of anthocyanins, followed by peonidin, petunidin, delphinidin and cyanidin (Fong et al 1971). In general, the concentrations of all anthocyanins were higher in 2009 than in Trans-resveratrol concentrations were higher in 2009 than in 2008, in some cases by more than double, with the exception of Red Paw 2 wines where the low water status wines were higher in Goldberg et al. (1995) found relatively high concentrations of trans-resveratrol in Pinot noir wines, regardless of their region of origin. They concluded that generally, cool and humid climates tend to produce wines with higher trans-resveratrol concentrations. In Ontario wines, they found a mean of3.16±1.34 mgll 54
55 (Goldberg et al. 1995), the mean concentration oftrans-resveratrol in wines for this study was 2.29mg/L, within one standard deviation of the mean observed by Goldberg et al Correlations between Variables Pearson's correlation coefficients between yield components, berry composition, vine size, and soil metrics for the pooled data from all vineyards are shown in the supplemental materials in Table 7-10 for 2008 and Table 7-11 for These tables have been colour-coded, such that cells highlighted in yellow, blue and red represent a p value ~ ,0.01, and 0.05 respectively. In large spatial datasets, it is not uncommon to consider correlation coefficients as low as 0.5 or 004 to be of note so long as the p value is small enough to give confidence in the correlation (Reynolds et al. 2007b). These correlations are not referred to as strong, but are worth noting. There were strong correlations between yield components; yield against number of clusters (2008: r=0.89, 2009: r=0.88; p~o.oool in both years) and moderate correlations to cluster size (2008: r=0.65, 2009; 0.57; p~o.oool, both years). In 2008, yield was also marginally correlated with anthocyanins (r=-0049; p~o.oool) and colour (r=-0.51; p~o.oool). Increasing yield had the effect of decreased ripening in the grapes. In 2008, berry size was best correlated with berry ph (r=0.39; p~o.oooi), berry TA (r=0.31; p.:so.0001), and mean soil moisture (r=-0047; p~o.oool). In 2009, berry size was best correlated with colour and hue (r=-0.30; p.:so.0001, and r=0.35; p.:so.oool respectively), soil clay content and silt content (r=-0043; p.:so.01, and r=0.37; p~o.ol respectively). Weight of cane prunings was best correlated with berry ph (r=-0.30, p.:so.ooo I), total anthocyanins (r=-0.34; p.:so.0001), and mean 'P (r=0046; p~o.ol) in Cane pruning weight was measured only atthe Lowrey's vineyard site in 2009, and was not included in the analysis. In 2008, mean 'P was correlated with berry ph (r=-0048; p~o.oooi), soluble solids (r=-0043; p~o.oi), weight of cane prunings, total berry anthocyanins (r=-0.65; p~o.oool), colour (r=-0.58; p.:so.oool), soil clay content (r=-0043; p.:so.ol), and sand content (r=0047; p.:so.oool). In 2009, mean 'P was marginally correlated with hue (r=0.32; p.:so.01), soil clay content (r=-0047; p~o.oool), and sand content (r=0.52; p~o.oool). There was a relationship between the vine water status and 55
56 the ripening of the grapes; as 'I' became more negative, the grapes accumulated more sugars and anthocyanins, as was seen by Sivilotti et ai., (2005) for anthocyanins but not soluble solids. This occurred in soils with more clay and less sand. Mean soil moisture in 2008 was correlated with berry size (r=-0.47; p:::,o.oool), colour (r=0.44; p:::,o.oool), total berry phenols (r=0.41; p:::,o.oooi), soil clay content (r=0.67; p:::,o.oooi), silt content (r=-0.79; p:::,o.oooi), soil CEC (r=0.82; p:::,o.oooi), and soil ph (r=0.64; p:::,o.oooi). In 2009, mean soil moisture was moderately correlated with total berry anthocyanins (r=-0.51; p:::,o.oooi), soil clay content (r=0.69; p:::,o.oooi), silt content (r=-0.81; p:::,o.oooi), soil CEC (r=0.81; p:::,o.oooi), and soil ph (r=0.64; p:::,o.oooi). These correlations to mean soil moisture are not intuitive, one would not expect an increase in soil moisture to result in a decrease in berry size and increase in grape ripening, and anthocyanin concentration; however, it has been noted that not all vines will respond to excess or deficit irrigation in the same way, and past research has found conflicting results (Koundouras et ai. 2006). The soil moisture content was measured using soil bulk conductivity, and the presence of water did not necessarily translate to water that is available for the vines. The higher clay soils may have had higher volumetric water content, but the vines were not accessing it, and the higher sand soils were likely better drained, with less available water. Shoot weight was not highly correlated to any other variable, in disagreement with the findings of Cortell et al. (2008) Principal Component Analysis PCA of yield components, grape, composition and vineyard variables when grouped by water status zone as well as observation loadings are shown in Figure 3-7 for 2008 and Figure 3-8 for 2009 from all vineyard sites. All four vineyard sites from both vintages are shown in Figure 3-9. In Figure 3-7, the first two principal components explained 86.46% of the variation in the 2008 data. With the exception of T A, all variables were heavily loaded on these components. TA was not heavily loaded on either of the first two components, but was explained by PC3, with an eigenvalue of on that component. Vine vigour and mean 'I' were highly correlated with the sand content, and were inversely correlated 56
57 with berry soluble solids, T A, total anthocyanins, and berry ph. Yield was inversely correlated with clay, as well as total phenols and colour. The vineyard sites clustered in the observations plot with some difference between the water status zones, but the larger differences were between vineyards. Black Paw vineyard was heavily loaded with soil clay content and organic matter, and was the most different from the other three sites. Red Paw I and Red Paw 2 were similar to one another, without clear separation of the water status zones within the vineyards. The Lowrey's vineyard was loaded with mean '1', sand content and shoot weight. The mean 'I' was negatively correlated with soluble solids, berry ph and total anthocyanins. For 2009, Figure 3-8 shows the first two principal components explained 70.34% of the variation in the data. There were more variables which were not heavily loaded on PCI or PC2 compared to 2008, with eigenvalues in the range of 0.2 to 0.5. Yield and cluster size were inversely correlated to total anthocyanins, hue and soluble solids. Clay content and mean soil moisture were inversely correlated with mean '1', berry size and silt. In 2009, all four vineyard sites separated in the observation loadings plot. Black Paw was loaded with clay, CEC, and soil moisture. Red Paw 2 was loaded with total anthocyanins, hue and berry size. Red Paw I was loaded with sand, total phenols and TA. Lowrey's was not distinctly loaded with any variables, but was most closely loaded with yield and colour intensity. In 2009, there were far fewer strong correlations between variables overall In both years it was the soil type, especially the clay content that was a major factor in the soil moisture. Mean 'I' was moderately correlated with the soil clay content (r=-0.47; p<o.oooi), and sand content (r=0.52; p<o.oooi). Again, the soil type was a driver of the water status, and of the terroir, in agreement with Seguin (1986). The clay content was also marginally correlated with berry size (r=-0.43; p<o.oi), and silt was correlated with total anthocyanins (r=0.45; p<o.oi). Soil texture and water status were both observed to be factors in the variability in grape composition. As in 2008, Black Paw was very different from the other sites, and heavily loaded with soil clay content. In 2009, the two Red Paw vineyards were more distinct from one another, with Red Paw 2 being more heavily loaded with berry soluble solids, total 57
58 anthocyanins and hue. Red Paw 1 was loaded with total phenols and berry T A. The fruit from Red Paw I was harvested earlier than the other vineyards, as the winery harvested this block early as a part of a new sparkling wine program. The extra ripening time was the likely cause ofthis difference. Considering both vintages, the output of the PCA is seen in Figure 3-9. Grape composition variables (soluble solids, berry ph, total anthocyanins and phenols) were generally highly correlated to one another, and negatively correlated with yield and cluster size, mean '1', and soil sand content. The first two principal components explained 61.3% of the variation in the data. Total anthocyanins, phenols, soluble solids and berry ph were all well correlated. All ofthesemetrics were roughly inversely correlated with yield, cluster size, '1', and sand. Clay content and soil moisture were not well correlated with yield or berry composition metrics except for berry size, TA and colour. In both years, but especially true in 2008, it was a combination of vine water status and soil type that were driving the composition of the grapes at harvest. Soil moisture was not a strong indicator of vine water status, and vigour did not playa significant role in driving vineyard variability Weather It is important to note that the two years for this study were abnormal in several ways. Both years were cooler than average, and wetter than average. In contrast, 2007 was much hotter and drier than average, and vine water stress experienced in 2007 may have laid the foundation for vine performance in 2008 with more of an influence than the excess moisture in the following years. Figure 7-2 in the supplemental materials shows the incidence and intensity of rainfall events in relation to data collection dates for 2008 and Rainfall events were more frequent in 2008, but the overall precipitation was higher in Daily maximum temperatures were slightly above the long-term mean in 2008, but minimum temperatures were below average, with a net effect of lower average temperatures. The monthly rainfall in 2008 and 2009 at the St. Davids, Ontario weather station were compared to the Environment Canada long-term average (1971 to 2000) at 58
59 the nearby St Catharines airport, as seen in Table 7-12 in the supplemental materials. The monthly rainfall in June, July and August in 2008 and May, June, July, August and October in 2009 were higher than average. Additionally, there was an increase in disease pressure because of the elevated daily maximum temperatures combined with high precipitation. In particular, downy mildew and bunch rot were of great concern in Maximum and minimum daily temperatures were well below average in The lower frequency of rainfall events, and the lower temperatures mediated disease pressure, and in general it was observed that disease was less severe in 2009 as reported in the Weather INnovations Inc. growing season reports for 2008 and 2009 ( The effect of the wet weather was apparent in the 'I' measurements made in this study. In 2008 the most severe mean 'I' (most negative) value was -9.4 bar in the Black Paw vineyard, and in 2009 it was -9.5 bar in both Red Paw 1 and Lowrey's vineyards. The minimum mean 'I' (least negative) was -6.0 bar in 2008, and -5.9 bar in 2009, both in Lowrey's vineyard. Stomatal openings and consequently grapevine photosynthesis are generally not affected by water stress until the midday 'I' is less (more negative) than-5 bar (Hardie & Considine 1976). Even at their most negative values, the vines in this study were not subjected to more than mild water stress Geomatics Spatial analysis of vineyard variability was done with the aid of maps. Red Paw yield components and grape composition (yield per vine, cluster size, berry size, soluble solids, ph, TA) are shown in Figure 7-3. Grape composition (total anthocyanins, colour intensity, hue and total phenolic compounds), vine size, and soil moisture are shown in Figure 7-4. Red Paw 1 'I' and water status zone delineation for both vintages are shown in Figure 3-3 as discussed. Soil texture (clay, silt, sand), and soil composition (ph, organic matter, CEC) are shown in Figure 7-5. Similarly, Red Paw maps of yield components, grape composition, vine size and soil moisture are shown in Figure 7-6Error! Reference source not found. and Figure 7-7. Ordered in the same way, Figure 7-8 through Figure 7-12 show Red Paw 2 maps from both vintages; Figure
60 through Figure 7-17 show Black Paw maps from both vintages; and Figure 7-18 through Figure 7-22 show Lowrey's vineyard maps from both vintages. At all four vineyards, in both years, maps of yield and cluster size were similar. Across vintages, there were some trends that are present in both years and others that switched between higher and lower values. The yield per vine map of Red Paw 1 in 2008 (Figure 7-3) had a distinct band of higher yield, running north-east through the eastern half of the vineyard. This region was still there in 2009 (Figure 7-6), although the actual yields were lower overall. Within the same vintage, maps of berry composition variables were qualitatively similar. Berry soluble solids, ph and TA are intimately related in the ripening of grapes (Coombe 1992), and in Red Paw 2, seen in Figure 7-9-d, -e and -f, there were clear patterns of higher soluble solids corresponding with higher ph and lower T A respectively. Comparing the same variables in 2009, in Figure 7-12-d, -e and -f, there was some similarity between years, but also some differences. In ph, there was a region of higher ph in the eastern half ofthe site in both years. The western half of the vineyard had a lower concentration of soluble solids in 2008, but this was reversed in 2009, where the concentration was higher. Maps of total anthocyanins, colour, hue and phenols were very similar to one another within vineyard sites, within vintage. Figure 7-19 shows this for Lowrey's vineyard in 2008 and Figure 7-22 for Since colour is related to the concentration of anthocyanins, which are phenolic compounds, this relationship is to be expected. Between years, these spatial trends also appeared fairly stable; the western half of the vineyard, lower in anthocyanins in 2008 (Figure 7-19) and was lower again in 2009 (Figure 7-22). This spatial similarity in phenolics was not as obvious at the other vineyards. In general, the Black Paw maps were difficult to interpret as a result of the site geometry. It was very narrow compared to the length, complicating the surface interpolation process. Spatial variation in water status zones, the basis for site divisions in this study, was somewhat stable between vintages. Red Paw 1 had the most negative values in the western half of the site in both years, the branch extending east and north in 2009 (Figure 60
61 3-3b) cut through the same region as the low water status zone in 2008 (Figure 3-3a). In Red Paw 2, Error! Reference source not found.there was a zone of lower water status through the middle of the vineyard in both years, and these two maps were very similar (Figure 3-4). The Black Paw water status zones were roughly similar with the high water status zone running through the middle of vineyard from north to south (Figure 3-5). Lowrey's vineyard seemed as though it was the exception, but in 2008 there were three water status zones, whereas in 2009 there were only two. Ignoring the dividing line between zones, the lower water status zones were focused in the north end of the vineyard in each year (Figure 3-6). The soil texture of the vineyard, one of the other drivers of variability, also matched spatially with other variables. Figure 7-5a is a map ofthe clay content in Red Paw I, and the same patterns of high and low were present in the vine water status (Figure 3-3), yield components (Figure 7-3 and Figure 7-6Error! Reference source not found.), and to some extent, grape composition (Figure 7-4 and Figure 7-7). The band of approximately 40% clay running north-east through the vineyard is similar to the yield and berry size, total anthocyanins and soil moisture maps, although not a perfect overlay. This same general relationship between clay content and other variables was present in the other vineyards as well. Vine size, measured by weight of cane prunings, showed spatial distribution similar to other variables in Red Paw 2, even though there were not strong correlations between these variables. In Figure 7-ge, the map of2008 vine size measurements in 2008 had a region of higher shoot weight in the eastern half of the vineyard, where there was also higher soil moisture (Figure 7-9Error! Reference source not found.f), lower total anthocyanins (Figure 7-9a), and higher soluble solids (Figure 7-8d). This trend did not appear in the other vineyards. Figure 7-1ge shows the pruning weights from 2008 at the Lowrey's vineyard, with almost no similarity to the trends in the soil moisture (Figure 7-19f), and poor similarity to maps of total anthocyanins (Figure 7-19a) and soluble solids (Figure 7-18e). In 2009, this was the only vineyard with shoot weight measurements, mapped in Figure 7-22e, and again there was not a strong similarity to the maps of soil moisture (Figure 7-22f), total anthocyanins (Figure 7-22a) or any other grape composition metric. Cortell 61
62 et al. (2006) mapped vigour zones in Pinot noir vineyards, and anthocyanin distribution in those same vineyards (Cortell et al. 2007a), but did not compare these maps directly. They found a strong relationship between vine vigour and anthocyanin composition, and when comparing the two publications, there was a clear spatial relationship between the vigour zones and the production of anthocyanins that was not found in this study. Bramley (2005) found that there were stable and clear patterns in the zones of berry composition. These zones were related to the ones he identified in yield (Bramley & Hamilton 2004), but in contrast to this study, he found a particular similarity ofthe spatial variation in berry weight to the grape composition variables. Reynolds et al. (2007) found that there were not distinct year-to-year patterns in grape composition or vine performance. The similarity of the weather in 2008 and 2009, while a complicating factor for observing the effect of water status, may have been at least partially responsible for the stability in these trends. The correlations described in Section were generally not very strong, with r values greater than 0.4 discussed as a marginal or moderate correlations. This relatively low cut-off and the subjective nature of qualitatively describing spatial variation in maps mean that the spatial trends may not be as strong as suggested. Further years of study are recommended to gain a better appreciation of trends in spatial variation over time. 3.4 Conclusions All of the vineyard sites were observed to be highly variable, with anthocyanins and phenols being the most variable grape composition variables. Yield and weight of cane prunings were the two most variable attributes in all four vineyards. Using water status as the basis for within-vineyard division into production lots, this study did not find differences between the water status zones in terms of vigour, berry composition, or soil properties. Similarly, dividing the vineyards by vigour did not reveal differences in berry composition or soil properties. The wines made from the fruit in the water status zones were not significantly different in chemical attributes. In analysis using HPLC, individual anthocyanins and phenolic compounds were not significantly different between wines from the high and low water status zones. 62
63 The weather in 2008 and 2009 complicated this study; both years were wetter and cooler than average. This may have helped to stabilize some of the spatial trends in vineyard performance, but was also likely the principal factor in muting any effect of water status on the vines. There was some correlation between ' and berry composition, but was not proven to be a driving factor in the spatial distribution of variability. The wetter than average years meant that the range of water status values observed were very narrow, with very little difference between high and low water status zones. Vine vigour was also not seen to be a primary factor in driving vineyard variability, in the one year that data was collected at all sites, pruning weights did not correlate well to most other variables. Maps of shoot weights bore some similarity to other variables, but not always. Spatial trends of variability in grape composition, soil moisture and vine water status were observed to be generally stable from year to year. In addition, correlations between variables were confirmed in spatial distribution by qualitative comparison of maps, but these trends were not clear enough to draw any concrete conclusions. 63
64 3.5 Literature Cited Acevedo-Opazo, c., Tisseyre, B., Guillaume, S., Ojeda, H The potential of high spatial resolution infonnation to define within-vineyard zones related to vine water status. Precision Agric.. 9: Andres-de Prado, R., Yuste-Rojas, M., Sort, X., Andres-Lacueva, C., Torres, M., and Lamuela Raventos, R Effect of soil type on wines produced from Vitis vinifera L. Cv. Grenache in commercial vineyards. J. Agric. Food Chern. 55: Bramley, R., Proffitt, T., Hamilton, R., Shearer, J., Onnesher, D., Lamb, D., Taylor, J., 200l. Precision viticulture - principles, opportunities and applications. In Proceedings: 11 th Australian Wine Industry Technical Conference, Adelaide. Bramley, R., Hamilton, R Understanding variability in winegrape production systems 1. within vineyard variation in yield over several vintages. Austral. J. Grape & Wine Res. 10: Bramley, R., Understanding variability in winegrape production systems 2. within vineyard variation in quality of several vintages. Austral. J. Grape & Wine Res. 11 : Coombe, B Research on development and ripening of the grape berry. Amer. J. Enol. Vitic.43: Cortell, J., Kennedy, J Effect of shading on accumulation of flavonoid compounds in (Vitis vinifera L.) Pinot noir fruit and extraction in a model system. J. Agric. Food Chern. 54: Cortell, J., Halbleib, M., Gallagher, A, Righetti, T., Kennedy, J. 2007a. Influence of vine vigour on grape (Vitis vinifera L. cv. Pinot noir) anthocyanins. 1. Anthocyanin concentration and composition in fruit. J. Agric. Food Chern. 55: Cortell, J., Halbleib, M., Gallagher, A, Righetti, T., Kennedy, J. 2007b. Influence of vine vigour on grape (Vitis vinifera L. cv. Pinot noir) anthocyanins. 2. Anthocyanins and pigmented polymers in wine. J. Agric. Food Chern. 55: Cortell, J., Siversten, H., Kennedy, J., Heymann, H Influence of vine vigour on Pinot noir fruit composition, wine chemical analysis, and wine sensory attributes. Amer. J. Enol. Vitic. 59: Fong, R., Kepner, R., Webb, A Acetic-acid-acylated anthocyanin pigments in the grape skins ofa number of varieties of Vi tis vinifera. Amer. J. Enol. Vitic. 22: Fuleki, T., Francis, F Quantitative methods for anthocyanins. 2. determination of total anthocyanin and degradation index for cranberry juice. J. Food Sci. 3: Goldberg, D., Yan, J., Ng, E., Diamandis, E., Karumanchiri, A, Soleas, G., Waterhouse, A A global survey oftrans-resveratrol concentrations in commercial wines. Amer. J. Enol. Vitic.46:
65 Hall, A, Louis, J., Lamb, D Characterising and mapping vineyard canopy using highspatial-resolution aerial multispectral images. Computers & Geosciences 29: Hardie, W., Conisidine, J Response of grapes to water-deficit stress in particular stages of development. Amer. J. Enol. Vitic. 27: Them-Gomez, M., Andres-Lacueva, c., Lamuela-Reventos, R, Waterhouse, A Rapid HPLC analysis of phenolic compounds in red wines. Amer. J. Enol. Vitic. 53: nand, P., Edward, G., Wilkes, E., Bruer, N Chemical Analysis of Grapes & Wine: Techniques 1 8t Ed. Winetitles Pub. Johnson, L., Bosch, D., Williams, D., Lobitz, B Remote sensing of vineyard management zones: implications for wine quality. AppL Engin. Agric.. 17: Koundouras, S., Marinos, V., Gkoulioti, A, Kosteridis, Y., Van Leeuwen, C Influence of vineyard location and vine water status on fruit maturation of nonirrigated cv. Agiorgitiko (Vitis vinifera L.). Effects on wine phenolic and aroma components. J. Agric. Food Chern. 54: Lamb, D., Weedon, M., Bramley, R Using remote sensing to predict grape phenolics at harvest in a Cabemet Sauvignon vineyard: timing observations against vine phenology and optimizing image resolution. Austral. J. Grape & Wine Res. 10: Matthews, M., Ishii, R, Anderson, M., O'Mahony, M Dependence of wine sensory attributes on vine water status. J. Sci. Food & Agric.. 51: Mazza, G., Fukumoto, L., Delaquis, P., Girard, B., Ewert, B Anthocyanins, phenolics, and colour of Cabemet Franc, Merlot and Pinot noir wines from British Columbia. J. Agric. Food Chern. 47: Morlat, R, Jacquet, A Grapevine root system and soil characteristics in a vineyard maintained long-term with or without interrow sward. Amer. J. Enol. Vitic. 54:1-7. Parr, W., Green, J., White, K., Sherlock, R The distinctive flavour of New Zealand Sauvignon Blanc: sensory characterization by wine professionals. Food Qual. Pref. 18: Pickering, G., Simunkova, K., DiBattista, D Intensity of taste and astringency sensations elicited by red wines is associated with sensitivity to PROP (6-n-propylthiouracil). Food Qual. Pref. 15: Post, D., Fimbres, A, Matthias, A, Sano, E., Accioly, L., Batchily, A, Ferreira, L Predicting soil albedo from soil colour and spectral reflectance data. Soil Sci. Soc. Amer. J.64: Rast, M., Hook, S., Elvidge, C., Alley, R An evaluation oftechniques for the extraction of mineral absorption features from high spectral resolution remote sensing data. Photogrammetric Engineering & Remote Sensing. 57:
66 Renka, R Multivariate interpolation of large sets of scattered data. ACM Transactions on Math. Software. 14: Reynolds, A., Price, S., Wardle, D., Watson, R Fruit environment and crop level effects on Pinot noir. 1. vine performance and fruit composition in British Columbia. Amer. J. Enol. Vitic. 45: Reynolds, A., Yerle, S., Watson, R, Price, S., Wardle, D Fruit environment and crop level effects on Pinot noir. 3. composition and descriptive analysis of Oregon & British Columbia wines. Amer. J. Enol. Vitic. 47: Reynolds, A., Lowrey, W., Tomek, L., Hakimi, J., desavigny, C Influence of irrigation on vine performance, fruit composition, and wine quality of Chardonnay in a cool, humid climate. Amer. 1. Enol. Vitic. 58: Reynolds, A., Senchuk, 1., vanderreest, c., desavigny, C. 2007b. Use ofgps and GIS for elucidation of the basis for terroir: spatial variation in an Ontario Riesling vineyard. Amer. J. Enol. Vitic. 58: Shaw, T The Niagara Peninsula viticultural area: a climatic analysis of Canada's largest wine region. J. Wine Res. 16: Sivilotti, P., Bonetto, C., Paladin, M., Peterlunger, E Effect of soil moisture availability on Merlot: from leaf water potential to grape composition. Amer. 1. Enol. Vitic. 56:9-18. Slinkard, K., Singleton, V Total phenol analysis: automation and comparison with manual methods. Amer. J. Enol. Vitic. 28: Turner, N Measurement of plant water status by the pressure chamber technique. Irrig. Sci. 9: Van Leeuwen, C., Seguin, G The concept ofterroir in viticulture. J. Wine Res. 17:1-10. Waterhouse, A Determination of total phenolics. In Current Protocols in Food Analytical Chemistry, , Wrolstad, RE. Zarco-Tejada, P., BeIjon, A., Lopez-Lozano, R, Miller, J., Martin, P., Cachorro, V., Gonzalez, M., defrutos, A Assessing vineyard condition with hyperspectral indices: leaf and canopy reflectance simulation in a row-structured discontinuous canopy. Remote Sensing of Environment. 99:
67 Table 3-1: Means of yield components grouped by water status zone within each site at four Pinot noir vineyards, st. Davids, ON, Water Status Category Yield (kg) No. of clusters Cluster weight (g) Berry weight (g) Red Paw Low 3.08a 2.74a a 112.5a High 2.65b 2.22b b 102.3b Significancea * *** ns ** ** ns ns ns Red Paw 2 Low b a High a b Significance ns ns ns ns * ns ns ** Black Paw Low High Significance ns ns ns ns ns ns ns ns Lowrey's Low a 106.4a Medium 2.39 b b 1.45 High b 94.4b Significance ns ns ns ns *** **** ns ns amean separation at 0.=0.1 using the LSD test *, **, ***, ****, ns: Significant atp:s.,.o.l, 0.05, 0.01, 0.001,. not significant, respectively bin 2009, Lowrey's vineyard was divided into two water status zones. 67
68 Table 3-2: Means of vineyard water status and vine size grouped by water status zone within each site at four Pinot noir vineyards, st. Davids, ON, Water Status Weight of cane Soil moisture (%) 'P (bar) Category prunings (kg) Red Paw c Low b -8.3b -8.7b 0.40 High a -7.5a -7.6a 0.39 Significance a ns * **** **** ns Red Paw 2 Low b -8.2b 0.32 High a -7.3a 0.30 Significance ns ns **** **** ns Black Paw Low b -9.1b 0.33 High a -8.4a 0.32 Significance ns ns **** **** ns Lowrey's Low 24.0a c -8.0b b Medium 23.6a b -7.3b 0.59 High 21.7b a -7.0a a Significance ** ns **** **** ns ** amean separation at 0.=0.1 using the LSD test *, **, ***, ****, ns: Significant at p:s..o.l, 0.05, 0.01, 0.001, not significant, respectively hin 2009, Lowrey's vineyard was divided into two water status zones. cin 2009, Lowrey's vineyard was the only site where pruning shoot weights were measured. 68
69 Table 3-3: Means of berry composition (soluble solids, TA, and ph) grouped by water status zone within each site at four Pinot noir vineyards, St. Davids, ON, Water Status Category Berry Brix Berry T A (gil) Berry ph Red Paw Low a High b Significance a ns ns ns * ns ns Red Paw 2 Low b b High a a Significance ns ns * ns ns **** Black Paw Low a 8.0a 3.59b 3.58 High b 7.5b 3.61a 3.59 Significance ns ns * * * ns Lowrey's Low b Medium 20.3 b 8.3b 3.48 High a Significance ns ns * ns ns ns amean separation at a=o.1 using the LSD test *, **, ***, ****, ns: Significant at p< 0.1,0.05,0.01,0.001, not significant, respectively bin 2009, Lowrey's vineyard was divided into two water status zones. 69
70 Table 3-4: Means of berry composition (total anthocyanins, colour intensity, hue, and total phenols) grouped by water status zone within each site at four Pinot noir vineyards, St. Davids, ON, Water Status Category Total anthocyanins (mg/l) Colour (au) Hue (au) Total phenols (mg/l) Red Paw Low b High a Significance a ns ns * ns ns ns ns ns Red Paw 2 Low 297.9a 367.5b 10.6a a High 272.1b 393.3a 10.0b b Significance ** *** * ns ns ns ns **** Black Paw Low High Significance ns ns ns ns ns ns ns ns Lowrey's Low 250.5a a Medium 229.0b b 9.5b High 209.0c c Significance *** ns *** ns ns ns ns ns amean separation at a=o.l using the LSD test *, **, ***, ****, ns: Significant at p:::,.o.l, 0.05, 0.01, 0.001, not significant, respectively bin 2009, Lowrey's vineyard was divided into two water status zones. 70
71 Table 3-5: Means of soil variables grouped by water status zones from four Pinot noir vineyard sites, St. Davids, ON, Water Status Category Clay{%) Silt (%) Sand (%) OM (%) CEC (meq/100g) Soil ph Red Paw Low b b b 5.8 High a a a 5.8 Significance a ns ns ns ns ns ns * ns * ns * ns Red Paw 2 Low b High a Significance ns ns ns ns ns ns ns ns ns ns ns * Black Paw Low a a High b b Significance ns ns ns ns ns ns ns * ns * ns ns Lowrey's Low 44.2a 43.9a b a 30.0a 28.4a Medium 40.6ab b b 6.6 High 37.1b 38.2b a b 23.5b 24.5b Significance ** ** ns ns ns ** ns ** ** * ns ns amean separation at 0.=0.1 using the LSD test *, **, ***, ****, ns: Significant at p~o.i, 0.05, 0.01, 0.001, not significant, respectively. bin 2009, Lowrey's vineyard was divided into two water status zones. 71
72 Table 3-6: Means of wine, grouped by water status zone within each site, chemical attributes; TA, ph, and ethanol (%) at four Pinot noir vineyards, St. Davids, ON, Wine WineTA{g/L) Wine ph Wine ethanol (%) Red Paw Low a High b Significance a ns ns ** ns ns ns Red Paw 2 Low a High b Significance ns * ns ns ns ns Black Paw Low b : High a Significance c ** ns ns Lowrey's Low a Medium 4.6 b High b Significance ns ns ns **** ns ns RMean separation at a=o.1 using the LSD test *, **, ***, ****, ns: Significant at p:::..o.l, 0.05, 0.01, 0.001, not significant, respectively bin 2009, Lowrey's vineyard was divided into two water status zones. "Black Paw wines in 2008 were not made in replicate; values shown are for the single fermentation 72
73 Table 3-7: Means of wine, grouped by water status zone within each site, chemical attributes; total anthocyanins, colour intensity, hue, and total phenols at four Pinot noir vineyards, St. Davids, ON, Total Wine anthocyanins Colour (au) Hue (au) Total phenols (mg/l) {mg/l} Red Paw Low a 0.4a High b O.4b Significance a ns ns * ** ns ns ns ns Red Paw 2 Low a a High b b Significance ns ns ns ** ns ns **** ns Black Paw Low a High b Significance c ns ns ns * Lowrey's Low b Medium b a High b Significance ns ns ns ns * ns ns ns amean separation at a=o.l using the LSD test *, **, ***, ****, ns: Significant at p:s..o.l, 0.05, 0.01, 0.001, not significant, respectively bin 2009, Lowrey's vineyard was divided into two water status zones. cblack Paw wines in 2008 were not made in replicate; values shown are for the single fermentation. 73
74 Table 3-8: Means of must, grouped by water status zone within each site, chemical attributes; TA, ph, and soluble solids at four Pinot noir vineyards, St. Davids, ON, Must Must Brix Must T A (gil) Must ph Red Paw 1 200B B B 2009 Low 19.4b 21.0a a High 19.Ba 20.Bb B.59 B.91b Significance a ** * ns * ns ns Red Paw 2 Low B7 7.B a High b Significance ns ns ns ns ns *** Black Paw Low B High B Significance c ns ns ns Lowrey's Low 19.5a ab B b 3.42 Medium 1B.9c b 6.34b 3.49a High 19.0b a b 3.42 Significance **** ** * ns ** ns amean separation at 0;=0.1 using the LSD test *, **, ***, ****, ns: Significant at p:::s..o.l, 0.05, 0.01, 0.001, not significant, respectively bin 2009, Lowrey's vineyard was divided into two water status zones. cblack Paw wines in 2008 were not made in replicate; values shown are for the single fermentation. 74
75 Table 3-9: Means of must, grouped by water status zone within each site, chemical attributes; total anthocyanins, colour intensity, hue, and total phenols at four Pinot noir vineyards, St. Davids, ON, Must Total Total phenols anthocyanins Colour (au) Hue (au) (mg/l) (mg/l) Red Paw Low a a a High b b b Significance a ns ** ns ** ns ns ns ** Red Paw 2 Low a High b Significance ns ns ns * ns ns ns ns Black Paw Low High Significance c ns ns ns ns Lowrey's Low Medium 84.7 b High Significance ns ns ns ns ns ns ns ns amean separation at (1=0.1 using the LSD test *, **, ***, ****, ns: Significant at ps..0.1, 0.05, 0.01, 0.001, not significant, respectively bin 2009, Lowrey's vineyard was divided into two water status zones. cblack Paw wines in 2008 were not made in replicate; values shown are for the single fermentation. 75
76 Table 3-10: Mean of individual anthocyanin concentrations in wines, grouped by water status zone within each site, at four Pinot noir vineyards, St. Davids, ON, Wine Delphinidin c Cyanidin Petunidin Peonidin Malvidin (mg/l) (mg/l) (mg/l) (mg/l) (mg/l) Red Paw Low High Significance a ns ns ns ns ns ns ns ns ns ns Red Paw 2 Low 2.90a 4.29a a 6.49a 8.51a 9.82a 88.48a High 2.31b 3.81b b 5.82b 7.10b 9.02b 75.87b Significance * * ns ns ** * * ns * ns Black Paw Low High Significance d ns ns ns ns ns Lowrey's Low a a Medium 3.13 b 0.34b b High b b Significance ns ns * ns ns ns * ns ns ns ameans separation at a=0.05 using the LSD test *, **, ***, ns: Significant at p~0.05, 0.01, 0.001, not significant, respectively bin 2009, Lowrey's vineyard was divided into two water status zones. c3-0-glucosides of individual anthocyanins ~lack Paw wines in 2008 were not made in replicate; values shown are for the single fermentation. 76
77 Table 3-11: Means offlavonol-3 phenolics concentrations in wines, grouped by water status zone within each site; catechin, epicatechin, quercetin at four Pinot noir vineyards, St. Davids, ON, Wine Catechin Epicatechin Quercetin (mg/l) (mg/l) (mg/l) Red'Paw Low 93.23b a 3.61 High a b 2.99 Significance a * ns ns ns * ns Red Paw 2 Low High Significance ns ns ns ns ns ns Black Paw Low High Significance c ns ns ns Lowrey's Low Medium b High Significance ns ns ns ns ns ns amean separation at u=0.05 using the LSD test *, **, ***, ns: Significant at p~0.05, 0.01, 0.001, not significant, respectively bin 2009, Lowrey's vineyard was divid~d into two water status zones. cblack Paw wines in 2008 were not made in replicate; values shown are for the single fermentation. 77
78 Table 3-12: Means of non-flavonoid phenolics and stilbene concentrations in wines, grouped by water status zone within each site; gallic acid, caffeic acid, p-coumaric acid, and trans-resveratrol at four Pinot noir vineyards, st. Davids, ON, Wine Gallic acid Caffeic acid p-coumaric acid Trans-resveratrol (mg/l) (mg/l) (mg/l) (mg/l) Red Paw Low High Significance a ns ns ns ns ns ns ns ns Red Paw 2 Low a a 2.41 High b b 2.49 Significance ns ns * ns ns ns * ns Black Paw Low a a High b b Significance c * ns ns * Lowrey's Low b 2.55 Medium b a High a 2.86 Significance ns ns ns ns ns ns ** ns amean separation at u=0.05 using the LSD test *, **, ***, ns: Significant at p:s..0.05, 0.01, 0.001, not significant, respectively bin 2009, Lowrey's vineyard was divided into two water status zones. cblack Paw wines in 2008 were not made in replicate; values shown are for the single fermentation. 78
 image from 29 May 2008.")

79 Figure 3-1: Sentinel vines in the Red Paw vineyards, St. Davids, ON overlaid on a true colour (RGB) image from 29 May Open squares represent endposts, open diamonds represent water status vines, and solid circles represent other sentinel vines. Red Paw 1 is on the right, with vine rows running east-west; Red Paw 2 is on the left, with vine rows running north-south. O-... 5[O=========:16om~ 79
 Lowrey's vineyard (Pinot noir, St.")


80 Figure 3-2: Sentinel vines in the (a) Black Paw vineyard and (b) Lowrey's vineyard (Pinot noir, St. Davids, ON) overlaid on true colour (RGB) images from 22 June Open squares represent end-posts, open diamonds represent water status vines, and solid circles represent other sentinel vines. o m rt. 80
 bar -9.3-9.1-8.9-8.7-8.5-8.3-8.1-7.9-7.7-7.")
; (a) 2008 and (b) 2009 in a Pinot")


81 (a) bar (b) bar Figure 3-3: Red Paw 1. Mean ':I' (bar); (a) 2008 and (b) 2009 in a Pinot noir vineyard, St. Davids, ON. Note that the range of values was not the same in both years, and a different value scale was used. The dark lines represent the division between high and low water status zones. 2'om rt 81
 (b) Figure 3-4: Red Paw 2.")


82 bar bar (a) (b) Figure 3-4: Red Paw 2. Mean 'P (bar); (a) 2008 and (b) 2009 in a Pinot noir vineyard, St. Davids, ON. Note that the range of values was not the same in both years, and a different value scale was used. The dark lines represent the division between high and low water status zones. o 20 40m 82


83 bar (a) (b) Figure 3-5: Black Paw. Mean ' (bar) in a Pinot noir vineyard, st. Davids, ON; (a) 2008 and (b) Note that the range of values was not the same in both years, and a different value scale was used. The dark lines represent the division between high and low water status zones. I o m 83
 (b) Figure 3-6: Lowrey's. Mean ' (bar) in a Pinot noir vineyard, st. Davids, ON; (a) 2008 and (b) 2009.")

84 bar bar (a) (b) Figure 3-6: Lowrey's. Mean ' (bar) in a Pinot noir vineyard, st. Davids, ON; (a) 2008 and (b) Note that the range of values was not the same in both years, and a different value scale was used. The dark lines represent the division between high, medium & low water status in 2008, & high and low water status zones in o 20 40m 84

85 C'II -c: CD Co E C'II "E CD 5 0- Co ~ U LI H4 H2 L2 : HI M4 L4 H3 L I -1.0 I -0.5 I 0.0 Component 1 I 0.5 I ,. -8 I -6 I -4 I -2 I o Component 1 I 2 I 4 I 6 I 8 Figure 3-7: PCA of 2008 yield components, grape composition and vineyard variables in four Pinot noir vineyards, St. Davids, ON. Principal component I (PCI) (57.86%) and PC2 (28.60%) explain 86.46% of the variation in the data. Left: variable loadings of variables on PCl & PC2 (Yield - yield per vine (kg), Clusters - number of clusters per vine, gcluster - glcluster, gberry - g/berry, bph - berry ph, Brix - berry Brix, TA - titratable acidity (gil), Shoot - weight of cane prunings (kg), Crop - crop load, Anth - total anthocyanins (mgll), Colour (au), Hue (au), Phenols - total phenolics (mg/l), TDRAvg - mean soil moisture (%), PBAvg - mean 'P (bar), Clay - % clay, Silt - % silt, Sand - % sand, OM - % organic matter, CEC - cation exchange capacity (meq/loog), sph - soil ph). Right: observation loadings (Blue - high water status, Red - low water status, Yellow - medium water status; 1 - Red Paw l, 2 - Red Paw 2, 3 - Black Paw, 4 - Lowrey's). 85
86 H2 e e L2 2- ('II CD " is 0.0- c. ~ ('II L3 " e ~ ~ H3 8 la e e H4 e Ll e HI I -1.0 I -0.5 I 0.0 Component 1 I 0.5 I I -5 I -4 I -3 I -2 I -1 I o Component 1 I 1 I 2 I 3 I 4 I 5 Figure 3-8: PCA of2009 yield components, grape composition and vineyard variables in four Pinot noir vineyards, St. Davids, ON. Principal component 1 (PC1) (44.68%) and PC2 (25.65%) explain 70.34% of the variation in the data. Left: variable loadings of variables on PC1 & PC2 (Yield - yield per vine (kg), Clusters - number of clusters per vine, gcluster - g/cluster, gberry - g/berry, bph - berry ph, Brix - berry Brix, T A - titratable acidity (gil), Anth - total anthocyanins (mg/l), Colour (au), Hue (au), Phenols - total phenolics (mg/l), TDRAvg - mean soil moisture, PBAvg - mean'll (bar), Clay - % clay, Silt - % silt, Sand - % sand, OM - % organic matter, CEC - cation exchange capacity (meq/100g), sph - soil ph). Right: observation loadings (Blue - high water status, Red -low water status; 1 - Red Paw 1,2 - Red Paw 2,3 - Black Paw, 4 - Lowrey's). 86

87 N 1: G) 8. ~ N c: G) E o u -1 _ L2-69 Ll-09 Hl-09 H2-09 Ll-OS HI-OS L2-0S ~. ~... ia:bi) e... L3.0S H4-09 H2-0S : H3-0S H4-0S M4-0S ri4-os L3-09 H I -1.0 I -0.5 I 0.0 I 0.5 I I I -6-5 I I I I I I 2 I I 3 4 I I 5 6 Component 1 Component 1 Figure 3-9: PCA of2008 and 2009 yield components, grape composition and vineyard variables in four Pinot noir vineyards, St. Davids, ON. Principal component 1 (PC1) (41.61 %) and PC2 (19.66%) explain 61.27% of the variation in the data. Left: variable loadings of variables on PC1 & PC2 (Yield - yield per vine (kg), Clusters - number of clusters per vine, gcluster - g/cluster, gberry - g/berry, bph - berry ph, Brix - berry Brix, T A - titratable acidity, Anthtotal anthocyanins (mg/l), Colour (au), Hue (au), Phenols - total phenolics (mg/l), TDRAvg - mean soil moisture (%), PBAvg - mean 'P (bar), Clay - % clay, Silt - % silt, Sand - % sand, OM - % organic matter, CEC - cation exchange capacity (meq/100g), sph - soil ph). Right: observation loadings (dark blue - high water status 2009; light blue - high water status 2008; dark red -low water status 2009; pink -low water status 2008; yellow - medium water status). 87
88 4.0 Influence of Water Status on Sensory Profiles of Niagara, Ontario Pinot noir 4.1 Introduction The effect of water stress on grapevine and fruit development has been extensively documented. The physiological impact of water stress on grapevines is largely agreed upon, but the mechanisms and effect on grape composition is not. Generally, when water loss from transpiration exceeds the available water, governed by solar radiation, temperature and relative humidity, physiological stress occurs (Hardie & Considine 1976). Water stress may result in reduced fruit set (Hardie & Considine 1976), reduced yield (Hardie & Considine 1976), increased sugar accumulation and break-down of malic acid (Koundouras et al. 2006), increased concentrations of anthocyanins and total grape phenolics (Koundouras et al. 2006; Sivilotti et al. 2005), and generally desirable grape composition and wine sensory attributes (Reynolds et al. 2007b; Matthews et al. 1990). In terms of sensory attributes, there is a relationship between the presence of moderate water stress and hedonic liking of wines made from the Agiorgitiko grape (Koundouras et al. 2006). Conversely, Reynolds et al. (2007) found that irrigation used to decrease the level of water stress increased the intensity of desirable sensory attributes in Chardonnay. Wines that were made as a part of a study on the effect of vine vigour on grape composition were subjected to sensory analysis by Cortell et al. (2008). The differences between the wines were in astringency, bitterness, sour and sweet tastes, earthy and chemical flavours, and heat. The low vigour zone wines tended to have the highest intensity of perceived astringency, and this was related to the actual tannin concentration in the fruit and skins. In a stepwise regression, the vine vigour was more important than vineyard site to explain the differences in the wines for the significantly different attributes, especially, astringency, sour, chemical and bitterness (Cortell et al. 2008). There is a relationship between the vigour of the vine, fruit shading and temperature, and the sensory properties of the wine. Phenolic compounds add to the overall sensory profile of a wine, through direct effects on astringency and bitterness (Noble 1994), and through interactive effects with other basic tastes. Increasing sweetness and polysaccharides has been shown to decrease the 88
89 perception of astringency caused by grapeseed tannins in solution (Smith et al. 1996). The timing of water stress and vegetative growth has the potential to influence the sensory attributes of a wine through controlled irrigation by affecting the balance of vegetative growth, fruit shading, and accumulation of flavour precursors in the grapes (Reynolds et al. 2007). This study aimed to investigate the relationship between within vineyard differences in water status and wine sensory attributes. It was hypothesized that there would be a relationship between the sensory attributes of Niagara, Ontario Pinot noir and the water status of the vineyard. 4.2 Materials & Methods Selection of vineyard sites, sentinel vine sampling strategy, observation of leaf water potential (, ), harvest and winemaking were described in detail in an earlier paper in this series (Chapter 3.2) Multidimensional Sorting Task A multidimensional sorting (MDS) task was carried out on the 2008 wines as a means of rapidly performing a difference test on all wine samples. This was performed in January of The Black Paw vines were left out ofthe task, as there was only a single fermentation from each water status zone, and the wines were faulted such that sensory analysis on them would be unpleasant for panelists. There were 17 untrained panelists, consisting of volunteers from students and staff of CCOVI (10 male and seven female). Following the procedure of Tang & Heymann (2002), panelists were given no training with the wines. Panelists were presented with three flights of wines in ISO tasting glasses under red ambient lighting to mask colour differences in the wines. Glasses were coded with three digit numbers, and covered with plastic lids to prevent the loss of aromatic intensity. There were two flights of six wines each (Red Paw vineyards), and one flight of nine wines (Lowrey's vineyard). Each flight consisted of all the wines from a single vineyard site. The wines were presented in a randomized incomplete block design. Panelists were asked to taste the wines, and place them into groups based on basic tastes, flavours and/or mouthfeel. The choice of common or differentiating attributes was entirely up to the individual panelists. They were given the restriction that there must be at least two groups, and each group must contain at least one wine. For each group, they were 89
90 asked to write the descriptors of the common characteristics of the wines in that group, in order to focus their thoughts. Each flight was separated by a break of at least 15 minutes. Water for rinsing between wines was provided, as well as crackers for clearing the palette between wines and flights Descriptive Analysis A panel of 10 volunteers from staff and students at CCOVI (five male, five female) were gathered in March 2009 to describe the 2008 wines from the Red Paw vineyards and from the Lowrey's vineyard. Black Paw wines were left out of the analysis because they were faulted such that they would be unpleasant for panelists. At the first session panelists were presented with four wines: a Red Paw wine made from excess fruit from sentinel vines in Red Paw 1 and 2 across water status zones, a blended Lowrey's wine made from excess fruit from all three water status zones, and two wines from individual water status zones. They were asked to smell and taste each of the wines, and independently generate descriptors for the wines. Collectively, this list of descriptors was modified over six training sessions during which the panelists were exposed to all of the wines, until all panelists agreed on the descriptors and their definitions. The final descriptors were: tart fruit aroma (sour cherry, cranberry), sweet fruit aroma (red cherry, strawberry, raspberry), sweet aroma (chocolate/vanilla, butterscotch), pepper spice aroma (black & white pepper), baking spice aroma (clove, anise), tobacco aroma, vegetal aroma (canned beans, asparagus and mushrooms), other aroma (reductive aromas, faults to be identified by written comments), red fruit flavour, spices flavour, vegetal flavour, earthy flavour, acidity, bitterness and astringency. Aroma standards were made for these descriptors, according to the preparations in Table 4-1. Standards were made using recipes published by Cortell et al. (2008) and Reynolds et al. (1996) as starting point, adjusted with local ingredients and modified for intensity as agreed upon by the panelists during training sessions. These standards were made available for panelists at all training and data collection sessions. The panelists met for a total of six training sessions in which they were exposed to each of the wines at least once. They were trained in the use of line scales for describing the intensity of the attributes relative to the other wines. Data collection was carried out over five sessions on 15-point unstructured line scales using Compusense software (Version 5.0; Compusense, Guelph, ON). Data collection 90
91 sessions were carried out in individual booths, with 30mL of the wines presented in ISO glasses under red ambient light to mask colour differences. In each of five sessions, eight wines were evaluated in two flights. The total collection of wines was randomized over the data collection period such that during each session, all panelists were exposed to the same randomly selected eight wines, with the order randomized among panelists. Each wine was presented in two replicates over the course of the data collection period. There was a forced 3 minute break between wines, and a 10 minute break between flights. Water and unsalted crackers were provided for panelists between wines. All wines were expectorated Statistical Methods The results of the sorting task were analyzed using an MDS model. A single similarity matrix for each of the flights of wines was created by summing the number of times each pair of wines was placed into the same group by the 17 panelists. This matrix was submitted to the PROC MDS in SAS using an unweighted Euclidean model (Version 9.1.3; SAS Institute, Cary, NC). The dimensions of interest were chosen using the stress or "badness of fit" and the overall squared correlation (RSQ) indices. These dimensions were submitted to cluster analysis in JMP (Version 8.0.1; SAS Institute, Cary, NC) using centroid hierarchal clustering to identify which wines were more similar to one-another as per the analysis of Tang & Heymann (2002). Cluster analysis takes each point starting as individuals, and through a step-wise process puts neighbouring points into clusters until a set endpoint is reached or until all points are in a single cluster. Where there is a sudden increase in the distance between clusters, a subjective cutting point between clusters can be inserted. Attribute intensity scores for the wines of each vineyard site were subjected to a three-factor ANOVA using the PROC GLM in SAS. Judge*wine, judge*rep, and wine*rep interaction factors were included to measure panel agreement, judge reliability and presentation errors respectively. Mean separation was performed for attributes that were significantly different between wines using the least significant different (LSD) test with 0.=0.05. A principal component analysis (PCA) was performed on mean attribute intensity scores for all wines using JMP. These methods are common for analysis ofda data as described by Reynolds et al. (1996), Nurgel et al. (2004), Cortell et al. (2008), Guindard & Cliff (1987) and many others. 91
92 4.3 Results Multidimensional Sorting The fit of the MDS model was evaluated using the optimization of the stress and RSQ. For each flight of wines, three dimensions were chosen to appropriately fit the data with a large RSQ (approaching or equal to 1) and a small stress value. For Red Paw 1, RSQ was 1 and the stress value was 5.93(10-10 ); for Red Paw 2, RSQ was 1 and the stress value was 4.01(10-7 ); and for Lowrey's, RSQ was 0.98 and the stress value was at three dimensions. Increasing the number of dimensions did not appreciably decrease the stress and increase RSQ indices, so three dimensions were chosen as an acceptable representation of the data. The groupings resulting from the cluster analysis on all three dimensions are shown in Figure 4-1 through Figure 4-3. For Red Paw 1, cluster analysis suggested a four-cluster solution. High water status fermentation replicates two and three, along with low water status replicate two were similar, whereas low water status replicates one and three and high water status replicate one were different from the other wines. For Red Paw 2 a three-cluster solution was appropriate. High water status replicate one and low water status replicate one were different from the other wines; while high water status replicates two and three and low water status replicates two and three were similar. For Lowrey's, a four-cluster solution was appropriate. High water status replicate one was different from the other wines; low water status replicate one and medium water status one were similar, low water status replicate two and medium water status replicate three were similar, and low water status replicate three, medium water status replicate two, and high water status replicates two and three were all similar. The results of the sorting task demonstrate that there were sensorial differences between fermentation replicates that were too large to separate from differences between water status zones. Fermentation replicates from within water status zones could not be considered to be the same for descriptive analysis, and all fermentation replicates were required to be included as individual samples Descriptive Analysis The F-values resulting from the three-factor ANOVA on results of the DA are seen in the supplemental materials. There was a significant difference between judges for every 92
93 attribute in each vineyard. Significant differences between wines were seen in sweet aroma and bitterness in Red Paw 1 (Table 7-13), sweet fruit aroma and vegetal aroma in Red Paw 2 (Table 7-14), and sweet aroma, vegetal aroma and spices flavour in Lowrey's wines (Table 7-15). The F-value output from a single-factor ANOVA by water status on each vineyard is shown in Table There were no significant differences between water status zones within each vineyard site. For Red Paw 1 wines, there was a significantjudge*wine interaction for sweet fruit aroma, bitterness, and astringency. There was a significant judge*rep interaction for baking spice aroma and astringency (Table 7-13). For Red Paw 2 wines, there was a significant difference in replications for vegetal aroma, a significant judge*rep interaction for baking spice aroma, vegetal aroma, red fruit flavour, and spices flavour (Table 7-14). For Lowrey's wines, there was a significant difference in repetitions for baking spice aroma, vegetal aroma, and acidity. There was a significant judge*wine interaction for sweet fruit aroma, baking spice aroma, vegetal flavour, acidity, and bitterness, and significant judge*rep interaction for vegetal flavour and acidity (Table 7-15). Means of aroma attribute intensities, and significant differences are shown in Table 7-17 for individual wines from the three vineyards in the supplemental materials. Means of flavour, taste and mouthfeel attribute intensities, and significant differences are shown in Table 7-18 for all wines from the three vineyards. There were wines from each vineyard site with significant differences between individual wines for specific attributes including sweet fruit aroma in Red Paw 2 and Lowrey's vineyards (Table 7-17), but these differences were not consistent with water status within each vineyard. Means ofda attribute intensities for wines grouped by vineyard site are shown in Table 4-2. There was a difference between sites for pepper spice aroma and vegetal aroma. Means ofda attribute intensities for wines grouped by water status zone within each vineyard are shown in Table 4;..3. There was a difference between the water zones for sweet aroma in wines from the Lowrey's vineyard. Pearson correlation coefficients between DA attribute intensities for all wines are shown in supplemental materials (Table 7-23). Cells are colour-coded to indicate significance level such that yellow, blue and red indicate a p-value,::::0.0001, 0.01 and 0.05, respectively. Tart fruit and sweet fruit aromas were well correlated with red fruit flavour (r=0.73, r=0.64; p,::::o.oooi). Baking spice and pepper spice aroma were well correlated with spices flavour (r=0.67, r=0.68; p,::::o.oooi). The strongest correlations were between tart fruit aroma and red fruit flavour, sweet fruit aroma and sweet aroma 93
94 (r=0.73, p,:::o.oool), and between vegetal aroma and vegetal flavour (r=0.70; p,:::o.oool). Acidity and astringency had the fewest strong correlations to any other attributes; however, acidity was marginally correlated with bitterness (r=0.48; p:s0.0001) and astringency (r=0.55; p:s0.0001). Bitterness was also marginally correlated with astringency (r=0.56; p,:::o.oool). PCA of all DA attribute intensities for 2008 wines from all three vineyards as well as observation loadings are shown in Figure 4-4. The ftrst two principal components explained 50.73% of the variation in the data. PC1 explains 33.82% and PC2 explains 17.35%, PC3, PC4 and PC5 explain an additional 10.65%, 9.08% and 6.71 % respectively, but they were not shown as they do not contribute any visual clarity to the results. The wines from water status zones within each vineyard tended to cluster together, although not with clear clustering apart from the other wines. From the Lowrey's vineyard, the high and medium water status wines are clustered separately from the low water status wines. The Red Paw 1 high water status wines are reasonably clustered, while the Red Paw 2 wines are not clearly clustered at all. As was seen in the Pearson correlation coefftcients, similarly named aroma and flavour descriptors tend to be highly correlated, and loaded along the same axes. The Lowrey's high and medium water status wines are loaded with vegetal attributes. Red Paw 1, low water status wines are better described by spice attributes. 4.4 Discussion Multidimensional Sorting The MDS revealed that the replicate fermentations resulted in unique wines. Some of the wines were more similar based on the groupings created by panelists, but these groupings were not consistent with water status zones. As grapes were bulked by water status zone from across vineyard sites, random fermentation effects were likely responsible for differences between wines greater than any differences that may have been present as a result of water status. Parr et al (2007) found that MDS was a strong predictor of varietal typicity in wines. The results of a sorting task of Sauvignon blanc wines from France and New Zealand indicated that the sorting task was a strong predictor of the results of a descriptive task performed later. 94
95 In this study, Red Paw 1 wines H2 and H3 from the high water status zone were clustered (Figure 4-1), and in the DA task, these two wines were in the same grouping for sweet aroma (Table 7-17). Similarly in Red Paw 2, wines H2 and H3 were clustered (Figure 4-2), and were not significantly different from one another in sweet fruit and vegetal aromas. The same trend was seen in the Lowrey's wines, where wines that were clustered (Figure 4-3) were not significantly different in mean attribute intensity. The MDS task was a relatively quick and effective means of performing a difference test, identifying that the differences between water status zones within each vineyard site were not great enough to mask fermentation effects. Small-scale fermentations for research have been criticized for producing faulted wines, and lacking standardized protocols; however, Sampaio et al. (2007) used standardized 4-L fermentation vessels for research-scale fermentation and found that the results were comparable to the commercial scale wines made from grapes from the same vineyard. The winemaking in this study was standardized as much as possible through the bulking of fruit, and consistent handling of the musts, fermenting and fmal wines through water status zones. It is likely that there were simply not large differences between the water status zones to begin with, and random fermentation effects dominated the differences between wines DA Panel Performance The descriptors used by the DA panelists were similar to those used by other panelists describing Pinot noir (Guinard & Cliff 1987; Reynolds et al. 1996; Cortell et al. 2008). The wines were in general, typical of Pinot noir. The "other" attribute was included as a dumping ground for panelists to describe reductive aromas, or other faults, in the wines. Comments made by panelists who used this descriptor were describing rubber boot, cabbage, or hydrogen sulfide. In Red Paw 1 wines, Low-3 was identified repeatedly as reductive, and in the MDS task, it did not cluster with any other wine. Similarly, from Red Paw 2, High-l and Low-l were repeatedly identified as reductive, and in the sorting task, these two wines did not cluster with the others. From the Lowrey's wines, High-I, High-3, Medium-2 and Medium-3 were described as reductive, but in this case they did not cluster apart from the other wines. The significant difference between judges for every attribute indicates that the judges were not in agreement in terms of attribute intensity. This is not entirely unexpected, and is a result of panelists using the range of available values on the line scale differently. The 95
96 judge*wine interaction is an indicator of panel agreement, where the null hypothesis is that the judges tend to score the intensities of the attributes of wines in the same way. This interaction was significant for bitterness in both Red Paw 1 and Lowrey's, astringency in Red Paw 1 wines, and acidity in Lowrey's wines. This indicated that the judges were not in agreement in how to rate these tastes and mouthfeel. It can be difficult to identify these sensations in the complex wine matrix, and differences between individuals, especially in bitterness perception, mean that some panel disagreement is not unusual (King et al. 1995; Pickering et al. 2003). There were significant judge*rep interactions for baking spice aroma and astringency for Red Paw 1, baking spice aroma, vegetal aroma, red fruit flavour and spices flavour for Red Paw 2, and vegetal flavour and acidity for Lowrey's wines. The null hypothesis ofthis interaction is that the judges rate the attributes the same way when presented the same wine. The significant interactions listed indicate that the judges were not reliable in rating these attributes. The repeated mention of baking spice and vegetal indicate that further discussion during the training sessions may have been merited in order to increase the judges' familiarity with these descriptors. The overall number of significant interactions was not large, and overall the depth of panel training appears to have been sufficient Effect of Water Status & Vineyard Location There were only two attributes that were significantly different between wines from Red Paw 1, two attributes from Red Paw 2 wines, and three attributes from Lowrey's wines. Averaging all wines from the water status zones in each vineyard, there was a difference between Lowrey's water status zones in sweet aroma; otherwise there were no differences between attribute intensities for any of the vineyard sites (Table 7-16). In the case of Lowrey's, the low water status zone had the highest intensity of sweet aroma, and the high water status zone had the lowest intensity. The medium water status zone was not different from the other two. Taking the mean of all wines from each vineyard, there were only two attributes that were different between vineyards: pepper spice and vegetal aroma (Table 4-2). These same two attributes were identified as areas where judges did not perform as reliably in rating the intensity. Red Paw 1 had the highest intensity for pepper spice aroma, and Lowrey's had the lowest, while Red Paw 2 was not different from either. Lowrey's wines had the highest vegetal aroma intensity, Red Paw 1 had the lowest, and Red Paw 2 was not different from 96
97 either. The relationship between the aroma and flavour descriptors of the same name was not surprising. As seen through Pearson's correlation coefficients (Table 7-23), and the PCA (Figure 4-4), these attributes tended to be well correlated. The judges were rating the same attribute in aroma and flavour. Based on observation loadings, the results are similar to those of the sorting task. The wines did not cluster by water status or vineyard, and it is difficult to draw any conclusions as to the effect of water status on the sensory attributes of the wines. Generally, the Lowrey's vineyard wines were described by vegetal aroma and flavour. Red Paw I wines were described by tart fruit aroma, baking spice and pepper spice aroma, and spice flavour. Red Paw 2 wines were the least clustered, and not clearly described by any of the attributes. Cortell et al. (2008) found that vigour was related to the perceived astringency of Pinot noir wines, and Reynolds et al. (1996) found that canopies with high shoot density resulted in Pinot noir with more vegetal character, and less fruit character. The previously described relationship between water status and vine size (Section 3.3) revealed that there was some relationship between vine size and water status in 2008, but it was not a strong statistical (r=0.46; p~o.ol) or spatial relation in all four vineyard sites. The vine vigour may have been playing a role in the sensory profile of the wines, but was not aligned with the water status zones used to delineate winemaking zones. 4.5 Conclusions There were random fermentation effects in the winemaking that led to differences between the wines from the water status zones of each vineyard. The multidimensional sorting task revealed that the replicate fermentations resulted in unique wines. The strength of the MDS was verified by the results of the DA task. The winemaking in this study was standardized by bulking the fruit, and consistent handling of the musts, fermenting and final wines through water status zones. There were not large enough differences between the water status zones to begin with so fermentation effects were pronounced. To understand the true effect of a site's terroir, the unique sensory properties of a wine from that site must be understood. There were only two attributes that were different between all wines from Red Paw 1, two attributes from Red Paw 2 wines, and three attributes from Lowrey's wines. The Lowrey's vineyard was described by vegetal aroma and flavour, the Red Paw I vineyard was described by tart fruit, and spice aromas and flavours, and the Red Paw 2 vineyard by a combination of fruit and spice aromas and flavours. Within the 97
98 sites, there were no differences between the sensory characteristics of wines grouped by water status, and random winemaking effects were responsible for most of the difference between the wines. Taking the mean of all wines from each vineyard, there were only two attributes that were different between vineyards: pepper spice and vegetal, These same two attributes were identified as areas where judges did not perform as reliably in rating the intensity. 98
99 4.6 Literature Cited Cortell, J., Siversten, H., Kennedy, J., Heymann, H Influence of vine vigour on Pinot noir fruit composition, wine chemical analysis, and wine sensory attributes. Amer. J. Enol. Vitic. 59:1- to. Guinard, J., Cliff, M Descriptive analysis ofpinot noir wines from Cameros, Napa and Sonoma. Amer. 1. Enol. Vitic. 38: Hardie, W., Conisidine, J Response of grapes to water-deficit stress in particular stages of development. Amer. J. Enol. Vitic. 27: King, B.M., Arents, P., Moreau, N Cost/efficiency evaluation of descriptive analysis panels- 1. panel size. Food Qual. Pref. 6: Koundouras, S., Marinos, V., Gkoulioti, A., Kosteridis, Y., Van Leeuwen, C Influence of vineyard location and vine water status on fruit maturation of nonirrigated cv. Agiorgitiko (Vitis vinifera L.). Effects on wine phenolic and aroma components. J. Agric. Food Chern. 54: Matthews, M., Ishii, R., Anderson, M., O'Mahony, M Dependence of wine sensory attributes on vine water status. J. Sci. Food & Agric. 51: Noble, A Bitterness in wine. Physiol. Behav. 6: Nurgel, c., Pickering, G., Inglis, D Sensory and chemical characteristics of Canadian ice wines. 1. Sci. Food & Agric. 84: Parr, W., Green, J., White, K., Sherlock, R The distinctive flavour of New Zealand Sauvignon Blanc: sensory characterization by wine professionals. Food Qual. Pref. 18: Pickering, G., Simunkova, K., DiBattista, D Intensity of taste and astringency sensations elicited by red wines is associated with sensitivity to PROP (6-n-propylthiouracil). Food Qual. Pref. 15: Reynolds, A., Yerle, S., Watson, B., Price, S., Wardle, D Fruit environment and crop level effects on Pinot noir. 3. composition and descriptive analysis of Oregon & British Columbia wines. Amer. J. Enol. Vitic. 47: Reynolds, A., Lowrey, W., Tomek, L., Hakimi, J., desavigny, C Influence of irrigation on vine performance, fruit composition, and wine quality of Chardonnay in a cool, humid climate. Amer. 1. Enol. Vitic. 58: Reynolds, A., Senchuk, I., vanderreest, C., desavigny, C. 2007b. Use ofgps and GIS for elucidation of the basis for terroir: spatial variation in an Ontario Riesling vineyard. Amer. J. Enol. Vitic. 58: Sampaio, T., Kennedy, J., Vasconcelos, M Use of micro scale fermentations in grape and wine research. Amer. J. Enol. Vitic. 58: ' Sivilotti, P., Bonetto, C., Paladin, M., Peterlunger, E Effect of soil moisture availability on Merlot: from leaf water potential to grape composition. Amer. 1. Enol. Vitic. 56:
100 Smith, A., June, H., Noble, A Effect of viscosity on the bitterness and astringency of grade seed tannin. Food. QuaL Pref.. 7: Tang, c., Heymann, H Multidimensional sorting, similarity scaling and free-choice profiling of grape jellies. J. Sensory Studies. 17:
101 Table 4-1: Descriptive analysis sensory attributes, definitions as described by panelists, and corresponding reference standards for Ontario Pinot noir wines. All standards were added to 100 ml of base wine (2008 Pinot noir from the Red Paw vineyards) unless otherwise noted. Attribute Definition Reference standard Tart fruit aroma 9 sour cherries + 50mL syrup (S&F Aroma of unripe or sour red fruits Foods) (sour cherry, cranberry) 30mL cranberry cocktail (Irresistibles) Aroma of ripe red fruits 3 strawberries (frozen, Green Giant) Sweet fruit aroma (strawberry, raspberry, red 5 raspberries (frozen, Green Giant), cherry) 2 Tbs cherry jam (President's Choice) sweet aroma Pepper spice aroma Aroma of dark chocolate, vanilla, butterscotch Aroma of black and/or white pepper 14g unsweetened chocolate (Baker's) 5 drops pure vanilla extract (McCormick), 2 Tbs butterscotch spread (Smuckers) 1 drizzle cracked black pepper (McCormick) 1 drizzle ground white pepper (No Name) Baking spice 1 drizzle ground cloves (McCormick), Aroma of clove and/or anise aroma 3 drizzles anise seeds (McCormick) Tobacco aroma Aroma of dried tobacco 3 large pinches Cigarette tobacco (Player's) Vegetal aroma 3 pieces cut green beans (DelMonte) Aroma of canned vegetables 3 pieces asparagus cuts (No Name) (beans, asparagus, mushrooms) 5 mushrooms, chopped (No Name) Other aroma Reductive aromas, or faults No reference standard Red fruit flavour Flavour of cherry, cranberry, strawberry, raspberry No reference standard Spices flavour Flavour of pepper, baking spices No reference standard Vegetal flavour Flavour of canned vegetables No reference standard Earthy flavour Flavour of soil, beetroot No reference standard Acidity Sour taste 1.5 gil tartaric acid in water Bitterness Bitter taste 0.3 gil caffeine in water Astringency Drying mouthfeel 0.3 gil aluminum sulfate in water 101
102 Table 4-2: Means of descriptive analysis attributes by vineyard; 2008 Pinot noir wines from Red Paw 1, Red Paw 2 and Lowrey's vineyards, st. Davids, ON. Vineyard Baking Tart Fruit Sweet Fruit Pepper Spice Tobacco Vegetal sweet Aroma Spice Aroma Aroma Aroma Aroma Aroma Aroma Red Paw a b Red Paw ab ab Lowrey's b a S"fi 19m Icance d ns ns ns * ns ns * Vineyard Red Fruit Spices Vegetal Earthy Flavour Flavour Flavour Flavour Acidity Bitterness Astringency Red Paw Red Paw Lowrey's Significance ns ns ns ns ns ns ns d Mean separation at a=0.05 using the LSD test; *, **, ***, ns: Significant at p:::. 0.05,0.01,0.001, not significant, respectively. 102
103 Table 4-3: Means of descriptive analysis attributes by water status zone; 2008 Pinot noir wines from Red Paw land 2 and Lowrey's vineyards, st. Davids, ON. Water Status Zone Baking Tart Fruit Sweet Fruit Pepper Spice Tobacco Vegetal sweet Aroma Spice Aroma Aroma Aroma Aroma Aroma Aroma Red Paw 1 Low High Significance d ns ns ns ns ns ns ns Red Paw 2 Low High Significance ns ns ns ns ns ns ns Lowrey's Low a Medium ab High b Significance ns ns * ns ns ns ns Water Status Zone Red Fruit Spices Vegetal Earthy Flavour Flavour Flavour Flavour Acidity Bitterness Astringency Red Paw 1 Low High Significance ns ns ns ns ns ns ns Red Paw 2 Low High Significance ns ns ns ns ns ns ns Lowrey's Low Medium High Significance ns ns ns ns ns ns ns d Mean separation at a=0.05 using the LSD test; *, **, ***, ns: Significant at p~ 0.05,0.01,0.001, not significant, respectively. 103
104 RP1L1, I Stress = 5.93(10-1 ) 0.5 RSQ= 1 RP1H3 0.5 I RP1H2 C'II Q RP1H e Dim1..,. Q I I RP1H RP1L ~ RP1H1! -0.5! Dim1 RP1L3 I I, I I I Figure 4-1: Three dimensional stimulus configurations from multidimensional sorting of 2008 Red Paw 1 Pinot noir wines, St. Davids, ON. Circled wines represented a subgroup suggested by cluster analysis. (RPIHI - Red Paw 1 high water status Rep 1, RPIH2 -high water status Rep 2, RPIH3 - high water status Rep 3, RPIL1 - Red Paw 1 Low water status Rep 1, RPIL2 - Low water status Rep 2, RPIL3 - Low water status Rep 3). 104
105 N E is E3> I I I') E I is RP2L3 0.5 RP2H1 RP2H In RP2H3 RP2L2-0.5 Stress = 4.01(10-7 ) RSQ= 1 I -1 RP2L1 Dim1 1.5 Dim1 Figure 4-2: Three dimensional stimulus configurations from multidimensional sorting of2008 Red Paw 2 Pinot noir wines, St. Davids, ON. Circled wines represented a subgroup suggested by cluster analysis. (RP2Hl - Red Paw 2 high water status Rep 1, RP2H2 -high water status Rep 2, RP2H3 - high water status Rep 3, RP2L1 - Red Paw 2 Low water status Rep 1, RP2L2 - Low water status Rep 2, RP2L3 - Low water status Rep 3) 105
106 LRH1 1 LRL3 'E Q -'1.5 Stress = RSQ= Dlm ~ Q :;; LRM3 LRL v - LRH2 LRM: RL1 Dim1-0.5 LRH3-1 LRM1 - Figure 4-3: Three dimensional stimulus configurations from multidimensional sorting of2008 Lowrey's Pinot noir wines, St. Davids, ON. Circled wines represented a subgroup suggested by cluster analysis. (LRH1- Lowrey's high water status Rep 1, LRH2 - high water status Rep 2, LRH3 - high water status Rep 3, LRMI - Lowrey's medium water status Rep 1, LRM2 - Medium water status Rep 2, LRM3 - Medium water status Rep 3, LRLI - Lowrey's Low water status Rep 1, LRL2 - Low water status Rep 2, LRL3 - Low water status Rep 3). 106
 -1-2L-2-2 - -3 - -4- -5 - -6-2H-1 : 1L-3 2L-1. 1L-1 I -1.0 I -0.5 I 0.0 I 0.5 I 1.")
107 N C Q) c: E 8 ~ t, M-1 4L-1. : 4L-3 N 1 4M-2 4H-3. 4L-2 C -. 2fI-3. ~ o 0-4H-2. 2H"'~ ~ _~ 1H-1 1H-2 Co o E 4H-1 4M-3 '. IH-3 1L-2 () -1-2L H-1 : 1L-3 2L-1. 1L-1 I -1.0 I -0.5 I 0.0 I 0.5 I 1.0 I I I I I I I I I I I I I Component 1 Component 1 Figure 4-4: PCA of sensory attribute intensity of2008 Pinot noir wines from three vineyards, st. Davids, ON. Principal component 1 (PC1) (33.82%) and PC2 (17.35%) explain 50.73% of the variation in the data. Left: variable loadings of sensory attributes on PC1 & PC2 (lower case - aroma, upper case - flavour). Right: observation loadings (lh - Red Paw 1, high water status; ll - Red Paw 1, low water status; 2H - Red Paw 2, high water status; 2L - Red Paw 2, low water status; 4H - Lowrey's, high water status; 4M - Lowrey's, medium water status; 4L - Lowrey's, low water status). 107
108 5.0 Using Remote Sensing to Understand Vineyard Variability 5.1 Introduction In New World winegrowing regions, especially young regions such as the Niagara Peninsula in Ontario, consumers are left to be the judge of a wine's value without a history of its geographic origin. The degree of variation within New World regions cannot be overestimated; there is a wide range of soil parent material, slope & aspect, distance from the moderating influence of Lake Ontario and associated mesoclimate conditions in the Niagara Peninsula (Shaw 2005). This variation, the relatively young age of the grape-growing industry, and the lack of a strict Appellation of Origin system means that growers and wineries are left to find and adapt new tools for understanding and managing their vineyards. The basic premise of precision agriculture (P A) is that inputs to farming practices are in response to information gathered with the intent of affecting outputs through an information feedback-loop system (Bramley et al. 2001). When applied to viticulture, there is a focus on understanding the spatial and temporal varillbility in the production of winegrapes (Hall et al. 2003). Grapegrowers have traditionally accepted the variability within vineyards as inherent to the underlying qualities of the site itself, the terroir. With many years of experience, vineyard areas have been subdivided into individually rated vineyards of higher or lower quality. The emergence of geomatics software has allowed grape growers to geographically link information from their vineyards into the P A feedback loop, and target inputs to specific regions of their vineyards. PA has been used successfully in grape production in New World regions including California (Johnson et al. 2001), Australia (Hall et al. 2003; Lamb et al. 2004), and Chile (Acevedo-Opazo 2008) as well as Old World regions such as Spain (Zarco Tejada et al. 2001). In viticultural applications, optical remote sensing has been used in modeling vegetative growth, and to infer grape composition from those measurements. 10hnson et al. (2001) used remotely sensed spectral data to delineate a vineyard site of Chardonnay into small-lot production zones. They found that the vine size was related to the vigour zones, as identified by the airborne image. The vigour zones were also related to vine water status, and grape composition variables. Thus, indirectly, remote sensing was used to predict vineyard status and grape composition, with direct implications for wine quality (Johnson et al. 2001). 108
109 The relationship between vegetation indices (vd and vegetative growth was further explored by Dobrowski et al (2003). There was a strong, positive correlation between the extracted VI and the pruning weight in two years. Additionally, the relationship established in the first season was able to predict the pruning weights in the second study vintage (Dobrowski et al 2003). The ability of remote sensing to be used to directly predict grape composition variables was explored by Lamb et al (2004). They found that re-sampling the image to a final pixel size approximately the same as the distance between rows, effectively combining vine size and density information into a single pixel, resulted in the strongest correlations to total phenolics and colour. They also reported that the strongest correlations (most negative) between NDVI and total phenolics and colour occurred around the time of vera is on (Lamb et al 2004). In the Languedoc region of France, Acevedo-Opazo et al (2008) performed a study on remotely sensed VI, vine water status, and grape composition on a number of wine grape varieties in non-irrigated vineyards. They found temporally stable relationships between zones delineated based on the normalized difference vegetation index (NDVI) and vegetative growth, vine water status, and yield. These zones were also consistent with soil type. They concluded that a combination of remotely sensed data with intimate vineyard knowledge, especially of the soil, is needed to predict grape composition and ultimately wine quality (Acevedo-Opazo et al. 2008). Overall, remote sensing has been proven as a tool for monitoring vineyard vegetative growth, and for making inferences into grape composition from the spectral measurements. The purpose of this study was to validate the use of remote sensing as an information gathering and observational tool in precision viticulture to understand terroir in a New World growing region. Four individual commercial vineyards planted to Vitis vinifera L. cv. Pinot noir in the Four Mile Creek and st. David's Bench sub-appellations, Niagara Region, Canada were the study locations. It was hypothesized that information extracted from multispectral remotely sensed images could be used to identify variations in vineyard metrics and berry composition. 5.2 Materials & Methods Selection of vineyard sites, sentinel vine sampling strategy, soil sampling, observation of leaf water potential ('P) and soil moisture, harvest and winemaking, berry 109
110 sampling and measurement of vine size by recording pruning shoot weights were described in detail in an earlier paper in this series (Chapter 3.2) Airborne Multispectral Images Airborne image capture by aircraft-mounted camera was coordinated by Dr. Ralph Brown (School of Engineering, University of Guelph, Guelph, ON) from the Guelph Airport A custom-built door mounting held a cluster of four confocal digital cameras with individual passband interference filters centred on red (650nm), green (550nm), blue (450nm) and nearinfrared (NIR, 770nm) wavebands. Raw image bands were 1280x1024 pixels, with a spatial resolution dependent on altitude, nominally 3500 feet above ground level. This resulted in a pixel size of roughly 38.6x38.6cm, with a 48 acre (19.5ha) footprint. In 2008 images were captured on 29 May, 1 July, 29 July and 21 August on days with clear skies and as close to solar noon as practical. In 2009, images were captured on 22 June, 5 August, and 1 September under clear sky conditions as close to solar noon as possible. In both years, bud-burst occurred early in May, bloom in mid-june, hedging was performed in early July. Veraison occurred late in August in 2008 and early September in Camera gain settings were adjusted at time of capture to saturate all four wavebands in pixels displaying a white Tyvek target placed on the ground in the vineyard for each flight. This had the dual purpose of removing the need to correct the images for radiometric or atmospheric interference, as well as making it possible for a direct conversion from digital number (DN) pixel values to reflectance values Image Processing Images were processed using ENVI 4.6 (ITT Visual Information Solutions, Boulder, CO). Band-to-band registration was performed using tie points gathered from an image of streets and buildings in nearby Virgil, Ontario taken with each flight. Pixel size was also verified from landmarks in this image. Images were georeferenced using ground control points (GCPs) which were geolocated using a Trimble GeoXT GPS unit (Trimble Navigation Ltd., Sunnyvale, CA) as described in section GCPs included comers of vineyard blocks, easily identifiable rocks, wind machines and gas tanks, and the end-posts of sentinel rows. There were 28 GCPs at Coyotes Run, and seven at Lowrey's, not including sentinel row end-posts. No less than 10 GCPs were used in any image registration, keeping the root 110
111 mean square error (RMSE) below 1.0 where possible. For image to map registration, a first degree rotation stretch translation (RST) method was used with cubic convolution resampling Data Extraction In order to extract spectral information from remotely sensed images, the pixels of interest must be first identified, and in this case those pixels represented sentinel vines. The Vine crawler algorithm (Hall et al. 2003) was modified for isolation of sentinel vines for the purpose of data extraction. Unlike the situation reported in Hall et al. (2003), Hall et al. (2008), Johnson et al. (2001), and Johnson (2003), there was a large amount of vegetation growing on the vineyard floor between rows and under vines. Every other inter-row was tilled in the spring, but was quickly overtaken with fresh vegetation as the season progressed. In addition, there was vegetation between the rows that were not tilled from the summer before. This is illustrated in Figure The Vinecrawler algorithm relies on the easy separation of vine and non-vine pixels (Hall et al. 2003). This is only possible where the vineyard floor is not covered with dense vegetation. A histogram ofndvi pixel counts forms a bimodal distribution where there is little or no vegetation on the vineyard floor, this was observed by Hall et al. (2003), and was the basis of using a threshold NDVI value to create a mask over non-vine pixels. The histogram was divided into three categories: vine, inter-row space, and mixed pixels (Hall et al. 2003). The inter-row space had a low NDVI indicative of dead vegetation and soil. The mixed pixels represented pixels that have a larger contribution as a result of the soil underneath the canopy, and were largely along the edges of the vine rows. Where there is vegetation other than vines, the frequency of high NDVI values increases, and the bimodal distribution is lost. Figure 7-24 is a histogram ofndvi values extracted from Red Paw 2 on 22 June 2009, demonstrating this effect. Instead of dead vegetation or bare soil between the vine rows, there was green vegetation with high NDVI values, similar and in many cases higher than that of the vines. Mixed pixels represented a combination of vine and soil as well as inter-row vegetation and soil. Applying a threshold mask to these images did not isolate vines from other vegetation or from the soil. Spectral information is the key decision-making criterion for the Vinecrawler algorithm in identifying pixels of interest. Since spectral information alone could not be used in this study due to the presence of background vegetation, the use of geographic information 111
112 was used as a ftrst step in data extraction. The GPS locations of the sentinel vines were overlaid on the geo-referenced images as a vector file. Small residual error from geolocating the vines, and the error introduced by georeferencing the images meant that these vector points were not aligned with vine rows. The points were manually shifted to the most likely location of the sentinel vine. Using knowledge of the vineyard layout, the first sentinel row was identified for each site. The vector points were shifted as little as possible, using the value of the NIR waveband to guide the placement of the points. Hall et al. (2003) reported that the center of the row was a pixel with the highest local NDVI value bound by pixels with lower NDVI values in addition to mixed pixels. This relationship did not hold with dense inter-row vegetation. Figure 7-25 shows a sample of Red Paw 2 from 22 June At the far left is inter-row vegetation, followed by vine, inter-row soil, another vine row, inter-row vegetation, a third vine row, and finally inter-row soil. As shown in Table 7-19, the highest local NIR band value and the highest NDVI value were not always at the same pixel. The highest of each value were seen in the inter-row space, and so the location of the vector point must be made in relation to a known edge of a vine row.. These edges are easily found next to soil. Knowing that each pixel is 38.6 em across, and that the vine rows are roughly 2.4 m apart, the vine row most likely includes the first three pixels (I.2m) from the first mixed pixel. The vector was placed as a seed point where the NIR band is highest, within a reasonable distance from where an edge of a vine row was discemable. Where there was dens~ vegetation between every row, this required tracing the row along its length from the last point where it could be distinguished from soil or inter-row vegetation. After placing the vector seed point, it was converted into a larger region of interest (ROI) to extract the band values at that point. Lamb et al. (2001; 2004) found that lowresolution images, when the pixel size was roughly equal to the vine row spacing, were better for extracting information about canopy size and density as well as for predicting total phenolics and colour. To that end, each seed point was extended to a 5x5 pixel matrix with the vector point at its centre. Band values were extracted from individual wavebands (NIR and red) andre-sampled to lxi, 3x3, and 5x5 pixel sizes before taking thendvi.note that taking the NDVI of each pixel in the matrix and averaging them is not mathematically equivalent to averaging each of the wavebands and calculating the NDVI from the mean band values. For example, Figure 7-26 shows a highlighted vine from Red Paw 2, I September The values of these pixels in the NIR and Red wavebands are shown in Table Taking the NDVI of each pixel and averaging those value results in an NDVI of 112
113 Conversely, taking the mean pixel value from each waveband and then calculated the NDVI resulted in a value of 0.186, the true NDVI of the re-sampled ROI Ground-based Leaf Reflectance The reflectance spectra of individual leaves were measured on water status vines. Measurements were performed on or around the same day as the airborne image capture so long as leaf surfaces were dry. In 2008 the dates were: 26 June, 25 July, and 22 August. There were not enough fully expanded leaves at the first airborne image capture date to measure ground-based leaf reflectance around 29 May. In 2009 the dates were: 24 June, 5 August, and 11 September. A Stellamet EPP2000 (UV-Vis-l OOnm) spectrometer, controlled by a small laptop computer running SpectraWiz software (Stellamet Inc., Tampa, FL) was used to record the reflectance spectra. A custom-built enclosure held the leaf as well as the 5W halogen bulb light-source. The detector fiber optic cable was fixed to the enclosure, at a 45 angle to the incident light. References were set before the first leaf, and again after every four to six vines. The dark reference, or 0% reflectance, was taken with the light off, and the leaf enclosure empty and held shut over the black felt base. The white reference, representing 100% reflectance, was performed with the light on and the enclosure firmly sealed around matte white Teflon square. Integration time from 15 to 30 ms was adjusted as necessary to maintain the white standard without saturating the spectrometer, and five samples were taken to mean to maintain computer performance and a smooth response curve. Three healthy, fully expanded leaves, from across the vine canopy, were chosen at random. Leaves that were too small for the enclosure were rejected. The accepted leaf was held flat in the enclosure, and exposed to the light source. The reflectance spectra was saved from 350 to 85Onm, at 2nm increments Statistical Methods Analysis of variance (ANOVA) was performed on the data collected at each vineyard site individually, for each vintage. Sentinel vines were grouped within sites fitst by water status zone, and then by vigour status zone. Data were submitted to the PROC GLM in SAS (Version 9.1.3; SAS Institute, Cary, NC), with means separation by the LSD (0.=0.1). Pearson's correlation matrices were generated between all variables using PROC CORR for all sentinel vines. Principal component analysis (PCA) was performed on the mean values 113
114 grouped by water status zone for all vineyard sites using JMP (Version 8.0.1; SAS Institute, Cary, NC). 5.3 Results The PCA of yield components, grape composition, vineyard soil and moisture variables, and leaf reflectance (both ground-based and airborne) when grouped by water status zone as well as observation loadings for 2008 at all four vineyard sites is shown in Figure 5-1. PCl accounted for 55.25% of the variation in the data, and PC2 for % for a total of 84.36% in the first two principal components. Similarly, Figure 5-2 shows 2009 data from all four vineyard sites. PC 1 accounted for 53.15% of the variation in the data, and PC2 for 21.29% for a total of 74.44% in the first two principal components. Figure 5-3 shows all four vineyard sites in both years, PCl accounts for 42.02% and PC2 for 18.60% of the variation in the data, accounting for 60.62% of the variation in the first two principal components. Clustering of the vineyard blocks was consistent for Black Paw and Lowrey's but less distinct for the Red Paw blocks in the PCA of both years. Means of seasonal mean NDVI-red extracted from airborne images with vines grouped by water status category are shown in Table 5-1. This table includes lxi, 3x3, and 5x5 pixel re-sampling for all four vineyard sites. Similarly, means of mean NDVI-green are shown in Table 5-2. There were no differences between water status zones within a vineyard at lxl pixel for either VI in either year, in fact there were no differences at all in At 3x3 and 5x5 pixels, there was a difference between water status zones in Lowrey's vineyard using both VI in 2008, and a difference in Red Paw 1 using NDVI-green in Red Paw 1. NDVI-green, proposed by Gitelson et al. (1996), is identical to the traditional NDVI, but the red waveband is replaced by the green, and has been shown to be more sensitive to the chlorophyll content of leaves. With vines grouped by vigour status zone, means of seasonal mean NDVI-red are shown in Table 7-21, and NDVI-green in Table In 2008, Black Paw vineyard was different between vigour status groups based on pruning shoot weights for all re-sampling rates except 5x5 using NDVI-green. No other vineyard was different between vigour zone for either index or re-sampling rate in As was discussed in an earlier paper in the series, (Chapter 3.2), after the 2009 season only vines at Lowrey's vineyard were pruned. Lowrey's was different between vigour zones using NDVI-green at lxl and 5x5 pixel resampling. 114
115 Table 7-24 through Table 7-31 are included in supplemental materials. Pearson correlation coefficients and corresponding significance levels ofndvi-red extracted from individual airborne images against seasonal mean ' for all sentinel vines, in both vintages, are shown in Table 7-24, and the same relationships for NDVI-green are shown in Table These tables include lxi, 3x3, and 5x5 pixel re-sampling. Similarly, Table 7-26 and Table 7-27 show the Pearson correlation coefficients ofndvi-red and green against vine size, Table 7-28 and Table 7-29 are against total phenolics, Table 7-30 and Table 7-31 are against total anthocyanins. Graphical representations of how these Pearson correlation coefficient changed over the growing season are also given, for NDVI-red only, all sentinel vines, from both years, 3x3 pixel re-sampling. Figure 5-5-a, -b, -c and -d are against mean ', vine size, total phenolic compounds, and total anthocyanins respectively. There is no clear relationship as to how the strength of any of these correlations changed over time, or as the re-sampling increased from lxl to 5x5 pixels. The Pearson correlation coefficients between the mean NDVI-red and -green for 2008 are shown in Table 7-32 and for 2009 in Table The only moderate correlation was between NDVI-red and ' (lxi, 3x3 and 5x5 pixel re-sampling, r=0.70, 0.65 and 0.56; p~o.oooi). The relationship between airborne and ground-based vegetation indices on individual dates are shown with Pearson correlation coefficients for all sentinel vines in Table 5-3 for 2008 and Table 5-4 for There was no pattern to the relationship between VI on individual dates, and very few of the correlations were significant (p~0.01), there was no relationship between the airborne VI and those measured using individual leaf reflectance. 5.4 Discussion Method Development The key difference between this study and those before it is presence of dense interrow vegetation. The clear bimodal distribution of pixel values observed by Hall et al. (2001; 2003) did not occur here, as was shown in Figure Indeed, many of the pixels with values ofndvi higher than the 0.67 cut-off used by Hall were observed to be area other than vine, and pixels showing entirely vine could be found in the entire range of positive values of NDVI. Using the method described above in Section 5.2.3, a best approximation of the location of a seed-point for the vine was located using the local maximum of the NIR 115
116 reflectance within a reasonable distance from the edge of a boundary between soil and vine. The characteristic spectral response curve of vegetation includes a dramatic increase in reflectance from the red wavelengths into the near-infrared around 750 nm, the greater the contribution of soil in a mixed pixel, the lower the pixel value in the NIR waveband (Hall et al. 2002). A fully-automated process was not developed because of the frequency of high NIR reflectance values between vine rows; a cut-off distance from a discemable soil edge was needed to place many of the seed points. Ultimately, this method proved to be effective and consistent. It was not complicated, but was time consuming. In order to speed up the process of extracting information from aerial images, the intelligent digitizer feature of the ENVI software package was used. Geolocated endposts and approximate locations of sentinel vines were used as guides, to rapidly highlight vine rows, and create a mask to select only those pixels containing vine and some mixed pixels. Figure 5-6 shows the masking process on an image of Red Paw 2 vineyard from 1 September,2009. This process loses information about canopy shape by assuming a 3-pixel (or any pre-selected integer value) width, but using the mask makes the process of identifying the location of sentinel vines much faster. In commercial applications, where individual vines are not the targets, this process is a more efficient method of creating a map of vine performance and is similar to the maps produced by using the GreenSeeker NDVI sensor (Drissi et al 2009) Remote Sensing and Vineyard Performance The peas from 2008 and 2009 in Figure 5-1 and Figure 5-2 show that there was a distinct separation of the four vineyard sites in both years. The two Red Paw vineyards were clustered in 2008, apart from Black Paw and Lowrey's vineyards. In both years, the lxi, 3x3, and 5x5 pixel re-sampling were highly correlated to each of the others. This was verified by the Pearson correlation coefficients, where the same index was highly correlated to the re-sampled indices in Table 7-32 and Table In 2008, Black Paw was heavily loaded with colour, soil organic matter and clay. Lowrey's was heavily loaded with the mean '1', cluster size, vine size, and the remotely sensed vegetation indices (NDVI-red, NDVI-green). The Red Paw vineyards were loaded with berry size, number of clusters and soil silt content. In 2009, Black Paw was heavily loaded again with soil clay content and organic matter. Lowrey's was loaded against cluster size, berry ph and berry soluble solids. Red 116
117 Paw I was loaded with soil silt content and the VI, and Red Paw 2 was loaded with berry colour intensity, hue, and total anthocyanins. The pooled data from both vintages showed that Black Paw is distinctly different from the other three sites, and again was described by the clay and soil organic matter. Red Paw I and 2 were more similar in 2009 with the consideration of the entire data set, where they did not cluster in the 2009 data alone. Red Paw 1 and Lowrey's were clustered in the larger data set, and were loaded with yield, cluster size and sand. It is likely that the colour of the soil, which was distinctly different in each site, contributed to the mixed pixels surrounding the sentinel vines. Since remote sensing has been used in predicting soil albedo (Post et al. 2000), it follows that different surface soil appearances would behave differently in this analysis. The means ofndvi-red and NDVI-green for all four vineyard sites, with sentinel vines divided by water status reveal that remote sensing was not able to differentiate within vineyard differences in water status. In 2008, using 3x3 and 5x5 pixel fe-sampling, there were differences between water status zones using NDVI-red and NDVI-green in the Lowrey's vineyard. The low water status zone had the lowest NDVI using both Red and Green. Using NDVI-green there was also a difference in Red Paw I in With 5x5 pixel re-sampling, the low water status zone was the smaller value. In 2009 there were no differences between water status zones in any vineyard using either index. Remote sensing was not useful as a tool in determining water status zones in these vineyards in 2008 and The Pearson's correlation coefficient between the mean NDVI and the mean 'I' revealed a reasonable correlation between the two in For lxi, 3x3 and 5x5 pixel re-sampling, r=0.70, 0.65 and 0.56 (p~0.0001), respectively. The correlations were less strong for NDVI-green, for lxi, 3x3 and 5x5 pixel re-sampling, r=0.35, 0.45 (p~0.01) and r=0.62 (p~0.0001), respectively. The small difference between water status zones likely masked the strength of remote sensing for monitoring the water status of the vines. Whereas the mean NDVI of each water status zone was not different, there was a strong relationship between the water status of individual vines and the NDVI in In 2009 the correlation between NDVI and mean 'I' was not as strong. For NDVIred, there were no significant correlations to mean water status. For NDVI-green, lxi, 3x3 pixel re-sampling, r=0.29 (p<0.05), r=0.38 and 0.32 (p<0.01) respectively. As previously discussed, there were not large differences between these zones as a result of the weather, and the differences may not have been present to be detected. 117
118 The means ofndvi-red and green with vines grouped by vigour status zone for 2008 at all four vineyards, and for Lowrey's vineyard in 2009 are shown in Table 7-21 and Table Using NDVI-red, there were differences between vigour zones in the Black Paw vineyard, but counter-intuitively the low vigour zone has the higher mean NDVI. In Red Paw 1, at 5x5 pixel re-sampling there was a difference between vigour zones, with the high vigour zone having the larger NDVI. With NDVI-green, there were differences between vigour zones in Black Paw, but with the high vigour zone having the lower NDVI. In 2009 there were differences between vigour zones using 1x1 and 5x5 re-sampling in Lowrey's vineyard, with the high vigour zone having the higher NDVI. The division by vigour status did not yield a more useful application of remote sensing than division by water status; however, there was a moderate correlation between shoot weight and NDVI-red and green in For lxi, 3x3 and 5x5 pixel re-sampling, the Pearson correlation coefficients were r=0.51, 0.46 and 0.36 (p:::0.0001) respectively. The correlations were less strong between shoot weight and NDVI-green, using lxi, 3x3, and 5x5 pixel re-sampling, r=0.14 (p:::0.05), r=0.23 and 0.40 (p:::0.0001) respectively. NDVI-red was better correlated to vine size than NDVI-green in 2008, but neither was a strong correlation. In general, the strength of correlations between NDVI and any other parameter was strongest at 1x1 pixel size, and decreased with the addition of more pixels. However, the 3x3 pixel re-sampling was most likely to include the entire canopy, and more likely to include the actual sentinel vine. It is also the pixel size that would be captured using the masked NDVI images. In Figure 5-4, the NDVI values extracted from 29 July and 21 August 2008 images of Lowrey's vineyard were mapped using the procedure of Section Maps from each date are of the lxi, 3x3, and 5x5 pixel re-sampling. The map of 1x1 pixel skews towards higher NDVI values, and the map of 5x5 pixel re-sampling skews towards the lower values. The 3x3 pixel re-sampling includes a large range of values, while maintaining the spatial distribution of trends in NDVI differences. For these reasons, the following discussion will focus on this re-sampling rate. In terms of grape composition metrics, in x3 pixel NDVI-red correlated best with cluster size (r=0.39; p:::0.0001), berry ph (r=-0.48; p:::0.0001), berry soluble solids (r=- 0.43; p:::0.0001), total anthocyanins (r=-0.65; p:::0.0001), and colour (r=-0.58; p:::0.0001). In 2009, NDVI-red correlated marginally with anthocyanins (r=0.49; p:::0.0001) and well with mean soil moisture (r=-0.89; p:::0.0001). Although there was a reasonable correlation between NDVI and anthocyanins in both years, the sign is different. Based on the findings of 118
119 Cortell & Kennedy (2006), Reynolds et al. (1994), and Spayd et al. (2002), one would expect an inverse relationship between NDVI and anthocyanins, with increasing light exposure from smaller canopies leading to higher concentrations of these and other phenolics. This was not found in this study. Lamb et al. (2004) found that the strength of the correlation between NDVI-red and total grape phenolics was best at veraison, while Hall et al (2010) found that the correlation continued to improve even after veraison. Neither of these trends was observed in either vintage for phenolics or anthocyanins. Figure 5-5-c and -d show the change in the correlation between NDVI-red and phenolics and anthocyanins over time. The two years did not agree in the pattern over time, and do not clearly peak at any time. In remote sensing studies, the absolute magnitude of the Pearson correlation coefficients is not always expected to be large. Lamb et al (2004), in comparing spatial resolution and timing of data capture in predicting total phenolics reported values no larger than r= The emphasis was on the change in the correlation over time, and a proof-ofconcept in the ability of remote sensing systems to predict grape composition metrics. The trend in change overtime in correlation between NDVI-red and mean ' is seen in Figure 5-5-a. There is some agreement between the two vintages, with the correlation at its weakest through the end of July and beginning of August, around the same time that hedging operations dramatically changed the canopy architecture and density. The same trend is seen in Figure 5-5-b, which trends the correlation between NDVI-red and weight of cane prunings in There was a dip in late-july, after which the correlation coefficient continued to increase. This study did not reveal an ideal time for remote sensing aerial image capture in predicting grape composition or vine size. The seasonal mean from both vintages indicated that VI extracted from aerial images have some limited potential for use in predicting grape composition and vine vigour in a cool climate, but the lack of clear trends makes it impossible to make recommendations as to ideal flight scheduling, or the true predictive powerofvl Using the mask of a vineyard, NDVI values at individual pixels are retained. In contrast, a map drawn from extracted values at sentinel vines required interpolation, and may miss small spatial trends. Figure 5-7 shows the masked and mapped NDVI values from Red Paw 2 vineyard on 1 September The areas of high and low NDVI were generally the same, confirming the validity of the gridding process, but there was more detail contained in 119
120 the masked image. In addition, after the application of the mask, an automatic algorithm, such as Vinecrawler (Hall et al. 2001) could be applied. The use of threshold values to mask non-vine area could not be used in this study, but using the process described above, the end result of a masked image is the same. It must be noted again, however, that while Vine crawler was able to describe canopy architecture in its original application, the masking process used here eliminates that ability. Concurrent to the airborne images, spectral information was collected with a handheld spectrometer. Table 5-3 and Table 5-4 show the Pearson correlation coefficients between the vegetation indices extracted from the airborne images and the hand-held spectrometer on individual dates of data capture. There was not a strong correlation between the two methods of data capture. Comparing the same VI measured using the hand-held unit and remotely sensed, the correlation coefficient rarely exceeded 0.30, and was often negative. There were several major differences between the two measurement techniques. The hand-held reflectance was hyperspectral, saved at 2-nm increments where the airborne images were captured in four large wavebands. The hand-held measurements were taken on three leaves per vine, and by nature of sampling they tended to be large leaves, and while randomly chosen from across the available canopy, they may not have been representative of the entire canopy. They were also sampled individually, where the airborne images account for many layers ofleaves, seen from above. The characteristic spectral response curve of a grapevine leaf, such as that given by Hall et al. (2002), is for a single leaf with hyperspectral resolution. Increasing the layering of leaves increases the total reflectance in the NIR wavebands, because of transmittance and reflectance between layers (Lillesand & Kiefer 2000). Seen from above at a 38cm spatial resolution, each pixel will contain information about the leaves from one or more vines, the soil, and the under-vine vegetation. The red edge inflection point (REIP) is the inflection point of the curve where reflectance increases sharply from the red to the NIR wavelengths. It could not be calculated from the airborne images as they lacked the spectral resolution. A ground-based optical remote sensing device such as GreenSeeker offers yet another option for remote sensing. The entire canopy is viewed laterally (Drissi et al. 2009), and converted into a NDVI value. The orientation of a vertically shoot positioned canopy means 120
121 that this method of observation provides a great deal of information as to the spectral response of the canopy, and is not hampered by the issue of ground-cover. 5.5 Conclusions A process was developed here to extract spectral information from airborne images when the presence of inter-row vegetation complicates the use of fully automated algorithms. An alternate method of masking vineyards to remove the effect of background vegetation was also developed. Both of these methods were effective when the bimodal distribution of vine and non-vine pixels was not evident in an image due to extensive non-vine vegetation. Re-sampling the images to a 3x3 pixel area of interest (approximately 1.15xl.15m) resulted in comparatively stronger correlations to vine performance and grape composition metrics, while using a large range of values ofndvi. There was no clear trend in terms of what phase of vine growth would provide the most useful information, but there were some correlations to vine metrics. Remotely sensed NDVI correlated moderately well with berry ph, soluble solids, vine size, total anthocyanins, colour, and soil clay and sand content in In 2009, NDVI correlated well with TA, total anthocyanins, mean soil moisture, and soil clay and silt content. The potential of remote sensing for use in understanding variability within Pinot noir vineyards has been explored with some evidence of a relationship to berry composition including key colour and anthocyanin metrics. Further study is recommended to reconcile the use ofndvi for delineation of selective harvest zones in a cool climate, and to find patterns in year-to-year differences in remotely sensed indices and how they related to vineyard performance over time. 121
122 5.6 Literature Cited Acevedo-Opazo, c., Tisseyre, B., Guillaume, S., Ojeda, H The potential of high spatial resolution information to define within-vineyard zones related to vine water status. Precision Agric.. 9: Ben-Dor, E., Levin, N Determination of surface reflectance from raw hyperspectral data without simultaneous ground measurements: a case study of the GER 63-channel sensor data acquired over Naan, Israel. International J. Remote Sensing 21 : Bramley, R., Proffitt, T., Hamilton, R., Shearer, J., Ormesher, D., Lamb, D., Taylor, J., Precision viticulture - principles, opportunities and applications. In Proceedings: 11 th Australian Wine Industry Technical Conference, Adelaide. Cortell, J., Kennedy, J Effect of shading on accumulation of flavonoid compounds in (Vitis vinifera L.) Pinot noir fruit and extraction in a model system. J. Agric.Food Chern. 54: Dettman-Kruse, J., Christians, N., Chaplin, M Predicting soil water content through remote sensing of vegetative characteristics in a turfgrass system. Crop Sci. 48: Dobrowski, S., Ustin, S., Wolpert, J Grapevine dormant pruning weight prediction using remotely sensed data. Austral. J. Grape & Wine Res.. 9: Drissi, R., Goutouly, J., Forget, D., Gaudillere, J Nondestructive measurement of grapevine leaf area by ground normalized difference vegetation index. Agronomy J. 101 : Gitelson,A., Kaufman, Y., Merzlyak, M Use ofa green channel in remote sensing of global vegetation from EOS-MODIS. Remote Sensing of Environment 58: Hall, A., Lamb, D., Holzapfel, B., Louis, J Optical remote sensing applications in viticulture - a review. Austral. J. Grape & Wine Res. 8: Hall, A., Louis, J., Lamb, D A method for extracting detailed information from high resolution multispectral images of vineyards. In Proceedings of the 6 th International Conference on Geocomputation; University of Queensland, Brisbane. Hall, A., Louis, J., Lamb, D Characterising and mapping vineyard canopy using high-spatialresolution aerial multispectral images. Computers & Geosciences 29: Hall, A., Lamb, D., Holzapfel, B., Louis, J Within-season temporal variation in correlations between vineyard canopy and winegrape composition and yield. Precision Agric.. Published online 04 February Johnson, L., Bosch, D., Williams, D., Lobitz, B Remote sensing of vineyard management zones: implications for wine quality. Appl. Engin. Agric.. 17: Johnson, L Temporal stability of an NDVI-LAI relationship in a Napa Valey vineyard. Austral. J. Grape & Wine Res. 9: Lamb, D., Brown, R Remote sensing and mapping of weeds in crops. J. Agric. Engin. Resources. 78:
123 Lamb, D., Weedon, M., Bramley, R Using remote sensing to predict grape phenolics at harvest in a Cabemet Sauvignon vineyard: timing observations against vine phenology and optimizing image resolution. Austral. J. Grape & Wine Res. 10: Lillesand, T., Kiefer, R Remote Sensing & Image Interpretation 4th Ed. John Wiley & Sons, Inc. Post, D., Fimbres, A, Matthias, A, Sano, E., Accioly, L., Batchily, A, Ferreira, L Predicting soil albedo from soil colour and spectral reflectance data. Soil Sci. Soc. Amer. J. 64: Rast, M., Hook, S., Elvidge, C., Alley, R An evaluation of techniques for the extraction of mineral absorption features from high spectral resolution remote sensing data. Photogrammetric Engineering & Remote Sensing. 57: Reynolds, A, Price, S., Wardle, D., Watson, B Fruit environment and crop level effects on Pinot noir. 1. vine performance and fruit composition in British Columbia. Amer. J. Enol. Vitic.45: Shaw, T The Niagara Peninsula viticultural area: a climatic analysis of Canada's largest wine region. J. Wine Res. 16: Spayd, S., Tarara, J., Mee, D., Ferguson, J Separation of sunlight and temperature effects on the composition of Vi tis vinifera cv. Merlot berries. Amer. J. Enol. Vitic. 53: Zarco-Tejada, P., Berjon, A, Lopez-Lozano, R, Miller, J., Martin, P., Cachorro, V., Gonzalez, Mi, defrutos, A Assessing vineyard condition with hyperspectral indices: leafand canopy reflectance simulation in a row-structured discontinuous canopy. Remote Sensing of Environment. 99:
124 Table 5-1 : Means ofndvi -red extracted from 2008 & 2009 airborne images in four Pinot noir vineyard sites, st. Davids, ON, 2008 and 2009 with vines grouped by water status zone. Images were re-sampled at lxi, 3x3, and 5x5 pixel target areas. Water Status NDVI-red NDVI-red NDVI-red Category 1x1pixel 3x3pixel 5x5pixel Red Paw Low High Significance a ns ns ns ns ns ns Red Paw 2 Low High Significance ns ns ns ns ns ns Black Paw Low High Significance ns ns ns ns ns ns Lowrey's Low c b 0.10 Medium 0.62 b 0.31b 0.18a High a a 0.10 Significance ns ns **** ns **** ns amean separation at a=o.1 using the LSD test *, **, ***, ****, ns: Significant at p~o.i, 0.05, 0.01,0.001, not significant, respectively bin 2009, Lowrey's vineyard was divided into two water status zones. 124
125 Table 5-2: Means ofndvi-green extracted from 2008 & 2009 airborne images in four Pinot noir vineyard sites, st. Davids, ON, 2008 and 2009 with vines grouped by water status zone. Images were re-sampled at lxi, 3x3, and 5x5 pixel target areas. Water Status NDVI-green NDVI-green NDVI-green Category 1x1pixel 3x3pixel SxSpixel Red Paw Low b 0.17 High a 0.18 Significance a ns ns ns ns * ns Red Paw 2 Low High Significance ns ns ns ns ns ns Black Paw Low High Significance ns ns ns ns ns ns Lowrey's Low c c 0.03 Medium 0.23 b 0.13b 0.14b High a a 0.04 Significance ns ns ** ns *** ns amean separation at 0.=0.1 using the LSD test *, **, ***, ****, ns: Significant at p~o.i, 0.05, 0.01, 0.001, not significant, respectively bin 2009, Lowrey's vineyard was divided into two water status zones. 125
126 Table 5-3: Pearson correlation coefficients and significance level (p-value) of vegetation indices extracted from airborne images against vegetation indices calculated using ground-based reflectance measurements for individual data collection dates in 2008 in four Pinot noir vineyard sites, 8t. Davids, ON. Correlation 01-Jul Jul Aug-08 (r-value) NDVI-R NDVI-G GR REIP NDVI-R NDVI-G GR REIP NDVI-R NDVI-G GR REIP NDVI-R 1x NDVI-R3x NDVI-R5x NDVI-G 1x NDVI-G 3x NDVI-G 5x GR 1x GR3x GR5x Significance 01-Jul Jul Aug-08 (~-value) NDVI-R NDVI-G GR REIP NDVI-R NDVI-G GR REIP NDVI-R NDVI-G GR REIP NDVI-R 1x ' <.0001 < NDVI-R3x NDVI-R 5x NDVI-G 1x1 < NDVI-G 3x NDVI-G 5x GR 1x1 < GR3x GR5x
127 Table 5-4: Pearson correlation coefficients and significance level (p-value) of vegetation indices extracted from airborne images against vegetation indices calculated using ground-based reflectance measurements for individual data collection dates in 2009 in four Pinot noir vineyard sites, 8t. Davids, ON. Correlation 22-Jun Aug Sep-09 {r-value} NDVI-R NDVI-G GR REIP NDVI-R NDVI-G GR REIP NDVI-R NDVI-G GR REIP NDVI-R 1x NDVI-R3x NDVI-R5x NDVI-G 1x NDVI-G 3x NDVI-G 5x GR 1x GR3x GR5x Significance 22-Jun Aug ep-09 (~-value) NDVI-R NDVI-G GR REIP NDVI-R NDVI-G GR REIP NDVI-R NDVI-G GR REIP NDVI-R 1x < NDVI-R3x NDVI-R5x NDVI-G 1x < <.0001 <.0001 < NDVI-G 3x < NDVI-G 5x < GR 1x < <.0001 <.0001 < GR3x < < <.0001 <.0001 < GR5x < <.0001 <.0001 <
")
128 N 'E io.o- ~~ ~ -- :~ ~ ~ ~ , N 'E Q) 5 0- c. E Hi M4. H :.... L3 :. ~ la ~ HI L I -1.0 I -0.5 I 0.0 I 0.5 I I -8 I -6 I -4 I -2 I o I 2 I 4 I 6 I 8 Component 1 Component 1 Figure 5-1: PCA of 2008 yield components, grape composition, vineyard variables and leaf reflectance (ground-based and airborne) in four Pinot noir vineyard sites, St. Davids, ON. Principal component 1 (PC1) (55.25%) and PC2 (29.11 %) explain 84.36% of the variation in the data. Left: variable loadings of variables on PCl & PC2 (Yield - yield per vine, Clusters - number of clusters per vine, gcluster - glcluster, gberry - g/berry, bph - berry ph, Brix - berry Brix, TAtitratable acidity, Shoot - dormant shoot weights, Anth - total anthocyanins (mgll), Colour (a.u.), Hue (a.u.), Phenols - total phenolics (mgll), TDRAvg - mean soil moisture, PBAvg - mean '1', Clay - % clay, Silt - % silt, Sand - % sand, OM - % organic matter, CEC - cation exchange capacity (meq/loog), sph - soil ph, NR - NDVI-red, NG - NDVI-green, GR - Greenness Ratio, REIP - Red Edge Inflection Point, Avgl,9,25 - lxi, 3x3, 5x5 pixel). Right: observation loadings (Blue - high water status, Red -low water status, Yellow - medium water status; 1 - Red Paw 1, 2 - Red Paw 2,3 - Black Paw, 4 - Lowrey's). 128


129 H4 ('II ~ LJ"~~ m ~ r ~ ('II 'E Q) _ 6 D- c. E H3 L3 la Ll HI H2 L I -1.0 I -0.5 I 0.0 I 0.5 I I I I I I I I I 1 I 2 I I 3 4 I I 5 6 Component 1 Component 1 Figure 5-2: PCA of 2009 yield components, grape composition, vineyard variables and leaf reflectance (ground-based and airborne) in four Pinot noir vineyard sites, St. Davids, ON. Principal component 1 (PC1) (53.15%) and PC2 (21.29%) explain 74.44% of the variation in the data. Left: variable loadings of variables on PC1 & PC2 (Yield - yield per vine, Clusters - number of clusters per vine, gcluster- g/cluster, gberry- g/berry, bph - berry ph, Brix - berry Brix, TAtitratable acidity, Anth - total anthocyanins (mg/l), Colour (a.u.), Hue (a.u.), Phenols - total phenolics (mg/l), TDRAvg - mean soil moisture, PBAvg - mean '1', Clay - % clay, Silt - % silt, Sand - % sand, OM - % organic matter, CEC - cation exchange capacity (meq/loog), sph - soil ph, NR - NDVI-red, NG NDVI-green, GR - Greenness Ratio, REIP - Red Edge Inflection Point, Avg1,9,25 - lxi, 3x3, 5x5 pixel). Right: observation loadings (Blue - high water status, Red -low water status; 1 - Red Paw 1,2 - Red Paw 2,3 - Black Paw, 4 - Lowrey's). 129
 HI-08-2 - H~-09 Ll-08 la-o ~ M4-08 H4-08 -4 - -6 - -1.0 - I -1.0 I -0.5 I 0.0 I 0.5 I 1.")
130 C\I 1: CD c. E L3-08 ~ H3-09 I: L2-09 Ll-09, H2-09 HI-09 ~ L L2 ~ lh-b w H2-08 :Q la-09 () HI H~-09 Ll-08 la-o ~ M4-08 H I -1.0 I -0.5 I 0.0 I 0.5 I I -8 I -6 I -4 I -2 I o I 2 I 4 I 6 I 8 Component 1 Component 1 Figure 5-3: PCA of 2008 & 2009 yield components, grape composition, vineyard variables and leaf reflectance (ground-based and airborne) in four Pinot noir vineyard sites, St. Davids, ON. Principal component 1 (PCI) (42.02%) and PC2 (18.60%) explain 60.62% of the variation in the data. Left: variable loadings of variables on PCI & PC2 (Yield - yield per vine, Clusters - number of clusters per vine, gcluster - glcluster, gberry - glberry, bph - berry ph, Brix - berry Brix, TA - titratable acidity, Anth - total anthocyanins (mg/l), Colour (a.u.), Hue (a.u.), Phenols - total phenolics (mgll), TDRAvg - mean soil moisture, PBAvg - mean 'P, Clay - % clay, Silt - % silt, Sand - % sand, OM - % organic matter, CEC - cation exchange capacity (meq/loog), sph - soil ph, NR - NDVIred, NG - NDVI-green, GR - Greenness Ratio, REIP - Red Edge Inflection Point, Avg1,9,25 - lxi, 3x3, 5x5 pixel). Right: observation loadings (Blue - high water status, Red -low water status, Yellow - medium water status; 1 - Red Paw 1, 2 - Red Paw 2,3 - Black Paw, 4 - Lowrey's). 130

 1-----,---,-------'")


 3x3 pixel, (c) 5x5 pixel;")
131 ( a) ,---, ' (b) ,---, ' (c) f-----,-----, ' NDVI (e) ,----,---' Figure 5-4: Maps ofndvi-red, extracted from Lowrey's Pinot noir vineyard (St. Davids, ON) airborne images. 29 July 2008: (a) lxl pixel, (b) 3x3 pixel, (c) 5x5 pixel; 21 August 2008: (d) lxl pixel, (e) 3x3 pixel, (f) 5x5 pixel. o 20 40m 131
132 (a), ~ ~ u 0.30 c 0 :g : --- ~ 0 u 0.10 c 0 I!! 0.00 ~ 22fay 11-Jun 01-Jul J~0-~ Date -+- 3x ~ 3x Aug i 19-rep! I r x3-20?81 C 0.14.!!! E 0.12 ~ ~ i 0.08 u 0.06 c o i 0.04 a I----,------;----,---, r---,----r----,--~~-_i 22-May 01-Jun 11-Jun 21-Jun 01-Jul 11-Jul 21-Jul 31-Jul 10-Aug 20-Aug 30-Aug ~I ~ I, (C) I 0.30 ~ 0.20 'u IE 0.10 ~ u c ! -0 {a-tr.1 a y 11-Jun 01-Jul 21,i-1ul 10-Aug ~ c ~ /f Date : 'u I5l U ~ o.oof ~ 22-~ay 8 ~ ~ I -,-----,----~~~--~==~---;,~::~-~~ ~ Jun 01 -Jul 21-Jul 10-Aug 30-Aug 19-5ep ~I ~ I Figure 5-5: Trend of Pearson correlation coefficient ofndvi-red against (a) '1', (b) weight of cane prunings, (c) total phenols, (d) total anthocyanins for 3x3 pixel sample size at in four Pinot noir vineyard sites, St_ Davids, ON, 2008 & 2009_ 132

, darker areas are the lowest")
, only the areas most likely to be vine")
, followed by green (0,15-0.30), yellow (0.30-0.")
133 Figure 5-6: (a) CIR, (b) grayscale NDVI, (c) masked NDVI with density slice: Red Paw 2 Pinot noir vineyard, st. Davids, ON, 1 September In the grayscale image (b), darker areas are the lowest values ofndvi and white areas are the highest. When masked (c), only the areas most likely to be vine canopy remain, the blue areas are the lowest values ofndvi (0-0.15), followed by green (0, ), yellow ( ), orange ( ) and red ( ). o -hm ~ 133
 masked NDVI and (b) map ofndvi extracted from 3x3 pixel")
 is not the same colour scale as that created for the")
134 NOVI (a) (b)', Figure 5-7: Red Paw 2 Pinot noir vineyard, St. Davids, ON, 1 September 2009; (a) masked NDVI and (b) map ofndvi extracted from 3x3 pixel re-sampling of the original multiband image. Note that the density slice applied to (a) is not the same colour scale as that created for the map in (b), but the relative meaning colours is the same. o -hm ~ 134
135 6.0 General Discussion & Conclusions The soil texture and nutrient content, vine water status, soil moisture, yield components and grape composition were measured in four Niagara, Ontario vineyards planted with Pinot noir in a study of within vineyard variability. Sentinel vines were geolocated using global GPS and a subset of these vines were identified as water status vines. Soil samples were collected in spring of2008 at the water status vines to a depth of 75cm. During the 2008 and 2009 growing seasons, midday leaf water potential ('P) was measured bi-weekly at the water status vines using the pressure chamber technique. Soil moisture was measured bi-weekly using time domain reflectometry (TDR) with 20cm probes at all sentinel vines. Variables were mapped using GIS for delineation into zones based on water status and vigour status, and for qualitative analysis of spatial trends. Both 2008 and 2009 were extremely wet years, resulting in a narrow range of soil and vine moisture status. Between 1 April and 31 October, there was 495mm of rain in 2008, and 553mm in While the total rainfall from April to October was less than the long-term average in 2008, monthly rainfall was higher than average in June, July and August in 2008 and May, June, July, August and October in These months are the key periods offruit set, berry development, veraison and harvest respectively, and represent the field measurement period used in this study. Yield was best correlated to the number of clusters (2008: r=0.89; p:s0.0001, 2009: r=0.88; p:s0.0001), and cluster size (2008: r=65; p:s0.0001; 2009: r=0.57; p:s0.0001), but not to berry size. In 2008,yie1d was also marginally correlated with berry soluble solids (r=-0.43; p:s0.0001), total anthocyanins (r=-0.49; p:s0.0001), and colour (r=-0.51; p:s0.0001). Increasing yield had the effect of decreased ripening in the grapes. Higher yielding vines tended to have berries with a lower concentration of soluble solids and anthocyanins. Bramley (2005) found that high and low yielding zones were spatially distributed in agreement with distribution in colour and phenolics, and inconsistently with ph and T A. He concluded that while spatial distribution trends in yield are important, how this affects grape composition is not consistent across all vineyard sites (Bramley 2005). Reynolds et al. (1994) found that berry soluble solids, ph and colour were increased with a reduction in crop level in Pinot noir, but the canopy density and fruit shading, which are related to vigour and vine balance are likely also playing a role in fruit ripeness. 135
136 Also in 2008, mean ' was marginally correlated with berry ph (r=-0.48; p.::::0.0001), berry soluble solids (r=-0.43; p.::::o.ol), shoot weight (r=0.46; p.::::o.ol), total anthocyanins (r=- 0.65; p.::::0.0001), colour (r=-0.58; p'::::0.0001), clay content (r=-0.43; p'::::o.ol), and sand content (r=0.47; P'::::0.0001). In 2009, mean ' was marginally correlated with the soil clay content (r=-0.47; p<o.oool), and sand content (r=0.52; p<o.oool). There was a relationship between the vine water status and the ripening of the grapes, as ' became more negative, the grapes accumulated more sugars and anthocyanins. This occurred in soils with more clay and less sand, the higher clay soils may have had higher water content, but the vines were not accessing it. Soils with more sand were likely better drained, with less available water. Shoot weight was not highly correlated to any other variable. Black Paw was defined by its soil, in particular the clay content and the organic matter. The two Red Paw vineyards were most similar to one another, and the Lowrey's vineyard was more like the Red Paw vineyards than it was like Black Paw, set apart primarily by the sand component of the soil. In 2009, there were fewer strong correlations between variables. Mean soil moisture was reasonably correlated with total anthocyanins (r=-0.51; p'::::0.0001), soil clay content (r=0.69; p.::::0.0001), silt content (r=-0.81; p.::::0.0001), cation exchange capacity (r=0.81; P'::::0.0001), and soil ph (r=0.64; p.::::0.0001). In both years the soil type was a factor in the soil moisture. In 2009, the clay content was also marginally correlated with berry size (r=- 0.43; p<o.ol), and silt was correlated with total anthocyanins (r=0.45; p<o.ol). Soil texture and water status were both factors in variability in grape composition. In both years, but especially true in 2008, there was an effect of both ' and soil texture on grape composition. Soil moisture was not a strong indicator of vine water status, and vigour did not playa significant role in driving vineyard variability. It was hypothesized that vine water status is related to yield components and berry composition. It was found that while mean vine water status was correlated to some grape and soil variables, these relationships were not consistent across two vintages, and did not cover all of the key grape composition metrics. The weather was the likely cause of this; the higher than average rainfall during grape development meant that vines did not experience water stress during the growmg season. Findings relating to the relationships between vine water status and fruit compistion observed by Hardie & Considine (1976), Koundouras et al. (2006), Reynolds et al were not confirmed in this study. An irrigation regime was not applied to the vines, and as has 136
137 been extensively discussed, all of the vines were excessively watered by rainfall in both years of this study. GIS was used to divide the vineyard sites by water status zone, and ANOVAs were perfonned to test for differences in the means of yield components, berry composition, vine growth, vineyard moisture status and soil variables. There was no metric, in either of the years, which was significantly different between water status zones for all four vineyard sites. In 2008 cluster size, berry T A and colour intensity were significantly different between water status zones in three of the four vineyards; however, for each of these metrics, the direction of the trend was not the same in the three vineyards. For example, the low water status zone has the higher TA in the Black Paw vineyard, but it was the high water status zone with the higher TA in Red Paw 2 and Lowrey's vineyards. In 2009, there were never more than two of the four vineyards with differences between water status zones. The gross variation in 'P was relatively low as seen in Table 7-1 through Table 7-4; the range from maximum to minimum 'I' was not large, and with excess moisture the vine water status was not the primary factor in variability within or between vineyards. The same GIS tool was used to divide the vineyards by vigour zone as detennined by pruning cane weight. Means of yield components, berry composition, vine growth, vineyard moisture status and soil variables were not different between vigour status zones at all four sites in either vintage. In 2008 berry size and soil sand content were different between vigour status zones in three of the four vineyards. In berry size, the trend was the same in each of those three vineyards, with the high vigour status zone having the larger berries. The trend is not consistent for all three vineyards in tenns of sand. In 2009 only the Lowrey's block was evaluated by vine size. Vigour zones were significantly different for all yield components, berry TA, colour intensity, soil clay and sand, and organic matter. In 2008 and 2009, vigour was not a primary factor in grape composition or vineyard perfonnance. There was a relatively strong correlation between the mean NDVI and the mean 'I' in For lxi, 3x3 and 5x5 pixel re-sampling, r=0.70, 0.65 and 0.56 (p::;:0.0001) respectively. The correlations were far less strong for NDVI-green, for lxi, 3x3 and 5x5 pixel re-sampling, r=0.35, 0.45 (p::;:0.01) and r=0.62 (p::;:0.0001) respectively. In 2009, they were not well correlated. There were some differences between the mean VI for vigour zones; using NDVI-red, there were differences between vigour zones in the Black Paw vineyard, but counterintuitively the low vigour zone had the higher mean NDVI. In Red Paw 1, at 5x5 pixel re- 137
138 sampling, there was a difference between vigour zones, with the high vigour zone having the larger NDVI. With NDVI-green, there were differences between vigour zones in Black Paw, but with the high vigour zone having the lower NDVI. In 2009 there were differences between vigour zones using lxl and 5x5 re-sampling in Lowrey's vineyard, with the high vigour zone having the higher NDVI. The division by vigour status did not yield a more useful application of remote sensing than division by water status. There was a strong correlation between shoot weight and NDVI-red and -green in 2008 and this may indicate support for use of remote sensing to delineate vigour zones for selective vineyard management, or identification of trouble-spots in a vineyard. For lxi, 3x3 and 5x5 pixel re-sampling, the Pearson correlation coefficients between pruning weight and NDVI-red were r=0.51, 0.46 and 0.36 (p~0.0001) respectively. The correlations were weaker between shoot weight and NDVI-green, using lxi, 3x3, and 5x5 pixel re-sampling: r=0.14 (p~0.05), r=0.23 and 0.40 (p:s0.0001) respectively. NDVI-red was better correlated to vine size than NDVI-green in Gitelson et al. (1996) proposed using the green waveband as a sensitive indicator of chlorophyll content with an advantage of existing satellite-based systems in that using the green-band proved less affected by atmospheric interference. In this study gain settings on the aircraft-mounted camera were corrected at each imaging site, eliminating the need for atmospheric correction and perhaps nullifying the advantage of using the green waveband. In grape composition metrics, x3 pixel NDVI-red correlated best with cluster size (r=0.39; p~o.oooi), berry ph (r=-0.48; p~o.oooi), berry soluble solids (r=-0.43; p~o.oool), total anthocyanins (r=-0.65; p~o.oooi), and colour (r=-0.58; p~o.oooi). In 2009, NDVI-red correlated best with anthocyanins (r=0.49; p~o.oooi) and mean soil moisture (r=- 0.89; p~o.oooi). The change in sign of the correlations between years, and the sometimes counter-intuitive trends suggest that further years of data collection would be beneficial in understand the true potential of using remote sensing for predicting grape composition in Niagara, Ontario Pinot noir. This study did not reveal an ideal time for remote sensing aerial image capture in predicting grape composition or vine size as was predicted by Lamb et al. (2004). The seasonal mean from both vintages indicated that vegetation indices extracted from aerial images have limited potential for use in predicting grape composition and vine vigour in a cool climate, but the lack of clear trends made it impossible to make recommendations as to ideal flight scheduling. Physiological changes associated with some degree of water stress, 138
139 as is expected in a dry climate such as Australia where Lamb et al. performed their study, may result in changes in the absorbance spectra of the grapevine canopy that did not occur in Ontario in 2008 and Geomatics and remote sensing tend to work well at predicting spatial trends, but this study investigated individual vines as targets. Without the application of a treatment, increasing the number of sentinel vines did not increase the range of values experiences by the vines. There may have been some benefit in sampling a panel of vines on a per metre basis, rather than sampling individual sentinel vines. This would have allowed for sample points to be an average of the local vineyard area, eliminating weighted effects of differences between individual vines and allowing within-vineyard regional differences to emerge. Variations of this type of sampling was used by Dobrowski et al. (2003), and Acevedo Opazo et al. (2008) and Hall et al. (2008). The chemical composition of musts and wines revealed that in no measured parameter were the wines from water status zones within each vineyard significantly different from more than two of the vineyards in either vintage. Differences between the must soluble solids in Red Paw 1 and Lowrey's vineyards did not translate to differences in wine ethanol content, although in general, the water status group with the higher soluble solids concentration became the wine with the higher ethanol content. Reverse-phase HPLC was used to quantify the concentration of individual anthocyanins, flavonol-3 phenolics, non-flavonoid phenolics, and trans-resveratrol in the wines. There were no differences in the concentrations of any of the compounds between water status zones in all four vineyards. As was seen in the other wine chemical composition metrics, there was not a difference between the wines. Malvidin represented the largest proportion of anthocyanins, followed by peonidin, petunidin, delphinidin and cyanidin. In general, the concentrations of all anthocyanins were higher in 2009 than in Trans-resveratrol concentrations were higher in 2009 than in 2008, in some cases by more than double, with the exception of Red Paw 2 low water status wmes. The hypothesis that must and wine chemical attributes are related to water status was not proven. Once more, the wetter and cooler than average weather meant that the range of water status values observed was very narrow, with a small difference between zones that did not translate to a physiological difference. 139
140 In terms of sensory attributes, the MDS revealed that the replicate fermentations resulted in unique wines inconsistent with water status. The winemaking in this study was standardized as much as possible through the bulking of fruit, and consistent handling of the musts, fermenting and final wines through water status zones. It is likely that there were simply not large differences between the water status zones to begin with, and so fermentation effects were pronounced. There were only two sensory attributes that were different between all wines from Red Paw I, two attributes from Red Paw 2 wines, and three attributes from Lowrey's wines. Averaging all wines from the water status zones in each vineyard, there was a difference between Lowrey's water status zones in sweet aroma; otherwise there were no differences between attribute intensities for any of the water status zones in any other vineyard. In the case of Lowrey's, the low water status zone had the highest intensity of sweet aroma, and the high water status zone had the lowest intensity. The medium water status zone was not significantly different from the other two. Taking the mean of all wines from each vineyard, there were only two attributes that were different between vineyards: pepper spice and vegetal. These same two attributes were identified as areas where judges did not perform as reliably in rating the intensity. Red Paw I had the highest intensity for pepper spice aroma, and Lowrey's had the lowest, while Red Paw 2 was not significantly different from either. Lowrey's wines had the highest vegetal aroma intensity, Red Paw I had the lowest, and Red Paw 2 was not significantly different from either. In the pea, the wines did not cluster by water status or vineyard, and it is not possible to draw any conclusions as to the effect of water status on the sensory attributes of the wines. Generally, the Lowrey's vineyard wines were described by vegetal aroma and flavour. Red Paw I wines were described by tart fruit aroma, baking spice and pepper spice aroma, and spice flavour. Red Paw 2 wines were the least clustered, and not clearly described by any of the attributes. The relationship between water status and vine size revealed that there was some relationship between vine size and water status in It was marginal statistical relationship (r=0.46; p:so.ol) but a reasonable spatial relationship was not seen in all four vineyard sites. The vine vigour may have been playing a role in the sensory profile of the wines, but was not aligned with the water status zones. 140
141 There were qualitative similarities between maps of soil texture, 'I' and soil moisture. Soil texture and vineyard water status were related, even in two wet vintages, and are collectively likely responsible for some within vineyard variability. The lack of differences between the chemical attributes of the musts and wines emphasized that there was not a great difference between water status zones in the vineyards. Within the same vintage, the maps of berry composition variables were very similar. Maps of total anthocyanins, colour, hue and phenols were very similar to one another within vineyard sites, within vintage. In general, the Black Paw maps were difficult to interpret as a result of the site geometry. The site is very narrow compared to the length of the rows, and difficult for gridding to produce a meaningful surface map. Spatial variation in water status zones, the basis for site divisions in this study, was somewhat stable between vintages. The soil texture of the vineyards, one of the other drivers of variability, matched spatial trends seen in other variables. Vine size, measured by weight of cane pruning, showed spatial distribution somewhat similar to other variables, even though there were not strong correlations between this variable and others. Regions of higher shoot weight in Red Paw 1 also showed higher soil moisture, lower total anthocyanins, and higher soluble solids. This trend did not appear in the other vineyards though, and is consistent with the lack of strong correlation. In 2009, Lowrey's was the only vineyard with shoot weight measurements, and again there was not a strong similarity to the maps of soil moisture, total anthocyanins or any other grape composition metric. The similarity of the weather in the two years, while a complicating factor for observing the effect of water status may have been at least partially responsible for the stability in some ofthe spatial trends between years. Further years of study are recommended to gain a better appreciation of trends in spatial variation over time, in varied weather conditions. One of the objectives of this study was to test the use of GPS and GIS as tools in the understanding of Niagara terroir. Although the results of this study do not confirm the hypotheses about the effect of vine water status on grape composition, they were used successfully for monitoring trends in vineyard performance, a key decision-making tool in the precision viticulture feedback cycle. Using remote sensing and GIS co-operatively has the greatest potential for the implementation ofpv. The masked images proved to be a quick method of viewing spatial trends in airborne images without the data extraction process. There were qualitative 141
142 similarities between maps of vineyard and grape composition variables to the maps of extracted data and the masked images. Using the mask ofa vineyard, true NDVI values at individual pixels are retained. In contrast, a map drawn from extracted values at sentinel vines required interpolation averaging, and may miss small spatial trends. An additional objective of this study was to test the use of remote sensing to monitor or predict trends in berry composition and vineyard performance. This was proven using both extracted values, and spatially by qualitative companson. Further years of study are warranted to test whether geomatics and remote sensing tools can be used to monitor Niagara vineyard conditions in all years, no matter how abnormal the weather. There was clear variability in all of the vineyard sites, and the lack of relationships between the spatially delineated water status zones and the variation in the fruit and wine suggests that water status in combination with other factors such as soil type should be combined in a more complex model of within vineyard terroir. The alternate measurements of vine vigour taken in 2009 were not successful. The risk of missing data, as was the case in 2009, suggests that alternate vigour measurements should be further explored. Other methods of measuring vine vigour, such as shoot length, trunk cross-sectional area and leaf chlorophyll content used by Cortell et al. (2007a, 2007b, 2008) may prove more reliable than weight of cane pruning alone. Other potential sources of variation within vineyards of potential interest to winemakers include the variability of yeast assimilable nitrogen compounds, and differences in vineyard temperature, especially through the winter and spring frost periods. The degree of cold experienced by a vine, and its ability to survive the exposure, may be linked to soil and moisture, as well as the topography of the vineyard. PV and remote sensing could playa role in monitoring and acting on any of these factors, and more, in Niagara and around the world. 142
143 6.1 Literature Cited Acevedo-Opazo, c., Tisseyre, B., Guillaume, S., Ojeda, H The potential of high spatial resolution information to define within-vineyard zones related to vine water status. Precision Agric.. 9: Cortell, J., Halbleib, M., Gallagher, A, Righetti, T., Kennedy, J. 2007a. Influence of vine vigour on grape (Vitis vinifera L. cv. Pinot noir) anthocyanins. 1. Anthocyanin concentration and composition in fruit. J. Agric. Food Chern. 55: Cortell, J., Halbleib, M., Gallagher, A, Righetti, T., Kennedy, J. 2007b. Influence of vine vigour on grape (Vitis vinifera L. cv. Pinot noir) anthocyanins. 2. Anthocyanins and pigmented polymers in wine. J. Agric. Food Chern. 55: Cortell, J., Siversten, H., Kennedy, 1., Heymann, H Influence of vine vigour on Pinot noir fruit composition, wine chemical analysis, and wine sensory attributes. Amer. J. Enol. Vitic. 59:1-10. Dobrowski, S., Ustin, S., Wolpert, J Grapevine dormant pruning weight prediction using remotely sensed data. Austral. J. Grape & Wine Res.. 9: Hall, A, Louis, J., Lamb, D Low-resolution remotely sensed images of wine grape vineyards map spatial variability in planimetric canopy area instead of leaf area index. Austral. J. Grape & Wine Res. 14:9-17. Hardie, W., Conisidine, J Response of grapes to water-deficit stress in particular stages of development. Amer. J. Enol. Vitic. 27: Koundouras, S., Marinos, V., Gkoulioti, A, Kosteridis, Y., Van Leeuwen, C Influence of vineyard location and vine water status on fruit maturation of nonirrigated cv. Agiorgitiko (Vitis vinifera L.). Effects on wine phenolic and aroma components. J. Agric. Food Chern. 54: Lamb, D., Weedon, M., Bramley, R Using remote sensing to predict grape phenolics at harvest in a Cabemet Sauvignon vineyard: timing observations against vine phenology and optimizing image resolution. Austral. J. Grape & Wine Res. 10: Reynolds, A, Lowrey, W., Tomek, L., Hakimi, J., desavigny, C Influence of irrigation on vine performance, fruit composition, and wine quality of Chardonnay in a cool, humid climate. Amer. J. Enol. Vitic. 58:
144 7.0 Supplemental Materials Table 7-1: Summary statistics for harvest components, grape composition, and vineyard soil variables for the Red Paw 1 Pinot noir vineyard, St. Davids, ON, Red Paw 1 Year Median Max Min CV (%} Spread a Yield (kg/vine) Cluster weight (g) Berry weight (g) Soluble solids (Brix) Berry ph TA (g/l) Vine size (kg) b Crop load (kg/kg) b Total anthocyanins (mg/l) Total phenols (mg/l) Colour (au) Hue (au) Mean soil moisture (%) Mean ' (bar) Clay (%) c Sand (%) c Silt (%) c OM (%) c CEC (meq/100g) c Soil ph c a Spread (Bramley 2005) is defined as the range (max-min) divided by the median, expressed as a percent. bpnming shoot weights were not measured in 2009 at this site. csoil samples were taken in 2008 only. 144
145 Table 7-2: Summary statistics for harvest components, grape composition, and vineyard soil variables for the Red Paw 2 Pinot noir vineyard, st. Davids, ON, Red Paw 2 Year Median Max Min CV {%) Spread a Yield (kg/vine) Cluster weight (g) Berry weight (g) Soluble solids (Brix) Berry ph TA (g/l) Vine size (kg) b Crop load (kg/kg) b Total anthocyanins (mg/l) Total phenols (mg/l) Colour (au) Hue (au) Mean soil moisture (%) Mean 'P (bar) c Clay(%) c Sand (%) c Silt (%) c OM (%) c CEC (meq/100g) c Soil ph a Spread (Bramley 2005) is defined as the range (max-min) divided by the median, expressed as a percent. bpruning shoot weights were not measured in 2009 at this site. csoil samples were taken in 2008 only. 145
146 Table 7-3: Summary statistics for harvest components, grape composition, and vineyard soil variables for the Black Paw Pinot noir vineyard, st. Davids, ON, Black Paw Year Median Max Min CV(%} Spread a Yield (kg/vine) Cluster weight (g) Berry weight (g) Soluble solids (Brix) Berry ph TA (g/l) Vine size (kg) b Crop load (kg/kg) b Total anthocyanins (mg/l) Total phenols (mg/l) Colour (au) Hue (au) Mean soil moisture (%) Mean ' (bar) c Clay (%) c Sand (%) c Silt (%) c OM (%) c CEC (meq/100g) c Soil ph a Spread (Bramley 2005) is defined as the range (max-min) divided by the median, expressed as a percent. bpruning shoot weights were not measured in 2009 at this site. csoil samples were taken in 2008 only. 146
147 Table 7-4: Summary statistics for harvest components, grape composition, and vineyard soil variables for the Lowrey's Pinot noir vineyard, St. Davids, ON, Lowrey's Year Median Max Min CV{%} Seread8 Yield (kg/vine) Cluster weight (g) Berry weight (g) Soluble solids (Brix) Berry ph TA (g/l) Vine size (kg) Crop load (kg/kg) Total anthocyanins (mg/l) Total phenols (mg/l) Colour (au) Hue (au) Mean soil moisture (%) Mean 'I' (bar) Clay (%) c C Sand (%) C Silt (%) C OM (%) CEC (meq/100g) _c C Soil ph a Spread (Bramley 2005) is defined as the range (max-min) divided by the median, expressed as a percent. csoil samples were taken in 2008 only. 147
148 Table 7-5: Means of yield components grouped by vigour status zone at four Pinot nair vineyard sites, St. Davids, ON, Vigour Status Category Red Paw 1 Low High Significance a Red Paw 2 Low High Significance Black Paw Low High Significance Lowrey's b 3.17a ** ns ns Yield (kg) No. of clusters Cluster weight (g) Berry weight (g) 2009 b b 28.7a ** ns ns ns ns ns b 1.71a ** 1.56b 1.66a ** 1.45b 1.56a ** Low 2.23b 2.39b 20.Ob 22.9a a b High 2.85a 2.88a 24.3a 29.1 b b a Significance *** ** *** **** ns * ns * amean separation at a=o.l using the LSD test *, **, ***, ****, ns: Significant at p~o.l, 0.05, 0.01, 0.001, not significant, respectively bin 2009, Lowrey's vineyard was the only site where pruning shoot weights were measured
149 Table 7-6: Means of soil and vine water status and weight of cane pruning grouped by vigour status zone at four Pinot noir vineyard sites, st. Davids, ON, Vigour Status Category Red Paw 1 Low High Significance a Red Paw 2 Low High Significance Black Paw Low High Significance Lowrey's Soil moisture (%) b ns ** **** 'I' (bar) Weight of cane pruning (kg) b a ns **** b a ns **** b a ns **** Low b 0.48b High O.77a 0.89a Significance ns ns ns ns **** **** amean separation at a=o.1 using the LSD test *, **, ***, ****, ns: Significant at p~o.i, 0.05, 0.01, 0.001, not significant, respectively bin 2009, Lowrey's vineyard was the only site where pruning shoot weights were measured. 149
150 Table 7-7: Means of berry composition (soluble solids, TA, and ph) grouped by vigour status zone at four Pinot noir vineyard sites, St. Davids, ON, Vigour Status Category Red Paw 1 Low High Significance a Red Paw 2 Low High Significance Black Paw Low High Significance Lowrey's Berry Brix ns 21.0b 22.0a *** ns 2009 b Berry T A (gil) ns ns ns ns 3.61b 3.64a ** 3: ns Berry ph 2009 Low b 3.46b 3.54 High a 3.48a 3.55 Significance ns ns ns ** * ns RMean separation at a=o.l using the LSD test *, **, ***, ****, ns: Significant at p:::.o.l, 0.05,0.01,0.001, not significant, respectively. bin 2009, Lowrey's vineyard was the only site where pruning shoot weights were measured. 150
151 Table 7-8: Means of berry composition (total anthocyanins, colour intensity, hue, and total phenols) grouped by vigour status zone at four Pinot noir vineyard sites, St. Davids, ON, Vigour Status Category Red Paw 1 Low High Significance a Red Paw 2 Low High Significance Black Paw Low High Significance Lowrey's Total anthocyanins (mg/l} b 271.3a 244.8b ** ns 369.3a 339.2b * Colour (au) a 9.0b * ns ns b 0.6a * ns ns Hue (au) 2009 Total phenols (mg/l) ns a b *** ns Low b High a Significance ns ns ns * ns ns ns ns amean separation at a.=0.1 using the LSD test *, **, ***, ****, ns: Significant at p~o.i, 0.05, 0.01, 0.001, not significant, respectively bin 2009, Lowrey's vineyard was the only site where pruning shoot weights were measured
152 Table 7-9: Means of soil variables grouped by vigour status zones at four Pinot noir vineyard sites, St. Davids, ON, Vigour Status Category Clay{%) Silt (%) Sand (%) OM{%) CEC (meq/100g) Soil ph Red Paw b Low 38.4b 58.1a High 35.5a 54.4b Significance a * ** ns ns ns ns Red Paw 2 Low High Significance ns ns ** ns ns ns Black Paw Low High Significance ** ns ** ns ns ns Lowrey's Low a b a b High b a b a Significance ns *** ns ns * * ns *** ns **** ns ns amean separation at a=0.1 using the LSD test *, **, ***, ****, ns: Significant at p:::"0.1, 0.05, 0.01, 0.001, not significant, respectively. bin 2009, Lowrey's vineyard was the only site where pruning shoot weights were measured. 152


")

153 Table 7-10: Pearson's correlation coefficients between yield components, berry composition and vineyard moisture and soil variables, 2008, at four Pinot noir vineyard sites, St. Davids, ON. Colour coding relates to significance (p-value) where yellow, blue and red represent p: ,0.01, and 0.05 respectively. 153


154 Table 7-11: Pearson's correlation coefficients between yield components, berry composition and vineyard moisture and soil variables, 2009, at four Pinot noir vineyard sites, St. Davids, ON. Colour coding relates to significance (p-value) where yellow, blue and red represent p::: ,0.01, and 0.05 respectively. 154
155 Table 7-12: Monthly rainfall for 2008 (Virgil, Ontario), 2009 (St. David's, Ontario) and average (St. Catharines, Ontario). Total rainfall over the growing season was less than the long term average in 2008, but above the average in June, July and August, key months in grape development Average April May June July August September October Total
 2009 actual vs.")
156 1.5 - m ::J (5 ~ ~ 0....c: en ~ ",'... ',.- :, '. ' <. _... _.J'., , ,:..., " " O- ~ ~ I o : ~ I 0.5 I 1 Shoot Wt. (kg) Predicted P<.0001 RSq=0.28 RMSE= I 1.5 Figure 7-1: Plot oflowrey's vineyard (Pinot noir, St. Davids, ON) 2009 actual vs. predicted weight of cane prunings (shoot weight) created using the multiple regression model of measured weight with cane diameter and internode length as model effects. The resulting R2 is 0.28, and the model was not accepted. 156
(i) ::!Ro ::r'~ (il s:il (I) <: 'T.I!K (I) _ S Q..~ ~!:! (I).... gel... '\" G-e'!\"l '-\" ~ (I) ~... N ~o (I) 0 00 ~.g '-\" ~ ~ <: cffi~.;-- ~ s:il ::I. o '\" S\" =to ~ [ N o 1.")
157 -VI -l 'C?'T.I g~ ' s (I),-,,-...1 '~ S ~ go s (I) S' r:n... - Q.. en! ~.~ 0:8 J" a 0(1) ~~......, 0 ~ ~ S"(I) c-. a o ::r' ::s (I)... ~[ ::r'<: '< s:il ~ g' '" '" ~ e' (I) 0 (;! '-.. o <: g s (j)(i) ::!Ro ::r'~ (il s:il (I) <: 'T.I!K (I) _ S Q..~ ~!:! (I).... gel... '" G-e'!"l '-" ~ (I) ~... N ~o (I) 0 00 ~.g '-" ~ ~ <: cffi~.;-- ~ s:il ::I. o '" S" =to ~ [ N o 1.0 Rain (mm) ~ ~ NNW W ~ ~ ~ o '" o ~ 0 ~ 0 ~ 0 ~ I---L----'----'----'----''--'--'----L--'------f 08/04/09 15/04/09 22/04/09 29/04/09 06/05/ / /05/09 03/06/09 10/06/09 17/06/091=~===. 24/ ,f ~ d ~ ~ ~~.!!l.colj3 (JJ al 3 co 0- i'l. a..a 08/07/09 1 " , ~ 15/07/09 22/07/09 if~~~=-: /07/ F ! 12108/09 19/08/09 "1=:==:::::=== , 26/08/09 02/09/09 i: ~ =======~ 09/09/ / /09/09 07/10/09 14/10/09 21/10/09 ~ 28/10/ o / / / / / / / c rr / / / / / / / '" Rain (mm) ~ ~ NNW W ~ ~ o ~ 0 ~ 0 ~ 0 ~ ~ 0 ::t: III ~ d?? ~ 3 ;c :J!Il. ~ -b 3' (JJ g 3 CD 3 - ::J a- U> :'i' cc

 g/berry 1.05 1.")
 Brix 15.5 16.5 17.5 18.5 19.5 20.5 21.")


158 (a) Yield (kg) (b) g/cluster (c) g/berry (d) Brix (e) Berry ph (f) BerryTA(g/L) Figure 7-3: Red Paw 1, 2008 vintage. Yield components and grape composition variables in a Pinot noir vineyard, St. Davids, ON. (a) yield per vine, kg; (b) cluster size, g; (c) berry size, g; (d) soluble solids, Brix; (e) berry ph; (t) berry TA, gil. o 10 20m rtj 158
 Intensity 5.5 6.5 7.5 8.5 9.5 10.")

 Shoot Weight kg 0 0.1 0.2 0.3 0.")
 Soil Moisture %9 10 11 12 13 14 15 16 17 18")

 total anthocyanins, mg/l; (b) colour intensity,")
159 (a) Anthocyanins mg/l (b) Intensity (c) Hue (d) Phenols mg/l ( e) Shoot Weight kg (f) Soil Moisture % Figure 7-4: Red Paw 1,2008 vintage. Grape composition, vine size, and soil moisture in a Pinot noir vineyard, St. Davids, ON. (a) total anthocyanins, mg/l; (b) colour intensity, ~2o+A520; (c) hue, ~201A52o; (d) total phenols, mg/l; (e) weight of cane prunings, kg; (f) Mean soil moisture, %. o m ~ 159


 % clay; (b) % silt; (c) % sand;")
160 (a) %Glay (b) %9~~~M~~~~WOO~~~M~OO~ (c) % Sand (d) Soil ph (e) % OM (t) GEG Figure 7-5: Red Paw Soil variables in a Pinot noir vineyard, St. Davids, ON. (a) % clay; (b) % silt; (c) % sand; (d) soil ph; (e) % organic matter; (1) cation exchange capacity, meqlloog. o 10 20m ~ 160

 glberry 1 1.1 1.2 1.3 1.")
 brix 15 16 17 18 19 20 21 22 23 24")


161 (a) Yield (kg) (b) glcluster (c) glberry (d) brix (e) Berry ph (f) BerryTA (gil) Figure 7-6: Red Paw 1,2009 vintage. Yield components and grape composition variables in a Pinot noir vineyard, St. Davids, ON. (a) yield per vine, kg; (b) cluster weight, g; (c) berry weight, g; (d) soluble solids, Brix; (e) berry ph; (f) berry T A, gil. o m ~ 161
 Hue 0.475 0.49 0.")
 Phenols mg/l 1600 1800 2000 2200 2400 2600 2800 3000 3200 3400 (e)")


162 (a) Anthocyan i ns mg/l (b) Intensity (c) Hue (d) Phenols mg/l (e) SoiIMoisture% Figure 7-7: Red Paw 1,2009 vintage. Grape composition, vine size, and soil moisture in a Pinot noir vineyard, St. Davids, ON. (a) total anthocyanins, mg/l; (b) colour intensity, ~2o+A5 20; (c) hue, ~201A52 0; (d) total phenols, mg/l; (e) mean soil moisture, %. 162 o 10 20m rtj


 (b) (c) Brix Berry")


 berry")
163 Y ield (kg) glcluster B B lob O.B (a) (b) (c) Brix Berry ph (d) (e) (1) Figure 7-8: Red Paw 2,2008 vintage. Yield components and grape composition variables in a Pinot noir vineyard, St. Davids, ON. (a) yield per vine, kg; (b) cluster weight, g; (c) berry weight, g; (d) soluble solids, Brix; (e) berry ph; (f) berry T A, gil. O~-1I!!2~O =====t 4!m' 163


 (b) (c) Phenols mg/l Shoot")


 total anthocyanins, mg/l;")
 hue, A420/As20; (d) total")
164 Anthocyanlns mg/l Hue BO O.B BO (a) (b) (c) Phenols mg/l Shoot Weight kg BOO (d) (e) (f) Figure 7-9: Red Paw 2,2008 vintage. Grape composition, vine size, and soil moisture in a Pinot noir vineyard, St. Davids, ON. (a) total anthocyanins, mg/l; (b) colour intensity, A420+As20; (c) hue, A420/As20; (d) total phenols, mg/l; (e) weight of cane prunings, kg; (t) mean soil moisture, %. o 20 4!rn 164


 (e) (f) Figure")

 % clay; (b) % silt; (c) %")
 cation")
165 % Clay % Silt % Sand (a) (b) (c) Soil ph eee ' ' ' (d) (e) (f) Figure 7-10: Red Paw Soil variables in a Pinot noir vineyard, St. Davids, ON. (a) % clay; (b) % silt; (c) % sand; (d) soil ph; (e) % organic matter; (f) cation exchange capacity, meq/100g. O~- 2C: o ==d()n 165

 (b) (c) Brix ph.\"- Beny 8erryTA 26 3.")


 yield per vine, kg; (b) cluster weight,")
166 Yield gfduster g/beny (kg) (a) (b) (c) Brix ph."- Beny 8erryTA B (d) (e) (f) Figure 7-11: Red Paw 2, 2009 vintage. Yield components and grape composition variables in a Pinot noir vineyard, St. Davids, ON. (a) yield per vine, kg; (b) cluster weight, g; (c) berry weight, g; (d) soluble solids, Brix; (e) berry ph; (f) berry T A, gil. O~-1III!!2~O==il40m' 166


 Figure 7-12: Red Paw 2,")


 colour intensity,")
167 H S. S 7.S 6.S S.S S O.S (a) (b) SolI Moisture % S 8.S 7.S 6.S S (e) Figure 7-12: Red Paw 2, 2009 vintage. Grape composition, and soil moisture in a Pinot noir vineyard, St. Davids, ON. (a) total anthocyanins, mg/l; (b) colour intensity, A420+A520; (c) hue, ~201A520; (d) total phenols, mg/l; (e) mean soil moisture, %. 167

 3.7 11.5 3.68 11 3.66 10.5 3.64 10 3.")

 '-r--r~ (e) (f) Figure")


 berry weight, g; (d)")
168 Yield (kg) (a) (b) (c) BerryTA Berry ph (gil) (d) '-r--r~ (e) (f) Figure 7-13: Black Paw, 2008 vintage. Yield components and grape composition variables in a Pinot noir vineyard, St. Davids, ON. (a) Yield per vine, kg; (b) cluster weight, g; (c) berry weight, g; (d) soluble solids, Brix; (e) berry ph; (t) berry T A, gil W20 m rtt


 weight of cane prunings, kg; (f) mean soil moisture, %. ~om ~ 169")
169 Anthocyanins mg/l Intensity Phenols mg/l Shoot Weight kg ( d) '--r----r------,---- ( e) L.., J Figure 7-14: Black Paw, 2008 vintage. Grape composition, vine size, and soil moisture in a Pinot noir vineyard, St. Davids, ON. (a) total anthocyanins, mg/l; (b) colour intensity, A420+As20; (c) hue, A420/As20; (d) total phenols, mg/l; (e) weight of cane prunings, kg; (f) mean soil moisture, %. ~om ~ 169
 '-r--,-----,.-----' ( c) '-r--,-----,.")


 % clay; (b) % silt; (c) % sand; (d) soil ph; (e)")
170 ( a) '-r--,-----,.-----' ( c) '-r--,-----,.-----' Soil ph Figure 7-15: Black Paw Soil variables in a Pinot noir vineyard, st. Davids, ON. (a) % clay; (b) % silt; (c) % sand; (d) soil ph; (e) % organic matter; (t) cation exchange capacity, meq/loog. 170 ~om rt

 '-r--~----' 3.7 25 9.5 9.3 24 9.1 3.6 23 8.9 22 8.")
 '-r--~----' ( e) '-r--,.")

 yield per vine, kg; (b) cluster weight, g; (c) berry")
171 g/cluster (a) '-r--~~ (b) '-r--,...,~ (c) '-r--~----' (d) '-r--~----' ( e) '-r--,...,----' (t) '-r--~----' Figure 7-16: Black Paw, 2009 vintage. Yield components and grape composition variables in a Pinot noir vineyard, St. Davids, ON. (a) yield per vine, kg; (b) cluster weight, g; (c) berry weight, g; (d) soluble solids, Brix; (e) berry ph; (f) berry TA, gil m ~

 c,--,---,----' (c)~~---.")


 total anthocyanins, mg/l; (b) colour")
172 ( a) c,--,---,----' (c)~~---.j (e) '--r----~- Figure 7-17: Black Paw, 2009 vintage. Grape composition, vine size, and soil moisture in a Pinot noir vineyard, St. Davids, ON. (a) total anthocyanins, mg/l; (b) colour intensity, A420+A520; (c) hue, A420/A520; (d) total phenols, mgll; ( e) mean soil moisture, % m ~

 f--------.")


 I-------.-- -,-----.")


 berry")
173 g/berry ( a) f , ' (c) I---~-~----' Brix I - (d) 1----,--- -,--- ( e) I ,-----.J (f) f-,---,--- Figure 7-18: Lowrey's, 2008 vintage. Yield components and grape composition variables in a Pinot noir vineyard, St. Davids, ON. (a) yield per vine, kg; (b) cluster weight, g; (c) berry weight, g; (d) soluble solids, Brix; (e) berry ph; (t) berry TA, gil C O ===4'0 m rt. 173

")


 total")
 colour intensity,")
 total")
174 Shoot Weight kg o (d) 1---,---,-----' (e) 1---,--, ' Figure 7-19: Lowrey's, 2008 vintage. Grape composition, vine size, and soil moisture in a Pinot noir vineyard, St. Davids, ON. (a) total anthocyanins, mg/l; (b) colour intensity, A420+As20; (c) hue, ~2o/As20; (d) total phenols, mg/l; (e) weight of cane prunings, kg; (t) mean soil moisture, %. 174


 f---")
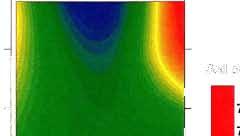
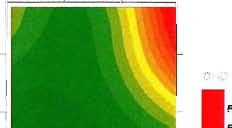
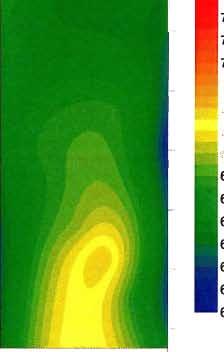
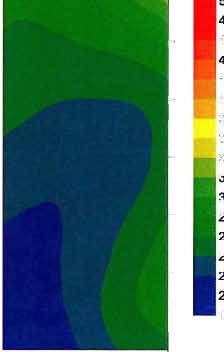
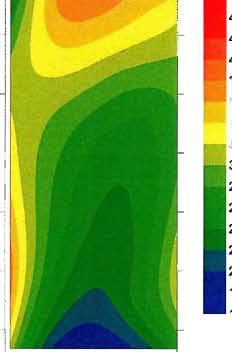
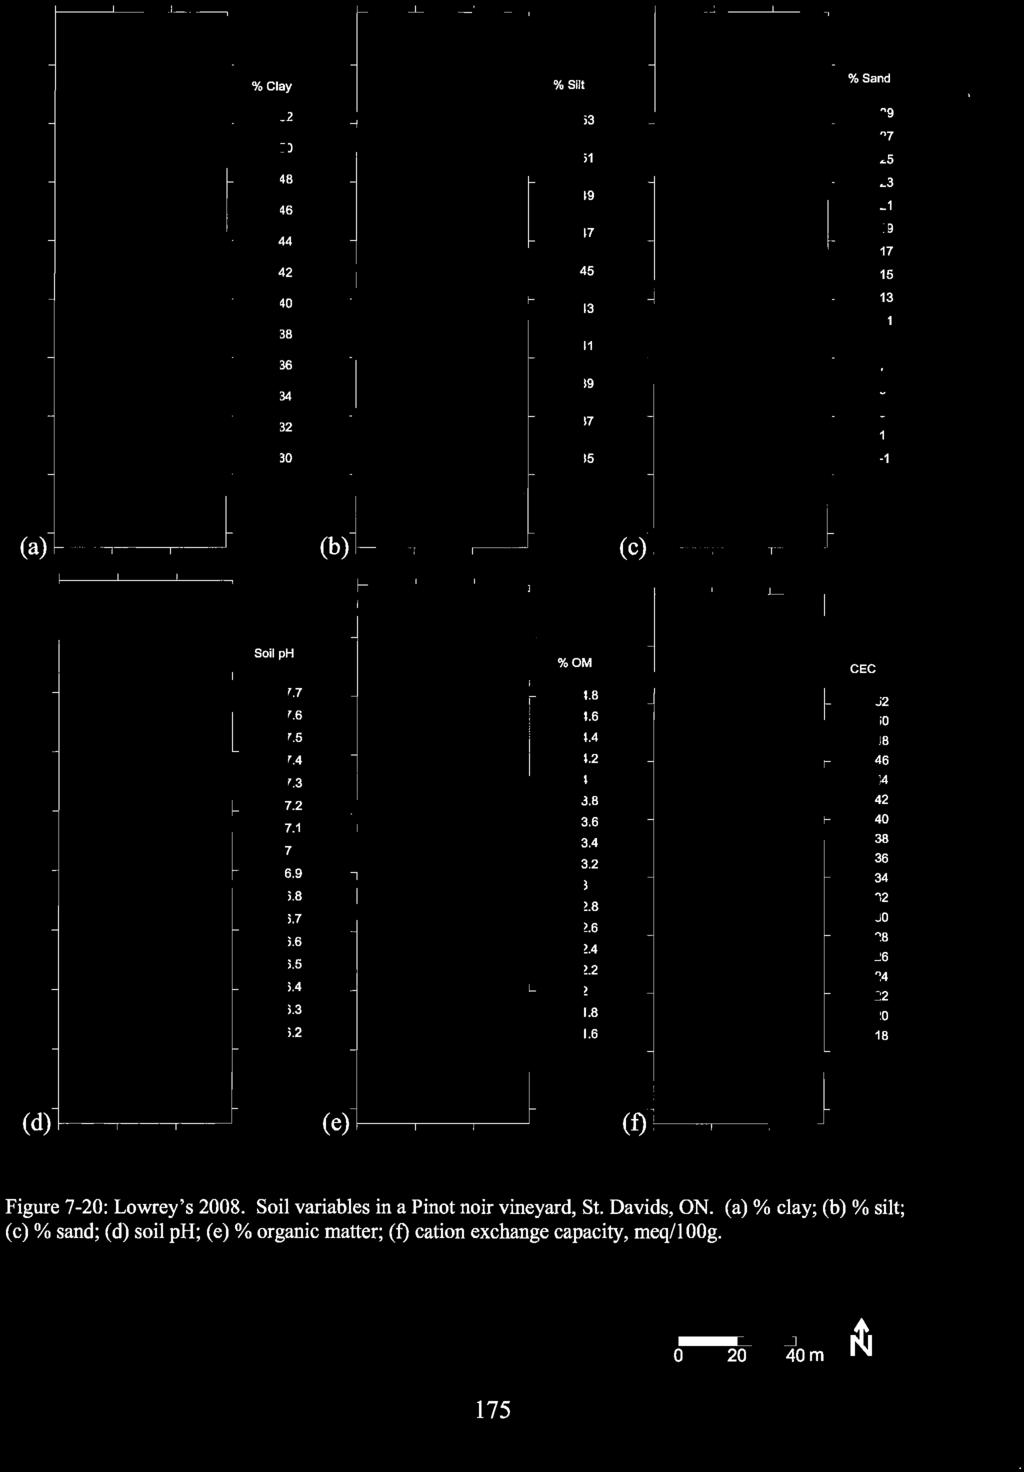
175 % Clay % Sill % Sand ( a) f , , J (b)!,,---_.-j (d) I-----r--,.---' Figure 7-20: Lowrey's Soil variables in a Pinot noir vineyard, St. Davids, ON. (a) % clay; (b) % silt; (c) % sand; (d) soil ph; (e) % organic matter; (f) cation exchange capacity, meq/ioog. 175

 f-----,- - --,-- --I (b) f--.. -,.---... -,--.")


 Yield per vine, kg; (b) Cluster weight,")
176 Yield (kg) g/cluster ( a) f-----,- - --,-- --I (b) f--.. -, ,--.--' (c) f--.-, , J Berry ph 3.68 Berry TA gil (d) 1--,--,----' (f) 1--,--,----' Figure 7-21: Lowrey's, 2009 vintage. Yield components and grape composition variables in a Pinot noir vineyard, St. Davids, ON. (a) Yield per vine, kg; (b) Cluster weight, glcluster; (c) Berry weight, g/berry; (d) Berry Brix; ( e) Berry ph; (f) Berry T A, gil. 176


 I--~-~----'")


 Hue,")
177 ( a) f-----,----,-----" (c) f--~-~--.j Shoot Weight kg Soil Moisture % (e) f-----,---,----- (t) I--~-~----' Figure 7-22: Lowrey's, 2009 vintage. Grape composition, vine size, and soil moisture in a Pinot noir vineyard, St. Davids, ON. (a) Total anthocyanins, mg/l; (b) Colour intensity, A420+As20; (c) Hue, ~2o/As20; (d) Total phenols, mg/l; (e) Shoot weight, kg; (f) Mean soil moisture, % L O ===4'0 m ~
178 Table 7-13: F-values and significance b of sensory attributes for Red Paw 1 Pinot noir wines, St. Davids, ON from the three-factor ANOV A with interactions. Red Paw 1: Source Tart fruit Sweet fruit Pepper Baking spice Tobacco Vegetal df sweet aroma of Variation aroma aroma spice aroma aroma aroma aroma Judge *** 41.04*** 28.13*** 18.18*** 49.15*** 15.06*** 10.12*** Wine * Rep Judge*wine ** Judge*rep ** Wine*rep Errore Red Paw 1: Source Red fruit Spices Vegetal Earthy of Variation flavour flavour flavour flavour Acidity Bitterness Astringency Judge 58.48*** 26.92*** 10.76*** 24.17*** 33.44*** *** 82.60*** Wine ** 1.32 Rep Judge*wine ** 1.75* Judge*rep * Wine*rep Error b *, **, ***: significant at p:::: 0.05,0.01,0.001 respectively C Error value is the mean square (MS) of the error term 178
179 Table 7-14: F-values and significance b of sensory attributes for Red Paw 2 Pinot noir wines, St. Davids, ON from the three-factor ANOVA with interactions. Red Paw 2: Source of Tart fruit Sweet fruit Pepper spice Baking spice Tobacco Vegetal df sweet aroma Variation aroma aroma aroma aroma aroma aroma Judge *** 24.72*** 41.88*** 13.78*** 49.98*** 33.44*** 33.77*** Wine * ** Rep *** Judge*wine Judge*rep * *** Wine*rep Error c Red Paw 2: Source Red fruit Spices Vegetal Earthy of Variation flavour flavour flavour flavour Acidity Bitterness Astringency Judge 31.89*** 26.07*** 20.91*** 58.03*** 64.82*** 92.16*** 47.67*** Wine Rep 6.69* Judge*wine Judge*rep 2.71* 2.33* Wine*rep Error c b *, **, ***: significant at p:::' 0.05,0.01,0.001 respectively C Error value is the Mean Square (MS) of the Error term 179
180 Table 7-15: F-values and significance b of sensory attributes for Lowrey's Pinot noir wines, St. Davids, ON from the tbree-factor ANOV A with interactions. Lowrey's: Source of Tart fruit Sweet fruit Pepper spice Baking spice Tobacco Vegetal df sweet aroma Variation aroma aroma aroma aroma aroma aroma Judge *** 11.36*** 4.59*** 8.40*** 20.09*** 10.77*** 14.89*** Wine * ** Rep ** * Judge*wine * *** Judge*rep Wine*rep Error c Lowrey's: Source of Red fruit Spices Vegetal Earthy Variation flavour flavour flavour flavour Acidity Bitterness Astringency Judge 23.10*** 13.44*** 14.68*** 31.64*** 43.64*** 32.77*** 25.92*** Wine * Rep * Judge*wine *** * 1.49* 1.23 Judge*rep * * Wine*rep Error c b *, **, ***: significant at p~ 0.05,0.01,0.001 respectively C Error value is the mean square (MS) of the error term 180
181 Table 7-16: F-values and significance b of sensory attributes for Pinot noir wines, St. Davids, ON from the single-factor ANOV A of water status zone for each of three vineyard blocks. Source of Variation df Tart fruit Sweet fruit Pepper spice Baking spice Tobacco Vegetal sweet aroma aroma aroma aroma aroma aroma aroma Red Paw 1 Water status zone Error Red Paw 2 Water status zone Error Lowrey's Water status zone * Error c Source of Variation Red fruit Spices Vegetal Earthy flavour flavour flavour flavour Acidity Bitterness Astringency Red Paw 1 Water status zone Error Red Paw 2 Water status zone Error Lowrey's Water status zone Error c b *, **, ***: significant at p~ 0.05, 0.01,0.001 respectively. C Error value is the mean square (MS) of the error term 181
182 Table 7-17: Means of descriptive analysis aroma attributes by wine; 2008 Pinot non wines from Red Paw 1, Red Paw 2 and Lowrey's vineyards, St. Davids, ON. Wine T::~~it S:~:!:~Uit sweet aroma :~~~r :~~~ T:~o~~O ~~~::I Red Paw 1 High b High a High a Low ab Low ab Low ab Significance m ns ns * ns ns ns ns Red Paw 2 High bc a High abc ab High ab bc Low c a Low ab c Low a Significance ns * ns ns ns ns ** Lowrey's High c abc High abc abc High abc ab Medium abc cde Medium bc a Medium abc abcd Low ab e Low a de Low ab bcde Significance ns * ns ns ns ns ** d Mean separation at a=0.05 using the LSD test; *, **, ***, ns: Significant at p::: 0.05, 0.01,0.001, not significant, respectively. 182
183 Table 7-18: Means of descriptive analysis flavour, taste & mouthfeel attributes by wine; 2008 Pinot noir wines from Red Paw 1, Red Paw 2 and Lowrey's vineyards, St. Davids, ON. W. Red fruit Spices Vegetal Earthy.... me flavour flavour flavour flavour ACidity Bitterness Astrmgency Red Paw 1 High b 3.28 High a 3.37 High b 3.42 Low b 2.84 Low b 3.34 Low b 3.07 Significance m ns ns ns ns ns ** ns Red Paw 2 High High High Low Low Low Significance ns ns ns ns ns ns ns Lowrey's High abc High bc High ab Medium abc Medium c Medium ab Low abc Low ab Low a Significance ns * ns ns ns ns ns d Mean separation at a=0.05 using the LSD test; *, **, ***, ns: Significant at p~ 0.05,0.01,0.001, not significant, respectively. 183
184 Table 7-19: Pixel values extracted from the rectangle shown in Figure 7-25,derived from Red Paw 2 Pinot noir vineyard site, St. Davids, ON, The bolded values are the pixels which would be chosen as the seed point for data extraction, based on the highest local NIR band reflectance. The shaded pixels represent those that are most likely to be all vine area. Note that the NIR and NOVI band values are highest at the pixels that are between the two vine rows, and in the case of the row on the left, taking the highest NOVI value as the seed point would also include negative NOVI values when expanded. Band Pixel Value Table 7-20: Pixel values from the rectangle in Figure 7-26, derived from Red Paw 2 Pinot noir vineyard site, st. Davids, ON,2009. The NOVI when calculated on a pixel-by-pixel basis is 0.212, and when calculated from the re-sampled NIR and red waveband the NOVI is 0.186; they are not equivalent operations. NIR RED NOVI
185 Table 7-21: Means ofndvi-red extracted from 2008 & 2009 airborne images in four Pinot noir vineyard sites, st. Davids, ON, 2008 and 2009 with vines grouped by vigour status zone. Images were re-sampled at lxi, 3x3, and 5x5 pixel target areas. Vigour Status Category Red Paw 1 Low High Significance a Red Paw 2 Low High Significance Black Paw Low High Significance Lowrey's 200B ns ns 0.04a 0.01b *** NDVI-red 1x1pixel 2009 b NDVI-red NDVI-red 3x3pixel 5x5pixel 200B B b a ns * 0.11 O.OB 0.11 O.OB ns ns -0.04a -0.04a -0.07b -0.07b *** ** Low B High B 0.10 Significance ns ns ns ns ns ns amean separation at a=o.1 using the LSD test *, **, ***, ****, ns: Significant at p< 0.1, 0.05,0.01,0.001, not significant, respectively bin 2009, Lowrey's vineyard was the only site where pruning shoot weights were measured 185
186 Table 7-22: Means ofndvi-green extracted from 2008 & 2009 airborne images in four Pinot noir vineyard sites, St. Davids, ON, 2008 and 2009 with vines grouped by vigour status zone. Images were re-sampled at lxi, 3x3, and 5x5 pixel target areas. Vigour Status Category Red Paw 1 Low High Significance a Red Paw 2 Low High Significance Black Paw Low High Significance Lowrey's NDVI-green 1x1pixel g b ns ns -0.05a -0.07b * NDVI-green 3x3pixel ns ns -0.11a -0.13b ** NDVI-green 5x5pixel ns ns ":0.11 ns Low b b High a a Significance ns ** ns ns ns * amean separation at a=o.l using the LSD test *, **, ***, ****, ns: Significant at p~o.i, 0.05, 0.01, 0.001, not significant, respectively bin 2009, Lowrey's vineyard was the only site where pruning shoot weights were measured 186


187 Table 7-23: Pearson's correlation coefficients between descriptive analysis attributes, 2008 Pinot noir wines from Red Paw 1, Red Paw 2 and Lowrey's vineyards, St. Davids, ON. Colour coding relates to significance (pvalue) where yellow, blue and red represent p~ ,0.01, and 0.05 respectively. Descriptors in upper case letters are flavour attributes. 187
188 Table 7-24: Pearson correlation coefficient ofndvi-red extracted from airborne images against mean 'I' for lxi, 3x3, and 5x5 pixel sample sizes centred over sentinel vines in four Pinot noir vineyard sites, st. Davids, ON, 2008 and NDVI R 1x1 3x3 5x5 1x1 3x3 5x5 rvalue Significance 29 May July July < Aug June Aug Se~t Table 7-25: Pearson correlation coefficient ofndvi-green extracted from airborne images against mean 'I' for lxi, 3x3, and 5x5 pixel sample sizes centred over sentinel vines from in four Pinot noir vineyard sites, St. Davids, ON, 2008 and NDVI-G 1x1 3x3 5x5 1x1 3x3 5x5 rvalue Significance 29 May July July Aug June Aug Se~t
189 Table 7-26: Pearson correlation coefficient ofndvi-red extracted from airborne images against weight of cane prunings for lxi, 3x3, and 5x5 pixel sample sizes centred over sentinel vines from in four Pinot noir vineyard sites, St. Davids, ON, 2008 growing season a NDVI-R 1x1 1x1 3x3 5x5 3x3 5x5 r value Significance 29 May July July < Aug < afollowing the 2009 growing season, Lowrey's vineyard was the only site where weight of cane prunings were measured. Table 7-27: Pearson correlation coefficient ofndvi-green extracted from airborne images against weight of cane prunings for lxi, 3x3, and 5x5 pixel sample sizes centred over sentinel vines in four Pinot noir vineyard sites, St. Davids, ON, 2008 growing season a NDVI-G 1x1 1x1 3x3 5x5 3x3 5x5 r value Significance 29 May July July < Aug afollowing the 2009 growing season, Lowrey's vineyard was the only site where weight of cane prunings were measured. 189
190 Table 7-28: Pearson correlation coefficient ofndvi-red extracted from airborne images against berry total phenols for lxi, 3x3, and 5x5 pixel sample sizes centred over sentinel vines in four Pinot noir vineyard sites, St. Davids, ON, 2008 and NDVI-R 1x1 3x3 5x5 1x1 3x3 5x5 rvalue Significance 29 May <.0001 <.0001 < July <.0001 <.0001 < July Aug June Aug Se~t <.0001 <.0001 <.0001 Table 7-29: Pearson correlation coefficient ofndvi-green extracted from airborne images against berry Total Phenols for lxi, 3x3, and 5x5 pixel sample sizes centred over sentinel vines in four Pinot noir vineyard sites, st. Davids, ON, 2008 and NDVI-G 1x1 3x3 5x5 1x1 3x3 5x5 rvalue Significance 29 May <.0001 <.0001 < July < July Aug June Aug Se~t <.0001 <.0001 <
191 Table 7-30: Pearson correlation coefficient ofndvi-red extracted from airborne images against berry Total Anthocyanins for lxi, 3x3, and 5x5 pixel sample sizes centred over sentinel vines in four Pinot noir vineyard sites, st. Davids, ON, 2008 and NDVI-R 1x1 3x3 5x5 1x1 3x3 5x5 rvalue Significance 29 May <.0001 <.0001 < July <.0001 <.0001 < July < Aug <.0001 < June <.0001 <.0001 < Aug <.0001 <.0001 < Sept <.0001 <.0001 <.0001 Table 7-31: Pearson correlation coefficient ofndvi-green extracted from airborne images against berry total anthocyanins for lxi, 3x3, and 5x5 pixel sample sizes centred over sentinel vines from in four Pinot noir vineyard sites, st. Davids, ON, 2008 and NDVI-G 1x1 3x3 5x5 1x1 3x3 5x5 rvalue Significance 29 May <.0001 <.0001 < July <.0001 <.0001 < July Aug June <.0001 <.0001 < Aug <.0001 <.0001 < Sept <.0001 <
 where yellow, blue and red represent p~ 0.")


192 Table 7-32: Pearson correlation coefficients between seasonal mean vegetation indices from airborne images and yield components and berry composition in four Pinot noir vineyard sites, St. Davids, ON, Colour coding relates to significance (p-value) where yellow, blue and red represent p~ ,0.01 and 0.05 respectively. Yield No. clusters g/cluster g/berry Berry ph Berry Brix BerryTA Shootwt. Crop load Anthocyanins Colour Hue Phenols Soil moisture 'P NR 1x1 NR3x3 NR5x5 NG 1x1 NG3x3 NG 5x5 Mean NDVI-red Mean NDVI-green - 1x1 3x3 5x5 1x1 3x3 5x5 _ _ _ _

 where yellow, blue and red represent p:s 0.0001, 0.")


193 Table 7-33: Pearson correlation coefficients between seasonal mean vegetation indices from airborne images and yield components and berry composition in four Pinot noir vineyard sites, St. Davids, ON, Colour coding relates to significance (p-value) where yellow, blue and red represent p:s , 0.01 and 0.05 respectively. Mean NDVI-red Mean NDVI-green 3x3 5x5 1x1 3x3 Yield No. clusters g/cluster g/berry Berry ph Berry Brix BerryTA Anthocyanlns Colour Hue Phenols Soli moisture ' NR 1x NR3x NR5x NG 1x NG3x NG5x


194 (a) (b) Figure 7-23: CIR image of the same portion of Red Paw 2 Pinot noir vineyard, 8t. Davids, ON from (a) 22 June 2009 and (b) 5 August Note that the blue/green of bare soil is replaced with dark red vegetation. r: = r- 2000,...,= ~ r r : ::J o (),... r-r- r ~ F _r- ".. F 500 r-..a o {, ~ NOVI Figure 7-24: Histogram ofndvi values extracted from Red Paw 2 Pinot noir vineyard block, 8t. Davids, ON, June 22, The presence of inter-row vegetation means that a threshold value cannot be used to differentiate vines from inter-row spaces, both vines and non-vine vegetation is present at all values ofndvi. 194


195 (a) (b) Figure 7-25: (a) CIR and (b) NDVI images from Red Paw 2, Pinot noir vineyard, St. Davids, ON, June 22, The values of the pixels in the rectangle are given in Table 7-19, and indicate that the highest NIR or NDVI alone cannot be used to identify the representative "vine" pixel for data extraction. Figure 7-26: CIR image of Red Paw 2 vineyard, 1 September The values of the pixels in the rectangle are given in Table 7-20, and show that taking the mean NDVI on a pixel-by-pixel basis is not equivalent to resampling the individual wavebands and then calculating NDVI. 195
Airborne Remote Sensing for Precision Viticulture in Niagara. Ralph Brown School of Engineering University of Guelph
 Airborne Remote Sensing for Precision Viticulture in Niagara Ralph Brown School of Engineering University of Guelph Why the interest in precision viticulture? Highly variable regions in Niagara due to
Applied Geomatics--connecting the dots between grapevine physiology,
 Applied Geomatics--connecting the dots between grapevine physiology, terroir, and remote sensing Andrew Reynolds, Brock University Ralph Brown, University of Guelph Matthieu Marciniak; David Ledderhoff;
INVESTIGATIONS INTO THE RELATIONSHIPS OF STRESS AND LEAF HEALTH OF THE GRAPEVINE (VITIS VINIFERA L.) ON GRAPE AND WINE QUALITIES
 ON GRAPE AND WINE QUALITIES") INVESTIGATIONS INTO THE RELATIONSHIPS OF STRESS AND LEAF HEALTH OF THE GRAPEVINE (VITIS VINIFERA L.) ON GRAPE AND WINE QUALITIES by Reuben Wells BAgrSc (Hons) Submitted in fulfilment of the requirements
INVESTIGATIONS INTO THE RELATIONSHIPS OF STRESS AND LEAF HEALTH OF THE GRAPEVINE (VITIS VINIFERA L.) ON GRAPE AND WINE QUALITIES by Reuben Wells BAgrSc (Hons) Submitted in fulfilment of the requirements
Vineyard Water Management
 Vineyard Water Management Pierre Helwi Texas A&M AgriLife Extension Service Grape Camp November 7, 2016 Lady Bird Johnson Park Pioneer Pavilion, Fredericksburg, TX Terroir Concept Climate Human factor
Late season leaf health CORRELATION OF VINEYARD IMAGERY WITH PINOT NOIR YIELD AND VIGOUR AND FRUIT AND WINE COMPOSITION. 6/22/2010
 // Not all vineyard blocks are uniform This is because of soil variation primarily, especially in factors which affect the supply of water This has a direct effect on vine vigour, which in turn has a direct
Session 4: Managing seasonal production challenges. Relationships between harvest time and wine composition in Cabernet Sauvignon.
 Session 4: Managing seasonal production challenges Relationships between harvest time and wine composition in Cabernet Sauvignon Keren Bindon Cristian Varela, Helen Holt, Patricia Williamson, Leigh Francis,
is pleased to introduce the 2017 Scholarship Recipients
 is pleased to introduce the 2017 Scholarship Recipients Congratulations to Elizabeth Burzynski Katherine East Jaclyn Fiola Jerry Lin Sydney Morgan Maria Smith Jake Uretsky Elizabeth Burzynski Cornell University
Joseph G. Alfieri 1, William P. Kustas 1, John H. Prueger 2, Lynn G. McKee 1, Feng Gao 1 Lawrence E. Hipps 3, Sebastian Los 3
 Joseph G. Alfieri 1, William P. Kustas 1, John H. Prueger 2, Lynn G. McKee 1, Feng Gao 1 Lawrence E. Hipps 3, Sebastian Los 3 1 USDA, ARS, Hydrology & Remote Sensing Lab, Beltsville MD 2 USDA,ARS, National
March 2017 DATA-DRIVEN INSIGHTS FOR VINEYARDS
 March 2017 DATA-DRIVEN INSIGHTS FOR VINEYARDS What do great wine, water on mars and drones have in common? Today: Drone Technologies in Viticulture AGENDA Technology Context: big data, precision ag, drones
World of Wine: From Grape to Glass
 World of Wine: From Grape to Glass Course Details No Prerequisites Required Course Dates Start Date: th 18 August 2016 0:00 AM UTC End Date: st 31 December 2018 0:00 AM UTC Time Commitment Between 2 to
OUTLINE Plan of the talk. Introduction Vineyards are variable in space The efficient vineyard project. The field site in Sonoma Results
 UCCE Sonoma County Grape Day February 8, 2017 Assessing variability in the vineyard through a spatially explicit selective-harvest approach A case study in Sonoma L. Brillante, A. Beebee, R. Yu, J. Martinez,
1. Continuing the development and validation of mobile sensors. 3. Identifying and establishing variable rate management field trials
 Project Overview The overall goal of this project is to deliver the tools, techniques, and information for spatial data driven variable rate management in commercial vineyards. Identified 2016 Needs: 1.
The Implications of Climate Change for the Ontario Wine Industry
 The Implications of Climate Change for the Ontario Wine Industry Tony B. Shaw Department of Geography and Cool Climate Oenology and Viticulture Institute Brock University Climate Change Most scientists
LAKE ONTARIO BEAMSVILLE BENCH VINEMOUNT RIDGE STATISTICS
 APPELLATION MAP Appellation Overview Diverse terroir, vine friendly micro climates, remarkably complex wines The Niagara Peninsula has the largest planted area of all viticulture areas in Canada. Situated
Wine-Tasting by Numbers: Using Binary Logistic Regression to Reveal the Preferences of Experts
 Wine-Tasting by Numbers: Using Binary Logistic Regression to Reveal the Preferences of Experts When you need to understand situations that seem to defy data analysis, you may be able to use techniques
World of Wine: From Grape to Glass Syllabus
 World of Wine: From Grape to Glass Syllabus COURSE OVERVIEW Have you always wanted to know more about how grapes are grown and wine is made? Perhaps you like a specific wine, but can t pinpoint the reason
New tools to fine-tune quality harvests : spectroscopy applications in viticulture. Ralph Brown, PhD, PEng CCOVI Associate Fellow
 New tools to fine-tune quality harvests : spectroscopy applications in viticulture Ralph Brown, PhD, PEng CCOVI Associate Fellow 1. Visible/NIR Spectroscopy of Grapes Interaction of matter with light (absorbance,
Do lower yields on the vine always make for better wine?
 Grape and wine quality Increasing quality Do lower yields on the vine always make for better wine? Nick Dokoozlian Viticulture, & Enology E&J Gallo ry Do lower yields on the vine always make for better
ARIMNet2 Young Researchers Seminar
 ARIMNet2 Young Researchers Seminar How to better involve end-users throughout the research process to foster innovation-driven research for a sustainable Mediterranean agriculture at the farm and local
Research Report: Use of Geotextiles to Reduce Freeze Injury in Ontario Vineyards
 Research Report: Use of Geotextiles to Reduce Freeze Injury in Ontario Vineyards Prepared by Dr. Jim Willwerth CCOVI, Brock University February 26, 20 1 Cool Climate Oenology & Viticulture Institute Brock
Monitoring Ripening for Harvest and Winemaking Decisions
 Joseph A. Fiola, Ph.D. Specialist in Viticulture and Small Fruit Western MD Research & Education Center 18330 Keedysville Road Keedysville, MD 21756-1104 301-432-2767 ext. 344; Fax 301-432-4089 jfiola@umd.edu
Spatial Variability in Ontario Pinot noir Vineyards: Use of Geomatics and Implications for Precision Viticulture
 Spatial Variability in Ontario Pinot noir Vineyards: Use of Geomatics and Implications for Precision Viticulture David Ledderhof, 1 Andrew G. Reynolds, 2 * Ralph Brown, 3 Marilyne Jollineau, 4 and Elena
Lesson 2 The Vineyard. From Soil to Harvest
 Lesson 2 The Vineyard From Soil to Harvest Objectives After reading this chapter, you should be able to display an understanding of how grapes are grown for wine production. describe the annual growing
Quality of Canadian oilseed-type soybeans 2017
 ISSN 2560-7545 Quality of Canadian oilseed-type soybeans 2017 Bert Siemens Oilseeds Section Contact: Véronique J. Barthet Program Manager, Oilseeds Section Grain Research Laboratory Tel : 204 984-5174
Colorado State University Viticulture and Enology. Grapevine Cold Hardiness
 Colorado State University Viticulture and Enology Grapevine Cold Hardiness Grapevine cold hardiness is dependent on multiple independent variables such as variety and clone, shoot vigor, previous season
INFLUENCE OF ENVIRONMENT - Wine evaporation from barrels By Richard M. Blazer, Enologist Sterling Vineyards Calistoga, CA
 INFLUENCE OF ENVIRONMENT - Wine evaporation from barrels By Richard M. Blazer, Enologist Sterling Vineyards Calistoga, CA Sterling Vineyards stores barrels of wine in both an air-conditioned, unheated,
Increasing the efficiency of forecasting winegrape yield by using information on spatial variability to select sample sites
 Increasing the efficiency of forecasting winegrape yield by using information on spatial variability to select sample sites Andrew Hall, Research Fellow, Spatial Science Leo Quirk, Viticulture Extension
AN ENOLOGY EXTENSION SERVICE QUARTERLY PUBLICATION
 The Effects of Pre-Fermentative Addition of Oenological Tannins on Wine Components and Sensorial Qualities of Red Wine FBZDF Wine. What Where Why How 2017 2. October, November, December What the authors
Growing Cabernet Sauvignon at Wynns Coonawarra Estate
 Growing Cabernet Sauvignon at Wynns Coonawarra Estate The influence of vintage, clones and site Ben Harris Vineyard Manager Wynns Coonawarra Estate Coonawarra Red and White Winegrape Varieties Red (90%)
Vineyard mapping using remote sensing technologies
 Elif SERTEL, Dursun Zafer SEKER, Irmak YAY, Emre OZELKAN, Mehmet SAGLAM, Yilmaz BOZ, Arzu, Turkey Key words: remote sensing, vineyard mapping, SPOT-5, IKONOS, Worldview-2 SUMMARY This study investigates
Lack of irrigation in 2002 reduced Riesling crop in Timothy E. Martinson Finger Lakes Grape Program
 Lack of irrigation in 2002 reduced Riesling crop in 2003 Timothy E. Martinson Finger Lakes Grape Program Lailiang Cheng, Alan Lakso, Thomas Henick-Kling and Terry Acree Depts. Horticulture Ithaca, Horticultural
EFFECT OF TOMATO GENETIC VARIATION ON LYE PEELING EFFICACY TOMATO SOLUTIONS JIM AND ADAM DICK SUMMARY
 EFFECT OF TOMATO GENETIC VARIATION ON LYE PEELING EFFICACY TOMATO SOLUTIONS JIM AND ADAM DICK 2013 SUMMARY Several breeding lines and hybrids were peeled in an 18% lye solution using an exposure time of
Predicting Wine Quality
 March 8, 2016 Ilker Karakasoglu Predicting Wine Quality Problem description: You have been retained as a statistical consultant for a wine co-operative, and have been asked to analyze these data. Each
Regression Models for Saffron Yields in Iran
 Regression Models for Saffron ields in Iran Sanaeinejad, S.H., Hosseini, S.N 1 Faculty of Agriculture, Ferdowsi University of Mashhad, Iran sanaei_h@yahoo.co.uk, nasir_nbm@yahoo.com, Abstract: Saffron
IMPOSING WATER DEFICITS TO IMPROVE WINE QUALITY AND REDUCE COSTS
 IMPOSING WATER DEFICITS TO IMPROVE WINE QUALITY AND REDUCE COSTS Terry L. Prichard, Water Management Specialist University of California Davis 420 S. Wilson Way, Stockton, CA 95205 (209) 468-2085; fax
Effects of Plastic Covers on Canopy Microenvironment and Fruit Quality. Matthew Fidelibus Viticulture & Enology UC Davis
 Effects of Plastic Covers on Canopy Microenvironment and Fruit Quality Matthew Fidelibus Viticulture & Enology UC Davis Justification and importance Table grapes are costly to produce Late-harvested fruit
Gabriel Balint, MoSco. A Thesis. submitted to the Department of Biological Sciences. in partial fulfillment of the requirements.
 Impact of different irrigation strategies on grapes and wine quality of four grapevine cultivars (Vitis sp.) in cool climate conditions. An investigation into the relationships among ABA, water status,
Flavonoids in grapes. Simon Robinson, Mandy Walker, Rachel Kilmister and Mark Downey. ASVO SEMINAR : MILDURA, 24 July 2014 AGRICULTURE FLAGSHIP
 Flavonoids in grapes Simon Robinson, Mandy Walker, Rachel Kilmister and Mark Downey ASVO SEMINAR : MILDURA, 24 July 2014 AGRICULTURE FLAGSHIP Flavonoids in grapes Grape Flavonoids Flavonoids are important
Development of smoke taint risk management tools for vignerons and land managers
 Development of smoke taint risk management tools for vignerons and land managers Glynn Ward, Kristen Brodison, Michael Airey, Art Diggle, Michael Saam-Renton, Andrew Taylor, Diana Fisher, Drew Haswell
Your headline here in Calibri.
 Pruning and Training Principles for Balanced Vines Your headline here in Calibri. Larry Bettiga Viticulture Advisor Monterey, Santa Cruz and San Benito Counties Simple text is best. Don t read from your
Spatial variability in Ontario Cabernet Franc vineyards I. Interrelationships among soil composition, soil texture, soil and vine water status
 Journal Journal of Applied Horticulture, 16(1): 3-23, 2014 Appl Spatial variability in Ontario Cabernet Franc vineyards I. Interrelationships among soil composition, soil texture, soil and vine water status
Impact of Vineyard Practices on Grape and Wine Composition
 Impact of Vineyard Practices on Grape and Wine Composition James A. Kennedy UC Davis April 20, 2018 Davis, CA Outline Assumption: Managing wine composition in the vineyard is effective General thoughts
Final Report. TITLE: Developing Methods for Use of Own-rooted Vitis vinifera Vines in Michigan Vineyards
 Final Report TITLE: Developing Methods for Use of Own-rooted Vitis vinifera Vines in Michigan Vineyards PRINCIPAL INVESTIGATOR: Thomas J. Zabadal OBJECTIVES: (1) To determine the ability to culture varieties
Elderberry Ripeness and Determination of When to Harvest. Patrick Byers, Regional Horticulture Specialist,
 Elderberry Ripeness and Determination of When to Harvest Patrick Byers, Regional Horticulture Specialist, byerspl@missouri.edu 1. Ripeness is an elusive concept for many people a. Ripeness is often entirely
Influence of climate and variety on the effectiveness of cold maceration. Richard Fennessy Research officer
 Influence of climate and variety on the effectiveness of cold maceration Richard Fennessy Research officer What is pre-fermentative cold maceration ( cold soak ) and what are the benefits? Introduction
Archival copy. For current information, see the OSU Extension Catalog: https://catalog.extension.oregonstate.edu/em9070
 EM 9070 June 2013 How to Measure Grapevine Leaf Area Patricia A. Skinkis and R. Paul Schreiner Figure 1. A leaf area template can be easily made using typical office supplies. The template, above, is being
2012 BUD SURVIVAL SURVEY IN NIAGARA & ESSEX AREA VINEYARDS
 BUD SURVIVAL SURVEY IN NIAGARA & ESSEX AREA VINEYARDS Prepared for: The Grape Growers of Ontario KCMS - Applied Research and Consulting 1215 Maple St. Box#13 Fenwick, Ontario L0S 1C0 Telephone: (905) 892-7050
Geographic Information Systemystem
 Agenda Time 9:00:-9:20 9-20 9:50 9:50 10:00 Topic Intro to GIS/Mapping and GPS Applications for GIS in Vineyards Break Presenter Kelly Bobbitt, Mike Bobbitt and Associates Kelly Bobbitt, Mike Bobbitt and
Optimising harvest date through use of an integrated grape compositional and sensory model
 Optimising harvest date through use of an integrated grape compositional and sensory model Alain DELOIRE, Katja ŠUKLJE, Guillaume ANTALICK, Campbell MEEKS, John W. BLACKMAN & Leigh M. SCHMIDTKE National
Big Data and the Productivity Challenge for Wine Grapes. Nick Dokoozlian Agricultural Outlook Forum February
 Big Data and the Productivity Challenge for Wine Grapes Nick Dokoozlian Agricultural Outlook Forum February 2016 0 Big Data and the Productivity Challenge for Wine Grapes Outline Current production challenges
2015 BUD SURVIVAL SURVEY IN NIAGARA AREA VINEYARDS
 BUD SURVIVAL SURVEY IN NIAGARA AREA VINEYARDS Prepared for: The Grape Growers of Ontario KCMS - Applied Research and Consulting 1215 Maple St. P.O Box 13 Fenwick, Ontario L0S 1C0 Telephone: (905) 892-7050
Washington Wine Commission: Wine industry grows its research commitment
 PROGRESS EDITION MARCH 22, 2016 10:33 PM Washington Wine Commission: Wine industry grows its research commitment HIGHLIGHTS New WSU Wine Science Center a significant step up for industry Development of
Phenolics of WA State Wines*
 Phenolics of WA State Wines* Jim Harbertson Washington State University * And Grapes! Introduction Impacts of deficit irrigation on grape and wine phenolics Impacts of grape ripening on wine phenolic development
Oregon Wine Advisory Board Research Progress Report
 Grape Research Reports, 1996-97: Fermentation Processing Effects on Anthocyanin and... Page 1 of 10 Oregon Wine Advisory Board Research Progress Report 1996-1997 Fermentation Processing Effects on Anthocyanin
Flowering and Fruiting Morphology of Hardy Kiwifruit, Actinidia arguta
 Flowering and Fruiting Morphology of Hardy Kiwifruit, Actinidia arguta Chantalak Tiyayon and Bernadine Strik Department of Horticulture, Oregon State University 4017 ALS, Corvallis, OR 97331, USA Email:
Training system considerations
 Comparative results of three training systems in Winchester VVA Meeting: 13-15 Feb 2003 Tony K. Wolf Professor of Viticulture Training system considerations Why research training systems in Virginia? increase
Coffee weather report November 10, 2017.
 Coffee weather report November 10, 2017. awhere, Inc., an agricultural intelligence company, is pleased to provide this map-and-chart heavy report focused on the current coffee crop in Brazil. Global stocks
Healthy Soils for a Sustainable Viticulture John Reganold
 Healthy Soils for a Sustainable Viticulture John Reganold Department of Crop & Soil Sciences Pullman, W Sustainable Viticulture Economically viable Environmentally sound Socially responsible QuickTime
Berry = Sugar Sink. Source: Sink Relationships in the Grapevine. Source: Sink Relations. Leaf = Photosynthesis = Source
 Source: Sink Relationships in the Grapevine S. Kaan Kurtural Department of Viticulture and Enology Source: Sink Relations Leaf = Photosynthesis = Source Berry = Sugar Sink 2 3/4/2018 1 Sink growing apex
Research News from Cornell s Viticulture and Enology Program Research Focus Cornell Researchers Tackle Green Flavors in Red Wines
 Research News from Cornell s Viticulture and Enology Program Research Focus 2010-1 RESEARCH FOCUS Cornell Researchers Tackle Green Flavors in Red Wines Tim Martinson 1 and Justin Scheiner 2 1 Senior Viticulture
5. Supporting documents to be provided by the applicant IMPORTANT DISCLAIMER
 Guidance notes on the classification of a flavouring substance with modifying properties and a flavour enhancer 27.5.2014 Contents 1. Purpose 2. Flavouring substances with modifying properties 3. Flavour
Quality of Canadian oilseed-type soybeans 2016
 ISSN 1705-9453 Quality of Canadian oilseed-type soybeans 2016 Véronique J. Barthet Program Manager, Oilseeds Section Contact: Véronique J. Barthet Program Manager, Oilseeds Section Tel : 204 984-5174 Email:
Flavonoids in grapes. Simon Robinson, Mandy Walker, Rachel Kilmister and Mark Downey. 11 June 2014 PLANT INDUSTRY
 Flavonoids in grapes Simon Robinson, Mandy Walker, Rachel Kilmister and Mark Downey 11 June 2014 PLANT INDUSTRY Grapes to wine a 2 metabolic zoo Grapevines Hundreds of different metabolites determine Wine
Abstract. Keywords: Gray Pine, Species Classification, Lidar, Hyperspectral, Elevation, Slope.
 Comparison of Hyperspectral Gray Pine Classification to Lidar Derived Elevation and Slope Andrew Fritter - Portland State & Quantum Spatial - afritter@pdx.edu Abstract The gray pine (GP) tree has been
Using Growing Degree Hours Accumulated Thirty Days after Bloom to Help Growers Predict Difficult Fruit Sizing Years
 Using Growing Degree Hours Accumulated Thirty Days after Bloom to Help Growers Predict Difficult Fruit Sizing Years G. Lopez 1 and T. DeJong 2 1 Àrea de Tecnologia del Reg, IRTA, Lleida, Spain 2 Department
Determination of wine colour by UV-VIS Spectroscopy following Sudraud method. Johan Leinders, Product Manager Spectroscopy
 Determination of wine colour by UV-VIS Spectroscopy following Sudraud method Johan Leinders, Product Manager Spectroscopy 1 1. A bit of background Why measure the colour of wine? Verification of lot-to-lot
Winery Property in Niagara-on-the-Lake Vineyard/Production/Retail
 VIEW ONLINE Winery Property in Niagara-on-the-Lake Vineyard/Production/Retail Estate sale DeMoura Winery Way Property 545 Niagara Stone Road, Niagara-on-the-Lake, ON Asking Price: $1,700,000 > Gateway
Fleurieu zone (other)
") Fleurieu zone (other) Incorporating Southern Fleurieu and Kangaroo Island wine regions, as well as the remainder of the Fleurieu zone outside all GI regions Regional summary report 2006 South Australian
Fleurieu zone (other) Incorporating Southern Fleurieu and Kangaroo Island wine regions, as well as the remainder of the Fleurieu zone outside all GI regions Regional summary report 2006 South Australian
Buying Filberts On a Sample Basis
 E 55 m ^7q Buying Filberts On a Sample Basis Special Report 279 September 1969 Cooperative Extension Service c, 789/0 ite IP") 0, i mi 1910 S R e, `g,,ttsoliktill:torvti EARs srin ITQ, E,6
F&N 453 Project Written Report. TITLE: Effect of wheat germ substituted for 10%, 20%, and 30% of all purpose flour by
 F&N 453 Project Written Report Katharine Howe TITLE: Effect of wheat substituted for 10%, 20%, and 30% of all purpose flour by volume in a basic yellow cake. ABSTRACT Wheat is a component of wheat whole
Fruit maturity and quality. Azra Alikadić Web Valley 2016, San Lorenzo Dorsino
 Fruit maturity and quality Azra Alikadić Web Valley 2016, San Lorenzo Dorsino Quality - Quality implies the degree of excellence of a product or its suitability for a particular use. - Which combines:
Sustainable oenology and viticulture: new strategies and trends in wine production
 Sustainable oenology and viticulture: new strategies and trends in wine production Dr. Vassileios Varelas Oenologist-Agricultural Engineer Wine and Vine Consultant Sweden Aim of the presentation Offer
REASONS FOR THE RISE IN ALCOHOL LEVELS IN NAOUSSA PDO WINES. Presented by Yiannis Karakasis MW
 REASONS FOR THE RISE IN ALCOHOL LEVELS IN NAOUSSA PDO WINES Presented by Yiannis Karakasis MW THE FACTS Alsace +2% PA Napa Valley from 12.5% PA, grapes are currently being harvested above 14% COULD THIS
Grape Weed Control. Harlene Hatterman-Valenti North Dakota State University
 Grape Weed Control Harlene Hatterman-Valenti North Dakota State University The Northern Grapes Project is funded by the USDA s Specialty Crops Research Initiative Program of the National Institute for
Vintage 2006: Umpqua Valley Reference Vineyard Report
 Vintage 2006: Umpqua Valley Reference Vineyard Report Summary: The 2006 vintage started off slow with a cool, wet spring and was followed by a largely climatically favorable growing season. The summer
Effects of Leaf Removal and UV-B on Flavonoids, Amino Acids and Methoxypyrazines
 Effects of Leaf Removal and UV-B on Flavonoids, Amino Acids and Methoxypyrazines Professor Brian Jordan Centre for Viticulture & Oenology, Lincoln University What are the major factors to be considered
Michigan Grape & Wine Industry Council Annual Report 2012
 Michigan Grape & Wine Industry Council Annual Report 2012 Title: Determining pigment co-factor content in commercial wine grapes and effect of micro-oxidation in Michigan Wines Principal Investigator:
Remote Sensing of Vegetation Properties
 Remote Sensing of Vegetation Properties K. Tansey, H. Balzter, S. Johnson, Paul Arellano and many others Department of Geography University of Leicester kevin.tansey@le.ac.uk Research at the University
IT 403 Project Beer Advocate Analysis
 1. Exploratory Data Analysis (EDA) IT 403 Project Beer Advocate Analysis Beer Advocate is a membership-based reviews website where members rank different beers based on a wide number of categories. The
Increasing Toast Character in French Oak Profiles
 RESEARCH Increasing Toast Character in French Oak Profiles Beaulieu Vineyard 2006 Chardonnay Domenica Totty, Beaulieu Vineyard David Llodrá, World Cooperage Dr. James Swan, Consultant www.worldcooperage.com
Plant root activity is limited to the soil bulbs Does not require technical expertise to. wetted by the water bottle emitter implement
 Case Study Bottle Drip Irrigation Case Study Background Data Tool Category: Adaptation on the farm Variety: Robusta Climatic Hazard: Prolonged dry spells and high temperatures Expected Outcome: Improved
Quality of Canadian non-food grade soybeans 2014
 ISSN 1705-9453 Quality of Canadian non-food grade soybeans 2014 Ann S. Puvirajah Chemist, Oilseed Services Contact: Ann S. Puvirajah Chemist, Oilseeds Services Tel: 204-983-3354 Email: ann.puvirajah@grainscanada.gc.ca
Measured effects of elevated temperature on vine phenology, yield, berry and wine attributes
 Measured effects of elevated temperature on vine phenology, yield, berry and wine attributes Victor Sadras, Martin Moran & Paul Petrie South Australian R&D Institute, Treasury Wine Estates Funded by Grape
Relation between Grape Wine Quality and Related Physicochemical Indexes
 Research Journal of Applied Sciences, Engineering and Technology 5(4): 557-5577, 013 ISSN: 040-7459; e-issn: 040-7467 Maxwell Scientific Organization, 013 Submitted: October 1, 01 Accepted: December 03,
UTILIZATION OF PROXIMAL SENSING TECHNOLOGY (GREENSEEKER ) TO MAP VARIABILITY IN ONTARIO VINEYARDS
 TO MAP VARIABILITY IN ONTARIO VINEYARDS") UTILIZATION OF PROXIMAL SENSING TECHNOLOGY (GREENSEEKER ) TO MAP VARIABILITY IN ONTARIO VINEYARDS Andrew G. REYNOLDS 1*, Ralph BROWN 2, Elena KOTSAKI 1, Hyun-Suk LEE 1 1 Cool Climate Oenology and Viticulture
UTILIZATION OF PROXIMAL SENSING TECHNOLOGY (GREENSEEKER ) TO MAP VARIABILITY IN ONTARIO VINEYARDS Andrew G. REYNOLDS 1*, Ralph BROWN 2, Elena KOTSAKI 1, Hyun-Suk LEE 1 1 Cool Climate Oenology and Viticulture
Estimating and Adjusting Crop Weight in Finger Lakes Vineyards
 Estimating and Adjusting Crop Weight in Finger Lakes yards (Material handed out at a Finger Lakes grower twilight meeting July, 2001) Copyright 2001 Robert Pool Reviewed by Jodi Creasap Gee, 2011 Why estimate
Spatial variability in Ontario Cabernet franc vineyards. II. Yield components and their relationship to soil and vine water status
 Journal Journal of Applied Horticulture, 16(2): 87-102, 2014 Appl Spatial variability in Ontario Cabernet franc vineyards. II. Yield components and their relationship to soil and vine water status Andrew
VQA Ontario. Quality Assurance Processes - Tasting
 VQA Ontario Quality Assurance Processes - Tasting Sensory evaluation (or tasting) is a cornerstone of the wine evaluation process that VQA Ontario uses to determine if a wine meets the required standard
Grape Growers of Ontario Developing key measures to critically look at the grape and wine industry
 Grape Growers of Ontario Developing key measures to critically look at the grape and wine industry March 2012 Background and scope of the project Background The Grape Growers of Ontario GGO is looking
WALNUT HEDGEROW PRUNING AND TRAINING TRIAL 2010
 WALNUT HEDGEROW PRUNING AND TRAINING TRIAL 2010 Carolyn DeBuse, John Edstrom, Janine Hasey, and Bruce Lampinen ABSTRACT Hedgerow walnut orchards have been studied since the 1970s as a high density system
Practical Aspects of Crop Load and Canopy Management
 Practical Aspects of Crop Load and Canopy Management Jim Wolpert Extension Viticulturist Department of Viticulture and Enology University of California, Davis Penn State Grape Day August 10, 2011 Presentation
Mechanical Canopy and Crop Load Management of Pinot Gris. Joseph P. Geller and S. Kaan Kurtural
 Mechanical Canopy and Crop Load Management of Pinot Gris Joseph P. Geller and S. Kaan Kurtural 3.6 million tons of wine grapes grown in CA More than 50% comes from the San Joaquin Valley More than 60%
Varietal Specific Barrel Profiles
 RESEARCH Varietal Specific Barrel Profiles Beaulieu Vineyard and Sea Smoke Cellars 2006 Pinot Noir Domenica Totty, Beaulieu Vineyard Kris Curran, Sea Smoke Cellars Don Shroerder, Sea Smoke Cellars David
Canopy Management for Disease Control in Wine Grapes Grape IPM Workshop March, 2011
 Canopy Management for Disease Control in Wine Grapes Grape IPM Workshop March, 2011 Mark L. Chien State-wide Viticulture Educator Penn State Cooperative Extension mlc12@psu.edu Environmental and viticultural
HANDS-ON SOLUTIONS TO OVERCOME FAST GRAPE RIPENING
 HANDS-ON SOLUTIONS TO OVERCOME FAST GRAPE RIPENING 1 Techniques based on modification of growing and ripening pattern Increase of vine yield (> bud load) Late shoot trimming Late irrigation (i.e. just
October Dear Valued Partner, it is with great pleasure that we present Masseto 2014.
 2014 October 2017 Dear Valued Partner, it is with great pleasure that we present Masseto 2014. This vintage goes into our history books as one of the longest & latest harvests ever... even later than the
Understanding Nitrogen, Phosphorus, and Potassium in Grapes. R. Paul Schreiner USDA - ARS - HCRL Corvallis, OR
 Understanding Nitrogen, Phosphorus, and Potassium in Grapes R. Paul Schreiner USDA - ARS - HCRL Corvallis, OR Research Profile Schreiner Lab Root Physiology in Grapes Defining & Characterizing AMF Diversity
Detecting Melamine Adulteration in Milk Powder
 Detecting Melamine Adulteration in Milk Powder Introduction Food adulteration is at the top of the list when it comes to food safety concerns, especially following recent incidents, such as the 2008 Chinese
LAST PART: LITTLE ROOM FOR CORRECTIONS IN THE CELLAR
 ROUSSEAU, OCHRATOIN A in WINES LITTLE ROOM FOR CORRECTIONS IN THE CELLAR, PAGE 1 OCHRATOIN A IN WINES: CURRENT KNOWLEDGE LAST PART: LITTLE ROOM FOR CORRECTIONS IN THE CELLAR Jacques Rousseau ICV Viticultural
Environmental Monitoring for Optimized Production in Wineries
 Environmental Monitoring for Optimized Production in Wineries Mounzer SALEH Applications Engineer Agenda The Winemaking Process What Makes a great a Wine? Main challenges and constraints Using Technology