Least Absolute Deviation Regression and Least Squares for Modeling Retention Indices of Set Compounds Food and Pollutants of the Environment
|
|
|
- Norah Hensley
- 5 years ago
- Views:
Transcription
1 American Journal of Applied Sciences Original Research Paper Least Absolute Deviation Regression and Least Squares for Modeling Retention Indices of Set Compounds Food and Pollutants of the Environment Fatiha Mebarki, Khadija Amirat, Salima Ali Mokhnach and Djellol Messadi Department of Chemistry, Laboratory of Environmental security and Food, Badji Mokhtar Annaba University, Annaba, Algeria Article history Received: Revised: Accepted: Correspondins Author: Khadija Amirat Department of Chemistry, Laboratory of Environmental security and Food, Badji Mokhtar Annaba University, Annaba, Algeria Abstract: Considering the importance of the statistical analysis of regression in modeling based separately on study for Quantitative structure retention indices on Carbowax 20 M (I Cw20M ) and OV-101 columns (I OV-101 ) relationships (QSRR) are determined for 114 pyrazines. The detection of influential observations for the standard least squares regression model is a problem which has been extensively studied. Least Absolute Deviation regression diagnostics offers alternative dicapproaches whose main feature is the robustness. Here a nonparametric method for detecting influential observations is presented and compared with other classical diagnostics methods. With have been applied for modeling separately retention indices of the same set of (89 pyrazines of Training and 25 of Test) eluted on Columns OV-101 and Carbowax-20M, using theoretical molecular descriptors derived from DRAGON Software and validating the results in the state approached graphically by Probability plot of the error and approached tests statistics of Anderson-Darling, in finished by the confidence interval thanks to robustness concept to check if errors distribution is really approximate. Keywords: Least Absolute Deviation Regression, Robustness, Outliers, Leverage Points, Tests Statistics, Environmental Introduction Since the 1970 the environment term is used to indicate the global Ecologic context, i.e., the whole of the conditions physical, chemical, biological climatic and geographic conditions, in which are developed living conditions and humans being in particular. Air, earth, water, natural resources, flora, fauna, people and their social interactions are included. The volatile heterocyclic constitute a significant family of odorous molecules, particularly interesting in the field of chemistry of the flavours and the odor can be regarded as a local pollution and a limited harmful effect to the bordering population of the potential sources. They represent more than one quarter of the volatile compounds characterized up to now in our food Pyrazines are heterocycles very present in our food. More than 80 derived from pyrazines are identified in a great number of cooked food, as bread, meat, torrefied coffee, the cocoa or hazel nuts; they are aromatizing compounds (Li et al., 2014; Buchbauer, 2000). Stanton and Jurs (1989), have used QSRR methodology to develop Models to link structural features of 107 pyrazines differently substituted, to their retention indices obtained up on two different polarities columns (OV-101 and Carbowax-20M). The equations have been calculated with the help of multilinear regression, the choice of the explanatory variables (topological, electronic and physical properties) being achieved by progressive elimination (Small and Jurs, 1983), among the 85 individual Molecular descriptors obtained for each whole molecule. The retention Indices (IR) obtained on each column are treated separately, while by drawing from the same sets of descriptors. The calculated models with 6 explanatory variables provide high standards errors (S = 23 units of index - u.i. - on OV-101 and S = u.i.up on Carbowax- (20 M) which do not predict good predictive capacities for these models, which let to suppose nonlinear relations between descriptors and property (IR) studied (Mebarki et al., 2016) Fatiha Mebarki, Khadija amirat, Salima Ali Mokhnach and Djellol messadi. This open access article is distributed under a Creative Commons Attribution (CC-BY) 3.0 license.
2 A large number of other estimation methods aimed at achieving robustness have been suggested and a considerable body of literature has developed. See for example, Gonin and Money (1989; Dodge, 1987) and the references therein. Generally the robust estimators in the literature can be classified as M-estimators, L- estimators, or R-estimators. Probably most attention has been paid to the Lestimators, for other type estimators, Judge et al. (1985). The robustness of Least Absolute Deviation method in relation with influential observations and its susceptibility to leverage point which are largely studied in literature (Dodge, 1987; 1997). We propose non parametric method Least Absolute Deviation (LAD) to detect the influential observations (aberrant and affect leverage) in comparison with least squares method. The tests of normality as whereas theory-driven methods include the normality test such Anderson Darling test. However, seier classified the test of normality into major categories test, empirical and normality distribution of the observed data. The Durbin-Watson statistic is conditioned on the order of the observations (rows). Minitab assumes that the observations are in a meaningful order, such as time order. The Durbin-Watson statistic determines whether or not the correlation between adjacent error terms is zero. To reach a conclusion from the test, you will need to compare the displayed statistic with lower and upper bounds in a table. If D > upper bound, no correlation exists; if D < lower bound, positive correlation exists; if D is in between the two bounds, the test is inconclusive. The objective of this work aims at using QSRR methodology, in the approach Method Least Absolute Deviation/Least Square (LAD/OLS), to model retention indices of (114) pyrazines (113 taken from Stanton and Jurs (1979) (1) and one compound (2- VinylPyrazine) taken from Mihara and Enomoto (1985), the molecular descriptors are only calculated starting from the chemical structure of the compounds. The linear statistical model for fixed effects will be examined relationships between retention index and different descriptors for two columns [(between retention indices of non polar column (OV- 101) and descriptor of Connectivity indices (are among the most popular topological indices (it is a descriptor of Structure- Activity Analysis), descriptor of Geometrical descriptors (representation of a molecule involves the knowledge of the relative positions of the atoms in 3D space) and descriptor of 3D-Molecule Representation of Structures based on Electron diffraction (3D- MoRSE); for relationships between retention index of polar column (CRW-20M) and descriptor of Connectivity indices (are among the most popular topological indices), descriptor of 2D autocorrelations (are molecular descriptors which describe how a considered property is distributed along a topological molecular structure) and descriptor of 3D-MoRSE (3D-Molecule Representation of Structures based on Electron diffraction)] by two robust methods for the evaluation of regression parameters starting from robust coefficients of regression most popular by the appendices. We have based ourselves on comparison between the two methods, application field (DA) will be discussed using Williams diagram which presents residues of standardized prediction according to the levers values (hi) (Eriksson et al., 2003; Tropsha et al., 2003). We present the state approached graphically by Probability plot of the error and approached statistics tests (Anderson-Darling), in finished by the confidence interval of compatibility at normal law to validated results of approached state between two methods for a risk α = 5% (Nornadiah and Yah, 2011; Damodar et al., 2009). Methodology The Data Set Molecular software Hyperchem 6.03 (AL-Noor and Asmaa, 2013) is used to represent the molecules, by employing semi-empirical method AM1 (Dewar et al., 1985; Holder, 1998) to obtain final geometries. The implied compounds in this study have the general structure 1. The retention data for the114 compounds chromate graphed on stationary phases OV-101 and CRW-20M have been taken from (113 taken from Stanton and Jurs (1979) (1) and 1 compound (2-VinylPyrazine) taken from (Mihara and Enomoto, 1985) and are enumerated in Table 1. Descriptor Generation The optimized geometries are transferred in software dragon from data-processing software version 5.4, for calculation of 1320 descriptors while operating on 89 pyrazines of test; subsets of descriptors are chosen by genetic algorithm, these descriptors can be separate in four categories: Topological, geometrical, physical and electronic descriptors have accounts of way and molecular indices of connectivity included. The geometrical descriptors included sectors of shade, the length with the reports/ratios of width, volumes of van der Waals, the surface and principal moments of inertia. The calculated descriptors of physical property included the molecular refringency of polariz ability and molar. The electronic descriptors included most positive and most negative described by Kaliszan. By employing the software Mobydigs (Todeschini et al., 2009) and by maximizing the coefficient of prédiction Q 2 and minimal R 2 of S (the error). 593
3 Table 1. Experimentally determined Retention Indices for pyrazines on OV-101 and Carbowax-20 M n Compounds ov-101 Compounds IR(cw) 1 Pyrazine 710 Pyrazine Methylpyrazine 801 Methylpyrazine ,3-dimethylpyrazine 897 2,3-dimethylpyrazine ,5-dimethylpyrazine 889 2,5-dimethylpyrazine ,6-dimethylpyrazine 889 2,6-dimethylpyrazine Trimethylpyrazine 981 Trimethylpyrazine Trimethylpyrazine 1067 Trimethylpyrazine Ethylpyrazine 894 Ethylpyrazine ethyl-5-methylpyrazine ethyl-5-methylpyrazine ethyl-6-methylpyrazine ethyl-6-methylpyrazine ,5-dimethyl-3-ethylpyrazine ,5-dimethyl-3-ethylpyrazine ,6-dimethyl-6-ethylpyrazine ,6-dimethyl-6-ethylpyrazine ,3-dimethyl-5-ethylpyrazine ,3-dimethyl-5-ethylpyrazine ,3-diethylpyrazine ,3-diethylpyrazine ,3-diethyl-5-methylpyrazine ,3-diethyl-5-methylpyrazine Propylpyrazine 986 Propylpyrazine methyl-3-propylpyrazine methyl-3-propylpyrazine ,3-dimethyl-5-propylpyrazine ,3-dimethyl-5-propylpyrazine ,5-dimethyl-3-propylpyrazine ,5-dimethyl-3-propylpyrazine ,6-methyl-3-propylpyrazine ,6-methyl-3-propylpyrazine Isopropyl pyrazine 949 Isopropylpyrazine ,3-dimethyl-5-isopropylpyrazine ,3-dimethyl-5-isopropylpyrazine Butylpyrazine 1088 Butylpyrazine butyl-3-methylpyrazine butyl-3-methylpyrazine butyl-3,5-dimethylpyrazine butyl-3,5-dimethylpyrazine butyl-3,6-dimethylpyrazine butyl-3,6-dimethylpyrazine butyl-2,3-dimethylpyrazine butyl-2,3-dimethylpyrazine Isobutyl pyrazine 1043 Isobutylpyrazine ,3-dimethyl-5-isobutylpyrazine ,3-dimethyl-5-isobutylpyrazine isobutyl-3,5,6-trimethylpyrazine isobutyl-3,5,6-trimethylpyrazine sec-butylpyrazine 1040 sec-butylpyrazine sec-butyl-2,3-dimethylpyrazine sec-butyl-2,3-dimethylpyrazine Pentylpyrazine 1192 Pentylpyrazine ,3-dimetyl-5-pentylpyrazine ,3-dimetyl-5-pentylpyrazine Isopentylpyrazine 1157 Isopentylpyrazine ,3-dimetyl-5-isopentylpyrazine ,3-dimetyl-5-isopentylpyrazine (2-methylbutyl) pyrazine 1151 (2-methylbutyl) pyrazine ,3-dimethyl-5-(2-methylbutyl) pyrazine ,3-dimethyl-5-(2-methylbutyl) pyrazine (2-methylbutyl)-2,5,6-trimethylpyrazine (2-methylbutyl)-2,5,6-trimethylpyrazine (2-methyl-3-pentyl) pyrazine 1240 (2-methyl-3-pentyl) pyrazine (2-ethylpropyl) pyrazine 1121 (2-ethylpropyl) pyrazine (1-methylbutyl) pyrazine 1133 (1-methylbutyl) pyrazine ,3-demethyl-5-(2-methylpentyl) pyrazine ,3-demethyl-5- (2-methylpentyl) pyrazine Hexylpyrazine 1293 Hexylpyrazine Octylpyrazine 1495 Octylpyrazine methyl-3-octylpyrazine methyl-3-octylpyrazine methyl-5-(2-methylbutyl)-3-octylpyrazine methyl-5-(2-methylbutyl)-3-octylpyrazine methyl-6-(2-methylbutyl)-3-octylpyrazine methyl-6-(2-methylbutyl)-3-octylpyrazine Methoxypyrazine 877 Methoxypyrazine methoxy-3-methylpyrazine methoxy-3-methylpyrazine methoxy-5-methylpyrazine methoxy-5-methylpyrazine ethyl-2-methoxypyrazine ethyl-2-methoxypyrazine isopropyl-2-methoxypyrazine isopropyl-2-methoxypyrazine isopropyl-3-methyl-2-methoxypyrazine isopropyl-3-methyl-2-methoxypyrazine sec-butyl-3-methyl-2-methoxypyrazine sec-butyl-3-methyl-2-methoxypyrazine isobutyl-3-methyl-2-methoxypyrazine isobutyl-3-methyl-2-methoxypyrazine methyl-2-methoxy-5-(2-methylbutyl) pyrazine methyl-2-methoxy-5-(2-methylbutyl)pyrazine methyl-2-methoxy-5-(2-methylpentyl) pyrazine methyl-2-methoxy-5-(2-methylpentyl)pyrazine Ethoxypyrazine 959 Ethoxypyrazine ethoxy-3-methylpyrazine ethoxy-3-methylpyrazine ethoxy-5-methylpyrazine ethoxy-5-methylpyrazine ethoxy-3-ethylpyrazine ethoxy-3-ethylpyrazine ethoxy-3-isopropylpyrazine ethoxy-3-isopropylpyrazine
4 Table 1. Continuo 64 2-ethoxy-5-isopropyl-3-methylpyrazine ethoxy-5-isopropyl-3-methylpyrazine ethoxy-5-isobutyl-3-methylpyrazine ethoxy-5-isobutyl-3-methylpyrazine sec-butyl-2-ethoxy-3-methylpyrazine sec-butyl-2-ethoxy-3-methylpyrazine ethoxy-3-methy-5-(2-methylbutyl) pyrazine ethoxy-3-methy-5-(2-methylbutyl) pyrazine (methylthio) pyrazine ethoxy-3-methy-5-(2-methypentyl) pyrazine methyl-2-(methylthio) pyrazine 1151 (methylthio) pyrazine methyl-2-(methylthio) pyrazine methyl-2-(methylthio) pyrazine ethyl-2-(methylthio) pyrazine ethyl-2-(methylthio) pyrazine isopropyl-2-(methylthio) pyrazine isopropyl-2-(methylthio) pyrazine isopropyl-3-(methylthio) pyrazine isopropyl-3-(methylthio) pyrazine sec-butyl-3-methyl-2-(methylthio) pyrazine sec-butyl-3-methyl-2-(methylthio) pyrazine isobutyl-3-methyl-2-(methylthio) pyrazine isobutyl-3-methyl-2-(methylthio) pyrazine methyl-5-(2-methylbutyl)-2-(methylthio) pyrazine methyl-5-(2-methylbutyl)-2-(methylthio) pyrazine methyl-5-(2-methylpentyl)-2-(methylthio) pyrazine methyl-5-(2-methylpentyl)-2-(methylthio) pyrazine (ethylthio) pyrazine 1148 (ethylthio) pyrazine ethylthio-3-methylpyrazine ethylthio-3-methylpyrazine ethylthio-5-isopropyl-3-methylpyrazine hylthio-5-isopropyl-3-methylpyrazine sec-butyl-2-ethylthio-3-methylpyrazine sec-butyl-2-ethylthio-3-methylpyrazine ethylthio-5-isobutyl-3-methylpyrazine ethylthio-5-isobutyl-3-methylpyrazine ethylthio-3-methyl-5-(2-methylbutyl) pyrazine ethylthio-3-methyl-5-(2-methylbutyl) pyrazine ethylthio-3-methylyl-5-(2-methylpentyl) pyrazine ethylthio-3-methylyl-5-(2-methylpentyl) pyrazine Phenoxypyrazine 1415 Phenoxypyrazine methyl-3-phenoxypyrazine methyl-3-phenoxypyrazine isopropyl-3-methyl-2-phenoxypyrazine isopropyl-3-methyl-2-phenoxypyrazine sec-butyl-3-methyl-2-phenoxypyrazine sec-butyl-3-methyl-2-phenoxypyrazine isobutyl-3-methyl-2-phenoxypyrazine isobutyl-3-methyl-2-phenoxypyrazine methyl-5-(2-methylpentyl)-2-phenoxypyrazine methyl-5-(2-methylpentyl)-2-phenoxypyrazine (phenylthio) pyrazine 1606 (phenylthio) pyrazine methyl-2-(phenylthio) pyrazine methyl-2-(phenylthio) pyrazine isopropyl-3-methyl-2-(phenylthio) pyrazine isopropyl-3-methyl-2-(phenylthio) pyrazine sec-butyl-3-methyl-2-(phenylthio) pyrazine sec-butyl-3-methyl-2-(phenylthio) pyrazine isobutyl-3-methyl-2-(phenylthio) pyrazine isobutyl-3-methyl-2-(phenylthio) pyrazine methyl-5-(2-methylbutyl)-2-(phenylthio) pyrazine methyl-5-(2-methylbutyl)-2-(phenylthio) pyrazine methyl-5-(2-methylpentyl)-2-(phenylthio) pyrazine methyl-5-(2-methylpentyl)-2-phenylthio) pyrazine Acetylpyrazine 993 Acetylpyrazine acetyl-3-methylpyrazine acetyl-3-methylpyrazine acetyl-5-methylpyrazine acetyl-5-methylpyrazine acetyl-6-methylpyrazine acetyl-6-methylpyrazine acetyl-3-ethylpyrazine acetyl-3-ethylpyrazine acetyl-3,5-dimethylpyrazine acetyl-3,5-dimethylpyrazine Chloropyrazine 861 Chloropyrazine ,3-dichloropyrazine ,3-dichloropyrazine chloro-3-methylpyrazine chloro-3-methylpyrazine chloro-3-ethylpyrazine chloro-3-ethylpyrazine chloro-3-isobutylpyrazine chloro-3-isobutylpyrazine chloro-5-isipropyl-3-methylpyrazine chloro-5-isipropyl-3-methylpyrazine sec-butyl-2-chloro-3-methylpyrazine sec-butyl-2-chloro-3-methylpyrazine chloro-5-isobutyl-3-methylpyrazine chloro-5-isobutyl-3-methylpyrazine chloro-3-methyl-5-(2-methylbutyl) pyrazine chloro-3-methyl-5-(2-methylbutyl) pyrazine chloro-3-methyl-5-(2-methylpentyl) pyrazine chloro-3-methyl-5-(2-methylpentyl) pyrazine VinylPyrazine VinylPyrazine 1392 Regression Analysis The analysis of the multiple linear regressions was carried out with two methods by software Matlab (2009) for (Least Absolute Deviation) and Minitab (16) for (OLS). We considers the multiple model of regression wich is given by (Berlin, 1982): y p 1 = β + β x + ε (1) i 0 j ij i j= 2 Detection of meaningless statements and with action leverage according to the method of least squares is a problem which is largely studied. Diagnosis by the Least Absolute Deviation regression offers alternative 595
5 approaches whose principal characteristic is robustness. In our study a non-parametric method to detect the meaningless statements and point s lever is applied and compared with the traditional method of diagnosis (least squares). Least Squares OLS Method This is carried out with software Minitab 16, method OLS with is applied to multiple regression which consists in defining the β estimate which minimizes: 2 ei = ( y β ) 2 i 0 xij (2) Least Absolute Deviations (LAD) Method The analysis of linear regression multiple is carried out with software Matlab (2009), by using the Least Absolute Deviations (LAD) method, which is one of the principal alternatives to the method of least squares when it is a question of estimating parameters of regression on, which minimizes the absolute values but not the values with square of the term of error. Least Absolute Deviation Method applied to the multiple regression consists in defining the β estimates which minimize (Dodge and Jureckova, 2000, Dodge, 2004): ei = yi β0 β xij (3) Results and Discussion An ideal model is one that has a high R value, a smallest value of standard error, starting from independent variables. The best models found has 3 descriptors for each stationary phase by using the software Moby Digs are given below. The criterion for identifying a compound as an outlier is that compound is diministed by three or more of six standard statistical tests used to detect outliers in regression analysis. These tests were (1) residual, (2) standardized residual, (3) Studentized residual, (4) leverage, (5) DFFITS, (6) Cook s distance. The residual is the difference between real value and the value predicted by the regression equation. The standardized residual is the residual divided by difference models of regression equation. The Studentized residual is the residual of forecast divided by proper model difference. Leverage allows for the determination of a point the influence. DFFITS describes difference in the fits of the equation caused by displacement of a given observation and Cook s distance describes the change of a model coefficient by the displacement of indicated point. The definition of each descriptor is given Table 2. The coefficient of multiple determinations (R 2 ) indicates the amount of variance in data is a explained by the model. The standard error of regression coefficient is given in each case and n indicates of molecules involved in regression analysis procedure. The Best Models IR (OV-101) : (XMOD, FDI, Mor 06 v); S = , R 2 = 99.4, n = 89 compounds IR (CRW20M) : (RDCHI, GATS1p, Mor 02 m); S = , R 2 = 98.08, n = 89 compounds The best tree parametric model was constructed using: [OV-101: Modified Randi connectivity index (XMOD) (is a molecular descriptor proposed as the sum of atomic properties, accounting for valence electrons and extended connectivities in the H- depleted molecular graph using a Randic connectivity index-type formula), Folding Degree Index (FDI) (is the largest eigenvalue of the distance/distance matrix, normalised dividing it by the number of atoms nat. This index tends to one for linear molecules (of infinite length) and decreases in correspondence with the folding of the molecule. Thus, it can be thought of as a measure of the folding degree of the molecule because it indicates the degree of departure of a molecule from strict linearity) and (Mor06v) (3D- MORSE-signal 06/weighted by atomic Vander Waals volumes (Mor06v) (3D-MoRSE) (3D-Molecule Representation of Structures based on Electron diffraction) descriptors are based on the idea of obtaining information from the 3D atomic coordinates by the transform used in electron diffraction studies for preparing theoretical scattering curves.3d-morse the descriptors are calculated for five different atomic properties w: the unweighted case (u), atomic mass (m), the van der Waals volume (v), the Sanderson atomic electro negativity (e) and, the atomic polarizability (p). (CRW-20M: Reciprocal Distance Randi-type Index (RDCHI) (is defined on the analogy of the Randic connectivity index X1, where the vertex degrees are substituted by the row sums of the reciprocal distance matrix. Moreover, the reciprocal distance squared Randictype-index RDSQ is obtained from the RDCHI index substituting the exponent-1/2 with 1/2.), Geary Autocorrelation -log 1/weighted by atomic polariz abilities (GATS1p) (2D autocorrelations calculated by DRAGON are spatial autocorrelations calculated on a H-depleted molecular graph weighted by atom physico-chemical properties (i.e., the atom weightings w) and include: Autocorrelations GATS calculated by the Geary coefficient) and 3D-MORSE-signal 02/weighted by atomic masses (Mor02m)]. 596
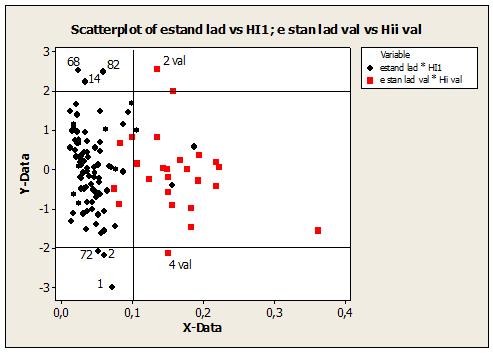
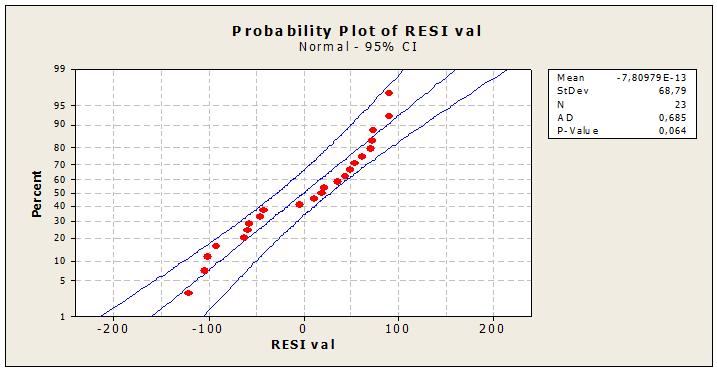
6 Table 2. Definitions of descriptors used in the retention index prediction models Descriptors The definition XMOD Modified Randi connectivity index FDI folding degree index Mor06v (3D-MORSE-signal 06/weighted by atomic Vander Waals volumes RDCHI reciprocal distance Randi-type index GATS1p Geary autocorrelation -log 1/weighted by atomic polarizabilities Mor02m 3D-MORSE-signal 02/weighted by atomic masses Using a significance level of 0.05, the Anderson- Darling normality test (Fig. 1) (A-Squared = 0,134; OV- 101, A-Squared = 0,270; Crbowax- 20 M < v cri = 0.752) indicates that the resting pulse data follow a normal distribution But it disturbance that if outliers may be present in the measurements. Auto Correlation of the Residus Values of the statistics of Durbin-Watson (Durbin and Watson, 1951), [d = 1,47910; OV-101/D = 1,29968; Carbowax-20M] are the greater than higher values given by the tables, respectively for 3 regresses and for reasonable risk α = 0.05, which expresses positive auto correlation of residues which establishes each time the independence of the residues include the absence of autocorrelation that if outliers may be present in the measurements. Column RCW -20 M Column OV -101 The diagnostic statistics joined together in Table 3 make it possible to make comparisons and to draw several conclusions. All relevant statistical parameters are reported in Table 3. Values of R 2 and R 2 adj attest the good fitting performances of the model which, moreover, is very highly significant (great value of the Fisher parameter F). The model is robust, the difference between R² and Q² is small (0.05% of Colum OV-101 and 0.22% of Colum CRW-20M). The model demonstrates a very good stability in internal validation while bootstrapping confirms the internal (Q²bOO) predictivity and stability of the model. SDE Pext is a little bit different from SDEP. The model works slightly worse in external prediction than in internal prediction. Correlation Matrix between Retention Indices and the Selected Descriptors Column OV-101 ov-101 XMOD FDI XMOD 0,986 0,000 FDI -0,039-0,152 0,715 0,154 Mor06v 0,181 0,059 0,274 0,089 0,582 0,009 Column CRW-20M: IR (cw) RDCHI GATS1p RDCHI 0,893 0,000 GATS1p -0,375 0,044 0,000 0,681 Mor02m 0,896 0,930-0,024 0,000 0,000 0,821 The matrix of correlation Table 4, obtained using the order Correlation of software MINITAB, shows that the descriptors are more or less correlated between them (r 0,39 for a p = 0,045<α = 0.05). All the descriptors respectively are correlated with the retention index of the CRW-20M phase except the GATS1p descriptor is correlated less and with the retention index of phase OV -101 descriptor (XMOD) is correlated and the Descriptors (FDI, Mor06v) less correlated. The Least Squares method of estimation of parameters of linear (regression) models performs well provided that the residuals are well not behaved. However, models with the disturbances that are prominently non-normally distributed or follow a normal distribution But it disturbance and contain sizeable outliers fail estimation by the Least Squares method. An intensive research has established that in such cases estimation by the Least Absolute Deviation (LAD) method performs well. Multiple linear Regression Comparison Robust Regression of OLS and Least Absolute Deviation We will try More particularly 2 estimate methods for the vector ( β *, β *,..., β * 0 1 k of Parameters: ( ) Method of ordinary least squares, the most known and the most used. The method Least Absolute Deviation (LAD) (Sum of the absolute values of the errors) (Machabert, 2014). 597
7 Table 3. Statistics diagnostic for the selected models Colum Models R 2 Q 2 Q 2 boot Q 2 ext R 2 adj Kx OV-101 X1sol Mor06v AMR 99,44 99,39 99,35 97,5 99,42 51,36 Kxy SDEP SDEC F s 65,5 18,736 17, ,6 18,38 R2 Q2 Q2boot Q2ext R2adj Kx CRW-20M RDCHI GATS1p Mor02m 98,08 97,86 97,72 77,02 98,01 46,61 Kxy SDEP SDEC F s 63,91 36,044 34, ,5 34,93 Table 4. Least absolute deviation estimates for model Predictor Coef SE Coef T P Constant ,237-9,44 0,000 XMOD 29,1 5,216 5,58 0,000 FDI ,36 17,97 0,000 Mor06v 70,4 10,909 6,453 0,000 Table 5. Least squaresestimates for model Predictor Coef SE Coef T P Constant -809,4 107,2-7,55 0,000 XMOD 292,454 0, ,35 0,000 FDI 1028,3 108,5 9,48 0,000 Mor06v 70,453 6,266 11,24 0,000 Table 6. Least absolute deviation estimates for model Predictor Coef SE Coef T P Constant 859,72 94,47 9,10 0,000 RDCHI 527,46 44,679 11,805 0,000 GATS1p -630,74 20,68-30,5 0,000 Mor02m ,582 1,45 0,000 Table 7. Least squares estimates for mode predictor Coef SE Coef T P Constant 852,37 44,50 19,15 0,000 RDCHI 512,52 33,40 15,34 0,000 GATS1p -636,05 24,61-25,85 0,000 Mor02m 32,671 4,612 7,08 0,000 Fig. 1. Structure of pyrazine (a) 598
 method.")
8 (b) Fig. 2. Diagram of percentage of normality s of the residues The advantage large of the Least Absolute Deviation (LAD) method is robustness, i.e., that the estimators are not impact by the extreme values, (they are known as "robust"). It is thus particularly interesting to use the method Least Absolute Deviation LAD if one is in the presence of aberrant values in comparison with Least Squares (OLS) method. Comparison of Hyperplanes of Regression The model has been estimated by first by Least Squares (OLS,) and then by Least Absolute Deviation, Running the least squares and Least Absolute Deviation regression yields the estimates given in Table. Column OV-101 Column CRW -20M All the variables for the two models is strongly statistically significant in the two columns with method least squares and the method Least Absolute Deviation (Table 4-7). We noticed that calculated of β least squares are not very different for the regression with β the Least Absolute Deviation on the two columns, except, calculated. β 1 and β 3 least squares is almost the same ones as for the regression with β 1 and β 3 Least Absolute Deviation on column OV-101 (Table 4-7). Thus it is relevant to remake a verification in presences of aberrant values using the following phases (Fig. 3): Hyper plane of regression can radically vary with the change of hyper plane coefficients. Graphical Comparisons of Alternative Regression Models The application field has been discussed with the help of Williams diagram. Column CRW-20M Column OV-101 The analysis of the residues shows that the observations ( ) raised residues in the two estimates and the observations (72, 2) raised residue with the Least Absolute Deviation estimate and lever by least square also observation (2, 4) raised residue and influential observations in the two estimates in the whole of validation on column OV -101 and column CRW -20 M the observations (1, 7, 85) raised residues in the two estimates, the observation (86) raised residues with the Least Absolute Deviation estimate and lever by least square also observation (2,3) raised residues and influential observations with Least Absolute Deviation but it with the least squares estimate the observation (2) influential observation butthe observation (3) lever whole of validation. After elimination of the collective aberrant points between the two methods and after the secondary treatment one has the observation (83) raised residues in the two estimates also the observation 2influential observation in the whole of validation in the two estimates on column CRW -20 M and on column OV -101 the observations (1,69) raised residues in the two estimates and the observation 81 the observations raised residues in the least squares estimate also observation (2) influential observation in the least squares estimate. Thus finally the models in which the meaningless statements were removed become: Column OV-101 Least Absolute Deviation: y = XMOD FDI Mor06v (4) 599
 600")

9 (a) (b) (c) 600
 Least absolute deviation method (Training, Test); (b, d) Least squares method (Training, Test) Least")
10 (d) Fig. 3. Diagram of Williams of the residues of prediction standardized according to the lever (a, c) Least absolute deviation method (Training, Test); (b, d) Least squares method (Training, Test) Least Squares: y = ,1 XMOD FDI Mor06v (5) Column CW -20M Least Absolute Deviation: y = 859, RDCHI GATS1p Mor02m Least Square: (6) y = 842,527 RDCHI 625 GATS1p + 29, 2 Mor02m (7) We noticed besides that calculated β can approach that regression with β Least Absolute Deviation on the two columns into precise calculated (β 1 and β 3 ) least squares are almost the same ones as for regression with (β 1 and β 3 ) Least Absolute Deviation and on the order same with (β 0 and β 2 ) on OV 101 and calculated β 1 least squares are almost the same ones as for regression with β 1 Least Absolute Deviation on CRW -20 M and on the order same with (β 1, β 3 and β 4 ). The analysis of the residues shows that in this case All the observation of Least Absolute Deviation method between (-2, 2), but it the analysis of the residues of least squares method shows that the observations [OV-101: Training - test (2), CRW-20 M: Training- (46)] the Least Absolute Deviation estimate given good result On the other hand estimate least squares Fig. 4: Graphical Comparisons of Alternative Regression Models Column CRW-20M Column OV-101 We notice no change of the coefficients of the right-hand side after feeding of the aberrant point what translates the line is stable which expresses that the Least Absolute Deviation method born not sensitive to the presences of the aberrant values thus we report that the Least Absolute Deviation method is a stable method and more robust. To conform the approach between the two methods and to deduce the robust method between them, There is a set of tests of normality (of standard errors or residues ) indeed, thanks to robustness concept, we can used simple techniques (descriptive e.g. Statistics, technical graphs) to check if the distribution of data is really approximate. Any test is associated a risk known as of first species years works us, we will adopt it risk α = 5%. Comparisons of the Tests of Normality of the Errors between Method Least Absolute Deviation and Least Squares in Approached State Software Minitab 16 proceeds automatically in estimating two principal parameters of the normal law (µ the Mean (OV-101:0, CRW-20M: 0), σ the variation-type (OV-101:10.35, CRW-20M:14.84) for least squares one applying the same principle with the Least Absolute Deviation method but one used (the median (OV-101: -1.57, CRW-20M:0.01) σ variationtype (OV-101:10.26, CRW-20M:15.08) and with the principal number in the state approached to the two columns (OV-101: n = 83, CRW-20 M: n = 85). 601
 602")

11 (a) (b) (c) 602
 603")


12 (d) (e) (f) 603
 (a, c, e, g) Training; (b, d, f,h) Test Graphic Tests Probability Plot of Error To check normality of errors of a model of regression is")

13 (g) (h) Fig. 4. Diagram of normality percentage of residues (Training, Test) (a, c, e, g) Training; (b, d, f,h) Test Graphic Tests Probability Plot of Error To check normality of errors of a model of regression is to carry out Probability stud of residues. Column CW -20M Least Squares Method Least Absolute Deviation Method Column OV-101 Least Squares Method Least Absolute Deviation Method A normal distribution with the two columns appears to fit your data sample fairly well. The plotted points form a reasonably straight line. Test of Anderson-Darling In our work, one finds us that Anderson-Darling (AD) [OV- 101: (Least Absolute Deviation) = with value of p>0.250, (least squares) = with value of p = 0.783, n = 83], [CRW-20M: (Least Absolute Deviation) Anderson-Darling (AD) = 0,693 with value of p>0.250, (least squares) = 0,468 with value of p = n = 85] < AD critique = with p>0.1 to 5%, the assumption of normality is compatible with our data with Least Absolute Deviation method and least squares. Interval of Confidence The interval confidence and the risqe a constitute a complementary approach thus (an estimate approach) the most used interval confidence is interval confidence has 100(1-a) = 95%. 604
14 The Column OV-101: Training : Least Absolute Deviation: (-31.52, 29), least squares (-30.18, 30.18) Test : Least Absolute Deviation (-59.15, 60.68), least squares (-58.82, 58.82) The Column CRW-20M: Training : Least Absolute Deviation: (-61.73, 61.74), least squares (-60.66, 60.66) Test : Least Absolute Deviation (-135.9, 135.8), least squares (-136.6, 136.6) The data may be compatible with the hypothesis also that the limited values of the interval are center which expresses the mean and the median which verifies position 95% that the 50th percentile for the population the center of the acceptance zone the null hypothesis. Completely all the graphic and statistical tests is accepted data of the approached state between the two methods especially the test of Anderson-Darling the value of the Least Absolute Deviation method closer to least squares method and Interval of The value of confidence these result is formed L approximate of two method. Conclusion PYRAZINes are compounds naturally presents in food and taking part in their odour, contray to their biodegradation, pyrazine formation has been intensively studied. Modeling of retention indices of 114 pyrazines (89 Training and 25 Test) eluted out of two columns various OV -101, the best tree parametric model was constructed using. [OV-101 with Modified Randi connectivity index (XMOD), Folding Degree Index (FDI) and (3D- MORSE-signal 06/weighted by atomic Vander Waals volumes (Mor06v); CRW-20M with Reciprocal distance Randi-type Index (RDCHI), Geary autocorrelation -log 1/weighted by atomic polariz abilities (GATS1p) and 3D-MORSE-signal 02/weighted by atomic masses (Mor 02 m)]. The Column of OV-101 and CRW-20M by two methods Least Absolute Deviation and least squares are based on the following comparisons. The comparison of the equations of the hyper planes: L equations of least squares is closer to Least Absolute Deviation after elimination of the aberrant points for the β 2 (Least Absolute Deviation) β 2 (least squares) and the other coefficient remaining with the same order for column OV-101 for the column CRW- 20 M the β 1 (Least Absolute Deviation) β 1 (least squares) and the other coefficient remaining with the same order after the secondary treatments for the checking of presence of aberrant values (training: 1, 2, 14, 68, 72, 82 test: 2, 4) (training: 1, 7, 85, 86, test: 2, 3) on column (OV -101) and (training: 1, 7, 85, 86, test: 2, 3) for the CRW-20M- column) and to be able to compare them By using the following stage. Graphic comparison: The applicability is discussed using the diagram of Williams in dependence. Lastly, it is noted that Least Absolute Deviation is a robust estimator not sensitive to the presences of the aberrant values thus we report that the Least Absolute Deviation method is a stable and robust method. Used test of normality s of the errors by graphic and statistical test. One applied compatibility with the normal law, but using the degree α = Too one confirmed approached graphically by Probability plot of the error One notes that the test to accept the assumption of normality is that of Anderson-Darling, in finished by the confidence interval with one p-been worth sup 0.1 on the columns. It general this study is shown that results by the two estimates theoretical (equation) and graph give good results expressed by the models. Acknowledgement We would like to thank Salima Khanouch, PhD (informatique) for writing the algorithm of least absolut deviation Method and Mr hessene (Teacher of English Language) for reviewing the language in the manuscript. Author s Contributions Fatiha Mebarki: Good Developed methods of least absolut deviation and least squares, Developed deference s Softwares (Matlab, Minitab, Tanagra, genetic Algorithm)and participated in all experiments, coordinated the data-analysis. Khadija Amirat: Developed deference s Softwares (Matlab, Minitab, Tropsha, SVM, genetic Algorithm) and participated in all experiments, coordinated the dataanalysis and contributed to the writing of the manuscript. Salima Ali Mokhnach: Correction of the work and chef laboratories. Djellol Messadi: Is the main researcher of project and chef of tree laboratories, designed the research plan and organized the study. Ethics This article is original and to the best knowledge of the authors has not been published before. The authors confirm that there are no ethical issues involved. 605
15 References Berlin, G.B., The Pyrazine. 1st Edn., J. Wiley, New York, ISBN-10: , pp: 687. Buchbauer, G., Threshold-based structure-activity relationships of pyrazines with bell-pepper Flavor. J. Agric. Food Chem., 48: PMID: Damodar, N.G. and C.D. Porter, Basic Econometrics. 5st Edn., McGraw-Hill Irwin,, Boston, ISBN-10: , pp: 922. Dewar, M.J.S., E.G. Zoebisch, E.F. Ealy and J.J.P. Stewart, AM1: A new general purpose quantum mechanical model. J. Am. Chem. Soc., 107: Dodge, Y. and J. Jureckova, Adaptive Regression. 1st Edn., Springer Science and Business Media, New York, ISBN-10: , pp: 177. Dodge, Y., Statistical Data Analysis Based on the Li-Norm and Related Methods. 1st Edn., North-Holland, Amsterdam, ISBN-10: , pp: 464. Dodge, Y., L1-Statistical Procedures and Related Topics. 1st Edn., Institute of Mathematical Statistics, Hayward, ISBN-10: , pp: 498 Dodge, Y., Statistique: Dictionnaire Encyclopédique. 1st Edn., Springer Science and Business Media, Paris, ISBN-10: , pp: 662. Dragon 5.4, Eriksson, L., J. Jaworska, A. Worth, M. Cronin and R.M. Mc Dowell et al., Methods for reliability, uncertainty assessment and applicability evaluations of regression based and classification QSARs. Environ. Health Perspect., 111: Gonin, R. and A.H. Money, Linear L P -norm Extimation. 1st Edn., Marcel Dekker, New York. Holder, A.J., AM1, Encyclopedia of Computational Chemistry. Scheleyer, P.V.R., N.L. Allinger, T. Clarck, J. Gasteiger and P.A. Kollman et al. (Eds.), Wiley, Chichester, pp: 1-8. Hyperchem 6.03, (Hypercube), Judge, G.G., W.E. Griffiths, R.C. Hill, H. Lütkepohl and T.C. Lee, The Theory and Practice of Econometrics. 2nd Edn, Wiley, New York, ISBN- 10: X, pp: 1019 Li, W., C.L. Heth and S.C. Rasmussen, Thieno[3,4-b] pyrazine-based oligothiophenes: Simple models of donor-acceptor polymeric materials. Phy. Chem. Chemicale Phys. J., 28 : Machabert, T., Modèles en très grande dimension avec des outliers. Théorie, Simulations, Applications Paris. Matlab, R., Minitab, release 16.1, statistical software, Mebarki, F., K. Amirat, S.A. Mokhnache and D. Messadi, Treatment by alternative methods of regression gas chromathographic retention indices of 35 pyrazines. Int. J. Instrument. Control Syst., 6: Mihara, S. and N. Enomoto, Calculation of retention indices of pyrazines on the basis of molecular structure. J. Chromatogr., 324: Moby Digs 1.1, Nornadiah, M.R. and Y.B. Yah, Power Comparaisons of shapiro-wilk, Kolmogorovsmornov, lillieffors and Anderson-Darling tests. J. Statistique Modell. Analyt., 2: Small, G.W. and P.C. Jurs, Interactive computer system for the simulation of carbon-13 nuclear magnetic resonance spectra. Anal. Chem., 55: DOI: /ac00258a033 Stanton, D.T. and P.C. Jurs, Computer-assisted predict of gaschromatographicretention indexes of pyrazines. Anal. Chem., 61: Todeschini, R., D. Ballabio, V. Consonni, A. Mauri and V. Pavan, MobyDigs 1.1, Copyright TALETE srl. Tropsha, A., P. Gramatica and V.K. Grombar, The importance of being earnest: Validation is the absolute essential for successful application and interpretation of QSPR models. QSAR Combi. Sci., 22:
Wine-Tasting by Numbers: Using Binary Logistic Regression to Reveal the Preferences of Experts
 Wine-Tasting by Numbers: Using Binary Logistic Regression to Reveal the Preferences of Experts When you need to understand situations that seem to defy data analysis, you may be able to use techniques
Relation between Grape Wine Quality and Related Physicochemical Indexes
 Research Journal of Applied Sciences, Engineering and Technology 5(4): 557-5577, 013 ISSN: 040-7459; e-issn: 040-7467 Maxwell Scientific Organization, 013 Submitted: October 1, 01 Accepted: December 03,
Appendix A. Table A.1: Logit Estimates for Elasticities
 Estimates from historical sales data Appendix A Table A.1. reports the estimates from the discrete choice model for the historical sales data. Table A.1: Logit Estimates for Elasticities Dependent Variable:
Gail E. Potter, Timo Smieszek, and Kerstin Sailer. April 24, 2015
 Supplementary Material to Modelling workplace contact networks: the effects of organizational structure, architecture, and reporting errors on epidemic predictions, published in Network Science Gail E.
Decision making with incomplete information Some new developments. Rudolf Vetschera University of Vienna. Tamkang University May 15, 2017
 Decision making with incomplete information Some new developments Rudolf Vetschera University of Vienna Tamkang University May 15, 2017 Agenda Problem description Overview of methods Single parameter approaches
Buying Filberts On a Sample Basis
 E 55 m ^7q Buying Filberts On a Sample Basis Special Report 279 September 1969 Cooperative Extension Service c, 789/0 ite IP") 0, i mi 1910 S R e, `g,,ttsoliktill:torvti EARs srin ITQ, E,6
RELATIVE EFFICIENCY OF ESTIMATES BASED ON PERCENTAGES OF MISSINGNESS USING THREE IMPUTATION NUMBERS IN MULTIPLE IMPUTATION ANALYSIS ABSTRACT
 RELATIVE EFFICIENCY OF ESTIMATES BASED ON PERCENTAGES OF MISSINGNESS USING THREE IMPUTATION NUMBERS IN MULTIPLE IMPUTATION ANALYSIS Nwakuya, M. T. (Ph.D) Department of Mathematics/Statistics University
Predicting Wine Quality
 March 8, 2016 Ilker Karakasoglu Predicting Wine Quality Problem description: You have been retained as a statistical consultant for a wine co-operative, and have been asked to analyze these data. Each
A New Approach for Smoothing Soil Grain Size Curve Determined by Hydrometer
 International Journal of Geosciences, 2013, 4, 1285-1291 Published Online November 2013 (http://www.scirp.org/journal/ijg) http://dx.doi.org/10.4236/ijg.2013.49123 A New Approach for Smoothing Soil Grain
wine 1 wine 2 wine 3 person person person person person
 1. A trendy wine bar set up an experiment to evaluate the quality of 3 different wines. Five fine connoisseurs of wine were asked to taste each of the wine and give it a rating between 0 and 10. The order
BORDEAUX WINE VINTAGE QUALITY AND THE WEATHER ECONOMETRIC ANALYSIS
 BORDEAUX WINE VINTAGE QUALITY AND THE WEATHER ECONOMETRIC ANALYSIS WINE PRICES OVER VINTAGES DATA The data sheet contains market prices for a collection of 13 high quality Bordeaux wines (not including
Relationships Among Wine Prices, Ratings, Advertising, and Production: Examining a Giffen Good
 Relationships Among Wine Prices, Ratings, Advertising, and Production: Examining a Giffen Good Carol Miu Massachusetts Institute of Technology Abstract It has become increasingly popular for statistics
Gasoline Empirical Analysis: Competition Bureau March 2005
 Gasoline Empirical Analysis: Update of Four Elements of the January 2001 Conference Board study: "The Final Fifteen Feet of Hose: The Canadian Gasoline Industry in the Year 2000" Competition Bureau March
STA Module 6 The Normal Distribution
 STA 2023 Module 6 The Normal Distribution Learning Objectives 1. Explain what it means for a variable to be normally distributed or approximately normally distributed. 2. Explain the meaning of the parameters
STA Module 6 The Normal Distribution. Learning Objectives. Examples of Normal Curves
 STA 2023 Module 6 The Normal Distribution Learning Objectives 1. Explain what it means for a variable to be normally distributed or approximately normally distributed. 2. Explain the meaning of the parameters
Online Appendix to. Are Two heads Better Than One: Team versus Individual Play in Signaling Games. David C. Cooper and John H.
 Online Appendix to Are Two heads Better Than One: Team versus Individual Play in Signaling Games David C. Cooper and John H. Kagel This appendix contains a discussion of the robustness of the regression
Identification of Adulteration or origins of whisky and alcohol with the Electronic Nose
 Identification of Adulteration or origins of whisky and alcohol with the Electronic Nose Dr Vincent Schmitt, Alpha M.O.S AMERICA schmitt@alpha-mos.com www.alpha-mos.com Alpha M.O.S. Eastern Analytical
Curtis Miller MATH 3080 Final Project pg. 1. The first question asks for an analysis on car data. The data was collected from the Kelly
 Curtis Miller MATH 3080 Final Project pg. 1 Curtis Miller 4/10/14 MATH 3080 Final Project Problem 1: Car Data The first question asks for an analysis on car data. The data was collected from the Kelly
Final Exam Financial Data Analysis (6 Credit points/imp Students) March 2, 2006
 March 2, 2006") Dr. Roland Füss Winter Term 2005/2006 Final Exam Financial Data Analysis (6 Credit points/imp Students) March 2, 2006 Note the following important information: 1. The total disposal time is 60 minutes.
Dr. Roland Füss Winter Term 2005/2006 Final Exam Financial Data Analysis (6 Credit points/imp Students) March 2, 2006 Note the following important information: 1. The total disposal time is 60 minutes.
From VOC to IPA: This Beer s For You!
 From VOC to IPA: This Beer s For You! Joel Smith Statistician Minitab Inc. jsmith@minitab.com 2013 Minitab, Inc. Image courtesy of amazon.com The Data Online beer reviews Evaluated overall and: Appearance
Pitfalls for the Construction of a Welfare Indicator: An Experimental Analysis of the Better Life Index
 Clemens Hetschko, Louisa von Reumont & Ronnie Schöb Pitfalls for the Construction of a Welfare Indicator: An Experimental Analysis of the Better Life Index University Alliance of Sustainability Spring
Activity 10. Coffee Break. Introduction. Equipment Required. Collecting the Data
 . Activity 10 Coffee Break Economists often use math to analyze growth trends for a company. Based on past performance, a mathematical equation or formula can sometimes be developed to help make predictions
Supporing Information. Modelling the Atomic Arrangement of Amorphous 2D Silica: Analysis
 Electronic Supplementary Material (ESI) for Physical Chemistry Chemical Physics. This journal is the Owner Societies 2018 Supporing Information Modelling the Atomic Arrangement of Amorphous 2D Silica:
Regression Models for Saffron Yields in Iran
 Regression Models for Saffron ields in Iran Sanaeinejad, S.H., Hosseini, S.N 1 Faculty of Agriculture, Ferdowsi University of Mashhad, Iran sanaei_h@yahoo.co.uk, nasir_nbm@yahoo.com, Abstract: Saffron
STABILITY IN THE SOCIAL PERCOLATION MODELS FOR TWO TO FOUR DIMENSIONS
 International Journal of Modern Physics C, Vol. 11, No. 2 (2000 287 300 c World Scientific Publishing Company STABILITY IN THE SOCIAL PERCOLATION MODELS FOR TWO TO FOUR DIMENSIONS ZHI-FENG HUANG Institute
Lesson 23: Newton s Law of Cooling
 Student Outcomes Students apply knowledge of exponential functions and transformations of functions to a contextual situation. Lesson Notes Newton s Law of Cooling is a complex topic that appears in physics
Handling Missing Data. Ashley Parker EDU 7312
 Handling Missing Data Ashley Parker EDU 7312 Presentation Outline Types of Missing Data Treatments for Handling Missing Data Deletion Techniques Listwise Deletion Pairwise Deletion Single Imputation Techniques
STUDY AND IMPROVEMENT FOR SLICE SMOOTHNESS IN SLICING MACHINE OF LOTUS ROOT
 STUDY AND IMPROVEMENT FOR SLICE SMOOTHNESS IN SLICING MACHINE OF LOTUS ROOT Deyong Yang 1,*, Jianping Hu 1,Enzhu Wei 1, Hengqun Lei 2, Xiangci Kong 2 1 Key Laboratory of Modern Agricultural Equipment and
What makes a good muffin? Ivan Ivanov. CS229 Final Project
 What makes a good muffin? Ivan Ivanov CS229 Final Project Introduction Today most cooking projects start off by consulting the Internet for recipes. A quick search for chocolate chip muffins returns a
1. Continuing the development and validation of mobile sensors. 3. Identifying and establishing variable rate management field trials
 Project Overview The overall goal of this project is to deliver the tools, techniques, and information for spatial data driven variable rate management in commercial vineyards. Identified 2016 Needs: 1.
Multiple Imputation for Missing Data in KLoSA
 Multiple Imputation for Missing Data in KLoSA Juwon Song Korea University and UCLA Contents 1. Missing Data and Missing Data Mechanisms 2. Imputation 3. Missing Data and Multiple Imputation in Baseline
Missing value imputation in SAS: an intro to Proc MI and MIANALYZE
 Victoria SAS Users Group November 26, 2013 Missing value imputation in SAS: an intro to Proc MI and MIANALYZE Sylvain Tremblay SAS Canada Education Copyright 2010 SAS Institute Inc. All rights reserved.
EFFECT OF TOMATO GENETIC VARIATION ON LYE PEELING EFFICACY TOMATO SOLUTIONS JIM AND ADAM DICK SUMMARY
 EFFECT OF TOMATO GENETIC VARIATION ON LYE PEELING EFFICACY TOMATO SOLUTIONS JIM AND ADAM DICK 2013 SUMMARY Several breeding lines and hybrids were peeled in an 18% lye solution using an exposure time of
Detecting Melamine Adulteration in Milk Powder
 Detecting Melamine Adulteration in Milk Powder Introduction Food adulteration is at the top of the list when it comes to food safety concerns, especially following recent incidents, such as the 2008 Chinese
Labor Supply of Married Couples in the Formal and Informal Sectors in Thailand
 Southeast Asian Journal of Economics 2(2), December 2014: 77-102 Labor Supply of Married Couples in the Formal and Informal Sectors in Thailand Chairat Aemkulwat 1 Faculty of Economics, Chulalongkorn University
International Journal of Business and Commerce Vol. 3, No.8: Apr 2014[01-10] (ISSN: )
![International Journal of Business and Commerce Vol. 3, No.8: Apr 2014[01-10] (ISSN: )](/thumbs/86/94457514.jpg "International Journal of Business and Commerce Vol. 3, No.8: Apr 2014[01-10] (ISSN: )") The Comparative Influences of Relationship Marketing, National Cultural values, and Consumer values on Consumer Satisfaction between Local and Global Coffee Shop Brands Yi Hsu Corresponding author: Associate
The Comparative Influences of Relationship Marketing, National Cultural values, and Consumer values on Consumer Satisfaction between Local and Global Coffee Shop Brands Yi Hsu Corresponding author: Associate
Flexible Working Arrangements, Collaboration, ICT and Innovation
 Flexible Working Arrangements, Collaboration, ICT and Innovation A Panel Data Analysis Cristian Rotaru and Franklin Soriano Analytical Services Unit Economic Measurement Group (EMG) Workshop, Sydney 28-29
Flexible Imputation of Missing Data
 Chapman & Hall/CRC Interdisciplinary Statistics Series Flexible Imputation of Missing Data Stef van Buuren TNO Leiden, The Netherlands University of Utrecht The Netherlands crc pness Taylor &l Francis
The Elasticity of Substitution between Land and Capital: Evidence from Chicago, Berlin, and Pittsburgh
 The Elasticity of Substitution between Land and Capital: Evidence from Chicago, Berlin, and Pittsburgh Daniel McMillen University of Illinois Ph.D., Northwestern University, 1987 Implications of the Elasticity
Increasing Toast Character in French Oak Profiles
 RESEARCH Increasing Toast Character in French Oak Profiles Beaulieu Vineyard 2006 Chardonnay Domenica Totty, Beaulieu Vineyard David Llodrá, World Cooperage Dr. James Swan, Consultant www.worldcooperage.com
Return to wine: A comparison of the hedonic, repeat sales, and hybrid approaches
 Return to wine: A comparison of the hedonic, repeat sales, and hybrid approaches James J. Fogarty a* and Callum Jones b a School of Agricultural and Resource Economics, The University of Western Australia,
Missing Data Treatments
 Missing Data Treatments Lindsey Perry EDU7312: Spring 2012 Presentation Outline Types of Missing Data Listwise Deletion Pairwise Deletion Single Imputation Methods Mean Imputation Hot Deck Imputation Multiple
Learning Connectivity Networks from High-Dimensional Point Processes
 Learning Connectivity Networks from High-Dimensional Point Processes Ali Shojaie Department of Biostatistics University of Washington faculty.washington.edu/ashojaie Feb 21st 2018 Motivation: Unlocking
The R&D-patent relationship: An industry perspective
 Université Libre de Bruxelles (ULB) Solvay Brussels School of Economics and Management (SBS-EM) European Center for Advanced Research in Economics and Statistics (ECARES) The R&D-patent relationship: An
Evaluating Population Forecast Accuracy: A Regression Approach Using County Data
 Evaluating Population Forecast Accuracy: A Regression Approach Using County Data Jeff Tayman, UC San Diego Stanley K. Smith, University of Florida Stefan Rayer, University of Florida Final formatted version
Is Fair Trade Fair? ARKANSAS C3 TEACHERS HUB. 9-12th Grade Economics Inquiry. Supporting Questions
 9-12th Grade Economics Inquiry Is Fair Trade Fair? Public Domain Image Supporting Questions 1. What is fair trade? 2. If fair trade is so unique, what is free trade? 3. What are the costs and benefits
Method for the imputation of the earnings variable in the Belgian LFS
 Method for the imputation of the earnings variable in the Belgian LFS Workshop on LFS methodology, Madrid 2012, May 10-11 Astrid Depickere, Anja Termote, Pieter Vermeulen Outline 1. Introduction 2. Imputation
AJAE Appendix: Testing Household-Specific Explanations for the Inverse Productivity Relationship
 AJAE Appendix: Testing Household-Specific Explanations for the Inverse Productivity Relationship Juliano Assunção Department of Economics PUC-Rio Luis H. B. Braido Graduate School of Economics Getulio
STUDY REGARDING THE RATIONALE OF COFFEE CONSUMPTION ACCORDING TO GENDER AND AGE GROUPS
 STUDY REGARDING THE RATIONALE OF COFFEE CONSUMPTION ACCORDING TO GENDER AND AGE GROUPS CRISTINA SANDU * University of Bucharest - Faculty of Psychology and Educational Sciences, Romania Abstract This research
Average Matrix Relative Sensitivity Factors (AMRSFs) for X-ray Photoelectron Spectroscopy (XPS)
 for X-ray Photoelectron Spectroscopy (XPS)") Average Matrix Relative Sensitivity Factors (AMRSFs) for X-ray Photoelectron Spectroscopy (XPS) These tables and plots contain AMRSFs for XPS calculated for the total peak area for all core levels with
Average Matrix Relative Sensitivity Factors (AMRSFs) for X-ray Photoelectron Spectroscopy (XPS) These tables and plots contain AMRSFs for XPS calculated for the total peak area for all core levels with
INFLUENCE OF THIN JUICE ph MANAGEMENT ON THICK JUICE COLOR IN A FACTORY UTILIZING WEAK CATION THIN JUICE SOFTENING
 INFLUENCE OF THIN JUICE MANAGEMENT ON THICK JUICE COLOR IN A FACTORY UTILIZING WEAK CATION THIN JUICE SOFTENING Introduction: Christopher D. Rhoten The Amalgamated Sugar Co., LLC 5 South 5 West, Paul,
Appendix A. Table A1: Marginal effects and elasticities on the export probability
 Appendix A Table A1: Marginal effects and elasticities on the export probability Variable PROP [1] PROP [2] PROP [3] PROP [4] Export Probability 0.207 0.148 0.206 0.141 Marg. Eff. Elasticity Marg. Eff.
Sponsored by: Center For Clinical Investigation and Cleveland CTSC
 Selected Topics in Biostatistics Seminar Series Association and Causation Sponsored by: Center For Clinical Investigation and Cleveland CTSC Vinay K. Cheruvu, MSc., MS Biostatistician, CTSC BERD cheruvu@case.edu
ANALYSIS OF THE EVOLUTION AND DISTRIBUTION OF MAIZE CULTIVATED AREA AND PRODUCTION IN ROMANIA
 ANALYSIS OF THE EVOLUTION AND DISTRIBUTION OF MAIZE CULTIVATED AREA AND PRODUCTION IN ROMANIA Agatha POPESCU University of Agricultural Sciences and Veterinary Medicine, Bucharest, 59 Marasti, District
7 th Annual Conference AAWE, Stellenbosch, Jun 2013
 The Impact of the Legal System and Incomplete Contracts on Grape Sourcing Strategies: A Comparative Analysis of the South African and New Zealand Wine Industries * Corresponding Author Monnane, M. Monnane,
The aim of the thesis is to determine the economic efficiency of production factors utilization in S.C. AGROINDUSTRIALA BUCIUM S.A.
 The aim of the thesis is to determine the economic efficiency of production factors utilization in S.C. AGROINDUSTRIALA BUCIUM S.A. The research objectives are: to study the history and importance of grape
The Roles of Social Media and Expert Reviews in the Market for High-End Goods: An Example Using Bordeaux and California Wines
 The Roles of Social Media and Expert Reviews in the Market for High-End Goods: An Example Using Bordeaux and California Wines Alex Albright, Stanford/Harvard University Peter Pedroni, Williams College
GrillCam: A Real-time Eating Action Recognition System
 GrillCam: A Real-time Eating Action Recognition System Koichi Okamoto and Keiji Yanai The University of Electro-Communications, Tokyo 1-5-1 Chofu, Tokyo 182-8585, JAPAN {okamoto-k@mm.inf.uec.ac.jp,yanai@cs.uec.ac.jp}
World of Wine: From Grape to Glass
 World of Wine: From Grape to Glass Course Details No Prerequisites Required Course Dates Start Date: th 18 August 2016 0:00 AM UTC End Date: st 31 December 2018 0:00 AM UTC Time Commitment Between 2 to
Valuation in the Life Settlements Market
 Valuation in the Life Settlements Market New Empirical Evidence Jiahua (Java) Xu 1 1 Institute of Insurance Economics University of St.Gallen Western Risk and Insurance Association 2018 Annual Meeting
Lecture 13. We continue our discussion of the economic causes of conflict, but now we work with detailed data on a single conflict.
 EC3320 2016-2017 Michael Spagat Lecture 13. We continue our discussion of the economic causes of conflict, but now we work with detailed data on a single conflict. The units of analysis for Collier-Hoefller-Fearon-Laitin
IMPACT OF RAINFALL AND TEMPERATURE ON TEA PRODUCTION IN UNDIVIDED SIVASAGAR DISTRICT
 International Journal of Agricultural Science and Research (IJASR) ISSN (P): 2250-0057; ISSN (E): 2321-0087 Vol. 8, Issue 1 Feb 2018, 51-56 TJPRC Pvt. Ltd. IMPACT OF RAINFALL AND TEMPERATURE ON TEA PRODUCTION
Business Statistics /82 Spring 2011 Booth School of Business The University of Chicago Final Exam
 Business Statistics 41000-81/82 Spring 2011 Booth School of Business The University of Chicago Final Exam Name You may use a calculator and two cheat sheets. You have 3 hours. I pledge my honor that I
COMPARISON OF CORE AND PEEL SAMPLING METHODS FOR DRY MATTER MEASUREMENT IN HASS AVOCADO FRUIT
 New Zealand Avocado Growers' Association Annual Research Report 2004. 4:36 46. COMPARISON OF CORE AND PEEL SAMPLING METHODS FOR DRY MATTER MEASUREMENT IN HASS AVOCADO FRUIT J. MANDEMAKER H. A. PAK T. A.
Nuclear reactors construction costs: The role of lead-time, standardization and technological progress
 Nuclear reactors construction costs: The role of lead-time, standardization and technological progress Lina Escobar Rangel and Michel Berthélemy Mines ParisTech - Centre for Industrial Economics CERNA
Zeitschrift für Soziologie, Jg., Heft 5, 2015, Online- Anhang
 I Are Joiners Trusters? A Panel Analysis of Participation and Generalized Trust Online Appendix Katrin Botzen University of Bern, Institute of Sociology, Fabrikstrasse 8, 3012 Bern, Switzerland; katrin.botzen@soz.unibe.ch
The Sources of Risk Spillovers among REITs: Asset Similarities and Regional Proximity
 The Sources of Risk Spillovers among REITs: Asset Similarities and Regional Proximity Zeno Adams EBS Business School Roland Füss EBS Business School ZEW Mannheim Felix Schinder ZEW Mannheim Steinbeis University
Table A.1: Use of funds by frequency of ROSCA meetings in 9 research sites (Note multiple answers are allowed per respondent)
") Appendix Table A.1: Use of funds by frequency of ROSCA meetings in 9 research sites (Note multiple answers are allowed per respondent) Daily Weekly Every 2 weeks Monthly Every 3 months Every 6 months Total
Appendix Table A.1: Use of funds by frequency of ROSCA meetings in 9 research sites (Note multiple answers are allowed per respondent) Daily Weekly Every 2 weeks Monthly Every 3 months Every 6 months Total
Laboratory Performance Assessment. Report. Analysis of Pesticides and Anthraquinone. in Black Tea
 Laboratory Performance Assessment Report Analysis of Pesticides and Anthraquinone in Black Tea May 2013 Summary This laboratory performance assessment on pesticides in black tea was designed and organised
IT 403 Project Beer Advocate Analysis
 1. Exploratory Data Analysis (EDA) IT 403 Project Beer Advocate Analysis Beer Advocate is a membership-based reviews website where members rank different beers based on a wide number of categories. The
Problem Set #3 Key. Forecasting
 Problem Set #3 Key Sonoma State University Business 581E Dr. Cuellar The data set bus581e_ps3.dta is a Stata data set containing annual sales (cases) and revenue from December 18, 2004 to April 2 2011.
Varietal Specific Barrel Profiles
 RESEARCH Varietal Specific Barrel Profiles Beaulieu Vineyard and Sea Smoke Cellars 2006 Pinot Noir Domenica Totty, Beaulieu Vineyard Kris Curran, Sea Smoke Cellars Don Shroerder, Sea Smoke Cellars David
Growth in early yyears: statistical and clinical insights
 Growth in early yyears: statistical and clinical insights Tim Cole Population, Policy and Practice Programme UCL Great Ormond Street Institute of Child Health London WC1N 1EH UK Child growth Growth is
Internet Appendix to. The Price of Street Friends: Social Networks, Informed Trading, and Shareholder Costs. Jie Cai Ralph A.
 Internet Appendix to The Price of Street Friends: Social Networks, Informed Trading, and Shareholder Costs Jie Cai Ralph A. Walkling Ke Yang October 2014 1 A11. Controlling for s Logically Associated with
World of Wine: From Grape to Glass Syllabus
 World of Wine: From Grape to Glass Syllabus COURSE OVERVIEW Have you always wanted to know more about how grapes are grown and wine is made? Perhaps you like a specific wine, but can t pinpoint the reason
HW 5 SOLUTIONS Inference for Two Population Means
 HW 5 SOLUTIONS Inference for Two Population Means 1. The Type II Error rate, β = P{failing to reject H 0 H 0 is false}, for a hypothesis test was calculated to be β = 0.07. What is the power = P{rejecting
2 nd Midterm Exam-Solution
 2 nd Midterm Exam- اس تعن ابهلل وكن عىل يقني بأ ن لك ما ورد يف هذه الورقة تعرفه جيدا وقد تدربت عليه مبا فيه الكفاية Question #1: Answer the following with True or False: 1. The non-parametric input modeling
Introduction to the Practical Exam Stage 1
 Introduction to the Practical Exam Stage 1 2 Agenda Exam Structure How MW Practical Differs from Other Exams What You Must Know How to Approach Exam Questions Time Management Practice Methodologies Stage
Flowering and Fruiting Morphology of Hardy Kiwifruit, Actinidia arguta
 Flowering and Fruiting Morphology of Hardy Kiwifruit, Actinidia arguta Chantalak Tiyayon and Bernadine Strik Department of Horticulture, Oregon State University 4017 ALS, Corvallis, OR 97331, USA Email:
THE EFFECT OF DIFFERENT APPLICATIONS ON FRUIT YIELD CHARACTERISTICS OF STRAWBERRIES CULTIVATED UNDER VAN ECOLOGICAL CONDITION ABSTRACT
 Gecer et al., The Journal of Animal & Plant Sciences, 23(5): 2013, Page: J. 1431-1435 Anim. Plant Sci. 23(5):2013 ISSN: 1018-7081 THE EFFECT OF DIFFERENT APPLICATIONS ON FRUIT YIELD CHARACTERISTICS OF
Réseau Vinicole Européen R&D d'excellence
 Réseau Vinicole Européen R&D d'excellence Lien de la Vigne / Vinelink 1 Paris, 09th March 2012 R&D is strategic for the sustainable competitiveness of the EU wine sector However R&D focus and investment
Structural Reforms and Agricultural Export Performance An Empirical Analysis
 Structural Reforms and Agricultural Export Performance An Empirical Analysis D. Susanto, C. P. Rosson, and R. Costa Department of Agricultural Economics, Texas A&M University College Station, Texas INTRODUCTION
Comprehensive analysis of coffee bean extracts by GC GC TOF MS
 Application Released: January 6 Application ote Comprehensive analysis of coffee bean extracts by GC GC TF MS Summary This Application ote shows that BenchTF time-of-flight mass spectrometers, in conjunction
Survival of the Fittest: The Impact of Eco-certification on the Performance of German Wineries Patrizia FANASCH
 Padua 2017 Abstract Submission I want to submit an abstract for: Conference Presentation Corresponding Author Patrizia Fanasch E-Mail Patrizia.Fanasch@uni-paderborn.de Affiliation Department of Management,
5. Supporting documents to be provided by the applicant IMPORTANT DISCLAIMER
 Guidance notes on the classification of a flavouring substance with modifying properties and a flavour enhancer 27.5.2014 Contents 1. Purpose 2. Flavouring substances with modifying properties 3. Flavour
The Wild Bean Population: Estimating Population Size Using the Mark and Recapture Method
 Name Date The Wild Bean Population: Estimating Population Size Using the Mark and Recapture Method Introduction: In order to effectively study living organisms, scientists often need to know the size of
Elemental Analysis of Yixing Tea Pots by Laser Excited Atomic. Fluorescence of Desorbed Plumes (PLEAF) Bruno Y. Cai * and N.H. Cheung Dec.
 Bruno Y. Cai * and N.H. Cheung Dec.") Elemental Analysis of Yixing Tea Pots by Laser Excited Atomic Fluorescence of Desorbed Plumes (PLEAF) Bruno Y. Cai * and N.H. Cheung 2012 Dec. 31 Summary Two Yixing tea pot samples were analyzed by PLEAF.
Elemental Analysis of Yixing Tea Pots by Laser Excited Atomic Fluorescence of Desorbed Plumes (PLEAF) Bruno Y. Cai * and N.H. Cheung 2012 Dec. 31 Summary Two Yixing tea pot samples were analyzed by PLEAF.
Flavour release and perception in reformulated foods
 Flavour release and perception in reformulated foods Towards a better understanding Christian Salles INRA, France 1 Background Many solutions have been proposed to decrease salt in foods but most of them
Structures of Life. Investigation 1: Origin of Seeds. Big Question: 3 rd Science Notebook. Name:
 3 rd Science Notebook Structures of Life Investigation 1: Origin of Seeds Name: Big Question: What are the properties of seeds and how does water affect them? 1 Alignment with New York State Science Standards
Which of your fingernails comes closest to 1 cm in width? What is the length between your thumb tip and extended index finger tip? If no, why not?
 wrong 0 1 2 3 4 5 6 7 8 9 10 11 12 13 14 15 16 17 right 66 65 64 63 62 61 60 59 58 57 56 55 54 53 52 51 50 49 score 100 98.5 97.0 95.5 93.9 92.4 90.9 89.4 87.9 86.4 84.8 83.3 81.8 80.3 78.8 77.3 75.8 74.2
TEACHER NOTES MATH NSPIRED
 Math Objectives Students will use a ratio to create and plot points and will determine a mathematical relationship for plotted points. Students will compute the unit rate given a ratio. Students will predict
2. Materials and methods. 1. Introduction. Abstract
 Standardizing Peanut Roasting Process Of Peanut Butter Production N. K. Dhamsaniya and N. C. Patel Junagadh Agricultural University, Junagadh, Gujarat, India Abstract The current practice of roasting peanut
STACKING CUPS STEM CATEGORY TOPIC OVERVIEW STEM LESSON FOCUS OBJECTIVES MATERIALS. Math. Linear Equations
 STACKING CUPS STEM CATEGORY Math TOPIC Linear Equations OVERVIEW Students will work in small groups to stack Solo cups vs. Styrofoam cups to see how many of each it takes for the two stacks to be equal.
An application of cumulative prospect theory to travel time variability
 Katrine Hjorth (DTU) Stefan Flügel, Farideh Ramjerdi (TØI) An application of cumulative prospect theory to travel time variability Sixth workshop on discrete choice models at EPFL August 19-21, 2010 Page
KEY. Chemistry End of Year Cornerstone Assessment: Part A. Experimental Design
 Chemistry End of Year Cornerstone Assessment: Part A. Experimental Design Directions: Read the paragraph below and then respond to the questions. Baking soda and vinegar react to form carbon dioxide gas.
Biologist at Work! Experiment: Width across knuckles of: left hand. cm... right hand. cm. Analysis: Decision: /13 cm. Name
 wrong 0 1 2 3 4 5 6 7 8 9 10 11 12 13 14 15 16 17 18 19 20 right 72 71 70 69 68 67 66 65 64 63 62 61 60 59 58 57 56 55 54 53 52 score 100 98.6 97.2 95.8 94.4 93.1 91.7 90.3 88.9 87.5 86.1 84.7 83.3 81.9
Introduction. Introduction. Introduction. Cistus. Cistus Pyrophytic ecology. Cistus 07/03/2014
 Predictive empirical models for mushroom production in ladanifer stands. Guzman y Vargas (Molecular Phylogenetics and Evolution Volume 37, Issue 3 644-6 Fig. Distribution map and number of species. Pie
Vibration Damage to Kiwifruits during Road Transportation
 International Journal of Agriculture and Food Science Technology. ISSN 2249-3050, Volume 4, Number 5 (2013), pp. 467-474 Research India Publications http://www.ripublication.com/ ijafst.htm Vibration Damage
distinct category of "wines with controlled origin denomination" (DOC) was maintained and, in regard to the maturation degree of the grapes at
 was maintained and, in regard to the maturation degree of the grapes at") ABSTARCT By knowing the fact that on an international level Romanian red wines enjoy a considerable attention, this study was initiated in order to know the possibilities of obtaining in Iaşi vineyard
ABSTARCT By knowing the fact that on an international level Romanian red wines enjoy a considerable attention, this study was initiated in order to know the possibilities of obtaining in Iaşi vineyard
Lecture 9: Tuesday, February 10, 2015
 Com S 611 Spring Semester 2015 Advanced Topics on Distributed and Concurrent Algorithms Lecture 9: Tuesday, February 10, 2015 Instructor: Soma Chaudhuri Scribe: Brian Nakayama 1 Introduction In this lecture