PNG Agro-Industry is Diverse, has great potential and not just Fisheries!
|
|
|
- Donna Webb
- 5 years ago
- Views:
Transcription

1 PNG Agro-Industry is Diverse, has great potential and not just Fisheries!

2 Coffee and Tea plantings - fertile Wahgi valley
 Photo R")
3 Outgrower Oil Palm Production (Fresh fruit bunches for collection) Photo R Roe

4 Oil Palm Estates (this in West New Britain)

5 Smallholder Coffee Production the backbone of the industry

6 Sun-dried smalllholder Arabica Coffee

7 Village Coffee Pulping

8

9

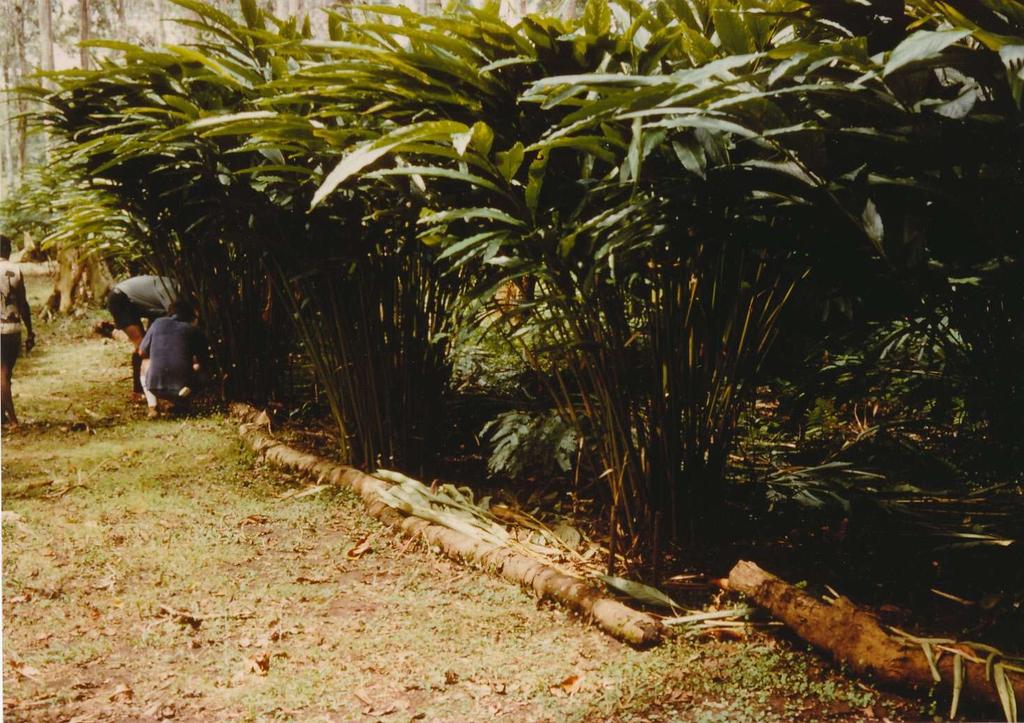
10 Smallholder Vanilla and other spices

11

12 Ramu Sugar
13 Cardamom
14 New Guinea isle - Long agricultural history Kuk 8,000 years Source of various crops e.g. sugar, varieties of banana etc later arrival of sweet potato External trade: Outsiders long saw production/trade potential e.g. Dampier et al 18 th C - for spices whales, birds of paradise feathers, 19 th C trochus shells, copra and rubber turn of C coffee trials (ENBP) Agriculture remains backbone to broad-based jobs and income earning (agric-fisheries-forestry still about 1/3 of GDP) Was the major export earner until 1984, when overtaken by minerals Post WW2, was dominated by coffee, cocoa, copra-coconut oil and (post 1960s) palm oil initially these crops largely plantation production, but esp post Independence increasingly smallholder output (except oil palm) After production boost in 1970s, total output for these relatively static, except palm oil palm which enjoyed major investment, largely in estates (and became the major export crop) Rubber areas diminished, but the crop remains an important localised lowland crop, mostly on estates with some recent expansion again; plus tea estates in WHP
15 Volatile spices production (cardamom, vanilla, chillies, etc); various other minor export crops (pyrethrum etc) Other cash crops sugar (partly for export), lately cassava for fuel, cashew (trials) Food crops and meat largely for domestic market, including commercial fruit and vegetable pineapple, but some live cattle exports Production constraints: years of low prices, poor access/infrastructure, poor market information, Some recovery of staple foods and export crop prices from 2006 Some modest production response, but needs sustained incentives (price), removed impediments, effective invesetment in R & D and PPPs Issues related to (appreciating) exchange rate and extractive industries Issues of bulking product for market need Niche /Specialty markets, fairtrade, organic RSPO oil palm some downstream processing (UK and oil palm PNG refinery), essential oils, virgin coconut oil, cocoa butter-chocolate, local roasts etc
16 percentage Percentage of GDP by Economic Activity (source:nso and Treasury forecast) Agric/forest/fish 30.0 Oil and Gas extraction Mining/quarrying 25.0 Construction 20.0 Manufacturing Community/Social 15.0 Wholesale/Retail
17 Percentage % of Total Exports - by Value (BPNG) -note that 2010 is extrapolated from 6 months data, which distorts, particularly seasonal crops Copper Gold Crude Oil Total Agriculture (excl. forestry/fisheries) Total forest products 5.00 Marine Products
18 million kina Exports -Value FOB (mil kina) (BPNG) 7,000.0 Total Agriculture (excl. forestry/fisheries) 6,000.0 Total forest products 5, ,000.0 Marine Products 3,000.0 Crude Oil 2, ,000.0 Gold year Copper
19 '000 tonnes (or other measure) Commodity Exports - Quantity, 1999-June 2010, doubled for crude annual output - underestimating season crops ('000 tonnes or specified) (BPNG) Coffee Cocoa Copra Coconut Oil Palm Oil Rubber Tea Logs ('0,000 m3) Marine Prods Crude Oil ('000 Barrels) year ( months data) Copper Gold (tonnes)
20 US cts/lb International Coffee Prices (US Cts/lb) 1998-Jan ICO Composite Price Other Mild Arabicas - weighted ave Robusta weighted ave Year and month
21 million kina Agricultural Export Crops - FOB Value (kina, million) (BPNG) ) 1, , Coffee Cocoa Copra Coconut Oil Palm Oil Rubber Tea
22 US Dollars per Tonne International Cocoa Price - daily price (ICCO) Jan 2002-Jan 5th Year and month
23 Feb-81 Nov-81 Aug-82 May-83 Feb-84 Nov-84 Aug-85 May-86 Feb-87 Nov-87 Aug-88 May-89 Feb-90 Nov-90 Aug-91 May-92 Feb-93 Nov-93 Aug-94 May-95 Feb-96 Nov-96 Aug-97 May-98 Feb-99 Nov-99 Aug-00 May-01 Feb-02 Nov-02 Aug-03 May-04 Feb-05 Nov-05 Aug-06 May-07 Feb-08 Nov-08 Aug-09 May-10 Feb-11 Nov Palm Oil Price USD per tonne 1981-Nov
24 Nov-85 Jul-86 Mar-87 Nov-87 Jul-88 Mar-89 Nov-89 Jul-90 Mar-91 Nov-91 Jul-92 Mar-93 Nov-93 Jul-94 Mar-95 Nov-95 Jul-96 Mar-97 Nov-97 Jul-98 Mar-99 Nov-99 Jul-00 Mar-01 Nov-01 Jul-02 Mar-03 Nov-03 Jul-04 Mar-05 Nov-05 Jul-06 Mar-07 Nov-07 Jul-08 Mar-09 Nov-09 Jul-10 Mar-11 Nov-11 Rubber - Monthly Price - No 1 smoked FOB Malaysia USD/lb (1985-Nov 2011)

25
Coffee prices maintain downward trend as 2015/16 production estimates show slight recovery
 Coffee prices maintain downward trend as 2015/16 production estimates show slight recovery The coffee market fell again in December 2015, reaching its second lowest monthly average of the year. This decrease
MONTHLY COFFEE MARKET REPORT
 E MONTHLY COFFEE MARKET REPORT June 2013 Coffee prices fell sharply in June 2013, as market fundamentals, combined with an uncertain macroeconomic outlook, drove the ICO composite indicator price to its
July marks another month of continuous low prices
 July marks another month of continuous low prices In July 2018, the ICO composite indicator price decreased by 2.9% to an average of 107.20 US cents/lb, which is the lowest monthly average for July since
Coffee market ends 2014 at ten month low
 Coffee market ends 2014 at ten month low Coffee prices continued to slide downwards in December 2014, with the monthly average of the ICO composite indicator at its lowest level since February. Recent
Coffee Season 2013/14 Finishes in Balance but Deficit Expected Next Year
 Coffee Season 2013/14 Finishes in Balance but Deficit Expected Next Year Coffee prices were volatile again over the course of September, mostly reacting to weather news from Brazil. Daily prices fell initially
May 2003 MONTHLY INDICES OF FREE MARKET PRICES IN US DOLLARS 1985 = 100
 MONTHLY INDICES OF FREE MARKET PRICES IN US DOLLARS 1985 = 100 Moving averages ALL FOOD 95 100 95 95 97 94 100 102 100 103 106 106 102 99 * TROPICAL BEVERAGES AND FOOD 98 102 97 97 99 95 102 105 101 104
April 2003 MONTHLY INDICES OF FREE MARKET PRICES IN US DOLLARS 1985 = 100 ALL FOOD
 MONTHLY INDICES OF FREE MARKET PRICES IN US DOLLARS 1985 = 100 Moving averages ALL FOOD 95 100 95 95 95 97 94 100 102 100 103 106 106 102 * TROPICAL BEVERAGES AND FOOD 99 101 98 97 97 99 95 102 105 101
Record exports from Brazil weigh heavy on the coffee market
 Record exports from Brazil weigh heavy on the coffee market Coffee exports from Brazil reached a record high of 36.8 million bags in crop year 2014/15 (April to March), fuelled by domestic stocks and encouraged
Coffee prices rose slightly in January 2019
 Coffee prices rose slightly in January 2019 In January 2019, the ICO composite indicator rose by 0.9% to 101.56 US cents/lb as prices for all group indicators increased. After starting at a low of 99.16
Coffee market ends 2016/17 coffee year in deficit for the third consecutive year
 Coffee market ends 2016/17 coffee year in deficit for the third consecutive year The ICO composite indicator continued its downward trend that started at the end of August, averaging 124.46 US cents/lb.
Coffee market recovers slightly from December slump
 Coffee market recovers slightly from December slump After reaching its lowest level in 22 months in December 2017, the monthly average of the ICO composite indicator price increased by 1.4% to 115.60 US
November 2012 MONTHLY INDICES OF FREE MARKET PRICES IN US DOLLARS 2000 = 100
 MONTHLY INDICES OF FREE MARKET PRICES IN US DOLLARS 2000 = 100 Moving averages ALL FOOD 274 267 261 253 254 260 269 267 264 262 283 282 280 272 * TROPICAL BEVERAGES AND FOOD 267 262 256 247 248 254 262
Record Exports for Coffee Year 2016/17
 Record Exports for Coffee Year 2016/17 Total exports in September 2017 reached 8.34 million bags, compared to 9.8 million in September 2016. While coffee year 2016/17 registered a decrease in its final
Coffee market remains volatile but lacks direction
 Coffee market remains volatile but lacks direction Prices fluctuated significantly during August, with the ICO composite indicator dropping by 10 cents before jumping back up another 12 cents by the end
Volatility returns to the coffee market as prices stay low
 Volatility returns to the coffee market as prices stay low Daily coffee prices hit their lowest level in 19 months during August, as commodity markets worldwide were negatively affected by currency movements
Prices for all coffee groups increased in May
 Prices for all coffee groups increased in May In May 2018, the ICO composite indicator increased by 0.7% to an average of 113.34 US cents/lb, following three months of declines. Prices for all coffee groups
Record exports in coffee year 2017/18
 Record exports in coffee year 2017/18 Total coffee exports increased each year since 2010/11 with a new record reached in 2017/18 at 121.86 million bags, 2% higher than 2016/17. In the twelve months ending
Growing divergence between Arabica and Robusta exports
 Growing divergence between Arabica and Robusta exports In April 218, the ICO composite indicator decreased by.4% to an average of 112.56, with the daily price ranging between 11.49 and 114.73. Prices for
Commodity Market Monthly
 Commodity Market Monthly Research Department, Commodities Unit June 1, 216 www.imf.org/commodities commodities@imf.org Commodity prices surged 6. percent in May, extending gains for fourth consecutive
Coffee market settles lower amidst strong global exports
 Coffee market settles lower amidst strong global exports The ICO composite indicator price declined by 1.2% in February 2018 to an average of 114.19 US cents/lb. Indicator prices for all three Arabica
Coffee market continues downward trend
 Coffee market continues downward trend Since August 2017, the ICO composite indicator price has declined in each month except January 2018. The composite indicator decreased by 1.1% in March 2018 to an
Coffee market ends 2017/18 in surplus
 Coffee market ends 217/18 in surplus World coffee production in coffee year 217/18 is estimated 5.7% higher at 164.81 million bags as output of Arabica increased by 2.2% to 11.82, and Robusta grew 11.7%
May 2012 MONTHLY INDICES OF FREE MARKET PRICES IN US DOLLARS 2000 = 100
 MONTHLY INDICES OF FREE MARKET PRICES IN US DOLLARS 2000 = 100 Moving averages ALL FOOD 251 266 * TROPICAL BEVERAGES AND FOOD 244 260 - TROPICAL BEVERAGES 240 252 - FOOD 245 261 * VEGETABLE OILSEEDS AND
World coffee consumption increases but prices still low
 World coffee consumption increases but prices still low The coffee market stabilised slightly in February, but prices remain at very low levels. A lack of news regarding fundamentals with expectations
March 2012 MONTHLY INDICES OF FREE MARKET PRICES IN US DOLLARS 2000 = 100
 MONTHLY INDICES OF FREE MARKET PRICES IN US DOLLARS 2000 = 100 Moving averages ALL FOOD 240 268 * TROPICAL BEVERAGES AND FOOD 235 261 - TROPICAL BEVERAGES 225 264 - FOOD 236 261 * VEGETABLE OILSEEDS AND
MONTHLY COFFEE MARKET REPORT
 1 E MONTHLY COFFEE MARKET REPORT March 2014 Ongoing uncertainty over the Brazilian coffee crop has caused significant fluctuations in coffee prices during March, with monthly volatility of the International
2018/19 expected to be the second year of surplus
 2018/19 expected to be the second year of surplus Coffee year 2018/19 is expected to be the second consecutive season of surplus, as global output, estimated at 167.47 million bags, exceeds world consumption,
Commodity Markets Review
 Public Disclosure Authorized Public Disclosure Authorized Public Disclosure Authorized Public Disclosure Authorized October 9, 2008 Commodity Markets Review Non-energy commodity prices fell 5.2 percent
THIS REPORT CONTAINS ASSESSMENTS OF COMMODITY AND TRADE ISSUES MADE BY USDA STAFF AND NOT NECESSARILY STATEMENTS OF OFFICIAL U.S.
 THIS REPORT CONTAINS ASSESSMENTS OF COMMODITY AND TRADE ISSUES MADE BY USDA STAFF AND NOT NECESSARILY STATEMENTS OF OFFICIAL U.S. GOVERNMENT POLICY Required Report - public distribution Date: GAIN Report
THOMSON REUTERS INDICES CONTINUOUS COMMODITY TOTAL RETURN INDEX
 THOMSON REUTERS INDICES CONTINUOUS COMMODITY TOTAL RETURN INDEX December 2012 1 TABLE OF CONTENTS Index Description 3 Methodology 3 Contract Roll 4 Real-Time Pricing Considerations 4 Constituent Contracts
MONTHLY COFFEE MARKET REPORT
 E MONTHLY COFFEE MARKET REPORT May 2014 After five consecutive months of rising prices, the coffee market reversed lower in May. From a high of 179 cents/lb in April, the daily price of the ICO composite
THE GLOBAL PULSE MARKETS: recent trends and outlook
 THE GLOBAL PULSE MARKETS: recent trends and outlook CICILS/IPTIC 2004 CONVENTION 10-12 12 June 2004 Beijing, China Boubaker BENBELHASSEN Commodities and Trade Division United Nations Food and Agriculture
MONTHLY COFFEE MARKET REPORT
 E MONTHLY COFFEE MARKET REPORT February 2014 February 2014 has seen significant developments in the coffee market, with prices shooting upwards at a startling rate. The ICO composite daily price has increased
Commodity Markets Review
 Public Disclosure Authorized Public Disclosure Authorized Public Disclosure Authorized September 7, 2006 Commodity Markets Review Non-oil commodity prices were unchanged in August but are up 23.7 percent
MONTHLY COFFEE MARKET REPORT
 E MONTHLY COFFEE MARKET REPORT July 2012 Coffee prices rebounded in July 2012, with the ICO composite indicator increasing by 9.5% compared to June, following nine consecutive months of price falls. The
Agricultural Exports, Economic Prospects and Jobs
 Agricultural Exports, Economic Prospects and Jobs West Hills Community College District Essential Elements Harris Ranch Inn and Conference Center November 6, 2014 Daniel A. Sumner University of California
LETTER FROM THE EXECUTIVE DIRECTOR
 E LETTER FROM THE EXECUTIVE DIRECTOR COFFEE MARKET REPORT December 2008 Price levels in December confirmed the downward trend recorded in the coffee market since September 2008. The monthly average of
Commodity Markets Review
 Public Disclosure Authorized Public Disclosure Authorized Public Disclosure Authorized Public Disclosure Authorized February 10, 2006 Commodity Markets Review Non-oil commodity prices surged 4.9 percent
Coffee market ends 2015/16 in deficit for the second consecutive year
 Coffee market ends 2015/16 in deficit for the second consecutive year The coffee market settled up by 5.5% in September, mostly driven by a steady increase in Robusta prices supported by concerns over
Downward correction in coffee market as supply prospects improve
 Downward correction in coffee market as supply prospects improve The recent rally in coffee prices underwent a notable reversal in November 2016, attributed to improved weather prospects in Brazil and
APPENDIX. Projections Commodity Unit Actual
 Projections Commodity Unit 1970 1980 1990 1997 1998 1999 2000 2001 2005 2010 Coal, US $/mt na. 43.10 41.67 36.39 34.38 33.25 33.00 33.50 35.50 38.00 Crude oil, avg. spot $/bbl 1.21 36.87 22.88 19.17 13.07
THIS REPORT CONTAINS ASSESSMENTS OF COMMODITY AND TRADE ISSUES MADE BY USDA STAFF AND NOT NECESSARILY STATEMENTS OF OFFICIAL U.S.
 THIS REPORT CONTAINS ASSESSMENTS OF COMMODITY AND TRADE ISSUES MADE BY USDA STAFF AND NOT NECESSARILY STATEMENTS OF OFFICIAL U.S. GOVERNMENT POLICY Required Report - public distribution Date: 11/13/2009
34 COMMODITY MARKETS AND THE DEVELOPING COUNTRIES COMMODITY PRICE OUTLOOK. TABLE Al. COMMODITY PRICES AND PRICE PROJECTIONS IN CONSTANT I 990 DOLLARS
 TABLE Al. COMMODITY PRICES AND PRICE PROJECTIONS IN CONSTANT I 990 DOLLARS Short-term Long-term Actual projections projections Commodity Unit 1970 1980 1985 1990 1993 1994 1995 1996 1997 1998 2000 2005
IN THIS ISSUE FEBRUARY Financial Calendar: Late September 2014 Annual Results Announced. 26 March 2014 Interim Results Announced
 FEBRUARY 2014 Welcome to our latest Global Dairy Update. This update is part of Fonterra s commitment to informing our farmers and wider stakeholders about the global dairy market, trends in New Zealand
Commodity Markets Review
 Public Disclosure Authorized Public Disclosure Authorized Public Disclosure Authorized June 10, 2009 Commodity Markets Review Non-energy commodity prices jumped 4.5 percent in May, with relatively strong
June 2016 MONTHLY INDICES OF FREE MARKET PRICES IN US DOLLARS 2000 = 100
 MONTHLY INDICES OF FREE MARKET PRICES IN US DOLLARS 2000 = 100 Moving averages ALL FOOD 225 198 201 205 197 195 198 194 193 191 191 196 200 212 * TROPICAL BEVERAGES AND FOOD 225 197 200 205 198 196 198
WEEKLY MAIZE REPORT 28 NOVEMBER 2018
 WEEKLY MAIZE REPORT 28 NOVEMBER 2018 Unigrain (Pty) Ltd Tel. No. : +27 11 692 4400 Fax. No. : +27 11 412 1183 INTERNATIONAL MARKET Table 1: CME Maize prices and weekly changes (cents/bushel) Currently
Commodity Markets Review
 February 10, 2009 Commodity Markets Review Non-energy commodity prices rose 4.9 percent in January, up for the first time in six months. Commodity prices have broadly stabilized following the plunge in
Commodity Markets Review
 Commodity Markets Review January 14, 2011 Non-energy commodity prices rose for a sixth straight month in December, up 4.8 percent, despite a 3 percent gain in the value of the dollar versus the euro. For
Downward correction as funds respond to increasingly positive supply outlook
 Downward correction as funds respond to increasingly positive supply outlook Coffee prices fell sharply at the end of April as institutional investors sold off their positions. The coffee market continues
Chapter 3 PERFORMANCE OF SPICES TRADE IN INDIA AND KERALA
 Chapter 3 PERFORMANCE OF SPICES TRADE IN INDIA AND KERALA India occupies a prominent position in the world spice trade. In the estimated world trade of species of 8,50,000 tonnes valued at US$ 2,200 millions,
Overview of the Manganese Industry
 39th Annual Conference Istanbul, Turkey 2013 Overview of the Manganese Industry International Manganese Institute Alberto Saavedra Market Research Manager June, 2013 Introduction Global Production Supply,
Milk and Milk Products: Price and Trade Update
 Milk and Milk Products: Price and Trade Update June 217 * International dairy prices The FAO Dairy Price Index averaged 29 points in June, up 16 points (8.3 percent) from January 217 and 71 points (51.5
Outline. Long-term Outlook for Cotton Consumption. World End-Use Consumption of Textile Fibers. World Consumption of Textile Fibers
 World Cotton Supply and Use International Cotton Advisory Committee Secretariat Outline! Long-term Outlook for Consumption! Outlook for /! Developments in World Cotton Trade Fifth Open Session: Cotton
THIS REPORT CONTAINS ASSESSMENTS OF COMMODITY AND TRADE ISSUES MADE BY USDA STAFF AND NOT NECESSARILY STATEMENTS OF OFFICIAL U.S.
 THIS REPORT CONTAINS ASSESSMENTS OF COMMODITY AND TRADE ISSUES MADE BY USDA STAFF AND NOT NECESSARILY STATEMENTS OF OFFICIAL U.S. GOVERNMENT POLICY Required Report - public distribution Date: 5/16/2016
Coffee Supply Chain Development and Tourism in Timor-Leste
 Coffee Supply Chain Development and Tourism in Timor-Leste David Freedman, Asian Development Bank Country Economist, Timor-Leste. 18 July, 2016, Pacific Update Conference, Suva, Fiji. Today s Presentation
World Cocoa Prices. Commodity Prices Update: Coffee, Cocoa, and Cotton. Joelle Cook and Professor C. Leigh Anderson
 SDR per tonne Commodity Prices Update: Coffee, Cocoa, and Cotton Joelle Cook and Professor C. Leigh Anderson Prepared for the Agricultural Policy and Statistics Division of the Bill and Melinda Gates Foundation
Commodity Markets Review
 Commodity Markets Review December 10, 2010 Non-energy commodity prices rose for a fifth straight month in November, up 3.4 percent, despite slight strengthening of the dollar. There was large volatility
Coffee Market Outlook
 Coffee Market Outlook 15 th Asia International Coffee Conference Ho Chi Minh City, Vietnam 7-9 December 2009 Néstor Osorio Executive Director ICO composite indicator price Monthly: January 2000 to November
Outlook for the World Coffee Market
 Outlook for the World Coffee Market 8 th AFRICAN FINE COFFEE CONFERENCE & EXHIBITION 17 to 19 February 2011 Arusha, Tanzania José Sette Executive Director a.i. 225 ICO composite indicator price Monthly:
ETHIOPIA. A Quick Scan on Improving the Economic Viability of Coffee Farming A QUICK SCAN ON IMPROVING THE ECONOMIC VIABILITY OF COFFEE FARMING
 ETHIOPIA A Quick Scan on Improving the Economic Viability of Coffee Farming 1 OBJECTIVES OF STUDY Overall objective Identify opportunities for potential benefits to coffee farmers from improved farm profitability
Commodity Prices Rise By A Tenth Over The First Half Of The Year
 Press Rlease Press Release 30/07/09 The Halifax Commodities Monitor tracks the price performance of 20 major commodities across the four key commodity types (Energy, Precious Metals, Base Metals and Agriculture)
Becoming a Smarter Trader: The Market Impact of the Structure in the Sugar, Coffee, and OJ Markets
 Becoming a Smarter Trader: The Market Impact of the Structure in the Sugar, Coffee, and OJ Markets Judith Ganes March 12 th, 2014 Increasing Reliance on a Few Suppliers for Global Needs Efficiency gains
SEP'17: 171 MAR'18: 182 SEP'18: 183 Daily Volume. Euronext milling wheat futures 20/05 30/05 09/06 19/06 29/06 09/07 19/07
 Trade Weekly volume - thousand tonnes Total MY - million tonnes Weekly volume - thousand tonnes Total MY - million tonnes Weekly volume - thousand tonnes Total MY - million tonnes Million tonnes Production
World Cocoa Conference Nov 2012
 World Cocoa Conference 19-23 Nov 2012 Situation and prospects for cocoa supply & demand Laurent Pipitone Director of Economics & Statistics Division 1 Improving market information and transparency One
Market Outlook- Era of Oversupply?
 Rabobank Agri Commodity Markets Research Market Outlook- Era of Oversupply? Sintercafe November 9, 20 Keith Flury Senior Commodity Analyst - Agri Commodity Markets Research (ACMR) Food & Agribusiness Research
MONTHLY COFFEE MARKET REPORT
 E MONTHLY COFFEE MARKET REPORT February 2012 Coffee prices presented a mixed performance in February, with Arabicas slipping and Robustas increasing by a similar amount. This resulted in a sharp narrowing
SEP'16: 162 MAR'17: 169 SEP'17: 176 Daily Volume. Euronext milling wheat futures 14/05 24/05 03/06 13/06 23/06 03/07 13/07
 Trade Weekly volume - thousand tonnes Total for MY - million tonnes Weekly volume - thousand tonnes Total f or MY - million tonnes Weekly volume - thousand tonnes Total f or MY - million tonnes TRQs Thousand
The supply and demand for oilseeds in South Africa
 THIS REPORT CONTAINS ASSESSMENTS OF COMMODITY AND TRADE ISSUES MADE BY USDA STAFF AND NOT NECESSARILY STATEMENTS OF OFFICIAL U.S. GOVERNMENT POLICY Required Report - public distribution Date: GAIN Report
THIS REPORT CONTAINS ASSESSMENTS OF COMMODITY AND TRADE ISSUES MADE BY USDA STAFF AND NOT NECESSARILY STATEMENTS OF OFFICIAL U.S.
 THIS REPORT CONTAINS ASSESSMENTS OF COMMODITY AND TRADE ISSUES MADE BY USDA STAFF AND NOT NECESSARILY STATEMENTS OF OFFICIAL U.S. GOVERNMENT POLICY Required Report - public distribution Date: 5/9/2011
Brazil. Coffee Annual. Coffee
 THIS REPORT CONTAINS ASSESSMENTS OF COMMODITY AND TRADE ISSUES MADE BY USDA STAFF AND NOT NECESSARILY STATEMENTS OF OFFICIAL U.S. GOVERNMENT POLICY Required Report - public distribution Date: 5/7/2015
Commodity Profile of Edible Oil for May
 Commodity Profile of Edible Oil for May - 2017 As on 17.05.2017 Contents 1. Edible Oil estimates for India ( marketing year- November 2016- October 2017)... 2 2. Production Trend of Domestic Oilseeds...
Soybean Oil and Palm Oil Account For An Increasing Share of World Vegetable Oil Consumption
 United States Department of Agriculture Foreign Agricultural Service Circular Series FOP 01-03 January 2003 Soybean Oil and Palm Oil Account For An Increasing Share of World Vegetable Oil Consumption Percent
September 2014 MONTHLY INDICES OF FREE MARKET PRICES IN US DOLLARS 2000 = 100
 MONTHLY INDICES OF FREE MARKET PRICES IN US DOLLARS 2000 = 100 Moving averages ALL FOOD 260 242 240 241 239 237 233 244 252 248 246 243 238 240 * TROPICAL BEVERAGES AND FOOD 258 238 237 238 234 232 228
Dairy Outlook. December By Jim Dunn Professor of Agricultural Economics, Penn State University. Market Psychology
 Dairy Outlook December 2015 By Jim Dunn Professor of Agricultural Economics, Penn State University Market Psychology The Class III market has taken a beating lately as cheese prices have drifted down and
Ecobank s pan-african footprint. Africa-Asia trade flows
 Ecobank s pan-african footprint Africa-Asia trade flows Ghana, Côte d Ivoire and Nigeria: The changing face of West African cocoa Dr Edward George Head of Group Research, Ecobank Lagos, February 3rd 2016
Commodity Markets Review
 Public Disclosure Authorized Public Disclosure Authorized Public Disclosure Authorized May 10, 2006 Commodity Markets Review Copper, nickel and zinc reached all-time highs in May, due to low stocks, capacity
Commodity Markets Review
 Public Disclosure Authorized Public Disclosure Authorized Public Disclosure Authorized October 8, 2009 Commodity Markets Review Non-energy commodity prices fell 0.6 percent in September with all main groups
MONTHLY COFFEE MARKET REPORT
 E MONTHLY COFFEE MARKET REPORT August 2012 Coffee prices experienced negative corrections across the board in August 2012, with the ICO composite indicator falling by 6.6% compared to July. This continues
Corn and Soybean CORN OUTLOOK SOYBEAN OUTLOOK STATISTICS AND ANALYSIS
 Corn and Soybean CORN OUTLOOK SOYBEAN OUTLOOK STATISTICS AND ANALYSIS CLAL (and its officers, employees and auxiliary persons) shall not be liable to clients, web users or anyone else for any loss or injury
WEEKLY MAIZE REPORT 06 FEBRUARY 2019
 WEEKLY MAIZE REPORT 06 FEBRUARY 2019 Unigrain (Pty) Ltd Tel. No. : +27 11 692 4400 Fax. No. : +27 11 412 1183 INTERNATIONAL MARKET Table 1: CME Maize prices and weekly changes (cents/bushel) Currently
WORLD SPICE CONGRESS 2010 Black & White Pepper Crop Report. Harris Freeman & Co.
 WORLD SPICE CONGRESS 2010 Black & White Pepper Crop Report Harris Freeman & Co. 1 The Past BLACK & WHITE PEPPER CROP REPORT A 5-Year PERSPECTIVE 5 year Supply & Demand statistics Factors Affecting Supply
For personal use only
 SEPTEMBER 216 GLOBAL DAIRY UPDATE European milk production has decreased for the first time since early 215, with volumes in June down 2 compared to last year. Last week we announced our annual results,
Ukrainian Market for Fruits and Vegetables. Oksana Varodi International Finance Corporation Berlin, Fruit Logistica 2011
 Ukrainian Market for Fruits and Vegetables Oksana Varodi International Finance Corporation Berlin, Fruit Logistica 2011 Content of the Presentation Production Trade Current challenges and opportunities
The Multiple Dimensions of Risk in Coffee
 The Multiple Dimensions of Risk in Coffee Annual Conference Forum on Agricultural Risk Management in Development 9-10 June 2011 Zurich, Switzerland José Sette Executive Director a.i. 1. Types of risk SUMMARY
US Aromatics. Overview on US Aromatics Feedstocks Adhesives and Sealants Council, Zachary Moore Markets Reporter.
 US Aromatics Overview on US Aromatics Feedstocks Adhesives and Sealants Council, Zachary Moore Markets Reporter www.icis.com 1 US Benzene Overview Production Imports/Exports Consumption Summary US Toluene
Economic Contributions of the Florida Citrus Industry in and for Reduced Production
 Economic Contributions of the Florida Citrus Industry in 2014-15 and for Reduced Production Report to the Florida Department of Citrus Alan W. Hodges, Ph.D., Extension Scientist, and Thomas H. Spreen,
China s Corn Processing Industry: Its Future Development and Implications for World Trade
 China s Corn Processing Industry: Its Future Development and Implications for World Trade Prepared by National Grain & Oils Information Center,China XiaoHui Wang April, 2007 Agriculture Production - No.
Asian Containerboard Markets
 Asian Containerboard Markets An Update on China: The Changes Keep Coming International Containerboard Conference November 2018 Beth Lis Vice President, Asian Paper & Packaging Beth Lis VP Asian Paper &
GLOBAL DAIRY UPDATE KEY DATES MARCH 2017
 MARCH 2017 GLOBAL DAIRY UPDATE European milk production decreased for the seventh consecutive month, while the US remains strong. The rate of decline in New Zealand production is easing. US exports continue
Soft Commodity Markets - Upcoming Milestones, and How the Market Could Be Affected
 Soft Commodity Markets - Upcoming Milestones, and How the Market Could Be Affected September 15, 2014 Judith Ganes President J. Ganes Consulting, LLC Weather & Politics Current Weather Expectations El
SEP'16: 154 MAR'17: 163 SEP'17: 173 Daily Volume. Euronext milling wheat futures 07/05 17/05 27/05 06/06 16/06 26/06 06/07
 Trade Weekly volume - thousand tonnes Total for MY - million tonnes Weekly volume - thousand tonnes Total f or MY - million tonnes Weekly volume - thousand tonnes Total f or MY - million tonnes TRQs Thousand
THIS REPORT CONTAINS ASSESSMENTS OF COMMODITY AND TRADE ISSUES MADE BY USDA STAFF AND NOT NECESSARILY STATEMENTS OF OFFICIAL U.S.
 THIS REPORT CONTAINS ASSESSMENTS OF COMMODITY AND TRADE ISSUES MADE BY USDA STAFF AND NOT NECESSARILY STATEMENTS OF OFFICIAL U.S. GOVERNMENT POLICY Required Report - public distribution Date: 5/7/2014
DEC'17: 163 MAY'18: 172 DEC'18: 177 Daily Volume. Euronext milling wheat futures 03/09 13/09 23/09 03/10 13/10 23/10 02/11
 Trade Weekly volume - thousand tonnes Total MY - million tonnes Weekly volume - thousand tonnes Total MY - million tonnes Weekly volume - thousand tonnes Total MY - million tonnes Million tonnes Production
much better than in As may be seen in Table 1, the futures market prices for the next 12 months
 Dairy Outlook December 2009 By Jim Dunn Professor of Agricultural Economics, Penn State University Market Psychology prices are higher than last month, especially Class IV. The outlook for dairy prices
RECENT STATUS OF COFFEE BERRY BORRER IN INDONESIA I. INTRODUCTION ECONOMY OF COFFEE COFFEE GROWING IN INDONESIA AGRICULTURAL PRACTICES ON COFFEE (2)
") RECENT STATUS OF COFFEE BERRY BORRER IN INDONESIA ICO Seminar on Coffee Berry Borrer London, 17 March 29 I. INTRODUCTION Surip Mawardi Soekadar Wiryadiputra Indonesian Coffee and Cocoa Research Institute
RECENT STATUS OF COFFEE BERRY BORRER IN INDONESIA ICO Seminar on Coffee Berry Borrer London, 17 March 29 I. INTRODUCTION Surip Mawardi Soekadar Wiryadiputra Indonesian Coffee and Cocoa Research Institute
Consistently higher production and more exportable supplies from Thailand are major factors in the decline in world rice prices in 2014 and continued
 Rice Consistently higher production and more exportable supplies from Thailand are major factors in the decline in world rice prices in 2014 and continued lower levels over the next ten years. Part of
MGEX Spring Wheat 2013
 MGEX Spring Wheat 213 The Minneapolis Grain Exchange, Inc. (MGEX) has been the principal market for hard red spring (HRS) wheat since 1881, offering futures and options contracts based on this unique commodity.
MAR'17: 172 SEP'17: 174 MAR'18: 178 Daily Volume. Euronext milling wheat futures 24/12 03/01 13/01 23/01 02/02 12/02 22/02
 Trade Weekly volume - thousand tonnes Total MY - million tonnes Weekly volume - thousand tonnes Total MY - million tonnes Weekly volume - thousand tonnes Total MY - million tonnes Million tonnes Production
Coffee Semi-Annual 2007
 GAIN Report Global Agriculture Information Network Template Version 2.9 Required Report - public distribution Date: 11/15/27 CO719 Colombia GAIN Report Number: CO719 Coffee Semi-Annual 27 Approved by: