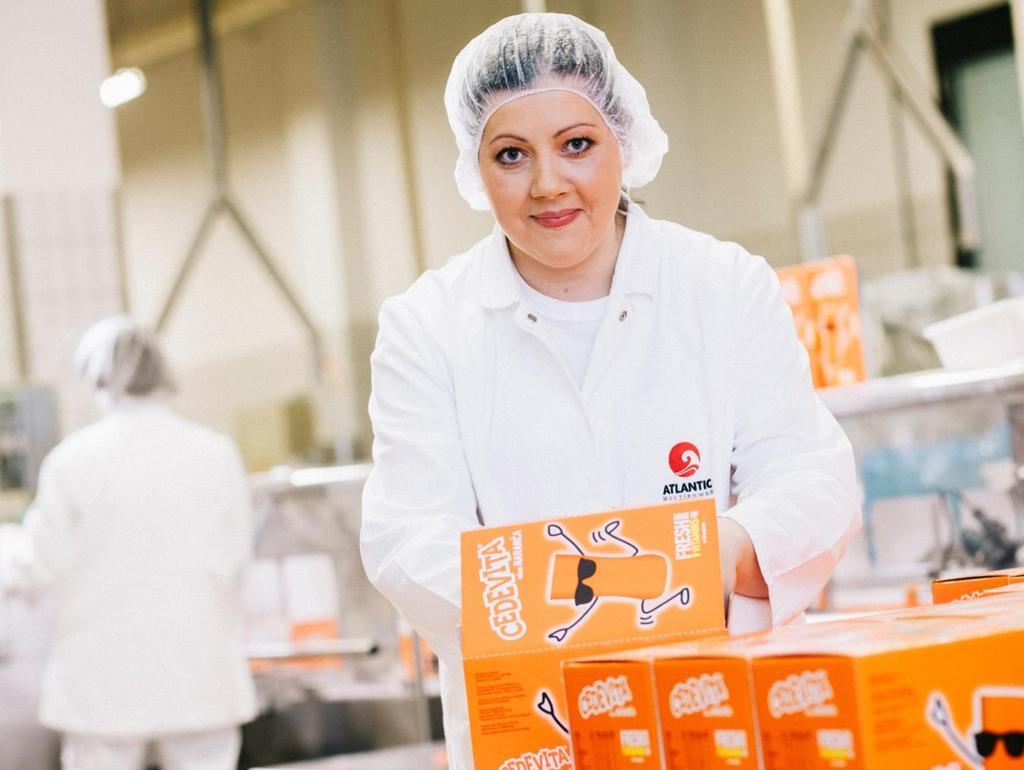
PRODUCTION DISTRIBUTION. = Leading regional manufacturer and distributor of FMCG brands
|
|
|
- Elfrieda George
- 5 years ago
- Views:
Transcription

1 London, March 27 th 2017

2 PRODUCTION DISTRIBUTION + = Leading regional manufacturer and distributor of FMCG brands
: EUR 405m FY16 sales: EUR 678m FY16 EBITDA:")
3 18 distribution centres 19 production facilities in 6 countries 40 product presence on over 40 markets 5500 employees on 12 markets Among the leading food and beverage companies in the SEE region Founded in 1991 Listed on the Zagreb Stock Exchange since 2007 MCap (20/03/2017): EUR 405m FY16 sales: EUR 678m FY16 EBITDA: EUR 63m 3


4 Management Board Ownership structure as of March15 th 2017 Emil Tedeschi Founder / President of the Management Board Others 10.5% Croatian pension funds 30.3% Emil Tedeschi 50.2% Mladen Veber Senior Vice President Business Operations Zoran Stanković Vice President Finance Neven Vranković Vice President Corporate Affairs Management 1.2% EBRD 2.0% Lada Tedeschi Fiorio 5.8% ATLANTIC GRUPA - THE BEST MANAGED COMPANY IN st in CROATIA 2 nd in the CEE region 1 st in the FOOD & BEVERAGE sector in the CEE Free float: 44.0% (according to the Zagreb Stock Exchange, free float does not include: treasury shares, shares in sole ownership over 5%, unless they are owned by pension funds) MANAGEMENT TEAM AND OWNERSHIP STRUCTURE 4
5 DISTRIBUTION DISTRIBUTION & PRODUCTION VERTICAL INTEGRATION European company National company Regional company s : Acquisition of DROGA KOLINSKA Growth in Germany and Austria Distribution centres across Croatia Various distribution cooperations Regional expansion 2001: Acquisition of CEDEVITA Several small-size acquisitions 2007: IPO 2005: Acquisition of MULTIPOWER Sales in EURm CAGR : +29.5% * *: Pro-forma consolidated with Droga Kolinska CEDEVITA MULTIPOWER DROGA KOLINSKA HISTORICAL DEVELOPMENT: TRACK RECORD IN VALUE CREATION 5
6 Pro forma cons 2010 Sales, EUR millions % 12.0% 10.0% 8.0% 6.0% 4.0% 2.0% 0.0% 11.8% 11.1% 11.5% 12.0% 11.8% 6.2% 2.8% Pro forma cons % 1.5% Margin overview 8.2% 8.6% 8.7% 10.5% 7.5% 9.3% 6.0% 4.0% 4.2% 4.5% 3.2% 2.3% EBITDA margin EBIT margin Net profit/loss margin Net debt/ebitda ROaE, ROCE Pro forma cons % 12.0% 10.0% 8.0% 6.0% 4.0% 2.0% 0.0% 11.8% 11.3% Pro forma cons % 12.7% 12.5% 9.4% 10.4% 12.7% 12.4% 13.1% 9.8% 7.6% 8.2% 4.7% ROaE ROCE HISTORICAL DEVELOPMENT OF KEY FINANCIAL INDICATORS 6
7 Performance on capital market ATGR-R-A Crobex Crobex10 40% 0% -40% 2.0% 8.0% 6.4% 7.8% 18.1% 17.1% -11.5% -2.9% -1.1% 30.9% -2.7% 34.0% 1.2% 3.1% 2.4% -80% Valuation Last price in reporting period Market capitalization* (in HRK millions) 2, ,777.1 Average daily turnover (in HRK thousands) EV (in HRK millions) 4, ,457.7 EV/EBITDA EV/EBIT EV/sales EPS (in HRK) P/E *Closing price multiplied by the total number of shares PERFORMANCE ON CROATIAN CAPITAL MARKET 7

8 8 PORTFOLIO OVERVIEW 8
9 Market share Barcaffe/ Grand kafa Argeta Smoki Cedevita Value share Croatia 13.2% 12.1% 25.1% 21.4% 18.5% 16.8% 78.5% 77.6% Serbia 52.9% 52.0% 23.6% 20.4% 53.5% 57.6% 72.5% 73.1% Slovenia 77.1% 75.9% 43.6% 39.8% 46.2% 42.0% 86.0% 84.4% B&H % 49.2% 36.1% 40.1% 79.7% 79.3% Source: Nielsen Retail Panel for food and non-food categories, period: June - November 2016 Top 10 - Region Top 5 - Slovenia Top 5 - Croatia Top 5 - Serbia Top 5 - B&H Top 5 - Macedonia 1 Coca Cola 2 Milka 3 Cedevita 4 Vegeta 5 Argeta 6 Smoki 7 Orbit 8 Cockta 9 Nivea 10 Jana Barcaffe Jana Plazma Argeta Argeta Coca Cola Coca Cola Coca Cola Coca Cola Bitolski Cedevita Cedevita Smoki Milka Coca Cola Fructal Vegeta Moja kravica Cedevita Colgate Argeta Jamnica Milka Chipsy Stobi Flips Source: Valicon research 2016 OUR BRANDS 9

10 Source: Valicon research 2016 OUR BRANDS 9

11 INTERNATIONAL REGIONAL LOCAL BRANDS STRUCTURING 10
12 SALES PROFILE


13 Sales by segments 2016 (EUR 678m) Sales by countries 2016 (EUR 678m) Croatia 28.8% 2% 1% Principal brands 21.4% 9% Coffee 20.8% 21% Sweet and salted snacks 12.8% 10% Beverages 12.5% Savoury spreads 10.6% 11% 21% Pharma & Personal care 10.2% Sports and Functional Food 8.8% 12% 13% Baby food 2.3% Gourmet 0.6% 3% 3% 10% 7% 8% 17% 23% 29% Serbia 23.2% Slovenia 16.8% Bosnia and Hercegovina 7.8% Other regional markets* 6.7% Key European markets** 10.1% Russia and CIS 3.7% Other markets 3.0% * Macedonia, Montenegro, Kosovo ** Germany, United Kingdom, Italy, Switzerland, Austria, Sweden, Spain AG BRANDS WITH SALES OVER EUR 15m in 2016 SALES PROFILE 12
14 FINANCIAL OVERVIEW
15 Performance in line with guidance Continued development of business operations in Western European markets Restructuring and reorganization of Sports and Functional food Amended loan conditions and issue of new corporate bond coupled with debt decrease Development of own brands and opening of new pharma locations Risk management and consolidation of IT solutions KEY BUSINESS DEVELOPMENTS IN
16 (in EURm) / 2015 Revenues (4.2%) Sales (4.7%) EBITDA (15.6%) EBIT (23.1%) Net profit (32.1%) Highlights from 2016 results: Results in accordance with expectations with the focus on business internationalisation. Sales growth in almost all regional markets (Croatia, Slovenia, Bosnia and Herzegovina and Macedonia, only drop in Serbia), due both own brands and principal sales growth, which confirmed the position of Atlantic Grupa as a leading distributor in the region. Lower result in Serbia caused by decrease in sales of coffee (caused by drop in overall Turkish coffee category and additional negative impact of the inventory optimisation by the key customer). Decline in sales in Russia and CIS markets primarily due to decrease of purchasing power caused by depreciation of rouble and high inflation rate. The decrease in EBITDA due to decrease in revenues caused by the terminated cooperation with the major buyer of the private label in Sports and Functional Food, and the restructuring of this business unit, as well as higher costs as a result of the targeted investments in the internationalisation of operations. Continuous focus on further deleveraging (net debt decrease of HRK millions or by 10.5%). Decrease of the finance costs by 9.8%. Costs of production materials lower by 8.6%, primarily due to lower prices of raw coffee and lower production in the sports and functional food segment, following the terminated cooperation with the major buyer of the private label. FINANCIAL OVERVIEW IN
17 (EUR 000) / 2015 (EUR million) / 2015 SBU Coffee % SBU Beverages % SBU (Sweet and Salted) Snacks % SBU Savoury Spreads % SBU Pharma and Personal Care SBU Sports and Functional Food % (40.9%) SDU Serbia (5.3%) SDU Croatia % DU Slovenia % SDR Zone West (2.3%) Other segments* (6.2%) Reconciliation** (381.1) (387.4) (1.6%) Sales (4.5%) SBU Coffee % SBU Beverages % SBU (Sweet and Salted) Snacks % SBU Savoury Spreads (0.6%) SBU Pharma and Personal Care SBU Sports and Functional Food % (2.7) (4.3) 36.3% SDU Serbia (33.7%) SDU Croatia (50.5%) DU Slovenia % SDR Zone West (7.3) 1.4 (628.2%) Other segments* (25.8) (17.3) (49.1%) Group EBITDA (15.5%) * Other segments include SDR HoReCa, SDU CIS, BU Baby Food, BU Gourmet, DU Macedonia and business activities not allocated to business and distribution units (headquarters and support functions in Serbia, Slovenia and Macedonia) which are excluded from the reportable operating segments. ** Line item Reconciliation relates to the sale of own brands which is included in the appropriate SBU and BU and in SDUs and DUs through which the products were distributed. PERFORMANCE BY SBUs AND SDUs IN
18 (in EUR millions) /2015 Sales (4.5%) EBITDA (15.5%) EBIT (23.0%) Net profit/(loss) (32.7%) Profitability margins EBITDA margin 9.3% 10.5% -120 bp 20% 6% 37% EBIT margin 6.0% 7.5% -145 bp 4% Net profit margin 3.2% 4.5% -129 bp 12% 21% (in HRK millions) Net debt 1, ,678.1 Total assets 5, ,294.6 Total Equity 2, ,945.3 Current ratio Gearing ratio 42.7% 46.3% Net debt/ebitda Interest coverage ratio Capital expenditure Cash flow from operating activities Capital and reserves 37.4% Long term borrowings 22.7% Short term borrowings 10.9% Bond 3.7% Trade and other payables 19.9% Other liabilities 5.5% FINANCIAL INDICATORS IN
19 STRATEGIC GUIDANCE
20 6,000 5,000 4,000 3,000 2,000 1,000 Sales (HRKm) 93% 103% 99% 102% 99% 98% 98% 102% 100% EBITDA (HRKm) 100% 98% 101% 98% 102% 101% 96% 100% 100% % Reported Guidance EBIT (HRKm) 101% 104% 97% 96% % % 99% Reported Guidance Atlantic Grupa listed on the Zagreb Stock Exchange on November 19 th % % 95% 102% % Sales99% EBITDA Reported EBIT Guidance % Since 2008 Atlantic 104% Grupa publishes guidance for the 399following 385 financial year and delivers it Sales EBITDA EBIT GUIDANCE TRACK RECORD 20
21 Strategic management guidance Focus on: (i) continuing internationalisation of the business (Multipower, Argeta, Donat Mg, Bebi, Cedevita, Granny s Secret), (ii) strengthening the position of regional brands (Cockta, Cedevita, Smoki, Grand Kafa, Barcaffe, Najlepše želje, Chipsos), (iii) active development of the regional HoReCa portfolio, and (iv) finishing of the restructuring of the business unit Sports and functional food. Special efforts will be placed into listing and positioning of own brands into retail channel in Germany and Austria and on marketing activities on those markets. The management of Atlantic Grupa in 2017 expects significantly higher average prices of raw coffee in the global commodity markets and an unfavourable effect of the EURUSD exchange rate, which will influence the profitability of the Strategic business unit Coffee. The negative influence will be partially compensated by higher retail process of coffee, and partially by the higher profitability of other business units. (in EUR millions) 2017 Guidance /2016 Sales % EBITDA % EBIT % Interest expense 9 10 (17.0%) In 2017, we expect capital expenditure in the amount of around EUR 20 million. The expected effective tax rate in 2017 should be at the level of the previous year. STRATEGIC GUIDANCE FOR


22 BUSINESS UNITS
23 DISTRIBUTION

24 STRENGTH OF DISTRIBUTION Developed network with 18 distribution centers Direct access on over 60,000 sales points in SEE Over 1,000 delivery vehicles DISTRIBUTION 24
 in SEE DISTRIBUTION")
25 DISTRIBUTION ZONE WEST ZONE EAST Leading Distributor of Multinational Brands Atlantic Grupa is one of leading distributors of high-quality top FMCG brands (both own and principal) in SEE DISTRIBUTION 25
26 SBU COFFEE

27 STRENGTH OF TRADITION Barcaffè - over 45 years of tradition in Slovenia 8 out of 10 Slovenians drink Barcaffè Grand kafa - over 15 years brand No.1 in Serbia SBU COFFEE 27


28 20.8 % share in sales No. 1 in Turkish coffee in Serbia, Slovenia, B&H and Macedonia EUR 141m sales in 2016 SBU COFFEE 28
29 SBU SAVOURY SPREADS

30 ARGETA & MONTANA delicious meal for all occasions Manufacturer of high quality food brands Argeta savoury spreads, and Montana sandwiches with extended freshness SBU SAVOURY SPREADS 30


31 10.6 % share in sales No. 1 1 SPREADS BiH Slovenia Austria Macedonia No. 22 SPREADS Switzerland Serbia Croatia EUR 72m sales in th strongest FMCG brand in the region. Sold in 33 countries. SBU SAVOURY SPREADS 31

32 BU GOURMET

33 GRANNY S SECRET Produced at the base of Mount Kopaonik, protected ecological area Hand picked fruits and vegetables specially treated at very low temperatures in order to preserve all the nutrients BU GOURMET 32


, Fruit Jams and Coulis,")
34 0.6 % share in sales EUR 4m sales in 2016 Products for true connoisseurs 100% natural, finest grown and wild fruits and vegetables without preservatives, artificial colors or aromas Present in over 20 markets worldwide CATEGORIES: Ajvar (Roasted Red Pepper Spreads), Fruit Jams and Coulis, Fruit and Vegetable Juices BU GOURMET 33
35 SBU SNACKS

36 LEADING FMCG BRANDS IN THE REGION Over 28,000 tonnes of snacks produced in 2016 Flips No.1 in Serbia, B&H and Slovenia No.1 chocolate bars and wafers in Serbia Over 1 million fans on Facebook SBU SNACKS 35


37 Created in 1972, the first flips produced in SEE, Smoki has become the generic word for a group of flips products. A delightful dessert offers a wide selection of flavours and shapes. The famous soft chocolate foam dessert, first of its kind in the SEE region, is a product with more than 75 years of tradition. Biscuits and wafers that marked the youth of many generations. No. 1 SERBIA Flips Chocolate bars Wafers CROATIA, SLOVENIA, BiH Flips No. 2 SERBIA Chocolate tablets Biscuits Sticks 12.8 % share in sales EUR 87m sales in 2016 SBU SNACKS 36
38 SBU SPORTS AND FUNCTIONAL FOOD

39 MULTIPOWER Leading brand in Europe Production, R&D and sales of sports and functional food and healthy food Leading brand of sports nutrition in Europe and No.1 in dietetic products category in Germany 40 years of tradition SBU SPORTS AND FUNCTIONAL FOOD 38


40 No. 1 Sports food in Europe. 8.8 % share in sales EUR 60m sales in 2016 SBU SPORTS AND FUNCTIONAL FOOD 39
41 SBU BEVERAGES
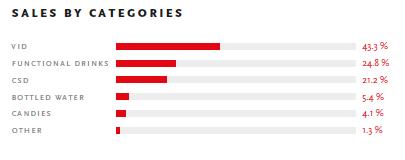
42 SALES BY CATEGORIES SBU BEVERAGES 41 52


43 No. 1 Vitamin instant drink in Croatia, Slovenia and Serbia A cola drink that was born different 60 years ago. Unique blend of 11 herbs and aroma of dog rose. During its 40 years became synonym for the healthy multivitamin refreshment in the region. A natural multifunctional mineral water with a high level of magnesium and clinically proven effect % share in sales EUR 85m sales in 2016 SBU BEVERAGES 42
44 SBU PHARMA AND PERSONAL CARE
 III. Cosmetics (Neva) 10.")

45 HEALTH AND BEAUTY CARE Encompasses 3 complementary activities: I. Farmacia pharmacy chain II. Food supplements and OTC products (Fidifarm and Dietpharm) III. Cosmetics (Neva) 10.2 % share in sales EUR 69m sales in 2016 Croatia s largest private chain of pharmacies and specialised shops for medicines and food supplements. Plidenta toothpaste has maintained its leading position on the Croatian market. An original Croatian universal cream. Renowned Croatian brand in the cosmetics. The leading regional producer of food supplements and vitamin products. SBU PHARMA AND PERSONAL CARE 44
46 No. 1 CROATIA Lip care Food supplements Dental care SERBIA and B&H Food supplements No. 2 CROATIA Body care SERBIA Lip care SBU PHARMA AND PERSONAL CARE 45
47 BU BABY FOOD

48 BEBI - FROM THE FIRST DAY OF LIFE No.1 in category of baby cereals in Ukraine No.1 in baby biscuits category in Lithuania BU BABY FOOD 47


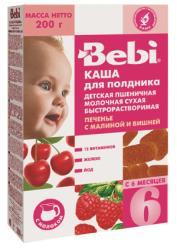
49 2.3 % share in sales EUR 16m sales in 2016 BU BABY FOOD 48
50 Atlantic Grupa d.d. Miramarska Zagreb, HR T ir@atlanticgrupa.com
20 7 C O M P A N Y O V E R V I E W
 COMPANY OVERVIEW 20 7 COMPANY OVERVIEW 2017 CONTENT ABOUT US 3 COFFEE 17 SNACKS 21 BEVERAGES 25 SAVOURY SPREADS 29 SPORT & FUNCTIONAL FOOD 33 BABY FOOD 37 GOURMET 41 PERSONAL CARE 45 PHARMA 49 DISTRIBUTION
COMPANY OVERVIEW 2018
 COMPANY OVERVIEW 2018 CONTENTS ABOUT US 4 BUSINESS UNITS 11 COFFEE 13 beverages 17 snacks 21 savoury spreads 25 pharma & personal care 29 sports & functional food 35 gourmet 39 DISTRIBUTION 43 atlantic
$ BUY STARBUCKS CORPORATION (SBUX) Rena Kaufman. Valuation Methodology. Market Data. Financial Summary (7/1/2018) Profile. Financial Analysis
 Rena Kaufman. Valuation Methodology. Market Data. Financial Summary (7/1/2018) Profile. Financial Analysis") STARBUCKS CORPORATION (SBUX) Market Data Market Cap (intraday): $69,991M Enterprise Value (Aug 9, 2018): $74,898M Enterprise Value/EBITDA (ttm): 14.97x Rena Kaufman $51.88 - BUY Valuation Methodology Method
STARBUCKS CORPORATION (SBUX) Market Data Market Cap (intraday): $69,991M Enterprise Value (Aug 9, 2018): $74,898M Enterprise Value/EBITDA (ttm): 14.97x Rena Kaufman $51.88 - BUY Valuation Methodology Method
C O M P A N Y O V E R V I E W
 COMPANY OVERVIEW 5 21 27 89 about us distribution food & beverages pharma & Personal care content 3 about us about us Atlantic Grupa is one of the leading food companies in the region with renowned regional
October Podravka Group. Erste Group Investor Conference 3-7 October 2011, Stegersbach. Podravka Group. Investor relations
 October 2009 Erste Group Investor Conference 3-7, Stegersbach October 2009 Content Overview Sales Business results Share performance Guidelines for 2011 Disclaimer This presentation contains certain forward-looking
ATLANTIC GRUPA PRODUCT CATALOGUE
 ATLANTIC GRUPA PRODUCT CATALOGUE 2016 01 NETWORK ABOUT US > > OWNERSHIP & KEY FACTS > KEY FIGURES 2014 > BRANDS > QUALITY MANAGEMENT AND SUSTAINABILITY > VALUES > 02 ARGETA PRODUCT CATALOGUE > > BARCAFFÈ
Peet's Coffee & Tea, Inc. Reports 62% Increase in Second Quarter 2008 Diluted Earnings Per Share
 Peet's Coffee & Tea, Inc. Reports 62% Increase in Second Quarter 2008 Diluted Earnings Per Share EMERYVILLE, Calif., July 31, 2008 /PRNewswire-FirstCall via COMTEX News Network/ -- Peet's Coffee & Tea,
Financial results 2014/2015. Strategy and development perspectives
 Financial results 2014/2015 Strategy and development perspectives Warsaw, September 2015 1 Agenda Strategy of the AMBRA Group Wine market in Poland Financial results and KPIs for 2014/2015 Development
DELIVERING REFRESHING SOFT DRINKS
 BEVERAGES DIVISION DELIVERING REFRESHING SOFT DRINKS Swire Beverages manufactures, markets and distributes refreshing soft drinks to consumers in Hong Kong, Taiwan, Mainland China and the USA. 46 215 PERFORMANCE
INVESTOR PRESENTATION. Post FY2017 Volume Announcement
 v INVESTOR PRESENTATION Post FY2017 Volume Announcement FORWARD-LOOKING STATEMENTS This presentation may contain certain forward-looking statements concerning our future performance and should be considered
July 2009 General Assembly
 General Assembly 22, Koprivnica Content Overview Business results 2008 Business results Jan - Mar 2009 Share performance Overview Growth and development of Podravka brands SALES GROWTH OF PODRAVKA BRANDS
International Beverage. Frank van Oers
 International Beverage Frank van Oers Long-term Growth Will Come from Single-Serve and Instants FY08 $3.2 Billion 6% 7% 8% 11% 18% 12% 38% 4% 24% 12% 3% 56% 1% 2 Multi-Serve (ex. Brazil) Single-Serve Instants
Preliminary unaudited financial results for the full year ended 30 June Amount for this reporting period
 Marlborough Wine Estates Group Limited Results for Announcement to the Market Preliminary unaudited financial results for the full year ended 30 June 2017 Reporting Period 1st July to 30th June 2017 Previous
Private Equity Investments
 Overview for Private Equity Investments Strategic capital and expertise for the wine industry Prepared: September 2011 Copyright 2010 Bacchus Capital Management In classical mythology, Bacchus is the god
An overview of the European flour milling industry. Gary SHARKEY, European Flour Millers Vice-President
 An overview of the European flour milling industry Gary SHARKEY, European Flour Millers Vice-President 24 + 5 national member associations The European flour millers on their internal market A large variety
Strengthening our coffee leadership
 Strengthening our coffee leadership Nestlé enters agreement for the perpetual global licensing rights of Starbucks consumer and foodservice products May 7, 2018 Mark Schneider François-Xavier Roger Chief
Strong Holiday Performance Drives 5% Global Comp Growth, Global Traffic Increases 2%
 Starbucks Delivers Record Q1 Revenue and EPS Strong Holiday Performance Drives 5% Global Comp Growth, Global Traffic Increases 2% Revenues rise 13% to a record $4.8 billion; EPS of $1.30 includes a gain
Coca-Cola beverages bring a refreshing taste to consumers.
 Coca-Cola beverages bring a refreshing taste to consumers. BEVERAGES DIVISION DELIVERING REFRESHING SOFT DRINKS Swire Beverages manufactures, markets and distributes refreshing soft drinks to consumers
Strategy and development perspectives
 Strategy and development perspectives Warsaw, 5 June 2017 AMBRA in brief 1992 establishment of AMBRA S.A. 1995 leader of the sparkling wines segment 1997 acquisition of the CIN&CIN brand 2005 IPO and formation
Seeka Limited. Retail Investors March 2019
 Seeka Limited Retail Investors March 2019 Orchard-to-market excellence Seeka is an international fresh produce business In Australia Grow, process and market - Kiwifruit - Nashi pears - European pears
John Culver. group president, Global Retail
 John Culver group president, Global Retail Starbucks has delivered strong growth globally GLOBAL RETAIL CONSOLIDATED REVENUE USD BILLIONS OPERATING INCOME USD BILLIONS CAGR 12% CAGR 17% $13.0 $18.5 $2.8
CCL Products (India) Ltd.
 Ltd.") Jan-16 Feb-16 Mar-16 Apr-16 May-16 Jun-16 Jul-16 Aug-16 Sep-16 Oct-16 Nov-16 Dec-16 Jan-17 s. CCL Products (India) Ltd.. February 6, 2017 BSE Code: 519600 NSE Code: CCL Reuters Code: CCLP.NS Bloomberg
Jan-16 Feb-16 Mar-16 Apr-16 May-16 Jun-16 Jul-16 Aug-16 Sep-16 Oct-16 Nov-16 Dec-16 Jan-17 s. CCL Products (India) Ltd.. February 6, 2017 BSE Code: 519600 NSE Code: CCL Reuters Code: CCLP.NS Bloomberg
April Podravka Group Business Results 2008
 Podravka Group Business results for year 2008 Content Overview of key events 2008 Sales Business results Costs / Expenses Share Disclaimer This presentation contains certain forward-looking statements
Financial Results for Fiscal Year Ending December 31, February 12, 2016 Suntory Beverage & Food Limited
 2016 SUNTORY 2013 BEVERAGE SUNTORY BEVERAGE & FOOD & LIMITED. Limited. All Rights All Reserved Rights Reserved. Financial for Fiscal Year Ending December 31, 2015 February 12, 2016 Suntory Beverage & Food
3 rd Quarter & 9 Months 2014 Financial Results 10 November 2014
 3 rd Quarter & 9 Months 2014 Financial Results 10 November 2014 Disclaimer The presentation is prepared by Super Group Ltd ( Super or the Group ) and is solely for the purpose of corporate communication
Value increase in the alcohol market
 Value increase in the alcohol market Warsaw, June 2018 Get to know AMBRA AMBRA Group is a leading manufacturer, importer and distributor of wines and other alcohol beverages in the Central-Eastern Europe.
ABN Australian Vintage Limited Full Year Result to 30 June 2018 Profit up 79% and Record Cash Flow
 ABN 78 052 179 932 Company Announcements Australian Securities Exchange 29 August 2018 Key Points Australian Vintage Limited Full Year Result to 30 June 2018 Profit up 79% and Record Cash Flow Net Profit
Corporate Presentation July 2016
 Corporate Presentation July 2016 I. Concha y Toro: At a Glance 2 Viña Concha y Toro Today Largest Chilean and Latin American Winery. Top 10 world s winery in volume commercialized. Unique business model
Raymond James 33 rd Annual Institutional Investors Conference March 5, DineEquity, Inc. All rights reserved.
 Raymond James 33 rd Annual Institutional Investors Conference March 5, 2012 Forward-Looking Information Statements contained in this presentation may constitute forward-looking statements within the meaning
PETROL. Raiffeisen Centrobank Institutional Investors Conference
 Raiffeisen Centrobank Institutional Investors Conference PETROL Contents 2 1. Introduction 2. Business Activities 3. Investor Information Appendix 3 1. Introduction The Petrol Group 4 The leading Slovenian
Foodservice EUROPE. 10 countries analyzed: AUSTRIA BELGIUM FRANCE GERMANY ITALY NETHERLANDS PORTUGAL SPAIN SWITZERLAND UK
 Foodservice EUROPE MARKET INSIGHTS & CHALLENGES 2015 2016 2017 2020 Innovative European Foodservice Experts 18, avenue Marcel Anthonioz BP 28 01220 Divonne-les-Bains - France 10 countries analyzed: AUSTRIA
CIBC Retail & Consumer Conference March 29, 2017
 CIBC Retail & Consumer Conference March 9, 07 Safe Harbor Statements Forward Looking Statements: This presentation contains forward-looking statements within the meaning of Section 7A of the Securities
Ontario Wine and Grape Industry Performance Study
 Ontario Wine and Grape Industry Performance Study 2015 Performed by VQA Ontario and Deloitte on behalf of the Ontario wine and grape industry March 2016 FINANCIAL INFORMATION I II 2015 ONTARIO WINE AND
CIBC Eastern Institutional Investor Conference
 CIBC Eastern Institutional Investor Conference September 7, 07 Safe Harbor Statements Forward Looking Statements: This presentation contains forward-looking statements within the meaning of Section 7A
EU: Knives, Scissors And Blades - Market Report. Analysis And Forecast To 2025
 EU: Knives, Scissors And Blades - Market Report. Analysis And Forecast To Copyright IndexBox, Inc., 2018 e-mail: info@indexbox.io www.indexbox.io TABLE OF CONTENTS 1. INTRODUCTION 1.1 REPORT DESCRIPTION
Regional Brands, National Potential. International Summit Agricultural & Food Transportation
 Regional Brands, National Potential International Summit Agricultural & Food Transportation Wednesday, December 3, 2008 1 Mike Townsley President Food Products Division 2 3 4 5 Our Way of Doing Business
UNDERSTANDING, LEADING, BUILDING & WINNING IN THE BUSINESS OF COFFEE FARMER BROTHERS
 UNDERSTANDING, LEADING, BUILDING & WINNING IN THE BUSINESS OF COFFEE FARMER BROTHERS WE ARE A COFFEE COMPANY DESIGNED TO DELIVER THE COFFEE PEOPLE WANT, THE WAY THEY WANT IT. FARMER BROTHERS 2 We have
J.P. Morgan High Yield And Leveraged Finance Conference February 27, 2017
 J.P. Morgan High Yield And Leveraged Finance Conference February 27, 2017 Safe Harbor Statements Forward Looking Statements: This presentation contains forward-looking statements within the meaning of
Ontario Wine and Grape Industry Performance Study
 Ontario Wine and Grape Industry Performance Study 2016 Performed by VQA Ontario and Deloitte on behalf of the Ontario wine and grape industry March 2017 FINANCIAL INFORMATION I II 2016 ONTARIO WINE AND
I. COMPANY I. OVERVIEW
 I. COMPANY I. OVERVIEW GRUMA IS THE WORLD S LARGEST CORN FLOUR AND TORTILLA PRODUCER, WITH OPERATIONS IN THE UNITED STATES, MEXICO, CENTRAL AMERICA, EUROPE, ASIA AND OCEANIA S U B S I D I AR I E S P R
April Podravka Group Business Results 2009
 Podravka Group Business results for 2009 Content Overview of key events Sales Business results Costs / Expenses Share Guidelines for 2010 Disclaimer This presentation contains certain forward-looking statements
Safe Harbor Statements
 Jefferies Consumer Conference June 20, 207 Safe Harbor Statements Forward Looking Statements: This presentation contains forward-looking statements within the meaning of Section 27A of the Securities Act
Starbucks Delivers Record Q1 Revenues and EPS Q1 Fiscal 2016 Highlights:
 Starbucks Delivers Record Q1 Revenues and EPS Strong Holiday Performance Drives 9% Comp Growth in the U.S. and Americas, 8% Globally; Global Traffic up 4% Consolidated Net Revenues Rise 12% to a Record
Investor Roadshow. December 2007
 Investor Roadshow December 2007 Agenda About Britvic Market Dynamics Strategy Financial Headlines Investment Highlights Overview Britvic is one of the two leading branded soft drinks business in Great
Financial Results for H1 Fiscal Year Ending December 31, August 6, 2015 Suntory Beverage & Food Limited
 Financial Results for H1 Fiscal Year Ending December 31, 2015 August 6, 2015 Suntory Beverage & Food Limited 2015 SUNTORY 2013 BEVERAGE SUNTORY BEVERAGE & FOOD & LIMITED. Limited. All Rights All Reserved
ONE YEAR ANNUAL RESULTS FONTERRA FONTERRA CO-OPERAT CO-OPERA IVE GROUP LTD
 ONE YEAR. 2012 ANNUAL RESULTS FONTERRA CO-OPERATIVE GROUP LTD 1 SIR HENRY VAN DER HEYDEN CHAIRMAN FONTERRA CO-OPERATIVE GROUP LTD 2 OVERVIEW Highlights Business performance Update on strategy Questions
Preliminary Results 2008
 Preliminary Results 2008 1 Gerald Corbett Chairman 2 John Gibney Finance Director 3 Financial Headlines FY08 m FY07 m % change Revenue 926.5 716.3 29.3 EBIT 96.7 80.0 20.9 EBIT Margin 10.4% 11.2% (80)bps
Press release Vevey, October 18, Nestlé reports nine-month sales for 2018
 Press release Vevey, October 18, 2018 Follow today's event live 14:00 CEST Investor call audio webcast Full details: https://www.nestle.com/media/mediaeventscalendar/allevents/2018-nine-month-sales Nestlé
Nestlé Investor Seminar 2014
 Nestlé Investor Seminar 2014 Beverage Nestlé USA Rob Case Nestlé Beverage Division President June 3 rd & 4 th, Liberty Hotel, Boston, USA Disclaimer This presentation contains forward looking statements
Presentation on Half Yearly Results. Analyst Meet November 2014
 Presentation on Half Yearly Results Analyst Meet November 2014 1 Agenda Key Themes Performance Highlights Operating Performance Review Financial Review 2 Key Themes H1 2014-15 Improved profitability in
Focused on Delivering
 34 Swire Pacific Annual Report 2009 Focused on Delivering Swire Beverages is one of the largest Coca-Cola bottlers in the world and the number one bottler in Mainland China with a powerful production and
For personal use only
 ABNN 78 052 179 932 Company Announcements Australian Securities Exchange 24 February 2016 Australian Vintage Half Year Result to 31 December 20155 Branded Sales Dry Profit up by 80% % Key Points Net Profit
Three-month sales. April 19, 2018 Nestlé three-month sales 2018
 Three-month sales 1 Disclaimer This presentation contains forward looking statements which reflect Management s current views and estimates. The forward looking statements involve certain risks and uncertainties
Yum! Brands Drive Profitable International Expansion. Graham Allan YRI President
 Yum! Brands Drive Profitable International Expansion Graham Allan YRI President Yum! International Division Agenda... 2006 Results/2007 Outlook Building Our Global Brands Future Growth Another Strong Year
WINE AND SPIRITS INDUSTRY
 Globalisation + Financialisation = Concentration? RECENT TRENDS ON MERGERS, ACQUISITIONS AND FINANCIAL INVESTMENTS IN THE WINE SECTOR Enometrics, XIV VDQS, May 4-5, 7 A. Coelho JP Couderc JL Rastoin UMR
Goldman Sachs Global Staples Forum May 8, 2018
 Goldman Sachs Global Staples Forum 2018 May 8, 2018 Safe Harbor Statements Forward Looking Statements: This presentation contains forward-looking statements within the meaning of Section 27A of the Securities
Majestic Wine 2013/14 Interim Results
 Majestic Wine 2013/14 Interim Results Key Competitive Advantages > > Excellent customer service delivered by highly trained store teams > > Taste before you buy, free to attend wine events and wine courses
Corporate Presentation May 2017
 Corporate Presentation May 2017 I. Concha y Toro: At a Glance 2 Viña Concha y Toro Today Largest Chilean and Latin American Winery. Top 10 world s winery in volume commercialized. Unique business model
Analyst Call Q August 11, 2017
 Analyst Call Q1 2017-18 August 11, 2017 Agenda 1. BUSINESS PERFORMANCE 2. FINANCIAL OVERVIEW 2 Business Performance 3 Key Highlights 5 th consecutive quarter of operating profit growth despite higher spends
World Yoghurt Market Report
 World Yoghurt Market Report 2000-2020 Price: 1,800 /$2,200 The report contains 330 pages of valuable information Analysis of the current market situation and future possibilities in all regions of the
Investor Presentation
 Investor Presentation COMPANY OVERVIEW GRUMA IS THE WORLD S LARGEST CORN FLOUR AND TORTILLA PRODUCER, WITH OPERATIONS IN THE UNITED STATES, MEXICO, CENTRAL AMERICA, EUROPE, ASIA AND OCEANIA Family: 52%
Import Summery Report Food Products Europe
 Import Summery Report Food Products Europe Contents............ 5. 5. 5. 5. 5. Table Table Table Disclaimer Global Imports Imports in Europe Focus Food Products Categories Fruit Juices & Beverages Bakery
Top 10 financial planning mistakes
 2017 Annual TWGAA Conference Top 10 financial planning mistakes Presented by: Amanda Sims, Associate, Silicon Valley Bank # 10 Improper sourcing strategies 2015 Annual Wine Conditions Survey 21 February
sandwiches and baguettes sold per year
 Company Introduction more than 30 000 000 sandwiches and baguettes sold per year Everything We Do Must Be Delicious Key Company Facts years experience in production, sales, & direct store 26distribution
2018 CIBC Retail & Consumer Conference
 2018 CIBC Retail & Consumer Conference March 28, 2018 Safe Harbor Statements Forward Looking Statements: This presentation contains forward-looking statements within the meaning of Section 27A of the Securities
Company Presentation. Opportunity Day 3Q2013 December, 2013
 Company Presentation Opportunity Day 3Q2013 December, 2013 Company Presentation Opportunity Day 3Q2013 December, 2013 Disclaimer Copyright 2013 MK Restaurant Group Public Company Limited. All rights reserved.
2008 Year End Results
 2008 Year End Results» Review of Business Stan McCarthy CEO» Financial Review Brian Mehigan CFO» Outlook and Future Prospects Stan McCarthy CEO» Q&A 2008 Headlines» Solid Kerry business development and
THE IRISH BEER MARKET 2017
 THE IRISH BEER MARKET THE IRISH BEER MARKET The Irish Brewers Association (IBA) Beer Market Report highlights the role of the brewing sector in Ireland s economy. Beer comfortably remains Ireland s favourite
The. Strauss Group. Company Presentation April 2015
 The Strauss Group Company Presentation April 2015 Strauss Group - Overview A food and beverage company active in More than 20 countries with a strong home base Israel s second-largest food group The world
VIETNAM COFFEE MARKET REPORT Q1/2018
 VIETNAM COFFEE MARKET REPORT Q1/2018 Content Abbreviations 3 3. Vietnam coffee market 49 Summary 4 3.1 Classification of coffee produced in Vietnam 49 1. Business environment 1.1 Macroeconomic situation
OUR POTENTIAL. Business Update MAY 2017
 OUR POTENTIAL Business Update MAY 2017 Disclaimer This presentation may contain forward-looking statements and projections. There can be no certainty of outcome in relation to the matters to which the
GLOBUS WINES. Wine Investment & Cellar Management. India London New York Hong Kong Tokyo
 GLOBUS WINES Wine Investment & Cellar Management India London New York Hong Kong Tokyo Why Wine Investments Tangible & Consumable asset Benefits from Limited supply high demand environment Not correlated
create and cultivate The WhiteWave Foods Company annual review 2014
 create and cultivate The WhiteWave Foods Company annual review 2014 contents our story CEO letter annual review 2014 create a new kind of food company At heart, we are creators pioneers in creating on-trend,
DIRECTORS AND CEO REPORT
 FOR THE YEAR ENDED 30 JUNE 2018 The Directors of Foley Family Wines Limited (FFW) wish to announce the 2018 operating results and annual report for the 12 months ended 30 June 2018. Highlights: Case sales
2016 was Telepizza Group s best year for chain sales 1 and EBITDA growth over the last decade
 Telepizza Full-Year Results for 2016 2016 was Telepizza Group s best year for chain sales 1 and EBITDA growth over the last decade Chain sales 1 grew by 7% to 517M while Underlying EBITDA rose by 10% to
Coffee Holding Co. Inc. Buy Price Target: $6 Key Statistics as of 4/29/2016. Thesis Points: Company Description: JVA: NYSE
 Coffee Holding Co. Inc JVA: NYSE Analyst: Sector: Peter Ostrowski Consumer Staples Buy Price Target: $6 Key Statistics as of 4/29/2016 Thesis Points: Market Price: Industry: Market Cap: 52-Week Range:
Investor Presentation 2014 (Herfy)
") Investor Presentation 2014 (Herfy) 1 Disclaimer This document has been prepared by Herfy ( the Company ) solely for presentation purposes. The information contained in this document has not been independently
Investor Presentation 2014 (Herfy) 1 Disclaimer This document has been prepared by Herfy ( the Company ) solely for presentation purposes. The information contained in this document has not been independently
GRUMA IS THE WORLD S LARGEST CORN FLOUR AND TORTILLA PRODUCER, WITH OPERATIONS IN THE UNITED STATES, MEXICO, CENTRAL AMERICA, EUROPE, ASIA AND OCEANIA
 COMPANY OVERVIEW GRUMA IS THE WORLD S LARGEST CORN FLOUR AND TORTILLA PRODUCER, WITH OPERATIONS IN THE UNITED STATES, MEXICO, CENTRAL AMERICA, EUROPE, ASIA AND OCEANIA Family: 52% Float: 48% Subsidiaries
GROWTH REPORTER EUROPE QUARTER 4, 2016
 GROWTH REPORTER EUROPE QUARTER 4, 2016 Feb 2016 INTRODUCTION This report: Compares overall market dynamics (value and unit growth) in the Fast Moving Consumer Goods sector across Europe. Is based on the
Food Export USA - Northeast Upstate NY Trade Conference & Expo
 Food Export USA - Northeast 2014 Upstate NY Trade Conference & Expo Why to Export? 95% of consumers not in the US! Diversification of Market Risk Extend life of product, development costs Capitalize on
Access China Conference Deutsche Bank Beijing 2 March 05
 Access China Conference Deutsche Bank Beijing 2 March 05 Agenda! Offering Summary! China s Wine Market! Introduction to Dynasty! Competitive Strengths! Financial Highlights! Strategies & Plans! Use of
Pizza Pizza Royalty Corp. ANNUAL GENERAL MEETING May 29, 2013
 Pizza Pizza Royalty Corp. ANNUAL GENERAL MEETING May 29, 2013 1 Elizabeth Wright, Board Chair 2 Forward-Looking Statement This presentation will contain forward-looking statements. Investors should be
July 2010 Barry Callebaut - Roadshow presentation
 Barry Callebaut 9-month key sales figures 2009/10 Agenda Barry Callebaut at a glance Highlights 9 months 2009-2010 Outlook 2 Barry Callebaut is active along the entire cocoa and chocolate value chain Cocoa
Majestic Wine 2010/11 Results
 Majestic Wine 2010/11 Results Overview > > Total Group sales up 10.3% to 257.3m (2010: 233.2m) > > Like for like ex vat sales up 5.3% > > Profit before tax up 26.6% to 20.3m (2010: 16.0m) > > 9.7p final
2017 FINANCIAL REVIEW
 2017 FINANCIAL REVIEW In addition to activity, strategy, goals, and challenges, survey respondents also provided financial information from 2014, 2015, and 2016. Select results are provided below: 2016
This is Haruhisa Inada. I will explain the financial results of the first quarter of FY 2018.
 This is Haruhisa Inada. I will explain the financial results of the first quarter of FY 2018. 1 Compared to the previous year, revenue was 277.1 billion yen, up 3.3%, operating income was 26.6 billion
Australian Vintage Ltd. June 2017 Results 30 th August 2017
 Australian Vintage Ltd. June 2017 Results 30 th August 2017 Australian Vintage Ltd. June 2017 Results Disclaimer The presentation has been prepared by Australian Vintage Limited (ACN 052 179 932) ( AVG
European Vitamin B9 (Folic Acid) Industry 2016 Market Research Report
 Industry 2016 Market Research Report") Published on Market Research Reports Inc. (https://www.marketresearchreports.com) Home > European Vitamin B9 (Folic Acid) Industry 2016 Market Research Report European Vitamin B9 (Folic Acid) Industry
Published on Market Research Reports Inc. (https://www.marketresearchreports.com) Home > European Vitamin B9 (Folic Acid) Industry 2016 Market Research Report European Vitamin B9 (Folic Acid) Industry
July 2010 Barry Callebaut - Roadshow presentation
 Barry Callebaut 9-month key sales figures 2009/10 July 2010 July 2010 Barry Callebaut - Roadshow presentation Agenda Barry Callebaut at a glance Highlights 9 months 2009-2010 Outlook July 2010 Barry Callebaut
LOCAL TASTE GLOBAL MARKET
 LOCAL TASTE GLOBAL MARKET ANNUAL GENERAL MEETING FY2016 MILESTONES * As defined in Euromonitor International report, Events Catering Services in Singapore, dated April 2016 whereby events catering refers
Leading the Category Driving Growth Creating Value. Fiona KENDRICK Head of Coffee and Beverages Strategic Business Unit
 Leading the Category Driving Growth Creating Value Fiona KENDRICK Head of Coffee and Beverages Strategic Business Unit Disclaimer This presentation contains forward looking statements which reflect Management
Investor Presentation
 Investor Presentation COMPANY OVERVIEW GRUMA IS THE WORLD S LARGEST CORN FLOUR AND TORTILLA PRODUCER, WITH OPERATIONS IN THE UNITED STATES, MEXICO, CENTRAL AMERICA, EUROPE, ASIA AND OCEANIA Family: 52%
DECEMBER 2015 HALF YEAR RESULTS BRANDED SALES DRIVES PROFIT UP BY 80% 24 th February 2016
 DECEMBER 2015 HALF YEAR RESULTS BRANDED SALES DRIVES PROFIT UP BY 80% 24 th February 2016 Disclaimer The information in this presentation is general advice, given in good faith and derived from sources
* Represents per share calculation based on number of shares o/s post issue; Source: Choice Broking Research, Company DRHP
 Healthy Coffee Business but Costly (CDEL) the parent company of the Coffee Day Group, pioneered the coffee culture in the chained cafe format in India under the brand Cafe Coffee Day (CCD). At the end
GRUMA IS THE WORLD S LARGEST CORN FLOUR AND TORTILLA PRODUCER, WITH OPERATIONS IN THE UNITED STATES, MEXICO, CENTRAL AMERICA, EUROPE, ASIA AND OCEANIA
 COMPANY OVERVIEW GRUMA IS THE WORLD S LARGEST CORN FLOUR AND TORTILLA PRODUCER, WITH OPERATIONS IN THE UNITED STATES, MEXICO, CENTRAL AMERICA, EUROPE, ASIA AND OCEANIA Family: 52% Float: 48% Subsidiaries
Food brands. Food Europe. Food North America
 Food brands Food Europe Cuisine de France offers the consumer traditional French breads, pastries and also a wide range of continental-style breads, confectionery and hot savoury items. Cuisine de France
Investor Presentation
 Investor Presentation COMPANY OVERVIEW GRUMA IS THE WORLD S LARGEST CORN FLOUR AND TORTILLA PRODUCER, WITH OPERATIONS IN THE UNITED STATES, MEXICO, CENTRAL AMERICA, EUROPE, ASIA AND OCEANIA Family: 52%
Massimo Zanetti Beverage Group the Group at a glance 2017
 1 Massimo Zanetti Beverage Group the Group at a glance 2017 CONTENTS 1. GROUP PROFILE 2. MARKET TRENDS 3. 2017 FINANCIAL RESULTS 4. INVESTMENT OPPORTUNITY 5. ANNEX Leva Luxury Coffee La San Marco Espresso
2008/09 first quarter net sales: 1,756 million (+13%) Strong organic growth: +7% Confirmed profit growth guidance for 2008/09
 Strong organic growth: +7% Confirmed profit growth guidance for 2008/09") Press Release 2008/09 first quarter net sales: 1,756 million (+13%) Strong organic growth: +7% Confirmed profit growth guidance for 2008/09 Press release - Paris, 30 October 2008 Pernod Ricard consolidated
Press Release 2008/09 first quarter net sales: 1,756 million (+13%) Strong organic growth: +7% Confirmed profit growth guidance for 2008/09 Press release - Paris, 30 October 2008 Pernod Ricard consolidated
New Zealand Dairy Companies Review. March
 New Zealand Dairy Companies Review March 2019 www.tdb.co.nz Table of contents Overview... 4 Financial performance... 5 Return On Capital Employed... 5 Analysis of the Northington report on Fonterra s financial