Corn. Rooted in Human History.
|
|
|
- Sherman Hall
- 6 years ago
- Views:
Transcription

1 Corn. Rooted in Human History WORLD OF CORN


2 Corn. Past, Present and Future. The world of corn has come a long way since the day a single seed kernel was planted next to a fish for fertilizer. Given those humble beginnings, it s incredible to imagine that 10 years from now, American farmers will be producing 17 billion bushels annually. Want a better understanding of that number? Take a look at the complimentary timeline poster we ve enclosed to see where corn has been. We can only imagine how much further it will go. Garry Niemeyer, President Rick Tolman, CEO 2
 296-1585 www.croplifeamerica.org The Fertilizer Institute (202) 962-0490 www.tfi.org CORN EXPORTS U.S. Grains Council (202) 789-0789 www.grains.")
3 Organizations CORN PROCESSING Corn Refiners (202) North American Millers (202) CORN INPUT American Seed Trade (703) CropLife America (202) The Fertilizer Institute (202) CORN EXPORTS U.S. Grains Council (202) FOOD AND SNACK CORN Popcorn Board (312) Snack Food (703) CORN FUTURES CME Group (312) RENEWABLE FUELS American Coalition for Ethanol (605) Growth Energy (202) Renewable Fuels (202) LIVESTOCK AND FEED American Feed Industry (703) National Cattlemen s Beef (303) National Grain and Feed (202) National Pork Board (515) National Pork Producers Council (202) U.S. Poultry & Egg (770) STATE ORGANIZATIONS Alabama Soybean and Corn (256) Mark Hall, Executive Director mark@alabamasoycorn.org Alabama Wheat & Feed Grain Producers (800) ext Buddy Adamson, Director badamson@alfafarmers.org Arkansas Corn and Grain Sorghum Board (501) Matt King, Executive Director matt.king@arfb.com Colorado Corn Colorado Corn Administrative Committee (970) Mark Sponsler, CEO msponsler@coloradocorn.com Georgia Agricultural Commodity Commission (404) Marcia Crowley, Agricultural Manager mcrowley@agr.state.ga.us Georgia Corn (229) Dewey Lee, State Executive Coordinator deweylee@uga.edu Illinois Corn (309) Rodney Weinzierl, Executive Director weinzier@ilcorn.org Illinois Corn Marketing Board (309) Rodney Weinzierl, Executive Director weinzier@ilcorn.org Indiana Corn Indiana Corn Marketing Council (800) Jane Ade Stevens, Executive Director jadestevens@indianacorn.org Iowa Corn Iowa Corn Promotion Board (515) Craig Floss, Chief Executive Officer cfloss@iowacorn.org Kansas Corn Kansas Corn Commission (785) Jere White, Executive Director jwhite@ksgrains.com Kentucky Corn Kentucky Corn Promotion Council (502) (800) Laura Knoth, Executive Director laura@kycorn.org Louisiana Soybean and Grain Research and Promotion Board (225) Kyle McCann, Corresponding Secretary kylem@lfbf.org Maryland Grain Producers Maryland Grain Producers Utilization Board (410) Lynne Hoot, Executive Director lynnehoot@aol.com Michigan Corn Corn Marketing Program of Michigan (517) 668-CORN (2676) corninfo@micorn.org Jody Pollok-Newsom, Executive Director jpollok@micorn.org Minnesota Corn Minnesota Corn Research and Promotion Council (952) Tim Gerlach, Executive Director gerlach@mncorn.org Mississippi Corn Mississippi Corn Promotion Board (662) Dr. Erick Larson elarson@pss.msstate.edu Missouri Corn Missouri Corn Merchandising Council (573) Gary Marshall, CEO gmarshall@mocorn.org Nebraska Corn Board (402) 471-CORN (2676) (800) Don Hutchens, Executive Director don.hutchens@nebraska.gov Nebraska Corn (402) (888) Scott Merritt, Executive Director smerritt@necga.org New York Corn & Soybean (518) Rick Zimmerman, Executive Director rzimmerman@zga-llc.com Corn of North Carolina (919) Julia Robbins, Executive Secretary jrobbins@earthlink.net North Dakota Corn North Dakota Corn Utilization Council (701) Tom Lilja, Executive Director tom@ndcorn.org Ohio Corn & Wheat Ohio Corn Marketing Program (740) Tadd Nicholson, Interim Executive Director tnicholson@ohiocornandwheat.org Oklahoma Corn (580) Raylon Earls Pennsylvania Corn (814) H. Grant Troop, Executive Director info@pacorngrowers.org South Carolina Corn and Soybean (803) Kathy Fudge, Executive Director sccsa@collabefforts.com South Dakota Corn South Dakota Corn Utilization Council (605) Lisa Richardson, Executive Director lisal@sdcorn.org Tennessee Corn (731) Polk Glover, Secretary/Treasurer polk@ken-tennwireless.com Corn Producers of Texas Texas Corn Producers Board (806) 763-CORN (2676) David Gibson, Executive Vice President dgibson@texascorn.org Virginia Corn, Soybean and Small Grains Boards (804) Phil Hickman, Program Director phil.hickman@vdacs.virginia.gov Virginia Grain Producers (757) Katie Frazier, Executive Director katie@virginiagrains.com Wisconsin Corn Wisconsin Corn Promotion Board (262) Robert Oleson, Executive Director wicorn@centurytel.net www@wicorn.org 3

4 Corn Production ONE BUSHEL (56 LBS.) OF CORN PROVIDES: 31.5 lbs. of starch or 33 lbs. of sweetener or 2.8 gal. of fuel ethanol or 22.4 lbs. of PLA fiber/polymer plus 17.5 lbs. of distillers dried grains with solubles* 13.5 lbs. of gluten feed** 2.6 lbs. of gluten meal** and 1.5 lbs. of corn oil** *In dry-grind ethanol process. **In wet-mill ethanol process. Gluten feed is 20 percent protein and gluten meal is 60 percent protein. U.S. CORN AT A GLANCE, million acres planted 84.0 million acres harvested 12.4 billion bushels produced $76.62 billion corn crop value $6.20 average price per bushel TOTAL DIGESTIBLE NUTRIENTS: Cracked corn: 90% Shelled corn: 88% Ear corn: 90% COMPONENTS OF YELLOW DENT CORN Wet Weight U.S. SELECT CROP VALUE, 2011 Billions of Dollars (U.S.) $0.18 Oats 3.8% Corn Oil 62% Starch $0.84 Barley $1.31 Sorghum $14.39 Wheat 15% Moisture 19.2% Protein & Fiber $35.76 Soybeans $76.62 Corn U.S. CORN PRODUCTION, 2011 Acres Planted (1,000s) Acres Harvested for Grain (1,000s) Average Yield (bushels/ acre) Total Production (1,000 bushels) Alabama ,500 Arizona ,760 Arkansas ,840 California ,750 Colorado 1,500 1, ,900 Connecticut 27 Delaware ,660 Florida ,000 Georgia ,660 Idaho ,200 Illinois 12,600 12, ,946,800 Indiana 5,900 5, ,500 Iowa 14,100 13, ,356,400 Kansas 4,900 4, ,400 Kentucky 1,380 1, ,700 Louisiana ,950 Maine 29 Maryland ,870 Massachusetts 17 Michigan 2,500 2, ,070 Minnesota 8,100 7, ,201,200 Mississippi ,720 Missouri 3,300 3, ,980 Montana ,680 Nebraska 9,850 9, ,536,000 Nevada 8 New Hampshire 15 New Jersey ,963 New Mexico ,740 New York 1, ,460 North Carolina ,460 North Dakota 2,230 2, ,300 Ohio 3,400 3, ,760 Oklahoma ,100 Oregon ,965 Pennsylvania 1, ,560 Rhode Island 2 South Carolina ,450 South Dakota 5,200 4, ,400 Tennessee ,285 Texas 2,050 1, ,710 Utah ,920 Vermont 90 Virginia ,120 Washington ,125 West Virginia ,534 Wisconsin 4,150 3, ,920 Wyoming ,100 U.S. 91,921 83, ,358,412 Source: World Agriculture Supply & Demand Estimates, 1/12/12 Source: USDA NASS, Crop Production 2011 Summary, 1/12/12 4
 18.9% Hay 25.")
5 U.S. ALL CROP ACRES HARVESTED, 2011 U.S. AVERAGE CORN YIELDS, Bushels per Acre Cotton 3.3% Sorghum (grain) 1.3% Rice 0.9% Barley 0.8% Sunflower 0.5% All Other 5.3% 15.5% Wheat 28.5% Corn (grain) 18.9% Hay 25.0% Soybeans Thousand Acres Corn (grain) 83,981 Sunflower 1,458 Proso Millet 338 Corn (silage) 5,928 Sugar Beets 1,213 Tobacco 325 Soybeans 73,636 Dry Edible Beans 1,156 Rye 242 Hay 55,633 Peanuts 1,098 Flaxseed 173 Wheat 45,705 Potatoes 1,077 Sweet Potatoes 130 Cotton 9,748 Canola 1,043 Safflower 127 Sorghum (grain) 3,929 Oats 939 Peppermint 74 Sorghum (silage) 224 Sugar Cane 873 Other 38 Rice 2,618 Lentils 411 Hops 30 Barley 2,239 Dry Edible Peas 343 Mustard Seed 22 Total 294, Source: USDA NASS, Crop Production 2011 Summary, 1/12/12 U.S. CORN PRODUCTION, ,230 2,414 2,629 3,598 5,646 8,119 7,475 9,503 8,967 10,087 11,806 11,112 10,531 13,038 12,092 13,092 12,447 12, Source: USDA NASS, Crop Production 2011 Summary, 1/12/12 Source: USDA NASS, Crop Production 2011 Summary, 1/12/12 U.S. CORN ACRES planted, Thousand Acres 109,364 86,837 83,275 65,919 74,179 84,097 75,957 75,702 78,894 78,603 80,929 81,779 78,327 93,527 85,982 86,382 88,192 91,921 U.S. CORN PRICES, Dollars per Bushels (U.S.) Source: USDA NASS, Crop Production 2011 Summary, 1/12/12 U.S. CORN ACRES HARVESTED, Thousand Acres 91,131 77,404 71,191 57,634 64,123 74,524 68,822 68,768 69,330 70,944 73,631 75,117 70,638 86,520 78,570 79,490 81,466 83,981 *Estimated **Projected for crop year 9/11 8/12 Source: USDA, WAOB, World Agriculture Supply & Demand Estimates, 1/12/12 U.S. CORN CROP VALUE, Billions of Dollars (U.S.) * 76.62** $0.29 $0.74 $1.66 $1.10 $1.08 $2.50 $2.37 $1.97 $2.32 $2.42 $2.06 $2.00 $3.04 $4.20 $4.06 $3.55 $5.18* $6.20** Source: USDA NASS, Crop Production 2011 Summary, 1/12/12 11 *Estimated **Projected for crop year 9/11 8/12 Source: USDA, World Agriculture Supply & Demand Estimates, 1/12/12 5

6 WORLD CORN PRODUCTION, * U.S. 12,358 Argentina 3.0% Ukraine 2.6% India 2.4% Mexico 2.4% S. Africa 1.4% Canada 1.2% 7.0% Brazil 7.4% EU % Other 22.1% China 36.2% U.S. China 7,549 EU-27 2,532 Brazil 2,401 Argentina 1,024 Ukraine 886 India 827 Mexico 807 S. Africa 492 Canada 421 Other 4,877 Source: USDA FAS, Grain: World Markets and Trade, 1/12/12 *Marketing Year 10/01/11 9/30/12 Total 34,174 WORLD CORN EXPORTS, * WORLD CORN IMPORTS, * S. Africa 2.4% India 2.3% EU % Paraguay 1.9% Serbia 1.7% Russia 1.1% Canada 0.5% Other 3.4% 44.4% U.S. 9.0% Brazil 12.7% Ukraine 18.5% Argentina U.S. 1,653 Argentina 689 Ukraine 472 Brazil 335 S. Africa 91 India 87 EU Paraguay 71 Serbia 63 Russia 39 Canada 20 Other 128 Total 3,727 Source: USDA FAS, Grain: World Markets and Trade, 1/12/12 *Marketing Year 10/01/11 9/30/12 China 4.2% Colombia 4.1% Iran 3.7% Malaysia 3.5% EU % 34.6% Other 17.0% Japan 6.3% Egypt 8.5% S. Korea 10.4% Mexico Japan 634 Mexico 386 S. Korea 315 Egypt 236 Taiwan 170 China 157 Colombia 154 Iran 138 Malaysia 130 EU Other 1,289 Total 3,727 Source: USDA FAS, Grain: World Markets and Trade, 1/12/12 *Marketing Year 10/01/11 9/30/12 WORLD CORN CONSUMPTION, * Total 34, Egypt 413 S. Africa 453 Canada 634 Japan 744 India 1,193 Mexico 2,047 Brazil 2,555 EU-27 7,519 China 7,198 Others 11,005 U.S. LEADING U.S. CORN EXPORT MARKETS Japan Mexico S. Korea Egypt Taiwan China Syria Canada Venezuela Israel Other Total 1,857 1,988 1,867 Source: USDA FAS, Grain: World Markets and Trade, 1/12/12 *Marketing Year 10/01/11 9/30/12 6

7 Corn Consumption U.S. CORN USAGE BY SEGMENT, 2011 HFCS 4.1% 7.1% Other CORN DISPLACED BY DDG/CGF IN DOMESTIC LIVESTOCK RATIONS 1,102 1,211 1,266* 13.0% Export 36.3% Feed & Residual % Reenters feed market as DDGs 27.3% Fuel Ethanol * Feed & Residual 4,600 Export 1,650 FSI Fuel Ethanol Corn displaced by DDG/CGF DDG exported 5,000 (1,266) (281) High-Fructose Corn Syrup 520 Sweeteners 265 Starch 260 Cereal/Other 202 Beverage Alcohol 135 Seed 24 Total FSI 6,406 Total Uses 12,656 Source: USDA ERS, Feed Outlook, 1/12 Note: Of the 5,000 million bushels of corn for ethanol, the equivalent of 1,266 million bushels of corn was produced in dried distillers grains and corn gluten feed for domestic use, and an additional 281 million bushels of dried distillers grains were exported. Source: ProExporter Network, 1/18/12 *Marketing year ending 8/31/12 HIGH-FRUCTOSE CORN SYRUP USAGE, * STARCH USAGE, * FOOD, SEED & INDUSTRIAL (FSI) USAGE, ,233 1,534 1,714 2,062 2,355 2,549 2,707 3,019 3,541 4,442 5,025 5,961 6,428 6,405* U.S. CORN USAGE BY SEGMENT, ,000 6,000 5,000 4,000 3,000 2,000 1,000 0 Feed & Residual Exports Carry-out FSI Source: USDA ERS, Feed Outlook *Projection Note: FSI includes corn used for ethanol, dried distillers grains and corn gluten feed. 7

8 SWEETENER USAGE, * CORN USED FOR ETHANOL AND DDGS PRODUCTION, ,168 1,323 1,603 2,119 3,049 3,709 4,591 5,021 5,000* U.S. CORN EXPORTS, ,660 1,327 2,177 2,229 1,794 1,503 1,979 1,937 1,941 1,905 1,588 1,900 1,818 2,134 2,125 2,437 1,858 1,980 1,835* 1,650** Source: USDA, WAOB, World Agriculture Supply & Demand Estimates, 1/12/12 *Estimate **Projection CEREAL & FOOD, * BEVERAGES & MANUFACTURING, * * Crop year ending 8/31/12. Includes approximately 1.3 billion bushels to be used as distillers grains for livestock feed. Source: ProExporter Network. Similar ratios apply for previous years. U.S. ETHANOL PRODUCTION FACILITIES, 2011 Million Gallons Under Nameplate Operating Construction/ Total Expansion Arizona California Colorado Georgia Idaho Illinois 1, , ,486.0 Indiana 1, , ,148.0 Iowa 3, , ,625.0 Kansas Kentucky Louisiana Michigan Minnesota 1, , ,147.0 Mississippi Missouri Nebraska 2, , ,089.0 New Mexico New York North Carolina North Dakota Ohio Oregon Pennsylvania South Dakota 1, , ,016.0 Tennessee Texas Virginia Wisconsin Wyoming Total 14, , ,770.9 Source: Renewable Fuels 8
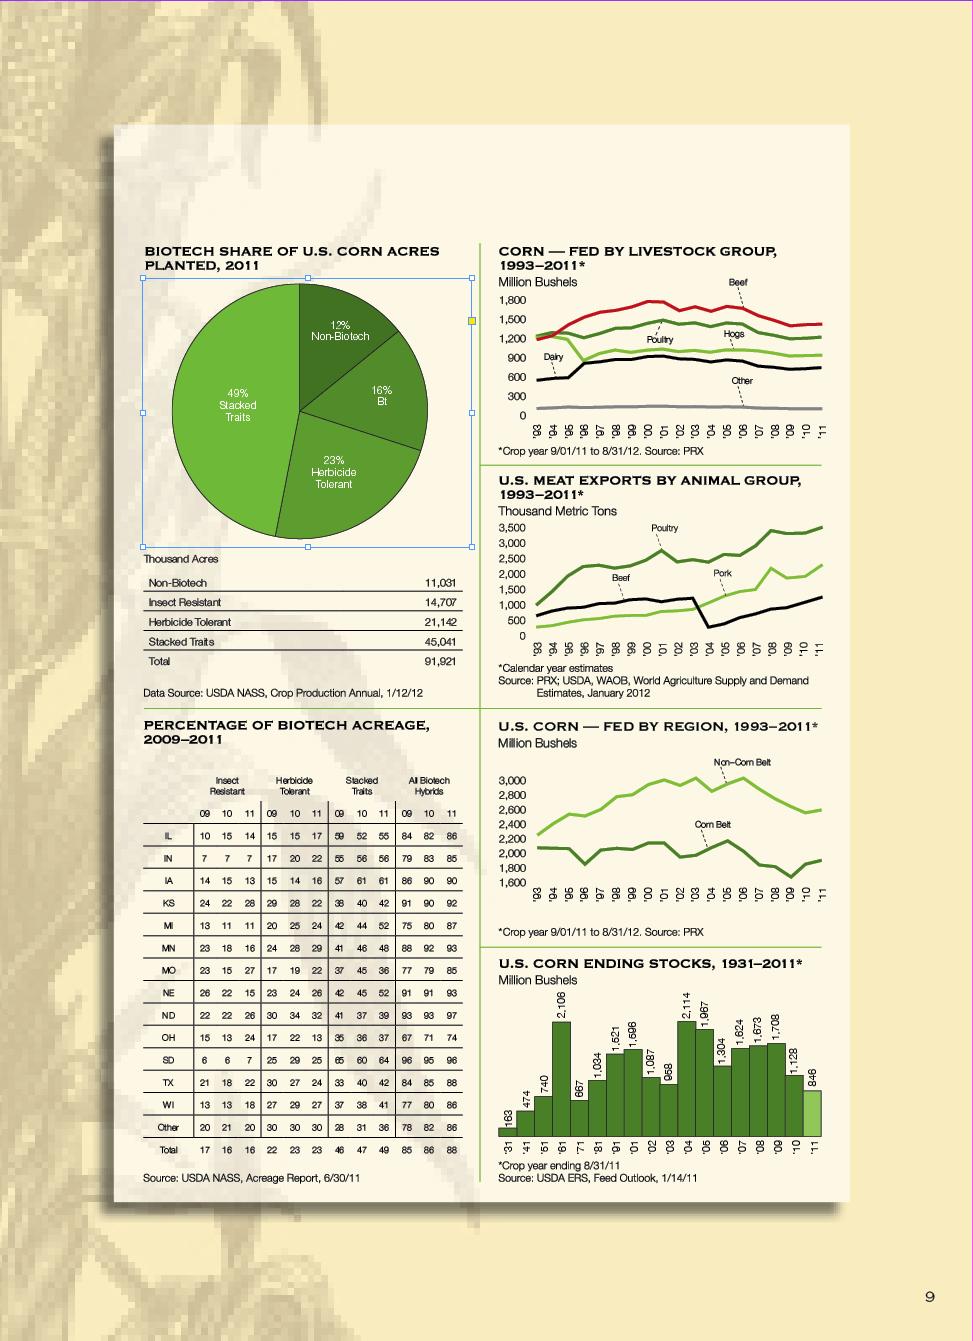
9
10 KEVIN IOWA FARMER

11 The land is my roots, my livelihood and my legacy. I m an American farmer. I grow more food now compared to a few decades ago using nearly half the energy and fewer resources for every bushel produced. Hear our stories at AmericasFarmers.com Monsanto and Vine Design is a registered trademark of Monsanto Technology LLC Monsanto Company.


12 Our Roots Go Deep Founded in 1957, the National Corn represents approximately 36,000 dues-paying corn growers and the interests of more than 300,000 farmers, who contribute through corn checkoff programs in their states. NCGA and its 48 affiliated state associations and checkoff organizations work together to help create and increase opportunities for corn growers. Visit for more details and updates on the corn industry National Corn
Bob Dickey. Bob Dickey. President, National Corn Growers Association Corn Grower from Laurel, Nebraska
 Bob Dickey Corn farmers in the United States are graded each year on how they respond to market demands, handle the pressure of weather extremes and improve their overall production practices. Their end
National Retail Report-Dairy
 Dairy Market News Branch Agricultural Marketing Service National Retail Report-Dairy Websites: http://www.marketnews.usda.gov/mnp/da-home and http://www.ams.usda.gov/mnreports/dybretail.pdf Volume 85-
National Retail Report-Dairy
 Dairy Market News Branch Agricultural Marketing Service National Retail Report-Dairy Websites: http://www.marketnews.usda.gov/mnp/da-home and http://www.ams.usda.gov/mnreports/dybretail.pdf Volume 85-
National Retail Report-Dairy
 Dairy Market News Branch Agricultural Marketing Service National Retail Report-Dairy Websites: http://www.marketnews.usda.gov/mnp/da-home and http://www.ams.usda.gov/mnreports/dybretail.pdf Volume 86-
Corn: Zea Mays, family poaceae, commonly known as Maize.
 Corn: Zea Mays, family poaceae, commonly known as Maize. Corn, a major source of food for both humans and animals, is grown in more countries than any other crop. The versatile plant can thrive in climates
National Retail Report-Dairy
 Dairy Market News Branch Agricultural Marketing Service National Retail Report-Dairy Websites: http://www.marketnews.usda.gov/mnp/da-home and http://www.ams.usda.gov/mnreports/dybretail.pdf Volume 86-
National Retail Report-Dairy
 Dairy Market News Branch Agricultural Marketing Service National Retail Report-Dairy Websites: http://www.marketnews.usda.gov/mnp/da-home and http://www.ams.usda.gov/mnreports/dybretail.pdf Volume 83-
National Retail Report-Dairy
 Dairy Market News Branch Agricultural Marketing Service National Retail Report-Dairy Websites: http://www.marketnews.usda.gov/mnp/da-home and http://www.ams.usda.gov/mnreports/dybretail.pdf Volume 86-
State Individual Income Tax Rates
 State Individual Income Tax Rates State Low High Low High Low High Alaama 1.500 5.000 2.000 5.000 2.000 5.000 Alaska 0.000 0.000 0.000 0.000 0.000 0.000 Arizona 2.000 8.000 3.800 7.000 2.870 5.040 Arkansas
Grain Stocks. Corn Stocks Up 15 Percent from June 2014 Soybean Stocks Up 54 Percent All Wheat Stocks Up 28 Percent
 Grain Stocks ISSN: 949-095 Released June 30, 05, by the National Agricultural Statistics Service (NASS), Agricultural Statistics Board, United s Department of Agriculture (USDA). Corn Stocks Up 5 Percent
Crop Production. Cotton Production Down 1 Percent from November Forecast Orange Production Down 1 Percent from October Forecast
 Crop Production ISSN: 19363737 Released December 10, 2010, by the National Agricultural Statistics Service (NASS), Agricultural Statistics Board, United States Department of Agriculture (USDA). Cotton
Grain Stocks. Corn Stocks Up 1 Percent from June 2017 Soybean Stocks Up 26 Percent All Wheat Stocks Down 7 Percent
 Grain Stocks ISSN: 949-095 Released June 9, 08, by the National Agricultural Statistics Service (NASS), Agricultural Statistics Board, United s Department of Agriculture (USDA). Corn Stocks Up Percent
Need it faster? Use 2-day or overnight shipping! We re sorry, due to state laws we are unable to expedite shipping to AZ, MA or NJ.
 Delivery Information Adult Signature Required Please send your wine to a home or business address where an individual at least 21 years of age is available during regular business hours to sign. By law
Crop Production. Winter Wheat Production Up 4 Percent from 2015 Orange Production Up 4 Percent from April Forecast
 Crop Production ISSN: 1936-3737 Released May 10, 2016, by the National Agricultural Statistics Service (NASS), Agricultural Statistics Board, United States Department of Agriculture (USDA). Winter Wheat
New England Middle Atlantic Region
 New England Middle Atlantic Region I. States of the New England Middle Atlantic Region: Maine - Delaware New Hampshire - New York Vermont - New Jersey Massachusetts - Pennsylvania Connecticut - Maryland
Recipe for the Northwest
 Recipe for the Northwest States: Idaho, Montana, Oregon, Washington, and Wyoming Latitude: 41 N to 49 N Elevation: The lowest areas are at sea level along the Pacific Ocean and the Snake River in Idaho
Chapter VIII.-CONVERSION FACTORS
 Chapter VIII.CONVERSION FACTORS 391. Purpose of conversion factors 392. How to use conversion factors A respondent may not always be able to give you information ' in the units of measure required for
CIRCLE The Center for Information & Research on Civic Learning & Engagement
 FACT SHEET CIRCLE The Center for Information & Research on Civic Learning & Engagement Youth in the States during the 2004 Presidential and 2002 Midterm Elections By Carrie Donovan, Mark Hugo Lopez, and
Prospective Plantings
 Prospective Plantings ISSN: 949-59X Released March 3, 07, by the National Agricultural Statistics Service (NASS), Agricultural Statistics Board, United s Department of Agriculture (USDA). Corn Planted
The State of the Craft Beer Raw Material Supply Sector; or Beer, Hops and Barley
 The State of the Craft Beer Raw Material Supply Sector; or Beer, Hops and Barley Damon Scott damon@brewersassociation.org Technical Brewing Projects Coordinator Brewers Association Brewers Association
Certified Organic Survey 2016 Summary
 United States Department of Agriculture National Agricultural Statistics Service Certified Organic Survey 0 Summary September 0 Contents Introduction... Page V TABLES. Farms, Land, and Value of Sales
PROFILE OF MARKET SERVED: Automatic Merchandiser. E-Newsletters. Marketing WEBSITE METRICS. Sessions Users Pageviews
 SOUTHCOMM ANALYTICS AUDIENCE PROFILE SOUTHCOMM BUSINESS MEDIA, LLC 1233 Janesville Ave., Fort Atkinson, WI 53538 800.547.7377 Southcomm.com For Period of July-September 2017 Automatic MERCHANDISER PROFILE
Unlocking the Power of the Seed
 SOYBEAN PROCESSING FLOWCHART OIL DISTILLATION GRINDING LOOSE, GROUND, OR PELLETED HULLS NOTE: The National Oilseed Processors Association () represents the U.S. soybean, canola, flaxseed, sunflower seed
Gecko Hospitality Survey Report 2017
 Salary Gecko Hospitality Survey Report 2017 www.geckohospitality.com Dear Restaurant Professional, On behalf of Gecko Hospitality, it s my pleasure to present our third annual Hospitality Management Salary
DATA AND ASSUMPTIONS (TAX CALCULATOR REVISION, MARCH 2017)
") DATA AND ASSUMPTIONS (TAX CALCULATOR REVISION, MARCH 2017) Taxes on sugary drinks can generate considerable revenue for states, cities, and the nation. The revised Revenue Calculator for Sugary Drink Taxes
DATA AND ASSUMPTIONS (TAX CALCULATOR REVISION, MARCH 2017) Taxes on sugary drinks can generate considerable revenue for states, cities, and the nation. The revised Revenue Calculator for Sugary Drink Taxes
Total cheese output (excluding cottage cheese) was 982 million pounds, 4.2 percent above February 2017 but 10.5 percent below January 2018.
 was 982 million pounds, 4.2 percent above February 2017 but 10.5 percent below January 2018.") Dairy Products ISSN: 949-0399 Released April 4,, by the National Agricultural Statistics Service (NASS), Agricultural Statistics Board, United States Department of Agriculture (USDA). Highlights Total
Dairy Products ISSN: 949-0399 Released April 4,, by the National Agricultural Statistics Service (NASS), Agricultural Statistics Board, United States Department of Agriculture (USDA). Highlights Total
Total cheese output (excluding cottage cheese) was 1.10 billion pounds, 2.7 percent above March 2017 and 11.6 percent above February 2018.
 was 1.10 billion pounds, 2.7 percent above March 2017 and 11.6 percent above February 2018.") Dairy Products ISSN: 949-0399 Released May 3,, by the National Agricultural Statistics Service (NASS), Agricultural Statistics Board, United States Department of Agriculture (USDA). Highlights Total cheese
Dairy Products ISSN: 949-0399 Released May 3,, by the National Agricultural Statistics Service (NASS), Agricultural Statistics Board, United States Department of Agriculture (USDA). Highlights Total cheese
Total cheese output (excluding cottage cheese) was 1.07 billion pounds, 0.9 percent above April 2017 but 3.7 percent below March 2018.
 was 1.07 billion pounds, 0.9 percent above April 2017 but 3.7 percent below March 2018.") Dairy Products ISSN: 949-0399 Released June 4,, by the National Agricultural Statistics Service (NASS), Agricultural Statistics Board, United States Department of Agriculture (USDA). Highlights Total cheese
Dairy Products ISSN: 949-0399 Released June 4,, by the National Agricultural Statistics Service (NASS), Agricultural Statistics Board, United States Department of Agriculture (USDA). Highlights Total cheese
Total cheese output (excluding cottage cheese) was 1.06 billion pounds, 3.1 percent above September 2017 but 2.0 percent below August 2018.
 was 1.06 billion pounds, 3.1 percent above September 2017 but 2.0 percent below August 2018.") Dairy Products ISSN: 949-0399 Released November,, by the National Agricultural Statistics Service (NASS), Agricultural Statistics Board, United States Department of Agriculture (USDA). Highlights Total
Dairy Products ISSN: 949-0399 Released November,, by the National Agricultural Statistics Service (NASS), Agricultural Statistics Board, United States Department of Agriculture (USDA). Highlights Total
Total cheese output (excluding cottage cheese) was 1.08 billion pounds, 2.8 percent above August 2017 but 0.7 percent below July 2018.
 was 1.08 billion pounds, 2.8 percent above August 2017 but 0.7 percent below July 2018.") Dairy Products ISSN: 949-0399 Released October 4,, by the National Agricultural Statistics Service (NASS), Agricultural Statistics Board, United States Department of Agriculture (USDA). Highlights Total
Dairy Products ISSN: 949-0399 Released October 4,, by the National Agricultural Statistics Service (NASS), Agricultural Statistics Board, United States Department of Agriculture (USDA). Highlights Total
Total cheese output (excluding cottage cheese) was 1.12 billion pounds, 3.0 percent above October 2017 and 6.1 percent above September 2018.
 was 1.12 billion pounds, 3.0 percent above October 2017 and 6.1 percent above September 2018.") Dairy Products ISSN: 949-0399 Released December 4,, by the National Agricultural Statistics Service (NASS), Agricultural Statistics Board, United States Department of Agriculture (USDA). Highlights Total
Dairy Products ISSN: 949-0399 Released December 4,, by the National Agricultural Statistics Service (NASS), Agricultural Statistics Board, United States Department of Agriculture (USDA). Highlights Total
Total cheese output (excluding cottage cheese) was 1.09 billion pounds, 1.4 percent above May 2017 and 1.7 percent above April 2018.
 was 1.09 billion pounds, 1.4 percent above May 2017 and 1.7 percent above April 2018.") Dairy Products ISSN: 949-0399 Released July 5,, by the National Agricultural Statistics Service (NASS), Agricultural Statistics Board, United States Department of Agriculture (USDA). Highlights Total cheese
Dairy Products ISSN: 949-0399 Released July 5,, by the National Agricultural Statistics Service (NASS), Agricultural Statistics Board, United States Department of Agriculture (USDA). Highlights Total cheese
Potatoes 2011 Summary
 United States Department of Agriculture National Agricultural Statistics Service Potatoes 0 Summary September 0 ISSN: Contents Introduction... Narrative... Potato Utilization United States: 000... 0 Potato
Total cheese output (excluding cottage cheese) was 1.08 billion pounds, 1.0 percent above November 2017 but 4.3 percent below October 2018.
 was 1.08 billion pounds, 1.0 percent above November 2017 but 4.3 percent below October 2018.") Dairy Products ISSN: 949-0399 Released February 4, 209, by the National Agricultural Statistics Service (NASS), Agricultural Statistics Board, United States Department of Agriculture (USDA). Highlights
Dairy Products ISSN: 949-0399 Released February 4, 209, by the National Agricultural Statistics Service (NASS), Agricultural Statistics Board, United States Department of Agriculture (USDA). Highlights
Potatoes 2014 Summary
 United States Department of Agriculture National Agricultural Statistics Service Potatoes 0 Summary September 0 ISSN: Contents Introduction... Narrative... Potato Utilization 0 Program States: 00... 0
Oilseed Industry in the United States
 Oilseed Industry in the United States The oilseed industry is a strong and vital participant in the U.S. economy. Oilseeds are highly versatile crops and are grown on more than 90 million acres. The worldwide
Differentiation in integrated health care policy approach an empirical analysis based on regional health life expectancy in China
 Differentiation in integrated health care policy approach an empirical analysis based on regional health life expectancy in China Mingxu Yang, Bei Lu 4 th International Conference of Long Term Care Directors
Honorable Members of the U.S. House of Representatives:
 April 28, 2015 Honorable Members of the U.S. House of Representatives: We are writing on behalf of the Coalition for Safe and Affordable Food about a significant development that could impact American
BRD BREWERS RESOURCE DIRECTORY
 BRD2013-2014 BREWERS RESOURCE DIRECTORY BENCHMARKING AND BESTPRACTICES SURVEY RESULTS REWERS ASSOCIATION MEMBERS-ONLY EXCLUSIVE CONTENT BREWERS ASSOCIATION MEMBERS-ONLY EXCLUSIVE CONTENT BREWERS ASSOCIATION
BRD BREWERS RESOURCE DIRECTORY
 BRD03-04 BREWERS RESOURCE DIRECTORY BENCHMARKING AND BESTPRACTICES SURVEY RESULTS REWERS ASSOCIATION MEMBERS-ONLY EXCLUSIVE CONTENT BREWERS ASSOCIATION MEMBERS-ONLY EXCLUSIVE CONTENT BREWERS ASSOCIATION
Benchmarking and Best Practices Survey Results
 nt brewers association members-only Exclusive content brewers association members-only Exclusive content brewers association members-only Exclusive Content bre brewers resource directory 211-212 Benchmarking
CropCast Weekly Oilseeds Report
 CropCast Weekly Oilseeds Report Don Keeney Thursday, CropCast Global Oilseeds Estimates AREA (m hectares) YIELD (kg/ha) PRODUCTION (mmt) CHANGE FROM LAST WEEK (mmt) 113.5 115.3 2641.3 2731.3 299.8 314.8
Regions of the United States
 Regions of the United States Class Outline Northeast South Midwest West The Northeast Northeast Maine, New Hampshire, Vermont, Massachusetts, Connecticut, Rhode Island, New York, New Jersey, Pennsylvania,
Total cheese output (excluding cottage cheese) was 1.09 billion pounds, 1.2 percent below December 2017 but 1.0 percent above November 2018.
 was 1.09 billion pounds, 1.2 percent below December 2017 but 1.0 percent above November 2018.") Dairy Products ISSN: 949-0399 Released February 28, 209, by the National Agricultural Statistics Service (NASS), Agricultural Statistics Board, United States Department of Agriculture (USDA). Highlights
Dairy Products ISSN: 949-0399 Released February 28, 209, by the National Agricultural Statistics Service (NASS), Agricultural Statistics Board, United States Department of Agriculture (USDA). Highlights
World Agricultural Outlook Board Interagency Commodity Estimates Committee Forecasts. Lockup Briefing February 10, 2015
 World Agricultural Outlook Board Interagency Commodity Estimates Committee Forecasts Lockup Briefing World Wheat Production Country or Region Million Tons Percent Percent World 716.1 725.0 0.2 1.2 United
Our Business. Our Values. Transparency : Services : Integrity :
 Our Business The Straits International Pte Ltd, founded in 2010, is a Singapore based supply chain manager specializing in agricultural and protein commodities. We originate and buy physical products from
Pledge of Quality and Origin. (Company Name) VeRUS Pet Foods (Address) P O BOX 239 ABINGDON MD (Website)
 VeRUS Pet Foods (Address) P O BOX 239 ABINGDON MD (Website)") Pledge of Quality and Origin (Company Name) VeRUS Pet Foods (Address) P O BOX 239 ABINGDON MD 21009 (Website) www.veruspetfoods.com The information provided is true and accurate, includes all ingredients
Pledge of Quality and Origin (Company Name) VeRUS Pet Foods (Address) P O BOX 239 ABINGDON MD 21009 (Website) www.veruspetfoods.com The information provided is true and accurate, includes all ingredients
Monitoring EU Agri-Food Trade: Development until October 2016
 Monitoring EU Agri-Food Trade: Development until October 2016 October 2016 EU agri-food exports stabilise at high level The monthly value of EU agri-food exports in October 2016 stabilised at EUR 11.4
Survey Overview. SRW States and Areas Surveyed. U.S. Wheat Class Production Areas. East Coast States. Gulf Port States
 Survey Overview Hard Red Winter Hard Red Spring Soft White Hard White U.S. Wheat Class Production Areas Gulf Port States East Coast States SRW States and Areas Surveyed Weather and Harvest: Soft red winter
May 11, The Honorable Tom Vilsack Secretary of Agriculture U.S. Department of Agriculture 1400 Independence Avenue, SW Washington, D.C.
 May 11, 2015 The Honorable Tom Vilsack Secretary of Agriculture U.S. Department of Agriculture 1400 Independence Avenue, SW Washington, D.C. 20250 Dear Secretary Vilsack: This letter is in regard to the
Quality of the United States Soybean Crop: Dr. Seth. L. Naeve and Dr. James H. Orf 2
 Quality of the United States Soybean Crop: 2007 1 Dr. Seth. L. Naeve and Dr. James H. Orf 2 Summary The American Soybean Association and the US Soybean Export Council have supported a survey of the quality
2014 U.S. Dry Bean Outlook
 2014 U.S. Dry Bean Outlook Steven Zahniser and Hodan Farah Wells USDA Economic Research Service Presentation delivered at U.S. Dry Bean Convention Coeur d Alene, ID, August 5, 2014 The views expressed
Honorable Members of the U.S. House of Representatives:
 July 21, 2015 Honorable Members of the U.S. House of Representatives: We are writing on behalf of the Coalition for Safe and Affordable Food to urge your support for H.R. 1599, the Safe and Accurate Food
Prospective Plantings
 Washington, D.C. Prospective Plantings Released March 30, 2007, by the National Agricultural Statistics Service (NASS),, U.S. Department of Agriculture. For information on call (202) 720-2127, office hours
Monitoring EU Agri-Food Trade: Development until June 2017
 Monitoring EU Agri-Food Trade: Development until June 2017 June 2017: Agri-food exports again above previous years level After a rebound in May, the monthly value of EU agri-food exports went down to EUR
Monitoring EU Agri-Food Trade: Development until December 2016
 Monitoring EU Agri-Food Trade: Development until December 2016 EU agri-food exports at highest annual level ever: EUR 130.7 billion The annual value of EU agri-food exports in 2016 reached a new record
USA INTERNET AND SOCIAL MEDIA REPORT Usage of Internet and social media among US wine consumers
 Report Brochure USA INTERNET AND SOCIAL MEDIA REPORT Usage of Internet and social media among US wine consumers JULY 2011 REPORT PRICE: 1,500 or 3 Report Credits Wine Intelligence 2013 1 Contents page
2017 U.S. DISTILLERS GRAINS EXPORTS
 217 U.S. DISTILLERS GRAINS EXPORTS 14, Annual U.S. Distillers Grains Exports 12, 12,695 1, 8, 6, 4, 2, 2,358 4,532 5,651 9,5 7,676 7,421 9,67 11,284 11,314 11,77 U.S. exports of distillers grains (DG)
STUDY GUIDE: AGRICULTURE: CROPS
 319 S. Naperville Road Wheaton, IL 60187 www.questionsgalore.net Phone: (630) 580-5735 E-Mail: info@questionsgalore.net Fax: (630) 580-5765 STUDY GUIDE: AGRICULTURE: CROPS MAIN FIELD CROPS GROWN IN THE
Monitoring EU Agri-Food Trade: Development until August 2018
 Monitoring EU Agri-Food Trade: Development until August 2018 August 2018: Export performance remains stable; imports from US continue to increase The value of EU agri-food trade in the month of August
United States Soybean Quality
 United States Soybean Quality Dr. Jill Miller Garvin and Dr. Seth L. Naeve TABLE OF CONTENTS 2015 Quality Report... 1 References... 7 Figure 1 US Soybean Planting and Harvest Progress... 8 Figure 2 US
Monitoring EU Agri-Food Trade: Development until August 2017
 Monitoring EU Agri-Food Trade: Development until August 2017 August 2017: Agri-food exports continue strong The monthly value of EU agri-food exports rose slightly to EUR 11.5 billion in August 2017, a
UPPER MIDWEST DAIRY NEWS
 Federal Milk Market Administrator U.S. Department of Agriculture UPPER MIDWEST DAIRY NEWS Victor J. Halverson, Market Administrator Volume 18, Issue 3 Upper Midwest Marketing Area, Federal Order No. 30
Soybean Oil and Palm Oil Account For An Increasing Share of World Vegetable Oil Consumption
 United States Department of Agriculture Foreign Agricultural Service Circular Series FOP 01-03 January 2003 Soybean Oil and Palm Oil Account For An Increasing Share of World Vegetable Oil Consumption Percent
State Licensing of Wine Sales in Food Stores: Impact on Existing Liquor Stores
 State Licensing of Wine Sales in Food Stores: Impact on Existing Liquor Stores Prepared by American Economics Group, Inc. for Food Marketing Institute March 2004 AMERICAN ECONOMICS GROUP, Inc. 2100 M St.
Monitoring EU Agri-Food Trade: Development until April 2017
 Monitoring EU Agri-Food Trade: Development until April 2017 April 2017: Agri-food exports back to average values The monthly value of EU agri-food exports in April 2017 reached a value of EUR 10.6 billion,
Monitoring EU Agri-Food Trade: Development until March 2017
 Monitoring EU Agri-Food Trade: Development until March 2017 March 2017: record value in monthly agri-food exports at EUR 12.7 billion The monthly value of EU agri-food exports in March 2017 reached a value
GRAINS AND LEGUMES OF THE WORLD
 GRAINS AND LEGUMES OF THE WORLD By: Grains 1. Grains are the seeds or fruits of plants from the grass family, including barley, corn, oats, rice, and wheat. 2. Early agriculture arose with the cultivation
Monitoring EU Agri-Food Trade: Development until October 2018
 Monitoring EU Agri-Food Trade: Development until October 2018 October 2018: best EU agri-food export performance ever The monthly value of EU agri-food trade in October 2018 was second biggest ever recorded
Monitoring EU Agri-Food Trade: Development until January 2016
 Monitoring EU Agri-Food Trade: Development until January 2016 January 2015 - EU agri-food exports in line with seasonal trend EU agri-food exports in January 2016 were worth EUR 9.3 billion, thus just
United States Soybean Quality. Prepared for the American Soybean Association International Marketing Soy Outlook Conferences
 United States Soybean Quality Annual Report 2013 Prepared for the American Soybean Association International Marketing Soy Outlook Conferences Dr. Seth L. Naeve, Dr. James H. Orf, and Nick H. Weidenbenner
EU28: Main exported Agricultural products (average in million Euro)
") EU28: Main exported Agricultural products (average 2011-2013 - in million Euro) Agricultural products Spirits and liqueurs Wine and vermouth Wheat Pork meat (fresh, chilled or frozen), w/o preparations
EU28: Main exported Agricultural products (average 2011-2013 - in million Euro) Agricultural products Spirits and liqueurs Wine and vermouth Wheat Pork meat (fresh, chilled or frozen), w/o preparations
Outline. Long-term Outlook for Cotton Consumption. World End-Use Consumption of Textile Fibers. World Consumption of Textile Fibers
 World Cotton Supply and Use International Cotton Advisory Committee Secretariat Outline! Long-term Outlook for Consumption! Outlook for /! Developments in World Cotton Trade Fifth Open Session: Cotton
Kentucky s Grain Farmers proudly present
 Kentucky s Grain Farmers proudly present A Study Guide for Corn and Wheat Kentucky farmers grow grains, which are part of a nutritious diet. GRAINS are the seeds or kernels of plants that belong to the
1301 Longworth House Building 328 Russell Senate Building. Washington, DC Washington, DC 20510
 August 29, 2018 The Honorable Mike Conaway The Honorable Pat Roberts Chairman Chairman House Committee on Agriculture Senate Committee on Agriculture 1301 Longworth House Building 328A Russell Senate Building
Monitoring EU Agri-Food Trade: Development until November 2016
 Monitoring EU Agri-Food Trade: Development until November 2016 November 2016 EU agri-food exports again at record level The monthly value of EU agri-food exports in November 2016 reached a new record level
EU Cereals Trade 2014/15 Marketing Year July - June. AGRI C 4 Committee for the Common Organisation of Agricultural Markets 27 August 2015
 EU Cereals Trade Marketing Year July - June AGRI C 4 Committee for the Common Organisation of Agricultural Markets 27 August 215 mio t 6 5 4 3 EU 28 - Cereals exports and imports from 2/1 to including
EU-28: Main imported Agricultural products (average in million Euro)
") EU-28: Main imported Agricultural products (average 2011-2013 - in million Euro) Oilcakes Soyabeans Cocoa Oilseeds, other than soyabeans Raw tobacco Cereals, other than wheat and rice Beet and cane sugar
EU-28: Main imported Agricultural products (average 2011-2013 - in million Euro) Oilcakes Soyabeans Cocoa Oilseeds, other than soyabeans Raw tobacco Cereals, other than wheat and rice Beet and cane sugar
Monitoring EU Agri-Food Trade: Development until December 2015
 Monitoring EU Agri-Food Trade: Development until December 2015 December 2015 - EU agri-food exports again higher than in previous years EU agri-food exports in December 2015 achieved a value of EUR 11.2
An Economic Analysis of Producing Carrots in the Red River Valley
 Agricultural Economics Report No. 430 November 1999 An Economic Analysis of Producing Carrots in the Red River Valley Won W. Koo Richard D. Taylor Department of Agricultural Economics Northern Plains Trade
The Science of Maryland Agriculture
 The Science of Maryland Agriculture OBJECTIVES: Students will be able to identify the 3 types of corn grown in the world. Students will learn the major uses of corn and its byproducts. Students will learn
Table of Contents 2010 OMS TITLE IN ALL CAPS
 1 2010 OMS TITLE IN ALL CAPS What is OMS? The Wines & Vines Online Marketing System (OMS) is the industry standard marketing application. Powered by the wine and grape industry s leading database, the
January 2015 WORLD GRAPE MARKET SUPPLY, DEMAND AND FORECAST
 January 2015 WORLD GRAPE MARKET SUPPLY, DEMAND AND FORECAST Table of Contents Executive Summary... 4 1. VARIETIES OF GRAPES... 6 1.1. White table grapes... 6 1.2. Red table grapes... 6 2. WORLD DEMAND
Monitoring EU Agri-Food Trade: Development until January 2018
 Monitoring EU Agri-Food Trade: Development until January 2018 January 2018: good start of a year for EU agri-food exports The value of EU agri-food exports in January 2018 kept its very high level, now
Americans are more than a little
 U.S. Consumption Patterns of Tree Nuts Biing-Hwan Lin Elizabeth Frazao Jane Allshouse (202) 694-5458 (202) 694-5455 (202) 694-5449 blin@ers.usda.gov efrazao@ers.usda.gov allshous@ers.usda.gov Americans
Monitoring EU Agri-Food Trade: Development until March 2018
 Monitoring EU Agri-Food Trade: Development until March 2018 14.000 EU28: Export to Extra-EU of Agri-Food Products 13.000 12.000 11.000 10.000 2018 2017 2015 2016 2014 9.000 8.000 7.000 6.000 Jan Feb Mar
The supply and demand for oilseeds in South Africa
 THIS REPORT CONTAINS ASSESSMENTS OF COMMODITY AND TRADE ISSUES MADE BY USDA STAFF AND NOT NECESSARILY STATEMENTS OF OFFICIAL U.S. GOVERNMENT POLICY Required Report - public distribution Date: GAIN Report
Global Considerations
 What Does Being a Global Player Mean to the U.S. Dairy Sector? Global Considerations 2 1 A Decade of Change $8, 4,5 $7, 4, (Million $) $6, $5, $4, $3, $2, $1, 3,5 3, 2,5 2, 1,5 1, 5 (Million Lbs.) $ 23
Crop Production. Orange Production Down 1 Percent from December Forecast
 Crop Production ISSN: 1936-3737 Released January 12, 2016, by the National Agricultural Statistics Service (NASS), Agricultural Statistics Board, United States Department of Agriculture (USDA). Orange
The supply and demand for oilseeds in South Africa
 THIS REPORT CONTAINS ASSESSMENTS OF COMMODITY AND TRADE ISSUES MADE BY USDA STAFF AND NOT NECESSARILY STATEMENTS OF OFFICIAL U.S. GOVERNMENT POLICY Required Report - public distribution Date: GAIN Report
MARCOS S. JANK. JAPAN BRAZIL Bilateral Dynamics and Partnership in the Agri-Food Sector
 MARCOS S. JANK JAPAN BRAZIL Bilateral Dynamics and Partnership in the Agri-Food Sector JAPAN-BRAZIL BUSINESS COUNCIL Tokyo, Japan 24 th July 2018 Japan and Brazil Competitive Advantages in the Agri-Food
Annual Report United States Soybean Quality. November Prepared for the US Soybean Export Council (USSEC) US Soy Outlook Conferences
 US Soy Outlook Conferences") United States Soybean Quality Annual Report 2016 Prepared for the US Soybean Export Council (USSEC) US Soy Outlook Conferences November 2016 Dr. Jill Miller-Garvin and Dr. Seth L. Naeve TABLE OF CONTENTS
United States Soybean Quality Annual Report 2016 Prepared for the US Soybean Export Council (USSEC) US Soy Outlook Conferences November 2016 Dr. Jill Miller-Garvin and Dr. Seth L. Naeve TABLE OF CONTENTS
Sprouts is a healthy grocery store offering fresh, natural and organic foods at great prices. Based on the belief that healthy food should be
 Sprouts is a healthy grocery store offering fresh, natural and organic foods at great prices. Based on the belief that healthy food should be affordable, Sprouts welcoming environment and knowledgeable
MEAT DEMAND Table 1: Willingness-to-Pay. Deli Ham
 About the Survey FooDS tracks consumer preferences and sentiments on the safety, quality, and price of food at home and away from home with particular focus on meat demand. FooDS is a monthly on-line survey
Corn is a SUPER PLANT!
 The Kentucky Corn Growers Association presents Corny Humor What is worse than nding a worm in your corn? Finding only half a worm. Why did the corn get mad at the farmer? Because he kept pulling its ears.
Market Implications for GM Crops
 Market Implications for GM Crops By Lloyd George www.farmhorizons.com Ph 03 9573 98 lloyd@farmhorizons.com Agriculture Australia 2003 Melbourne 12-14 August Farm Horizons Australian grain information service
IMPORTANT. For assistance updating your membership or retrieving your membership login credentials, please
 CIDER MARKET TRENDS EXECUTIVE SUMMARY: 2017 IMPORTANT This public summary is a highlight view of USACM s first annual cider market report in partnership with Nielsen, a global measurement and data analytics
National Illicit Drug Prices
 National Illicit Drug Prices U.S. DEPARTMENT OF JUSTICE Product No. 2011-L0424-001 January 2011 Year-End 2009 and Midyear 2010 Preface The Intelligence Bulletin National Illicit Drug Prices Year-End 2009
South American Soybean Stocks (Argentina and Brazil) Expected to Increase in 2001/02 to Record Level Despite Record Exports
 Expected to Increase in 2001/02 to Record Level Despite Record Exports") United States Department of Agriculture Foreign Agricultural Service Circular Series FOP 02-02 February 2002 South American Soybean Stocks (Argentina and Brazil) Expected to Increase in 2001/02 to Record
United States Department of Agriculture Foreign Agricultural Service Circular Series FOP 02-02 February 2002 South American Soybean Stocks (Argentina and Brazil) Expected to Increase in 2001/02 to Record
THE ECONOMIC IMPACT OF WINE AND WINE GRAPES ON THE STATE OF TEXAS 2015
 THE ECONOMIC IMPACT OF WINE AND WINE GRAPES ON THE STATE OF TEXAS 2015 A Frank, Rimerman + Co. LLP Report Updated January 2017 This study was commissioned by the Texas Wine and Grape Growers Association