NABCA Releases Control States Nine-Liter Spirits Sales for December
|
|
|
- Ursula Ross
- 5 years ago
- Views:
Transcription

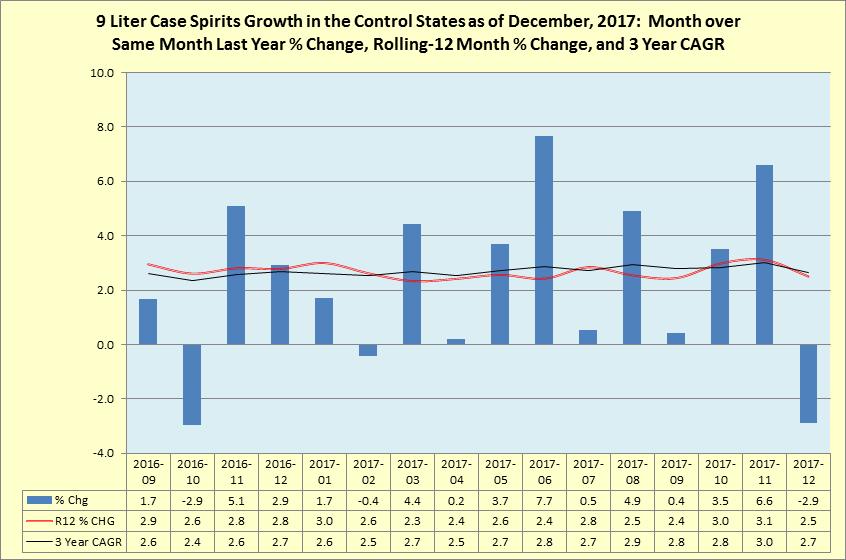
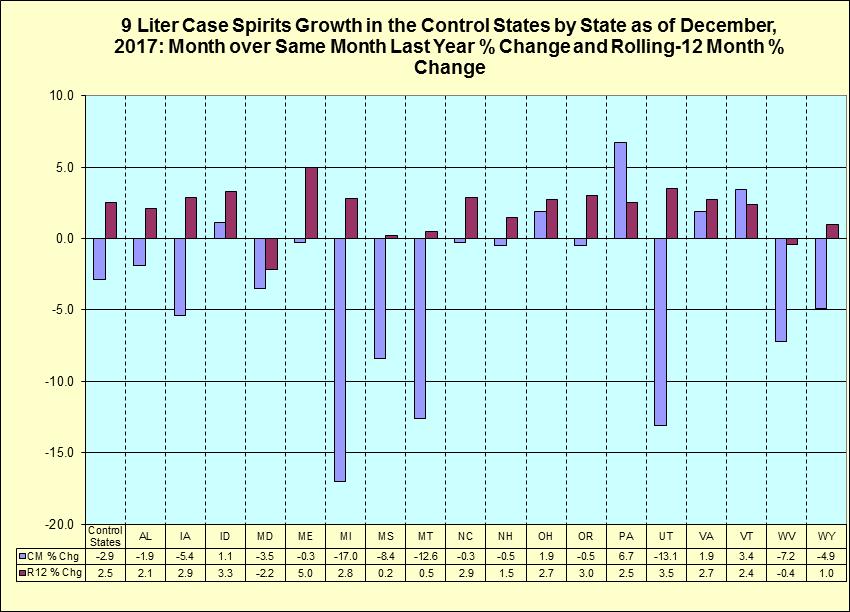
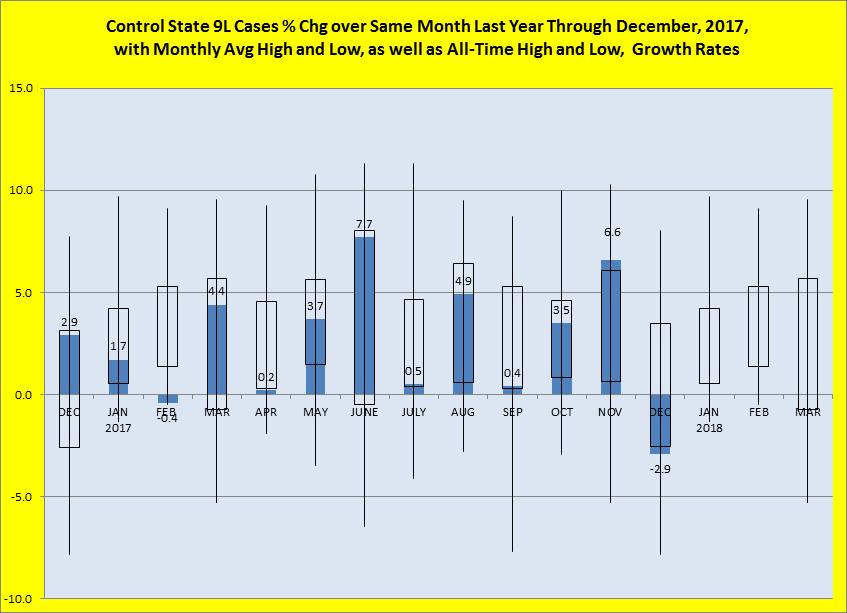
1 Contact: Margaret Barchine, APR FOR IMMEDIATE RELEASE Office; Cell NABCA Releases Control States Nine-Liter Spirits Sales for December Control State results for nine-liter beverage sales for December 2017 END-OF-YEAR RESULTS During 2017 nine-liter case spirits sales in the control states grew at 2.5%, down from 2016 s 2.8% and 2015 s 2.7%. Shelf Dollars grew at 4.7%, down from 2016 s 5.0% and 2015 s 5.3% s volumetric growth, 2.5%, lags the Control States eighteen-year CAGR calculated to be 2.8%. During the past five years, volumetric growth has been below average and trending down, suggesting that 2018 s growth rate will be comparable to or slightly lower than those reported during recent years s dollar growth, down slightly from growth rates reported during the past few years, is trending slightly downward, suggesting that 2018 s growth will lag rates reported during recent years. Tequila s 9.5% annual nine-liter case growth rate, compared to 2016 s 8.4%, is noteworthy. However, again during 2017 Irish Whiskey outpaced all other categories with an annual growth rate of 14.2%, down from 2016 s 14.7%. During 2017, Brandy/Cognac, Canadian Whiskey, Cocktails, Cordials, Domestic Whiskey, Gin, Irish Whiskey, Rum, Scotch, Tequila, and Vodka grew at 4.4%, 2.2%, 4.3%, 0.1%, 4.2%, -0.8%, 14.2%, 0.0%, 0.0%, 9.5%, and 1.9%, respectively. The NorthWest Control States (Idaho, Montana, Oregon, Utah, and Wyoming) grew volumes at 2.7% during 2017, the NorthEast Control States (Maine, New Hampshire, and Vermont) grew volumes at 2.6%, the Central Control States (Iowa, Montgomery County Maryland, Michigan, Ohio, Pennsylvania, and West Virginia) reported growth of 2.5%, and the Southern Control States (Alabama, Mississippi, North Carolina, and Virginia) reported 2.3%. The four regions (Southern, North West, North East, and Central) grew Shelf Dollars at 4.3%, 4.4%, 5.2%, and 5.0%, respectively. END-OF-DECEMBER RESULTS During December, nine-liter control states spirits case sales, under the influence of calendar anomalies in Michigan and Utah, fell 2.9% over same period sales last year. Pennsylvania (6.7%) and Vermont (3.4%) reported monthly growth rates for December that exceeded their twelve-month trends. The growth rates for Alabama (-1.9%), Iowa (-5.4%), Idaho (1.1%), Montgomery County Maryland (-3.5%), Maine (-0.3%), Michigan (-17.0%), Mississippi (-8.4%), Montana (-12.6%), North Carolina (-0.3%), New Hampshire (-0.5%), Ohio (1.9%), Oregon (-0.5%), Utah (-13.1%), Virginia (1.9%), West Virginia (-7.2%), and Wyoming (-4.9%) fell short of matching their twelve month trends. Control state rolling-twelve month volume growth, 2.5%, was down from November s reported 3.1%. Spirits volumes have grown 2.5% year-to-date compared to 2.8% a year ago. Control state spirits shelf dollars were down 0.3% during December while trending at 4.7% during the past twelve months. Montgomery County Maryland (2.6%) and Pennsylvania (13.8%) reported growth rates
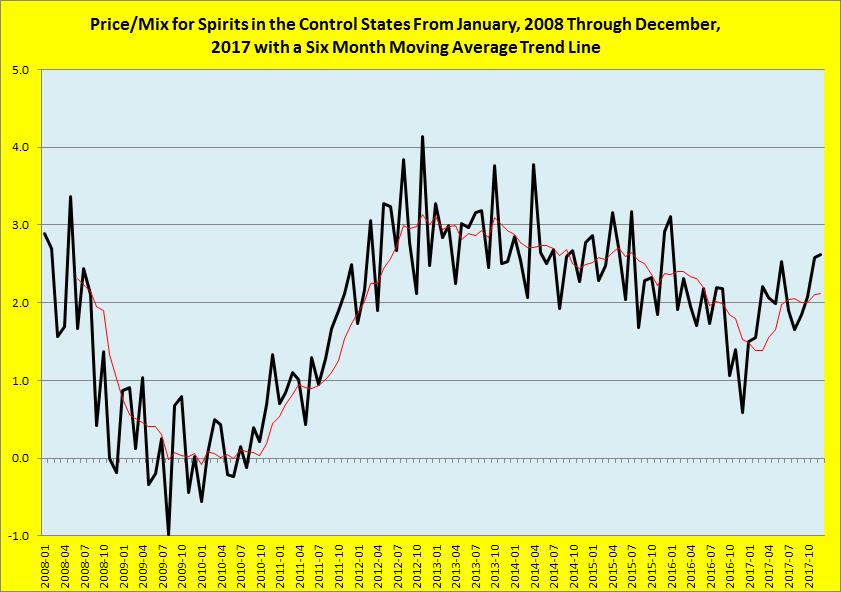
2 exceeding their twelve-month trends. Alabama (1.5%), Iowa (-3.6%), Idaho (2.9%), Maine (3.8%), Michigan (- 15.6%), Mississippi (-6.7%), Montana (-13.0%), North Carolina (0.4%), New Hampshire (1.5%), Ohio (5.7%), Oregon (1.0%), Utah (-10.1%), Virginia (2.5%), Vermont (5.1%), West Virginia (-6.5%), and Wyoming (-4.0%) grew shelf dollars at rates below their twelve month trends. Shelf dollars in the control states are up 4.7% year-to-date compared to 5.0% last year. Price/Mix for December is 2.6%, flat with November s reported 2.6%. December s Control State spirits nine-liter case and shelf dollar growth rates were effected by the Control States reporting calendars: Utah, with 2.6% of Control States spirits nine-liter case volumes and dollars, reported four weeks of sales this year versus five weeks of sales during December 2016, artificially deflating sales and skewing Control States results. Utah had six fewer selling days during this year s December than during last year s. Michigan, with 13.9% of Control States spirits nine-liter case volumes and 15.4% of Control States dollars, reported four weeks of sales this year versus five weeks of sales during December 2016, artificially deflating sales and skewing Control States results. Michigan had seven fewer selling days during this year s December than during last year s. December 2017 was a month with five Sundays compared to December 2016 which had four. Retail outlets in six Control States (Alabama, Mississippi, Montana, North Carolina, Utah, West Virginia) are closed on Sundays. Overall, December 2017 had seventeen fewer selling days, 3.4% fewer, than last year s December. After equivalizing nine-liter spirits case sales with respect to selling-day variations, December s volumetric growth is 2.0%, and rolling-twelve-month volume is up 2.4%. Likewise, after equivalizing shelf dollars, December s control states shelf dollar growth rate is 4.9% with a twelve-month trend of 4.5%. December s equivalized Price/Mix is 2.9%. Irish Whiskey, with 1% share of the nine-liter case-control states spirits market, was December s fastest growing category with 4.7% reported and a twelve-month trend of 14.2%. Vodka, with 35% share, grew during the same periods at -3.0% and 1.9%, respectively. All categories--irish Whiskey (4.7%), Cocktails (4.1%), Domestic Whiskey (0.1%), Vodka(-3.0%), Scotch(-3.9%), Gin(-4.8%), Cordials(-4.9%), Brandy/Cognac(- 4.9%), Rum(-5.0%), and Canadian Whiskey(-5.4%)--grew at rates below their twelve month trends. December s nine-liter wine case sales growth rate was -0.1%. Pennsylvania (reporting 3.9% nine-liter case growth for wines), New Hampshire (-0.2%), Utah (-14.5%), Mississippi (-7.1%), Montgomery County Maryland (-4.7%), and Wyoming (-6.3%) are the control states that are the sole wholesalers of wines and spirits within their geographical boundaries. Rolling-twelve month wine volume growth in these six control states was 2.0%, down from November s reported 2.4%. 9L Cases CM % Chg Shelf $ CM % Chg Price/Mix Control States Total Control States % Central Region % IA, MD, MI, OH, PA, WV NE Region % ME, NH, VT NW Region % ID, MT, OR, UT, WY Southern Region % AL, MS, NC, VA
3
4

5 For more information about the NABCA, visit ### ABOUT NABCA: Established in 1938, NABCA is the national association representing the Control State Systems - those jurisdictions that directly control the distribution and sale of beverage alcohol within their borders. Headquartered in Alexandria, VA, NABCA s mission is to support member jurisdictions in their efforts to protect public health and safety and assure responsible and efficient systems for beverage alcohol distribution and sales.
NABCA Releases Control States Nine-Liter Spirits Sales for March Control State results for nine-liter beverage sales for March 2017
 Contact: Margaret Barchine, APR 703-578-4200-Office; 703-907-9636-Cell maggie.barchine@nabca.org FOR IMMEDIATE RELEASE NABCA Releases Control States Nine-Liter Spirits Sales for March Control State results
NABCA Releases Control States Nine-Liter Spirits Sales for September
 Contact: Margaret Barchine, APR 703-578-4200-Office; 703-907-9636-Cell maggie.barchine@nabca.org FOR IMMEDIATE RELEASE NABCA Releases Control States Nine-Liter Spirits Sales for September Control State
National Retail Report-Dairy
 Dairy Market News Branch Agricultural Marketing Service National Retail Report-Dairy Websites: http://www.marketnews.usda.gov/mnp/da-home and http://www.ams.usda.gov/mnreports/dybretail.pdf Volume 85-
National Retail Report-Dairy
 Dairy Market News Branch Agricultural Marketing Service National Retail Report-Dairy Websites: http://www.marketnews.usda.gov/mnp/da-home and http://www.ams.usda.gov/mnreports/dybretail.pdf Volume 83-
National Retail Report-Dairy
 Dairy Market News Branch Agricultural Marketing Service National Retail Report-Dairy Websites: http://www.marketnews.usda.gov/mnp/da-home and http://www.ams.usda.gov/mnreports/dybretail.pdf Volume 86-
National Retail Report-Dairy
 Dairy Market News Branch Agricultural Marketing Service National Retail Report-Dairy Websites: http://www.marketnews.usda.gov/mnp/da-home and http://www.ams.usda.gov/mnreports/dybretail.pdf Volume 85-
National Retail Report-Dairy
 Dairy Market News Branch Agricultural Marketing Service National Retail Report-Dairy Websites: http://www.marketnews.usda.gov/mnp/da-home and http://www.ams.usda.gov/mnreports/dybretail.pdf Volume 86-
National Retail Report-Dairy
 Dairy Market News Branch Agricultural Marketing Service National Retail Report-Dairy Websites: http://www.marketnews.usda.gov/mnp/da-home and http://www.ams.usda.gov/mnreports/dybretail.pdf Volume 86-
State Individual Income Tax Rates
 State Individual Income Tax Rates State Low High Low High Low High Alaama 1.500 5.000 2.000 5.000 2.000 5.000 Alaska 0.000 0.000 0.000 0.000 0.000 0.000 Arizona 2.000 8.000 3.800 7.000 2.870 5.040 Arkansas
Need it faster? Use 2-day or overnight shipping! We re sorry, due to state laws we are unable to expedite shipping to AZ, MA or NJ.
 Delivery Information Adult Signature Required Please send your wine to a home or business address where an individual at least 21 years of age is available during regular business hours to sign. By law
DATA AND ASSUMPTIONS (TAX CALCULATOR REVISION, MARCH 2017)
") DATA AND ASSUMPTIONS (TAX CALCULATOR REVISION, MARCH 2017) Taxes on sugary drinks can generate considerable revenue for states, cities, and the nation. The revised Revenue Calculator for Sugary Drink Taxes
DATA AND ASSUMPTIONS (TAX CALCULATOR REVISION, MARCH 2017) Taxes on sugary drinks can generate considerable revenue for states, cities, and the nation. The revised Revenue Calculator for Sugary Drink Taxes
CIRCLE The Center for Information & Research on Civic Learning & Engagement
 FACT SHEET CIRCLE The Center for Information & Research on Civic Learning & Engagement Youth in the States during the 2004 Presidential and 2002 Midterm Elections By Carrie Donovan, Mark Hugo Lopez, and
SPECIFICATION MANUAL
 CONTROL STATES CODE (CSC) SPECIFICATION MANUAL NATIONAL ALCOHOL BEVERAGE CONTROL ASSOCIATION 4401 Ford avenue, suite 700 ALEXANDRIA, VIRGINIA 22302-1473 Tel: (703) 578-4200 STATISTICAL/CSC FAX: (703) 824-8134
BRD BREWERS RESOURCE DIRECTORY
 BRD2013-2014 BREWERS RESOURCE DIRECTORY BENCHMARKING AND BESTPRACTICES SURVEY RESULTS REWERS ASSOCIATION MEMBERS-ONLY EXCLUSIVE CONTENT BREWERS ASSOCIATION MEMBERS-ONLY EXCLUSIVE CONTENT BREWERS ASSOCIATION
State Licensing of Wine Sales in Food Stores: Impact on Existing Liquor Stores
 State Licensing of Wine Sales in Food Stores: Impact on Existing Liquor Stores Prepared by American Economics Group, Inc. for Food Marketing Institute March 2004 AMERICAN ECONOMICS GROUP, Inc. 2100 M St.
IMPORTANT. For assistance updating your membership or retrieving your membership login credentials, please
 CIDER MARKET TRENDS EXECUTIVE SUMMARY: 2017 IMPORTANT This public summary is a highlight view of USACM s first annual cider market report in partnership with Nielsen, a global measurement and data analytics
Gecko Hospitality Survey Report 2017
 Salary Gecko Hospitality Survey Report 2017 www.geckohospitality.com Dear Restaurant Professional, On behalf of Gecko Hospitality, it s my pleasure to present our third annual Hospitality Management Salary
BRD BREWERS RESOURCE DIRECTORY
 BRD03-04 BREWERS RESOURCE DIRECTORY BENCHMARKING AND BESTPRACTICES SURVEY RESULTS REWERS ASSOCIATION MEMBERS-ONLY EXCLUSIVE CONTENT BREWERS ASSOCIATION MEMBERS-ONLY EXCLUSIVE CONTENT BREWERS ASSOCIATION
Bob Dickey. Bob Dickey. President, National Corn Growers Association Corn Grower from Laurel, Nebraska
 Bob Dickey Corn farmers in the United States are graded each year on how they respond to market demands, handle the pressure of weather extremes and improve their overall production practices. Their end
January OAK WEALTH ADVISORS 2019 ABLE ACCOUNT COMPARISON MATRIX AK AL AR AZ CA ABLE Contact Information
 AK AL AR AZ CA ak.savewithable.com 888.609.8871 enableal.com 866.833.7949 ar.savewithable.com 888.609.8874 az able.com calable.ca.gov 833.225.2253 YES YES YES YES $40 to $60 $45 $40 to $60 $42 $37 Portion
COOKIES AND SWEET BISCUITS
 International Markets Bureau AMERICAN EATING TRENDS REPORT COOKIES AND SWEET BISCUITS Unless otherwise stated, all of the information in this report was derived from the NPD Group s National Eating Trends
RAW MILK REGULATIONS AND STATUTES 50 State Compilation
 RAW MILK REGULATIONS AND STATUTES 50 State Compilation AK ALASKA ADMIN. CODE tit. 18, 32 (cow, goat or sheep permitted) --- AL ALA. ADMIN. CODE. R. 420-3- 16 --- AR ARK. CODE. ANN. 20-59-227; 20-59-248
Benchmarking and Best Practices Survey Results
 nt brewers association members-only Exclusive content brewers association members-only Exclusive content brewers association members-only Exclusive Content bre brewers resource directory 211-212 Benchmarking
Recipe for the Northwest
 Recipe for the Northwest States: Idaho, Montana, Oregon, Washington, and Wyoming Latitude: 41 N to 49 N Elevation: The lowest areas are at sea level along the Pacific Ocean and the Snake River in Idaho
The State of the Craft Beer Raw Material Supply Sector; or Beer, Hops and Barley
 The State of the Craft Beer Raw Material Supply Sector; or Beer, Hops and Barley Damon Scott damon@brewersassociation.org Technical Brewing Projects Coordinator Brewers Association Brewers Association
A Step Ahead: Creating Focus for Your DTC Strategy. Steve Gross, Wine Institute VP of State Relations
 A Step Ahead: Creating Focus for Your DTC Strategy Steve Gross, Wine Institute VP of State Relations Goals for Today What happened in 2017? What do we anticipate for 2018? What can you be doing to help?
Purchasing, Receiving, Storing, and Issuing
 Chapter 18 Purchasing, Receiving, Storing, and Issuing After reading this chapter, you will be able to: Describe a wine list in terms of its depth and breadth. Identify factors to consider when choosing
NABCA News. Control State News. License State News. International News. Public Health News. Industry News. Daily News
 NABCA News Control State Results for June 2018 Control State News PA: Pennsylvania looks to cash in on state's craft beer boom License State News NJ: East Windsor recognizing Alcohol Awareness Month in
Emerging Practices: Breweries/Distilleries. Mike McCann Spencer Fane LLP spencerfane.com
 Emerging Practices: Breweries/Distilleries Mike McCann 816.292.8110 mmccann@spencerfane.com Industry Perspective Craft Industry Evolution Although showing signs of slowing growth, craft beer continues
New England Middle Atlantic Region
 New England Middle Atlantic Region I. States of the New England Middle Atlantic Region: Maine - Delaware New Hampshire - New York Vermont - New Jersey Massachusetts - Pennsylvania Connecticut - Maryland
PROFILE OF MARKET SERVED: Automatic Merchandiser. E-Newsletters. Marketing WEBSITE METRICS. Sessions Users Pageviews
 SOUTHCOMM ANALYTICS AUDIENCE PROFILE SOUTHCOMM BUSINESS MEDIA, LLC 1233 Janesville Ave., Fort Atkinson, WI 53538 800.547.7377 Southcomm.com For Period of July-September 2017 Automatic MERCHANDISER PROFILE
Certified Organic Survey 2016 Summary
 United States Department of Agriculture National Agricultural Statistics Service Certified Organic Survey 0 Summary September 0 Contents Introduction... Page V TABLES. Farms, Land, and Value of Sales
Wholesale Distributors
 Alabama Alaska Arizona Arkansas California International Wines Birmingham, AL (205) 945-7101 www.international-wines.com K&L Distributors Anchorage, AK (907) 563-3030 Young s Market Company Phoenix, AZ
Wholesale Distributors
 Alabama Alaska Arizona Arkansas California International Wines Birmingham, AL (205) 945-7101 www.international-wines.com K&L Distributors Anchorage, AK (907) 563-3030 Phoenix, AZ (602) 233-1900 Tucson,
Total cheese output (excluding cottage cheese) was 982 million pounds, 4.2 percent above February 2017 but 10.5 percent below January 2018.
 was 982 million pounds, 4.2 percent above February 2017 but 10.5 percent below January 2018.") Dairy Products ISSN: 949-0399 Released April 4,, by the National Agricultural Statistics Service (NASS), Agricultural Statistics Board, United States Department of Agriculture (USDA). Highlights Total
Dairy Products ISSN: 949-0399 Released April 4,, by the National Agricultural Statistics Service (NASS), Agricultural Statistics Board, United States Department of Agriculture (USDA). Highlights Total
Total cheese output (excluding cottage cheese) was 1.06 billion pounds, 3.1 percent above September 2017 but 2.0 percent below August 2018.
 was 1.06 billion pounds, 3.1 percent above September 2017 but 2.0 percent below August 2018.") Dairy Products ISSN: 949-0399 Released November,, by the National Agricultural Statistics Service (NASS), Agricultural Statistics Board, United States Department of Agriculture (USDA). Highlights Total
Dairy Products ISSN: 949-0399 Released November,, by the National Agricultural Statistics Service (NASS), Agricultural Statistics Board, United States Department of Agriculture (USDA). Highlights Total
Total cheese output (excluding cottage cheese) was 1.12 billion pounds, 3.0 percent above October 2017 and 6.1 percent above September 2018.
 was 1.12 billion pounds, 3.0 percent above October 2017 and 6.1 percent above September 2018.") Dairy Products ISSN: 949-0399 Released December 4,, by the National Agricultural Statistics Service (NASS), Agricultural Statistics Board, United States Department of Agriculture (USDA). Highlights Total
Dairy Products ISSN: 949-0399 Released December 4,, by the National Agricultural Statistics Service (NASS), Agricultural Statistics Board, United States Department of Agriculture (USDA). Highlights Total
Total cheese output (excluding cottage cheese) was 1.10 billion pounds, 2.7 percent above March 2017 and 11.6 percent above February 2018.
 was 1.10 billion pounds, 2.7 percent above March 2017 and 11.6 percent above February 2018.") Dairy Products ISSN: 949-0399 Released May 3,, by the National Agricultural Statistics Service (NASS), Agricultural Statistics Board, United States Department of Agriculture (USDA). Highlights Total cheese
Dairy Products ISSN: 949-0399 Released May 3,, by the National Agricultural Statistics Service (NASS), Agricultural Statistics Board, United States Department of Agriculture (USDA). Highlights Total cheese
Total cheese output (excluding cottage cheese) was 1.07 billion pounds, 0.9 percent above April 2017 but 3.7 percent below March 2018.
 was 1.07 billion pounds, 0.9 percent above April 2017 but 3.7 percent below March 2018.") Dairy Products ISSN: 949-0399 Released June 4,, by the National Agricultural Statistics Service (NASS), Agricultural Statistics Board, United States Department of Agriculture (USDA). Highlights Total cheese
Dairy Products ISSN: 949-0399 Released June 4,, by the National Agricultural Statistics Service (NASS), Agricultural Statistics Board, United States Department of Agriculture (USDA). Highlights Total cheese
Prospective Plantings
 Washington, D.C. Prospective Plantings Released March 30, 2007, by the National Agricultural Statistics Service (NASS),, U.S. Department of Agriculture. For information on call (202) 720-2127, office hours
Total cheese output (excluding cottage cheese) was 1.08 billion pounds, 2.8 percent above August 2017 but 0.7 percent below July 2018.
 was 1.08 billion pounds, 2.8 percent above August 2017 but 0.7 percent below July 2018.") Dairy Products ISSN: 949-0399 Released October 4,, by the National Agricultural Statistics Service (NASS), Agricultural Statistics Board, United States Department of Agriculture (USDA). Highlights Total
Dairy Products ISSN: 949-0399 Released October 4,, by the National Agricultural Statistics Service (NASS), Agricultural Statistics Board, United States Department of Agriculture (USDA). Highlights Total
Everclear still IS the NGS category with +95% share! Source(s): IRI Data 26 Weeks Ending 4/9/17 Total US MULO +C Nielsen Total US 7/15/17
: IRI Data 26 Weeks Ending 4/9/17 Total US MULO +C Nielsen Total US 7/15/17") Everclear still IS the NGS category with +95% share! Source(s): IRI Data 26 Weeks Ending 4/9/17 Total US MULO +C Nielsen Total US 7/15/17 MAKE IT YOUR OWN With a neutral profile and a unique ability to
Everclear still IS the NGS category with +95% share! Source(s): IRI Data 26 Weeks Ending 4/9/17 Total US MULO +C Nielsen Total US 7/15/17 MAKE IT YOUR OWN With a neutral profile and a unique ability to
Total cheese output (excluding cottage cheese) was 1.09 billion pounds, 1.4 percent above May 2017 and 1.7 percent above April 2018.
 was 1.09 billion pounds, 1.4 percent above May 2017 and 1.7 percent above April 2018.") Dairy Products ISSN: 949-0399 Released July 5,, by the National Agricultural Statistics Service (NASS), Agricultural Statistics Board, United States Department of Agriculture (USDA). Highlights Total cheese
Dairy Products ISSN: 949-0399 Released July 5,, by the National Agricultural Statistics Service (NASS), Agricultural Statistics Board, United States Department of Agriculture (USDA). Highlights Total cheese
Armenian Alcoholic Beverages Market and Industry Overview
 Avenue Consulting Group Strategy Operations Legal and Tax Armenian Alcoholic Beverages Market and Industry Overview Yerevan, 2015 Content Why This Report is Prepared 3 Armenian Alcoholic Beverages Market
Portable Convenient Red/ Orange Vegetable Options for K12
 Portable Convenient Red/ Orange Vegetable Options for K12 Unlimited K12 Menu Solutions: Offer these veggies everyday for dipping with popular entrees like Pizza, Chicken, & Burritos! Red/Orange Veggie
Crop Production. Winter Wheat Production Up 4 Percent from 2015 Orange Production Up 4 Percent from April Forecast
 Crop Production ISSN: 1936-3737 Released May 10, 2016, by the National Agricultural Statistics Service (NASS), Agricultural Statistics Board, United States Department of Agriculture (USDA). Winter Wheat
egrid2012 Version 1.0 Year 2009 Summary Tables
 Year 2009 Summary Tables egrid2012 Version 1.0 (created April 2012) 1. Year 2009 egrid Subregion - Greenhouse Gases 2. Year 2009 egrid Subregion - Criteria Pollutants 3. Year 2009 egrid Subregion Output
Potatoes 2011 Summary
 United States Department of Agriculture National Agricultural Statistics Service Potatoes 0 Summary September 0 ISSN: Contents Introduction... Narrative... Potato Utilization United States: 000... 0 Potato
Wholesale Distributors
 Alabama Alaska Arizona Arkansas California International Wines Birmingham, AL (205) 945-7101 www.international-wines.com K&L Distributors Anchorage, AK (907) 563-3030 Phoenix, AZ (602) 233-1900 Tucson,
Potatoes 2014 Summary
 United States Department of Agriculture National Agricultural Statistics Service Potatoes 0 Summary September 0 ISSN: Contents Introduction... Narrative... Potato Utilization 0 Program States: 00... 0
Differentiation in integrated health care policy approach an empirical analysis based on regional health life expectancy in China
 Differentiation in integrated health care policy approach an empirical analysis based on regional health life expectancy in China Mingxu Yang, Bei Lu 4 th International Conference of Long Term Care Directors
Total cheese output (excluding cottage cheese) was 1.08 billion pounds, 1.0 percent above November 2017 but 4.3 percent below October 2018.
 was 1.08 billion pounds, 1.0 percent above November 2017 but 4.3 percent below October 2018.") Dairy Products ISSN: 949-0399 Released February 4, 209, by the National Agricultural Statistics Service (NASS), Agricultural Statistics Board, United States Department of Agriculture (USDA). Highlights
Dairy Products ISSN: 949-0399 Released February 4, 209, by the National Agricultural Statistics Service (NASS), Agricultural Statistics Board, United States Department of Agriculture (USDA). Highlights
DIRECT-TO-CONSUMER WINE SHIPPING REPORT
 DIRECT-TO-CONSUMER WINE SHIPPING REPORT 1 Highlights of the Report GROWTH OF VOLUME Over 5M cases shipped. BOTTLE PRICES $ 200+ was the fastest growing price category. GROWTH OF VALUE direct-to-consumer
Dairy Market. Overview. Commercial Use of Dairy Products. U.S. Dairy Trade
 Dairy Market Dairy Management Inc. R E P O R T Volume 21 No. 5 May 2018 DMI NMPF Overview Many of the key dairy market statistics reported for March and April indicated that milk prices for U.S. dairy
Food Manufacturing in New Jersey Industry Report FOOD MANUFACTURING IN NEW JERSEY
 FOOD MANUFACTURING IN NEW JERSEY 1 1.4% 1.3% 1% 6.2% Number of NJ Food Manufacturing Establishments by Subsector FIGURE 1 6.7% 6.7% 7.2% 13.5% 56% Bakeries and Tortilla Manufacturers Other Food Manufacturing
Mango Retail Performance Report 2017
 Mango Retail Performance Report 2017 1 Table of Contents Pages 3-9 Pages 10-15 Pages 16-34 Pages 35-44 Pages 45-51 Pages 52-54 Executive Summary Fruit and Tropical Fruit Performance Whole Mango Performance
NABCA Control State Results. Control State News. License State News. International News. Public Health News. Industry News.
 NABCA Control State Results Control State Results for August 2018 Control State News VA: Miss Virginia Partners with Virginia ABC to Teach Students about Making Smart Choices License State News NY: Local
Grain Stocks. Corn Stocks Up 15 Percent from June 2014 Soybean Stocks Up 54 Percent All Wheat Stocks Up 28 Percent
 Grain Stocks ISSN: 949-095 Released June 30, 05, by the National Agricultural Statistics Service (NASS), Agricultural Statistics Board, United s Department of Agriculture (USDA). Corn Stocks Up 5 Percent
Updated: Hickory Harvest Expands Recall of Certain Sunflower Kernel Products Because of Possible Listeria Monocytogenes
 Updated: Hickory Harvest Expands Recall of Certain Sunflower Kernel Products Because of Possible Listeria Monocytogenes For Immediate Release June 3, 2016 Contact Consumers Consumers Customer Service Service
Global Considerations
 What Does Being a Global Player Mean to the U.S. Dairy Sector? Global Considerations 2 1 A Decade of Change $8, 4,5 $7, 4, (Million $) $6, $5, $4, $3, $2, $1, 3,5 3, 2,5 2, 1,5 1, 5 (Million Lbs.) $ 23
Honorable Members of the U.S. House of Representatives:
 April 28, 2015 Honorable Members of the U.S. House of Representatives: We are writing on behalf of the Coalition for Safe and Affordable Food about a significant development that could impact American
MEAT DEMAND Table 1: Willingness-to-Pay. Deli Ham
 About the Survey FooDS tracks consumer preferences and sentiments on the safety, quality, and price of food at home and away from home with particular focus on meat demand. FooDS is a monthly on-line survey
Re: LCBO Spirits & Beer New Sales Targets. New Sales Targets. February 3, To: All Trade Associations
 LC February 3, 2010 To: All Trade Associations Re: LCBO Spirits & Beer New Sales Targets Over the past decade, the LCBO Spirits & Beer category has experienced tremendous growth. That growth is continuing
Regions of the United States
 Regions of the United States Class Outline Northeast South Midwest West The Northeast Northeast Maine, New Hampshire, Vermont, Massachusetts, Connecticut, Rhode Island, New York, New Jersey, Pennsylvania,
What Does Being a Global Player Mean to the U.S. Dairy Sector?
 What Does Being a Global Player Mean to the U.S. Dairy Sector? Global Considerations Copyright of Daily Dairy Report, Inc. 2 A Decade of Change $8,000 4,500 $7,000 4,000 (Million $) $6,000 $5,000 $4,000
Grape Growers of Ontario Developing key measures to critically look at the grape and wine industry
 Grape Growers of Ontario Developing key measures to critically look at the grape and wine industry March 2012 Background and scope of the project Background The Grape Growers of Ontario GGO is looking
ENTERING THE U.S. WINE MARKET ISRAEL WINE EXPO
 1 ENTERING THE U.S. WINE MARKET ISRAEL WINE EXPO OVERVIEW OF THE U.S WINE MARKET Trends, Markets, Brand Economics OPPORTUNITIES / APPROACHES 2 U.S. WINE MARKET OVERVIEW Growth Continues For Twelve Consecutive
Coffee market ends 2014 at ten month low
 Coffee market ends 2014 at ten month low Coffee prices continued to slide downwards in December 2014, with the monthly average of the ICO composite indicator at its lowest level since February. Recent
Crop Production. Cotton Production Down 1 Percent from November Forecast Orange Production Down 1 Percent from October Forecast
 Crop Production ISSN: 19363737 Released December 10, 2010, by the National Agricultural Statistics Service (NASS), Agricultural Statistics Board, United States Department of Agriculture (USDA). Cotton
An Economic Analysis of Producing Carrots in the Red River Valley
 Agricultural Economics Report No. 430 November 1999 An Economic Analysis of Producing Carrots in the Red River Valley Won W. Koo Richard D. Taylor Department of Agricultural Economics Northern Plains Trade
Record exports from Brazil weigh heavy on the coffee market
 Record exports from Brazil weigh heavy on the coffee market Coffee exports from Brazil reached a record high of 36.8 million bags in crop year 2014/15 (April to March), fuelled by domestic stocks and encouraged
Chapter VIII.-CONVERSION FACTORS
 Chapter VIII.CONVERSION FACTORS 391. Purpose of conversion factors 392. How to use conversion factors A respondent may not always be able to give you information ' in the units of measure required for
Product Diversity and Consumer Choice in U.S. Markets for Wine, Beer, and Spirits
 Product Diversity and Consumer Choice in U.S. Markets for Wine, Beer, and Spirits Olivier GERGAUD (KEDGE University) Hervé REMAUD (KEDGE University) Brad RICKARD (Cornell University) Presented at the 2016
Dairy Outlook. December By Jim Dunn Professor of Agricultural Economics, Penn State University. Market Psychology
 Dairy Outlook December 2015 By Jim Dunn Professor of Agricultural Economics, Penn State University Market Psychology The Class III market has taken a beating lately as cheese prices have drifted down and
2011 Regional Wine Grape Marketing and Price Outlook
 Center for Crop Diversification Survey CCD-SV-1 2011 Regional Wine Grape Marketing and Price Outlook Timothy Woods and Matthew Ernst Dr. Woods is an Extension Professor at the University of Kentucky. Mr.
7th ANNUAL GUILD-WIDE BAKERY OPEN HOUSE - Saturday, June 24, 2017
 BRITISH COLUMBIA Brambles Bakery & Cafe 2151 Quilchena Ave. Merritt BC 10 am - 12 pm CALIFORNIA Beck's Bakery 100 Ericson Ct., Suite 100 C Arcata CA 11 am - 1 pm No RSVP needed Breaking Bread Bakery 1074
Dairy Market. July The U.S. average all-milk price rose by $0.20 per hundredweight in May from a
 Dairy Market Dairy Management Inc. R E P O R T Volume 20 No. 6 July 2017 DMI NMPF Overview The U.S. average all-milk price rose by $0.20 per hundredweight in May from a month earlier, and the June federal
Coffee prices maintain downward trend as 2015/16 production estimates show slight recovery
 Coffee prices maintain downward trend as 2015/16 production estimates show slight recovery The coffee market fell again in December 2015, reaching its second lowest monthly average of the year. This decrease
Hospital Acquired Infections Report. Disparities National Coordinating Center
 Author: Alex Shangraw, MSPH Editor: Madeleine Shea, PhD Hospital Acquired Infections 2011-2012 Report Disparities National Coordinating Center February 2014 Acknowledgements: Shanta Whitaker, PhD, MPH;
Total cheese output (excluding cottage cheese) was 1.09 billion pounds, 1.2 percent below December 2017 but 1.0 percent above November 2018.
 was 1.09 billion pounds, 1.2 percent below December 2017 but 1.0 percent above November 2018.") Dairy Products ISSN: 949-0399 Released February 28, 209, by the National Agricultural Statistics Service (NASS), Agricultural Statistics Board, United States Department of Agriculture (USDA). Highlights
Dairy Products ISSN: 949-0399 Released February 28, 209, by the National Agricultural Statistics Service (NASS), Agricultural Statistics Board, United States Department of Agriculture (USDA). Highlights
LOUISVILLE PECAN COMPANY
 2016 LOUISVILLE PECAN COMPANY Greetings from the Henson Family Enjoy We d like to thank our friends and customers for their loyalty and support throughout the years. We look forward to hearing from you
Grain Stocks. Corn Stocks Up 1 Percent from June 2017 Soybean Stocks Up 26 Percent All Wheat Stocks Down 7 Percent
 Grain Stocks ISSN: 949-095 Released June 9, 08, by the National Agricultural Statistics Service (NASS), Agricultural Statistics Board, United s Department of Agriculture (USDA). Corn Stocks Up Percent
MILLENNIAL CONSUMERS SEEK NEW TASTES, WILLING TO PAY A PREMIUM FOR ALCOHOLIC BEVERAGES. Nielsen Releases Most Comprehensive Study To Date
 The Nielsen Company 150 North Martingale Road Schaumburg, IL 60173-2076 www.nielsen.com News Release CONTACT: Jennifer Frighetto, 847-605-5686 jennifer.frighetto@nielsen.com FOR IMMEDIATE RELEASE MILLENNIAL
P O L I C I E S & P R O C E D U R E S. Single Can Cooler (SCC) Fixture Merchandising
 Fixture Merchandising") P O L I C I E S & P R O C E D U R E S Single Can Cooler (SCC) Fixture Merchandising Policies and s for displaying non-promotional beer TBS Marketing Written: August 2017 Effective date: November 2017 1
P O L I C I E S & P R O C E D U R E S Single Can Cooler (SCC) Fixture Merchandising Policies and s for displaying non-promotional beer TBS Marketing Written: August 2017 Effective date: November 2017 1
An Annual Report by ShipCompliant and Wines & Vines. Direct to consumer. Wine Shipping Report
 An Annual Report by ShipCompliant and Wines & Vines Direct to consumer Wine Shipping Report 2013 Trends and milestones for shipping wine directly to consumers. Introduction Executive summary Highlights
Table of Contents 2010 OMS TITLE IN ALL CAPS
 1 2010 OMS TITLE IN ALL CAPS What is OMS? The Wines & Vines Online Marketing System (OMS) is the industry standard marketing application. Powered by the wine and grape industry s leading database, the
GENERAL AGREEMENT ON RESTRICTED DS23/R TARIFFS AND TRADE (C/M/250, page 35). (DS23/2 of 12 April 1991).
. (DS23/2 of 12 April 1991).") GENERAL AGREEMENT ON TARIFFS AND TRADE RESTRICTED DS23/R 16 March 1992 Limited Distribution UNITED STATES - MEASURES AFFECTING ALCOHOLIC AND MALT BEVERAGES Report of the Panei 1. INTRODUCTION 1.1 On 7
GENERAL AGREEMENT ON TARIFFS AND TRADE RESTRICTED DS23/R 16 March 1992 Limited Distribution UNITED STATES - MEASURES AFFECTING ALCOHOLIC AND MALT BEVERAGES Report of the Panei 1. INTRODUCTION 1.1 On 7
THE ECONOMIC IMPACT OF WINE AND WINE GRAPES ON THE STATE OF TEXAS 2015
 THE ECONOMIC IMPACT OF WINE AND WINE GRAPES ON THE STATE OF TEXAS 2015 A Frank, Rimerman + Co. LLP Report Updated January 2017 This study was commissioned by the Texas Wine and Grape Growers Association
SPIRITS BUSINESS THE MEDIA PACK 2012 THE ONLY INTERNATIONAL TRADE MAGAZINE SOLELY DEDICATED TO SPIRITS
 ONLY INTERNATIONAL TRADE MAGAZINE SOLELY DEDICATED TO MEDIA PACK With a trend towards more sophisticated off-trade drinking, consumers seeking even more value for money, and continued growth in a largely
Americans are more than a little
 U.S. Consumption Patterns of Tree Nuts Biing-Hwan Lin Elizabeth Frazao Jane Allshouse (202) 694-5458 (202) 694-5455 (202) 694-5449 blin@ers.usda.gov efrazao@ers.usda.gov allshous@ers.usda.gov Americans
Local Health Departments and Regional Offices of Illinois Department of Public Health
 TO: FROM: Local Health Departments and Regional Offices of Illinois Department of Public Health William Beaty, Acting Chief Division of Food, Drugs and Dairies DATE: May 6, 2010 SUBJECT: MEMORANDUM FRESHWAY
AMERICAN GLOBAL EXPORTERS L.L.C.
 Current Bulk Distilled Spirits Pricing as of APRIL, 2017. (Prices subject to change) All Prices EWX/FOB. Minimums vary. Volume discounts available for most products. WHISKEY Scotch (3 YO) GBP3.50 per L/A
Dairy Market. May 2017
 Dairy Market Dairy Management Inc. R E P O R T Volume 20 No. 4 May 2017 DMI NMPF Overview The rate of milk production growth began to moderate during the first quarter, but additional milk production continues
UPPER MIDWEST DAIRY NEWS
 Federal Milk Market Administrator U.S. Department of Agriculture UPPER MIDWEST DAIRY NEWS Victor J. Halverson, Market Administrator Volume 18, Issue 3 Upper Midwest Marketing Area, Federal Order No. 30
Table. Outbreaks from Unpasteurized (Raw) Milk and non- Mexican Style Raw Milk Cheeses, United States, *
 Milk and non- Mexican Style Raw Milk Cheeses, United States, *") Table. Outbreaks from Unpasteurized (Raw) Milk and non- Mexican Style Raw Milk Cheeses, United States, 1998-2011.* Year Month State Etiology No. Ill No. Hosp. Source Comments/References 2011 Aug- Nov WA
Table. Outbreaks from Unpasteurized (Raw) Milk and non- Mexican Style Raw Milk Cheeses, United States, 1998-2011.* Year Month State Etiology No. Ill No. Hosp. Source Comments/References 2011 Aug- Nov WA
MIDWEST Rocky Mountain Region
 MIDWEST KENTUCKY Heartland CS.DH of W. Ky.S.IL. Greater Louisville CS Support Group OHIO Alliance Area Celiac Support Group Cincinnati celiac Support Group, Northeast Ohio Celiac Support Group Greater
U.S. Bottled Water Market
 IBWA 2016 U.S. Bottled Water Market Market Trends November 9, 2016 Beverage Marketing Capabilities Beverage Marketing Corporation utilizes an integrated model for providing information, analysis and advice
MANGO PERFORMANCE BENCHMARK REPORT
 MANGO PERFORMANCE BENCHMARK REPORT 2015-2016 TABLE OF CONTENTS Page 3 Page 5 Page 12 Page 15 Page 27 Page 36 Page 46 Approach and Data Set Parameters Overview and Mango Trend-Spotting Fruit and Tropical
Dairy Market. June 2017
 Dairy Market Dairy Management Inc. R E P O R T Volume 20 No. 5 June 2017 DMI NMPF Overview U.S. dairy exports were up substantially over a year earlier during February April, from 13 percent of U.S. milk
Dairy Market R E P O R T
 Volume 18 No. 8 Dairy Market R E P O R T August 2015 DMI NMPF Overview Milk prices in many major milk-producing countries have plummeted to levels that are producing severe financial stress for their farmers.