DEVELOPING A PERFORMANCE MEASUREMENT FRAMEWORK FOR THE SOUTH AFRICAN WINE SUPPLY CHAIN: A FOCUS ON THE BULK EXPORT SEGMENT.
|
|
|
- Linda Malone
- 6 years ago
- Views:
Transcription

1 DEVELOPING A PERFORMANCE MEASUREMENT FRAMEWORK FOR THE SOUTH AFRICAN WINE SUPPLY CHAIN: A FOCUS ON THE BULK EXPORT SEGMENT Johan Smit Department of Industrial Engineering University of Stellenbosch Study leader: Joubert van Eeden Thesis presented in fulfilment of the requirements for the degree of Master of Engineering Management in the Faculty of Engineering at Stellenbosch University M.Eng (Research) Engineering Management March 2016
2 Declaration I, the undersigned, hereby declare that the work contained in this final year project is my own original work and that I have not previously in its entirety or in part submitted it at any university for a degree Signature March Date Copyright 2016 Stellenbosch University All rights reserved i
3 Abstract The purpose of this study was to develop a performance measuring framework for the South African (SA) wine supply chain, focusing on the bulk export segment. Cellars lack supply chain knowledge, and, as a result, under-perform from a supply chain perspective. The framework will enable cellars to measure relevant processes whereby logistical performance can be improved and, in the process, advance the SA wine industry as a whole. In addition, this framework will enable cellars to benchmark quantitative supply chain data and compare it to other cellars or in future, to other countries competing in the same market. The performance measuring framework was developed using an emergent multi-phased exploratory approach. This thesis presents the exploratory approach as two distinct interactive phases, qualitative data collection to be the first approach and then quantitative. The explanatory approach was conducted in concurrent strands over a period of time that constituted a multi-phased approach. Multiple semi-structured and unstructured interviews were scheduled with cellars, freight forwarders and the department of agriculture, forestry and fisheries. In addition, projects were conducted by final year undergraduates, surveys were sent out and workshops were scheduled, each contributing to the quantitative and qualitative data comprising this thesis. For this thesis, the cellars represented 29.2 % of SA s bulk export segment and the representative freight forwarders were responsible for roughly 77.5% of SA s bulk exports. These samples were deemed sufficient in size to represent the knowledge of the segment. Findings revealed that cellars use insufficient supply chain segmentations. Their systems are not configured to record data in segments, which made it ii
4 difficult to collect the required quantitative data. Moreover, cellars are generally unaware of activities occurring further down the supply chain and, as a result, freight forwarders were approached to obtain quantitative data. In spite of this complication, an ideal framework was developed using primarily qualitative data. The ideal framework includes metrics that differentiates the various cellars focusing on bulk exports from one another. In conclusion, cellars should firstly, reconfigure their systems to record data in the segments proposed by this study. This will enable cellars to calculate the metrics in a segmented manner, thereby enabling them to compare different supply chains with one another. Secondly, cellars should ascertain which of their attributes demand the most attention or improvement, or alternatively, which attribute is best aligned with their strategy. The selected attribute should be implemented first in order to provide a platform on which other attributes should be implemented to avoid making unnecessary errors again. Finally, once all attributes have been implemented correctly at each cellar, benchmarking can commence. This will enable cellars to compare processes with one another, identify gaps in their processes, improve logistical operations and advance the industry as a whole. iii
5 Opsomming Die doel van hierdie studie was om n prestasiemeting raamwerk vir die SA wyn industrie se voorsieningsketting te ontwikkel, met die fokus op die stortmaat uitvoer segment. Kelders het n gebrek aan voorsieningsketting konsepte en relevante kennis, en as n gevolg onder presteer met n voorsieningsketting perspektief. Die raamwerk stel kelders in staat om relevante prosesse te meet waardeur logistieke prestasie verbeter kan word en in die proses die SA wynbedryf as n geheel te bevorder. Hierdie raamwerk stel die kelders in staat om kwantitatiewe data te vergelyk teen ander kelders of in die toekoms teen ander lande te vergelyk wat in die selfde mark kompeteer. Die raamwerk is ontwikkel deur gebruik te maak van n ontluikende multifasige ondersoekende benadering. Navorsing toon die verduidelikende benadering as twee afsonderlike interaktiewe fases, kwalitatiewe data-insameling as die eerste benadering en dan kwantitatiewe as die tweede. Die ondersoekende benadering is in gelyklopende dele oor n gegewe tydperk uitgeofen sodat n multi-gefaseerde benadering saamgestel moet word. Verskeie semi-struktuur en ongestruktureerde onderhoude is geskeduleer met kelders, expediteurs en die departement van landbou, bosbou en visserye. Daarby is finale jaar projekte uitgevoer, opnames was uitgestuur en werkswinkels was geskeduleer wat alles bygedra het tot die kwantitatiewe en kwalitatiewe data vir hierdie tesis. Vir hierdie tesis, het kelders 29,2 % verteenwoordig van die SA stortmaat uitvoer segment en die verteenwoordigende expediteurs is verantwoordelik vir ongeveer 77,5 % van die stortmaat uitvoer van SA. Die steekproef is voldoende in grootte tot die kennis van die verteenwoordigde segment. iv
6 Daar is gevind dat kelders onvoldoende voorsieningsketting segmentering het. Hul stelsels is nie ingestel om data in segmente aan te teken nie en het dit dus moeilik gemaak om die kwantitatiewe data wat vereis was in te samel. Ten spyte van hierdie komplikasie, was n ideale raamwerk hoofsaaklik ontwikkel deur gebruik te maak van kwalitatiewe data. Die ideale raamwerk sluit metrieke in wat kelders, wat n fokus op stortmaat uitvoer het, van mekaar sal onderskei. Ten slotte, kelders moet eerstens hul stelsels instel om data op te neem in die form van die geselekteerde segmente vir hierdie studie. Dit sal kelders in staat stel om metrieke te bereken in n gesegmenteerde wyse en in die proses verskillende voorsieningskettings met mekaar kan vergelyk. Tweedens moet kelders vasstel watter attribuut meeste aandag of verbetering nodig het of wat hoofsaaklik in lyn is met hul strategie. Hierdie attribuut se metrieke moet eerste gemplementeer word en sal n platform skep waarme ander attribute geimplementerr kan word sonder dat onnodige foute weer gemaak word. Laastens, na al die attribute korrek gemplementeer is sal kelder hulle prosesse kan begin maatstaaf. Dit stel kelders in staat om prosesse met mekaar te vergelyk, gapings te identifiseer in hul prosesse, logistieke bedrywighede te verbeter en wat dan as gevolg die bedryf as geheel sal bevorder. v
7 Contents Abstract Opsomming Nomenclature ii iv xiv 1 Introduction History of SA wine industry SA wine industry Overview of SA s wine industry Segmentation Bulk exports Conclusion Rationale of the research Problem statement Scope and objectives Scope Objectives Conclusion Theory and literature analysis Supply chain management overview Short history of SCM Supply chain management Supply chain visibility Total quality management vi
8 CONTENTS Continuous improvement Categories of benchmarking Conclusion Implement benchmarking as a strategy Hypothesis benchmarking process Eight stage benchmarking implementation Data quality assurance Blue and red ocean strategy Conclusion Performance measuring frameworks review Relevant performance measurement requirements Balanced score card Overview of SCOR Review of relevant research Conclusion Chapter conclusion Methodology Methodology overview Background and scope of project Thesis methodology Results and discussions Findings for preliminary investigation (Stage 1) Reliability Responsiveness Agility Cost Assets management efficiency Summary Findings for developing framework (Stage 2) Reliability Responsiveness Asset management efficiency vii
9 CONTENTS 4.3 Conclusions Developing ideal framework Reliability Responsiveness Agility Cost Asset Management Efficiency Conclusion Conclusion Thesis summary Suggestions and recommendations for the industry Future directions References 134 A Formal institution and organisations in the SA wine industry 135 B Average prices of wine sold in bulk 137 C The Gartner Supply Chain Top 25 for D Agenda for semi-structured interview 141 D.1 Description E Designed measurements in Excel for Stage F Survey developed for Stage G The South African wine industry insight survey viii
10 List of Figures 1.1 Wine production areas of South Africa SAWIS (2014b) List of the districts SAWIS (2014b) Top ten countries producing 80% of global wine production OIV (2014) The four segments selected for SA wine supply chain Wine production split between the segments Total bulk wine export volume and value (Price per litre): High-level representation of SA export supply chain SCM representation (Cheng, 2014) Time-line showing the evolution of quality concepts (Reid & Sanders, 2013) Plan-Do-Study-Act cycle (Reid & Sanders, 2013) Eight stage benchmarking implementation SCOR hierarchy consisting of 4 levels SCOR implementation roadmap (SCC, 2013) Supply chain strategy matrix Illustration of data (Francis, 2009) Research team and scope Segment representation in SA wine industry Export bulk wine supply chain (Adapted form Garcia et al. (2011)) Methodology road map Preliminary findings for Stage Reliability measurements The requested time stamps ix
11 LIST OF FIGURES 4.4 Reliability findings for Stage Orders shipped late and arrived late at POD Flowchart of entities and lead times in supply chain (van Lill (2015); Watson (2015)) Three cycle times (CT) measurements Responsiveness findings for Stage Montreal Montreal route options Bulk IDOS results for Stage Contracted bulk IDOS results for Stage 2 (percentage are indication of contracted bulk) Spot bulk IDOS results for Stage 2 (percentage are indication of contracted bulk) Cellars responsibility regarding reliability Variation in wine produced per year (SAWIS, 2014a) Variation in bulk wine exported per year (SAWIS, 2014a) x 2 matrix to illustrate a cellar s exposure to the market x 2 matrix to illustrate a cellar s exposure to the market x 2 matrix to illustrate a cellar s exposure to the market x 2 matrix to illustrate a cellar s exposure to the market Summary of 2 x 2 matrix that illustrate a cellar s exposure to the market Illustration of contracted bulk export volume flows Illustration of segment IDOS calculation x
12 List of Tables 1.1 Number of wine cellars that crush grapes (WOSA, 2014) Total SA bulk exports to top 9 bulk importing countries (SAWIS, 2014a) Bulk export growth per year from (SAWIS, 2014a) Ranking of shared content information The 5 levels of supply chain maturity (McCormack et al., 2003) Data quality objectives (CDM, 2015) Red ocean vs. blue ocean strategy (Chan & Mauborgne, 2004) Summary of performance measuring frameworks Representative cellar of SA wine industry Representatives handling SA s wine industry exports (van Zyl, 2015) Summary of cellars segmentation focus Metrics with description SCC (2013) Unreliable order information Data required from freight forwarders for each order Summary of data quality Pre-loading check-list (Australia, 2015) Loading check-list (Australia, 2015) Summary of reliability measures Summary of responsiveness measures Summary of assets management efficiency measures Ideal framework summary Proposed data capturing for ideal framework xi
13 LIST OF TABLES 5.8 Summary of definition for each metric xii
14 Nomenclature Superscripts ATA ATD BSC Busco COLS DAFF Devco DPO DSO ETA ETD FOB GDP IDOS KWV MSC Actual Time of Arrival Actual Time of Departure Balanced Score Card Wine Industry Business Support Company Corrected Ordinary Least Squares Department of Agriculture, Forestry and Fisheries Wine Industry Development Company Days Payable Outstanding Days Sales Outstanding Estimated Time of Arrival Estimated Time of Departure Free on Board Gross Domestic Profit Inventory Days of Supply Kooperative Wijnbouwers Vereniging van Zuid Afrika Mediterranean Shipping Company xiii
15 Nomenclature OLS PDSA POD QA QC SA SAWB SAWIS SCC SCM SCOR SCPM SFA SU TQM WIP WOSA Ordinary Least Squares Plan-Do-Study-Act Port of Destination Quality Assurance Quality Control South Africa South African Wine & Brandy SA Wine Industry Information & Systems Supply Chain Council Supply Chain Management Supply Chain Operations Reference Supply Chain Performance Measurements Stochastic Frontier Analysis Stellenbosch University Total quality management Work In Progress Wines of South Africa xiv
16 Chapter 1 Introduction Contents 1.1 History of SA wine industry SA wine industry Overview of SA s wine industry Segmentation Bulk exports Conclusion Rationale of the research Problem statement Scope and objectives Scope Objectives Conclusion SA s wine has a rich history dating back to The SA wine industry has experienced substantial growth since its origin and provided growth for the economy. For example, it contributed R36.1 billion to the gross domestic product (GDP) in 2013 (SAWIS, 2015). SA s wine industry still manages its supply chain with low supply chain maturity, therefore, SA s wine supply chain remains underdeveloped and lacking in the knowledge to advance it. This issue presented an opportunity to conduct further research in this industry regarding the SA wine supply chain. In this section, a brief viticultural history of SA s wine industry and its development is presented. In order 1
17 1.1 History of SA wine industry to comprehend the problem statement defined in this thesis, literature was reviewed regarding the current state of the SA wine industry, the segmentation split of the industry, as well as the segmentation focus of this thesis, namely bulk exports. This section will also provide the rational of the research and the problem statement on which the study centres. Finally, the objective and scope for the thesis is detailed here. Notably, for the purpose of this thesis, when referring to natural wine or wine, it only includes white, red and Blanc de noir/rosé wines. Distilling wine, sparkling wines, dessert wines and fortified wines are excluded from the term natural wine. (WOSA, 2014) 1.1 History of SA wine industry SA s first wine was made on 2 February 1659 and was recorded in Jan van Riebeeck s diary (Goode, 2013). Thereafter, vineyards gradually increased and wine was exported to Europe and sold to ships passing through the Cape. This became a great business opportunity and farmers invested more time and money into wine making. Due to hungry birds that needed to feed, farmers were forced to pick grapes earlier than deemed ripe. This resulted in the wine being highly acidic and was therefore poor in taste. Jan van Riebeeck and his accomplices, the Free Burghers who were servants of the Dutch East India Company (also known as Vereenigde Oostindische Compagnie), had little viticultural knowledge. Later, governor Simon van der Stel demonstrated that palatable wine could be produced (van Wyk, 1989). After Simon van der Stel introduced palatable wine, numerous farmers begun planting vineyards to enter into this market, resulting in competition. This ultimately lead to enriching the knowledge of the wine production process and as such, better quality wine was produced. By then (e.g.,1825) wine exports accounted for half of SA s exports, although it did not continue with the same trend. Some problems arose that prevented the wine industry from maintaining the growth it had been experiencing. These problems included over planting of vineyards and plagues, namely the phylloxero, which made wine production a challenge. (Goode, 2013) In 1918 the co-operative company, Kooperative Wijnbouwers Vereniging van Zuid Afrika, more commonly known as KWV, was registered (KWV, 2013). The main thrust 2
18 1.1 History of SA wine industry behind KWV s formation was to avoid continuous problems such as overproduction and price collapses. KWV purchased the grapes from the grape growers, at a fixed price per ton, and produced and marketed the wine. KWV also focused on infiltrating the local and international markets. One of the main goals of grape growers was to maximise grape production, regardless of quality, and in essence, make more money (Goode, 2013). This business model was appealing to the grape growers and KWV grew steadily in power. However, this also led to problems, since some grape growers cultivated a higher quality of grapes and did not receive the added benefits. Thereafter, price segments for different qualities of grapes were established. KWV regulated SA s wine industry for 19 years ( ) and subsequently converted into a private company in 1997, which was the settlement of the free trade agreement. KWV operated as a private company, but in light of the settlement, agreed to fund an industry trust that would support transformation and provide services to the industry (Ponte & Ewert, 2007). The free trade agreement in 1997 allowed cellars to register as private companies and market and produce their own selection of wines. This period was especially difficult for privately owned cellars since they had little experience with regards to wine making and marketing. A further challenge arose in that KWV was now a competitor and no longer the regulator of the wine market. This created an opportunity for organisations to take responsibility for different sectors and areas of the spirit industry, and to represent them. The SA Wine Industry Trust (SAWIT), established in 1999, was divided into two non-profit organisations, namely Wine Industry Business Support Company (Busco) and Wine Industry Development Company (Devco); (Ponte & Ewert, 2007). The funds sponsored by KWV were transferred into these two organisations to support both of their objectives. Busco s objective was to support the industry representatives, namely SA Wine Industry Information & Systems (SAWIS), Wines of South Africa (WOSA) and Winetech. In short, SAWIS is a statistical research group, WOSA focuses on generic promotions and Winetech is a human support and technology transfer research institution (van der Merwe, 2009). The objective of Devco was to support new entrants into the industry and help with marketing, farm worker agreements, and to offer access to extension services. See Appendix A for additional formal institutions 3
19 1.2 SA wine industry and organisations in the SA wine industry. Over the years, wine making process evolved, leading to more efficient wine making practices whilst enriching the industry s knowledge. This enabled the wine makers to produce larger quantities of better quality wine, using the same volume of grapes, at lower costs. Procedures were further improved in 1994 when more advanced technology was introduced, using automated machines that radically increased the output and quality of wine (Biophile Magazine, 2011). Since then the wine industry has grown steadily and become more specialised. The total wine production grew with 67.2 % from 2003 to 2013 WOSA (2014). This growth trend forced cellars to outsource activities that occupied unnecessary time spent on non-value added procedures. For example, the wine industry now uses distributors to deliver their wine, allowing wine producers to focus on wine production and marketing, rather than keeping track of logistics. To summarise, SA s wine industry has a rich historical background, but remains classified as a new world wine country. The wine industry still encounters some challenges faced in the past and has yet to develop solutions to manage them. KWV diminished the surplus of wine in SA and sold it as table wine. It was a business model that was not sustainable, and had to change. Although SA s wine industry structure changed three times, the industry proved to be stable and well managed by the executive office of the wine industry council. Shortly after the KWV registered as a private company, cellars started producing wine at their own facilities and could produce wine they deemed adequate for the different markets. These markets included local, export, high-,medium-, and low-class income groups, among others. Over the years, cellars developed different strategies for the different markets, best suited for their needs. To this end, cellars devoted their attention to producing wine to fit their needs, but neglected the rest of the partners in the supply chain. 1.2 SA wine industry The SA wine industry is complex, yet its supply chain activities are underdeveloped. In order to understand this better, this section provides a short overview of SA s wine industry, which includes statistical information to explain SA s challenges and position 4
20 1.2 SA wine industry with reference to international competitors. This section further provides a review of SA s wine industry and segments in the wine industry with a focus on bulk exports Overview of SA s wine industry Currently, more than 3, 300 farmers grow and maintain 99, 463 hectares of land under vines according to WOSA (2015). In 2014, the annual harvest amounted to 1, 519, 708 tons, 81% of which was used to produce natural wine. The other 19% included distilling wine, rebate wine, juice and grape concentrate. SA s wine industry currently hosts 564 wine cellars which are divided into three categories, namely producer cellars, private cellars and producing wholesalers (See Table 1.1) with producing wholesalers contributing the largest volume of wine (SAWIS, 2014a). The wine cellars are scattered over SA, but viticulture is mainly situated at the North-Western and South-Western regions, where the Mediterranean climate is suitable for growing grapes (See Figure 1.1). The Western Cape contributes both the largest volume and variety of wine in SA, with a slightly cooler climate than what the latitude suggests (Ponte & Ewert, 2007). The list of districts are better detailed in Figure 1.2. Table 1.1: Number of wine cellars that crush grapes (WOSA, 2014) Wine cellar type Number of cellars Producer cellars 50 Private cellars 493 Producing wholesalers 21 Total 564 5
21 1.2 SA wine industry Figure 1.1: Wine production areas of South Africa SAWIS (2014b) Figure 1.2: List of the districts SAWIS (2014b) SA is the ninth largest wine exporter in the world and contributes 3.9 % of the world s wine production (SAWIS, 2014a). According to OIV (2014), the global wine production for 2014 excluding must and juice, decreased with 6% compared to Furthermore, it should be noted that in 2013, the global wine production reached the second largest volume it has seen in 14 years. Therefore, 2014 is considered to be a 6
22 1.2 SA wine industry normal year in terms of global wine production. Also, 2013 global wine production was similar to 2006, but using hectares less vineyard area (OIV, 2014), indicating that wine cellars are operating far more effectively and efficiently, with better methods and technology having been introduced. France and Italy are generally regarded as the world s largest wine producers, with France producing the most in 2013 (SAWIS, 2013). See Figure 1.3 for the top ten countries producing 80% of the global wine production. SA exports its wine to Germany, United Kingdom, Russia, France and Denmark, among many others. These countries also have the option to import wine from neighbouring countries in the northern hemisphere. A great benefit for these countries is a shorter lead time and as such, SA is at a geographical disadvantage. Countries with the same challenges as SA include Argentina, Australia and Chile, which collectively produce 13.2 % of the world s wine (IWC (2014); Transo (2013)). SA has definite disadvantages against the northern hemisphere countries, but faces major competition against the Southern countries. Specifically, SA has a continuous challenge to compete on price and lead time against the Southern exporting countries. According to SAWIS (2013), other challenges facing SA s export wine market experience include: ˆ From 1994 SA s exported almost half of its wine to the UK, Sweden and Germany, but thereafter it stagnated. Therefore, SA has to gain new export markets. ˆ SA has not succeeded in broadening the exporting markets, including the African countries. ˆ There are hundreds of exporting brands in SA, which means there is insufficient marketing spending and economies of scale to market these brands. ˆ When emerging into new markets, information regarding the macro economy, marketing, markets, and competitors are deemed as prerequisite requirements. 7
 Moving towards consolidation of consumption At Exporting this time wine the is year, therefore not is not a simple yet")
23 PRESS RELEASE 1.2 SA wine industry 2014 wine production in the 10 main producing countries Figure 1.3: Top ten countries producing 80% of global wine production OIV (2014) Moving towards consolidation of consumption At Exporting this time wine the is year, therefore not is not a simple yet comprehensive task and requires information visibility on the level further of down consumption of different markets, yet the data available points to a consolidation of global the consumption, supply chain at around to manage 243 mhl. those factors that the cellar has little control over. In this context, SA s government is responsible for providing more support in order for Under these circumstances, 2014 production should guarantee that consumption and the wine demand exports for wines to increase, for industrial which uses will (brandy, ultimately vinegar and enhance vermouth) economic are covered. growth and allocate resources more efficiently. In addition, and according to PwC (2014), the major concern for the next 12 to 36 months, pertains to the increase in price for water and electricity. Other price increases, namely chemicals, cleaning, filtration, bottling and packaging are also a major concern for the future. Furthermore, according to SAWIS (2013), the total unsold stock of wine in SA, shows an increase of 28.5% (37.9 million litres) in red wine, and 2.9% (10.4 million litres) in white wine from 2009 to National and international competitors are becoming fiercer and as such, adequately managing the wine industry is becoming a greater a necessity than before Segmentation The SA wine industry has different processes, products and markets, making it a challenge to integrate all the activities into one supply chain. Depending on the process 8
24 1.2 SA wine industry followed or the market focus, each product has its own price segment and may be sold in packaged or bulk format (see Appendix B for bulk wine s most current price segments). It is clear that there are multiple factors to take into consideration when analysing the product range of a cellar. Therefore, a single supply chain cannot be used to manage all products and flows in this cellar. Products have to be treated differently in that they follow different streams after an order has been assigned. Consider the following two case studies to recognise the need for more than one supply chain. Case 1: Cellar A sells wine in packaged format which is sold locally and is exported. The variety of wine sold has a price range from table wine to premium wine. This cellar invested in equipment and has its own bottling and labelling machinery. Furthermore, the cellar exports its wine only to Germany and sells the rest locally. Case 2: Cellar B sells wine in bulk and packaged format which is only exported. This cellar only sells table wine in both packaged and bulk format. Cellar B does not have bottling or labelling equipment and outsources both processes. Furthermore, the cellar sells the majority of wine to the top 5 importing countries and has mature relationships with the majority. Currently, SA s wine industry functions as if there is only one supply chain. Looking at both the above cases, it is clear that SA s wine industry has more than one supply chain. In the event where an order is placed for cellar A and B to export wine in packaged format, each will follow different process, although both export packaged wine. Cellar A would bottle and label at the cellar and would therefore have a fast response time after the initial order was placed. Cellar B, however, first needs to inform the bottling and labelling company to get the order ready. Since cellar B must fit into the schedule of the bottling and labelling company, they would likely work on a make-tostock principal to save time. This way they are able to compete against Cellar A with responsiveness. Moreover, Cellar A has continuous control over the quality of bottling and labelling, whereas Cellar B must rely on the guarantee of the outsourcing company. 9
25 1.2 SA wine industry There is also the possibility of not selling the pre-packed wine which could lead to high inventory cost. Therefore, the two cellars with different strategies cannot function in the same supply chain. To illustrate the point further, consider the event where cellar A receives an order to sell table wine locally and cellar B gets an order to export table wine in bulk. The wine production process are similar, but are vastly different after an order is placed. Since almost no process overlaps when selling packaged locally and exporting bulk, one can conclude that there is more than one supply chain in the wine industry. Van Eeden, Louw, Goedhals-Gerber & van Dyk (2012) conducted a study to increase the wine industry s supply chain knowledge and identified six supply chains, namely Local Bulk, Local Basic, Local Premium, Export Bulk, Export Basic, and Export Premium. The selection of supply chains proved to be a challenge, in that the segmentation of price would complicate the study further. For the purpose of this study, SA s wine supply chain was divided into four basic segments, namely Bulk Export, Bulk Local, Packaged Export and Packaged Local (See Figure 1.4). Wine Customer EXPORT LOCAL BULK BULK-EXPORT BULK-LOCAL PACKAGED PACKGED-EXPORT PACKGED-LOCAL Figure 1.4: The four segments selected for SA wine supply chain Bulk exports The four supply chains illustrated in Figure 1.4 were selected on the basis that they include various operations and information flows regarding all activities required to produce and supply wine. Each supply chain follows similar activities prior to transporting the wine, after which they become unique and face distinctive difficulties. This section describes the flow of products and information, as well as challenges within the bulk export supply chain. 10
26 1.2 SA wine industry In 2014, SA produced a total of 956,6 million litres of wine, of which 57.4% was exported (WOSA, 2014). Of the total wine produced, 37.3% was exported in bulk, making bulk export the largest segment in the wine industry (see Figure 1.5). The remaining wine was exported in packaged format or sold locally as packaged or bulk (WOSA, 2014). Figure 1.5 exhibits the split of SA s wine production regarding the segments mentioned above (VinPro, 2014). Undertaking both bulk and packaged wine is a costly exercise, especially for producing cellars, since they do not have the capital to hold packaging material and dry goods for long periods of time (Bezuidenhout, 2014). Packaged wine thus has a much longer turnaround time than bulk wine. However, bulk wine is sold in large volumes, which would provide a beneficial cash flow structure; in other words a higher cash-to-cash ratio than that of packaged wine. Therefore the bulk export market is, in most cases, the more popular market to venture into and would accordingly be the largest market. Bulk export 37.3% Packaged export 20.1% Bulk & packaged local 45.6% Figure 1.5: Wine production split between the segments Pool systems originated with the establishment of the KWV where all the grapes were priced the same irrespective of quality. This was later changed to accommodate different quality pools. After the KWV registered as a privately owned company, the industry continued with the pool system. A pool system exists when cellars pay grape growers for the grapes delivered at the cellar. The grapes delivered are categorised in quality groups and pooled accordingly. The grape growers are then compensated according to the quantity and quality of their grapes. This system provides security for the grape growers and cellars are able to build relationships with the grape growers and 1 11
27 1.2 SA wine industry work together towards the same goal, essentially advancing their supply chain maturity level. A problem with the pool system is that grape growers only get imbursed after the wine is sold and as such, many cellars would enter into the bulk market. Furthermore, from 2009 the total natural wine exports dropped with an average of 5% for three years and in 2012 exports increased with 16.7% from the previous year and a further 26.5% from 2012 (SAWIS, 2014a);(see Figure 1.6). SA exports the majority of its bulk wine to the northern hemisphere (See Table 1.2). Table 1.3 displays the growth of the top nine countries regarding SA s bulk exporting market. It is noteworthy that from 2008 to 2014, SA experienced growth with most countries, although 2014 is considered a poor year compared to In 2012, Italy and Spain experienced drought and were not able to produce the quantities of wine they usually experience (Hall, 2012). New world countries such as SA, Australia, Argentina and Chile took advantage of this opportunity and exported bulk wine to all major importing countries. In 2013, the drought experienced in 2012 resulted in a dramatic increase in the volume of wine exported from SA. The 2013 exports provided an exceptional year; considered to be an outlier, while 2014 is considered to be a normal year. Millions (litres) ( 10 8 ) Rand Total bulk export volume Price per litre Figure 1.6: Total bulk wine export volume and value (Price per litre): (SAWIS, 2014a) 12
28 1.2 SA wine industry Table 1.2: Total SA bulk exports to top 9 bulk importing countries (SAWIS, 2014a) Country Germany UK Russia France U.S.A Canada Denmark Sweden Switzerland Total (l) Table 1.3: Bulk export growth per year from (SAWIS, 2014a) Country Germany 7% -6% 6% 16% 22% -19% UK 23% -19% 54% 11% 69% -4% Russia -65% 190% -62% 6% 417% -28% France 5% -5% -13% 25% 309% -29% U.S.A. -36% 56% -55% 3% 473% -93% Canada -48% 93% -11% 26% 116% -28% Denmark 26% -21% 50% 78% 20% -9% Sweden 400% -80% 526% 68% 12% -45% Switzerland -28% 39% -44% 278% 0% -48% Total (l) -3% 3% 4% 25% 78% -25% Conclusion This section provided the reader with background of the SA wine industry, specifically, the history of wine making and the evolution of the SA wine industry structure. In addition, the section presented the current state of the SA wine industry with reference to statistical data. This section further included an outline of segmentation within the 13
29 1.3 Rationale of the research wine supply chain and background regarding a particular segment, namely bulk export. 1.3 Rationale of the research A preliminary study was conducted in 2012 to identify the gaps, opportunities and information available in SA s wine industry. The research indicated that SA s wine industry lacks necessary knowledge of the supply chain and as a result, has been underperforming (Van Eeden et al., 2012). Currently, there are no performance indicators for cellars to measure themselves with (PwC, 2014). Therefore, enriching the knowledge of supply chain principles may help the wine industry to improve the current supply chain performance, resulting in well-established long-term relations with both customers and industry players. An opportunity was presented to Stellenbosch University to establish a performance measuring framework in order to benchmark the current state of SA s wine supply chain. Firstly, performance indicators should be identified that will have an effect on the performance of the supply chain. Secondly, the data should be gathered for the selected performance indicator and thirdly, the data should be presented to the cellars in order for them to interpret it and improve their supply chain performance. This will enable other industry players in the supply chain to view their performance relative to the sample or industry average, and to improve their processes whilst contributing to the industry s performance as a whole. SA s wine is sold on the global market and competes against countries such as France, USA, China, Australia and Chile, among others, for market share SAWIS (2013). To improve current global trading, change has to occur. Changing the current structure, logistics, or the way organisations are managed, remains challenging. Many organisations are resisting change because the current management meets their basic requirements. The purpose of this study is to develop a performance measuring framework for the SA wine supply chain, focusing on the bulk export segment. The framework should be developed to enable cellars to benchmark quantitative supply chain information. This will permit them to compare supply chain processes to the sample or industry average, which will ultimately construct a platform for the SA wine industry to improve as a 14
30 1.4 Problem statement whole.the performance measuring framework can be used to benchmark the SA s wine industry performance indicators. Cellars can use the benchmark results to evaluate where specific performance attributes of their supply chain are, relative to the sample or industry average. After evaluating their position, action can be taken to improve the gaps in their supply chains. This will ultimately benefit all wine producers and advance the industry as a whole. 1.4 Problem statement A preliminary study was conducted in 2012 indicating that SA s wine industry lacks the relevant knowledge of the supply chain concepts, and as a result, the industry generally under-performs. The purpose of this study is to develop the first performance measuring framework for the SA supply chain by using quantitative and quantitative supply chain information, focusing on one segment in the wine industry, namely bulk export. This will provide a platform from which to advance the SA wine industry. Questions that have to be addressed in this thesis are listed below: ˆ What processes are conducted to export wine in bulk format? ˆ What level of data is available that can be used to develop and validate a framework? ˆ Which performance indicators would distinguish cellars from one-another and provide distinctive benchmarking results? 1.5 Scope and objectives The following two sections will provide the scope and objectives that comprise this thesis. The scope is briefly discussed to provide an overview of the field that is under study. More detail regarding the scope of this study is provided in Chapter Scope This thesis addressed the first two years of the three-year project. For the purpose of this study, the SA wine industry is divided into four segments. These segments are listed below: 15
31 1.5 Scope and objectives ˆ Bulk Export ˆ Packaged Export ˆ Bulk Local ˆ Packaged Local The project research team consists of three masters students, each developing a performance measuring framework for a selected segment. This thesis was conducted on the SA bulk wine supply chain, specifically, the section in the supply chain after the wine has been produced, to the delivery at port of discharge (POD);(See blue highlighted entities in Figure 1.7). The other two students focused on packaged export and packaged local segments. The bulk local segment was not accounted for, since the wine is included in any of the other segments. In other words, the bulk local wine will be sold to an individual who will then sell it again, but in any of the other segments. 29.2% ± 77.5% Grape growers Cellars Freight forwarders SA Port POD Client Customer Figure 1.7: High-level representation of SA export supply chain The focus of this thesis was on the bulk export segment that consisted of 16 cellars representing 29.2% of the bulk export segment (see Figure 1.7). SA s wine industry is large and comprises nearly 600 cellars. To include all cellars in the sample was beyond the scope of this study, since this would have resulted in an overload of information, which could not be evaluated. As such, the 29.2% representation was deemed sufficient for the bulk export segment. The participating cellars represented a variety of producer cellars, wholesalers and private cellars that were beneficial since it involved all three cellar types that are present in the industry. The three cellar types include producer cellars, private cellars and wholesalers. Four freight forwarders were approached in the second year of the study that mange roughly 77.5% of the SA wine exports (see Figure 1.7). Semi-structured and unstructured interviews were conducted to collect quantitative and qualitative data. In addition, PwC, an auditing firm, was approached to comprehend the financial side of the 16
32 1.6 Conclusion cellars. An entity that was not approached in the supply chain was the Cape Town port, seeing that wine is a small part of the ports exports comparing it to deciduous fruit, steel, and chemicals among many others Objectives Quantitative and qualitative information was gathered from semi-structured and unstructured interviews, visits to wine farms, appointments with freight forwarders and an auditing firm, a survey and multiple research projects. This enabled the student to develop a performance measuring framework for the bulk export segment. Advantages from other established frameworks were also used as guidance in developing the framework. The performance measuring framework developed in this thesis can be used to benchmark processes in the bulk wine supply chain. Wine producers can compare their supply chain s quantitative information against industry standards and identify gaps within their supply chain. Key objectives for the study in the bulk export segment included the following: ˆ To understand SA s wine industry supply chain and its processes regarding bulk export. ˆ To assess the maturity and determine the level of information available in the supply chain. ˆ To identify performance indicators of the wine supply chain that can be used as a benchmark metric that will help improve SA s wine industry as a whole. ˆ To create a framework to measure performance indicators using a established framework and analyse it after data is collected. ˆ To identify gaps in the framework and develop an ideal framework. 1.6 Conclusion SA s wine industry in under-performing and under pressure. The research team believes that enriching the knowledge of SCM can improve the ability to make better business decisions, which could improve logistical performance and ease the pressure 17
33 1.6 Conclusion on wine producers. Quantitative and qualitative information was gathered primarily through semi-structured and unstructured interviews, a survey and multiple research projects. The information obtained was used to develop a performance measurement framework for the bulk export segment in order to benchmark SA s wine cellars supply chain processes. The thesis aims to provide the wine industry with a way to improve business decisions, logistical performance, and customer satisfaction within the wine supply chain to achieve world class standards. This will benefit the industry in competing in the global market. 18
34 Chapter 2 Theory and literature analysis Contents 2.1 Supply chain management overview Short history of SCM Supply chain management Supply chain visibility Total quality management Conclusion Implement benchmarking as a strategy Hypothesis benchmarking process Eight stage benchmarking implementation Data quality assurance Blue and red ocean strategy Conclusion Performance measuring frameworks review Relevant performance measurement requirements Balanced score card Overview of SCOR Review of relevant research Conclusion Chapter conclusion
35 2.1 Supply chain management overview The purpose of this chapter is to provide the reader with the necessary literature that has been reviewed. This chapter commences with the important aspects of SCM and total quality management (TQM) as well as the benefits it holds. The chapter further discusses different categories of benchmarking and a method to implement a benchmarking study, followed by reviews on different performance measuring frameworks with a focus on the SCOR framework. Finally, this chapter includes the benefits of having a mature supply chain and the effects of implementing a performance measuring framework. This chapter aims to provide the reader with a clear conceptual knowledge of SCM, benchmarking and the importance of performance measuring frameworks. 2.1 Supply chain management overview This section will present an overview of SCM and TQM. Both knowledge of SCM and TQM are becoming increasingly important for industries as they experience growth. With regards to the wine industry, it is growing and more wine is being produced every year. As such, more international markets are entered by cellars and as a result, the logistical activities are becoming complex. It is important to manage these activities efficiently and effectively. A further look at TQM approaches, namely the plan-do-act cycle and benchmarking will also be discussed Short history of SCM In 1908, Henry Ford installed the first assembly line of an entire auto-mobile. In 1913, the demand for cars required Henry not only to manage the assembly line, but to observe the entire supply chain as a whole (Glueck, Koudal & Vaessen, 2006). Managing a supply chain was a new and innovative way of managing an organisation. In spite of courses explaining SCM already existing in the United States education system in 1919, it was only considered to be a strategic function from the 1950s. The transformation period started after the 1950s, when companies recognised SCM as a separate organizational function (Habib, 2011). Only in the 1980s, did SCM form part of manager s 20
36 2.1 Supply chain management overview strategic decision making process. SCM became a popular trend, and various business magazines published multiple articles on SCM and relevant topics. The SCM wave continued through the 1990s and became more complex as personal computers and internet became established in the world of technology. Globalisation of products and services stared becoming a new strategy for industries and changed the way supply chains were managed. Thereafter, companies such as Dell, Procter & Gamble, Toyota, Walmart ect. recognised SCM as a primary process to manage a company in all its aspects (SCC, 2013). In 1996, a non-profit organisation, namely the Supply Chain Council (SCC), was formed. Their primary goal was to provide tools to help organizations make dramatic, rapid, and sustainable improvements in supply chain performance (SCC, 2013). Supply Chain Operations Reference (SCOR) is one of the current tools developed by the SCC and is used in industries to improve logistical performance Supply chain management Supply chain is a general term used in service and manufacturing industries, the primary purpose of which is to satisfy customer needs while generating profits for the organisation (Chopra & Meindl, 2001). In this section, a conceptual understanding of supply chain is provided as well as the importance of managing it. Supply chains comprise of all activities, beginning from raw material to the end consumer. These activities include sourcing, manufacturing, documentation and transportation among many others. All activities form part of functions within the supply chain and operate as cross-functional operations where information, funds and physical products flow. Each function interacts with other functions and operates differently. Importantly, all functions operate as one to satisfy customers needs. One way to measure supply chains are by calculating their value generated, which is a financial measurement to compare most supply chains with one another. According to Chopra & Meindl (2001), the objective of a supply chain is to maximise the overall value generated. The value of a supply chain is the difference between inputs and outputs. In 21

37 2.1 Supply chain management overview other words, it is the difference between the effort that went into producing the final product and what the customer values the final product for. Another method to compare supply chains with one-another is to calculate the supply chain s profitability, which includes all profits shared across the supply chain functions. The objective of a supply chain is to maximise the value generated and operations that contribute to the value of a supply chain, such as funds, information, and physical products should carefully be managed. In addition, a supply chain consists of functions where decisions are made daily in order to optimise the integration between information, funds and the flow of products. As a result of the latter, the term supply chain management was established and is now recognised as a strategic function in most organisation (Habib, 2011). Michigan State University (2014) defines SCM as follows: SCM is an integrated approach to planning, implementing and controlling the flow of information, materials and services from raw material and component suppliers through the manufacturing of the finished product for ultimate distribution to the end customer (See Figure 2.1). Figure 2.1: SCM representation (Cheng, 2014) Consumers constantly require more advanced products, services, customer care and faster delivery at a lower cost. Companies are challenged to meet these needs and to operate as a profitable organisation. However, consumers needs are not the only challenges companies face, as global competition and market uncertainty are other challenges to take into consideration. One way to manage these challenges is to manage 22
38 2.1 Supply chain management overview the variety of supply chains within an organisation. According to Roberts (2014), SCM provides many advantages, namely reduced cost, increased efficiency, increased output and profits. Other advantages, namely shorter lead times, forecasting and improved planning are also possible. Therefore, SCM is becoming a key factor to help organisations overcome the variety of challenges mentioned above. To ensure well-coordinated supply chain, all parties within the supply chain should work towards the same goal. However, numerous dilemmas can prevent the supply chain from flowing efficiently; causing mayhem up and down the supply chain. One such dilemma is known as the bullwhip effect. The bullwhip effect occurs when demand fluctuates and amplifies up the supply chain from customer to supplier. According to Nienhaus, Ziegenbein & Duijts (2011), the bullwhip effect affects three aspects of the supply chain, namely dimensioning of capacities, variation in inventory level and high level of safety stock. These effects have a great impact on finances and information flowing through the supply chain and no party within the supply chain will benefit from it at any point. A well-coordinated supply chain will, however, prevent distortion and diminish the bullwhip effect. Also, it will balance supply and demand, allowing the supply chain parties to have a healthier risk-managing system. Companies such as IBM, Apple, Dell and many others are considered among the world s leading companies. A system that all these companies have in common is well-structured supply chain. The above mentioned companies are listed in the top 25 Gartner supply chain for 2015 (Rivera (2015); see Appendix C), of which 15 are listed in the Forbes 200 largest public companies (Forbes, 2015). These companies mastered supply chain management and realised that a supply chain is a bi-directional flow process, where products and information flow from raw material to consumer and vice versa (See Figure 2.1). To summarise, SCM is a key factor in all industries, which will not only benefit the organisation itself, but all parties involved the supply chain. As such, organisations should adopt this concept and continuously improve the flow of products, information and finances in order to create a sustainable supply chain Supply chain visibility One manner in which a supply chain can be effectively managed is with information flowing bi-directionally; from raw materials to the consumer. This enables the company 23
39 2.1 Supply chain management overview to use the information to create visibility in the supply chain. The visibility will provide clarity regarding the limits, performance and opportunities of the supply chain. In this context, supply chain visibility is key to the success of a supply chain. Moreover, the maturity of a supply chain is greatly affected by its visibility, and will be discussed in the following section. Collecting data within organisational systems is becoming more important, since the information can give an indication as to where problems lie and whether an organisation is experiencing growth. The information is not only beneficial for the organisation itself, but for other supply chain partners who collaborate with them. Therefore, supply chain visibility is important and provides a clear view regarding operations such as, in-transit visibility, production visibility, on-hand visibility and cost visibility. Visibility affects the entire performance (Carid, Moretto, Perego & Tumino, 2014) and strategic performance (Wei & Wang, 2010) of a supply chain and is therefore a key issue that should be addressed. Data visibility within the supply chain is relevant for all organisations and includes the sharing of real time data of critical information that is required to manage the flow of products/services, and information between customers and suppliers (Handfield & Nichols, 2002). According to Handfield & Nichols (2002), having supply chain visibility can include benefits such as reduced lead times, better decision making, improve constraint management, increased profits and lower costs, and numerous others, which will effectively decrease supply chain problems. Not only will these benefits diminish problems, they will also enable supply chain partners to prevent future problems form occurring. These anticipated problems can then be identified early, and appropriate action can be taken. Handfield & Nichols (2002) conducted a study asking numerous companies to rank which information should be shared in a supply chain. Companies were given a list of criteria which they had to rank on a scale from 1 to 5, with 5 being the most important. The average results of the feedback received are displayed in Table 2.1. Only the top 8 out of 34 criterions are displayed in this table. 24
40 2.1 Supply chain management overview Table 2.1: Ranking of shared content information Criteria Average Material releases 5 Material requirements 4.8 Inventory 4.7 Order status 4.3 Advanced shipping notice 4.3 Sales forecast 4.3 Quality specification 4.3 Rejection of order 4.3 Furthermore, visibility has a direct impact on the maturity of the supply chain. The maturity of a supply chain can be divided into five levels (See Table 2.2); (Mc- Cormack, Johnson & Walker, 2003). This supply chain maturity model was developed over a period of two decades by researches who concluded that it has a life cycle, depending on the extent to which the organisation defines its processes and their ability to manage, measure and control them. The purpose of this model is to asses at which stage an organisation s supply chain is situated. Level 1 of the maturity model is where an organisation s supply chain is unstructured and internally focussed. This results in high SCM costs and an unpredictable process performance (McCormack et al., 2003). Also, if targets are set, they are often missed as a result of low visibility up and down the supply chain. This may cause low customer satisfaction and the outcome presents frustration and burnout in an organisation. Level 2 is an organisation s supply chain with basic processes in place, which are defined and documented. The organisation remains internally focused where representative from sales, transport, and manufacturing meet regularly to coordinate with each other (McCormack et al., 2003). Theses representatives have a basic understanding of SCM aspects and work primarily in functional silos. The SCM costs remains high and process performance is more predictable, but the organisation still misses targets due to low visibility. Levels 1 and 2 are internally focused, since operational excellence and functional improvements remain the core focus of internal operations (Poirier & Walker, 2005). 25
41 2.1 Supply chain management overview Table 2.2: The 5 levels of supply chain maturity (McCormack et al., 2003) Levels Process maturity Short description Level 1 Ad Hoc Processes are unstructured and internally focussed. Level 2 Level 3 Level 4 Level 5 Defined Linked Integrated Extended Basic processes are defined and documented, and also internally focused. Basic collaboration between customers with structures with strategic intent is put in place. The company, its suppliers and vendors are working collaboratively. There is high visibility throughout the supply chain. A horizontal, customer focused, collaborative culture is firmly in place. Level 3 represents the breakthrough level (McCormack et al., 2003). At this level organisations have a SCM team and generally have a supply chain manager. The team puts structures into place above that of traditional functions. The organisation shares high-level information, as well as common goals and measures, which will stretch horizontally across the supply chain. At this level, SCM cost decreases, root cause analyses are conducted and performance processes become more predictable. More importantly, at this level, customers are included into decision making and process improvements. At Level 4, the traditional functions disappear, as SCM procedures take over. A joint venture is undertaken by supply chain partners in order to collaborate on planning and forecasting, which dramatically reduces the SCM cost whilst increasing customer satisfaction. Level 5 is where a horizontal, customer focused, collaborative culture is firmly established. All supply chain parters are integrated and all have high visibility of the supply chain. This level indicates complete network connectivity and prove to have high processing capabilities. A higher level of supply chain maturity may require costly infrastructure and not all organisations have the need to operate at level 5. Therefore, it is important to understand the industry with which the organisation is situated in order to determine the level of supply chain maturity that is required for that industry. Also, an organisation might operate at level 2 supply chain maturity, but in order to permeate new markets, the organisation has to shift to level 4, which will ease the process of invading unknown 26
42 2.1 Supply chain management overview territory. Therefore, organisations not only need to operate at the current level of maturity, but should identify the level of maturity other possible markets are operating with. To summarise, with greater supply chain visibility the organisations are able to have a lean supply chain, identify problems early on and eliminate them, improve customer satisfaction and increase profits. It also directly affects the maturity of the supply chain and organisations, therefore, have to determine the supply chain visibility required for their industry on order to optimise supply chain costs Total quality management Organisations strive for world class performance; adding maximum value to their services or goods with minimal input. One approach to controlling these inputs and outputs is total quality management (TQM). Reid & Sanders (2013) define TQM as an integrated effort designed to improve quality performance at every level of the organisation. In addition, Dahlgaard, Kristensen & Kanji (1998) developed a pyramid, which was adapted from Kanji & Asher (1996), with five principles forming the core of TQM. The five pillars are: 1. Leadership 2. Customer focus 3. Everyone s participation 4. Focus on facts 5. Continuous improvement These principles are fundamental pillars in the TQM pyramid, but continuous improvement will be the focus of this section. This section will also discuss implementing a benchmarking study, which is one of many continuous improvement methods Continuous improvement Many organisations strive to implement a quality focused culture within their company. The benefits of the latter are increasing competitiveness, enabling change, and increasing co-operation, among many others (Harvey, 2006). The concept of quality has been around for many years, yet its meaning and focus has changed from inspection, to customer driven quality. The transformation process from old and new quality 27
43 2.1 Supply chain management overview concepts are detailed in Figure 2.2. Date 1900s 1940s 1960s 1980s - To date Focus Description Inspection Statistical sampling Old Concept of Quality: Inspect for quality after production. Organisational quality focus Customer driven quality New Concept of Quality: Build quality into the process. Identify and correct causes of quality problems. Figure 2.2: Time-line showing the evolution of quality concepts (Reid & Sanders, 2013) Even though the meaning of quality and its focus has evolved, the cost of poor quality is always a burden and can lead to loss of business. Consequently, companies still have major issues in this regard and constantly apply different techniques to solve quality related problems. One philosophy, which has earned its credibility, is continuous improvement, also known in Japanese as kaizen (Reid & Sanders, 2013). Continuous improvement has many methods to help companies implement it. One such method, which will be discussed below, is benchmarking. A short description follows: Benchmarking: The procedure that entails comparing process measurements of operation, products, services and practises, is referred to as benchmarking. Benchmarking is an important tool for virtually any industry, and by implementing it, industries can achieve realistic goals and sustain them. According to Howard (1992), no business is too small to take part in benchmarking. In fact, smaller companies can integrate new processes and ideas more easily than larger companies that are constrained in their systems or government. Indeed, study conducted by Taylora & Wrightb (2006) found that the success of TQM was not associated with the size of the company. Their results further suggested that in order to attain the highest level of TQM success, companies should measure benchmarking and self-assessment practices, provided they establish an appropriate measuring framework before measuring these practices. In addition, benchmarking should be a replicable process and should, therefore, be managed as one. 28
44 2.1 Supply chain management overview A simple method to apply is the plan-do-study-act (PDSA) cycle, which was developed by Deming (Dahlgaard et al., 1998). PDSA cycle is a straightforward approach that is detailed in Figure 2.3. For each phase in the cycle, it is important to document the problems as well as the procedures that were followed to find the solutions. Future problems can be traced back to the documents with logged solutions in order to apply the same solution or improve it. Not only should the problems be documented, but data should also be gathered to compare processes before and after implementing the solutions to examine whether or not the process has improved. The procedure of each phase is described below: ˆ Plan: The cycle starts with identifying the problems and planning to solve each one. ˆ Do: The second phase consists of implementing the plan. It is preferable to conduct a pilot study. One reason for this is to examine whether or not the plan is economically viable and effective. ˆ Study: In the third phase the managers should gather and examine the data obtained in the previous two steps to determine whether or not the process has improved and if it is cost effective. Otherwise the plan should be re-evaluated. ˆ Act: The final phase consists of integrating the information of the previous three phases and taking action, whether the results are positive or negative. This phase is most effective when communicating with other employees as soon as changes occur. Plan Act Do Study Figure 2.3: Plan-Do-Study-Act cycle (Reid & Sanders, 2013) Organisations cannot expect to develop the ideal framework for benchmarking after the first, or only one attempt. It is a process that gains value over time. Therefore, the PDSA cycle is an ideal cycle to manage the benchmarking process. 29
45 2.1 Supply chain management overview Categories of benchmarking As stated in Section 2.1.4, benchmarking is a proven philosophy of continuous improvement to support organisations in achieving their goals and sustaining them. Although benchmarking alone will not guarantee that the companies achieve all of their goals, this process can assist an organisation insofar as to identify which actions should be taken to achieve best in class. Therefore, a strong correlation between the analysis of information obtained through benchmarking and the implementation of results should be apparent. Benchmarking is a systematic process which should be implemented on a continuous basis to obtain the best results. There are four categories of benchmarking, namely internal, external, functional and generic benchmarking (Karlöf & Östblom (1994); Zairi (1992)). Each benchmark serves different functions, depending on the outcome one wants to achieve. A description of each benchmarking category is provided below. Internal benchmarking: Organisations have certain structural processes in place that fit their strategy the best. Some of these processes differ vastly inside an organisation, but others are similar and relatively comparable. Comparing the similar processes within the organisation against one-another is known as internal benchmarking (Zairi, 1992). For example, an organisation consisting of several franchises can compare their processes with one-another and implement the best practices. This presents an opportunity to be innovative with new processes and as a result, the organisation can benefit as a whole. Benchmarking is a timely and continuous process, which allows organisations to become acquainted with the process of benchmarking and sharpen their focus on the operative content of their work (Karlöf & Östblom, 1994). One advantage of internal benchmarking is that the organisation retains full control over the data and do not have to collect the data from various sources to obtain accurate results. However, the organisation is restricted by its own boundaries, and can access only limited data. Whereas external and functional benchmarking on the other hand, have access to more data and as such are more likely to achieve world class performance. Many organisations start with internal benchmarking and use it as the groundwork before tacking on external benchmarking. This is done in order to get the most value out of external benchmarking. Importantly, internal benchmarking is not a substitute for external benchmarking, but rather a starting point for this method (Karlöf & Östblom, 1994). 30
46 2.1 Supply chain management overview External benchmarking: External benchmarking is the process of comparing the activities of one s own organisation to other leading competitors by measuring the actual processes. This benchmarking category does not limit the organisation to compare its activities within the same industry, but encourages its comparison with various other industries (Jacobs, Chase & Lummus, 2011). However, there are some risks involved in external benchmarking. One such risk is that organisations tend to focus more on competitive factors instead of identifying the value it can add to effective performance. It is not natural, as Karlöf & Östblom (1994) defines it, to dance with the enemy. Many organisations that undertake benchmarking are competing for market share and are unaccustomed to share important information regarding processes and financial data. This is problematic since companies will benefit most when organisations supply all relevant data. Individuals can then calculate the benchmarks and find world class performance indicators proficiently and accurately. Functional benchmarking & Generic benchmarking: Functional benchmarking is similar to external benchmarking, but its scope is restricted to comparing production operations or processes within the same industry. It focuses on products, services and specific processes, functions and product development. Finally, generic benchmarking is similar to functional benchmarking, but compares production operations or processes across non-relating industries. The methods discussed here is the area where an organisation can benefit most from using benchmarking, since its scope includes related and unrelated industries (Zairi, 1992). Also, the focus is narrowed down to only production operations and distinctive processes, which allow the organisation to focus on specific problems Conclusion To summarise, benchmarking is not always the optimal solution, but it can clarify which questions should be asked to improve the logistical processes at hand. Also, internal benchmarking is not a substitute for external, generic or functional benchmarking, but is merely a starting point. External and internal benchmarking holds potential for sustainable growth, though functional and generic benchmarking hold the most potential for growth. The benchmarking category selected for this study was functional benchmarking. The industry lacks supply chain knowledge and is not equipped with meaningful research to contribute to external and generic benchmarking. Also, the 31
47 2.2 Implement benchmarking as a strategy industry is not embodied with franchises, suggesting that internal benchmarking was not an option for this study. In addition, since benchmarking is a process that should be replicable, the PDSA cycle method can be used to regulate the benchmarking process. 2.2 Implement benchmarking as a strategy The content of this section consists mainly of the implementation process of benchmarking. It commences with a description of a hypothesis benchmarking process, as developed by Karlöf & Östblom (1994), and continuous with the implementation process. The implementation process is an integration of methods used by Watson (1992) and Karlöf & Östblom (1994) Hypothesis benchmarking process Before benchmarking, an organisation can first implement a hypothetical approach in order to see if this process can add value for the time invested. This will provide the organisation with a good indication of the result that a benchmarking study can obtain. By conducting a hypothesis benchmarking test, organisations can ascertain whether or not the benchmarking study would be worth their effort. The hypothesis approach consists of five steps (Karlöf & Östblom, 1994). These steps are detailed below: 1. Surveying the structure of the business This step is conducted to understand the environment that the hypothesis benchmarking process should operate in. The environment is a macro overview that includes financial strength, growth and dynamics, competition, efficiency and the organisational structure of the company. 2. Identifying difficulties and constraints It is important to identify difficulties and constraints at an early stage in order to avoid problems later on. 3. Identifying critical questions Questions should be asked to indicate precisely what the study is intended to answer. 4. Setting up hypothetical solutions The hypothetical solutions are answers to the critical questions, indicating which solutions are plausible with the questions raised. 32
48 2.2 Implement benchmarking as a strategy 5. Testing the truth of the hypothesis At this point, the solutions obtained in the previous step are evaluated. A logic tree is proposed to determine the steps towards each solution. If a hypothesis proves false, one should refer back to the logic tree and identify a different path to obtain a true hypothesis. The hypothesis approach provides a quick solution to problems and broadens one s knowledge of the organisation. The drawbacks are that this approach cannot solve complex problems and the solutions obtained are merely an indication of what may occur. Despite the disadvantages, this approach is beneficial for all organisations and is generally shown to have an overall positive outcome (Karlöf & Östblom, 1994). If the hypothesis approach proves to be beneficial for the organisation, the organisation can fully implement a benchmarking study Eight stage benchmarking implementation The implementation of benchmarking is an eight stage process, adapted from Watson (1992) and Karlöf & Östblom (1994), and if carried out correctly, can minimise error and provide relevant data. This procedure requires preliminary activities to be completed before implementing benchmarking. According to Watson (1992), implementing a benchmarking study is similar to conducting a research project. The benchmarking method is divided into two sections, each consisting of four stages. The first section s stages include understanding the business model, deciding on activities to be benchmarked, breaking activities down, developing business model (See Figure 2.4). After Section 1 has been completed, Section 2 commences with the following stages, namely finding benchmarking partners, gathering information, analysis and implementation (See Figure 2.4). Therefore, Section 1 consists of the preliminary processes and Section 2 is the actual implementation of benchmarking. 33
49 2.2 Implement benchmarking as a strategy Section 1 Stage 1 Stage 2 Stage 3 Stage 4 Understand business model Decide on activities to be benchmarked Break activities down Develop enterprise business model Section 2 Stage 5 Stage 6 Stage 7 Stage 8 Finding benchmarking partners Gather information Analyse Implement Figure 2.4: Eight stage benchmarking implementation Stage 1 of Section 1 is a comprehensive study necessary in order to understand the business or industry of the organisation, as well as to establish whether an external or internal benchmarking study should be conducted. This stage is the starting point that allows the individual who is implementing the benchmarking study to understand the operations behind the business and to identify the mission and vision of the business. In Stage 2, key business processes and problem areas should be identified to establish which activities should be benchmarked. Clearly, more than one activity should be identified, since some activities are trade-offs of one-another. For instance, an organisation may perform best in lead times to deliver products to customers, which would indicate that the products are make-to-stock. As a result, the trade-off is higher storage cost for the organisation. Identifying these activities can be achieved through ABC analysis, among other methods, in order to distinguish whether or not the organisation should undertake an internal, external, functional or generic benchmarking study. Moreover, it is important to take customers and suppliers into account when identifying key business processes and problem areas in a supply chain. At Stage 3, the organisation should break the key business processes and problem areas down into detailed segment in order to discover how the processes work and how they can be measured. This provides the organisation with sufficient information to search for other business processes and problem areas similar to theirs. One disadvantage with breaking down these processes, is that it is expensive and time-consuming. In 34
50 2.2 Implement benchmarking as a strategy spite of this, it tends to generate the most accurate solutions. Upon completion of these stages, the organisation will have the information needed to develop a business enterprise model (Stage 4 ) appropriate for their organisation (Watson, 1992). This model should illustrate the integration between internal services, key business processes and market segments. In addition, the business environment should be described through material, information, resources and control flows. Once the organisation has developed their enterprise business model and has identified the benchmarking activities, they should search for benchmarking partners. Stage 5 of Section 2 consists of finding benchmarking partners. Ideal benchmarking partners are the leaders in the industry who are willing to disclose information regarding their financial records and processes. Moreover, a trade-off between the leaders in the industry and those who are willing to disclose information should be determined in order to find ideal benchmarking partners. An ideal benchmarking parter would supply sufficient data and cooperate to benefit all parties participating in the benchmarking study. Stage 6 involves collecting data with reference to the activities that were selected during Stage 2 of Section 1. In Stage 7, the data is analysed in order to view the positions of all organisations. The average of the various organisations represents the sample s benchmark. Importantly, it would be best if the sample of participants represents a sufficient portion of the market in order to achieve an accurate benchmark average. Once each organisation has been benchmarked, they will be able to identify where they are positioned relative to the sample average. The organisation is now able to identify the activities in which they are lacking (Stage 8 ). The organisation can then review the best practises in order to improve their activities and be more competitive. (Karlöf & Östblom, 1994) In conclusion, benchmarking is a process of continuous improvement and should be replicable by using the PDSA cycle. Section 1 is a preliminary study and should only be conducted if the organisation s business model has not changed, whereas Section 2 is continuous and should be repeated to obtain better results. This would allow the organisation to systematically improve key aspects of their processes to become a world class performer Data quality assurance Data quality is a significant part of data collection and should, therefore, be part of the process from the beginning. This course of action is more commonly known as data 35
51 2.2 Implement benchmarking as a strategy quality assurance (QA). Data QA is a system that is designed to ensure that the data meets the quality control s (QC) objectives. Usually data QA is conducted before data QC to implement the data capturing effectively. The data QA should conform to the following data quality objectives to guide the implementation of QC (see Table 2.3). Table 2.3: Data quality objectives (CDM, 2015) Objectives Description Relevance: Completeness: Consistency Credibility: Currentness: Accuracy: Objectivity: Conservativeness: Security: Transparency: Traceability: Is the data relevant and applicable to achieve objectives. This includes procedures to handle, avoid and identify missing data. Will the data be reproducible if asked again or asked from others. Is the reference to their sources and information/data provided. Apply the most recent data available to reflect the current practices. Also, this relates the frequency the data is updated. The steps should be designed to minimise uncertainties and errors when collecting data. Avoid prejudiced, partial and biased information. Any division in the objectives should be addressed and a conservative approach should be adapted for incomplete, incorrect, missing, old or invalid data. Enforce a procedure to restrict access to the database. Acknowledge processes and appropriate data to provide clarity. The data should be traceable and documented such that a third party will be able to continue with the data collection. All data quality objectives are important to meet, but some will receive more focus for this thesis since these are lacking in the SA wine industry. These objectives include completeness, consistency, accuracy, security, transparency and traceability. This will provide a stable platform for further research with particular reference to the development of a framework for SA s wine industry. 36
52 2.2 Implement benchmarking as a strategy Blue and red ocean strategy Benchmarking is an effective method to use and allows organisations to reach world class performance. According to Parast & Adams (2012), organisations should implement industry best practices to compete and challenge competitors. Therefore, the organisations should carefully monitor changes within their environment, as well as evaluate new technologies and best practices in their and other industries. Technologies and development of new information systems contribute to the world of information and organisations have more tools at their disposal to monitor changes in the industry. Matthew & Julian (2010) state that benchmarking creates a competitive environment for all organisations within an industry. Consequentially, organisations are starting to reach the ceiling. In other words, the major competitors in a market are implementing all relevant best practices and optimising each one. In this context, the blue and red ocean philosophy is relevant, and is as described below. Chan & Mauborgne (2004) conducted a study to ascertain the distinction between those companies that became successful, where others have failed. Chan and Mauborgne identified two strategies, namely the blue and red ocean strategies. The blue ocean strategy involves organisations who are innovative and creates demand, rather than competing for it. The red ocean strategy represents all known markets where competition for market share is fierce, such as the fast moving consumer goods market, including many of the wine industry products. The differences between these two strategies are outlined in Table 2.4. Moreover, Chan and Matalobos found that those who created blue oceans, usually create them within their core business. In other words, they created blue oceans from red oceans by observing and studying the market to find where new demand can be created. 37
53 2.3 Performance measuring frameworks review Table 2.4: Red ocean vs. blue ocean strategy (Chan & Mauborgne, 2004) Red ocean strategy Blue ocean strategy - Compete in existing market space. - Create uncontested market space - Beat the competition. - Make the competition irrelevant. - Exploit existing market. - Create and capture new demand. - Make the value/cost trade-off - Break value/cost trade-off - Align the whole system of a company s - Align the whole system of a company s activities with its strategic choice of activities in pursuit of differentiation differentiation or low cost. and low cost. In essence, organisations need extensive knowledge of their industry to be able to create blue oceans. Thus, benchmarking an industry will not only enrich organisations knowledge, but will allow them to move from red to blue oceans Conclusion To summarise, benchmarking was discussed as an eight stage implementation process. Prior to the implementation process, a hypothesis benchmarking study can be conducted in order to determine whether or not the study will benefit the organisation to the extent that the study is economically viable. Furthermore, the red and blue ocean strategies were discussed in order to understand that benchmarking is not an optimal answer to solve problems. Organisations have to remain innovative in order to lead an industry and to target new markets. Benchmarking is a tool that can be used to create visibility within an industry and that will challenge organisations to improve those areas where they lack most. By implementing such strategies, all parties in the industry will be able to compare their performances and improve where necessary, thereby advancing the industry as a whole. 2.3 Performance measuring frameworks review Firstly, this section provides the reader with the knowledge to develop a well-designed framework. Secondly, a few frameworks are discussed to provide a background that is beneficial for this study. The section concludes with a discussion as to why some frameworks are not suitable for this study and suggests the most appropriate one. 38
54 2.3 Performance measuring frameworks review Relevant performance measurement requirements In this section, different studies regarding performance measurement, are evaluated. Only the requirements that will improve the design for a performance measuring framework for this paper are discussed. Though the requirements discussed are mostly good quality frameworks, problem areas are also reviewed since they are downfalls that should not be repeated. When analysing or benchmarking a supply chain s performance, quantitative analyses are preferred over qualitative analyses. Quantitative information is easy to process and concrete results can be obtained. Beamon (1999) supports this claim and states that qualitative information is vague and difficult to utilise in any way. Shao & Wang (2010) argue that a combined method is far more accurate, since qualitative information leads to quantitative results. Therefore, in order for companies to excel in their industry, it is necessary to identify supply chain performance measures using both quantitative and qualitative information. Furthermore, supply chains are complex systems as discussed in Section As such, it is difficult to identify exact measurements for a particular supply chain. In order to identify suitable measurements, quantitative and qualitative information should be gathered to fully understand the supply chain. Since each supply chain consist of its own distinctive processes, different performances can be measured within each supply chain. The supply chain s performances are affected by a diverse set of external variables such as, supply chain management and planning decisions, as well as supply chain design decisions (Pero, Rossi, Noé & Sianesi, 2010). According to Estampe, Lamouri, Paris & Brahim-Djelloul (2010), the performance of a supply chain can be measured in terms of both customers level of satisfaction and the cost incurred. Also, Camerinelli (2009) reviewed a survey that asked a large number of European companies to list the three most common metrics they use to measure the performance of their supply chains. These included delivery performance and customer service level, cost reduction, and efficiency. However, since customer satisfaction is the main priority, it should be the focus of measurement. In other words, the functions which are measured should add value to the customer s perspective, not only to the company itself. Gunasekaran, Patel & McGaughey (2004) developed a framework for supply chain performance measurements (SCPM), but argue that it is only a starting point for an assessment of the need for SCPM. Gunasekaran et al. (2004) also states that their 39
55 2.3 Performance measuring frameworks review framework is compiled from a small sample and if an organisation desires to develop a framework they should reflect on their own needs and prioritise the measurements to fit their strategy. However, Gunasekaran et al. (2004) framework provides some benefits for this paper in terms of developing a framework for the wine industry. Gunasekaran et al. (2004) divided an organisation s supply chain activities into four areas, namely plan, source, make and deliver where each activity has a strategic, tactical and operational level. The strategic level includes high level decision-making where long-, medium- and short-term goals are decided. The tactical level includes calculated decisions to ensure the strategic level goals are met. And lastly, the operational level involves day-to-day decisions made by front-line or low-level managers. By dividing the supply chain activities into different levels, it designates the responsibilities for each measurement. This will in turn, highlight the information streams within the organisation and where it is lacking. For example, sourcing at the tactical level, may affect making at operational level, thus leaving a gap in information streams since these two managers don not have a day-to-day communication stream. Furthermore, Neely (2002) identified certain requirements the performance measurement should adhere to. These requirements are: ˆ There should be few measures, since too many will exceed cognitive limits to analyse data and information will be lost. Also, to attain more diverse data, the number of measures should be evenly spilt between financial and non-financial measures. ˆ The non-financial processes should reflect on the financial sheets afterwards, such that non-financial measures are seen as leading indicators, while financial measures are seen as lagging indicators. ˆ The measuring system should be stable and should create an awareness regarding long-term goals. Neely (2002), however, states that these requirements can only be achieved in a world with perfect measurements. Since this is the case, this study viewed these requirements as rough guidelines rather that absolute standards when considering a measurement. On the basis of Neely (2002) argument, Akyuz & Erkan (2010) conducted a literature review on SCPM for the new supply chain era regarding the problem areas, requirements, and basic research methodologies followed. Although Akyuz & Erkan 40
56 2.3 Performance measuring frameworks review (2010) an suggested that further research is required in the area of developing performance measurements, they found that SCPM is still a positive addition to most organisations. Some problem areas and requirements highlighted in the study, are used in this paper to avoid similar mistakes executed in the past. Problem areas identified in the study that should be avoided are: ˆ Failing to align the organisation s strategy with the measurements. ˆ Measuring a large number of metrics. These problem areas should be avoided since the focus of performance measurements is to measure processes or operations within the organisation and allow it to compare performance with itself and similar organisations. When the strategy is not aligned with the measurements, it steers the organisation s focus in the wrong direction, making them invest time and money in processes and people, all the while adding no value to their organisation. As such, an important step towards developing a suitable performance measurement is to understand the organisation s business model and to afterwards, establish short- and long-term strategies for the organisation. Not only should the right metrics be selected, but the correct quantity as well. Selecting too many metrics may lead to an overload of information that creates turmoil. This may shift the manager s focus to deal with irrelevant problems with the after-effect leading to investing resources in the wrong areas. Furthermore, Akyuz & Erkan (2010) also argue that new era performance measurement metrics should include a list of requirements. Some requirements are recommended for this paper: ˆ Base the performance measurements on the industry s strategies and objectives. ˆ Balance non-financial and financial measures according to the industry s strategies. ˆ Be comparable to other performance measures used by similar industries (Akyuz & Erkan, 2010). ˆ Define and standardise data collection and calculation methods. ˆ Use performance measurement results for strategic, tactical and operational decision making. 41
57 2.3 Performance measuring frameworks review ˆ Prioritise metrics. It is noteworthy that the requirements stipulated by Gunasekaran et al. (2004), Neely (2002) and Akyuz & Erkan (2010) are similar in some areas. Since each have valuable requirements for developing a framework, these requirements should be seen as a primary focus when determining the measurements. One aspect the above mentioned authors did not consider, is the relationship between the measurements. In light of this, Beamon (1999) proposed a framework for performance measurements. Beamon divided the performance measurements into three types, namely resource measures, flexibility measures and output measures. Resource measures consist of inventory levels, equipment utilisation and energy usage, among others. Flexibility measures accommodate the volume fluctuations in a supply chain and output measures consist of customer responsiveness, quality and quantity of products. Each is a vital contribution to the performance measurement, since one performance measurement affects the others. For example, when measuring a single measure of the supply chain s performance, namely cost, it would change the company s focus to reduce cost and optimise that aspect of the company. Although cost is considered to be a high priority when measuring performance, the other measures may experience a downturn. While companies may reduce cost, it could result in poor customer response time, poor performance or lack of flexibility (Beamon, 1999). Therefore, measuring a single performance measure ignores the interactions between characteristics in a supply chain and is therefore generally inadequate (Beamon, 1999). To conclude, developing a performance measuring framework is different for each industry, but there are some requirements that should be taken into consideration across all performance measuring frameworks. These requirements were highlighted in this section as well as the problem areas to be avoided. Briefly, the major requirements to take into consideration are aligning the measurements with the business strategy, measuring financial and non-financial measurements, and performance measurements that should be indirectly proportional to one-another Balanced score card In 1992, the balanced score card (BSC) was developed by Dr. Robert Kaplan (Harvard Business School) and David Norton as a performance measurement framework that combined financial and non-financial metrics to give managers a balanced view of organisational performance (Balanced scorecard institute, 2015). Kaplan & Norton (1992) 42
58 2.3 Performance measuring frameworks review viewed the use of financial measurements alone as inadequate, since it gives misleading signals that interferes with innovation and continuous improvement. The financial measurement will indicate the after-effect of innovation and continuous improvement, but will not initiate them. In order to fully analyse organisational performance, it is necessary to measure both financial and non-financial metrics. Consequently, Kaplan & Norton (1992) developed the BSC. The BSC views the organisation from four perspectives, namely the Learning and Growth Perspective, Business Process Perspective, Customer Perspective and Financial Perspective. These perspectives minimise the information overload, giving managers four areas to focus on, form which to measure their performance. It delivers results in a single report allowing managers to see whether one area has improved at the expense of another (Kaplan & Norton, 1992). The following section will provide a short description of each perspective. Learning and growth perspective Innovation and continuous improvement plays a large role in an organisation s success. This enables them to remain competitive or even lead innovation. In order for this to take place, employees should be exposed to new techniques and technologies. Kaplan & Norton (1992) state that a company s ability to innovate, improve and learn ties directly to the company s value (Kaplan & Norton, 1992). Therefore, this perspective includes the learning and training of all individuals working for an organisation. Customer perspective Customers are an essential part of any organisation, especially in a competitive environment where it is easy for a customer to change suppliers when they are not satisfied. Therefore, customers are one of the key metrics that should be measured. Kaplan & Norton (1992) identified four categories by which customers can be measured, namely quality, cost, service and performance (Kaplan & Norton, 1992). Categorising and measuring the customers in this way would allow the organisation to view their performance from the customer s perspective. Business process perspective This perspective provides companies with internal business processes enabling them to satisfy customer needs and maintain a profitable organisation. Measurements should be aligned with an organisational strategy to provide sufficient information leading to better decision-making. Kaplan & Norton (1992) state that these measurements are unique to the organisation s mission and should therefore not be developed by outside 43
59 2.3 Performance measuring frameworks review consultants, but by the managers themselves. Financial perspective: Financial measurements typically include net profit, shareholder profit, asset turnover, and return on capital, among many others. These measurements should not be neglected, since they show concrete results which make it easy for managers to make financial decisions. Also, it shows logical results for the other measurements enabling managers to see whether their decision was favourable for the organisation. To summarise, the balanced score card is a well-researched method and has earned its credibility in the industry. Therefore, some aspects that were mentioned in this section will be used as guidelines to develop a framework for the SA bulk wine. These aspects are generally used to view the organisation as a balanced entity where financial and non-financial metrics are trade-offs of one another. Finally, it is imperative to incorporate the customer s perspective in most decisions, seeing that they are an essential part of any organisation Overview of SCOR Organisations in general, have many supply chains to identify and prioritise. Without knowing which supply chains are essential, management might invest time and money in the wrong areas within their organisation. SCOR is a framework used to identify, measure, evaluate, and describe supply chain configurations within the organisation and also helps to prioritise them. SCOR consists of a hierarchy of four levels, where the first three levels are applicable across all industries and level four is industry specific (See Figure 2.5); (SCC, 2013). Level 1 provides a high level overview of the organisation and consists of six processes, namely Plan, Source, Make, Deliver, Return and Enable. These processes define the content and scope of the SCOR model and differentiate businesses from one another. A combination of these processes will indicate the efficiency of several processes within the company (Garcia, Marchetta, Camargo, Morel & Forradellas, 2011). Each of Level 1 s processes are sub-divided into more detailed processes with reference to the business strategy. These detailed processes are labelled as Level 2 and consists of 24 processes. Organisations use at least one or more of these processes, since an organisation that uses supply chains require, for example, a planning section, and a Level 2 process would thus be mandatory for the organisation. Level 3 is more detailed than 44
.")
. In phase 0, the sponsors are identified.")
60 2.3 Performance measuring frameworks review Figure 2.5: SCOR hierarchy consisting of 4 levels the previous two levels, as it measures an organisation s everyday operations. This level defines an organisation s ability to successfully compete within its market and identifies gaps within their strategy (SCC, 2013). Lastly, Level 4 is industry specific and is not therefore not within the scope of the SCOR framework. In addition to the SCOR framework, the SCC provides a roadmap to implementing the framework, which consists of 6 phases (See Figure 2.6). In phase 0, the sponsors are identified. These sponsors are individuals who are committed and help to construct the project. The next phase, phase 1, the supply chains are identified and re-evaluated to determine only the essential supply chains. Some organisations may have multiple supply chains that they can incorporate into one. According to Gilmore (2011), an organisation only needs 4-5 supply chains, otherwise the analysis will become overcomplicated. Supply chains are prioritised according to a rank given by organisations. This indicates which supply chains are of higher priority relative to other supply chains identified in phase 1. In addition, each supply chain consists of five performance at- 45
61 2.3 Performance measuring frameworks review Phase Name Deliverable Resolve 0 Organise Organizational Support Who is the sponsor? 1 Discover Supply Chain Definition Supply Chain Priorities Project Charter What will the program cover? 2 Analyse Scorecard Benchmark Competitive Requirements What are the strategic requirements of your supply chain? 3 Material Geo Map Tread Diagram Disconnect Analysis Initial Analysis - where are the problems 4 Work Transaction Level 3, Level 4 Processes Best Practice Analysis Final Analysis - where are the solutions? 5 Implement Oppertunity Analysis Project Definition Deployment Organisation How to deploy? Figure 2.6: SCOR implementation roadmap (SCC, 2013) tributes, namely flexibility, reliability, responsiveness, cost and assets, which would be categorised in phase 2 (SCC, 2013). These attributes affect the major operations of an organisation and will provide feedback as to how well the performance attributes are performing in each supply chain. The performance attributes and supply chains are displayed in a strategy matrix (See Figure 2.7). To avoid confusion, it should be noted that Figure 2.7 uses the supply chain information collected from a sample of cellars. The performance attributes are categorised according to three different classifications, namely superior (S), advantage (A) and parity (P); (See Figure 2.7). These classifications allow the organisation to identify which performance attributes are of higher importance in each supply chain. A superior classification is this instance, implies that the organisation requires a specific performance attribute to be in the 90th percentile. In a hypothetical scenario, for example, information is gathered by 100 organisations from which industry standards 46
62 2.3 Performance measuring frameworks review Supply Chain Strategy Matrix Export Bulk Export Packaged Local Bulk Local Packaged Reliability A A P P External Responsiveness Flexibility S P S P A A A A Internal Cost Assets A P A P S P S P Figure 2.7: Supply chain strategy matrix are determined. If an organisation s goal is to be superior in a certain performance attribute, it suggested that this performance attribute should be in the top 10 out of the 100. The other categories, namely advantage and parity are 70 and 50 percentiles respectively; meaning that advantage should be in the top 30 and parity in the top 50. A category is assigned to each attribute to highlight the organisation s strategies. Out of the five attributes, one should preferably be superior, two advantage and two parity, since it would not be possible for a company to be superior in all aspects of the organisation (See Figure 2.7). For example, if the organisation selects reliability as the performance attribute to be superior, it would affect cost or assets in a negative way. Therefore, some performance attributes effects are trade-off s to one another and should be taken into consideration when categorising their attributes. In phase 2, a benchmark study can be implemented to reveal gaps in the organisation s logistical processes. As discussed in Section 2.1.4, metrics that have the greatest effect on logistical performance should be selected for a benchmarking study. These will be used to compare processes against the other benchmarking partners. Gaps between your organisation and other benchmarking partners can be identified for the selected metrics. Formulated results for a benchmarking study of a hypothetical organisation is shown in Figure 2.8 in the column You. The industry standards are shown in the next three columns, namely Parity, Adv and Superior. The difference between the organisation s metrics and industry standards are displayed in the Gap column. This method helps management to narrow their focus down to specific problem areas 47
63 2.3 Performance measuring frameworks review within the organisation. Organisations are now able to invest money in the appropriate areas and identify best practises to achieve world class standards and compete globally. Attribute SAP Metric (level 1) You Parity Adv Superior Gap Reliability S Perfect Order Fulfillment 97% 92% 95% 98% 1% Response A Order Fulfilment Cycle Time 14 days 8 days 6 days 4 days 8 days Flexibility P Ups. Supply Chain Flexibility 62 days 80 days 60 days 40 days 0 days Cost P Supply Chain Mgmt Cost 12.2% 10.8% 10.4% 10.2% 1.4% Assets P Cash-to-Cash Cycle Time 35 days 45 days 33 days 20 days 2 days Figure 2.8: Illustration of data (Francis, 2009) In phase 3, the supply chains that were prioritised in phase 1, are now analysed and initial problems are identified. The matrix in Figure 2.8 can identify those areas in which problems surface, since it is difficult for individuals to identify specific problems at a high level measurement. It is important to search for the problems that cause the organisation to perform poorly as compared with the rest of the industry. These include problems that prevent the company from being the best in class, or to perform as expected according to the industry. Problems can also be categorised from important to less important, delivering the highest reward with least input. The next phase, Phase 4, is the final analysis. In this phase, solutions for the problems identified in phase 3 are proposed. The solution will reduce recurring problems and improve the organisation s logistical activities. Importantly, the solutions should be sustainable; else the organisation will fall behind to the rest of the industry in years to come. The first two phases are mostly theoretical and provide sufficient information to push for operational implementation. Phases 3 and 4 are highly analytical and lastly, in Phase 5, the team can prepare for an implementation plan. It is important that the whole team understands the implementation plan, how it should be executed, and how to sustain these new developments Review of relevant research This section reviews a study conducted by Garcia et al. (2011) in the wine industry of Argentina. Garcia developed a framework to measure the performance of the wine 48
64 2.3 Performance measuring frameworks review industry s supply chain. This method is similar to the SCOR framework in some areas and will be highlighted in this section. In addition, statistical techniques used to benchmark the performance of a supply chain are reviewed. Over the past 15 years, a number of studies have been conducted to establish a benchmark for specific industries. These have included chemical (Keren, Harry, Mannan & Mannan, 2004), service (Simpson & Kondouli, 2000), tourism and hospitality (Perdue, 2004), as well as the manufacturing industries (Gordon & Shohal, 2001). However, little research has been done to benchmark the wine industry. One such study, which tackles the importance of performance measurements in the wine industry, was conducted by Garcia et al. (2011). Garcia et al. (2011) developed a framework to measure logistical performance in the wine industry. The research was conducted on six wineries in Mendoza, situated in West Argentina. The authors identified four performance attributes, namely quality, timeliness, logistics cost, and productivity and capacity; quite are similar to the five performance attributes of SCOR. SCOR s reliability is similar to quality identified by Garcia et al. (2011), as is responsiveness to timeliness, cost to logistical cost, and assets to productivity and capacity. The attributes of Garcia et al. (2011) function in a manner that is similar to SCOR s, where the performance attributes are further detailed in lower levels. The lower levels focus on specific areas where quantitative information are gathered to establish a benchmark for these indicators, however, SCOR s indicators are applicable across all industries whereas Garcia et al. (2011) model is focused specifically on the wine industry. Furthermore, Garcia et al. (2011) stated that the research is not a complete benchmarking study of the wine industry of Argentina, and that further research is required. Expanding on Garcia et al. (2011) method, Dollet & Matalobos (2010) proposed a multi-level network orchestration of premium and super-premium wines, that encompasses a broader view of the entire supply chain. Multi-level network orchestration is a design that optimises all global networks and collaborations of the same product. In addition to Garcia et al. (2011) model, Dollet & Matalobos (2010) demonstrated that all entities within the supply chain should fall under one strategy, and this will probably be the most powerful member of the network. Garcia et al. (2011) method was not based on statistical techniques, however, a number of other techniques should also be considered. These performance benchmarking techniques include the Ordinary Least Squares (OLS) technique, Corrected Ordinary 49
65 2.3 Performance measuring frameworks review Least Squares (COLS) models, and Stochastic Frontier Analysis (SFA); (IBNET, 2005). These methods are statistical techniques that require sufficient data to formulate accurate conclusions. OLS can benchmark an individual organisation s performance against their average production or cost functions. This is done by comparing the actual output to predicted output which will provide a measure of relative performance. COLS models also compare the organisations average production and cost functions, but use the best performing company instead of expected performance, to compare results. SFA focuses on two frontiers, namely production and cost. In each frontier all inputs and outputs are calculated and the input with maximum possible outputs is regarded as optimal. For SFA techniques, sufficient data is required to achieve desirable solutions (IBNET, 2005). With the above mentioned statistical benchmarking techniques in mind, it should also be considered how to effectively provide benchmarking measurements to industry players, who can then improve their logistical processes in order to advance the industry as a whole. Hodge (2011) mentions a few important principles needed for an effective performance measuring framework. The primary principle refers to measuring the system according to the strategy of the organisation. Other key principles include measuring all processes comprised of financial and non-financial data, the measurement should be evaluated over a period of time, and lastly, measurements should be communicated and documented. The above mentioned statistical methods is considered to be important when developing a performance measuring framework for the SA wine industry Conclusion In conclusion, two established performance frameworks have been discussed, namely BSC and SCOR. Both of these are similar on many aspects, since they divide metrics in financial and non-financial measurements. SCOR is better suited than BSC for this study, since it already incorporates supply chain activities between suppliers and provides measurements for them. Furthermore, Garcia et al. (2011) developed a performance measuring framework for the wine industry of Argentina and divided the segments according to the price and quality. This seems to be suitable framework to use, since it has already been applied to the wine industry. However, the division of segments within this thesis are different to that of Garcia et al. (2011) model, as SA s quality and price of wine are not comparable to one-another. In other words, there is no honest standard by which to categorise the wine in SA according to the price and quality. Therefore, segmenting the SA s wine industry according to price and quality will be problematic, since a standard first has to be developed, which is beyond the 50
66 2.4 Chapter conclusion scope of this project. After discussing BSC, SCOR and Garcia et al. (2011) framework, SCOR remains best suited for this thesis (See Table 2.5). Table 2.5 shows the criteria that was derived from Section to select the best suited framework for this study. Although SCOR is the primary framework that will be used, the other frameworks have other benefits that, when used in conjunction with SCOR s existing framework, will enhance it. Table 2.5: Summary of performance measuring frameworks Performance framework criteria BSC Garcia SCOR Does the performance framework include financial and non-financial measurements Can the performance framework incorporate the cellars strategy Does the performance framework have established measurements to choose from Can the performance framework show tradeoff s between measurements Does the performance framework provide best practise for measurements Is the performance framework fit for SA s current supply chain processes YES NO YES YES PARTIALLY YES NO NO YES YES PARTIALLY YES NO NO YES YES NO YES 2.4 Chapter conclusion This chapter provided an overview of SCM, which included basic SCM concepts, supply chain visibility and TQM. As discussed, all three concepts are becoming increasingly important as the wine industry of SA experiences growth. SA s wine industry still operates with little supply chain visibility and is affected negatively by it. Therefore, it would be beneficial for the industry to explore these concepts further. In addition, an eight stage implementation process was discussed, which will be used as a guideline when developing a performance measuring framework for SA s wine industry. This eight stage process was adapted from Watson (1992) and Karlöf & Östblom (1994), and will fulfil the objectives of a benchmarking methodology. Relevant performance measurement concepts and other frameworks were discussed, but the focus was directed to the SCOR framework, since the SA wine supply chain framework will be primarily 51
67 2.4 Chapter conclusion based on SCOR. 52
68 Chapter 3 Methodology Contents 3.1 Methodology overview Background and scope of project Thesis methodology Methodology overview The purpose of the following sections are to provide the methodology that was applied, as well as the scope of the thesis. Firstly, the research team is introduced and a highlevel overview of the methodology is provided. This also includes the scope of the thesis. This section further provides the methodology, which is discussed in detail, and concludes with methods of interpretation regarding the quantitative and qualitative data Background and scope of project The research team consisted of three Industrial Engineering masters students. The project was supervised by three individuals, namely a project leader from the department of Industrial Engineering (Stellenbosch University), a supervisor from the department of Logistics (SU) and lastly, a respective from the Council for Scientific and Industrial Research (CSIR) to provide specialised input for the project. 53
69 3.1 Methodology overview The overall project is a longitudinal study that spans over a three-year period (see Figure 3.1). This thesis addresses the outcome of the first two years of the project which is divided into three stages (see Section 3.1.2). The first stage comprised of two work-streams, which were conducted in parallel. Work-stream A took place during year 1 of the project, whereas work-stream B spanned over the first two years. Work-stream A was supervised by the departments of Industrial Engineering and Logistics, where six honours students from Logistics and five final-year Industrial Engineering students conducted case studies for 16 cellars. Four students conducted a case study at more than one cellar, which was beneficial since they had access to a larger representation of the market. These case studies were conducted with the primary intention of gathering information from the representative cellars and to broaden the research team s knowledge of the wine industry. Work-stream B consisted of the three masters students focusing on developing a supply chain measuring framework for three priority segments of the wine industry. These three segments are: ˆ Bulk export ˆ Packaged export ˆ Packaged local Since Bulk Local is either exported in bulk or packaged, or sold locally in packaged format, it is included in either one of the three priority segments. 54
70 3.1 Methodology overview Year 1 Year 2 Year 3 Research team 6 Logistical department students 5 Industrial engineering students 3 Master students 4 Supervisors 4 Logistical department students 5 Industrial engineering students 3 Master students 3 Supervisors Further research - See Chapther 6 Stages conducted Stage 1 Stage 2 Stage 3 Participants 16 Cellars 20 Cellars 4 Freight forwarders Figure 3.1: Research team and scope The first year, which consisted of Stage 1 (see Figure 3.1) of the project allowed the research team to gather information regarding the SA wine supply chain processes. This enabled them to identify problem areas in order to develop a preliminary supply chain measuring framework. In the second year, the research team revisited the participants (cellars) and the industry partners who were actively involved in the wine supply chain, to gather more information to validate and improve the preliminary supply chain measuring framework. In the second year, five final-year Industrial Engineering students and four Logistics students conducted case studies with reference to the problem areas identified during the first year of the project. This enabled the research team to focus on developing a new framework simultaneously while more information was being gathered regarding the wine supply chain processes. After the meetings, and subsequent changes to the preliminary framework and input from the wine industry, a new framework was developed. The metrics selected for the new framework were measured by collecting qualitative data from the cellars and the freight forwarders. These industry partners had to be approached since cellars do not keep a record of the type of information we required. 55
71 3.1 Methodology overview Before either of the work streams were undertaken, cellars were selected that would represent a large sample of SA s wine industry, thereby leading to sufficient data and contributing to the validity of the research. Since the SA wine industry in general is a large and complex industry as mentioned in Section 1.2, only a few of SA s wine cellars could be included. This ensured avoiding an overload of information that could not be processed within the scope of this project. Therefore, the scope of the study only comprises a representation of the SA wine industry. More specifically, the wine districts of Breedekloof, Stellenbosch, Robertson and Worcester were represented in this study. The advantages of selecting these districts, as highlighted by Van Eeden et al. (2012) in the preparatory study, were the sheer volume of wine produced and the variety of producer cellars, wholesalers and private cellars. According to WOSA (2014), there are 38 wineries in the Worcestor and Breedekloof regions. The Worcestor region accounts for 20% of the national vineyards and produces 27% of Africa s total wine production volume. After evaluating the range of cellars in SA, 16 cellars were identified to participate in this study (see Table 3.1). The cellars were selected on the bases of the following: ˆ Volume ˆ Region ˆ Demographics ˆ Business models The representative cellars account between 29.2% to 40% of SA s total natural wine production (Van Eeden, 2015). The reason for the representation range of 11.8%, is a result of the bulk local segment. Cellars sell bulk local to other cellars, who then sell it in any of the other three segments. The latter cellars combine the bulk they produced and bulk purchased from other cellars as their total production. This causes the total volume in bulk local segment to be inaccurate, seeing that the volume produced is added in the bulk local segment and in the other segments. Therefore, the participating cellars account for 40% of the industry in the event where all bulk local is sold to other cellars who then sell the wine in other segments. In the event where no bulk local is sold in the other segments, the participating cellars account for 29.2% of the industry. In addition, the cellars listed in Table 3.1 were selected with special interest in their different business models, as well as for the variety of districts they 56
72 3.1 Methodology overview represent and providing sufficient volumes in each segment. Table 3.1: Representative cellar of SA wine industry Cellar name Cellar name Botha cellar Bonnievale cellar Darling cellar Du Toitskloof cellar Koelenhof cellar Lutzville Vineyards Ltd Montagu cellar Namaqua cellar Perdeberg cellar Robertson cellar Roodezandt cellar Rooiberg cellar Stellenbosch Hills cellar Uniwines cellar Van Loveren cellar Wellington Wines cellar The 16 cellars participating in the study were divided amongst the three masters students, each focusing on different segments. The cellars were allocated to the masters students in accordance with the particular segmentation focus of the cellar. For example, a cellar that mainly produces bulk wine for export was assigned to the masters student focusing on bulk export who assumed responsibility for that cellar. The sample of cellars selected for the study focuses on one or more of these segments. This was determined through semi-structured interviews and workshops. See Figure 3.2 for the volume of litres represented for each segment by the sample of cellars and the percentage they contribute to the industry. For this thesis, the cellars represented 29.2% of the bulk export segment and included five of the top ten volume contributors in the bulk export segment. This sample was deemed sufficient in size to represent the knowledge of the segment, since the sample of cellars adheres to the four criteria s set out. 57
73 3.1 Methodology overview Liters in sample (Million) Bulk Local Bulk Export Million liters Packaged Local 19.7 % of industry Packaged Export % of industry Figure 3.2: Segment representation in SA wine industry This thesis concentrated on the SA wine supply chain with the focus pertaining to the bulk export segment. The study focused on a specific area of the SA bulk export supply chain: it covers the section of the bulk export supply chain from the production of wine to the delivery of it at the POD. See Figure 3.3 for the bulk export supply chain focus, which is indicated in red. Furthermore, as previously mentioned, quantitative data were requested from other freight forwarders and meetings were scheduled with each. These meetings were scheduled with four freight forwarders who handle roughly 77.5% of the bulk exports of SA (see Table 3.2). Table 3.2: Representatives handling SA s wine industry exports (van Zyl, 2015) Freight forwarder Handle % of SA s exports JF Hillebrand 40-50% Inter-sped 20-30% Gorgio Gori 5-10% Outsource Logistics < 2% 58
74 3.1 Methodology overview Grape Grower Raw Material Suppliers Grapes Order Supplies Wine Cellar Bulk Wine Bulk Wine Order is placed & Send samples Filler/ Packer Export Send two additional samples Export documentation Notice FF of order Export market Freight Forwarder Arrives at POD Freight Operator Finished Goods Shipping Information Importer Final Customer Figure 3.3: Export bulk wine supply chain (Adapted form Garcia et al. (2011)) 59
75 3.1 Methodology overview Thesis methodology The methodology process was divided into three stages (see Figure 3.4 for detailed steps). These stages are listed below: Stage 1: Investigation of the SA wine industry and designing a preliminary framework. Stage 2: Developing a new framework which was refined to the SA bulk export wine supply chain. Stage 3: Developing an ideal framework. Parallel to these three stages, literature was reviewed, semi-structured and unstructured interviews were conducted, and final-year projects were produced in order to obtain the most relevant information regarding the development of the framework. The framework was developed using an emergent multi-phased exploratory approach. This thesis presents the exploratory approach as two distinct interactive phases, qualitative data collection to be the first approach and then quantitative (Creswell & Clark, 2006). The exploratory approach was conducted in concurrent strands over a period of time that constituted a multi-phased approach. 60
76 3.1 Methodology overview Literature study Literature study Stage 1 objectives Stage 2 objectives Analysis of data Workshops Final year projects Final year projects Semi-structure and unstructured interviews Semi-structure and unstructured interviews Stage 3 objectives Analysis of data Workshops Begin and complete work-stream A - Enrich research team s SA wine industry knowledge. Begin work-stream B - Schedule workshops and structured interviews with cellars participating in study. - Develop new framework based on the outcome of latter. - Design user friendly method to collect quantitative data. Complete work-stream B - Analyse feedback based on the new framework outcomes, workshops, interviews and final year projects. - Expand the scope of participants. - Develop a refined framework. - Design user-friendly method to collect quantitative data. Develop ideal framework for bulk export segment. Figure 3.4: Methodology road map 61
77 3.1 Methodology overview The first stage was the starting point and the crucial element in both work streams. Work stream A was conducted by five final -year Industrial Engineering students and six Logistics students, as highlighted before. Each department s final-year projects had different objectives, in that the Logistics department s focus was mainly on research, whereas the Industrial Engineering department focused on problem-solving. Although the objectives were different, the overall objective, namely enriching the research team s and participants knowledge regarding SA s wine supply chain, was achieved. Workstream B was conducted in parallel to work-stream A. In Stage 1, the research team became acquainted with the industry through scheduled workshops with all cellars participating in the study (See Appendix D for agenda). The workshop included the cellars financial directors, marketing managers and chief executive officers. These workshops and semi-structured interviews steered the cellar management committees thinking in the direction of supply chain concepts. The workshop s primary focus was to identify which two of the four segments the cellar focuses on, or wishes to focus on, and to identify which attributes are superior, advantage or parity for each selected segment (refer to Section for the five attributes). In addition, the workshops and semi-structured interviews should indicate the quality of information and data available in the industry. This will enable the research team to understand the different business models used by cellars and to identify their challenges. After the workshops and semi-structured interviews were completed, sufficient information had been gathered to develop a preliminary framework. This framework included metrics from each of the five attributes of SCOR, seeing that the attributes consisted of financial and non-financial metrics and are trade-offs of one-another. The objective of the preliminary framework was to determine the availability of the quantitative data, as discussed during the workshops. The metrics were designed on Microsoft Excel with a clear description of the metrics and how to calculate each one (See Appendix E). The Excel file was sent via to all participating cellars who completed the Excel sheets in the two-week period allotted to them. The feedback was received via , after which the analysis of the quantitative data commenced. The research team analysed each metric that had been measured. Conclusions were drawn for each metric, and workshops were arranged to share the feedback and present it to the cellars. The knowledge obtained from analysing the quantitative data, together with the feedback received from the workshops, formed the point of departure for Stage 2. 62
78 3.1 Methodology overview In Stage 2, the first objective was to investigate the feedback received from Stage 1 s measurements, workshops and the problems that surfaced during this stage. The next objective was to expand the scope of the project to include more cellars and other industry partners. During the refining process new metrics were selected for the new framework which were refined to SA s bulk export wine supply chain and its processes. The metrics were selected on the basis of the level of data that was available in the industry and the feedback received during Stage 1. There are many limitations regarding quantitative data availability in the SA wine industry and therefore, not all SCOR s attributes were measured for Stage 2. These limitations will be elaborated in Chapter 4. Moreover, each metric received demographics which would present the metrics in more detail. Similar to Stage 1, Stage 2 metrics were selected and were designed in Microsoft Excel. The designed Excel sheets were converted into one survey to be more convenient for the cellars. The survey, designed on SurveyMonkey Inc. (2015), provided security and accuracy according to the QC objectives set out by CDM (2015). The data requested for Stage 2 could not be collected at the cellars alone, seeing that they do not capture all the requested data on their systems. Data were also collected from other sources, namely JF Hillebrand, Outsource Logistics, Inter-Sped and Gorgio Gori. By including other industry partners and collecting the data directly, this ensured better security and increased the industry partners willingness to participate. During the final stage, Stage 3, an ideal framework was constructed for the bulk export segment. The ideal framework was developed using the results from Stage 1 and Stage 2, the literature review, scheduled interviews, workshops and final-year projects regarding this study. Moreover, this framework was not developed based on the information and data available in the industry, but based on an ideal scenario where all information and data would be available. 63
79 Chapter 4 Results and discussions Contents 4.1 Findings for preliminary investigation (Stage 1) Reliability Responsiveness Agility Cost Assets management efficiency Summary Findings for developing framework (Stage 2) Reliability Responsiveness Asset management efficiency Conclusions The findings for Stage 1 and 2 are predominantly focused on work-stream B. The feedback is provided in the same manner as the methodology, enabling the reader to simultaneously compare the methodology stages with the findings for each stage. The chapter commences with the findings from Stage 1, which comprises of problems that have to be addressed in Stage 2, as well as the benefits that were discovered. The chapter continuous on to discuss Stage 2 and its findings, before concluding with the problems and benefits identified in both stages, the latter of which will be used for the development of the ideal framework. 64
80 4.1 Findings for preliminary investigation (Stage 1) 4.1 Findings for preliminary investigation (Stage 1) The objectives for Stage 1 were: ˆ To begin and complete work-stream A To enrich the research team s supply chain knowledge regarding SA s wine supply chain. ˆ To begin work-stream B To schedule semi- and unstructured interviews with cellars participating in the study. To develop a new framework based on an outcome of latter. To design user-friendly methods to collect data. As mentioned in the methodology, the first workshop at each cellar was the starting point for this thesis. Each wine cellar was visited and a series of questions were asked to identify which two of the four segments are most relevant for their business strategy. Some cellars selected only one segment, since they do not participate in any of the other segments. Eight out of the 16 cellars, which represents 29.2 % of the industry volume, identified bulk exports as one of the two segments they intend to focus on (See Table 4.1). The cellars were asked to identify which attribute should be superior, and which two attributes should be advantage as displayed in Figure 2.7 and 2.8. Not all cellars chose two attributes to be advantage, some only selected one. This feedback provided sufficient information with reference to the strategy most bulk export cellars apply. Moreover, seven out of the eight cellars, who identified bulk export as one of their segments, selected reliability to be superior for this segment (highlighted in red in Table 4.1). Therefore, a primary concern for all cellars focusing on bulk export was their reliability. Reliability is defined as all items and quantities received on-time, complete documentation and in the right condition (SCC, 2014). Six of the seven who selected reliability as superior, selected responsiveness to be advantage (highlighted in blue in Table 4.1). This trend provides a starting point for developing a performance measuring framework of SA s wine industry that focuses on the export bulk segment. 65
81 4.1 Findings for preliminary investigation (Stage 1) Table 4.1: Summary of cellars segmentation focus Segments Bulk Bulk Packaged Packaged Local Export Local Export Attributes 1 S 2 A S A S A S A Reliability 1 4 7O Responsiveness O Flexibility Cost Assets Number of wine cellars focusing on specific segment 1 S: Superior 2 A: Advantage Table 4.1 was observed, and although a certain trend follows the bulk export segment, it should be emphasised that all attributes must be measured. As mentioned in Section 2.3.1, performance attributes impact one another, therefore, at least one metric from each attribute was selected and measured. Since Stage 1 s primary focus was to enrich the research team s knowledge and to evaluate the level of data available in SA s wine industry, only six high-level metrics were selected and measured for the bulk export segment. These six high-level metrics represents all five attributes and would provide a clear depiction of the industries data availability. The six metrics selected for Stage 1 are shown in Table 4.2 with a description provided for each. 66
82 4.1 Findings for preliminary investigation (Stage 1) Table 4.2: Metrics with description SCC (2013) Attribute Metrics Description Reliability Responsiveness Agility Cost Cost Asset Perfect Order Fulfilment Order Fulfilment Cycle Time Upside Supply Chain Flexibility Storage cost Transportation cost Inventory days of supply Measure the % of orders that meet the delivery performance. The average actual cycle time consistently achieved to fulfil customer orders. For each individual order, this cycle time starts from the order receipt and ends with customer acceptance of the order, namely FOB. The number of days required to achieve an unplanned sustainable 20% increase in quantities delivered. Storage cost for finished goods stock (Measurements: Rand per litre) All calculations start where the goods leave the facility where it is stored after production up to FOB The amount of inventory (stock) expressed in days of sales The measurements were selected from the SCOR framework (Revision 11) and were developed in Excel (See Appendix E). This enabled the participating cellars to answer and provide data in Excel for the selected measurements. This Excel file was sent out via to all participants, after which the data were collected via and subsequently analysed. The results for each metric are detailed in Figure
83 4.1 Findings for preliminary investigation (Stage 1) Reliability Segment Units Level1Measurement Bulk Export % PerfectOrderFulfilment 0, Responsiveness Segment Units Level1Measurement 16,10 Bulk Export Days OrderFulfilmentCycleTime Agility Segment Units Level1Measurement Bulk Export Days UpsideSupplyChainFlexibility 28, Cost Segment Units Level1Measurement Bulk Export Randperlitre(bulk) TransportationCost Randperlitre(bulk) StorageCost 0,0217 0, Assets Segment Units Level1Measurement Bulk Export Days InventoryDaysofSupply 358, Units Days Figure 4.1: Preliminary findings for Stage 1 68
84 4.1 Findings for preliminary investigation (Stage 1) In Figure 4.1, each circle represents a cellar participating in the study. Though eight cellars participate in the bulk export segment, it should be noted that with certain metrics fewer than eight circles are indicated. There are two main reasons for this: the first and most common reason is that measurement could not be determined. Specifically the cellars use operating systems that incorporate data into one supply chain, whereas this study focused on selecting data divided into different supply chain segments. Therefore, the operating systems could not provide adequate data for specific metrics that were required from the cellars. The second reason is the specific measurement was misunderstood by participating cellars and consequently, the results could not be interpreted. Therefore, including the outliers would give an inaccurate indication as to what is actually taking place in the industry. Next, the development of the metrics and the results from Stage 1 will be discussed Reliability Metric: Perfect order fulfilment A perfect order is seen as an order where the correct product and quantity are delivered on time. If available, the cellars were asked to specify any reliability issues that caused an imperfect order. The list of reliability issues that were provided included product type, customer, quantity, condition, date and time window, and supporting documentation. This would give an indication as to where the majority of problems may exist. All cellars understood this metric, but some did not have the recorded data on the system required for quarter 2 (April, May and June) in 2014, or any quarter for that matter. Thus, only three circles can be seen in Figure 4.1. Figure 4.1 displays three circles, however, six measures have been provided where four circles are displayed on top of each other. These circles include four 100% reliability measures. Since cellars only manage the production part of the supply chain, it was often unknown to them if the order was perfect with respect to SCOR s criteria. Only the operations that affect cellars, pertaining to the order fulfilment process, were brought to their attention. The cellars would correct the problem or do the necessary to satisfy the clients needs, but the event is never recorded in their system. Therefore, asking the cellars about reliability issues is problematic, since they can only recall some events and could not display it in a report for further investigation. Only the orders that were shipped back are recorded and only these were provided. Therefore, cellars are believed to have 100% reliability or close to that, when in fact many reliability issues 69
85 4.1 Findings for preliminary investigation (Stage 1) could occur without the cellars knowledge. Data were available in their documents, but these were kept in hard copy format and stored away in cabinets. To fully comprehend the effects of this metric, cellars had to provide data for each order that was exported in bulk format. To collect the data in this manner was beyond the scope of the study and would require sufficient time and manual labour, which was not available. Therefore, the cellars and the research team together declined this cumbersome process. In spite of these complications, data were still obtained for this metric. As previously noted, cellars viewed an imperfect order as one that has been shipped back. Therefore, the circles in Figure 4.1 represent the cellars reliability in terms of their understanding of a perfect order. Of course, there are numerous other factors that could affect a cellar s reliability, of which none were taken into consideration for this metric. This suggests that the current measurement the cellars obtained for this metric represents their maximum reliability. When the other factors are included, only then will the true reliability of cellars be revealed Responsiveness Metric: Order fulfilment cycle time Order fulfilment cycle time, for simplicity, was measured from when the order was placed to when it was loaded onto the ship, and not delivered to the importer s warehouse. Roughly 95% of orders were shipped with Free on Board International Chamber of Commence terms, commonly known as FOB INCOTERMS RO For this reason, the metric was measured until the cellars transportation responsibilities for the wine ended. The measurement selected for this metric is defined as the average speed of all orders received by the cellar in the second quarter of 2014 (April, May and June). By observing Figure 4.1, it can be noted that one cellar obtained an average order cycle time of 2.5 days from 39 orders. This is highly unlikely, since, according to Watson (2015), the industry average for geting wine ready for shipment is around 14 days. Also, samples are sent to SAWIS and Vinetech for quality approval and needs to be accepted before the wine can be exported. This process takes approximately 3 days and therefore an average cycle time of 2.5 days is extremely unlikely (van Lill (2015); Watson (2015)). Another process that may delay the average cycle time, is the time it takes for freight forwarder companies to schedule a shipping time, which should ideally 70
86 4.1 Findings for preliminary investigation (Stage 1) be scheduled well in advance. Therefore, there is enough evidence to support the fact that the 2.5 average cycle time is inaccurate and the measurement was incorrectly calculated by the cellar. Upon further analysis of the data, it came to our attention that the cellars did not have all the data regarding the order information required for the complete measurement. The cellars could only provide the data they required for their personal use, for example the quantity, client name, blend and freight forwarder used. This is because information that affects data records further down the supply chain was not a prerequisite for the cellars, seeing that they apparently they have no a use for it. The cellars take approximately 14 days to prepare a bulk order for shipment, therefore the cellars estimated, in days, the speed at which they presume to deliver at port. No accurate dates were provided, since they do not record this information. For Stage 2, it became necessary to include other industry partners in the study who capture relevant data further down the supply chain. These industry partners are the freight forwarder companies that handle the exporting documentation and deal with the shipping companies. After being acquainted with the freight forwarder companies, it was discovered that the transporting function is divided into two operations and each function could be handled by any two freight forwarders. The freight forwarder companies refer to the two as the importer s agent and the other FOB agent. The importer s agent has a direct connection with the importer and handles the product, whereas the FOB agent does most of the documentation and communication with the cellar. Both agents communicate regularly with each other to ensure that the order is fulfilled. Relationships are built over time and the importer (the customer) decides which company should be used as the importer s agent, while the cellars decide who the FOB agent should be. In light of these discoveries, and in future, data should instead be gathered from multiple freight forwarders and orders should be linked to determine the dates along the transportation process. A consistent number that is used throughout the transportation process is the importer s purchase order number. Through this, it is possible to track the order from the cellar, to FOB agent, to the importer s agent to the POD. 71
87 4.1 Findings for preliminary investigation (Stage 1) Agility Metric: Upside supply chain flexibility Cellars interpreted this measurement differently, which subsequently caused them to provide inaccurate data. The metric was measured for three sections of the cellar, namely source, make and deliver. For each section, the cellar had to calculate how long, in days, it would take to up-scale each section with 20%. The approach, explaining the definition for this metric, was unsuccessful, seeing that the research team lacked knowledge with reference to how wine making-related processes were executed in the cellars. The first problem surfaced after measuring the ability to up-scale the sourcing section. Cellars understood the question differently: some cellars assumed that to upscale, they needed to plant more grapes, whereas others assumed they could purchase grapes from surrounding grape growers to up-scale. Therefore the answers were vastly different. Also, it is not an easy task to up-scale sourcing, since the cellars are susceptible to harvest fluctuations. Measuring the make section was also misunderstood. Cellars do not fully utilise their production and storage facilities and tend to have an excess capacity in both their production and storage facilities. Therefore, it would generally take zero days to up-scale their make stage. The cellars invested in machines, tanks and storage areas to handle a large harvest. A large harvest in this case could refer to the 2013 harvest, where the harvest, was the largest it has been in 14 years. Cellars infrastructures are generally equipped to handle such a harvest and the facilities are therefore not optimised during a normal harvest. Only when SA has a great harvest are the facilities fully utilised. Up-scaling the delivery stage thus seems effortless for the cellars, seeing that it only affects the freight forwarders. The cellars have a selection of freight forwarders to use that are capable of managing a 20% volume increase from the wine industry. For this reason, this metric would not provide a valid benchmark measurement for the wine industry. Although the measurements were confusing to the cellars, data were nonetheless obtained. The cellars provided the time, in days, it would take for them to up-scale each of the three measurements. The circles in Figure 4.1 represents the sum of the three measurements. For example, it takes a cellar 15 days for sourcing, 18 days for making and 2 days for delivery. The value that will be used as a benchmark will thus be 35 days ( ). Considering that the metric s definition does not adhere to 72
88 4.1 Findings for preliminary investigation (Stage 1) the wine industry s processes, further development is needed. Although cellars selling predominantly bulk wine identified reliability as the superior attribute on their list, it is assumed that the agility or flexibility of a cellar will be the determining factor to differentiate cellars in the industry Cost Metric: Storage cost The storage cost measurement included only the finished goods of bulk wine (local and export bulk wine), measured in (R/l). This metric was especially difficult for cellars to calculate and only two cellars provided answers (See Figure 4.1). The first reason for the incomplete data is that the production and storage areas are shared in some cellars. This proved to be a challenging calculation for cellars, seeing that the cellar had to divide the storage and production area. The section set out to store wine in the cellars, varies each year, depending on the harvest or unsold stock from the previous year. From the cellar s viewpoint, it was an effort to calculate this metric. It was necessary to measure storage costs in order to acquire a clear view of the metric, but at the same time enforcing too much effort onto the participants would make them less enthusiastic about their participation in the project. The final reason for incomplete data, is that one of the cellar s warehouse was paid off and the cellar s financial manager viewed the storage cost as zero, seeing that they do not have to pay for the building they use for storage. Therefore, it was accepted for Stage 1 that the storage area could not be calculated. Seeing that the storage cost would not form part of Stage 2 framework, further investigation was not required. Metric: Transportation cost Six out of the eight cellars provided sufficient data for this metric (see Figure 4.1). This metric was easier to calculate than storage cost, since transportation is mostly outsourced. The cellars were able to calculate the transportation cost (R/l) from the quotations of the transportation cost and the quantity of bulk wine on their financial records. Each cellar s average transportation costs are closely grouped (See Figure 4.1), which substantiates that the cellars understood the metric. One main reason why some cellars pay more for transportation than others, is because of the cellar s location. Some cellars are further located from the Cape Town port than others and would in reality, pay more for transport. Therefore, the cost variation for transport is directly 73
89 4.1 Findings for preliminary investigation (Stage 1) proportional to the location of the cellars Assets management efficiency Metric: Inventory days of supply For this metric, cellars were asked to provide the average value of inventory at standard cost and the cost of goods sold for the second quarter in 2014 (April, May June). The inventory days of supply (IDOS) metric was measured using the information requested. After the data were analysed, the answers revealed that the metric was misunderstood. It is very unlikely that a cellar has an average IDOS of more than 550 days. This was the first indication that the metric was misinterpreted. Wine is stored in bulk format, but cellars were oblivious as to whether the wine will be sold in the format of packaged or bulk. Therefore, calculating the IDOS for the bulk export segment caused confusion and cellars did not know whether to include all bulk in storage or only the wine that was sold for the year. The general consensus, derived from the interviews, is that around 80% of wine produced by cellars, which is sold in bulk format, is contracted and sold for the year. Therefore around 20% of the wine is neither classified as bulk, nor as packaged, and would be sold in any format. In Figure 4.1, four cellars provided data. As previously mentioned, 550 IDOS is very unlikely. It should be noted in Figure 4.1 that two cellars obtained a IDOS of more than 300 days. This suggests that these cellars have close to a year s inventory on a monthly basis. After becoming acquainted with the wine industry, it was recognised that cash flow is highly regarded in the wine industry. With that in mind and the fact that cellars sales and marketing team s goal is to sell all the wine before the next harvest, excluding work in progress (WIP), makes it unlikely that cellars store that much wine during the year Summary Stage 1 provided the research team with valuable information in order to develop a new framework in Stage 2. It was found that the maturity of SA wine supply chain was between Level 1 or 2, seeing that information regarding the interactions and progress of activities further down the supply chain are unfamiliar to the cellars (See Section for supply chain maturity). After the data from Stage 1 were analysed, feedback sessions were scheduled, which both sponsors and participants attended. The 74
90 4.2 Findings for developing framework (Stage 2) feedback sessions objectives were to provide the attendees with the progress of the study, mentioning problems that surfaced and receiving feedback from the attendees regarding their view of the results found. More emphasis was placed on the positive results during the feedback sessions. In retrospect, the problems identified in Stage 1, highlighted below, should be addressed before a new framework is developed in Stage 2. The problems that surfaced during Stage 1 were addressed in Stage 2 in order to obtain accurate data. The problems identified in Stage 1 are listed below: ˆ Cellars have little transportation data. ˆ Storage cost was difficult to measure and requires a detailed definition. ˆ Transportation cost is not a relevant measurement to benchmark. ˆ The definition for up-scaling source, make and deliver was vague and misunderstood by most cellars. ˆ Inventory days of supply metric has to be reviewed in order to measure it in a segmented manner. ˆ Cellars do not have order data further down the supply chain. ˆ Cellars have insufficient supply chain segmentation. 4.2 Findings for developing framework (Stage 2) The new framework was developed in Stage 2 that addressed the problems identified in Stage 1. In Stage 2, 23 invitations, which included the 16 cellars participating in Stage 1, were sent out, of which 18 responded. Eight of the 18 cellars that responded, practise in the bulk export segment. The new framework developed for Stage 2 is discussed next with a description for each metric in response to the problems identified in Stage 1. In Stage 2, only three attributes with partially available data were measured, seeing that the SA wine industry lacks information regarding the other metrics (See Table 4.5). These three attributes were measured in more detail and received more metrics, segments and demographics. The remaining attributes that were not measured, underwent further development, and will form part of the ideal framework. Also, at this stage there were no suitable measurements for the cost and agility attributes. The attributes that were measured included reliability, responsiveness, and assets. The first attribute that will be discussed is reliability, followed by responsiveness, and assets. 75
91 4.2 Findings for developing framework (Stage 2) The objective for Stage 2 was to complete work-stream B. Work-stream B s objectives are listed below. ˆ To analyse feedback based on the new framework outcomes, workshops, interviews and final year projects. ˆ To expand the scope of participants. ˆ To design user-friendly methods to collect data. ˆ To develop a new and refined framework Reliability Reliability refers to the ability to perform tasks as expected with reference to the timeliness, quality and quantity of the product being delivered (SCC, 2014). This performance attribute is customer focused and will greatly impact an organisation s customer satisfaction level. The wine industry is a competitive industry and as a result, wine cellars will do what they can to gain a competitive advantage. This includes boosting their reliability to ensure sales remain high and to stay competitive in the SA wine industry. This does not only include the wine cellars competing on an individual level, but also includes SA s wine industry competing against international wine industries, such as Australia, Argentina, and Chile, among others. SA s wine industry s largest market is exporting bulk wine, which faces competition against other southern exporting countries. Therefore, not only should each individual wine cellar s reliability be advantageous, but so should the SA wine industry s reliability as a whole. For the above-mentioned reasons, reliability was selected to from part of this framework. Reliability consists of a Level 1 metric, namely perfect order fulfilment (RL.1.1) which can be calculated as shown in Equation 4.1. Perfect order fulfilment consists of four Level 2 metrics (RL.2.1 to RL.2.4); see Figure 4.2 for an illustration. Perfect order fulfilment is a high-level measurement that only captures orders and assigns a value of 1 when completed and 0 when incomplete or awaiting completion. Incomplete orders receive an abstract reason as to why an order failed, which makes finding solutions strenuous. Capturing Level 2 metrics provides more detailed reasons as to why the product delivery was incomplete. This enables cellars to narrow the problem down to a specific operation within the delivery process. In order to gather Level 2 metrics data, it was necessary to involve other supply chain partners. These supply chain partners, 76
92 4.2 Findings for developing framework (Stage 2) namely freight forwarders, have more mature processes and systems than that of cellars, and were therefore able to provide more reliable information. Reliability = (Total Perfect Orders) 100% (4.1) (Total Number of Orders) RL.2.1 % of Orders Delivered in Full RL.1.1 Perfect Order Fulfilment RL.2.2 RL.2.3 Delivery Performance to Customer Commit Date Documentation accuracy RL.2.4 Perfect Condition Figure 4.2: Reliability measurements The freight forwarder companies were asked to complete four Level 2 metrics. The companies only captured one of the four metrics on their systems, namely delivery performance to customer commit date. This metric is defined by SCC (2014) as the percentage of orders that are fulfilled on the customer s originally committed date. In the case of exporting, this metric will almost always receive a 0, seeing that transportation is mainly dependent on the weather conditions. The ship departs from Cape Town port and propels toward its destination. During this journey, weather may change which may cause the ship to delay or advance its arrival time. As such, for the SA wine industry, the metric should not specify a committed date, but should rather stipulate a time window during which the ship has to arrive. Furthermore, Documentation accuracy, perfect condition and % of order delivered in full are not captured on the freight forwarder s systems. Documentation accuracy is defined as the percentage of orders with accurate documentation supporting the order. Perfect condition is the condition in which the product arrives at the importers warehouse, and % of order delivered in full is the percentage of perfect orders received by 77
93 4.2 Findings for developing framework (Stage 2) the customer with correct quantity. (SCC, 2014). Faulty documentation and imperfect conditions of products do sometimes occur. These problems are handled instantly, but are not recorded on their systems. Therefore, the freight forwarder can indicate those problems that occur most, but no record is kept regarding these problems. It rarely occurs that the wine is shipped back due to poor quality or the documentation being false. After all, a sample from the same wine is exported to the importer and needs to be accepted by them prior to shipping the full container. In addition, a sample of the wine that was pumped into the flexitank, is collected by SAWIS to manage the quality of wine being shipped (van Lill, 2015). Under the above mentioned circumstances, the exporting cellar would be suspicious regarding the actual reasons for returning the wine. One response from a cellar was that importers forecasts predicted that more wine would be sold before the next order from SA arrives. If the container arrives after a two-week lead time, the importer would rather send it back because of alleged poor quality than to pay for wine that would be laborious to sell (van der Watt & Lötter, 2015). Nonetheless, taking the latter argument into consideration, there are certainly occasions where the product is of poor quality, or it simply does not meet the necessary requirements of customer s demand, but this is rarely the case. As previously mentioned, delivery performance to customer commit date was the only level-two metric that could be measured due to the availability of the data on their systems. This metric received time stamps to differentiate between various processes and to distinguish between responsibilities for the order during specific periods. The time stamps the freight forwarders provided are shown in Figure 4.3. Estimated time of DEPARTURE Estimated time of ARRIVAL Grape growers Cellars Freight forwarders SA Port POD Client Customer Actual time of DEPARTURE Actual time of ARRIVAL Days at sea Figure 4.3: The requested time stamps By calculating the difference between the estimated time of departure (ETD) and the actual time of departure (ATD), the team was able to determine whether the order departed on time or late. A similar calculation could be done for the actual time of 78
94 4.2 Findings for developing framework (Stage 2) arrival (ATA) of the shipping vessel. The freight forwarders could only provide the estimated time of arrival (ETA) for when the finish goods should arrive at the importer s warehouse and not the ETA at POD. Therefore, calculating the difference between ETA and ATA would not portray a true depiction of the arrival reliability of ships. Although the calculation is problematic, it can still be concluded that when the order arrives (ATA) after the ETA date the order is late. This provides an effective reliability measure for entities pertaining to the exporting wine process. The first to be discussed is the departure reliability measure. To be able to ship the wine on time requires collaboration between the cellars, freight forwarders and shipping companies. These three entities can therefore affect the time of departure. However, other unexpected events may also hamper this process. These include natural disasters, labour strikes at port or other service providers, weather conditions, and terrorism, among others. For our data collection purposes, the freight forwarders supplied data, which only contains the date for ETD and ATD with no explanation for late arrivals. Therefore, during the analysis of the data, if an order was late, it was assumed that either the cellar, freight forwarder, shipping company, payment issues from the importer, or the weather was the cause. The second reliability measure is the arrival of the shipping vessel at POD. In this case, the entity that can affect the time the order is delivered at POD is the shipping company, however, weather conditions may also hamper the delivering process. Therefore, during the analysis of the data, if a shipping vessel was late, it was assumed to be the weather conditions, or shipping companies error that prevented the shipping vessel from being on time. Figure 4.4 displays the reliability of orders that were shipped on time. The size of the circles in this figure represent the number of orders. It should be noted that only 30% of cellar C s order departed on time, while the rest was late. As previously mentioned, major entities that may prevent the order from being shipped on time, include the cellar itself, freight forwarders, the shipping company, payment complications or the weather. In the case of the other cellars, 0% of the order departed on time. This is therefore inferred to be a problem area in the supply chain, and one that should be measured and addressed in future. Moreover, as previously indicated, the ETA and the ATA cannot effectively be compared in the same manner as ETD and ATD, but results could nonetheless be derived from the data. It was found that nearly 30% of the samples 79
95 4.2 Findings for developing framework (Stage 2) of orders retrieved from freight forwarders arrived later that the ETA. This confirms that the orders POD arrival were later than the ETA at the importer warehouse and as such, the orders were exceptionally late. In addition, the 30% represents the reliability of orders delivered on time. This is essentially the highest reliability measure that can be obtained, considering the possibility that the order, having arrived on time at ETA, could still arrive late at the importer s warehouse. Two undergraduate students conducted studies regarding the responsiveness and reliability aspects of the packaged export supply chain segment. It was found that the bottling of packaged wine must be booked in advance and any delay of dry goods or wine may hamper this process. Therefore, orders that arrive late at the importer s warehouse could have a ripple effect, resulting in processes being delayed, which incorrectly portrays SA wine industry s reliability to be poor. Celars\Ship_Reliability 30% 28% 26% CountSHIPorders CelartoSHIP 24% 22% 20% 18% 16% 14% 12% 10% 8% 6% 4% 2% 0% -2% CelarF CelarA CelarH CelarC CelarG CelarE CelartoSHIPforeachCelar.SizeshowsCountSHIPorders.ThedataisfilteredonCelarName,SHIPto PODandCommodity.TheCelarNamefilterkeeps11of11members.TheSHIPtoPODfilterkeepsalvalues.TheCommodityfilterkeepsBulkWines(+2).TheviewisfilteredonCelartoSHIPandCelar.TheCellartoSHIPfilterkeepsalvalues.TheCelarfilterexcludesnomembers. Figure 4.4: Reliability findings for Stage 2 Upon further investigation, it became clear that there were inconsistencies in the data. Figure 4.5 presents the events where the orders were shipped late from Cape Town port ( ETD to departure indicated in blue), but also arrived late at POD ( ETA to arrival indicated in black). This sample represents 62% of all the order data obtained from the freight forwarders. It should be noted that most of the time, 80
96 4.2 Findings for developing framework (Stage 2) shipping vessels arrived between one and ten days late, whereas the shipping company frequently departed 12 days late, or more. The average of the ETA to arrival was calculated, excluding the outliers, and a value of seven days was obtained. Similarly, the ETD to departure was calculated and we obtained a value of 14 days. This indicates that on average the shipping vessel arrives seven days late at POD, as to the shipping vessel departing 14 days late from Cape Town port. This suggests that on average, the shipping company advances travelling at sea by seven days (14-7), which is unlikely seeing that the average time a shipping vessel spent at sea was 24 days for this sample. This implies that the shipping vessels have to perform an average of 30% more efficiently during sea travel Frequency Days More ETD to departure ETA to arrival Figure 4.5: Orders shipped late and arrived late at POD Investigation of specific case studies representing extreme outliers, revealed that the data were unreliable. One such extreme outlier, namely order information, is shown in Table 4.3 below. In this example, the order departed 197 days late form Cape Town port, spent 29 days at sea, and arrived 5 days late at Liverpool. According to the sample, the average time a shipping vessel travels to Liverpool, is 30 days. This suggests that it is not possible for a shipping vessel to arrive five days late at Liverpool after it departed 197 days late at Cape Town port. The sample of data obtained from the freight forwarders represents another 14 cases similar to the Liverpool order, which is problematic. This concern was presented to a freight forwarder participating in the study. The response was that the ETD is automatically updated by their system after the ETA is entered; where the ETA is the date the importer expects the wine to arrive at its warehouse. The system then calculates, using historical data, the date the wine should be shipped from Cape Town port. In some cases, the ETA is updated, but the 81
97 4.2 Findings for developing framework (Stage 2) ETD is not updated accordingly. In light of this, caution is urged when attempting to draw conclusions from the data in this regard. Table 4.3: Unreliable order information Cellar Cellar F Days departed late 197 Days at sea 29 Days arrived late 5 Wine type Bulk Destination Liverpool Responsiveness Responsiveness is defined by SCC (2014) as the speed at which a supply chain provides products to the customer. The metric is considered to be highly important for SA cellars, seeing that the feedback from the Stage 1 suggested responsiveness to be an order-winning criteria (See Table 4.1). According to Nel, Dippenaar & Hertog (2015), exporting wine in bulk format generally has a lead time of 12 weeks. For example, when the importer purchases new wine in bulk format from SA. This process from when the order has been placed to receiving the wine at POD will take approximately 12 weeks in total. Shipping wine in bulk format is complex, time consuming, and requires excessive paperwork. This laborious process is discussed next (See Figure 4.6). The first step for ordering wine in bulk from SA, is for the importer to request samples if the wine is unknown to him/her. Otherwise, the importer will request an order directly, but in most cases a sample is required for verification purposes. The order generally contains relevant information, namely the date of shipping, date of arrival, volume, POD, and cost information, among others (JF Hillebrand, 2014). Before an order is shipped, three samples are sent away in order to test the necessary qualities of the wine. The samples are sent to SAWIS and the Department of Agriculture, Forestry and Fisheries (DAFF). This certification from SAWIS has a 42 days guarantee that allows the cellar to request export documentation during that period (van Wyk, 2015). This document can be requested online upon placing an order by using the reference number SAWIS assigned to the cellar s wine. 82
98 4.2 Findings for developing framework (Stage 2) Importer requests samples Send a sample to DAFF 1 day 0 -? days 2-3 days 0-1 day Samples are send to importer Order is placed Send samples (SAWIS & DAFF) Request export document online Notice FF of order When vessel is available 2 days (Stacking) Received export document Wine is pumped into Flexitank Two samples send to DAFF Wine is delivered to SA port 2 days (Loading) days (On ocean) Wine is loaded onto shipping vessel Wine arrives at POD Figure 4.6: Flowchart of entities and lead times in supply chain (van Lill (2015); Watson (2015)) 83
99 4.2 Findings for developing framework (Stage 2) Continuing on from when the order is placed, the cellar has to react and give notice to the freight forwarder. The freight forwarder then notifies the cellar when the wine should be ready for shipping and schedules a time and date for the wine to be pumped into the flexitank. Pumping the wine into the flexitank takes place at the cellars, where the wine is stored. The port generally has a stack time of two days, in which the cellar has to deliver the wine. Prior to pumping the wine into the flexitank, the cellar notifies the DAFF to schedule an inspector. The inspector s purpose is to extract wine from the flexitank and deliver it to the DAFF. Occasions do occur when the inspector is not able to visit the cellar, mainly due to the inspector being busy inspecting other cellars wine. In this case, the cellar contacts the inspector, asking for permission to load the flexitank. After the permission has been granted, the cellar is responsible for extracting two bottles of wine from the flexitank and sending it to DAFF. The loaded flexitank is shipped to the port during the assigned stack time. After the stack time is due, the ship is loaded which takes approximately two days, but weather may hamper the loading process. The ship will stay at bay for two days, after which the ship will sail to the next destination even when the ship was not loaded due to bad weather. This is commonly known in the industry as cut and run (van Lill, 2015). According to van Lill (2015), it is too expensive for the ship to stay longer, causing full containers to stay behind those that were not loaded onto the ship due to poor weather conditions. The next set of ships to arrive are generally pre-booked with containers. Only when space becomes available, are the cut and run products loaded; else they are loaded on the next available ship. This can affect a cellar s responsiveness negatively. After the ship has sailed across the ocean and arrived at POD, the wine is unloaded and transported to the importer s warehouse of choice. Thereafter, two additional samples are extracted from the flexitank and are sent to DAFF. The wine is then compared to the samples that were extracted in SA in order to establish whether the wines are the same kind and the same quality. The metric used to measure the responsiveness of cellars is referred to as Order Fulfilment Cycle Time (RS.1.1) and will be discussed below. This metric measures the average cycle time taken from when an order is placed, until the order is delivered and accepted by the customer. Since SA s wine industry is in fierce competition with other southern hemisphere countries that also export the majority of their wine to the northern countries, responsiveness will have a great effect on the SA wine industry. There are many operations that may reduce cycle time, and as such, the metric was 84
100 4.2 Findings for developing framework (Stage 2) customised from Stage 1 to adhere to the SA wine industry supply chain. The Order Fulfilment Cycle Time was divided into three additional cycle times, each containing the cycle time of an important operation in the supply chain (see Figure 4.7). Adding these three cycle times will effectively provide the Order Fulfilment Cycle Time. This metric was divided into the three cycle times to be able to pinpoint precisely where the problems occurred during the entire cycle time. CT 1 Order to harbour RS.1.1 Order Fulfilment Cycle Time CT 2 Harbour to on ship CT 3 On ship to POD Figure 4.7: Three cycle times (CT) measurements The data requested from the freight forwarders are listed in Table 4.4. There are four actual dates required to determine the three cycle times. The first cycle is from when the order is placed until the order is delivered at the port. The initial date on which the order was placed is only available at the cellars, whereas the date of products arrival at port is available on the freight forwarder system. Therefore, the data should be linked between the cellar s system and the freight forwarders systems. A unique entity that is used throughout all parties systems, is the importer purchase order. The next required date is when the ship departed from Cape Town port. The time the wine was stationed at the port can be determined with the second cycle time. Finally, the third cycle time is the duration of the ship at sea. The last three dates mentioned, namely the date delivered at Cape Town port, actual date when order was shipped from port and actual date when order arrived at POD, each have a requested date. By capturing both the actual and requested dates, reliability issues can effectively be found. Although the largest volume of wine is shipped with FOB Port of Cape Town INCOTERMS RO 2010 and the cellars have no influence from that point onwards, it is proposed that the cellars should be aware of the products reliability. If the customer experiences bad service from the FF in SA, the cellars is effected by it. 85
101 4.2 Findings for developing framework (Stage 2) Table 4.4: Data required from freight forwarders for each order Number Data required 1. Cellar name/code 2. Unique ID Exporters Custom code 3. Importer s PO 4. If applicable name of FOB agent 5. If applicable name of importer s agent 6. Delivery Point: If applicable date delivered at FF warehouse 7. Delivery Point: Date delivered at Cape Town port 8. Requested date when order was shipped from port 9. Actual date when order was shipped from port 10. Requested date when order arrived at POD 11. Actual date when order arrived at POD 12. Port of destination (name) 13. Volume (litres) 14. Reliability issues 15. Consolidation (LCL/FCL) 16. Shipping line 17. Inco-terms The average time, presented in number of days, that ships travel at sea are displayed in Figure 4.8. By observing this figure, it should be noted that the data is consistent and no extreme cases are presented here. This suggests that there are few responsiveness issues pertaining to travelling at sea. Upon further analyses of the data, however, one shipping route revealed a difference in responsiveness for the same destination. This issue is highlighted in Figure
102 4.2 Findings for developing framework (Stage 2) Responsiveness POD Celar Aarhus Ajman CelarA NewarkNj Houston Antwerpen Baltimore Bangkok-Bmt. Bremerhaven CelarB Singapore Aarhus Toronto Busan Copenhagen Dakar Felixstowe CelarC Helsinki Fos-Sur-Mer Freeport Genoa CelarD NewYork Newark Halifax Helsingborg Helsinki Houston CelarE Liverpool Kobe JebelAli Kobe Liverpool London CelarF Antwerpen Xiamen Montreal Copenhagen LondonGateway Montoir-Bretagne Montreal NewYork CelarG Roterdam Baltimore Freeport Montreal Newark NewarkNj Novorossiysk CelarH Liverpool Montreal Vancouver Osaka Rauma Riga Roterdam CelarI Baltimore Osaka Zanzibar Singapore Sodertalje Teesport Toronto Avg.Daysonsea Vancouver Xiamen Yangon Zanzibar Figure 4.8: Responsiveness findings for Stage 2 87
103 4.2 Findings for developing framework (Stage 2) Montreal Celar Shippingline Orders CelarF HapagLloyd 1 2 Montreal Average37,00 Montreal CelarG MSC CelarH MSC Montreal Montreal Average46,37 Montreal Montreal Montreal Montreal Average47,12 Montreal Montreal Avg.Daysonsea Figure 4.9: Montreal Hapag Lloyd, a shipping company, travels on average, ten days less than the Mediterranean Shipping Company (MSC). There are two potential reasons for this: the first reason is that Hapag Lloyd has a better shipping vessel than MSC, which can travel faster at sea. The second reason is that the two shipping lines routes are different (See Figure 4.10 for different routes). This matter was presented to a freight forwarder participating in the study, who then confirmed that Hapag Lloyd travelled using Option 2 as a direct root (see Figure 4.10). Although the route takes an average of ten days faster than Option 1, this route will no longer be used as an direct root, unless it becomes more economically viable. No further complications arose during the analyses, which suggests that measuring responsiveness for the shipping vessels travelling at sea is not necessary for external benchmarking between cellars. 88

104 4.2 Findings for developing framework (Stage 2) Option 1 Option 2 Figure 4.10: Montreal route options Asset management efficiency SCC (2014) defines asset management efficiency as the ability to efficiently utilize assets. This includes the management of all assets in a company and their performance. The metrics selected for this attribute included capacity utilisation and IDOS. The latter metric was measured in Stage 1. This metric did not provide accurate results, and consequently, a better definition was provided and measured accordingly. A few changes were made to this metric for Stage 2. The metric received a demographic in order to distinguish the order type. In the feedback sessions after Stage 1, it was found that the IDOS depended on the kind of order placed. Two kinds of orders were identified, namely contracted bulk and spot bulk orders. Another change made to the metric was the period in which the data were captured. The period changed from quarter 2 in 2014, to the full year of 2014 (January 2014 to December 2014). Two demographics were identified during Stage 2, as mentioned. These two demographics cannot be compared to one-another since each of the two have different source or make cycle times. The first demographic, contracted bulk, is wine that is ordered in advanced before the end of harvest for that year. In other words, contracted bulk refers to all bulk wine that is sold in terms of a contracted agreement before the end of harvest. This represents a make-to-stock environment. The cellars are always aware 89
105 4.2 Findings for developing framework (Stage 2) when the wine will be shipped and can plan accordingly. Therefore, with contracted bulk there is substantial dwell time, but in the case of spot bulk, there is little to no dwell time. Dwell time is the time spent in the same stage of a process. For example, dwell time is the time bulk wine spends in storage after an order has been placed for that wine and until the wine is pumped into a flexitank. Some importers order 3 million litres at once, but request it to be delivered in different quantities during the year. Therefore, much dwell time occurs during these orders since the wine spends time in the same stage after the order has been placed. The second demographic is spot bulk. Bulk wine is considered to be spot bulk when wine is ordered during the year and the cellars have to react quickly to get the order ready. This represents a make-to-order environment. Therefore, there is little to no dwell time and the cellars have to react immediately to get the order shipped. Since the first demographic represents a make-to-stock situation and the second demographic represents a make-to-order setting, the two are not comparable to each other. Therefore, the two cycle times are also not comparable. The demographics are necessary and distinguish between different markets the cellars are involved in. Spot bulk would represent a cellar s responsiveness the best, since they have to respond and get the order ready immediately after the order has been placed. The metric s data were collected via a survey, namely SurveyMonkey Inc. (2015), which provided security, user-friendliness and was less intimidating for participants (See Appendix F for survey). The questions in the survey were designed to capture both cycle times. In Stage 1 s findings, it was found that each quarter represents a different order pattern. This could not be discovered in the data from Stage 1, but was highlighted during one of the feedback sessions for Stage 1 (Van Eeden, 2015). It was found that to be able to compare IDOS for contracted and spot bulk, the metric should be compared for each quarter. The results were collected via the survey and were evaluated. After evaluating the data, it was found that some cellars do not capture the data according to the two categories, yet they confirmed it is possible to extract the data according to the categories. The equation SCOR (Revision 11.0) used to determine the metric is: (5 point rolling average of gross value of inventory at standard cost) (Annual cost of goods sold) 365 days (4.2) 90
106 4.2 Findings for developing framework (Stage 2) Equation 4.2 was difficult to calculate, since each cellar calculates the value of their wine differently for insurance purposes. The numerator (value above the line) was calculated using different inventory at standard costs values for each cellar. This was problematic, seeing that the measure could not be used as a benchmark. The equation was then re-evaluated and redeveloped to conform to benchmarking standards. The equation used to determine this metric in Stage 2 is: (Average of inventory f or quarter i (litres)) (Inventory sold for quarter i (litres)) 90 days (4.3) W here i = 1, 2, 3 or 4 The results for Stage 2 s IDOS metric for bulk export (contracted and spot together) are detailed in Figure The cellars names are kept secret for non-disclosure reasons. The first matter to address is the sensibility that the data represents. It can be noted that IDOS in quarter 1 (1 Jan to 31 Mar) is far less than the other quarters. This is considered sensible, seeing that the store is nearly empty and ready for new wine to be produced during this quarter. The effect of the new wine produced can be seen in quarter 2 when a spike in IDOS occurs. After quarter 2, the IDOS slowly decreases as the wine is sold during the year. The survey s results revealed that the largest purchase of additional bulk was during quarter 4. 91
107 4.2 Findings for developing framework (Stage 2) Bulk(Quarter1) Celar CelarE CelarJ CelarN CelarO CelarP CelarR CelarJ CelarP CelarE CelarR CelarN Average(160,5) AverageIDOSforquater1(2014) CelarO Bulk(Quarter2) Celar CelarE CelarJ CelarN CelarO CelarP CelarR CelarO CelarR CelarJ AverageIDOSforquater2(2014) CelarE Average(287,2) CelarP CelarN Bulk(Quarter3) Celar CelarE CelarJ CelarN CelarO CelarP CelarR CelarJ CelarO CelarR Average(217,9) CelarE AverageIDOSforquater3(2014) CelarN CelarP Bulk(Quarter4) Celar CelarE CelarJ CelarN CelarO CelarP CelarR CelarJ CelarO CelarE Average(160,5) CelarR CelarP CelarN AverageIDOSforquater4(2014) CelarBE Nul NO YES Figure 4.11: Bulk IDOS results for Stage 2 92
108 4.2 Findings for developing framework (Stage 2) It should be noted in Figure 4.11 that all cellars, except cellar O (displayed as a red cross) follow a sensible pattern during each quarter. Upon further investigation, cellar O confirmed the data to be accurate and that the cellar indeed stores large quantities of wine during the first quarter for non-producer markets, namely Japan and UK. Cellar O cultivates their own grapes, but purchase majority of the grapes from other farms. They purchase grapes early in the year from the northern cape and produces wine, which is then immediately sold in large quantities (3-6 million litre) to the non-producing markets. Seeing that the data provided by the cellars was accurate, it was further inspected to determine the two demographics of IDOS. Figure 4.12 displays contracted bulk and Figure 4.13 displays spot bulk. From these figures it can be observed that two of the cellars contract 90% of their bulk wine, another two 50%, and one 20%. Analysing these two figures revealed a unique trend that not only proves the accuracy of the data, but also illustrates the difference between contracted and spot market focusses. As previously mentioned, contracted bulk is wine that is sold in terms of a contracted agreement. Thus, prior to producing wine, it is contracted and then shipped in different quantities during the year. In the case of spot bulk, cellars sell the wine to any market during the year and it would therefore be more laborious to sell. This reasoning can be seen in Figures 4.12 and Focusing on the cellars that contract 50% of their bulk wine (cellar R and P), it should be noted that these cellars IDOS for contracted bulk is an average of 48% less than for spot bulk. This confirms the rational that the spot market is less predictable, the wine is more difficult to sell, which in turn, creates a larger IDOS. Similarly, observing the cellar that contracts 20% of their bulk wine, it can be noted that the IDOS for their bulk wine is always above the average of the sample (See Figure 4.11). Also, by observing all cellars in Figure 4.11, it can be concluded that cellars competing in the spot market have on average 16% higher IDOS than contracted bulk. In light of these discoveries, contracted bulk and spot bulk are not comparable and should be measured separately. The figures indicate that cellar N has a high IDOS compared to other cellars competing in the contracted bulk market, when in fact, cellar N may have a low IDOS compared it to other cellars competing in the same market. Similarly, cellars that contract 50% of their bulk wine cannot be compared to those who contract 90% of their bulk wine. Although the data makes sense, their remain some unanswered questions regarding the accuracy of the data. Of course, when the total 93
109 4.2 Findings for developing framework (Stage 2) volume for spot bulk sales and contracted bulk sales are added, it would reflect the exact same volume as total export bulk sales. In some cases, however, it did not reflect the exact same quantities. Therefore, it is assumed that cellars estimated these values in some cases, but did not have the data on any system to accurately display it in a report. 94
110 4.2 Findings for developing framework (Stage 2) Contractedbulk(Quarter1) Celar CelarE CelarJ CelarN CelarO CelarP CelarR CelarN 20% AverageIDOSforquater1(2014) Celar Nul CelarR 50% Average110,5 Contractedbulk(Quarter2) Celar CelarE CelarJ CelarN CelarO CelarP CelarR CelarR 50% CelarJ 90% CelarA Average168,5 CelarB CelarE 90% CelarO 90% CelarP 50% AverageIDOSforquater2(2014) CelarE 90% Contractedbulk(Quarter3) Celar CelarE CelarJ CelarN CelarO CelarP CelarR CelarC CelarN 20% CelarR 50% Average116,0 CelarD CelarO 90% CelarE CelarP 50% CelarF CelarE 90% CelarG AverageIDOSforquater3(2014) CelarH Contractedbulk(Quarter4) Celar CelarE CelarJ CelarJ 90% CelarN CelarO CelarP CelarR CelarI Average82,6 CelarP 50% CelarE 90% CelarJ AverageIDOSforquater4(2014) CelarK CelarL CelarM CelarN CelarO CelarP CelarQ CelarR Figure 4.12: Contracted bulk IDOS results for Stage 2 (percentage are indication of contracted bulk) 95
111 4.2 Findings for developing framework (Stage 2) Spotbulk(Quarter1) Celar CelarE CelarJ CelarN CelarO CelarP CelarR CelarE 90% Average89,0 CelarR 50% CelarO 90% CelarN 20% AverageIDOSforquater1(2014) Spotbulk(Quarter2) Celar CelarE CelarJ CelarN CelarO CelarP CelarR CelarJ 90% CelarO 90% CelarE 90% CelarR 50% Average185, AverageIDOSforquater2(2014) CelarP 50% CelarN 20% Spotbulk(Quarter3) Celar CelarE CelarJ CelarN CelarO CelarP CelarR CelarJ 90% CelarO 90% CelarE 90% CelarR 50% Average139,8 CelarP 50% AverageIDOSforquater3(2014) CelarN 20% Spotbulk(Quarter4) Celar CelarE CelarJ CelarJ 90% CelarN CelarO CelarP CelarR CelarE 90% CelarO 90% Average111,8 CelarR 50% CelarP 50% CelarN 20% AverageIDOSforquater4(2014) Celar CelarE CelarJ CelarN CelarO CelarP CelarR Celar CelarE CelarJ CelarN CelarO CelarP CelarR Figure 4.13: Spot bulk IDOS results for Stage 2 (percentage are indication of contracted bulk) 96
112 4.3 Conclusions 4.3 Conclusions Many problems and challenges surfaced during Stages 1 and 2. These complications prevented the research team from gathering complete quantitative data that would have provide an added sense of validity to the ideal framework. The major challenges the research team experienced are listed below: ˆ The cellar s records contained little to no quantitative data that were required for the new framework. ˆ The participants, mainly the cellars, lacked supply chain knowledge. ˆ The cellars warehouse, production, financial systems, among others, were designed to present their data as one supply chain and not in a segmented manner. ˆ The freight forwarders lacked data that were required for the new framework. Although the quantitative data were insufficient, many challenges that the cellars experienced were brought to the attention of the research team. These led to important questions being asked in order to discover the root cause of these complications. Delving deeper into these complications revealed a true depiction of SA s wine industry comparing it to what it could, or should be. By asking these questions, it made professionals in the industry rethink the way they defined their supply chains, or to at least start thinking in a supply chain manner in order to define their supply chains. By viewing Table 4.5, it should be noted that quantitative data were available for Stage 1 and 2. Yet, although the data were available, the accuracy of the data seemed to lack. Not one metric received 100% accurate data, only partially accurate data. The latter also applies for the completeness of the data. Freight forwarders stored important files containing the data required for Stage 2 hard copy format, similar to the cellars. Therefore, collecting the information was an burdensome exercise and beyond the scope of the study. Seeing that Stage 1 and 2 derived greater value from the qualitative data, the ideal framework was based primarily on the results obtained from qualitative data. 97
113 4.3 Conclusions Table 4.5: Summary of data quality STAGE 1 Attribute Metric Data availability Completeness Consistency Accuracy Transparency Traceability Reliability Perfect Order Fulfilment P N Y N N Y Responsiveness Order Fulfilment Cycle Time P N Y N N N Agility Upside Supply Chain Flexibility N Cost Storage cost N Transportation cost Y Y Y Y N Y Asset Inventory days of supply P P N P N Y STAGE 2 Attribute Metric Data availability Completeness Consistency Accuracy Transparency Traceability Reliability % of orders delivered in full N Delivery performance commit date Y P Y P P Y Documentation accuracy N Perfect condition N Responsiveness Order date N Arrived at port N Estimated and actual time of departure Y Y Y P P Y Estimated and actual time of arrival Y Y Y P P Y Asset Bulk (Export) Y P P P P Y Spot bulk Y P N P P Y Contracted bulk Y P N P P Y Key Description Y Yes P Partially N No 98
114 Chapter 5 Developing ideal framework Contents 5.1 Reliability Responsiveness Agility Cost Asset Management Efficiency Conclusion The ideal framework is based on the quantitative and qualitative findings from Stage 1 and 2. Both the latter stages frameworks were developed using the data availability in the wine industry in order to obtain quantitative results. Some of these results were used to develop the ideal framework, but it was mostly the results of qualitative data that were used for the development of the ideal framework. As mentioned, the ideal framework is not based on the current data availability in the industry, but on an ideal situation were all data are available. The ideal framework includes all five of SCOR s attributes, seeing that they are trade-offs of one another. The ideal framework is a combination of metrics for each attribute and will be discussed below. 5.1 Reliability The cellars have a responsibility to their customers to deliver the correct quantity and quality of wine on time and with correct documentation. Since the majority of wine 99
115 5.1 Reliability is shipped with FOB Port of Cape Town INCOTERMS RO 2010, the cellar s responsibility stops after the wine is loaded onto the ship. Thereafter, the customer s (the importer s) responsibility starts. In addition, the cellar s wine is delivered at the customer s warehouse, which implies that the cellar is responsible for the correct quality and quantity of wine until then, but not the time of arrival and/or its documentation accuracy. Therefore, the customer experiences SA s cellar s time and documentation reliability until the wine is loaded onto the ship and the quantity and quality reliability throughout the shipping process (see Figure 5.1). For example, if the cellar did not add the correct amount of protein stabiliser to the wine, the wine will not taste the same after it has been on sea for roughly two weeks. This problem will only be discovered after the wine has been tasted, therefore the reliability regarding the quality of the wine should be measured again at the importers warehouse. Quantity and quality Grape growers Cellars Freight forwarders SA Port POD Client Customer Time and documentation accuracy Figure 5.1: Cellars responsibility regarding reliability Now that the cellars responsibilities have been identified with reference to the customer experience of the reliability of SA s cellars, measurements can be determined to record these events that will reveal where reliability issues may occur. The areas to be discussed first, are the time and documentation accuracy, respectively. Measurements were developed for each area that provide meaningful measures on which important business decisions can be based. As previously mentioned, the cellars are responsible for delivering the wine to the port on time. These events and dates should be recorded on both the cellar s and freight forwarder s systems. Both entities in the supply chain should record the following information regarding the time and date of events: ˆ Date the order was placed. ˆ Estimated time and date the wine should arrive at the Cape Town port. 100
116 5.1 Reliability ˆ Actual time and date the wine arrived at the Cape Town port. ˆ Estimated date the wine should be shipped from the Cape Town port. ˆ Actual time and date the wine was shipped from the Cape Town port. ˆ Estimated date the wine should arrive at POD. ˆ Actual time and date the wine arrived at POD. ˆ If late, what was the reason for not being on time. ˆ If the wine was rejected by the importer or DAFF, what was the reason. Recording these events would provide visibility in this section of the supply chain for both cellars and freight forwarders. In addition, reoccurring problems that hampered the customer s experience of SA s reliability can be revealed. These problems can be dealt with and SA s reliability will improve. Looking back at Figure 4.4, it should be noted that the reliability of SA, whether it is the shipping companies error, the cellar, or the weather, is poor. By recording these events, the root cause as to why these measurements are poor can be resolved. Documentation accuracy relates to all documentation supporting the order. This includes shipping, payment, compliance and other required documentation. Documentation between countries is vital, as without it, products cannot be delivered. Since documentation is a fundamental process for exporting wine, it should be measured strictly. The cellars and freight forwarders already realised this, and strict protocol have been implemented to avoid unnecessary documentation errors. However, a strict protocol will not always prevent error, since human error always plays a part. Therefore, each document in the shipping process should be recorded on the freight forwarder and cellars systems, as well as any problems that occurred. Again, this may prevent reoccurring problems, while the root cause of the problem can be established. Although the term FOB INCOTERMS RO 2010 suggests the importer takes full responsibility for the wine after it has been loaded onto the ship, the cellars play a large part in the quantity and quality of the wine. The cellars pump the wine into the flexitank, and are subjected to the quantity they inject. The wine may decrease in volume, seeing that wine is a Newtonian 1 liquid (Spitzer, 2012). Therefore, when wine 1 A Newtonian liquid decreases in viscosity and density when temperatures increase. 101
117 5.1 Reliability is shipped during summer from the warmer climates of Cape Town to cooler temperatures in the northern countries, the weight may differ, regardless of the different scales used in both countries. To ensure quality throughout the shipping process, a check-list should be developed to ensure that the processes for which the cellars are responsible, are executed correctly. The check-list can be modified uniquely to adhere to the wine specification. In addition, the check-list should be divided into two sections, namely the pre-loading and loading check-list (See Table 5.1 & 5.2); (Australia, 2015). Table 5.1: Pre-loading check-list (Australia, 2015) Check-list 1 Oxygen levels 5 Samples 2 Microbial stability 6 Pre-shipment approval 3 Organoleptic status 7 Container status 4 Wine chemistry status 8 Flexible containers (flexitank) Table 5.2: Loading check-list (Australia, 2015) Check-list 1 Oxygen levels 5 Seals 2 Temperature of wine 6 Samples 3 Ullage 7 Chemical and organoleptic status 4 Volume 8 Traceability In addition to the check-list, this list can be used to minimise human error and will provide accountability. This may enhance the customer s experience of SA s wine industry. Having these procedures in place will provide a sense of professionalism and security for the customers. Now that all four measurements have been discussed in relation to the SA wine industry, a summary displaying the measures for reliability, is provided in Table
118 5.2 Responsiveness Table 5.3: Summary of reliability measures Reliability issue Record until Measurement On time On ship Record the five dates and information regarding the delay, if any. Documentation accuracy On ship Record all shipping related documentation, as well as problems. Quantity Importers warehouse Measure quantity before and after shipping. Quality Importers warehouse Create check list and record these events. 5.2 Responsiveness The activities prior to shipping are mostly within the cellar s control. Briefly, the cellars have to prepare the wine for shipment, complete or outsource the necessary documentation, and give notice to deliver the wine at the port. Therefore, responsiveness is mostly the cellar s responsibility. Other problems may occur over which the cellars do not have control, such as trucks that do not arrive on time, a flexitank that is faulty or unclean, documentation that is incorrect, among others. However, those problems that the cellars do have control over can be prevented. These problems are not the cellar s fault, but the customer nonetheless experiences poor responsiveness as a result of these unforeseen events. For the ideal framework, the first section of responsiveness was measured from when the order was placed, to its arrival at the Cape Town port. The second section was measured from when the ship departed from Cape Town port to the POD. Although in Stage 2 the results indicated no problems with responsiveness regarding travelling at sea, this section of the supply chain should still be measured. At present, this part of the framework will not provide the cellars with a benchmark they can use to compare with each other, but it should be used in future when the SA bulk export framework is comparable to other southern hemisphere wine countries. Furthermore, as mentioned in Section 4.2.3, bulk can be divided into two demographics. The first demographic is contracted bulk and the second is spot bulk. In the case of contracted bulk orders, customers request orders during the year in different 103
119 5.2 Responsiveness quantities, depending on importers sales forecasting. Although the cellars expect the contracted wine to be shipped during the year, it sometimes occurs that an importer requests an order on short notice. The cellar will then prepare the order for shipment and request the correct documentation. In such an event, the responsiveness for contracted bulk and spot bulk would be comparable. In order to compare contracted and spot bulk in any event, dwell times should be recorded and excluded from the order cycle times. Seeing that the two demographics cycle times are comparable, both ought to be measured. Cellars competing in the contracted bulk market have, in most cases, more time to complete an order. Consequently, this reduces the pressure to prepare an order hastily, and therefore, this measurement will not benefit the cellars competing in the contracted bulk market as much as it would benefit those competing in the spot market. Similar to the on-time reliability measurement, the customer only experiences cellar s responsiveness until it is loaded onto the ship. Therefore, the responsiveness of a cellar will be measured only until the wine is loaded onto the ship. In order to measure this attribute, events needed to be identified that differentiate between time occurrences. The time stamps selected for bulk export that should be measured are: ˆ Time and date the order was placed. ˆ Time and date samples are send and received. ˆ Time and date the order was ready. ˆ Time and date the wine was pumped into the flexitank. ˆ Time and date the wine arrived at the Cape Town port. ˆ Time and date the wine was shipped from Cape Town port. ˆ Time and date the wine arrived at POD. ˆ Record of any dwell time during any stage. This will effectively provide the cellar with information regarding the different processes during the time the order was placed until it is on board the ship. This information can be used to identify stagnant areas that can be improved. For further investigation, cellars can add time occurrences, specifically during the first and second bullet, to adhere to cellar-specific processes. In conclusion, in order to compare the 104
120 5.3 Agility responsiveness of the cellar for spot and contracted bulk, dwell time should be recorded and should be excluded from the calculation. A summary displaying the measures for responsiveness, is provided in Table 5.4. Table 5.4: Summary of responsiveness measures Bulk order Record until Measurements Spot bulk POD Measure all eight data measure identified (Order fulfilment cycle time) Contracted bulk POD Measure all eight data measure identified (Order fulfilment cycle time) 5.3 Agility Briefly defined, flexibility is the organisation s general ability to react to external and a variety of other changes. In the SA wine industry, there are many changes the cellars have to consider with short-term or long-term effects. For example, when an order is changed from white to red wine, the cellar has to be flexible and respond to such a change. This is referred to as short-term flexibility. For long-term flexibility, consider the event where the harvest for the year has decreased with 10% from the previous year. With this change, the cellars have to adapt over a period regarding their storage, production facilities, raw material, and equipment, among many others. Similarly, when the harvest increases the cellars have to adapt to this change. Therefore, cellars also have to be flexible in the long-term. SA s wine production fluctuates every year, although it has been more consistent from 2011 (see Figure 5.2). Looking at bulk wine exports (See Figure 5.3), it can be noted that the demand for SA s bulk wine fluctuates vigorously. The main reason for this is that global harvests fluctuate and there is consequently a shortage or a surplus of wine in the international market. Therefore, a need exists to determine the cellar s exposure to market fluctuations. This will enable cellars to better utilise their assets and would, in essence, save money. 105
121 5.3 Agility % Increase/decrease (Wine produced) Volume (x 10 9 ) Percentage (%) Volume produced % Increase/decrease in wine production from the previous year Figure 5.2: Variation in wine produced per year (SAWIS, 2014a) Volume (x 10 8 ) % Increase/decrease (Bulk export) Percentage (%) Volume sold % Increase/decrease in bulk export from previous year Figure 5.3: Variation in bulk wine exported per year (SAWIS, 2014a) 106
122 5.3 Agility Cellars exporting wine in bulk aim to invest in long-term (1 year) customer contracts, providing them with the security to sell the majority of their wine. The local harvest fluctuates from year to year, and to forecast long-term sales for all available wine seems problematic. Prior to a harvest, the cellars are able to predict the volume and variety of wine that can be produced. This enables the marketing and sales teams to obtain contracts. The wine sold from long-term contracts represents the majority of the cellars production, but in most instances cellars have an excess of wine that needs to be sold. In the event where cellars do not have excess inventory to sell, it is generally the result of a poor local harvest where the wine that was produced was sold. A poor international harvest also affects SA s wine sales and would consequentially diminish SA s cellars excess wine. The 2012 drought in Italy is an example of such an event (Hall, 2012). The drought affected SA s wine exports and can be seen in the increase in volume of bulk exported from 2012 to 2013 (See Figure 5.3). The customers, who in this case are the individuals who purchase the bulk wine, do not necessarily want to commit to long-term contracts. There are a two main reasons for this, namely the global harvest fluctuations and consumers needs change. Therefore, cellars are predominately exposed to global harvests, which has a considerable effect on sales. Since cellars are exposed to factors that are not in their control, it is important to know how exposed each cellar is to these factors. This will indicate how flexible a cellar is towards market fluctuations over a period. One way to measure this is by evaluating the income statement and plotting it in a 2 x 2 matrix against export sales fluctuations. This metric was developed by using only qualitative data obtained during Stage 1 and 2. An undergraduate student conducted a dissertation on how to measure agility in the SA wine supply chain. It was concluded that no absolute metric could be used from the SCOR (Revision 11) guide that adheres to the wine industry and therefore, a new metric was developed for agility. Figure 5.4 is a simple illustration of a 2 x 2 matrix, where the y-axis is presented as the percentage exposure to market and the x-axis is the difference between SA s present year s export sales for bulk wine, and the previous years. The horizontal dotted purple line represents the average of all cellars exposure to the market, and can therefore change. Firstly, the SA bulk export sales will be discussed (x-axis), after which the cellars exposure to the market equation will be discussed (y-axis). Variability in sales for SA s bulk export market is determined by the difference in sales from the previous year and the present year s sales. For example, the total sales 107
123 5.3 Agility for quarter 1 in 2014 was 500, 000l and total sales for quarter 1 in 2015 was 512, 500l, indicating that the export sales have increased by 2.5%. This shows that the cellar s sales have increased from the previous year, and in general the cellar s gross profit would also increase. Next would be to determine how much the profit before tax has increased regarding the increase in sales. It is at this stage when a cellar would be able to determine how exposed their profit is to sales. In other words, how exposed the cellar s cash flow is towards sales fluctuations. If the previous example were to change and sales dropped by 2.5% from the previous year, the same could be argued for this prediction. Exposure to market (%) 2.5 Q 1 Q 2 y Low exposure Average exposure to market High exposure 1 (2.5;1) Q Q Bulk export variability (%) x Figure 5.4: 2 x 2 matrix to illustrate a cellar s exposure to the market In order to calculate the cellar s exposure to the market, an equation is required. The percentage exposure to market is calculated as follows: (y + 1)(Gross profit) + (Income ws Expenses ws ) = P rofit(1 + z) (5.1) 108
124 5.3 Agility W here z = 10% (Use when profit is positive) Or z = 10% (Use when profit is negative) And y = % Exposure to market ws = Expenses and income related to wine activities This formula will indicate with what percentage gross profit has to grow in order to increase the profit before tax with 10%. For example, if a cellar calculates x and obtains a value of 0.1%, the cellar s gross profit almost directly affects the profit before tax, which implies that the cellar s total sales has a large impact on profit before tax. Also, considering a cellar with a larger exposure to market percentage would indicate that the cellar is less exposed to the market, since it requires sales to increase with a larger margin before profit before tax has a similar effect to when exposure to market equals 0.1%. The only factors that are able to influence the profit before tax are sales, cost of goods sold, income and expenses. Equation 5.1 takes all those factors into account, except for tax percentage. In addition, only income and expenses related to wine sales, production and storage are used in this calculation. The reason for this is that some farms have many sources of income that are not related to the cellar s financial statements, for example, a restaurant. Also, the financial documents are kept separate and are independent from the pool system of the cellar. In some cases, the financial documents are not separated, which would indicate that the cellar is less exposed to the market than those whose financial documents are separated, since the extra income would decrease the exposure to market percentage (See Equation 5.2). y = P rofit (1 + z) (Income ws Expenses ws ) (Gross prof it) 1 (5.2) A few examples will now be provided to illustrate the effect of the 2 x 2 matrix. There are four examples explaining the effects for each quadrant in the matrix. Figure 5.4 represents a cellar who currently has had an increase in bulk export sales from the previous year. Using the previous example, where the bulk export sales increase from 500, 000l to 512, 500l from 2014 (Jan to Apr) to 2015 (Jan to Apr). This is indicated 109
125 5.3 Agility by the green dot, which represents the position of the cellar, that is positioned at 2.5% on the x-axis. Let us assume that the cellar has calculated their exposure to market percentage and obtained a value of 1%. This shows that the cellar is in quadrant three (Q3 ). After the cellar has identified their position on the matrix, conclusions can be drawn from this position on the 2 x 2 matrix. For example 1, the first matter that will be addressed is that the cellar is positioned below the exposure to market average and has a positive export sales compared it to the previous year (See Figure 5.4). This is considered to be a safe quadrant, since the cellar s export bulk sales is at an upward trend and it s exposure to the market is high. Therefore, a small percentage increase in gross profit, which implies that sales are increasing, will have a great positive effect on the profit before tax. Example 2 is where a cellar has a decrease in export bulk sales from 2014 to 2015 and has calculated the exposure to market as 1% (See Figure 5.5). This places the cellar in quadrant four (Q4 ). This is not considered to be an ideal quadrant, since the cellar is highly exposed to the market fluctuations and has a decrease in bulk export sales. Therefore, the decrease in sales almost directly impacts the profit before tax and is seen as a major disadvantage for the cellar. Exposure to market (%) y Q Q 2 Low exposure Average exposure to market High exposure (-5;1) 1 (2.5;1) Q Q Bulk export variability (%) x Figure 5.5: 2 x 2 matrix to illustrate a cellar s exposure to the market Example 3 shows a cellar which has a decrease in sales from 2014 to 2015, but has obtained an exposure to market value of 2.5%, placing the cellar in quadrant one (Q1 ); 110
126 5.3 Agility (See Figure 5.6). The exposure to market percentage is above the average and indicates that the value is higher than the average exposure to market of all cellars. Therefore, the cellar has a low exposure to the market, which is beneficial in this case, since the export bulk sales is showing a decreasing trend. The decreasing trend in sales could include factors that are not in the control of the cellar, for example a greater than normal harvest in the northern wine countries. If a year strikes where sales are very poor, it would be in the cellar s best interest to roam in Q1. Exposure to market (%) y (-5;2.5) Q Q 2 Low exposure Average exposure to market High exposure Q 4 (-5;1) Q Bulk export variability (%) x Figure 5.6: 2 x 2 matrix to illustrate a cellar s exposure to the market Now looking at the last example, example 4 : Here, the cellar is in quadrant two (Q2 ) with a increase in export bulk sales of 7.5% and an exposure to a market percentage of 2.5% (See Figure 5.7). This quadrant is also not an ideal position to be in, since the cellar s exposure is low and sales are increasing. Therefore, profit before tax would slowly increase where sales increase with a more rapid trend. It could be argued that the low exposure to the market is caused by the effects of the increase in sales, which would result in wine-related expenses to increase, such as outsourcing. Q2 is still more desirable than Q4, since the sales are in an upward trend. 111
127 5.3 Agility Exposure to market (%) y (-5;2.5) (7.5;2.5) Q Q 2 Low exposure Average exposure to market 1 High exposure Q Q Bulk export variability (%) x Figure 5.7: 2 x 2 matrix to illustrate a cellar s exposure to the market In summary, this 2 x 2 matrix only gives an indication as to where the cellar is positioned relative to the other cellars. Therefore, it is not a fixed measurement on which all strategic decisions should be based, but it can nonetheless support the decision-making of a cellar. For example, after a few years, the cellar would be able to determine whether they are mostly in the upper quadrants (Q1 & Q2 ) or in the lower quadrant (Q3 & Q4 ). The bulk export segment is highly dependent on the local and international harvest, and as such it is difficult to manipulate or change the cellar s position from the left quadrant (Q1 & Q4 ) to the right quadrant (Q2 & Q3 ); (See Figure 5.8). But the position from the upper to the lower quadrants and vice versa can be influenced by better management of the expenses. Expenses which can be better managed are mostly outsourcing expenses. In the case where SA s wine production is low, similar to the event in 2005 (See Figure 5.2), cellars production and storage facilities are under-utilised. In another case, where SA s wine production is high, the facilities are over-utilised. Therefore, it is important to find the acceptable point where facilities are utilised optimally over a long period. A figure that summarises this metric is shown below. 112
128 5.4 Cost Exposure to market (%) y Low exposure Q Q Average exposure to market High exposure Q Q Bulk export variability (%) x Figure 5.8: Summary of 2 x 2 matrix that illustrate a cellar s exposure to the market Furthermore, when the facilities are under-utilised the cellar would most likely be positioned in Q1 or Q4, depending on the previous year s sales. Since Q4 is not the ideal position to be in, the cellar should have an exit (or risk management) plan in order to shift to Q1. Specifically, the cellar has to effectively change its exposure to market percentage. In order to achieve this, more wine should be sold, the wine-related income should increase or wine-related expenses should decrease. Increasing sales is in this case, not an option to change, since the objective of the sales team is to sell all the wine. The challenge lies in changing the wine-related income and expenses. Cellars risk management plans should be able to turn under-utilised facilities into a profit. An example would be to outsource the under-utilized facilities, namely storage, and transport, among many others. If such operations do not exist for outsourcing, it could be an opportunity for cellars to invest in order to be flexible when the wine production or bulk export sales fluctuate. 5.4 Cost Of all the metrics, identifying cost metrics proved to be the most challenging. Numerous cost metrics were selected to form part of the cost attribute, however, this attribute is not restricted to the identified metrics. These metrics are listed below: ˆ Transportation cost 113
129 5.4 Cost ˆ Chemical, cleaning and filtration cost ˆ Labour (direct and indirect) cost ˆ Return cost ˆ Storage cost Cellars can select other cost metrics that would support a relationship between the cost attribute and other attributes in order to monitor the effect that other attributes have on cost. All attributes should be in balance, otherwise one attribute may advance at the expense of another, which will lead to overspending without realising the effect that attributes have on one another. It is therefore imperative that the cost attribute should be measured, but should only be used as an internal measure. The first metric to be discussed is transportation cost. In Stage 1, transportation cost was measured form the cellars to Cape Town port. In the ideal framework, transportation cost should include the shipping cost as well. The reliability and responsiveness of wine that is exported, is largely affected by the road transport, the flexitank provider, documentation, freight forwarders and shipping lines. As such, measuring all transportation costs up to POD would represent the reliability and responsiveness attributes effects on cost the best. The transportation cost can be broken down into more detail, providing a cost breakdown for each step of the transportation process. This is the cellar s choice, but for initial implementation purposes, the transportation cost should be seen as one metric without sub-divisions. In the event where this cost increases due to unknown reasons, the metrics can be sub-divided to identify the root cause of the problem. Importantly, this metric should be measured in R/litre to compare it internally. The next two cost metrics that were identified, are labour and chemical, cleaning and filtration costs. According to a survey conducted by PwC (2014), labour (direct and indirect) is the highest cost, whereas chemical, cleaning and filtration form the second highest cost (See Appendix G). Since these are major expenses for cellars participating in the bulk export segment, it should be monitored and measured in R/litre. This measurement is provided by PwC and can therefore be accessed from them, however, there would be a time delay in retrieving the data, and the data would also not be segmented. PwC conducts an annual survey, which allows cellars to access the information at that time. Therefore, cellars should measure these cost metrics themselves 114
130 5.4 Cost in order to track any trends that surface during the year, and also to capture the data in a segmented manner. As already mentioned, it rarely occurs that wine is rejected by the importer after it has been shipped, but there remain such events. In most cases, the wine is rejected before it leaves the port and, therefore, has a large impact on responsiveness and reliability of the cellars (van Wyk, 2015). These events should be recorded and accounted for. Therefore, the return cost was identified to form part of the cost metric. Not only can the effect of the return cost be seen in relation to the other attributes, but also with the monetary value lost due to wine that has been rejected by DAFF or the importer. The final cost metric identified, is storage cost. Since bulk is stored in tanks, the cost for storing wine will only include direct costs associated with the tanks that are used to store the wine. This includes the cost of leasing, rent, depreciation, acquisition, maintenance labour cost and expenses of internal and/or external maintenance. This metric is considered to be important, since the harvest fluctuates every year and the cellars are in some cases, out of storage space or in other cases, are under-utilising their storage capacity. Similar to the agility metric, decisions are based on the harvest fluctuations, and it is therefore important to know how much money would be lost if the cellars storage facilities are under-utilised. In addition to the latter, cellars would then be able to scale down and find an optimum utilisation point for their storage equipment. The money that will be saved can be used to outsource storage when needed. Bulk that is exported is stored in tanks and as such, the storage cost is simpler to calculate. This metric would also effectively provide a monetary value that will be saved if IDOS for bulk decreases. It is important that all cost measurements be measured in R/litre in order to compare these measurements to one another. The logistics of exactly what to include in each metric is subject to interpretation. Seeing that it is an internal benchmark, it is imperative that the metric is measured consistently throughout. This will allow the cellar s financial manager to identify a consistent trend between attributes. For example, the cellar wishes to be more responsive and they intend to outsource their flexitank provider, road transport and other related operations to be a top performer in the industry. This will ultimately have a great impact on cost. Hypothetically, the cellar would then be able to determine that a 5% increase in responsiveness would effectively increase transportation cost with 12%. The cellar can then evaluate whether this is an 115
131 5.5 Asset Management Efficiency option to venture into. Also, trends can be identified over periods of time. Similar to the previous example, if the cellar wishes to improve responsiveness and invest into that area of the company, responsiveness can improve, while showing an increase or decrease in cost. This will support the platform on which decisions are based, ultimately leading to better decision-making in the future. 5.5 Asset Management Efficiency The metrics selected to form part of the ideal framework for this attribute are IDOS for bulk export and cash-to-cash. These metrics will provide the cellars with internal visibility, on which business decisions can be based. IDOS for bulk export, will now be discussed followed by the cash-to-cash metric for the bulk export segment. IDOS should be measured in segments, as conducted in Stage 2. As previously mentioned, bulk export has two demographics, namely contracted and spot bulk. IDOS should be calculated with Equation 5.3 shown below. Although the results in Stage 2 for IDOS provided partially accurate data, the cellars had difficulty determining the volume of wine at the end of each month that was assigned to contracted and spot bulk. The cellars do not record the inventory of wine in a segmented manner. Therefore, it was a laborious process to obtain the data. In order to measure this metric effortlessly, cellars should record the inventory and sales of the wine in segments. This is a historical measurement and should be viewed in the way it has been illustrated in Figure 5.9. This figure represents one demographic, namely contracted bulk. (Average of inventory f or quarter i (litres)) (Inventory sold for quarter i (litres)) 90 days (5.3) W here i = 1, 2, 3 or 4 116
132 5.5 Asset Management Efficiency (Black arrow) (Month) Inventory for contracted bulk export at beginning of financial year (litres) Additional bulk purchased for contracted bulk export and work in process that became available (litres) Contracted bulk export sales (litres) Contracted bulk export not sold for the year (litres) Figure 5.9: Illustration of contracted bulk export volume flows As mentioned before, cellars do not know in which segment the wine will be sold. Therefore, by analysing the volume flows of wine for each segment at the end of a financial year or every month, the IDOS for each segment can be calculated. The IDOS for a segment can be calculated as illustrated in Figure = + Figure 5.10: Illustration of segment IDOS calculation The black arrow represents all wine not sold for the year. It is important to note that this only includes wine that was planned to be sold for the year. This excludes WIP, other liquors, grape juice and fortified wine. In Stage 2, cellars were asked to estimate a percentage of wine not sold for the year, which only included the wine that was planned to be sold for that year. The sample average of wine not sold for the year 2014, obtained a value of 13.3%. It is still unknown in which segment this wine would have been sold and therefore presents a problem for dividing the wine into segments. As such, an accurate method for dividing the unsold wine is to divide it relative to the year s sales for each segment. For example, a cellar sold 50% of the wine in the bulk export segment and the other half in the packaged export segment. The total volume of unsold wine would be halved and each half would be included in the respective seg- 117
133 5.5 Asset Management Efficiency mented IDOS calculations. The contracted bulk export sales (red arrow) can be determined by adding all sales during the year, or at the end of a month that pertains to this demographic. An identical calculation should be made for the additional bulk wine purchased or WIP that becomes available (green arrow) during the year or during the month. At the end of the financial year or month, the total sales minus the additional export bulk wine purchased, plus the unsold wine (black arrow), would provide an accurate indication of the bulk export segments inventory (blue arrow) at the beginning of the year or month (see Figure 5.10). In Stage 2, the cellars systems did not capture each order in a segmented manner and would have resulted in a cumbersome manual search procedure to accurately calculate IDOS. As already mentioned, IDOS should be calculated in a segmented manner and should be further divided into demographics. For the cash-to-cash metric, the bulk export IDOS should be used and not the two demographics. After the IDOS is calculated, there remain two other variables to calculate, namely days sales outstanding (DSO) and days payable outstanding (DPO). The SCOR (Revision 11) framework calculates cash-to-cash as follows: Cash-to-Cash Cycle Time = Inventory Days of Supply + Days Sales Outstanding (5.4) Days P ayable Outstanding DSO and DPO should be calculated in a similar manner as bulk export IDOS. In other words, both DSO and DPO should be segmented in order use this metric as a benchmark. At the end of the financial year or month, the financial manager should view the payment history of their creditors and debtors in order to calculate both DSO and DPO (see Equation 5.5 and 5.6). 5 point annual average of gross accounts receivable (T otal gross annual sales 365 days) (5.5) 5 point rolling average of gross payable (T otal gross annual material purchased 365 days) (5.6) 118
134 5.6 Conclusion After all three variables are calculated, the cash-to-cash metric can be calculated in a segmented manner. If cellars computer systems are configured to capture the data in segments, this metric will be effortless to calculate. At present, cellars systems do not, but are able to, capture the information in a segmented manner. Table 5.5 is a summary displaying the measures for assets management efficiency attribute. Table 5.5: Summary of assets management efficiency measures Bulk order Spot bulk Contracted bulk Bulk wine (contracted + spot bulk) Bulk wine Bulk wine Bulk wine Measurement IDOS IDOS IDOS DSO DPO Cash-to-cash 5.6 Conclusion In summary, the ideal framework was proposed that consists of five attributes, each of which received metrics that should be measured (See Table 5.6 for summary of idela framework and the primary outcomes of each attribute). Table 5.7 is a summary of all metrics, showing the frequency each metric should be measured and who is responsible to capture the data for that specific metric. In Table 5.8, each metrics definition is provided. 119
135 5.6 Conclusion Table 5.6: Ideal framework summary Attribute Metrics Data measures Primary outcomes of attribute Reliability 3 11 Satisfying customers experience Responsiveness 1 8 Create visibility by tracking time occurrences from when an order has been placed Agility 1 2 Better utilisation of facility and equipment Cost 5 5 Better decision making (opportunity cost) Assets 2 6 Improve inventory management Total
136 5.6 Conclusion Table 5.7: Proposed data capturing for ideal framework PHASE 3 (Ideal framework) Attribute Metric Frequency Responsibility Reliability Date the order was placed. Per order Cellar Estimated time and date the wine should arrive at the Cape Town port. Per order Cellar and FF Actual time and date the wine arrived at the Cape Town port. Per order Cellar and FF Estimated date the wine should be shipped from the Cape Town port. Per order Cellar and FF Actual time and date the wine was shipped from the Cape Town port. Per order Cellar and FF Estimated date the wine should arrive at POD. Per order FF Actual time and date the wine arrived at POD. Per order FF If late, what was the reason for not being on time. Per order Cellar If the wine was rejected by the importer or DAFF, what was the reason. Per order Cellar Pre-check list Per order Cellar Loading check list Per order Cellar Responsiveness Time and date the order was placed. Per order Cellar Time and date samples are send and received. Per order Cellar and DAFF Time and date the order was ready. Per order Cellar Time and date the wine was pumped into the flexitank. Per order Cellar and FF Time and date the wine arrived at the Cape Town port. Per order Cellar and FF Time and date the wine was shipped from Cape Town port. Per order Cellar and FF Time and date the wine arrived at POD. Per order FF Record of any dwell time during any stage. Per order Cellar Agility Exposure to market Monthly Cellar Fluctuations in bulk export sales Monthly Cellar Cost Transportation cost Monthly Cellar Chemical, cleaning and filtration cost Monthly Cellar Labour (direct and indirect) cost Monthly Cellar Return cost Monthly Cellar Storage cost Monthly Cellar Assets IDOS Monthly Cellar Cash-to-cash Monthly Cellar 121
137 5.6 Conclusion Table 5.8: Summary of definition for each metric Ideal framework - Bulk export Attribute Metric Definition Delivery performance Percentage of orders which all of the items are received by customer on-time. Reliability to customer commit date Documentation Percentage of orders which all of the items are received by customer with correct documentation. Perfect condition Percentage of orders delivered in undamaged state that meet specification, have the correct configuration, are faultlessly delivered and accepted by the customer. Responsiveness Order fulfilment cycle time The average actual cycle time consistently achieved to fulfill customer orders. For each individual order, this cycle time starts from the order receipt and ends with customer acceptance of the order. Agility Exposure to market (new metric) This is calculated with the exposure to market equation. Fluctuations in bulk export sales from year to year. Cost Transportation cost The cost associated with the physical transportation of goods between supply chain nodes. Purchased material The total cost of chemical, cleaning and filtration cost. cost Production labour cost The total cost associated with the personnel performing the activities of Make. Return cost The total cost of disposition of materials returned due to planning errors, supplier quality, production, order management, quality rejections and delivery errors. Storage cost The cost associated with tanks designed to support the fulfilment of customer orders. Asset IDOS-bulk export The amount of bulk export inventory expressed in days of sales. IDOS-contracted bulk The amount of contracted bulk export inventory expressed in days of sales. (Contracted bulk is wine that is ordered in advanced before the end of harvest for that year) IDOS-spot bulk The amount of spot bulk export inventory expressed in days of sales. (Spot bulk is wine that is ordered Days payable outstanding during the year, meaning not contracted bulk) The length of time from purchasing materials dry goods (bottles, labels, corks, capsules and boxes)until cash payments must be made expressed in days. Days sales outstanding The length of time from when a sale is made until the cash is received from customers. The amount of sales expressed in days. Cash-to-cash The time it takes for an investment made to flow back into a company after it has been spent for raw materials (focusing on bulk export segment). 122
138 Chapter 6 Conclusion Contents 6.1 Thesis summary Suggestions and recommendations for the industry Future directions This chapter consists of three sections. Section 6.1 contains a brief summary of each chapter comprising this thesis. Section 6.2 provides the industry with suggestions and recommendations in order to apply or commence with the ideal framework. Lastly, in Section 6.3, suggestions for future work are provided that will further enhance the ideal framework as it stands. 6.1 Thesis summary The introduction to the thesis, Chapter 1, provided and overview of the history of SA wine industry and followed with an informal discussion on the current status of SA s wine industry. It continued on to discuss the rational of the research, provided a problem statement, scope, as well as objectives of the study. The aim of Chapter 2 was to present the body of literature that provided the background to this study. The chapter presented the literature with a theoretical focus on supply chain concepts and management methods. The necessary literature on benchmarking was also provided, together with an implementation process. This process was used as a guideline for the development of the ideal framework and proved to be 123
139 6.2 Suggestions and recommendations for the industry appropriate for the wine industry. This chapter also contains relevant literature on performance measuring frameworks, and established SCOR to be the suited framework for this thesis. Chapter 3 presented a comprehensive overview of the methodology that was implemented in the present study, consisting of the background and scope of the study, followed by the thesis methodology. The thesis methodology consisted of three stages, of which the first and the second made alternative use of quantitative and qualitative data collection strategies. The data were collected via final year undergraduate projects, semi-structured and unstructured interviews, surveys and workshops. The data were analysed and the results were discussed in Chapter 4. Findings showed that the wine industry lacks quantitative data and consequently, the ideal framework was developed using mostly those results obtained from qualitative data. One of the main reason why cellars lacked quantitative data was due to the inadequacy of their systems. Cellars systems did not capture all the necessary data, but the team nonetheless requested the data in the form of segments. This also revealed that cellars are in some cases unaware of the activities that occur from production further down the supply chain. The ideal framework was not developed based on the availability of quantitative data, but was based on an ideal situation where all data would be available. This framework was further discussed in Chapter 5, including implementation strategies to apply these metrics in a cellar. 6.2 Suggestions and recommendations for the industry Chapter 5 proposed metrics for each attribute that would differentiate cellars competing in the bulk export segment from one another. The combination of metrics for each attribute represents the ideal framework. This framework is a tool that cellars in the industry should use to measure their own supply chains and to then compare their metrics to those of other cellars in order to identify areas lacking in their performance. This would enable cellars to improve logistical processes where they lack, whilst keeping them aligned with their strategy. This section aims to provide some practical guidelines for implementing the ideal framework.how a cellar should go about the process of starting a journey to measure their supply chain performance is explained next. The first step before measuring a cellars bulk export supply chain is to assign a 124
140 6.2 Suggestions and recommendations for the industry strategy to it. This strategy should be aligned with the market in which the cellar is competing. The strategy most cellars selected in the SA wine industry was having a reliable bulk export supply chain. The cellars deemed reliability as the superior performance attribute. Cellars may differ vastly in this, since the strategy mostly depends on the customer. The second step is to measure one performance attribute for initial implementation purposes. The attribute selected first should be aligned with the strategy assigned in the first step. For example, a cellar with a strategic focus to be reliable should first focus on that section of the framework. This enables cellars to improve the performance of the attribute most important to them. Whilst measuring a specific section in the framework, cellars are able to determine if the measurements are meeting their desired targets. If not, the root cause should be identified and dealt with. During the measuring or implementation phase of the framework, cellars can add measurements to the framework to conform to their specific processes in their supply chain. The third step follows after the framework has been implemented. Cellars should continue to measure and perform internal benchmarking, and then start their first improvement cycle, namely plan-do-check-act cycle. This is an iterative process cycle that can help improve the measuring and internal benchmarking results of a cellar. This enables them to track their performance over a period of time and react to that while measuring their progress. The time it should take to implement the above mentioned process is dependable on two factors. The first would be the number of resources assigned to this process, and secondly the current performance status of the cellars. After a sufficient number of cellars have performed internal benchmarking, cellars can in future perform external benchmarking to track their performance against the industrys performance. This in essence will advance the industry as a whole. The combination of metrics for each attribute represents the ideal framework. This framework is a tool that cellars in the industry should use to measure their own supply chains and to then benchmark their results to themselves or those of other cellars in order to identify areas lacking in their performance. This would enable cellars to improve logistical processes where they lack, whilst keeping them aligned with their strategy. Areas where cellars may lack are exposed, and corrective action for these 125
141 6.3 Future directions areas will commence. This will ultimately add value to the SA wine industry as a whole, seeing that each cellar corrects their problematic areas. Implementing this framework is seen as an independent effort from cellars to collaboratively improve all cellars supply chain performance, making the SA wine supply a new benchmark for exporting wine in bulk format. 6.3 Future directions As with most projects, there was insufficient time to cover all aspects of the industry. This section aims to provide suggestions for future work in order to develop an improved ideal framework. There are four main suggestions which should be addressed in future. These are discussed below: Suggestion 1: Apply agility metric and improve necessary gaps Seeing that the harvest, together with the total bulk exports of SA, fluctuates every year, the cellars have to adapt their facilities in order to adhere to these changes. For this reason, the student believes that the agility metric would be the differentiating factor. An agility metric was proposed in Chapter 5, but was never applied. Therefore, this metric needs further work to improve or refine the metric. Suggestion 2: be applied After data has been captured in segments, the ideal framework should During Stages 1 and 2, it was discovered that the cellars did not provide the necessary quantitative data required for this study. Therefore, the ideal framework was based primarily on qualitative data which was sufficient, seeing that a large portion of the wine and freight forwarder industries were represented in this study. In order to experience the full impact of the ideal framework, it should be applied using quantitative data. Thus, when cellars capture data in segments, the ideal framework can be applied. Suggestion 3: Refine cost metric for internal benchmarking and then refine cost metric to be used as an external benchmark At present, cost metrics are proposed in the ideal framework, however, it is not compulsory to measure the identified metrics. Financial data are considered to be highly 126
142 6.3 Future directions important and are not easily shared. Therefore, financial data should be measured internally. Many cellars will select the same cost metrics and other different metrics. In order to develop the cost metrics as an external benchmark, cellars should share financial data as well as the metrics they selected to measure. This will provide a selection of metrics to benchmark, of which only the most relevant will be selected for external benchmarking. Suggestion 4: The ideal framework should be compared on an international level For this thesis, the SA wine supply chain was divided into four supply chains. These supply chains were selected on the basis that they include various operations and information flows regarding all activities required to produce and supply wine. Future investigations should be conducted with the aim of identifying additional supply chains. In addition, each supply chain consisted of five attributes, each of which received demographics. A suggestion would be to identify additional demographics that would distinguish processes from one another and make distinctive processes comparable. Suggestion 5: The ideal framework should be compared on an international level Not only do SA s cellars compete against one another for market share in the bulk export segment, but SA s wine industry competes against other countries wine industries for global market share, especially against the southern hemisphere due to the seasonality nature of the agricultural product. SA s wine industry wishes to compare their overall performance against other countries, which will highlight their lack of performance. This could serve as a drive for improvement in order to enhance their processes and in essence, outperform competitors. Thus, the final suggestion is to compare the ideal framework on an international level in order to provide the industry with relevant data on which business decisions should be based. 127
143 References Akyuz, G.A. & Erkan, T.E. (2010). Supply chain performance measurement: A literature review. International Journal of Production Research, 48, pp , 41, 42 Australia, W. (2015). Bulk wine loading procedure. [Online], Available: https: // [2015, Sep 5]. xi, 102 Balanced scorecard institute (2015). Balanced scorecard basics. [Online], Available: About-the-Balanced-Scorecard [2015, Jan 27]. 42 Beamon, B.M. (1999). Measuring supply chain performance. International Journal of Operations and Production Management, 19, pp , 42 Bezuidenhout, F.A. (2014). South African producer co-operative wineries. [Online], Available: [2015, Jun 9]. 11, 137 Biophile Magazine (2011). South Africas wine industry: A horror story. [Online], Available: [2015, Jul 8]. 4 Camerinelli, E. (2009). Measuring the value of the supply chain. Ashgate publishing Company. 39 Carid, M., Moretto, A., Perego, A. & Tumino, A. (2014). The benefits of supply chain visibility: A value assessment model. Int. J.Production Economics, 151, pp CDM, E.B. (2015). Guidelines for quality assurance and quality control of data used in the establishment of standardized baselines. [Online], Available: unfccc.int/reference/guidclarif/meth/meth_guid46.pdf [2014, Aug 9]. xi, 36,
144 REFERENCES Chan, K.W. & Mauborgne, R. (2004). Blue ocean strategy. Harvard Business Review, 1, pp xi, 37, 38 Cheng, S.A. (2014). Coca Cola and its supply chain system. [Online], Available: http: //cmuscm.blogspot.com/2014/01/as-personwho-is-new-to-field-of-supply. html [2015, Jan 8]. ix, 22 Chopra, S. & Meindl, P. (2001). Supply Chain Management : Strategy, Planning and Operation. Prentice-Hall. 21 Creswell, J.W. & Clark, V.L.P. (2006). Design and conducting mixed methods reseach. SAGE Publications. 60 Dahlgaard, J.J., Kristensen, K. & Kanji, G.K. (1998). Fundamentals of total quality management. Chapman and Hall. 27, 29 Dollet, J.N. & Matalobos, A.D. (2010). Network orchestration in response to customized mass markets of premium wines and spirits. An International Journal, 11, p Estampe, D., Lamouri, S., Paris, J.L. & Brahim-Djelloul, S. (2010). A framework for analysing supply chain performance evaluation models. Int. J. Production Economics, 142, pp Forbes (2015). The world s biggest public companies. [Online], Available: fortune.com/fortune500/ [2015, July 8]. 23 Francis, J. (2009). Keeping SCOR in your supply chain : Benchmarking. presentation. ix, 48 Garcia, F., Marchetta, M., Camargo, M., Morel, L. & Forradellas, R. (2011). A framework form easuring logistics performance in the wine industry. Master s thesis, School of Engineering, National University of Cuyo, Centro Universitario. ix, 44, 48, 49, 50, 51, 59 Gilmore, D. (2011). How many supply chains do you need? [Online], Available: Supply_Chain_Segmentation.php?cid=5067 [2014, Jan 21]. 45 Glueck, J.J., Koudal, P. & Vaessen, W. (2006). Putting a premium on service. Deloitte Research, 1, p
145 REFERENCES Goode, J. (2013). A brief history of South African wine. [Online], Available: -a-brief-history-of-south-african-wine/ [2015, May 14]. 2, 3 Gordon, J. & Shohal, A. (2001). Assessing manufacturing plant compeditiveness: An emperical field of study. International journal of operations and production management, 21, pp Gunasekaran, A., Patel, C. & McGaughey, R.E. (2004). A framework for supply chain performance measurement. Int. J. Production Economics, 87, pp , 40, 42 Habib, M. (2011). Supply Chain Management (SCM): Theory and Evolution. Master s thesis, American International University - Bangladesh (AIUB). 20, 22 Hall, J. (2012). Wine prices to rise after dry weather in Spain and Italy. [Online], Available: Wine-prices-to-rise-after-dry-weather-in-Spain-and-Italy.html [2015, 4 Jun]. 12, 107 Handfield, R.B. & Nichols, E.L. (2002). Supply Chain Redesign: Transforming supply chian into integrated value systems. Financial Times Prentice Hall. 24 Harvey, L. (2006). Quality culture, quality assurance and impact. 27 Hodge, S. (2011). 10 Guiding principles for an effective performnace measuring measuring framework. [Online], Available: 10-guiding-principles-for-an-effective-performance-measurement-framework/ [2014, July 20]. 50 Howard, R. (1992). You need not be big to benchmark. Nation s, 80, p IBNET (2005). Benchmarking methodologies: The international benchmarking network for water and sanitation utilities. [Online], Available: PerformanceBenchmarking-StatisticalTechniques.php [2014, July 24]. 50 IWC (2014). Top fifteen wine-producing countries. [Online], Available: http: //italianwinecentral.com/top-fifteen-wine-producing-countries-2014/ [2014, Oct 28]
146 REFERENCES Jacobs, F.R., Chase, R.B. & Lummus, R.R. (2011). Operations and supply chain management. McGraw-Hill and Irwin, 13th edn. 31 JF Hillebrand (2014). JF Hillebrand SA: Export workshop In Workshop, Grande Roche Hotel. Paarl. 28 Aug Kanji, K. & Asher, M. (1996). 100 Methods for total quality management. Sage Publications. 27 Kaplan, R.S. & Norton, D.P. (1992). The balanced scorecard - measures that drive performance. Harvard Business Review, 7, pp , 43 Karlöf, B. & Östblom, S. (1994). Benchmarking: A signpost to excellence in quality and productivity. John Wiley and Sons Ldt. 30, 31, 32, 33, 35, 51 Keren, N., Harry, H., Mannan, W. & Mannan, S. (2004). Benchmarking moc practises in the process industry. Progress safety progress, 12, pp KWV (2013). Our history. [Online], Available: our-company/timeline?skip-screening=true [2015, May 15]. 2 Matthew, L. & Julian, K. (2010). Benchmarking and transparency: Incentives for the pharmaceutical industry s corporate social responsibilit. Journal of Business Ethics, 95, pp McCormack, K., Johnson, W.C. & Walker, W.T. (2003). Supply chain networks and business process orientation : advanced strategies and best practices. CRC Press LLC. xi, 25, 26 Michigan State University (2014). Broad college of business: Department of supply chain management. [Online], Available: msscm/definition [2014, July 18]. 22 Neely, A. (2002). Business performance measurement. Cambridge University Press. 40, 42 Nel, L., Dippenaar, K. & Hertog, R. (2015). Interview. JF Hillebrand, 26 Feb : Nienhaus, J., Ziegenbein, A. & Duijts, C. (2011). How human behaviour amplifies the bullwhip effect: A study based on the beer distribution game online. Centre for Enterprise Sciences (BWI), Swiss Federal Institute of Technology (ETH) Zurich and IBM Business Consulting Services AG
147 REFERENCES OIV (2014). International organisation of vine and wine. [Online], Available: [2014, Nov 3]. ix, 6, 7, 8 Parast, M.M. & Adams, S.G. (2012). Corporate socialresponsibility, benchmarking, and organizational performance in the petroleum industry:a quality management perspective. Int. J.Production Economics, 139, pp Perdue, R. (2004). Benchmarking in tourism and hospitality industries: The selection of benchmarking partners. Sage journals, 43, p Pero, M., Rossi, T., Noé, C. & Sianesi, A. (2010). An exploratory study of the relation between supply chain topological features and supply chain performance. Int. J. Production Economics, 87, pp Poirier, C. & Walker, I. (2005). Business porcess management applied: Creating the value management enterprise. J.Ross Publishing, Inc. 25 Ponte, S. & Ewert, J. (2007). South Africa wine: An industry in ferment. Tralac, 8, p.1. 3, 5, 135 PwC (2014). The South African wine industry: Insights survey [Online], Available: [2014, April 3]. 8, 14, 114, 155 Reid, R.D. & Sanders, N.R. (2013). Operations management: An integrated approach, vol. 5 of Edition International Student Version. Wiley. ix, 27, 28, 29 Rivera, J. (2015). The Gartner supply chain top 25 for [Online], Available: [2015, July 8]. 23, 139 Roberts, S. (2014). The advantages of the supply chain management for small companies. Demand Media, 1, p SAWIS (2013). World and local overview. 7, 8, 14 SAWIS (2014a). Exports 2014: Statistics. [Online], Available: za/info/stats_exports_2014.php [2014, Sep 29]. x, xi, 5, 6, 12, 13, 106 SAWIS (2014b). Production areas of South Africa. [Online], Available: sawis.co.za/cert/download/districts_-_jan_2014.pdf [2015, May 08]. ix, 6 132
148 REFERENCES SAWIS (2015). Final report - macroeconomic impact of the wine industry on the South African economy (also with reference to the impacts on the Western Cape). Available: -_Final_Report_Version_4_30Jan2015.pdf [2015, May 06]. 1 SCC (2013). Supply Chain Council: SSC and SCOR overview. [Online], Available: [2014, March 17]. ix, xi, 21, 44, 45, 46, 67 SCC (2014). Supply chain council. In Introducing all elements of the Supply Chain reference model: Standards for processes, metrics, practises and skill, Cape Town, South Africa. 27 May , 76, 77, 78, 82, 89 Shao, C. & Wang, L. (2010). Qualitative phase space reconstruction analysis of supply-chain inventory time series. South African Journal of Science, 106, pp Simpson, M. & Kondouli, D. (2000). A practicle approach to benchmarking in three service industries. Total quality management, 11, p Spitzer, D.W. (2012). How does an increase in temperature affect liquids? [Online], Available: how-does-an-increase-in-temperature-affect-liquids/ [2015, Sep 5]. 101 SurveyMonkey Inc. (2015). Palo Alto, California, USA. [Online], Available: www. surveymonkey.com [2015, Feb 15]. 63, 90 Taylora, W. & Wrightb, G. (2006). The contribution of measurement and information infrastructure to TQM success. The international journal of management science, 34, pp Transo (2013) Top 10 wine countries. [Online], Available: transowine.com/news/68-general/ top-10-wine-countries.html [2014, Oct 28]. 7 van der Merwe, A. (2009). A decision support system for scheduling the harvesting and wine making processes at a winery. Master s thesis, University of Stellenbosch. 3 van der Watt, G. & Lötter, J. (2015). Interview. Perdeberg winery, 3 Nov :
149 REFERENCES Van Eeden, J. (2015). Third workshop session. In Workshop, Laborie Wine Farm. Paarl. 2 Des , 90 Van Eeden, J., Louw, J., Goedhals-Gerber, L. & van Dyk, F. (2012). Wine supply chain survey 2012: Findings and challenges. Presentation. 10, 14, 56 van Lill, E. (2015). Interview. Outsource Logistics, 25 Feb :00. x, 70, 78, 83, 84 van Wyk, K. (2015). Interview. Department of Agriculture, Forestry and Fisheries, 28 Sep :00. 82, 115 van Wyk, S. (1989). Preliminary Wine Course. Cape wine acadamy. 2 van Zyl, N. (2015). Interview. Inter-Sped cape (pty) ltd, 15 May :00. xi, 58 VinPro (2014). South African wine industry directory. WineLand Media. 11 Watson, G.H. (1992). The benchmarking workbook: Adapting best practices for performance improvement. Productivity Press, Inc. 32, 33, 35, 51 Watson, S. (2015). Interview. JF Hillebrand, 8 May :00. x, 70, 83 Wei, H.L. & Wang, E.T. (2010). The strategic value of supply chain visibility: increasing the ability to reconfigure. European Journal of Information Systems, 19, pp WOSA (2014). Statistics. [Online], Available: worldwide.php [2014, Oct 30]. xi, 2, 4, 5, 11, 56 WOSA (2015). The industry overview. [Online], Available: The-Industry/Overview/ [2015, Jul 9]. 5 Zairi, M. (1992). Competitive benchmarking: An executive guide. Technical communications (Publishing) LTD. 30,
150 Appendix A Formal institution and organisations in the SA wine industry (Ponte & Ewert, 2007) 135
151 Table 12: FORMAL INSTITUTIONS AND ORGANISATIONS IN THE SOUTH AFRICAN WINE INDUSTRY Institution Acronym Established Members Mission Functions and positions Industry Association for Reponsible Alcohol Use ARA 1981 with a different name SAB, VinPro, Wine cellars SA, members of SALBA, and 50 associate members promotion of respnsible use of beverage alcohol representative authority and policy-making body on the social ascpects of alcohol consumption; supports stringent age limits on consumption (age 18), moderation in consumption as a quality of life factor, medical advise on consumption during pregnancy Black Association of the Wine and Spirits Industry Biodiversity & Wine Initiative Cape Estate Wine Producers Association Cape Winemakers Guild South African Black Vintners Alliance South African Society for Enology and Viticulture South African Wine and Brandy Company South Africa Wine Industry Council South African Wine Industry Information and Systems BAWSI 1998 BWI 2004 CEWPA 1968 CWG Started by eight founding members in 1982 SABVA black-owned businesses, 48 NGOs under RUDNET (Rural Development Network), 16 labour unions, farmworker co-ordinating council, other organizations and 'emerging farmers and taverners' 4 champions, 4 coops, 70 private wineries and conservation partners 111 units that are registered for the production of estate wine approximately 40 members, by invitation only 12 black-owned wine companies SASEV members SAWB SAWIC 2006 organizations representing wine industry constituencies board of directors has members from: VinPro, WCSA, Salba, labour, civil society, and emerging farmers SAWIS 1999 part of SAWB/SAWIC transforming the wine industry to make it representative of South African society conserving the biodiversity of the Cape Floral Kingdom to maintain and promote the unique postion of the estate as the pinnacle of the Wine of Origin system, and to represent the interests of its members in industry forums to nurture and develop members' winemaking expertise; to serve as benchmark of South African winemaking through the showcasing of members' wines creating an enabling environment for emerging black-owned wine companies to optimise the quality of SA grapes, wines and related products by distributing scientific knowledge enchance the strategic enviroment for the benefit of the industry: not available provides data and information to wine industry players and applies the wine of origin system mobilise individuals and interested parties from historicallydisadvanteged backgrounds for social upliftment of people on farms, implement fair labour practices, and empowerment of members prevent further loss of biodiversity in threatened habitat in crtitical sites in wine areas ; set aside areas as natural habitat; promote changes in farming practices that enhance the suitability of vineyards as habitats for biodiversity; Management committee with 11 elected and 2 co-opted members; 4 committee meetings a year and two general meetings. Lobbied for the establishment of estate demarcations in the 1973 SA Wine of Origin system. For nomination, a winemaker must have been responsible for producing outstanding wines for five years minimum and continue doign so; only those nominated that are voted positively by 2/3 by the AGM can enter; the CWG Auction is its annual showcase linking wine enterprises to business resources; develop a business model to ease entry into the wine industry for prospective enterpreneurs includes viticulturists, enologists, laboratories, scientists; publishes a scientific journal, organises meetings and disseminates information representative body of the wine industry; drew up the Wine Industry Strategy PLan (WIP); seeks to increase global competitiveness and profitability; generate quitable access and participation in the wine value chain; enable environmentally sustainable producction of wine emerged from the restructuring of SAWB; includes four business units: Winetech, SAWIS, WOSA and DTU (the Development and Transformation Unit), focusing the development of a Wine-BEE Charter one of the business unit of SAWB (now SAWIC) South African Wine Industry Trust SAWIT 1999 VinPro VinPro 2003 Vine Improvement Organisation Wine Cellars of South Africa Wine and Agricultural Ethical Trade Association Wine Industry Network for Expertise and Technology Wines of South Africa Wine and Spirit Board Independent vignerons VIO 1986 WCSA 2002 WIETA 2002 Winetech 1996, operational from 1999 trusteees appointed by the Minister of Agriculture 5000 bona fide wine producers KWV, Distell, TechnoGrow, VinPro, Nurserymen Association 56 cellars and wine marketers 128 grower and producer sites; 94 in wine industry (25 fully accredited) part of SAWB/SAWIC WOSA SA wine exporters WSB participants to the wine of origin and IPW schemes, Department of Agriculture, and Agricultural Research Council 45 independent grape growers transformation of the SA wine industry for the benefit of the historically disdvantaged wine farmers' service organization providing services and representation in wine industy bodies plant improvement and certification to establish an environment within which its members can optimally produce and market wine with consideration for other sectors of the industry improve the working conditions of employees in agriculture by promoting the adoption of and adherence to a code of good practice provide the industry with forefront technology and human resources to strenghten competitiveness and profitability generic marketing of South African wine abroad (from 2006, also promotion of wine domestically, and promotion of wine tourism) administers the wine of origin system comminucate the interests of independent grape growers and represent them in industry bodies created through agreement between KWV and the government to focus on the transformation of the wine industry in SA; includes 3 non-profit companies: BUSCO (Business Support Company); DEVCO (Development Support Company); and WIECO (Wine Industry Empowerment Company) formerly part of the service branch of KWV; provides services in viticulture, oenology, soil science, agro-economics and management executing the Plant Improvement Scheme for wine grapes; official body concerning vine propagation material Members represent about 75% of all wine sold in South Africa -- mostly cooperatives or former cooperatives; majority of these used to be part of KWK (Co-operative Wine Cellars Committee) and WBA (Wine Marketing Association) measures how agricultural producers are responding to the rights and obligations established in the labour legislation introduced after 1994 and assists them in ensuring compliance support the industry through expertise, training, education, technological innovation, scientific network generic marketing body falling under SAWB (now SAWIC); aims at building 'Brand South Africa' for wines; runs wine shows, keeps media informed, brings wine and lifestyle writers to the Cape runs tasting committees, administers the Integrated Production of Wine scheme, certfies wines and issues seals of certification; advises the Department of Agriculture on technical issues regarding wine and liquors initially, active in obtaining the right to sell grapes directly to wholesalers (before liberalisation); currently, mainly communicating with wholesalers on grape prices, contracts, strategies; provide market information to members; Source: Wineland, various issues, and fieldwork interviews
152 Appendix B Average prices of wine sold in bulk (Bezuidenhout, 2014) 137
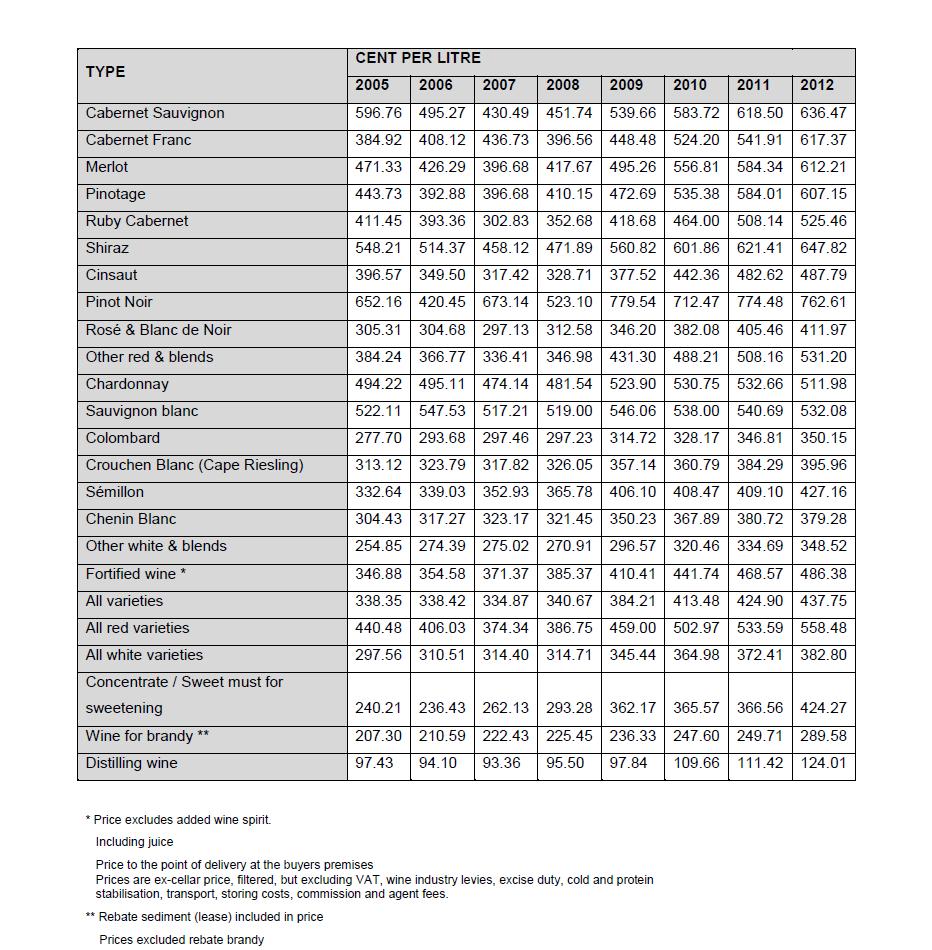
153 138
South African Wine Supply Chain Project
 3rd International Workshop on Food Supply Chain Making Food Supply Chains Efficient, Responsive and Sustainable South African Wine Supply Chain Project Joubert van Eeden 1, Esbeth van Dyk 2, Johan Louw
CHAPTER I BACKGROUND
 CHAPTER I BACKGROUND 1.1. Problem Definition Indonesia is one of the developing countries that already officially open its economy market into global. This could be seen as a challenge for Indonesian local
Foodservice EUROPE. 10 countries analyzed: AUSTRIA BELGIUM FRANCE GERMANY ITALY NETHERLANDS PORTUGAL SPAIN SWITZERLAND UK
 Foodservice EUROPE MARKET INSIGHTS & CHALLENGES 2015 2016 2017 2020 Innovative European Foodservice Experts 18, avenue Marcel Anthonioz BP 28 01220 Divonne-les-Bains - France 10 countries analyzed: AUSTRIA
OIV Revised Proposal for the Harmonized System 2017 Edition
 OIV Revised Proposal for the Harmonized System 2017 Edition TABLE OF CONTENTS 1. Preamble... 3 2. Proposal to amend subheading 2204.29 of the Harmonized System (HS)... 4 3. Bag-in-box containers: a growing
Grape Growers of Ontario Developing key measures to critically look at the grape and wine industry
 Grape Growers of Ontario Developing key measures to critically look at the grape and wine industry March 2012 Background and scope of the project Background The Grape Growers of Ontario GGO is looking
STATE OF THE VITIVINICULTURE WORLD MARKET
 STATE OF THE VITIVINICULTURE WORLD MARKET April 2015 1 Table of contents 1. 2014 VITIVINICULTURAL PRODUCTION POTENTIAL 3 2. WINE PRODUCTION 5 3. WINE CONSUMPTION 7 4. INTERNATIONAL TRADE 9 Abbreviations:
VINPRO PRODUCTION PLAN SURVEY 2015 (PART 2) Financial. Financial. indicatiors. indicators. of top performing wine grape producers
 Financial. Financial. indicatiors. indicators. of top performing wine grape producers") PHOTO: JANA LOOTS. 2015-CROP (PART 2) VINPRO PRODUCTION PLAN SURVEY 2015 (PART 2) Financial Financial indicatiors indicators of top performing wine grape producers Primary wine grape producers use precision
PHOTO: JANA LOOTS. 2015-CROP (PART 2) VINPRO PRODUCTION PLAN SURVEY 2015 (PART 2) Financial Financial indicatiors indicators of top performing wine grape producers Primary wine grape producers use precision
The state of the European GI wines sector: a comparative analysis of performance
 The state of the European GI wines sector: a comparative analysis of performance Special Report November 2017 1. Overview of a growing global wine market Wine is one of the most globalised products. The
STATE OF THE VITIVINICULTURE WORLD MARKET
 STATE OF THE VITIVINICULTURE WORLD MARKET April 2018 1 Table of contents 1. VITICULTURAL PRODUCTION POTENTIAL 3 2. WINE PRODUCTION 5 3. WINE CONSUMPTION 7 4. INTERNATIONAL TRADE 9 Abbreviations: kha: thousands
State of the Vitiviniculture World Market
 Punta del Este, November 19th, 2018 State of the Vitiviniculture World Market Jean-Marie Aurand Director General Topics Potential of viticultural production Production of grapes Production of wine Consumption
FREQUENTLY ASKED QUESTIONS (FAQS)
") FREQUENTLY ASKED QUESTIONS (FAQS) Table of Contents CAS FAQ... 4 1.1... CAS FAQ 4 2 1.1.1 What is Coffee Assurance Services (CAS)? 4 1.1.2 What is the vision of Coffee Assurance Services? 4 1.1.3 What
FREQUENTLY ASKED QUESTIONS (FAQS) Table of Contents CAS FAQ... 4 1.1... CAS FAQ 4 2 1.1.1 What is Coffee Assurance Services (CAS)? 4 1.1.2 What is the vision of Coffee Assurance Services? 4 1.1.3 What
HONDURAS. A Quick Scan on Improving the Economic Viability of Coffee Farming A QUICK SCAN ON IMPROVING THE ECONOMIC VIABILITY OF COFFEE FARMING
 HONDURAS A Quick Scan on Improving the Economic Viability of Coffee Farming 1 OBJECTIVES OF STUDY Overall objective Identify opportunities for potential benefits to coffee farmers from improved farm profitability
MBA 503 Final Project Guidelines and Rubric
 MBA 503 Final Project Guidelines and Rubric Overview There are two summative assessments for this course. For your first assessment, you will be objectively assessed by your completion of a series of MyAccountingLab
Is Fair Trade Fair? ARKANSAS C3 TEACHERS HUB. 9-12th Grade Economics Inquiry. Supporting Questions
 9-12th Grade Economics Inquiry Is Fair Trade Fair? Public Domain Image Supporting Questions 1. What is fair trade? 2. If fair trade is so unique, what is free trade? 3. What are the costs and benefits
A CELLAR FULL OF COLLATERAL: BORDEAUX v NAPA IN THE SEARCH FOR OENOLOGICAL GOLD
 A CELLAR FULL OF COLLATERAL: BORDEAUX v NAPA IN THE SEARCH FOR OENOLOGICAL GOLD Tom McCluskey, Dublin City University Stéphane Ouvrard, Kedge Business School, Ian Taplin, Wake Forest University. Introduction
Canada-EU Free Trade Agreement (CETA)
") Canada-EU Free Trade Agreement (CETA) The Issue: Following 5-years of negotiation, CETA was signed in principle on October 18, 2013, and signed officially by Prime Minister Trudeau on October 29, 2016,
Canada-EU Free Trade Agreement (CETA) The Issue: Following 5-years of negotiation, CETA was signed in principle on October 18, 2013, and signed officially by Prime Minister Trudeau on October 29, 2016,
Crisis Communications Protocol for the Wine Industry
 Crisis Communications Protocol for the Wine Industry 2017 Why this protocol Local and international media have a keen interest in the transformation and development of the South African wine industry.
Red wine consumption in the new world and the old world
 Red wine consumption in the new world and the old world World red wine market is expanding. In 2012, the total red wine trade was over 32 billion dollar,most current research on wine focus on the Old World:
North America Ethyl Acetate Industry Outlook to Market Size, Company Share, Price Trends, Capacity Forecasts of All Active and Planned Plants
 North America Ethyl Acetate Industry Outlook to 2016 - Market Size, Company Share, Price Trends, Capacity Forecasts of All Active and Planned Plants Reference Code: GDCH0416RDB Publication Date: October
Wine On-Premise UK 2016
 Wine On-Premise UK 2016 T H E M E N U Introduction... Page 5 The UK s Best On-Premise Distributors... Page 7 The UK s Most Listed Wine Brands... Page 17 The Big Picture... Page 26 The Style Mix... Page
Costa Rica: In Depth Coffee Report: COFFEE INDUSTRY STRUCTURE
 Costa Rica: In Depth Coffee Report: COFFEE INDUSTRY STRUCTURE COSTA RICA COFFEE INDUSTRY STRUCTURE 1 The Costa Rican Coffee Supply Chain Unlike most countries, in Costa Rica farmers don t process their
DETERMINANTS OF DINER RESPONSE TO ORIENTAL CUISINE IN SPECIALITY RESTAURANTS AND SELECTED CLASSIFIED HOTELS IN NAIROBI COUNTY, KENYA
 DETERMINANTS OF DINER RESPONSE TO ORIENTAL CUISINE IN SPECIALITY RESTAURANTS AND SELECTED CLASSIFIED HOTELS IN NAIROBI COUNTY, KENYA NYAKIRA NORAH EILEEN (B.ED ARTS) T 129/12132/2009 A RESEACH PROPOSAL
Introduction. Quantification of the marketing and distribution costs for the commercialization of Alsatian wine Work in progress
 Vineyard Data Quantification Society Quantification of the marketing and distribution costs for the commercialization of Alsatian wine Work in progress Laurent Grimal, Philippe Guerlain, Sylvie Rivot Université
Communications Protocol for the Wine Industry
 Communications Protocol for the Wine Industry 2017 Why this protocol Local and international media have a keen interest in the transformation and development of the South African wine industry. This protocol
Preliminary unaudited financial results for the full year ended 30 June Amount for this reporting period
 Marlborough Wine Estates Group Limited Results for Announcement to the Market Preliminary unaudited financial results for the full year ended 30 June 2017 Reporting Period 1st July to 30th June 2017 Previous
2017 FINANCIAL REVIEW
 2017 FINANCIAL REVIEW In addition to activity, strategy, goals, and challenges, survey respondents also provided financial information from 2014, 2015, and 2016. Select results are provided below: 2016
2016 China Dry Bean Historical production And Estimated planting intentions Analysis
 2016 China Dry Bean Historical production And Estimated planting intentions Analysis Performed by Fairman International Business Consulting 1 of 10 P a g e I. EXECUTIVE SUMMARY A. Overall Bean Planting
World vitiviniculture situation
 World vitiviniculture situation Surface area Grape Wine Global grape production Production Consumption Trade 2016 FAO-OIV Focus: Table and Dried Grapes 2 Global area under vines Area under vines in the
Overview of the Manganese Industry
 39th Annual Conference Istanbul, Turkey 2013 Overview of the Manganese Industry International Manganese Institute Alberto Saavedra Market Research Manager June, 2013 Introduction Global Production Supply,
J / A V 9 / N O.
 July/Aug 2003 Volume 9 / NO. 7 See Story on Page 4 Implications for California Walnut Producers By Mechel S. Paggi, Ph.D. Global production of walnuts is forecast to be up 3 percent in 2002/03 reaching
ICC September 2018 Original: English. Emerging coffee markets: South and East Asia
 ICC 122-6 7 September 2018 Original: English E International Coffee Council 122 st Session 17 21 September 2018 London, UK Emerging coffee markets: South and East Asia Background 1. In accordance with
and the World Market for Wine The Central Valley is a Central Part of the Competitive World of Wine What is happening in the world of wine?
 The Central Valley Winegrape Industry and the World Market for Wine Daniel A. Sumner University it of California i Agricultural l Issues Center January 5, 211 The Central Valley is a Central Part of the
(A report prepared for Milk SA)
") South African Milk Processors Organisation The voluntary organisation of milk processors for the promotion of the development of the secondary dairy industry to the benefit of the dairy industry, the consumer
South African Milk Processors Organisation The voluntary organisation of milk processors for the promotion of the development of the secondary dairy industry to the benefit of the dairy industry, the consumer
Ideas for group discussion / exercises - Section 3 Applying food hygiene principles to the coffee chain
 Ideas for group discussion / exercises - Section 3 Applying food hygiene principles to the coffee chain Activity 4: National level planning Reviewing national codes of practice and the regulatory framework
Handbook for Wine Supply Balance Sheet. Wines
 EUROPEAN COMMISSION EUROSTAT Directorate E: Sectoral and regional statistics Unit E-1: Agriculture and fisheries Handbook for Wine Supply Balance Sheet Wines Revision 2015 1 INTRODUCTION Council Regulation
The supply and demand for oilseeds in South Africa
 THIS REPORT CONTAINS ASSESSMENTS OF COMMODITY AND TRADE ISSUES MADE BY USDA STAFF AND NOT NECESSARILY STATEMENTS OF OFFICIAL U.S. GOVERNMENT POLICY Required Report - public distribution Date: GAIN Report
Sunflower seed COMMODITY PROFILE
 Contents 1. Description of the industry............................ 1 2. Marketing structure................................. 3 3. Strategic challenges................................ 6 4. Other information..................................
NAMC Presentation 8 MARCH Sharron Marco-Thyse Chairperson
 NAMC Presentation 8 MARCH 2012 Sharron Marco-Thyse Chairperson 1 The wine industry contributes some R163 billion a year to South Africa s GDP An additional R4.2 billion is generated annually through wine
DO YOU GROW WINE GRAPES, MAKE WINE OR PARTNER WITH THE WINE INDUSTRY?
 DO YOU GROW GRAPES, MAKE OR PARTNER WITH THE INDUSTRY? Vinpro represents 2 500 South African wine grape producers, cellars and wine-related businesses, while providing strategic direction, rendering specialised
Wine Intelligence for Vinisud
 Wine Intelligence for Vinisud Economic observatory of Mediterranean wines in international markets 19 th February 2018 Wine Intelligence 2018 1 I. Objectives and methodology II. Focus on the market (production
Global Wine Report SAN JOAQUIN VALLEY WINE GROWERS ASSOCIATION NOVEMBER 29, 2017 DEDICATED BROKERS IN 8 COUNTRIES
 Global Wine Report SAN JOAQUIN VALLEY WINE GROWERS ASSOCIATION NOVEMBER 29, 2017 DEDICATED BROKERS IN 8 COUNTRIES GLOBALLY BASED TO BUILD YOUR BUSINESS WORLDWIDE 1 INTRODUCTION Ciatti Co à 8 Regional Offices
HERZLIA MIDDLE SCHOOL
 NAME TEACHER S COMMENT TEACHER CLASS PARENT S COMMENT MARK PERCENTAGE PARENT S SIGNATURE HERZLIA MIDDLE SCHOOL GRADE 7 ECONOMIC & MANAGEMENT SCIENCES 27 AUGUST 2015 TIME: 50 minutes MARKS: 70 o This paper
GENERAL DESCRIPTION OF INDUSTRY AND COMPANY
 Appendix G Appendix Sample G: Import Business Business Plan: Otoro Plan: Import Company Otoro Import Company EXECUTIVE SUMMARY Otoro Imports is a spice importing and marketing corporation established in
By Type Still, Sparkling, Spring. By Volume- Liters Consumed. By Region - North America, Europe, Asia Pacific, Latin America and Middle East
 Global Bottled Water Market (Value, Volume): Analysis By Type (Still, Sparkling, Spring), By Region, By Country: Opportunities and Forecast (2018-2023) By Type Still, Sparkling, Spring By Volume- Liters
Chile. Tree Nuts Annual. Almonds and Walnuts Annual Report
 THIS REPORT CONTAINS ASSESSMENTS OF COMMODITY AND TRADE ISSUES MADE BY USDA STAFF AND NOT NECESSARILY STATEMENTS OF OFFICIAL U.S. GOVERNMENT POLICY Required Report - public distribution Date: GAIN Report
Sustainable Coffee Challenge FAQ
 Sustainable Coffee Challenge FAQ What is the Sustainable Coffee Challenge? The Sustainable Coffee Challenge is a pre-competitive collaboration of partners working across the coffee sector, united in developing
Work Sample (Minimum) for 10-K Integration Assignment MAN and for suppliers of raw materials and services that the Company relies on.
 for 10-K Integration Assignment MAN and for suppliers of raw materials and services that the Company relies on.") Work Sample (Minimum) for 10-K Integration Assignment MAN 4720 Employee Name: Your name goes here Company: Starbucks Date of Your Report: Date of 10-K: PESTEL 1. Political: Pg. 5 The Company supports the
Work Sample (Minimum) for 10-K Integration Assignment MAN 4720 Employee Name: Your name goes here Company: Starbucks Date of Your Report: Date of 10-K: PESTEL 1. Political: Pg. 5 The Company supports the
World Yoghurt Market Report
 World Yoghurt Market Report 2000-2020 Price: 1,800 /$2,200 The report contains 330 pages of valuable information Analysis of the current market situation and future possibilities in all regions of the
OPPORTUNITIES FOR SRI LANKAN ELECTRONIC PRINTED CIRCUITS IN TURKEY. Prepared by:
 OPPORTUNITIES FOR SRI LANKAN ELECTRONIC PRINTED CIRCUITS IN TURKEY Prepared by: Embassy of Sri Lanka Turkey December 2017 Table of Content 1.Summary... 3 2.Market Description... 3 3.Position of Sri Lankan
KOREA MARKET REPORT: FRUIT AND VEGETABLES
 KOREA MARKET REPORT: FRUIT AND VEGETABLES 주한뉴질랜드대사관 NEW ZEALAND EMBASSY SEOUL DECEMBER 2016 Page 2 of 6 Note for readers This report has been produced by MFAT and NZTE staff of the New Zealand Embassy
ETHIOPIA. A Quick Scan on Improving the Economic Viability of Coffee Farming A QUICK SCAN ON IMPROVING THE ECONOMIC VIABILITY OF COFFEE FARMING
 ETHIOPIA A Quick Scan on Improving the Economic Viability of Coffee Farming 1 OBJECTIVES OF STUDY Overall objective Identify opportunities for potential benefits to coffee farmers from improved farm profitability
Assessment of Management Systems of Wineries in Armenia
 International Wine Conference "Global Trends and Best Practices in the Wine World: Implications and Recommendations for Armenia" November 24, 2017 Assessment of Management Systems of Wineries in Armenia
Angela Mariani. University of Naples Parthenope
 Angela Mariani University of Naples Parthenope Workshop Mediterranean products in the global market Section 6: The global market for wine: issues and prospects p 17 June 2008 BRIEF COMMENTS ON THE FOLLOWING
Sustainability Initiatives in Other Tropical Commodities Dr. Jean-Marc Anga Director, Economics and Statistics Division
 0 International Cocoa Organization Sustainability Initiatives in Other Tropical Commodities Dr. Jean-Marc Anga Director, Economics and Statistics Division 1 Sustainable Development 1983: Brundtland Commission
THE ECONOMIC IMPACT OF MODEL WINERIES IN TEXAS. Industry Report
 THE ECONOMIC IMPACT OF MODEL WINERIES IN TEXAS Industry Report by Pati Mamardashvili, PhD International School of Economics at Tbilisi State University, Tbilisi, Georgia Tim Dodd, PhD Texas Tech University,
More information at Global and Chinese Pressure Seal Machines Industry, 2018 Market Research Report
 Report Information More information at https://www.htfmarketreport.com/reports/1320915 Global and Chinese Pressure Seal Machines Industry, 2018 Market Research Report Report Code: HTF1320915 Pages: 150
M03/330/S(2) ECONOMICS STANDARD LEVEL PAPER 2. Wednesday 7 May 2003 (morning) 2 hours INSTRUCTIONS TO CANDIDATES
 ECONOMICS STANDARD LEVEL PAPER 2. Wednesday 7 May 2003 (morning) 2 hours INSTRUCTIONS TO CANDIDATES") c PROGRAMA IB DIPLOMA PROGRAMME PROGRAMME DU DIPLÔME DU BI DEL DIPLOMA DEL BI M03/330/S(2) ECONOMICS STANDARD LEVEL PAPER 2 Wednesday 7 May 2003 (morning) 2 hours INSTRUCTIONS TO CANDIDATES! Do not open
c PROGRAMA IB DIPLOMA PROGRAMME PROGRAMME DU DIPLÔME DU BI DEL DIPLOMA DEL BI M03/330/S(2) ECONOMICS STANDARD LEVEL PAPER 2 Wednesday 7 May 2003 (morning) 2 hours INSTRUCTIONS TO CANDIDATES! Do not open
OUR MARKET RESEARCH SOLUTIONS HELP TO:
 CONSUMER INTELLIGENCE AND INSIGHTS ON THE SA WINE INDUSTRY 31 MAY 2011 1 COMPANY OVERVIEW We are MARKET RESEARCH AND CONSUMER INTELLIGENCE EXPERTS who ensure you make smarter, more-profitable decisions
Pasta Market in Italy to Market Size, Development, and Forecasts
 Pasta Market in Italy to 2019 - Market Size, Development, and Forecasts Published: 6/2015 Global Research & Data Services Table of Contents List of Tables Table 1 Demand for pasta in Italy, 2008-2014 (US
Tea Statistics Report 2015
 Tea Statistics Report 215 Introduction This report presents the scope and scale of the UTZ tea program in 215. Throughout this report tea also includes rooibos unless otherwise specified. The statistics
Global Hot Dogs Market Insights, Forecast to 2025
 Report Information More information from: https://www.wiseguyreports.com/reports/3366552-global-hot-dogs-market-insights-forecast-to-2025 Global Hot Dogs Market Insights, Forecast to 2025 Report / Search
Roaster/Production Operative. Coffee for The People by The Coffee People. Our Values: The Role:
 Are you an enthusiastic professional with a passion for ensuring the highest quality and service for your teams? At Java Republic we are currently expanding, so we are looking for an Roaster/Production
DO YOU GROW OR BUY WINE GRAPES, AND MAKE WINE FROM IT?
 DO YOU GROW OR BUY GRAPES, AND MAKE FROM IT? Vinpro represents 2 500 South African wine grape producers, cellars and wine-related businesses, while providing strategic direction, rendering specialised
DELIVERING REFRESHING SOFT DRINKS
 BEVERAGES DIVISION DELIVERING REFRESHING SOFT DRINKS Swire Beverages manufactures, markets and distributes refreshing soft drinks to consumers in Hong Kong, Taiwan, Mainland China and the USA. 46 215 PERFORMANCE
ANALYSIS OF THE EVOLUTION AND DISTRIBUTION OF MAIZE CULTIVATED AREA AND PRODUCTION IN ROMANIA
 ANALYSIS OF THE EVOLUTION AND DISTRIBUTION OF MAIZE CULTIVATED AREA AND PRODUCTION IN ROMANIA Agatha POPESCU University of Agricultural Sciences and Veterinary Medicine, Bucharest, 59 Marasti, District
2018 World Vitiviniculture Situation. OIV Statistical Report on World Vitiviniculture
 2018 World Vitiviniculture Situation OIV Statistical Report on World Vitiviniculture Introduction This report has been prepared by the Statistics department of the International Organisation of Vine and
2013 Annual Quantification Report: Media Feedback Report Coffee in South Africa
 2013 Annual Quantification Report: Media Feedback Report Coffee in South Africa 30 September 2013 Product Definitions Wine Pure Ground Pure Instant Mixed Ground Mixed Instant Definition This product comprises
Buying Filberts On a Sample Basis
 E 55 m ^7q Buying Filberts On a Sample Basis Special Report 279 September 1969 Cooperative Extension Service c, 789/0 ite IP") 0, i mi 1910 S R e, `g,,ttsoliktill:torvti EARs srin ITQ, E,6
World vitiviniculture situation
 World vitiviniculture situation Surface area Grape Wine Global grape production Table and dried grapes Production Consumption Trade 2017 OIV Focus: Vine varietal distribution in the world 2 Global area
Candidate Agreement. The American Wine School (AWS) WSET Level 4 Diploma in Wines & Spirits Program PURPOSE
 WSET Level 4 Diploma in Wines & Spirits Program PURPOSE") The American Wine School (AWS) WSET Level 4 Diploma in Wines & Spirits Program PURPOSE Candidate Agreement The purpose of this agreement is to ensure that all WSET Level 4 Diploma in Wines & Spirits candidates
The American Wine School (AWS) WSET Level 4 Diploma in Wines & Spirits Program PURPOSE Candidate Agreement The purpose of this agreement is to ensure that all WSET Level 4 Diploma in Wines & Spirits candidates
Contents 1. Introduction Chicory processing Global Trends in Production, Producer Prices and Trade of Chicory...
 i ii Contents 1. Introduction... 1 2. Chicory processing... 1 3. Global Trends in Production, Producer Prices and Trade of Chicory... 3 4. SA s Production, Producer Prices, Gross Value and Trade Patterns
Brazil Milk Cow Numbers and Milk Production per Cow,
 TABLE OF CONTENTS 1. Brazil 1.1. Brazil Milk Market Introduction 1.1.1. Brazil Cow Milk Market Production and Fluid Milk Consumption by Volume, 1.1.2. Brazil Milk Cow Numbers and Milk Production per Cow,
LEAN PRODUCTION FOR WINERIES PROGRAM
 LEAN PRODUCTION FOR WINERIES PROGRAM 2015-16 An Initiative of the Office of Green Industries SA Industry Program and the South Australian Wine Industry Association, in association with Wine Australia South
Paper Reference IT Principal Learning Information Technology. Level 3 Unit 2: Understanding Organisations
 Centre No. Candidate No. Surname Signature Paper Reference(s) IT302/01 Edexcel Principal Learning Information Technology Level 3 Unit 2: Understanding Organisations Wednesday 3 June 2009 Morning Time:
Commercial Representation in China Service description
 Commercial Representation in China Service description Selling wine in China Enter the largest market in the world The Chinese market is one of the largest in the world in import of wine, and continues
For personal use only
 ABNN 78 052 179 932 Company Announcements Australian Securities Exchange 24 February 2016 Australian Vintage Half Year Result to 31 December 20155 Branded Sales Dry Profit up by 80% % Key Points Net Profit
OPPORTUNITIES FOR SRI LANKAN VIRGIN COCONUT OIL IN TURKEY
 OPPORTUNITIES FOR SRI LANKAN VIRGIN COCONUT OIL IN TURKEY Prepared by: Embassy of Sri Lanka, Turkey June 2017 CONTENTS 1. SUMMARY... 3 2. MARKET DESCRIPTION... 3 3. POSITION OF SRI LANKAN VIRGIN COCONUT
GLOBAL ECONOMIC VITIVINICULTURE DATA
 Paris, 23 October 2014 GLOBAL ECONOMIC VITIVINICULTURE DATA 271 mhl of wine produced in 2014 With a reduction of 6% compared with the previous year, world wine production has returned to an average level
Sample. TO: Prof. Hussain FROM: GROUP (Names of group members) DATE: October 09, 2003 RE: Final Project Proposal for Group Project
 DATE: October 09, 2003 RE: Final Project Proposal for Group Project") Sample TO: Prof. Hussain FROM: GROUP (Names of group members) DATE: October 09, 2003 RE: Final Project Proposal for Group Project INTRODUCTION Our group has chosen Chilean Wine exports for our research
Sample TO: Prof. Hussain FROM: GROUP (Names of group members) DATE: October 09, 2003 RE: Final Project Proposal for Group Project INTRODUCTION Our group has chosen Chilean Wine exports for our research
Certified Coffees, current market and a vision into the future.
 Certified Coffees, current market and a vision into the future. To talk about certification programs in coffee today, we must first look into the past history of the coffee trade and identify when and
Guidelines for Unified Excellence in Service Training
 G.U.E.S.T Program ADVANCED V1.4 Guidelines for Unified Excellence in Service Training CULTIVATING SEVEN STAR STANDARDS IN LUXURY SERVICE & HOSPITALITY OPERATIONS ON-BOARD SUPER YACHTS Specifications, Learning
Starbucks / Dunkin Donuts research. Presented by Alex Hockley and Molly Fox. Wednesday, June 13, 2012
 F& H Starbucks / Dunkin Donuts research Presented by Alex Hockley and Molly Fox Executive Summary: These days there are a significant amount of coffee establishments located in Center City, Philadelphia.
1) What proportion of the districts has written policies regarding vending or a la carte foods?
 What proportion of the districts has written policies regarding vending or a la carte foods?") Rhode Island School Nutrition Environment Evaluation: Vending and a La Carte Food Policies Rhode Island Department of Education ETR Associates - Education Training Research Executive Summary Since 2001,
Rhode Island School Nutrition Environment Evaluation: Vending and a La Carte Food Policies Rhode Island Department of Education ETR Associates - Education Training Research Executive Summary Since 2001,
2. The proposal has been sent to the Virtual Screening Committee (VSC) for evaluation and will be examined by the Executive Board in September 2008.
 for evaluation and will be examined by the Executive Board in September 2008.") WP Board 1052/08 International Coffee Organization Organización Internacional del Café Organização Internacional do Café Organisation Internationale du Café 20 August 2008 English only Projects/Common
WP Board 1052/08 International Coffee Organization Organización Internacional del Café Organização Internacional do Café Organisation Internationale du Café 20 August 2008 English only Projects/Common
Marketing Strategy and Alliances Analysis of Starbucks Corporation
 Liberty University DigitalCommons@Liberty University Faculty Publications and Presentations School of Business 2009 Marketing Strategy and Alliances Analysis of Starbucks Corporation Rebecca Lingley Liberty
1. Continuing the development and validation of mobile sensors. 3. Identifying and establishing variable rate management field trials
 Project Overview The overall goal of this project is to deliver the tools, techniques, and information for spatial data driven variable rate management in commercial vineyards. Identified 2016 Needs: 1.
Sustainable Coffee Economy
 Seeking a Balance Sustainable Coffee Economy Brazilian initiatives and experience Environmental Sustainability Respecting the limits of capacity Economic Sustainability support of ecosystems Rational and
Peaches & Nectarines and Cherry Annual Reports
 THIS REPORT CONTAINS ASSESSMENTS OF COMMODITY AND TRADE ISSUES MADE BY USDA STAFF AND NOT NECESSARILY STATEMENTS OF OFFICIAL U.S. GOVERNMENT POLICY Required Report - public distribution Date: GAIN Report
BVM PROSPECTUS. DAMIAN ADAMS Ph E MIKE CROAD Ph E
 BVM PROSPECTUS Berakah Vineyard Management is a market leader in all aspects of vineyard operations, from vineyard establishment through to cost-leading vineyard management and wine company relationship
Wine Clusters Equal Export Success
 University of Wollongong Research Online Faculty of Commerce - Papers (Archive) Faculty of Business 2004 Wine Clusters Equal Export Success D. K. Aylward University of Wollongong, daylward@uow.edu.au Publication
Company Coverage. Country Coverage. Global Coverage. Regional Coverage
 Global Food Service Market: Analysis By Type (Full Service Restaurants, Cafe and Bars, QSRs, Fast Casual Restaurants, Others), By Full Service Restaurant (Fine Dining, Casual Dining), By Region, By Country
The Economic Impact of Wine and Grapes in Lodi 2009
 The Economic Impact of Wine and Grapes in Lodi 2009 Prepared for the Lodi District Grape Growers Association and the Lodi Winegrape Commission May 2009 A S T O N E B R I D G E R E S E A R C H R E P O R
COUNTRY PLAN 2017: TANZANIA
 COUNTRY PLAN 2017: TANZANIA COUNTRY PLAN 2017: TANZANIA VISION2020 PRIORITIES AND NATIONAL STRATEGY PRIORITIES Vision2020 SDG s No poverty Quality education Gender equality Decent work Responsible Production
C O R P O R AT E S T R AT E G Y U P D AT E. October, 2018
 C O R P O R AT E S T R AT E G Y U P D AT E October, 2018 FORWARD LOOKING STATEMENTS This presentation contains forward-looking statements, that should be considered as good faith estimates. Such statements
WP Board 1035/07. 3 August 2007 Original: English. Projects/Common Fund
 WP Board 1035/07 International Coffee Organization Organización Internacional del Café Organização Internacional do Café Organisation Internationale du Café 3 August 2007 Original: English Projects/Common
Food and beverage services statistics - NACE Rev. 2
 Food and beverage services statistics - NACE Rev. 2 Statistics Explained Data extracted in October 2015. Most recent data: Further Eurostat information, Main tables and Database. This article presents
WORKING GROUP ON TEA TRADE AND QUALITY. Intersessional Meeting of the Intergovernmental Group on Tea Rome, 5-6 May 2014
 WORKING GROUP ON TEA TRADE AND QUALITY Intersessional Meeting of the Intergovernmental Group on Tea Rome, 5-6 May 2014 Intersessional Meeting of the FAO/IGG ON TEA WORKING GROUP ON TEA TRADE & QUALITY
China Coffee Market Overview The Guidance For Selling Coffee In China Published November Pages PDF Format 420
 China Coffee Market Overview 2009 2010 The Guidance For Selling Coffee In China Published November 2009 102 Pages PDF Format 420 Order online at: http://www.drinksector.com/basket.asp?idreport=76&basketaction=auto
MARKETING OF AGRICULTURAL PRODUCTS ACT, 1996 (ACT No. 47 OF 1996) ESTABLISHMENT OF STATUTORY MEASURE: RECORDS AND RETURNS IN RESPECT OF DRIED FRUIT
 ESTABLISHMENT OF STATUTORY MEASURE: RECORDS AND RETURNS IN RESPECT OF DRIED FRUIT") R. 1344 Marketing of Agricultural Products Act (47/1996): Establishment of a statutory measure: Records and returns in respect of dried fruit 40376 STAATSKOERANT, 28 OKTOBER 2016 No. 40376 19 DEPARTMENT
R. 1344 Marketing of Agricultural Products Act (47/1996): Establishment of a statutory measure: Records and returns in respect of dried fruit 40376 STAATSKOERANT, 28 OKTOBER 2016 No. 40376 19 DEPARTMENT
The Market Potential for Exporting Bottled Wine to Mainland China (PRC)
") The Market Potential for Exporting Bottled Wine to Mainland China (PRC) The Machine Learning Element Data Reimagined SCOPE OF THE ANALYSIS This analysis was undertaken on behalf of a California company
The Market Potential for Exporting Bottled Wine to Mainland China (PRC) The Machine Learning Element Data Reimagined SCOPE OF THE ANALYSIS This analysis was undertaken on behalf of a California company