Genetic structure in cultivated grapevines is linked to geography and human selection.
|
|
|
- Gavin Francis
- 5 years ago
- Views:
Transcription


1 Genetic structure in cultivated grapevines is linked to geography and human selection. Roberto Bacilieri, Thierry Lacombe, Loic Le Cunff, Manuel Di Vecchi-Staraz, Valerie Laucou, Blaise Genna, Jean-Pierre Peros, Patrice This, Jean-Michel Boursiquot To cite this version: Roberto Bacilieri, Thierry Lacombe, Loic Le Cunff, Manuel Di Vecchi-Staraz, Valerie Laucou, et al.. Genetic structure in cultivated grapevines is linked to geography and human selection.. BMC Plant Biology, BioMed Central, 2013, 13 (25), 33 p. < / >. <hal > HAL Id: hal Submitted on 20 Aug 2015 HAL is a multi-disciplinary open access archive for the deposit and dissemination of scientific research documents, whether they are published or not. The documents may come from teaching and research institutions in France or abroad, or from public or private research centers. L archive ouverte pluridisciplinaire HAL, est destinée au dépôt et à la diffusion de documents scientifiques de niveau recherche, publiés ou non, émanant des établissements d enseignement et de recherche français ou étrangers, des laboratoires publics ou privés.
2

3 BMC Plant Biology This Provisional PDF corresponds to the article as it appeared upon acceptance. Fully formatted PDF and full text (HTML) versions will be made available soon. Genetic structure in cultivated grapevines is linked to geography and human selection BMC Plant Biology 2013, 13:25 doi: / Roberto Bacilieri Thierry Lacombe Loïc Le Cunff Manuel Di Vecchi-Staraz Valérie Laucou Blaise Genna Jean-Pierre Péros Patrice This Jean-Michel Boursiquot ISSN Article type Research article Submission date 7 January 2013 Acceptance date 31 January 2013 Publication date 8 February 2013 Article URL Like all articles in BMC journals, this peer-reviewed article can be downloaded, printed and distributed freely for any purposes (see copyright notice below). Articles in BMC journals are listed in PubMed and archived at PubMed Central. For information about publishing your research in BMC journals or any BioMed Central journal, go to Bacilieri et al. This is an open access article distributed under the terms of the Creative Commons Attribution License ( which permits unrestricted use, distribution, and reproduction in any medium, provided the original work is properly cited.
4 Genetic structure in cultivated grapevines is linked to geography and human selection Roberto Bacilieri 1* * Corresponding author roberto.bacilieri@supagro.inra.fr Thierry Lacombe 1,2 thierry.lacombe@supagro.inra.fr Loïc Le Cunff 3 loic.lecunff@supagro.inra.fr Manuel Di Vecchi-Staraz 2 mdvs@mdvs.it Valérie Laucou 1 valerie.laucou@supagro.inra.fr Blaise Genna 2 blaise.genna@supagro.inra.fr Jean-Pierre Péros 1 jean-pierre.peros@supagro.inra.fr Patrice This 1 patrice.this@supagro.inra.fr Jean-Michel Boursiquot 4 jean-michel.boursiquot@supagro.inra.fr 1 Institut National de la Recherche Agronomique, UMR 1334 AGAP Amélioration génétique et adaptation de plantes, équipe DAVEM, 2 Place P. Viala, Montpellier, France 2 INRA - Domaine de Vassal. Ancienne route de Sète, Marseillan Plage, France 3 Institut Français de la Vigne et du Vin - Unité Mixte Technologique Géno- Vigne, 2 Place P. Viala, Montpellier, France 4 Montpellier SupAgro, UMR 1334 AGAP Amélioration génétique et adaptation de plantes, équipe DAVEM, 2 Place P. Viala, Montpellier, France
5 Abstract Background Grapevine (Vitis vinifera subsp. vinifera) is one of the most important and ancient horticultural plants in the world. Domesticated about 8 10,000 years ago in the Eurasian region, grapevine evolved from its wild relative (V. vinifera subsp. sylvestris) into very diverse and heterozygous cultivated forms. In this work we study grapevine genetic structure in a large sample of cultivated varieties, to interpret the wide diversity at morphological and molecular levels and link it to cultivars utilization, putative geographic origin and historical events. Results We analyzed the genetic structure of cultivated grapevine using a dataset of 2,096 multi-locus genotypes defined by 20 microsatellite markers. We used the Bayesian approach implemented in the STRUCTURE program and a hierarchical clustering procedure based on Ward s method to assign individuals to sub-groups. The analysis revealed three main genetic groups defined by human use and geographic origin: a) wine cultivars from western regions, b) wine cultivars from the Balkans and East Europe, and c) a group mainly composed of table grape cultivars from Eastern Mediterranean, Caucasus, Middle and Far East countries. A second structure level revealed two additional groups, a geographic group from the Iberian Peninsula and Maghreb, and a group comprising table grapes of recent origins from Italy and Central Europe. A large number of admixed genotypes were also identified. Structure clusters regrouped together a large proportion of family-related genotypes. In addition, Ward s method revealed a third level of structure, corresponding either to limited geographic areas, to particular grape use or to family groups created through artificial selection and breeding. Conclusions This study provides evidence that the cultivated compartment of Vitis vinifera L. is genetically structured. Genetic relatedness of cultivars has been shaped mostly by human uses, in combination with a geographical effect. The finding of a large portion of admixed genotypes may be the trace of both large human-mediated exchanges between grape-growing regions throughout history and recent breeding. Background Cultivated grapevine, Vitis vinifera subsp. vinifera, is one of the major horticultural crops worldwide. Domesticated from the dioecious taxon V. vinifera subsp. sylvestris [1-4], the modern grape is today more diverse and heterozygous than its wild relative [5-8]. The combined action of selection, breeding, admixture and migration is believed to have shaped the cultivated compartment, possibly starting from multiple gene pools during domestication [9,10]. Humans certainly selected traits related to fertility, blossom drop (coulure), productivity, berry size, sugar and acidity content [4,11,12], since these are keys for successful grape production. Similarly, hermaphroditism has been strongly selected for, almost to complete fixation, as self-pollinating plants achieve higher fruit production. Other
6 traits were also probably selected, such as shoot habit, tolerance to biotic and abiotic stress, adaptation to local environment, and cuttings ability. Vegetative propagation is indeed believed to have been adopted early in the domestication process [11]. Large-scale grafting, in contrast, was only implemented at the end of the 19 th century, after the introduction of Phylloxera in Europe [13]. A slow selection process of promising local landraces early in domestication, followed by direct breeding and selection from the end of the Middle Age onwards, may have favored the emergence of family clusters of cultivars [14,15]. Finally, human-mediated movements of seeds and cuttings occurred even over long distances and were the means of grape extension to the New World, followed by selection and adaptation to local conditions [4]. The combination of such factors has most probably structured modern grapevine genetic diversity. Up to now, studies searching for genetic structure in grapevine have been based on samples either relatively small (up to a few hundred) [5,9,10,16] or geographically limited [17]. Myles et al. [18], exploring SNP polymorphism in a set of 583 cultivars (404 of which had known geographic origin), found a weak East west structure gradient; however their sample was under-representing some important regions (Caucasus, Spain, North Africa) and therefore could not be fully conclusive about genetic structure of the entire cultivated grapevine gene pool. Thus, the analysis of genetic structure in the largest grapevine collection available worldwide (INRA Vassal, France) could enable us to better understand the extent and distribution of grape diversity and how mankind shaped it. In addition, structure analysis is a prerequisite for deciphering complex traits in genetic resources using association genetics, a methodology that already yielded interesting results in grape [19,20]. The extensive diversity of grapevine [8] and recent progresses in DNA analysis technologies make genome-wide association genetics over hundreds of accessions the next target for grapevine research. Therefore, population structure analysis is today all the more pivotal. The genetic material maintained at the French grapevine collection of Vassal [21] has been built up over the last 140 years through a large network of international partnerships. More than 5,000 accessions of Vitis vinifera have been morphologically and agronomically characterized [22] and historically documented. Using twenty microsatellite markers at linkage equilibrium [23], Laucou et al. [8] identified 2,323 unique genotypes in this collection. Microsatellite markers (or Simple Sequence Repeats, SSR) are indeed suitable to better understand the genetic structure of cultivated plants [24-26]. The main objectives of the present study were to understand the genetic diversity of cultivated grapevine and how humans molded it over the years, and to provide a description of genetic structure that could be used to select genotype samples appropriate for further genetic association studies. We used a subset of 2,096 microsatellite genotypes from the Vassal database, without missing data and with at least two allele differences. Statistical tests were conducted to control the possible effects of sampling, in particular the bias that could arise from oversampling one geographical region or one family group. We analyzed the structure using two different methods of clustering, the first based on a Bayesian approach [27], and the second using Ward s hierarchical clustering method [28,29]. We also compared the genetic diversity and family relatedness within the clusters at different levels of ancestry. Finally, to interpret population structure in relation to both cultivar use and
7 history, we characterized the clusters using the geographic origin of cultivars and their phenotypic characteristics. Results Diversity Our sample of 2,096 cultivated genotypes (Additional file 1: Table S1) displayed from 5 to 34 alleles per locus, with a total of 324 alleles over the 20 loci, an unbiased expected heterozygosity (He) of 77% and a mean polymorphism information content (PIC) of (Additional file 2: Table S2). Owing to the large number of loci with moderate allele frequencies, the single parent exclusion probability was quite high ( ). Population structure The similarity pattern among the 10 STRUCTURE analysis replicates (Figure 1) and Evanno s K s statistics (Additional file 3: Figure S1) indicated K s = 3 and K s = 5 as the most pertinent levels of population subdivision. No converging solutions were identified for the subsequent Ks levels (6 to 12), which were therefore not further considered with STRUCTURE. Figure 1 Similarity index among STRUCTURE runs. Similarity index among runs for each STRUCTURE K-level, and its confidence intervals (10 runs for each K). Using a threshold of >85% for group assignation, 1,001 genotypes (out of the 2,096) were assigned to a cluster at K s = 3 and 817 at K s = 5. The proportion of admixed genotypes was thus large, i.e. 52% and 61% of the total number of cultivars, at K s = 3 and K s = 5 respectively. Since the repartition of genotypes from the different regional groups was not equilibrated (Table 1), we tested STRUCTURE sensitivity to the effect of sampling, comparing the full genotype collection (set 1: 2,096 genotypes) to a subset of set 1 with equilibrated geographic groups (set 2: 888 randomly chosen genotypes, Table 1). Genotype partitioning in STRUCTURE subgroups was stable between the two different samplings, the individual K- scores for set 2 being almost perfectly correlated to those of set 1 for K s = 3 (r 2 = 0.97, p < ) and K s = 5 (r 2 = 0.98, p < ). Instabilities among repeated runs were found at K s = 4 and K s = 6, both within and between set 1 and set 2. Because of these coherent results, all subsequent analyses were based on the full set of 2,096 genotypes (set 1).
8 Table 1 Composition of the cultivar groups used in the analysis Group Name Group Code Subgroup Name Subgroup Code Countries a Number of cultivars Number of cultivars for testing sampling effect b Maghreb MAGH Maghreb MAGH DZA, MAR, TUN Iberian Peninsula IBER Iberian Peninsula IBER ESP, PRT Western & WCEUR Western Europe WEUR BEL, FRA, GBR, NLD Central Europe Central Europe CEUR AUT, DEU, CHE, CZE, SVK, TCH Italian Peninsula ITAP Italian Peninsula ITAP ITA Balkans BALK Eastern Europe EEUR BGR, HUN, ROU Balkan Peninsula BALP BIH, CYP, GRC, HRV, SCG, YUG Russia & Ukrain RUUK Russia & Ukrain RUUK MDA, RUS, UKR, URS Eastern Mediteranean & Caucasus EMCA Caucasus & Turkey CAUC ARM, AZE, GEO, TUR Near East NEAS EGY, ISR, LBN, SYR, Middle & Far East MFEAS Middle East MEAS IRN, YEM Central Asia & Far East FEAS AFG, CHN, IND, JPN, KAZ, TJK, TKM, UZB New World Vineyard NEWO New World Vineyard NEWO ARG, AUS, CHL, MEX, PER, USA, ZAF Non determined ND Non determined ND a According to the ISO alpha 3 codes ( b Sub-sample build with the aim to study a possible effect of differences in sample size among geographic regions, on STRUCTURE analysis. Countries of origin were grouped into larger regional groups, for easiness of representation and statistical tests.
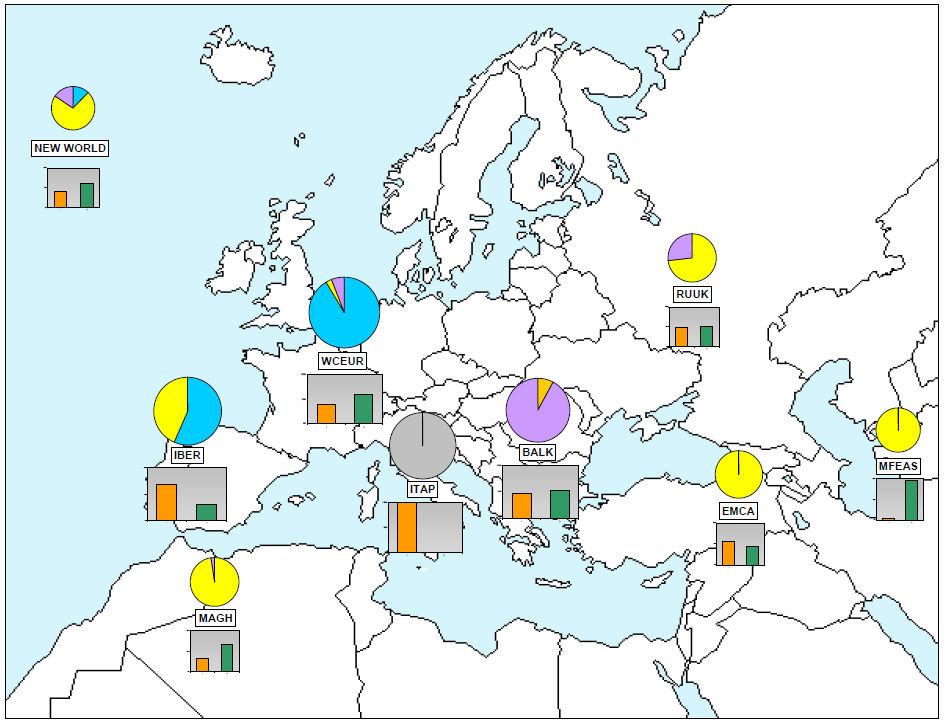
9 Geographic origin and viticultural traits of the identified subgroups STRUCTURE clustering at K s = 3 highlighted three well-distinct groups (Figure 2, Additional file 4: Table S3): Figure 2 Characterization of the STRUCTURE groups. Characterization of the STRUCTURE groups according to geography and use. - a Western Europe group (S-3.1) of wine cultivars (93%) containing 55% of the Western and Central Europe genotypes, without any Asian, Balkans or Maghreb cultivars; - a East group (S-3.2) mostly composed of table cultivars (71% of table grapes and 9% of double-use cultivars), including 96% of the Far- and Middle-East genotypes, notably all genotypes from Uzbekistan (n = 33), Afghanistan (8), Tajikistan (4), Turkmenistan (4) and Iran (23), as well as 66% of the Eastern Mediterranean and Caucasus cultivars, and almost no Western and Central Europe cultivars (less than 2%). Interestingly, 43% of the cultivars from Maghreb were positioned within this group; - a Balkan and Eastern Europe group (S-3.3) of mostly wine cultivars (71%), with 34% and 60% of the varieties from the Balkans and East Europe, and less than 4% Western Europe cultivars. The relationship between the different clusters and cultivar geographical origin was analyzed (Figure 3). The Eastern Mediterranean & Caucasus (EMCA), Middle & Far East (MFEAS) and Maghreb (MAGH) geographic groups (Table 1) were composed almost exclusively of genotypes clustered in the S-3.2 STRUCTURE genetic group; the Western & Central Europe (WCEUR) and the Balkans (BALK) geographic groups were also mainly composed of genotypes from their corresponding STRUCTURE group (S-3.1 and S-3.3, respectively). By contrast, the Russian, Iberian and New World cultivars were distributed in several STRUCTURE genetic groups. For K s = 3, it is worth noting that 100% of the Italian cultivars were assigned to the admixed class, while the Middle and Far East group displayed a very low level of admixture (3.6%). Apart from its meaningful geographic distribution, the admixed group was composed of even proportions of wine or table cultivars, of black, red or white color grapes, and of aromatic or non-flavored grapes. Figure 3 Genetic composition of the geographic groups. Genetic composition of the geographic groups for the Ks = 3 of STRUCTURE. For the detailed country list, see Table 1. The histograms represent the percentage of non-admixed (green) versus admixed (orange) genotypes. For the non-admixed cultivars, the pies represent the proportion of each cluster in each region: Table / East (yellow); Wine / Balkans and East-Europe (pink); Wine / West and Central Europe (blue). As 100% of the Italian genotypes are admixed, the ITAP pie is empty (grey). The clustering at K s = 5 (Figure 2, Additional file 4: Table S3) identified in addition an Iberian and Maghreb group (S-5.1), and a group comprising mostly table grapes (80%) of recent origin, also called obtentions, from Italy and Central Europe (S-5.4). The group S- 5.1 derived partially from the S-3.2 group (41% of the varieties), with Iberian varieties composing 69% of the group. The group S-5.4 mostly derived from the admixed Ks = 3 group (78% of the varieties).
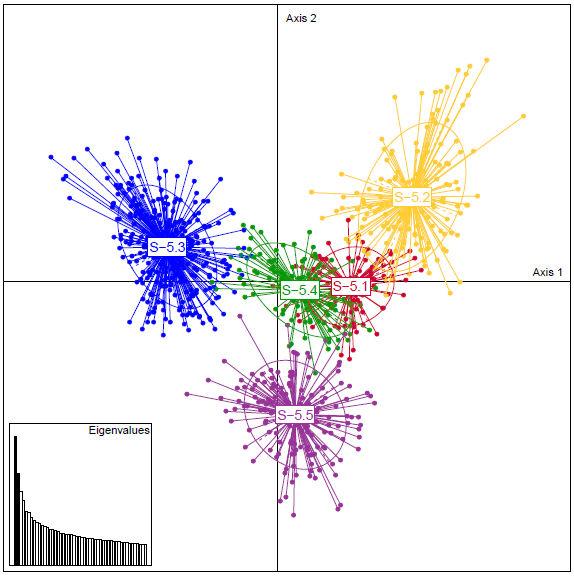
10 Axes 1 and 2 of a PCA on SSR data of the genotypes belonging to Ks = 5, explaining 30.3% and 21.4% of the total variance respectively (Figure 4), clearly separated the WCEUR, BALK and East groups. The two additional groups at (S-5.4 and S-5.1) were separated by PCA only on axes 3 and 4 respectively (not shown), which explained 14.3% and 8.8% of the total variance. Thus genetic clustering at K s = 3 appeared more structuring than the one at K s = 5. Figure 4 Principal component analysis on SSR data. Principal component analysis on SSR data of genotypes belonging to Ks = 5. Colors of the groups correspond to the colors in Figure 2. Axes 1 and 2 explain 30.3% and 21.4% of the total variance respectively (black vertical bars in the eigenvalues histogram). To support the STRUCTURE analysis, we performed a Ward clustering (Figure 5; the full dendrogram for the 2,096 cultivars is given in Additional file 5: Figure S2). The Ward and STRUCTURE clustering were found consistent (Additional file 6: Table S4), with a correspondence among clusters composition of 90% and 87% for K = 3 and K = 5 respectively. In addition to the main partitions already explored at Ks = 3 and 5, the Ward clustering level at K w = 12 (Additional file 7: Table S5) identified local germplasms, groups of cultivars with a particular characteristic (white, seedless or muscat flavor grapes), or parentages linked to human selection and breeding (next paragraph). Figure 5 Dendrogram based on Ward s clustering. Dendrogram based on Ward s clustering. For levels three and five of clustering, the comparison among the Ward and STRUCTURE groups is summarized with the double code labels (W-x.x / S-x.x), and the percentage of shared individuals between them. Genetic diversity and family structure within and among clusters The genetic diversity of the K s = 3 and K s = 5 groups is described in Table 2. In both cases the Table - East group, although not the largest one, was by far the most diverse, displaying the largest number of common and private alleles, as well as the largest non-biased heterozygosity. Observed and expected non-biased heterozygosity statistics were generally large but not significantly different among groups. No significant heterozygosity deficit could be detected (not shown).
11 Table 2 Statistics of genetic diversity for the STRUCTURE sub-populations at Ks = 3 and 5 K s level K s group N S-3.1 (Wine - West & Central Europe) Mean number of alleles / locus Private alleles (absolute count) a Private alleles (equal samples) a Ho Standard Heb deviation He Ks = 3 S-3.2 (Table - East) S-3.3 (Wine - Balkans & East Europe) S-5.1 (Wine & Table - Iberian Peninsula & Maghreb) S-5.2 (Table - East) Ks = 5 S-5.3 (Wine West and Central Europe) S-5.4 (Italy & Central Europe) S-5.5 (Wine - Balkans & East Europe) a Private alleles are displayed both as absolute count values in the whole sub-populations (if allele frequency > 0.01), and adjusted for sample bias, considering equal-sized sub-samples, as in Zachary et al. [58]. b He represents the non-biased heterozygosity as in Nei [71].
12 The average genetic differentiation among STRUCTURE groups for K s = 3 and K s = 5 was D est = and respectively (harmonic means; in both cases, standard deviation D est = 0.005). The largest differentiation between pairs of subpopulations was found between the Western-Central Europe and the Eastern groups, for both K s = 3 and 5, with D est = and respectively). The Eastern group and the group from the Iberian Peninsula and Maghreb displayed a D est of 0.139, the lowest of all comparisons (Additional file 8: Table S6). Since the presence of family groups may affect population genetic structure, we explored the distribution of cultivar family relationships within and among STRUCTURE groups. By comparing all possible genotype pairs, the ML-relatedness software outlined in total 1,069 likely parent pairs involving 1,099 putative parents. The distribution of the likely parent pairs among and within STRUCTURE (K s = 3 and 5) and Ward (K w = 12) groups is shown in Table 3. The two members of a family-related pair were more frequently found within the same cluster than in different clusters; the coefficient of relatedness was also significantly higher within clusters compared to whole population relatedness (r 2 = 0.046). Smaller relatedness values were found within the admixed group or at the margins of the STRUCTURE clusters (one parent belonging to a cluster and the other to the admixed group). In the admixed group, we found 3.0% and 3.2% of genotypes with parents in two different STRUCTURE groups for K s = 3 and K s = 5, respectively (not shown). The parentage at the inter-k level was not significantly different from the average parentage in the entire population. Table 3 Distribution of family relationship among genotype pairs, classified within and between structure subgroups STRUCTURE Related pairs LEVEL r 2 LEVEL (HS, FS, PO) K s = 3 Intra-Clusters 47% 0.11 Inter-Clusters 1% 0.02 Intra-Admixed 24% 0.05 Inter Cluster/Admixed 28% 0.04 K s = 5 Intra-Clusters 39% 0.14 Inter-Clusters 1% 0.03 Intra-Admixed 27% 0.04 Inter Cluster/Admixed 33% 0.04 K w = 12 Intra-Clusters 63% 0.14 Inter-Clusters 37% 0.04 Note: For each couple, if both genotypes belonged to the same K group, or to the admixed group, the couple was assigned to the Intra-Clusters or the Intra-Admixed classes, respectively; similarly, a couple was assigned to the Inter-clusters and Inter Cluster/Admixed classes if they belong to different Ks or if one belong to one K and the other is admixed, respectively. Ward s clustering does not identify the admixed class. At the Kw = 12 subdivision level, the analysis of the family structure (percent of genotypes with family relations within group and average within-group relatedness) allowed to characterize and confirm four already described kin groups, essentially formed by one family (Table 4), and identified two additional groups composed by a mix of several families. One example was the W-12.6 group, with 48% of all genotypes related to each other, a relevant proportion of which were recently bred white table grapes with muscat flavor. On the opposite, the W group, comprising Caucasian, Russian and Maghreb cultivars (derived
13 from the S.3.2 East table grapes group) displayed the lowest relatedness and the smallest number of family-related genotypes.
14 Table 4 Characterization of the clusters at K w = 12, based on their genetic diversity, family relationship and phenotypic characteristics Group Code N He Percent of genotypes with family relations in the same group Average relatedness "r" (st dev) Description of the main family composing the group General group description W % 0.26 (0.039) Family group of Gouais blanc Black and white wine cultivars from Western Europe W % 0.16 (0.027) Family groups of Savagnin and Cabernet franc Black and white wine cultivars from South West of France and Portugal W % 0.12 (0.029) Wine cultivars from Central Europe and Balkan peninsula, with mostly white, red, grey or pink berry skin color W % 0.11 (0.015) Black and white wine cultivars from Iberian Peninsula and Maghreb. W % 0.04 (0.013) Black and white cultivars (mostly for wine but also for table grape) from Italy and Alps. W % 0.13 (0.020) Mix of several recently bred families Table grape cultivars, new breeding or modern selections, with mostly white berry skin color and muscat flavor. W % 0.14 (0.017) Several families obtained by breeding in the XIXth and early XXth century Traditional breeding of table grape (including some cultivars with muscat flavor) selected in several countries during XIXth century and early XXth. W % 0.15 (0.018) Family groups of Chasselas and Muscat à petits grains Wine cultivars with white, red, grey or pink berry skin color. Presence of several cultivars with muscat flavor W % 0.16 (0.024) Family group of Pinot and Riesling A majority of white wine cultivars from Western Europe W % 0.06 (0.014) Wine cultivars with mostly black berry skin color, from Italy (Centre and North), France (Alps and South), Spain (North) and Portugal. W % 0.07 (0.018) Traditional table grape cultivars originated from Far, Middle and Near East, with mainly white, red, grey or pink berry skin color ; this group gathers most of the seedless grapevine cultivars W % 0.03 (0.014) Diverse wine and table grape cultivars in particular from Caucasus, Russia and Maghreb N is the number of genotypes within the group; He represents the non-biased heterozygosity as in Nei [71]; the average relatedness r is calculated with the Queller and Goodnight formula [72], and the standard error using 100 jackknifes over loci [30].
15 All the analyses above allowed us to characterize the different groups (Table 4 and Additional file 9: Table S7) for their genetic diversity, family relationships and phenotypic characteristics, and finally propose an interpretation of grapevine genetic history and geographic partitioning. Discussion The main objective of this study was to explore the genetic diversity and structure of cultivated grapevine and link them to cultivar utilization, putative geographic origin and historical events. Microsatellite markers data for 2,323 unique cultivars collected and maintained at the French grapevine collection of Vassal (INRA, France), were available [8]. Inferences of population structure were derived with both a Bayesian and a hierarchical clustering method. Since clustering methods may be sensitive to sampling bias, to improve our chances to detect true structure patterns, we followed three strategies, i) first we focused only on the 2,096 genotypes (out of the 2,323 unique cultivars) without missing SSR data and excluding putative clones and close mutants (with only one or two allele differences over the 40 alleles); indeed, missing data may bias the clustering procedure, and nearly identical SSR genotypes can be considered as redundant for our scope; ii) secondly, we evaluated the possible bias due to unbalanced geographical representativeness of our sample, by running STRUCTURE analysis on two data sets, one with the entire sample and the other balanced in term of cultivar geographical origin (cultivars being randomly picked within each geographical group). STRUCTURE provided a very consistent attribution of genotypes to clusters independently of the data set, thus only the full set of genotypes was further analyzed; iii) third, since the STRUCTURE clustering method can be disputed because human manipulation of cultivars (displacements, breeding, clonal propagation) could have generated a deviation from the Hardy-Weinberg equilibrium, we complemented the STRUCTURE analysis with the method of discriminant analysis developed by Ward, which is independent from any assumptions on population dynamics. According to Odong et al. [30], the two methods are complementary, so they can conveniently be used together and compared. The 2,096 cultivars of the Vassal collection studied here originate from 52 countries around the world, making our sample highly representative of the cultivated grapevine gene pool. Our data confirmed the high levels of diversity and heterozygosity of the cultivated grapevine, in agreement with a number of previous studies [4,5,8,17,18]. This can be due to an intermix of factors: i) a weak bottleneck effect during domestication [18] as observed for maize and wheat [31,32], probably in relation to ii) vegetative propagation and diffusion of cuttings across geographic regions [11], iii) several putative domestication events from different gene pools [9,10], then intermixed by man with breeding and selection, and iv) diversifying selection in plant breeding [33]. The large diversity found in grapevine opens an avenue for further selection and breeding [18]. Among the 2,096 genotypes studied here, over one half is still poorly known from a viticultural and oenological point of view and may potentially carry new genes and traits of interest for new breeding and selection. STRUCTURE identified one main level of population subdivision at K s = 3 and a secondary subdivision at K s = 5. A PCA analysis and Ward s hierarchical clustering confirmed this finding. Both the STRUCTURE and Ward methods indicated inconsistencies in clustering for K = 4 and 6, suggesting that these two levels are not appropriate for subdividing the grapevine gene pool. While confirming the main subdivision, Ward s clustering also pointed to a finer structure linked to grapevine uses, family structure or local geographic groups.
16 The analysis of family relationships also revealed that STRUCTURE clustered a significant portion of family-related genotypes, nearly double of the fraction found in the admixed group. By contrast almost no parentage was found among genotypes from different K3 groups (inter-group level). These findings are probably the result of the history of grapevine, with the practice of breeding focusing mostly on local varieties. In the admixed group we could identify approximately 3% of genotypes with parents classified in two different STRUCTURE clusters, such as the wine grape Tarrango, known to be a cross between Touriga (a wine grape from Portugal, S-3.1 group) and Sultanina (a seedless table grape from Turkey, S-3.2 group). The crossing among genotypes from different STRUCTURE groups probably corresponds to recent breeding activity in search for novelties and hybrid vigor, remaining nevertheless proportionally marginal. We also detected significantly more family relationships within the already know grapevine kin groups of i) Gouais [15,34,35], ii) Savagnin and Cabernet franc [14], iii) Chasselas and Muscat, and iv) Pinot and Riesling [36], and found traces of existence of two additional groups, each composed by a mix of several families, such as the W-12.6 and W-12.7 groups, comprising family-related table grapes with muscat flavor released by modern breeding. The interaction of genetic structure and family relationship is known to be difficult to resolve, and 20 microsatellite loci are probably not sufficient to avoid false positives, despite the large number of alleles. Nevertheless, our family relationship analysis, seen as a tentative to understand large scale population patterns and not to precisely detect each single family pair, provided a coherent global picture. This analysis was also coherent with a more specific paper by Lacombe et al. in 2012 [37] who explored direct parentage using an exclusion probabilities algorithm, with a slightly different sample, thus explaining minor differences. Geography and history The three main clusters revealed by our study, both with STRUCTURE and Ward s methods, confirmed previously obtained molecular results [5,9] and the eco-geographic grouping proposed by Negrul [38], in particular the correspondences between the proles occidentalis and S-3.1/W-3.1 groups, the pontica and S-3.3/W-3.3 groups, and the orientalis and S-3.2/W- 3.2 groups. Our results allow us to subdivide these clusters according to cultivar putative geographical origins: i) West and Central Europe (S-3.1), ii) East Mediterranean, Caucasus, Middle and Far East (S-3.2), and iii) Balkans and East Europe (S-3.3). Clustering at K = 5 identified two new groups, an Iberian Peninsula group and a group of table grape obtentions with Italian Peninsula and Central Europe origins. Genetic characterization of the groups clearly showed the East table grape group (S-3.2 and S-5.2 for K = 3 and 5 respectively) as the most diverse in terms of mean number of alleles, number of private alleles, and non-biased heterozygosity. This is consistent with the hypothesis that grapevine domestication initially occurred in Eastern regions (Caucasus and Fertile Crescent) as suggested earlier [2-4,9], repeatedly introducing genes from the wild. The high frequency of private alleles in S-3.2 and S-5.2 could also be explained by a history of limited exchanges from East to West, as attested by the high differentiation values (D est ) between these regions, and a slower development of grape breeding in the East, as indicated by the low frequency of family-related genotypes in that region as compared to other regions, revealing a weaker selection bottleneck effect there. However, given the high genetic
17 diversity of grapevine at all subdivision levels, the selection and breeding bottlenecks seem in general weak for this crop. The second most diverse group was the West and Central Europe wine grape group, probably as a result of this area s long history of grapevine cultivation and development, in combination, as already stated by other authors, with gene flow from local wild or primodomesticated grapevines [9,10,18]. The Balkans and East Europe cluster also formed a well identified STRUCTURE group with an intermediate diversity. The two additional groups at Ks = 5 (the Iberian Peninsula group and the group of table grape obtentions), appeared as secondary groups with a lesser global diversity. More generally, the full hierarchical partitioning obtained with the STRUCTURE and Ward methods as well as the D est differentiation statistics appeared consistent with historical data, such as the diffusion of viticulture around the Mediterranean Sea, with one route connecting Eastern (W-3.2) to Western Europe through the Balkans and Central Europe (W-3.3, W.3.1) [2,9], and a Southern route to the Maghreb and Iberian peninsula (W-3.2 / W-5.1 / W-12-4). The Balkans and Eastern Europe group and the Western and Central Europe group were both characterized by a large proportion of genotypes belonging to one STRUCTURE group only, probably corresponding to separate regional grapevine cultivar development and selection. In contrast, other regions as Russia and Ukraine, the Iberian Peninsula, and the New World countries, contain a mix of two or three STRUCTURE groups, in relation to their regional position. In particular, varieties found in Russia and Ukraine appear to have either East (S- 3.2), Balkans and East Europe (S-3.3) origins, consistently with what we know of the centralizing impact that Russian agricultural research had during the Soviet period [39]. Similarly, the Iberian peninsula group include cultivars from West Europe (S-3.1), East (S- 3.2) and Maghreb (S-5.1) as well as a high proportion of admixed genotypes, in coherence with the long historical exchange relationships this region had both with Europe and North Africa. Based on maternally inherited chloroplast markers, Arroyo-Garcia et al. suggested that the Iberian Peninsula could be a secondary center of domestication [9]. Our results add a new view of Spain and Portugal as platforms of centralization, intermixing and exchange of varieties throughout history. Finally, at K w = 12, the genotypes from the eastern regions (proles orientalis [38]) further subdivided into two sub-groups, one mainly composed of wine cultivars of Caucasian origin (including Georgia, Armenia, Azerbaijan and Turkey, W-12.12), and the other comprising table cultivars from Central Asia (Tajikistan, Uzbekistan, Turkmenistan) together with Iran and Afghanistan (W-12.11). The separation of these two groups may be a trace of divergent selection for the main local use for grapevine (table vs. wine). On the other hand, the absence of admixture in the Middle and Far East group, in particular for the 72 cultivars from Uzbekistan, Afghanistan, Tajikistan, Turkmenistan and Iran, and the high K scores of its genotypes may be an indication that the corresponding center of domestication was larger than formerly believed (several authors indeed placed it in a geographic region between the Black Sea and Iran [2,3,40,41]), an hypothesis already proposed in 1976 by Olmo [12], but not confirmed by later studies. It is difficult to decide between these two scenarii since the information available on grapevine crop development is quite limited for Central Asian countries. A large proportion of admixed genotypes was found by STRUCTURE, both at K s = 3 and K s = 5. A previous study on maize indicated that, in crops, STRUCTURE grouping is generally
18 coherent for first cycle inbreds with simple parentage relationships, while the presence of multiple levels of family relationships and cohort overlapping in more advanced breeding systems leads to different grouping possibilities and low STRUCTURE stability [42]. We can infer that our sample contains both types of material, with a number of ancient varieties anchoring the main clusters (founders), and recent breeds complicating structure resolution. The stability of K s = 3 and K s = 5 groupings and the individual percentage of cluster ancestry allowed us to discriminate among these two types of materials. The geographic distribution of the admixed genotypes is not random (Table 1): the Middle-Far East is the region displaying the lowest level of admixture, while Italy in particular and secondly the Iberian Peninsula, display the larger proportion of admixed genotypes. We were unable to find other traits characterizing the admixed group: it is composed of even proportions of phenotypic classes of grape use, berry color, flavor, berry seed number, or sex. While confirming and reinforcing the observation of geographic structure of the cultivated gene pool already described by other authors [5,9,16,18,38], our results are also coherent with the study of Cipriani et al. [17] suggesting that Italian varieties present weak or no structure: indeed in our study the Italian cultivars appear to be admixed, probably as a result of the inter-regional exchange role that Roman culture has certainly played. Phenotypic traits Our results also provide information about the effect human selection on morphological traits had on shaping the genetic diversity of cultivated grapevine. Table and wine grapes have different berry size and bunch shapes, both important traits used for cultivar classification [22]. Table and wine grapes are clearly separated by STRUCTURE at K s = 3. At K s = 5; only the group including Iberian and Maghreb cultivars (S-5.1) is composed of a mix of table and wine cultivars, which is likely the result of artificial selection and intimate cultivars intermixing in this area. The black color of berries is considered as an ancestral trait compared with the other colors, both at phenotypic [1] and molecular level. The molecular basis of the apparition of red, rose, grey and white berry colors has been previously documented [43-45] and the diffusion of the major causal mutations Gret1 insertion and K980 mutation within the cultivated compartment was described by Fournier-Level et al. [19]. In the present STRUCTURE analysis, the Central and West Europe subgroup (S-5.3) is composed of a majority of black cultivars. This can be explained by the isolation of these regions from the Eastern cultivars, by local domestication and gene flow from endemic black-berried V. v. sylvestris, or human selection. All other subgroups include a large number of white cultivars, reinforcing the idea of a wide and strong diffusion of Gret1 over the whole geographic range of grapevine [19]. Most of the intermediary phenotypes (red, rose and grey) are concentrated within two groups: Balkans and Central Europe (S-5.5), and East (S-5.2), confirming these regions as putative sources of color variation [19]. The geographical origin of Muscat flavor is assumed to be Greece or the Balkan Peninsula [46,47]. Thereafter, human selection aimed to spread this desirable trait in both table and wine grapes [20]. With STRUCTURE, we found the majority of Muscat founders within the Central Europe table group (S-5.4). Only a small number of them were involved in breeding, essentially in the Balkans, forming kingroups with other known parents such as Chasselas.
19 Seedless cultivars clustered essentially with cultivars of Turkish, Caucasian and Asian origins, belonging to the proles orientalis [38], coherently with available historical data about their origins from Turkey and Near-East [48]. Conclusions The array of analytical methods used here contributed coherent information to interpret the geographic and phenotypic structure, pointing to the main differentiation axes that exist within the cultivated compartment of Vitis vinifera, as it was shown in other species, such as potato [49], poplar [50], and maize [51]. Archaeological and historical data suggest that domestication of grapevine took place in the region spanning from the Fertile Crescent to South Caucasus [2,3,40,41], and from there spread in three directions: a Northern route, through Greece and the Roman empire to its western borders; a Southern route, through Egypt, the Arab territories all the way to Spain during the last Arab invasions; and a third route towards Asia. The results of our analysis, in particular the three groups defined by K s = 3 and the finding of intermixed resources in focal regions of grapevine development, are consistent with this historical scenario. New elements provided by our studies are: i) the identification of the Iberian and Italian Peninsulae as regions of intermixing and exchange of varieties; ii) an East west bottleneck effect due to limited cultivar migration, complemented by local selection and breeding; iii) a more extended center for grapevine primodomestication, expanded to Central Asian countries. Our results also suggest that signs of weak genetic structure in grapevine found by earlier studies were probably due to either regionally and/or numerically limited sampling. By examining the molecular data on the large INRA grape collection of Vassal, we have shown that grape diversity is structured into groups that interestingly reflect historical evolution, migration and human selection. The subpopulations identified in this study, and in particular at K s = 3 or K s = 5, will be very useful to define samples for linkage disequilibrium and genetic association studies [52], especially for traits of significance for local adaptation or sensitive to local human selection. The finding of large proportions of family relationships within structure groups should however be taken in account. Genetic association studies may certainly be optimized by the use of the structure and parentage matrices as covariates in the analysis. In the near future, the study of additional cultivars from regions less represented in our sample (such as the Caucasus area), the study of wild genotypes from around the distribution area including Central Asian countries, and the use of other markers associated with genes of interest linked to domestication and selection processes, will provide more precise information about the evolution of Vitis vinifera. Methods Plant material The plant material was composed of cultivated grapevine varieties belonging to V. vinifera subsp. vinifera held in the INRA grape repository at Vassal (France). This collection includes 3,727 accessions available as field-grown plants and genotyped with 20 microsatellite markers [8].
20 Geographic assignation Geographic origin of referenced cultivars was derived from general bibliography on ampelography and viticulture [53,54]. For non-referenced cultivars, the origins were estimated on the basis of the accession origin. Recently bred cultivars (e.g., Tarrango) were assigned to the breeder s country (in this example, Australia) and not to the countries of origin of their progenitors (in this case, Portugal and Turkey). Countries of origin were grouped as shown in Table 1. Cultivar characterization Cultivar traits were observed and recorded over several years, using the methods developed for the grapevine genetic resources catalogues [53-55], and coded according to the International Organization of Vine and Wine descriptors [56], as presented in Table 5. Table 5 List of the phenotypic traits recorded for group characterization and coded according to the OIV (2009) notation system Characteristic Level of expression International Code Utilization of the fruit Wine grape (W); Table and/or raisin grape (T). - Berry skin color White (B); Black (N); Rose (Rs); Grey (G); Red (Rg). OIV-225 Berry flesh color Non-colored (NoC); Colored (Col). OIV-231 Berry flavor None (No); Muscat (Mus); Herbaceous (Herb); Other (Oth). OIV-236 Presence of seeds Seeded berry (SD); Seedless berry (SL). OIV-241 Sex of flower Hermaphrodite (H); Female (F). OIV-151 DNA extraction and genotyping DNA extraction, PCR amplification and genotyping of microsatellites were carried out according to This et al. [4] and Laucou et al. [8]. The 20 nuclear microsatellite loci were chosen according to their polymorphism level and their position on the linkage groups [23]. Differences of one base pair between alleles at one given locus were double-checked by reamplification and re-analysis; a test for the presence of null alleles was also carried out [57]. Since genotypes with only one or two allele differences represent closely related material, such as clones or recent mutants, and provide very little additional information to the analysis, these were considered redundant and not taken into account. Thus, out of the 2,323 single genotypes identified in Laucou et al. [8], 2,096 genotypes presenting no missing data and at least three allele differences were analyzed in our study for further structure and clustering analyses (full list and characteristics are given in Additional file 1: Table S1). Statistical analysis Main diversity statistics for the 20 microsatellite markers, such as the total number of alleles, expected heterozygosity and total gene diversity [58] were calculated using Genetix [59]. A private allele index adjusted for sample bias was estimated with ADZE [60], following a generalized rarefaction approach. Genetic differentiation D est was computed using the SMOGD software [61,62], based on the method of Jost [63]. Confidence intervals were calculated using 1000 bootstraps, Polymorphism Information Content (PIC) according to
21 Botstein et al. [64], and the single parent exclusion probabilities according to Jamieson & Taylor [65]. The dataset of 2,096 unique genotypes was used to run a series of tests, with the Bayesian method implemented in STRUCTURE [27], in order to find the best model to infer population structure (with or without admixture, correlated allele frequencies, or prior information about sampling locations) and the best K s level of population subdivision, with K s varying from 2 to 12. Within STRUCTURE, we allowed an iterative process with a burnin phase of iterations, and a sampling phase of replicates. Ten replicates of each assumed K s -level subdivision were compared to estimate group assignation stability. We first evaluated the different models of admixture, allele frequencies and prior population information available in STRUCTURE. The most appropriate model to interpret our data appeared to be the uncorrelated allele frequencies and prior geographic information model, which showed a better stability between runs for K s = 3 and 5, and a lower variance for K s = 5, as compared to other possible STRUCTURE models (Additional file 3: Figure S1). Since the geographic groups are not equally represented in Vassal, a second analysis was run to measure a possible sampling effects, in particular the bias that could arise from oversampling one region or one family group. This was tested by running STRUCTURE on two different set of genotypes (Table 1), the full set of 2096 genotypes (set1) and a sub-set of 888 genotypes randomly drawn to constitute equally-sized, geographic origin-based groups (set2). Finally, the most probable uppermost level of structure subdivision between the successive K s values was estimated with two methods: 1) the calculation of Evanno s delta-k as the second order change in the likelihood function divided by the standard deviation of the likelihood [66,67], and 2) the similarity coefficient between each pair of runs, which provides an evaluation of the stability of the solutions between runs. Genotypes were assigned to a cluster when 85% or more of their inferred genome belonged to the cluster, the genotypes with a lower score being considered as admixed. The chosen clusters for each Ks level were then labeled according to a three digit code (e.g. S-2.1, S- 2.2,, S-5.5) for further geographic and phenotypic characterization. A graphical display of the individual and group distances was obtained with a Principal Component Analysis (PCA) using the package adegenet implemented in R [68,69]. To validate the STRUCTURE clustering, we compared its output with that obtained using a less constrained method of clustering. Odong et al. [30] highlighted that STRUCTURE and Ward s method [28] are convergent and complementary. Thus we used Ward s method to evaluate the distances between clusters minimizing the sum of squares of any two clusters at each step. Using Ward dissimilarity matrix, we built a dendrogram with DARwin software [29]. The advantage of Ward clustering is to provide details of the relationships at any level, as close as family levels. One disadvantage is that it does not deal with admixed genotypes. We indexed the Ward subdivision levels as K w, and labeled the subgroups accordingly (W- 2.1, W-2.2,, W-12.12).
22 Genetic structure partitioning between and within groups - Family relationships To estimate the part of the population genetic structure due to parentage, we first calculated the most probable family relationship among each pair of genotypes using the MLrelatedness software [70]. Genotype pairs (half of a 2,096 x 2,096 matrix minus the diagonal [(n 2 -n)/2)] = 2,195,569 couples) were declared either unrelated or family-related, this latter category grouping full sibs, half-sibs, and parent-offsprings, in order to lower the chance of false attribution. Only non-ambiguous relationship assignations (according to 99.9% confidence intervals calculated in 100 mating population simulations) with an experimentally determined LOD score > 9 were taken into account. For each of the above subdivisions we also calculated a weighted average relatedness r 2. The results of this analysis were then assigned to categories of STRUCTURE subdivision (e.g. within or among subgroups), according to the group of each parent. Within-group average relatedness was estimated with the formula of Queller and Goodnight [71] and its standard deviation with 100 jackknifes over loci, using the RERAT software [72]. Phenotypic evaluation of the different K levels To interpret the population structure in terms of cultivar utilization, movement and history, each subpopulation was finally characterized for its flower and fruit traits and for its geographic origin. Group names were ultimately based on their main characteristics. Competing interests The authors declare that they have no competing interests. Authors' contributions RB, JPP, TL, MDVS, and LL carried out the statistical calculations. VL carried out the molecular analysis. LL, MDVS, PT, RB and JPP suggested and discussed statistical methods. TL and JMB took care of, identified and classified the plant material, and interpreted the statistical results with regard to the history of viticulture. BG managed the genetic resources collection and provided the plant material. RB wrote the paper with the help and corrections of TL, LL, JMB, JPP, and PT. PT conceived the study and was PhD work coordinator for MDVS. JMB supervised the work. All authors read and approved the final manuscript. Authors information Thierry Lacombe, Manuel Di Vecchi-Staraz, Blaise Genna: ( Acknowledgements The authors thank the staff of the INRA Vassal grapevine collection and more specifically Thierry Dessup, Sandrine Lalet and Mireille Dessup. We thank Philippe Chatelet for helpful
23 comments and text editing. This work was supported in part by a grant from the French Ministry of Agriculture, Fisheries and Forests (Centres de Ressources Biologiques) References 1. Levadoux L: Les populations sauvages et cultivées de Vitis vinifera L. Ann. Amélior Plantes 1956, 6: Zohary D: Domestication of the Grapevine Vitis vinifera L. in the Near East. In The origins and ancient history of wine. Edited by McGovern P, Fleming S, Katz S. New York: Gordon and Breach; 1996: McGovern P: Ancient wine: the search for the origins of viniculture. Princeton: Princeton University Press; This P, Lacombe T, Thomas M: Historical origins and genetic diversity of wine grapes. Trends Genet 2004, 22: Aradhya MK, Dangl GS, Prins BH, Boursiquot JM, Walker MA, Meredith CP, Simon CJ: Genetic structure and differentiation in cultivated grape, Vitis vinifera L. Gene Res 2003, 81: Salmaso M, Faes G, Segala C, Stefanini M, Salakhutdinov L, Zyprian E, Toepfer R, Grando MS, Velasco R: Genome diversity and gene haplotypes in the grapevine (Vitis vinifera L.), as revealed by single nucleotide polymorphisms. Mol Breed 2004, 14: Di Vecchi-Staraz M, Laucou V, Bruno G, Lacombe T, Gerber S, Bourse T, Boselli M, This P: Low level of pollen-mediated gene flow from cultivated to wild grapevine: consequences for the evolution of the endangered subspecies Vitis vinifera L. subsp. sylvestris. J Hered 2008, 100: Laucou V, Lacombe T, Dechesne F, Siret R, Bruno JP, Dessup M, Dessup T, Ortigosa P, Parra P, Roux C, Santoni S, Varès D, Peros JP, Boursiquot JM, This P: High throughput analysis of grape genetic diversity as a tool for germplasm collection management. Theor Appl Genet 2011, 122: Arroyo-Garcia R, Ruiz-Garcia L, Bolling L, Ocete R, Lopez MA, Arnold C, Ergul A, Soylemezoglu G, Uzun HI, Cabello F, Ibanez J, Aradhya MK, Atanassov A, Atanassov I, Balint S, Cenis JL, Costantini L, Goris-Lavets S, Grando MS, Klein BY, McGovern PE, Merdinoglu D, Pejic I, Pelsy F, Primikirios N, Risovannaya V, Roubelakis-Angelakis KA, Snoussi H, Sotiri P, Tamhankar S, This P, Troshin L, Malpica JM, Lefort F, Martinez- Zapater JM: Multiple origins of cultivated grapevine (Vitis vinifera L. ssp. sativa) based on chloroplast DNA polymorphisms. Mol Ecol 2006, 15: Grassi F, Labra M, Imazio S, Spada A, Sgorbati S, Scienza A, Sala F: Evidence of a secondary grapevine domestication centre detected by SSR analysis. Theor Appl Genet 2003, 107:
24 11. Zohary D, Hopf M: Domestication of plants in the Old World: the origin and spread of cultivated plants in West Asia, Europe and the Nile Valley. Oxford: Oxford University Press; Olmo HP: Grapes. Vitis, Muscadinia. In Evolution of crop plants. Edited by Simmonds NW. London. UK: Longman; 1976: Pouget R: The history of the control of grapevine phylloxera in France ( ). Paris: INRA; 1990: Boursiquot JM, Lacombe T, Laucou V, Julliard S, Perrin FX, Lanier N, Legrand D, Meredith C, This P: Parentage of Merlot and related winegrape cultivars of Southwestern France: discovery of the missing link. Aust J Grape Wine Res 2008, 15: Bowers J, Boursiquot JM, This P, Chu K, Johansson H, Meredith C: Historical genetics: the parentage of Chardonnay, Gamay, and other winegrapes of Northeastern France. Science 1999, 285: Imazio S, Labra M, Grassi F, Scienza A, Failla O: Chloroplast microsatellites to investigate the origin of grapevine. Genet Resour Crop Evol 2006, 53: Cipriani G, Spadotto A, Jurman I, Di Gaspero G, Crespan M, Meneghetti S, Frare E, Vignani R, Cresti M, Morgante M, Pezzotti M, Pe E, Policriti A, Testolin R: The SSR-based molecular profile of 1005 grapevine (Vitis vinifera L.) accessions uncovers new synonymy and parentages, and reveals a large admixture amongst varieties of different geographic origin. Theor Appl Genet 2010, 121: Myles SBA, Owens CL, Brown PJ, Grassi F, Aradhya MK, Prins B, Reynolds A, Jer- Ming C, Wareh D, Bustamanteb CD, Buckler ES: Genetic structure and domestication history of the grape. PNAS 2010, 108: Fournier-Level L, Le Cunff L, Boursiquot JM, This P: Evolution of the VvMybA gene family, the major determinant of berry colour in cultivated grapevine (Vitis vinifera L.). Heredity 2010, 104: Emanuelli F, Battilana J, Costantini L, Le Cunff L, Boursiquot JM, This P, Grando MS: A candidate gene association study on muscat flavor in grapevine (Vitis vinifera L.). BMC Plant Biol 2010, 10: Centre de resources génétiques de la vigne, Collection de Vassal: France: INRA; Boursiquot JM, Dessup M, Rennes C: Distribution of the main phenological, agronomical and technological characters of Vitis vinifera L. Vitis 1995, 34: Doligez A, Adam-Blondon AF, Cipriani G, Laucou V, Merdinoglu D, Meredith CP, Riaz S, Roux C, This P, Di Gaspero G: An integrated SSR map of grapevine based on five mapping populations. Theor Appl Genet 2006, 113:
25 24. Harter AV, Gardner KA, Falush D, Lentz DL, Bye RA, Rieseberg LH: Origin of extant domesticated sunflowers in Eastern North America. Nature 2004, 430: Vigouroux Y, Mitchell S, Matsuoka Y, Hamblin M, Kresovich S, Smith JSC, Jaqueth J, Smith OS, Doebley J: An analysis of genetic diversity across the maize genome using microsatellites. Genetics 2005, 169: Hamblin MT, Warburton ML, Buckler ES: Empirical comparison of simple sequence repeats and single nucleotide polymorphisms in assessment of maize diversity and relatedness. PLoS One 2007, 12:e Pritchard JK, Stephens M, Donnelly P: Inference of population structure using multilocus genotype data. Genetics 2000, 155: Ward JH: Hierarchical grouping to optimize an objective function. J Am Stat Assoc 1963, 58: Perrier X, Jacquemoud-Collet JP: DARwin software. Cirad; Odong TL, van Heerwaarden J, Jansen J, van Hintum TJL, van Eeuwijk FA: Determination of genetic structure of germplasm collections: are traditional hierarchical clustering methods appropriate for molecular marker data? Theor Appl Genet 2011, 123: Eyre-Walker A, Gaut RL, Hilton H, Feldman DL, Gaut BS: Investigation of the bottleneck leading to the domestication of maize. Proc Natl Acad Sci USA 1998, 95: Kilian B, Ozkan H, Walther A, Kohl J, Dagan T, Salamini F, Martin W: Molecular diversity at 18 loci in 321 wild and 92 domesticated lines reveal no reduction of nucleotide diversity during Triticum monococcum (einkorn) domestication: Implications for the origin of agriculture. Mol Biol Evol 2007, 24: McCouch S: Diversifying selection in plant breeding. PLoS Biol 2004, 2(10):e Boursiquot JM, Lacombe L, Bowers J, Meredith C: Gouais, a key vine of the European wine heritage. Bulletin de l'oiv 2004, 77: Bowers JE, Siret R, Meredith CP, This P, Boursiquot JM: A single pair of parents proposed for a group of grapevine varieties in northeastern France. Acta Horticulturae 2000, 528: Vouillamoz JF, Grando MS: Genealogy of wine grape cultivars: Pinot is related to Syrah. Heredity 2006, 97: Lacombe T, Boursiquot JM, Laucou V, Di Vecchi-Staraz M, Peros JP, This P: Largescale parentage analysis in an extended set of grapevine cultivars (Vitis vinifera L.). Theor Appl Genet, doi: /s published online 27 September 2012.
26 38. Negrul AM: Origin and classification of cultured grape. In The Ampelography of the USSR. Edited by Baranov A, Kai YF, Lazarevski MA, Palibin TV, Prosmoserdov NN. Moscow: Pischepromizdat; 1946: Pistorius R: Scientists, plants and politics: a history of the plant genetic resources movement. Rome, Italy: International Plant Genetic Resources Institute; McGovern PE, Rudolph HM: The analytical and archaeological challenge of detecting ancient wine: two case studies from the ancient Near East. In The origins and ancient history of wine. Edited by McGovern P, Fleming S, Katz S. New York: Gordon and Breach; 1996: McGovern PE, Glusker DL, Exner LJ, Voigt MM: Neolithic resinated wine. Nature 1996, 381: Camus-Kulandaivelu LJ, Veyrieras B, Gouesnard B, Charcosset A, Manicacci D: Evaluating the reliability of Structure outputs in case of relatedness between individuals. Crop Science 2007, 47: Kobayashi S, Goto-Yamamoto N, Hirochika H: Association of VvMybA1 gene expression with anthocyanin production in grape (Vitis vinifera) skin-color mutants. J Jap Soc Hortic Sci 2005, 74: This P, Lacombe T, Cadle-Davidson M, Owens CL: Wine grape (Vitis vinifera L.) color associates with allelic variation in the domestication gene VvMybA1. Theor Appl Genet 2007, 114: Walker AR, Lee E, Bogs J, McDavid DAJ, Thomas MR, Robinson SP: White grapes arose through the mutation of two similar and adjacent regulatory genes. Plant J 2007, 49: Bronner A: Muscats and muscat varieties: survey and universal synonyms, from the origin to the present. Versailles France: INRA Editions; Crespan M, Milani N: The Muscats: A molecular analysis of synonyms, homonyms and genetic relationships within a large family of grapevine cultivars. Vitis 2001, 40: Bioletti FT: The Seedless Raisin Grapes. Bulletin of the California Agricultural Experimental Station 1921, 298: Spooner DM, McLean K, Ramsay G, Waugh R, Bryan GJ: A single domestication for potato based on multilocus amplified fragment length polymorphism genotyping. Proc Nat Acad Sci 2005, 102: Smulders MJM, Cottrell JE, Lefèvre F, van der Schoot J, Arens P, Vosman B, Tabbener HE, Grassi F, Fossati T, Castiglione S, Krystufek V, Fluch S, Burg K, Vornam B, Pohl A, Gebhardt K, Alba N, Agúndez D, Maestro C, Notivol E, Volosyanchuk R, Pospíšková M, Bordács S, Bovenschen J, van Dam BC, Koelewijn HP, Halfmaerten D, Ivens B, van Slycken J, Vanden Broeck A, Storme V, Boerjan W: Structure of the genetic diversity in black
27 poplar (Populus nigra L.) populations across European river systems: Consequences for conservation and restoration. For Ecol Manag 2008, 255: Vigouroux Y, Glaubitz JC, Matsuoka Y, Goodman MM, Jesus SG, Doebley J: Population structure and genetic diversity of new world maize races assessed by DNA microsatellites. Am J Bot 2008, 95: Yu JM, Pressoir G, Briggs WH, Bi IV, Yamasaki M, Doebley JF, McMullen MD, Gaut BS, Nielsen DM, Holland JB, Kresovich S, Buckler ES: A unified mixed-model method for association mapping that accounts for multiple levels of relatedness. Nat Genet 2006, 38: Galet P: Dictionnaire encyclopédique des cépages. Paris: Hachette; The Vitis International Variety Catalogue (VIVC) Truel P: Catalogue des variétés de vigne en collection. Montpellier: INRA editions; 1985: Organisation Internationale de la vigne et du vin: OIV descriptor list for grape varieties and Vitis species. 2nd edition. Paris: Office International de la Vigne et du Vin; van Oosterhout C, Hutchinson HF, Derek P, Wills M, Shipley P: MICRO-CHECKER: software for identifying and correcting genotyping errors in microsatellite data. Molecular Ecology Notes 2004, 4: Nei M: Molecular Evolutionary Genetics. New York: Columbia University Press; Belkhir K, Borsa P, Chikhi L, Raufaste N, Bonhomme F: GENETIX CNRS UMR Montpellier: Université de Montpellier II; Zachary A, Szpiech ZA, Jakobsson M, Rosenberg NA: ADZE: a rarefaction approach for counting alleles private to combinations of populations. Bioinformatics 2008, 24: Crawford NG: SMOGD: software for the measurement of genetic diversity. Mol Ecol Resourc 2010, 10: SMOGD: Software for the Measurement of Genetic Diversity (vsn ) Jost L: GST and its relatives do not measure differentiation. Mol Ecol 2008, 17: Botstein D, White RL, Skolnick M, Davis RW: Construction of a genetic linkage map in man using restriction fragment length polymorphism. Am J Hum Genet 1980, 32:
28 65. Jamieson A, Taylor SS: Comparisons of three probability formulae for parentage exclusion. Anim Genet 1997, 28: Evanno G, Regnaut S, Goudet J: Detecting the number of clusters of individuals using the software structure: a simulation study. Mol Ecol 2005, 14: Rosenberg NA, Pritchard JK, Weber JL, Cann HM, Kidd KK, Zhivotovsky LA, Feldman MW: Genetic structure of human populations. Science 2002, 298: Jombart T: adegenet: a R package for the multivariate analysis of genetic markers. Bioinformatics 2008, 24: R Core Team: R: A Language and Environment for Statistical Computing. Vienna, Austria: R Foundation for Statistical Computing; Kalinowski ST, Wagner AP, Taper ML: ML-Relate: a computer program for maximum likelihood estimation of relatedness and relationship. Mol Ecol Notes 2006, 6: Queller DC, Goodnight KF: Estimating relatedness using genetic markers. Evolution 1989, 43: Schwacke L, Schwacke J, Rosel P: RERAT: relatedness estimation and rarefaction analysis tool.; Available from: Additional files Additional_file_1 as XLS Additional file 1 Table S1 List of the 2096 genotypes (introduction and variety names, cultivar code) and their main characteristics (geographic origin, utility, sex, skin color, flesh color, berry flavor and seeds). Additional_file_2 as DOC Additional file 2 Table S2 Diversity indexes for the 20 microsatellite loci and the 2,096 cultivated grapevine genotypes. Additional_file_3 as DOC Additional file 3 Figure S1 The four steps of the graphic method of Evanno et al. (2005), allowing the estimation of the true number of ancestral groups K. Additional_file_4 as XLS Additional file 4 Table S3 Geographic and agro-technological characterization of the STRUCTURE subgroups. Additional_file_5 as PDF Additional file 5 Figure S2 Full dendrogram of the 2096 cultivated grapevines, according to a clustering based on the 20 SSR marker data and the Ward method. The short name of the varieties was used (use the zoom option to read). Group color codes and numbers are given in the Additional file 1, Table S1, "codes" sheet.
29 Additional_file_6 as DOC Additional file 6 Table S4 Comparison of the clustering between the STRUCTURE and the Ward methods. Additional_file_7 as XLS Additional file 7 Table S5 Geographic and agro-technological characterization of the Ward subgroups. Additional_file_8 as XLS Additional file 8 Table S6 Matrix of the D est among STRUCTURE groups. Additional_file_9 as DOC Additional file 9 Table S7 Group agro-morphological characterization.
30 Figure 1
31 Figure 2
32 Figure 3
33 Figure 4
Chapter V SUMMARY AND CONCLUSION
 Chapter V SUMMARY AND CONCLUSION Coffea is economically the most important genus of the family Rubiaceae, producing the coffee of commerce. Coffee of commerce is obtained mainly from Coffea arabica and
FINAL REPORT TO AUSTRALIAN GRAPE AND WINE AUTHORITY. Project Number: AGT1524. Principal Investigator: Ana Hranilovic
 Collaboration with Bordeaux researchers to explore genotypic and phenotypic diversity of Lachancea thermotolerans - a promising non- Saccharomyces for winemaking FINAL REPORT TO AUSTRALIAN GRAPE AND WINE
SHORT TERM SCIENTIFIC MISSIONS (STSMs)
") SHORT TERM SCIENTIFIC MISSIONS (STSMs) Reference: Short Term Scientific Mission, COST Action FA1003 Beneficiary: Bocharova Valeriia, National Scientific Center Institute of viticulture and winemaking named
SHORT TERM SCIENTIFIC MISSIONS (STSMs) Reference: Short Term Scientific Mission, COST Action FA1003 Beneficiary: Bocharova Valeriia, National Scientific Center Institute of viticulture and winemaking named
Title: Development of Simple Sequence Repeat DNA markers for Muscadine Grape Cultivar Identification.
 Title: Development of Simple Sequence Repeat DNA markers for Muscadine Grape Cultivar Identification. Progress Report Grant Code: SRSFC Project # 2018 R-06 Research Proposal Name, Mailing and Email Address
WP Board 1054/08 Rev. 1
 WP Board 1054/08 Rev. 1 9 September 2009 Original: English E Executive Board/ International Coffee Council 22 25 September 2009 London, England Sequencing the genome for enhanced characterization, utilization,
AVOCADO GENETICS AND BREEDING PRESENT AND FUTURE
 AVOCADO GENETICS AND BREEDING PRESENT AND FUTURE U. Lavi, D. Sa'ada,, I. Regev and E. Lahav ARO- Volcani Center P. O. B. 6, Bet - Dagan 50250, Israel Presented at World Avocado Congress V Malaga, Spain
Big Data and the Productivity Challenge for Wine Grapes. Nick Dokoozlian Agricultural Outlook Forum February
 Big Data and the Productivity Challenge for Wine Grapes Nick Dokoozlian Agricultural Outlook Forum February 2016 0 Big Data and the Productivity Challenge for Wine Grapes Outline Current production challenges
Buying Filberts On a Sample Basis
 E 55 m ^7q Buying Filberts On a Sample Basis Special Report 279 September 1969 Cooperative Extension Service c, 789/0 ite IP") 0, i mi 1910 S R e, `g,,ttsoliktill:torvti EARs srin ITQ, E,6
Genetic diversity analysis of cultivated and wild grapevine (Vitis vinifera L.) accessions around the Mediterranean basin and Central Asia
 accessions around the Mediterranean basin and Central Asia") Riaz et al. BMC Plant Biology (2018) 18:137 https://doi.org/10.1186/s12870-018-1351-0 RESEARCH ARTICLE Open Access Genetic diversity analysis of cultivated and wild grapevine (Vitis vinifera L.) accessions
Riaz et al. BMC Plant Biology (2018) 18:137 https://doi.org/10.1186/s12870-018-1351-0 RESEARCH ARTICLE Open Access Genetic diversity analysis of cultivated and wild grapevine (Vitis vinifera L.) accessions
Structures of Life. Investigation 1: Origin of Seeds. Big Question: 3 rd Science Notebook. Name:
 3 rd Science Notebook Structures of Life Investigation 1: Origin of Seeds Name: Big Question: What are the properties of seeds and how does water affect them? 1 Alignment with New York State Science Standards
Where in the Genome is the Flax b1 Locus?
 Where in the Genome is the Flax b1 Locus? Kayla Lindenback 1 and Helen Booker 2 1,2 Plant Sciences Department, University of Saskatchewan, Saskatoon, SK S7N 5A8 2 Crop Development Center, University of
Multiple Imputation for Missing Data in KLoSA
 Multiple Imputation for Missing Data in KLoSA Juwon Song Korea University and UCLA Contents 1. Missing Data and Missing Data Mechanisms 2. Imputation 3. Missing Data and Multiple Imputation in Baseline
is pleased to introduce the 2017 Scholarship Recipients
 is pleased to introduce the 2017 Scholarship Recipients Congratulations to Elizabeth Burzynski Katherine East Jaclyn Fiola Jerry Lin Sydney Morgan Maria Smith Jake Uretsky Elizabeth Burzynski Cornell University
Mapping and Detection of Downy Mildew and Botrytis bunch rot Resistance Loci in Norton-based Population
 Mapping and Detection of Downy Mildew and Botrytis bunch rot Resistance Loci in Norton-based Population Chin-Feng Hwang, Ph.D. State Fruit Experiment Station Darr College of Agriculture Vitis aestivalis-derived
Shaping the Future: Production and Market Challenges
 Call for Papers Dear Sir/Madam At the invitation of the Ministry of Stockbreeding, Agriculture, and Fisheries of the Oriental Republic of Uruguay, the 41th World Congress of Vine and Wine and the 16 th
Catalogue of published works on. Maize Lethal Necrosis (MLN) Disease
 Disease") Catalogue of published works on Maize Lethal Necrosis (MLN) Disease Mentions of Maize Lethal Necrosis (MLN) Disease - Reports and Journals Current and future potential distribution of maize chlorotic mottle
Catalogue of published works on Maize Lethal Necrosis (MLN) Disease Mentions of Maize Lethal Necrosis (MLN) Disease - Reports and Journals Current and future potential distribution of maize chlorotic mottle
Identification of haplotypes controlling seedless by genome resequencing of grape
 Identification of haplotypes controlling seedless by genome resequencing of grape Soon-Chun Jeong scjeong@kribb.re.kr Korea Research Institute of Bioscience and Biotechnology Why seedless grape research
Calvin Lietzow and James Nienhuis Department of Horticulture, University of Wisconsin, 1575 Linden Dr., Madison, WI 53706
 Precocious Yellow Rind Color in Cucurbita moschata Calvin Lietzow and James Nienhuis Department of Horticulture, University of Wisconsin, 1575 Linden Dr., Madison, WI 53706 Amber DeLong and Linda Wessel-Beaver
OIV Revised Proposal for the Harmonized System 2017 Edition
 OIV Revised Proposal for the Harmonized System 2017 Edition TABLE OF CONTENTS 1. Preamble... 3 2. Proposal to amend subheading 2204.29 of the Harmonized System (HS)... 4 3. Bag-in-box containers: a growing
OF THE VARIOUS DECIDUOUS and
 (9) PLAXICO, JAMES S. 1955. PROBLEMS OF FACTOR-PRODUCT AGGRE- GATION IN COBB-DOUGLAS VALUE PRODUCTIVITY ANALYSIS. JOUR. FARM ECON. 37: 644-675, ILLUS. (10) SCHICKELE, RAINER. 1941. EFFECT OF TENURE SYSTEMS
Emerging Local Food Systems in the Caribbean and Southern USA July 6, 2014
 Consumers attitudes toward consumption of two different types of juice beverages based on country of origin (local vs. imported) Presented at Emerging Local Food Systems in the Caribbean and Southern USA
Online Appendix to. Are Two heads Better Than One: Team versus Individual Play in Signaling Games. David C. Cooper and John H.
 Online Appendix to Are Two heads Better Than One: Team versus Individual Play in Signaling Games David C. Cooper and John H. Kagel This appendix contains a discussion of the robustness of the regression
Wine-Tasting by Numbers: Using Binary Logistic Regression to Reveal the Preferences of Experts
 Wine-Tasting by Numbers: Using Binary Logistic Regression to Reveal the Preferences of Experts When you need to understand situations that seem to defy data analysis, you may be able to use techniques
Catalogue of vines grown in France Cabernet franc N
 Catalogue of vines grown in France http://plantgrape.plantnetproject.org UMT Géno-Vigne INRA - IFV - Montpellier SupAgro Edited on 12/05/2018 Cabernet franc N Name of in France Cabernet franc Origin Cabernet
GENETICS AND EVOLUTION OF CORN. This activity previews basic concepts of inheritance and how species change over time.
 GENETICS AND EVOLUTION OF CORN This activity previews basic concepts of inheritance and how species change over time. Objectives for Exam #1: 1. Describe and complete a monohybrid ( one trait ) cross of
A Note on a Test for the Sum of Ranksums*
 Journal of Wine Economics, Volume 2, Number 1, Spring 2007, Pages 98 102 A Note on a Test for the Sum of Ranksums* Richard E. Quandt a I. Introduction In wine tastings, in which several tasters (judges)
Confectionary sunflower A new breeding program. Sun Yue (Jenny)
") Confectionary sunflower A new breeding program Sun Yue (Jenny) Sunflower in Australia Oilseed: vegetable oil, margarine Canola, cotton seeds account for >90% of oilseed production Sunflower less competitive
Confectionary sunflower A new breeding program Sun Yue (Jenny) Sunflower in Australia Oilseed: vegetable oil, margarine Canola, cotton seeds account for >90% of oilseed production Sunflower less competitive
MBA 503 Final Project Guidelines and Rubric
 MBA 503 Final Project Guidelines and Rubric Overview There are two summative assessments for this course. For your first assessment, you will be objectively assessed by your completion of a series of MyAccountingLab
GENOTYPIC AND ENVIRONMENTAL EFFECTS ON BREAD-MAKING QUALITY OF WINTER WHEAT IN ROMANIA
 GENOTYPIC AND ENVIRONMENTAL EFFECTS ON BREAD-MAKING QUALITY OF WINTER WHEAT IN ROMANIA Mihaela Tianu, Nicolae N. Sãulescu and Gheorghe Ittu ABSTRACT Bread-making quality was analysed in two sets of wheat
ANALYSIS OF THE EVOLUTION AND DISTRIBUTION OF MAIZE CULTIVATED AREA AND PRODUCTION IN ROMANIA
 ANALYSIS OF THE EVOLUTION AND DISTRIBUTION OF MAIZE CULTIVATED AREA AND PRODUCTION IN ROMANIA Agatha POPESCU University of Agricultural Sciences and Veterinary Medicine, Bucharest, 59 Marasti, District
World vitiviniculture situation
 World vitiviniculture situation Surface area Grape Wine Global grape production Production Consumption Trade 2016 FAO-OIV Focus: Table and Dried Grapes 2 Global area under vines Area under vines in the
Relation between Grape Wine Quality and Related Physicochemical Indexes
 Research Journal of Applied Sciences, Engineering and Technology 5(4): 557-5577, 013 ISSN: 040-7459; e-issn: 040-7467 Maxwell Scientific Organization, 013 Submitted: October 1, 01 Accepted: December 03,
Ongoing Conservation & Research Activities on Grapevine at the INRA-Montpellier
 Ongoing Conservation & Research Activities on Grapevine at the INRA-Montpellier T. Lacombe, J.-M. Boursiquot, V. Laucou, R. Bacilieri, L. Le Cunff, J.-P. Péros, M. Di Vecchi, P. This UMR 1097 DiAPC & Domaine
Flexible Working Arrangements, Collaboration, ICT and Innovation
 Flexible Working Arrangements, Collaboration, ICT and Innovation A Panel Data Analysis Cristian Rotaru and Franklin Soriano Analytical Services Unit Economic Measurement Group (EMG) Workshop, Sydney 28-29
Catalogue of vines grown in France Gamay N
 Catalogue of vines grown in France http://plantgrape.plantnetproject.org UMT Géno-Vigne INRA - IFV - Montpellier SupAgro Edited on 18/02/2018 Gamay N Name of in France Gamay Origin Based on published genetic
Virginie SOUBEYRAND**, Anne JULIEN**, and Jean-Marie SABLAYROLLES*
 SOUBEYRAND WINE ACTIVE DRIED YEAST REHYDRATION PAGE 1 OPTIMIZATION OF WINE ACTIVE DRY YEAST REHYDRATION: INFLUENCE OF THE REHYDRATION CONDITIONS ON THE RECOVERING FERMENTATIVE ACTIVITY OF DIFFERENT YEAST
Missing Data Treatments
 Missing Data Treatments Lindsey Perry EDU7312: Spring 2012 Presentation Outline Types of Missing Data Listwise Deletion Pairwise Deletion Single Imputation Methods Mean Imputation Hot Deck Imputation Multiple
ICC September 2018 Original: English. Emerging coffee markets: South and East Asia
 ICC 122-6 7 September 2018 Original: English E International Coffee Council 122 st Session 17 21 September 2018 London, UK Emerging coffee markets: South and East Asia Background 1. In accordance with
Predicting Wine Quality
 March 8, 2016 Ilker Karakasoglu Predicting Wine Quality Problem description: You have been retained as a statistical consultant for a wine co-operative, and have been asked to analyze these data. Each
Experiment # Lemna minor (Duckweed) Population Growth
 Population Growth") Experiment # Lemna minor (Duckweed) Population Growth Introduction Students will grow duckweed (Lemna minor) over a two to three week period to observe what happens to a population of organisms when allowed
Experiment # Lemna minor (Duckweed) Population Growth Introduction Students will grow duckweed (Lemna minor) over a two to three week period to observe what happens to a population of organisms when allowed
STATE OF THE VITIVINICULTURE WORLD MARKET
 STATE OF THE VITIVINICULTURE WORLD MARKET April 2015 1 Table of contents 1. 2014 VITIVINICULTURAL PRODUCTION POTENTIAL 3 2. WINE PRODUCTION 5 3. WINE CONSUMPTION 7 4. INTERNATIONAL TRADE 9 Abbreviations:
Global Perspectives Grant Program
 UW College of Agriculture and Natural Resources Global Perspectives Grant Program Project Report Instructions 1. COVER PAGE Award Period (e.g. Spring 2012): Summer 2015 Principle Investigator(s)_Sadanand
The state of the European GI wines sector: a comparative analysis of performance
 The state of the European GI wines sector: a comparative analysis of performance Special Report November 2017 1. Overview of a growing global wine market Wine is one of the most globalised products. The
AJAE Appendix: Testing Household-Specific Explanations for the Inverse Productivity Relationship
 AJAE Appendix: Testing Household-Specific Explanations for the Inverse Productivity Relationship Juliano Assunção Department of Economics PUC-Rio Luis H. B. Braido Graduate School of Economics Getulio
their cultivation in and 36% of expansion in crop NCARE). growing in olive Area: sq km (UN, 2008) (UN, 2010/ /15) GNI per Bank, 2010) 2009)
. growing in olive Area: sq km (UN, 2008) (UN, 2010/ /15) GNI per Bank, 2010) 2009)") Policies - Jordan 2012 1. GENERAL DESCRIPTION OF OLIVE GROWING IN JORDAN 1.1. Introductionn The olive tree is one of the most important and oldest crops in Jordan where it is ntertwined with the daily
Policies - Jordan 2012 1. GENERAL DESCRIPTION OF OLIVE GROWING IN JORDAN 1.1. Introductionn The olive tree is one of the most important and oldest crops in Jordan where it is ntertwined with the daily
State of the Vitiviniculture World Market
 Punta del Este, November 19th, 2018 State of the Vitiviniculture World Market Jean-Marie Aurand Director General Topics Potential of viticultural production Production of grapes Production of wine Consumption
The Roles of Social Media and Expert Reviews in the Market for High-End Goods: An Example Using Bordeaux and California Wines
 The Roles of Social Media and Expert Reviews in the Market for High-End Goods: An Example Using Bordeaux and California Wines Alex Albright, Stanford/Harvard University Peter Pedroni, Williams College
Instruction (Manual) Document
 Document") Instruction (Manual) Document This part should be filled by author before your submission. 1. Information about Author Your Surname Your First Name Your Country Your Email Address Your ID on our website
Instruction (Manual) Document This part should be filled by author before your submission. 1. Information about Author Your Surname Your First Name Your Country Your Email Address Your ID on our website
International Journal of Business and Commerce Vol. 3, No.8: Apr 2014[01-10] (ISSN: )
![International Journal of Business and Commerce Vol. 3, No.8: Apr 2014[01-10] (ISSN: )](/thumbs/86/94457514.jpg "International Journal of Business and Commerce Vol. 3, No.8: Apr 2014[01-10] (ISSN: )") The Comparative Influences of Relationship Marketing, National Cultural values, and Consumer values on Consumer Satisfaction between Local and Global Coffee Shop Brands Yi Hsu Corresponding author: Associate
The Comparative Influences of Relationship Marketing, National Cultural values, and Consumer values on Consumer Satisfaction between Local and Global Coffee Shop Brands Yi Hsu Corresponding author: Associate
Can You Tell the Difference? A Study on the Preference of Bottled Water. [Anonymous Name 1], [Anonymous Name 2]
![Can You Tell the Difference? A Study on the Preference of Bottled Water. [Anonymous Name 1], [Anonymous Name 2]](/thumbs/78/76759741.jpg "Can You Tell the Difference? A Study on the Preference of Bottled Water. [Anonymous Name 1], [Anonymous Name 2]") Can You Tell the Difference? A Study on the Preference of Bottled Water [Anonymous Name 1], [Anonymous Name 2] Abstract Our study aims to discover if people will rate the taste of bottled water differently
Can You Tell the Difference? A Study on the Preference of Bottled Water [Anonymous Name 1], [Anonymous Name 2] Abstract Our study aims to discover if people will rate the taste of bottled water differently
Foodservice EUROPE. 10 countries analyzed: AUSTRIA BELGIUM FRANCE GERMANY ITALY NETHERLANDS PORTUGAL SPAIN SWITZERLAND UK
 Foodservice EUROPE MARKET INSIGHTS & CHALLENGES 2015 2016 2017 2020 Innovative European Foodservice Experts 18, avenue Marcel Anthonioz BP 28 01220 Divonne-les-Bains - France 10 countries analyzed: AUSTRIA
Catalogue of vines grown in France Chardonnay B
 Catalogue of vines grown in France http://plantgrape.plantnetproject.org UMT Géno-Vigne INRA - IFV - Montpellier SupAgro Edited on 11/04/2018 Chardonnay B Name of in France Chardonnay Origin This variety
World of Wine: From Grape to Glass
 World of Wine: From Grape to Glass Course Details No Prerequisites Required Course Dates Start Date: th 18 August 2016 0:00 AM UTC End Date: st 31 December 2018 0:00 AM UTC Time Commitment Between 2 to
COMPARISON OF CORE AND PEEL SAMPLING METHODS FOR DRY MATTER MEASUREMENT IN HASS AVOCADO FRUIT
 New Zealand Avocado Growers' Association Annual Research Report 2004. 4:36 46. COMPARISON OF CORE AND PEEL SAMPLING METHODS FOR DRY MATTER MEASUREMENT IN HASS AVOCADO FRUIT J. MANDEMAKER H. A. PAK T. A.
PERFORMANCE OF HYBRID AND SYNTHETIC VARIETIES OF SUNFLOWER GROWN UNDER DIFFERENT LEVELS OF INPUT
 Suranaree J. Sci. Technol. Vol. 19 No. 2; April - June 2012 105 PERFORMANCE OF HYBRID AND SYNTHETIC VARIETIES OF SUNFLOWER GROWN UNDER DIFFERENT LEVELS OF INPUT Theerachai Chieochansilp 1*, Thitiporn Machikowa
EFFECT OF TOMATO GENETIC VARIATION ON LYE PEELING EFFICACY TOMATO SOLUTIONS JIM AND ADAM DICK SUMMARY
 EFFECT OF TOMATO GENETIC VARIATION ON LYE PEELING EFFICACY TOMATO SOLUTIONS JIM AND ADAM DICK 2013 SUMMARY Several breeding lines and hybrids were peeled in an 18% lye solution using an exposure time of
wine 1 wine 2 wine 3 person person person person person
 1. A trendy wine bar set up an experiment to evaluate the quality of 3 different wines. Five fine connoisseurs of wine were asked to taste each of the wine and give it a rating between 0 and 10. The order
Wine production: A global overview
 Wine production: A global overview Prepared by: Sally Easton DipWSET, MW for WSET Alumni A global overview One of the challenges of wine production is matching production to consumption in order to minimise
Handbook for Wine Supply Balance Sheet. Wines
 EUROPEAN COMMISSION EUROSTAT Directorate E: Sectoral and regional statistics Unit E-1: Agriculture and fisheries Handbook for Wine Supply Balance Sheet Wines Revision 2015 1 INTRODUCTION Council Regulation
The aim of the thesis is to determine the economic efficiency of production factors utilization in S.C. AGROINDUSTRIALA BUCIUM S.A.
 The aim of the thesis is to determine the economic efficiency of production factors utilization in S.C. AGROINDUSTRIALA BUCIUM S.A. The research objectives are: to study the history and importance of grape
ICC July 2010 Original: French. Study. International Coffee Council 105 th Session September 2010 London, England
 ICC 15-2 12 July 21 Original: French Study E International Coffee Council 15 th Session 22 24 September 21 London, England Relations between coffee stocks and prices Background In the context of its programme
Comparison of the Improved Coconut Hybrid CRIC65 with its Reciprocal Cross and the Parental Varieties for Reproductive Traits
 Journal of Food and Agriculture 2014, 7 (1 & 2): 11-17 DOI: http://doi.org/10.4038/jfa.v7i1-2.5189 Comparison of the Improved Coconut Hybrid CRIC65 with its Reciprocal Cross and the Parental Varieties
and the World Market for Wine The Central Valley is a Central Part of the Competitive World of Wine What is happening in the world of wine?
 The Central Valley Winegrape Industry and the World Market for Wine Daniel A. Sumner University it of California i Agricultural l Issues Center January 5, 211 The Central Valley is a Central Part of the
cocos, 2016: 22: Printed in Sri Lanka RESEARCH ARTICLE
 cocos, 2016: 22: 25-29 Printed in Sri Lanka RESEARCH ARTICLE Assessing the performance of fruit colour based phenotypes of tall (Typica) coconuts (Cocos nucifera L.) in Sri Lanka S. A. C. N. Perera l ',
INFLUENCE OF THIN JUICE ph MANAGEMENT ON THICK JUICE COLOR IN A FACTORY UTILIZING WEAK CATION THIN JUICE SOFTENING
 INFLUENCE OF THIN JUICE MANAGEMENT ON THICK JUICE COLOR IN A FACTORY UTILIZING WEAK CATION THIN JUICE SOFTENING Introduction: Christopher D. Rhoten The Amalgamated Sugar Co., LLC 5 South 5 West, Paul,
Discrimination of Ruiru 11 Hybrid Sibs based on Raw Coffee Quality
 Discrimination of Ruiru 11 Hybrid Sibs based on Raw Coffee Quality Gichimu B.M.*, Gichuru E.K., Mamati G.E. & Nyende A.B. *Coffee Research Foundation P.O. Box 4 00232, Ruiru, Kenya Presented during the
FPMS GRAPE PROGRAM NEWSLETTER
 FPMS GRAPE PROGRAM NEWSLETTER Number 1, January 1996 Foundation Plant Materials Service University of California Davis, CA 95616-8600 Phone: (916) 752-3590 - FAX (916) 752-2132 TO: All Participants in
Notes on the Philadelphia Fed s Real-Time Data Set for Macroeconomists (RTDSM) Capacity Utilization. Last Updated: December 21, 2016
 Capacity Utilization. Last Updated: December 21, 2016") 1 Notes on the Philadelphia Fed s Real-Time Data Set for Macroeconomists (RTDSM) Capacity Utilization Last Updated: December 21, 2016 I. General Comments This file provides documentation for the Philadelphia
1 Notes on the Philadelphia Fed s Real-Time Data Set for Macroeconomists (RTDSM) Capacity Utilization Last Updated: December 21, 2016 I. General Comments This file provides documentation for the Philadelphia
WINE RECOGNITION ANALYSIS BY USING DATA MINING
 9 th International Research/Expert Conference Trends in the Development of Machinery and Associated Technology TMT 2005, Antalya, Turkey, 26-30 September, 2005 WINE RECOGNITION ANALYSIS BY USING DATA MINING
Gasoline Empirical Analysis: Competition Bureau March 2005
 Gasoline Empirical Analysis: Update of Four Elements of the January 2001 Conference Board study: "The Final Fifteen Feet of Hose: The Canadian Gasoline Industry in the Year 2000" Competition Bureau March
Accuracy of imputation using the most common sires as reference population in layer chickens
 Heidaritabar et al. BMC Genetics (2015) 16:101 DOI 10.1186/s12863-015-0253-5 RESEARCH ARTICLE Open Access Accuracy of imputation using the most common sires as reference population in layer chickens Marzieh
Is Fair Trade Fair? ARKANSAS C3 TEACHERS HUB. 9-12th Grade Economics Inquiry. Supporting Questions
 9-12th Grade Economics Inquiry Is Fair Trade Fair? Public Domain Image Supporting Questions 1. What is fair trade? 2. If fair trade is so unique, what is free trade? 3. What are the costs and benefits
(Definition modified from APSnet)
") Development of a New Clubroot Differential Set S.E. Strelkov, T. Cao, V.P. Manolii and S.F. Hwang Clubroot Summit Edmonton, March 7, 2012 Background Multiple strains of P. brassicae are known to exist
Development of a New Clubroot Differential Set S.E. Strelkov, T. Cao, V.P. Manolii and S.F. Hwang Clubroot Summit Edmonton, March 7, 2012 Background Multiple strains of P. brassicae are known to exist
Fleurieu zone (other)
") Fleurieu zone (other) Incorporating Southern Fleurieu and Kangaroo Island wine regions, as well as the remainder of the Fleurieu zone outside all GI regions Regional summary report 2006 South Australian
Fleurieu zone (other) Incorporating Southern Fleurieu and Kangaroo Island wine regions, as well as the remainder of the Fleurieu zone outside all GI regions Regional summary report 2006 South Australian
THE MANIFOLD EFFECTS OF GENES AFFECTING FRUIT SIZE AND VEGETATIVE GROWTH IN THE RASPBERRY
 THE MANIFOLD EFFECTS OF GENES AFFECTING FRUIT SIZE AND VEGETATIVE GROWTH IN THE RASPBERRY II. GENE I2 BY D. L. JENNINGS Scottish Horticultural Research Institute, Dundee {Received 16 September 1965)...
Growing divergence between Arabica and Robusta exports
 Growing divergence between Arabica and Robusta exports In April 218, the ICO composite indicator decreased by.4% to an average of 112.56, with the daily price ranging between 11.49 and 114.73. Prices for
FACTORS DETERMINING UNITED STATES IMPORTS OF COFFEE
 12 November 1953 FACTORS DETERMINING UNITED STATES IMPORTS OF COFFEE The present paper is the first in a series which will offer analyses of the factors that account for the imports into the United States
Origin-based products: From local culture to legal protection
 Origin-based products: From local culture to legal protection Laurence Bérard American Origin Products and the TTIP: Collaboration for Rural Development First Research Leaders Meeting University of Arkansas,
2018 World Vitiviniculture Situation. OIV Statistical Report on World Vitiviniculture
 2018 World Vitiviniculture Situation OIV Statistical Report on World Vitiviniculture Introduction This report has been prepared by the Statistics department of the International Organisation of Vine and
Missing value imputation in SAS: an intro to Proc MI and MIANALYZE
 Victoria SAS Users Group November 26, 2013 Missing value imputation in SAS: an intro to Proc MI and MIANALYZE Sylvain Tremblay SAS Canada Education Copyright 2010 SAS Institute Inc. All rights reserved.
Figure 1: Percentage of Pennsylvania Wine Trail 2011 Pennsylvania Wine Industry Needs Assessment Survey
 Industry Needs Assessment Demographic of Participants As part of my initiative to get a quick snap shot of the Pennsylvania wine industry needs, an assessment survey was made public on July 1, 2011. This
RUST RESISTANCE IN WILD HELIANTHUS ANNUUS AND VARIATION BY GEOGRAPHIC ORIGIN
 RUST RESISTANCE IN WILD HELIANTHUS ANNUUS AND VARIATION BY GEOGRAPHIC ORIGIN Dr. Tom GULYA USDA Northern Crop Science Lab, Fargo, ND 58105, USA Dr. Gary KONG, DPI, Toowoomba, Qld, Australia Mary BROTHERS
STATE OF THE VITIVINICULTURE WORLD MARKET
 STATE OF THE VITIVINICULTURE WORLD MARKET April 2018 1 Table of contents 1. VITICULTURAL PRODUCTION POTENTIAL 3 2. WINE PRODUCTION 5 3. WINE CONSUMPTION 7 4. INTERNATIONAL TRADE 9 Abbreviations: kha: thousands
Subject: Industry Standard for a HACCP Plan, HACCP Competency Requirements and HACCP Implementation
 Amendment 0: January 2000 Page: 1 V I S C New Zealand Subject: Industry Standard for a HACCP Plan, HACCP Competency Requirements and HACCP Implementation Reference Nos: VISC 1 Date issued: 27 January 2000
CARTHAMUS TINCTORIUS L., THE QUALITY OF SAFFLOWER SEEDS CULTIVATED IN ALBANIA.
 CARTHAMUS TINCTORIUS L., THE QUALITY OF SAFFLOWER SEEDS CULTIVATED IN ALBANIA. Valdete VORPSI, Fatos HARIZAJ, Nikoll BARDHI, Vjollca VLADI, Erta DODONA Faculty of Agriculture and Environment, Agriculture
Statistics & Agric.Economics Deptt., Tocklai Experimental Station, Tea Research Association, Jorhat , Assam. ABSTRACT
 Two and a Bud 59(2):152-156, 2012 RESEARCH PAPER Global tea production and export trend with special reference to India Prasanna Kumar Bordoloi Statistics & Agric.Economics Deptt., Tocklai Experimental
IT 403 Project Beer Advocate Analysis
 1. Exploratory Data Analysis (EDA) IT 403 Project Beer Advocate Analysis Beer Advocate is a membership-based reviews website where members rank different beers based on a wide number of categories. The
JCAST. Department of Viticulture and Enology, B.S. in Viticulture
 JCAST Department of Viticulture and Enology, B.S. in Viticulture Student Outcomes Assessment Plan (SOAP) I. Mission Statement The mission of the Department of Viticulture and Enology at California State
Academic Year 2014/2015 Assessment Report. Bachelor of Science in Viticulture, Department of Viticulture and Enology
 Academic Year 2014/2015 Assessment Report Bachelor of Science in Viticulture, Department of Viticulture and Enology Due to changes in faculty assignments, there was no SOAP coordinator for the Department
Research on the potential alcohol of some local varieties and biotypes of wine grapes in Arad County
 Volume 17(1), 56-61, 2013 JOURNAL of Horticulture, Forestry and Biotechnology www.journal-hfb.usab-tm.ro Research on the potential alcohol of some local and biotypes of wine grapes in Arad County Dobrei
COMPARISON OF BLACKLINE-RESISTANT AND CONVENTIONAL WALNUT VARIETIES IN THE CENTRAL COAST
 COMPARISON OF BLACKLINE-RESISTANT AND CONVENTIONAL WALNUT VARIETIES IN THE CENTRAL COAST - 2013 William W. Coates ABSTRACT Samples of nine conventional walnut varieties were compared to samples of nine
ARIMNet2 Young Researchers Seminar
 ARIMNet2 Young Researchers Seminar How to better involve end-users throughout the research process to foster innovation-driven research for a sustainable Mediterranean agriculture at the farm and local
ALBINISM AND ABNORMAL DEVELOPMENT OF AVOCADO SEEDLINGS 1
 California Avocado Society 1956 Yearbook 40: 156-164 ALBINISM AND ABNORMAL DEVELOPMENT OF AVOCADO SEEDLINGS 1 J. M. Wallace and R. J. Drake J. M. Wallace Is Pathologist and R. J. Drake is Principle Laboratory
Interloper s legacy: invasive, hybrid-derived California wild radish (Raphanus sativus) evolves to outperform its immigrant parents
 evolves to outperform its immigrant parents") Interloper s legacy: invasive, hybrid-derived California wild radish (Raphanus sativus) evolves to outperform its immigrant parents Caroline E. Ridley 1 and Norman C. Ellstrand 1,2 1 Department of Botany
Interloper s legacy: invasive, hybrid-derived California wild radish (Raphanus sativus) evolves to outperform its immigrant parents Caroline E. Ridley 1 and Norman C. Ellstrand 1,2 1 Department of Botany
Genetic diversity of wild Coffee (Coffea arabica) and its implication for conservation
 and its implication for conservation") Genetic diversity of wild Coffee (Coffea arabica) and its implication for conservation Kassahun Tesfaye, Feyera Senbeta, Tamiru Oljira, Solomon Balemi, Govers, K., Endashaw Bekele, Borsch, T. Biodiversity
Genetic diversity of wild Coffee (Coffea arabica) and its implication for conservation Kassahun Tesfaye, Feyera Senbeta, Tamiru Oljira, Solomon Balemi, Govers, K., Endashaw Bekele, Borsch, T. Biodiversity
Sorghum Yield Loss Due to Hail Damage, G A
 1 of 8 6/11/2009 9:27 AM G86-812-A Sorghum Yield Loss Due to Hail Damage* This NebGuide discusses the methods used by the hail insurance industry to assess yield loss due to hail damage in grain sorghum.
Genetic diversity and population structure of rice varieties grown in the Mediterranean basin. Spanish population, a case of study
 Genetic diversity and population structure of rice varieties grown in the Mediterranean basin. Spanish population, a case of study Concha Domingo domingo_concar@gva.es March 8 th 2017 ITRC-2017, Griffith
North America Ethyl Acetate Industry Outlook to Market Size, Company Share, Price Trends, Capacity Forecasts of All Active and Planned Plants
 North America Ethyl Acetate Industry Outlook to 2016 - Market Size, Company Share, Price Trends, Capacity Forecasts of All Active and Planned Plants Reference Code: GDCH0416RDB Publication Date: October
Determination of Fruit Sampling Location for Quality Measurements in Melon (Cucumis melo L.)
") Determination of Fruit Sampling Location for Quality Measurements in Melon (Cucumis melo L.) Miriam Paris 1, Jack E. Staub 2 and James D. McCreight 3 1 University of Wisconsin-Madison, Department of Horticulture,
Determination of Fruit Sampling Location for Quality Measurements in Melon (Cucumis melo L.) Miriam Paris 1, Jack E. Staub 2 and James D. McCreight 3 1 University of Wisconsin-Madison, Department of Horticulture,
Final Report. TITLE: Developing Methods for Use of Own-rooted Vitis vinifera Vines in Michigan Vineyards
 Final Report TITLE: Developing Methods for Use of Own-rooted Vitis vinifera Vines in Michigan Vineyards PRINCIPAL INVESTIGATOR: Thomas J. Zabadal OBJECTIVES: (1) To determine the ability to culture varieties